Audit Data Analytics - IFAC Analytics Audit Data Analytics – Technique, not a Tool Internal...
22
Audit Data Analytics Bob Dohrer, IAASB Member and Working Group Chair Miklos Vasarhelyi Phillip McCollough IAASB Meeting September 2015 Agenda Item 6-A
Transcript of Audit Data Analytics - IFAC Analytics Audit Data Analytics – Technique, not a Tool Internal...

Page 1
Audit Data Analytics
Bob Dohrer, IAASB Member and Working Group Chair
Miklos VasarhelyiPhillip McCollough
IAASB MeetingSeptember 2015Agenda Item 6-A

Page 2
• Introductory remarks• Illustrations
o Revenue Three Way Matcho Revenue Segregation of Dutieso Predictive Analyticso Clustering
• What could the future hold?• What can others do in this area?
Data Analytics
Audit Data AnalyticsAgenda
Page 3
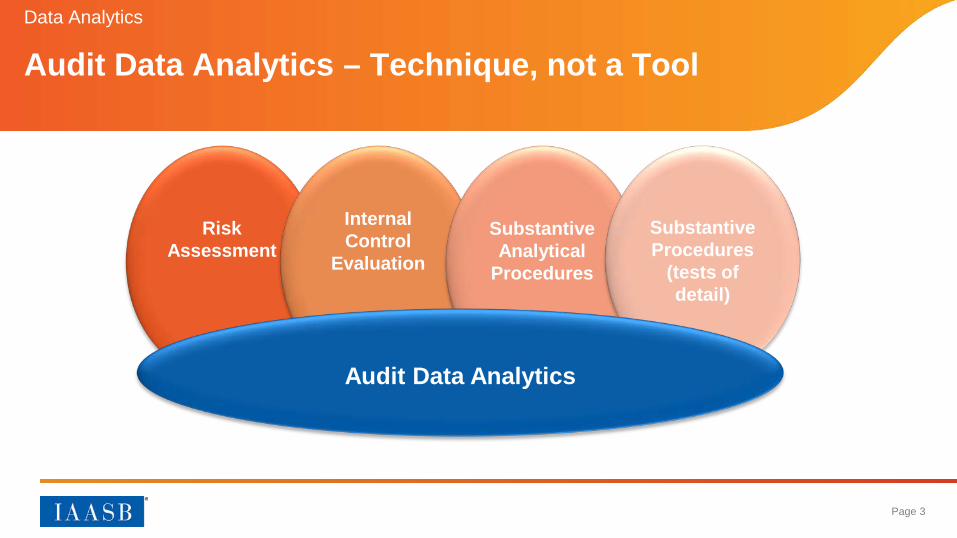
Risk Assessment
Data Analytics
Audit Data Analytics – Technique, not a Tool
Internal Control
Evaluation
Substantive Analytical
Procedures
Substantive Procedures
(tests of detail)
Audit Data Analytics

Page 4
• Procedure: For every invoice, shipping document and sales order received from customers, compare the invoiced customer, quantity, and unit price to the quantity shipped per the shipping documents and the quantity and unit price reflected in the sales order received from the customer.
• Objective: Obtaining audit evidence over the existence and accuracy of revenue. (ISA 500 paragraphs 6 and 9).
• Prior year approach: Tests of internal controls over the revenue process, substantive analytical procedures and tests of details (sampling).
Data Analytics
Illustration 1 – Revenue Three Way Match
Page 5
Data Analytics
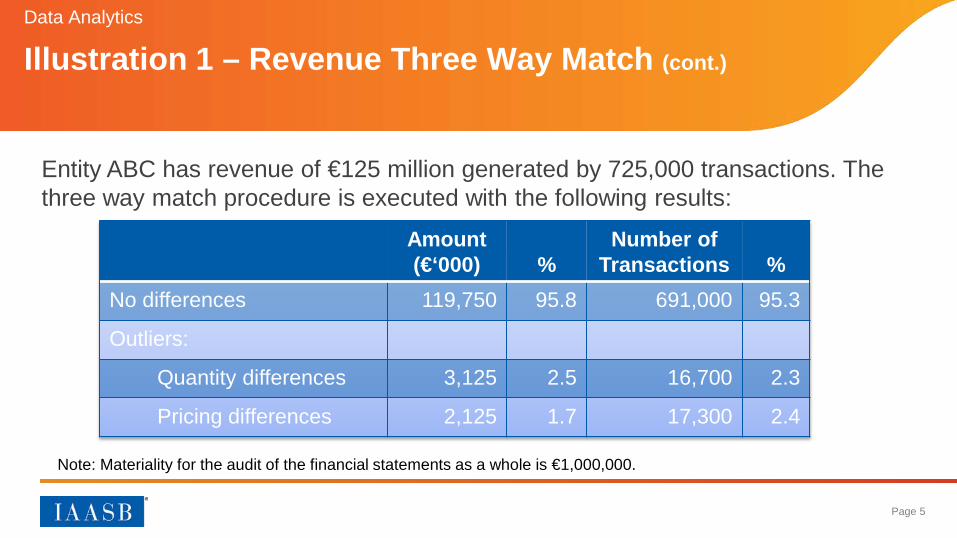
Entity ABC has revenue of €125 million generated by 725,000 transactions. The three way match procedure is executed with the following results:
Note: Materiality for the audit of the financial statements as a whole is €1,000,000.
Illustration 1 – Revenue Three Way Match (cont.)
Amount(€‘000) %
Number of Transactions %
No differences 119,750 95.8 691,000 95.3
Outliers:
Quantity differences 3,125 2.5 16,700 2.3
Pricing differences 2,125 1.7 17,300 2.4

Page 6
• Is the three way match procedure data analytics? Or is it automation?• How do the ISA’s currently address 100% testing? (ISA 500 paragraph A53) • Is risk assessment relevant (beyond determining to execute the procedure)?• Is this risk assessment or a substantive procedure (or both)?• What impact does the ability to measure results so precisely have?• Why does the procedure produce audit evidence?• What level of evidence is needed on outliers?
– How does the knowledge gained from performing procedure in year 1 affect year 2?• What about the integrity of the data used in the procedure?• Are process level controls relevant?• Auditor verification / evaluation of the technology / routine used to execute the procedure?
Data Analytics
Illustration 1 – Revenue Three Way Match (cont.)Some of the Challenges that Arise

Page 7
• Procedure: For every sales transaction, evaluation of any segregation of duties conflicts relative to customer master file maintenance, sales order processing, sales invoicing, sales returns / credit notes, and applying cash collections.
• Objective: Obtaining audit evidence over the effectiveness of internal control over sales processing.1 (ISA 330 paragraphs 8–9 and ISA 315 paragraph 12)
1 This is one of the tests of control over sales processing.
Data Analytics
Illustration 2 – Revenue Segregation of Duties

Page 8
Data Analytics
For entity ABC, an analysis of segregation of duties was executed with the following findings:
Illustration 2 – Revenue Segregation of Duties (cont.)
Number of users
Amount(€‘000)
Number oftransactions
Population of sales 542 125,000 725,000
Instances in which same individual created sales invoice, sales return or credit note and applied cash
7 620 3,934
Instances in which same individual executed sales order processing, dispatched goods (delivery document) and applied cash
96 7,692 46,903
Note: Materiality for the audit of the financial statements as a whole is €1,000,000.

Page 9
• Is the segregation of duties procedure data analytics?• Is risk assessment relevant (beyond determining to execute the procedure)?• Is the segregation of duties a risk assessment procedure or a test of control?• What impact does the ability to measure results so precisely have?• Should the conclusion on internal controls be bi-furcated (i.e., transactions with segregation
of duties conflicts, transactions without segregation of duties conflicts)?• What level of evidence is needed on outliers?
– How does the knowledge gained from performing procedure in year 1 affect year 2?• What about the integrity of the data used in the procedure?• Auditor verification / evaluation of the technology / routine used to execute the procedure?
Data Analytics
Illustration 2 – Revenue Segregation of Duties (cont.)Some of the Challenges that Arise

Page 10
• Time series extrapolation and cross-sectional analytics can be used to predict results – substantive analytical procedure (ISA 520 paragraphs 5 and A4–A16). If proposed results fall within acceptable variance, assess whether further year-end procedures are necessary.
• In addition to substantive analytical procedures and analytical procedures presently performed at the planning and completion phases of an audit, predictive analytics are increasingly being performed as a substantive analytical procedure.
Example: Big Data as Audit Evidence: Utilizing Weather, Geolocational and other Indicators across outlets of a major retailer, Alexander Kogan and Kyunghee Yoon
Data Analytics
Illustration 3 – Predictive AnalyticsWhat is predictive analytics?

Page 11
Objective: Predict revenue at the store level (approximately 2,000 stores) for a publicly held retail company using internal company data and non-traditional data (e.g., weather).
Forecasting daily store level sales (one step ahead forecasting). Multivariate regression model with / without the peer store indicator and
weather indicators. AR(1)+…+AR(7) with / without the peer store indicator and weather
indicators.
Data Analytics
Illustration 3 – Predictive Analytic (cont.)Data and Model Description

Page 12
• Expectations derived from store level disaggregated data are more accurate than ones from entity level aggregated data.
• Peer stores have predictive powers for sales.
• Data not traditionally used in substantive analytical procedures (e.g., social media, weather, geolocation) are often effective in predicting sales.
Data Analytics
Illustration 3 – Predictive Analytic (cont.)Preliminary Results

Page 13
Data Analytics
Illustration 3 – Predictive Analytic (cont.)Clustering Using Store Sales by Peer Group
Page 14
Data Analytics
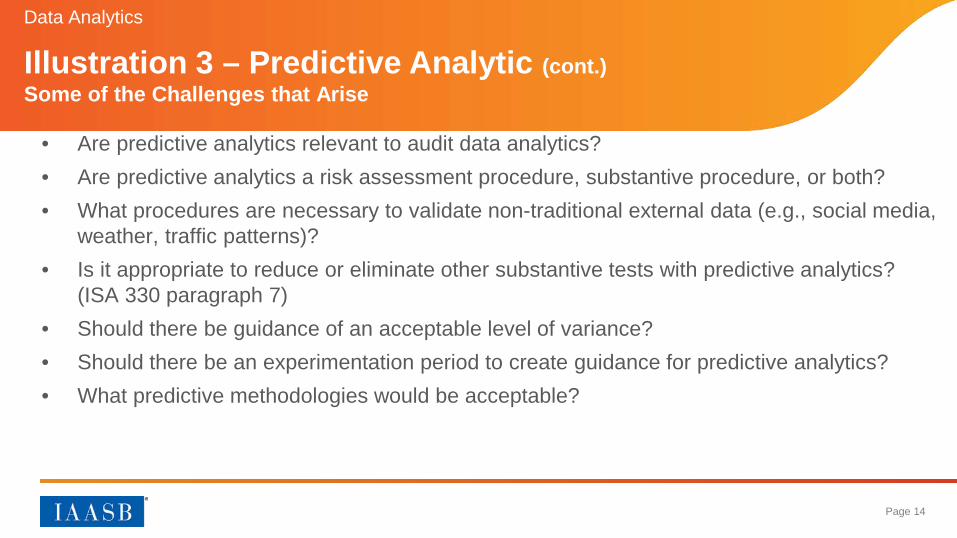
Illustration 3 – Predictive Analytic (cont.)Some of the Challenges that Arise
• Are predictive analytics relevant to audit data analytics?• Are predictive analytics a risk assessment procedure, substantive procedure, or both?• What procedures are necessary to validate non-traditional external data (e.g., social media,
weather, traffic patterns)?• Is it appropriate to reduce or eliminate other substantive tests with predictive analytics?
(ISA 330 paragraph 7)• Should there be guidance of an acceptable level of variance?• Should there be an experimentation period to create guidance for predictive analytics?• What predictive methodologies would be acceptable?

Page 15
• Multidimensional clustering is a powerful tool to detect groups of similar events and identify outliers – Audit Sampling (ISA 530, paragraph 6)
• Can be used in any set of data examination procedures (preferably with a reduced set of data).
• Looking for anomalous clusters and outliers from the clusters. Statistically complex.
Multidimensional Clustering for audit fault detection in an insurance and credit card settings and super-app Sutapat Thiprungsri, Miklos A. Vasarhelyi, and Paul Byrnes
Data Analytics
Illustration 4 – Clustering

Page 16
Data Analytics
Illustration 4 – Clustering (cont.)

Page 17
Data Analytics
Illustration 4 – Clustering (cont.)The need for a Super-application to facilitate auditor statistical decisions
• Normalizes all data to be clustered.• Creates normalized principal components from the normalized data.• Automatically selects the necessary normalized principal components for use in
clustering and outlier detection.• Compares a variety of algorithms on selected set of normalized principal
components.• Determines the preferred model based upon the silhouette coefficient metric. This
model is then used for final clustering and outlier detection procedures.• Produces relevant information and outputs throughout the process, thereby
facilitating additional, deeper analyses.
Page 18
Data Analytics
Illustration 4 – Clustering (cont.)Some of the Challenges that Arise
• What audit evidence does clustering create, if any, for populations that have tight clustering vs. outliers to the cluster?
• Is clustering a risk assessment procedure, substantive procedure, or both?• What follow-up on outliers is necessary?• Is it appropriate to reduce other substantive tests with clustering?• Should there be guidance of acceptable level of variance from cluster geometric center?• If auditors (or others) are developing applications for use in the audit, what quality control
should be performed to verify that the application is fit for purpose, technically sound etc.?
• Should there be an experimentation period to create guidance for clustering?• What clustering methodologies would be acceptable?

Page 19
• As an alternative to statistical and optimization methods, human decision models can be built either by capturing human behavior and models (expert / cognitive computing) or by using machine learning methods to develop these rules.
• Typically supervised machine learning methods such as decision trees, logistic regression, and vector machines will be used. Possibility that in the future, the volume of data may exceed human capacity to audit that data.
Expert Knowledge Elicitations in a Procurement Card Context at PGDeniz Applebauum and Abdullah Al-Awadhi
Credit card default and lawsuit prediction at Itau-UnibancoMiklos A. Vasarhelyi, Eduardo Miyaki, Qi Liu, Jun Dai, Fei Qi Huan, Pei Li, and Basma Modarrat
Data Analytics
What could the future hold?Machine Learning / Cognitive Computing

Page 20
Data Analytics
What could the future hold? (cont.) Some of the Challenges that Arise – Machine Learning / Cognitive Computing
• Are machine learning techniques relevant to audit data analytics?• Is it reasonable to reduce or eliminate other substantive tests with machine
learning?• What impact might this reduction have?• Level of guidance needed on methods?• Should there be a new method of separate review of the technologies used
if these methods are used?• Should there be an experimentation period to create guidance for machine
learning?• What predictive methodologies would be acceptable?

Page 21
– Continuous Control Monitoring – formalization of controls evaluation– Continuity Equations – structural modeling in continuous auditing– Process Mining in Auditing – audit Logs in Enterprise Resource Planning
systems– Exceptional exceptions – choosing exceptions from huge data– Evidence from Big Data – electronic logs everywhere– Audit Data Standard – normalizing data to facilitate analytic applications– Visualization for continuous assurance monitoring – creating auditor
dashboards
Data Analytics
What could the future hold? (cont.)Others

Page 22
– Where in the audit of historical financial statements are these methods to be used?
– How to create an experimentation period where supervised analytics projects are performed in real engagements?
– How to deal with the economic limitations of using data analytic methods in audits?
Data Analytics
What can others do in this area?