AUDIT COMMITTEE OF THE PORTLAND...
186
AUDIT COMMITTEE OF THE PORTLAND DEVELOPMENT COMMISSION Portland, Oregon RESOLUTION NO. 6990 ACCEPTING AND APPROVING COMPREHENSIVE ANNUAL FINANCIAL REPORT FOR FISCAL YEAR 2011-12 AS REQUIRED BY OREGON REVISED STATUTE 297.425, PORTLAND CITY CHARTER CHAPTER 15-104, AND PDC RESOLUTION NO. 6112 WHEREAS, the Oregon Revised Statute 297.425 requires that “the accounts and fiscal affairs of every municipal corporation shall be audited and reviewed at least once each calendar or fiscal year;” WHEREAS, the Portland City Charter Chapter 15-104 requires that “the Commission shall provide for an annual comprehensive independent audit of all funds and accounts of the Commission by a qualified Certified Public Accountant or firm of such accountants selected with the approval of the City Auditor;” WHEREAS, the Portland Development Commission (“PDC”) Board of Commissioners (“Board”) with Resolution 6112 delegated authority to the PDC Audit Committee (“Audit Committee”) to, among other things, “review and comment on management’s response to audit findings and recommendations, and provide the Board with recommendations on addressing issues identified by the auditor and/or management;” WHEREAS, Moss Adams, LLP (“Moss Adams”), has been contracted with by the City of Portland to conduct an annual comprehensive independent audit of all funds and accounts of the Commission for the fiscal year 2011-12; WHEREAS, based upon the independent audit, Moss Adams has audited the PDC’s Comprehensive Annual Financial Report for the Fiscal Year Ended June 30, 2012, attached hereto as Exhibit A (the “Fiscal Year 2011-12 CAFR”), and prepared a letter discussing significant matters of interest noted during the course of the annual fiscal year end audit for fiscal year 2011-12, attached hereto as Exhibit B (the “Moss Adams Management Letter”); and WHEREAS, management has prepared responses to the Management Letter, with such responses attached hereto as Exhibit C (the “PDC Management Responses”). NOW, THEREFORE, BE IT RESOLVED, that the PDC Board, acting as the Audit Committee, hereby accepts and approves the Fiscal Year 2011-12 CAFR on behalf of the Commission; BE IT FURTHER RESOLVED, that the Audit Committee hereby accepts the Moss Adams Management Letter and endorses the PDC Management Responses; and
Transcript of AUDIT COMMITTEE OF THE PORTLAND...

AUDIT COMMITTEE OF THE
PORTLAND DEVELOPMENT COMMISSION
Portland, Oregon
RESOLUTION NO. 6990
ACCEPTING AND APPROVING COMPREHENSIVE ANNUAL FINANCIAL
REPORT FOR FISCAL YEAR 2011-12 AS REQUIRED BY OREGON REVISED
STATUTE 297.425, PORTLAND CITY CHARTER CHAPTER 15-104, AND
PDC RESOLUTION NO. 6112
WHEREAS, the Oregon Revised Statute 297.425 requires that “the accounts and fiscal affairs of
every municipal corporation shall be audited and reviewed at least once each calendar or fiscal year;”
WHEREAS, the Portland City Charter Chapter 15-104 requires that “the Commission shall
provide for an annual comprehensive independent audit of all funds and accounts of the Commission by
a qualified Certified Public Accountant or firm of such accountants selected with the approval of the City
Auditor;”
WHEREAS, the Portland Development Commission (“PDC”) Board of Commissioners (“Board”)
with Resolution 6112 delegated authority to the PDC Audit Committee (“Audit Committee”) to, among
other things, “review and comment on management’s response to audit findings and recommendations,
and provide the Board with recommendations on addressing issues identified by the auditor and/or
management;”
WHEREAS, Moss Adams, LLP (“Moss Adams”), has been contracted with by the City of Portland
to conduct an annual comprehensive independent audit of all funds and accounts of the Commission for
the fiscal year 2011-12;
WHEREAS, based upon the independent audit, Moss Adams has audited the PDC’s
Comprehensive Annual Financial Report for the Fiscal Year Ended June 30, 2012, attached hereto as
Exhibit A (the “Fiscal Year 2011-12 CAFR”), and prepared a letter discussing significant matters of
interest noted during the course of the annual fiscal year end audit for fiscal year 2011-12, attached
hereto as Exhibit B (the “Moss Adams Management Letter”); and
WHEREAS, management has prepared responses to the Management Letter, with such
responses attached hereto as Exhibit C (the “PDC Management Responses”).
NOW, THEREFORE, BE IT RESOLVED, that the PDC Board, acting as the Audit Committee, hereby
accepts and approves the Fiscal Year 2011-12 CAFR on behalf of the Commission;
BE IT FURTHER RESOLVED, that the Audit Committee hereby accepts the Moss Adams
Management Letter and endorses the PDC Management Responses; and


AUDIT COMMITTEE OF THE
PORTLAND DEVELOPMENT COMMISSION
Portland, Oregon
RESOLUTION NO. 6990
EXHIBIT A
ACCEPTING AND APPROVING COMPREHENSIVE ANNUAL FINANCIAL
REPORT FOR FISCAL YEAR 2011-12 AS REQUIRED BY OREGON REVISED
STATUTE 297.425, PORTLAND CITY CHARTER CHAPTER 15-104, AND
PDC RESOLUTION NO. 6112
Exhibit A – C includes this cover page and contains 176 pages:
Comprehensive Annual Financial Report for the Fiscal Year Ended June 30, 2012

PORTLAND DEVELOPMENT COMMISSION
Comprehensive Annual Financial Report
for the Fiscal Year Ended June 30, 2012
A Component Unit of the City of Portland, Oregon

Cover photo:
United States Senator Ron Wyden and PDC Executive Director Patrick Quinton with representatives of the Port-
land Mercado project. The Portland Mercado, a Latino public market, is a community-driven initiative slated
to open in summer 2014. The Mercado will occupy a now-vacant building owned by PDC at Southeast 72nd
Avenue and Foster Road, in the Lents Town Center Urban Renewal Area. The three-quarter acre Mercado site
will feature an array of services including a butcher, food and produce vendors, a bakery and local retailers.
Furthering the Neighborhood Economic Development Strategy, in addition to expanding access to culturally
specific food, the Mercado will provide opportunities for business incubation, expansion and wealth creation
for local entrepreneurs.
Created by Portland voters in 1958, PDC plays a major role in making Portland, Oregon one of
America’s most livable cities. As Portland’s urban renewal and economic development agency,
PDC is pursuing an aggressive strategy to create the most sustainable economy in the world, by
connecting people and resources to achieve the city’s vision of healthy neighborhoods, a vibrant
central city, a strong regional economy, and quality jobs and housing for all. PDC integrates
business, economic and physical development to spark job creation and attract investments that
provide a full range of employment opportunities and economic benefits to all residents in the
region. PDC has played a key role in the creation of many of Portland’s most important landmarks,
and is internationally recognized as a model for urban renewal success and sustainable practices.
For more information, visit the PDC website at www.pdc.us.

PORTLAND DEVELOPMENT COMMISSION A Component Unit of the City of Portland, Oregon
Comprehensive Annual Financial Report
Prepared by the Portland Development Commission Finance and Business Operations
Patrick Quinton, Executive Director Faye Brown, Chief Financial Officer
For the fiscal year ended June 30, 2012

About PDC In 1958, Portlanders voted to create the Portland Development Commission to serve as Portland’s urban renewal and economic development agency. During the past half century, PDC has taken forward 20 urban renewal plans that have changed the face of Portland – making it a better place to live for all Portlanders. PDC focuses on what matters to Portland: job creation, economic vitality, collaboration and partnership, and responsible stewardship of public funds. As Portland’s urban renewal and economic development agency, PDC is pursuing an aggressive strategy to create the most sustainable economy in the world.
PDC’s Mission
Our Mission is to create one of the world’s most desirable and equitable cities by investing in job creation, innovation and economic opportunity throughout Portland.
To achieve this end, the revised 2010-2014 Strategic Plan focuses PDC’s efforts around five goals:
Strong Economic Growth and Competitiveness Social Equity Healthy Neighborhoods A Vibrant Central City Effective Stewardship over our Resources and Operations, and Employee Investment
The Commission is responsible for maintaining an accounting system and providing for a comprehensive independent financial audit. The following pages are the Commission’s Comprehensive Annual Financial Report with accompanying report of independent auditor.

Table of Contents
Page
INTRODUCTORY SECTION
Letter of Transmittal from Executive Director and Chief Financial Officer ............................... I-V Governing Board ........................................................................................................................ VI Organization Chart .................................................................................................................... VII Map of Urban Renewal Areas .................................................................................................. VIII Certificate of Achievement for Excellence in Financial Reporting .............................................. IX
FINANCIAL SECTION Independent Auditor’s Report ...................................................................................................... 1 Management’s Discussion and Analysis ..................................................................................... 3 Basic Financial Statements: Government-wide Financial Statements: Statement of Net Assets .................................................................................................. 19 Statement of Activities ..................................................................................................... 20 Fund Financial Statements: Balance Sheet – Governmental Funds ........................................................................... 22 Reconciliation of the Governmental Funds Balance Sheet to the Statement of Net Assets ................................................................................... 24 Statement of Revenues, Expenditures, and Changes in Fund Balances – Governmental Funds ........................................................................ 25 Reconciliation of the Statement of Revenues, Expenditures, and Changes in Fund Balances of Governmental Funds to the Statement of Activities .................................................................................................. 27 Statement of Revenues, Expenditures, and Changes in Fund Balance – Budget and Actual: General Fund (adopted as Urban Redevelopment Fund) ......................................... 28 Housing and Community Development Contract Fund ............................................. 29 Statement of Net Assets – Proprietary Funds ................................................................. 30 Statement of Revenues, Expenses, and Changes in Fund Net Assets – Proprietary Funds .......................................................................... 31 Statement of Cash Flows – Proprietary Funds ................................................................ 32 Statement of Fiduciary Assets and Liabilities – Agency Fund ........................................ 33

Table of Contents (continued)
Page FINANCIAL SECTION, Continued: Basic Financial Statements, Continued: Notes to the Basic Financial Statements:
I. Summary of Significant Accounting Policies ............................................................. 34 II. Stewardship, Compliance, and Accountability .......................................................... 41 III. Detailed Notes on All Funds:
A. Cash and Cash Equivalents and Cash with City of Portland Investment Pool ......................................................................................... 42 B. Internal Balances and Transfers .................................................................. 45 C. Loans Receivable ........................................................................................ 46 D. Restricted Net Assets .................................................................................. 49 E. Property Held for Sale .................................................................................. 49 F. Capital Assets .............................................................................................. 50 G. Operating Leases ......................................................................................... 50 H. Changes in Long-Term Liabilities ................................................................ 51 I. Amounts Due To and From the City of Portland .......................................... 52 J. Revenue ....................................................................................................... 52
IV. Other Information: A. Retirement and Deferred Compensation Plans .......................................... 53 B. Other Postemployment Benefits .................................................................. 55 C. Commitments ............................................................................................... 58 D. PDC’s Use of the City of Portland’s Conduit Debt ....................................... 58 E. Contingencies .............................................................................................. 59 F. Risk Management ........................................................................................ 60 G. Related Party Transactions .......................................................................... 62 H. Reviews by Grantor Agencies ...................................................................... 63
Required Supplementary Information Other Postemployment Healthcare Benefits Schedule of Fund Progress ...................... 65
SUPPLEMENTARY DATA (Combining Statements and Schedules, Budgetary Schedules, and Schedules of Capital Assets Used in the Operation of Governmental Funds): Combining Balance Sheet – Nonmajor Governmental Funds ............................................. 67 Combining Statement of Revenues, Expenditures, and Changes in Fund Balances – Nonmajor Governmental Funds .......................................................... 68 Combining Balance Sheet – Nonmajor Special Revenue Funds ......................................... 69 Combining Statement of Revenues, Expenditures, and Changes in Fund Balances – Nonmajor Special Revenue Funds ..................................................... 70 Schedule of Revenues, Expenditures, and Changes in Fund Balance – Budget and Actual: HOME Grant Fund ................................................................................................. 71 Other Federal Grants Fund .................................................................................... 72 Ambassador Program Fund ................................................................................... 73 Enterprise Zone Fund ............................................................................................ 74 Combining Balance Sheet – Nonmajor Capital Projects Funds ........................................... 75 Combining Statement of Revenues, Expenditures, and Changes in Fund Balances – Nonmajor Capital Projects Funds ....................................................... 77

Table of Contents (continued)
Page
FINANCIAL SECTION, Continued: SUPPLEMENTARY DATA, Continued: Schedule of Revenues, Expenditures, and Changes in Fund Balance – Budget and Actual: Downtown Waterfront Urban Renewal Fund ......................................................... 79 North Macadam Urban Renewal Fund .................................................................. 80 River District Urban Renewal Fund ........................................................................ 81 South Park Blocks Urban Renewal Fund .............................................................. 82 Convention Center Urban Renewal Fund ............................................................. 83 Central Eastside Urban Renewal Fund ................................................................. 84 Lents Town Center Urban Renewal Fund ............................................................. 85 Interstate Corridor Urban Renewal Fund ............................................................... 86 Gateway Regional Center Urban Renewal Fund .................................................. 87 Airport Way Urban Renewal Fund ......................................................................... 88 Willamette Industrial Urban Renewal Fund ........................................................... 89 Schedule of Revenues, Expenditures, and Changes in Fund Balance – Budget and Actual: Enterprise Loans Fund .......................................................................................... 91 Combining Schedule of Net Assets – for Components of the Enterprise Loans Fund .................................................................................................... 92 Combining Schedule of Revenues, Expenses, and Changes in Fund Net Assets – for Components of the Enterprise Loans Fund ................................. 94 Schedule of Revenues, Expenses, and Changes in Fund Balance – Budget and Actual: Enterprise Management Fund ............................................................................... 96 Schedule of Revenues, Expenditures, and Changes in Fund Balance – Budget and Actual: Risk Management Fund ......................................................................................... 97 Statement of Changes in Assets and Liabilities – Agency Fund .......................................... 98 Capital Assets Used in the Operation of Governmental Funds: Schedule by Source ...................................................................................................... 100 Schedule by Function and Activity ................................................................................ 101 Schedule of Changes by Function and Activity ............................................................. 102 Schedule of Activity of Real Property Held by the Commission .................................... 103
STATISTICAL SECTION Net Assets by Component for the Last Ten Fiscal Years ....................................................... 106 Changes in Net Assets for the Last Ten Fiscal Years ............................................................ 107 Fund Balances of Governmental Funds for the Last Ten Fiscal Years .................................. 108 Changes in Fund Balances of Governmental Funds for the Last Ten Fiscal Years ............... 109 General Government Revenues for the Last Ten Fiscal Years .............................................. 110 General Government Expenditures for the Last Ten Fiscal Years ......................................... 111 Urban Renewal Area Consolidated Tax Rates for the Last Ten Fiscal Years ........................ 112 Urban Renewal and Redevelopment Bonds – Future Bond Principal Requirements ...................................................................................................... 114

Table of Contents (continued)
Page
STATISTICAL SECTION, Continued: Urban Renewal and Redevelopment Bonds – Future Bond Interest Requirements ........................................................................................................ 116 Urban Renewal Property Values, Tax Increment, and Projected Demographics – Last Ten Years or Since Inception: River District Urban Renewal Fund ...................................................................... 118 Convention Center Urban Renewal Fund ........................................................... 119 South Park Blocks Urban Renewal Fund ............................................................ 120 Downtown Waterfront Urban Renewal Fund ....................................................... 121 North Macadam Urban Renewal Fund ................................................................ 122 Central Eastside Urban Renewal Fund ............................................................... 123 Interstate Corridor Urban Renewal Fund ............................................................. 124 Lents Town Center Urban Renewal Fund ........................................................... 125 Gateway Regional Center Urban Renewal Fund ................................................ 126 Airport Way Urban Renewal Fund ....................................................................... 127 Willamette Industrial Urban Renewal Fund ......................................................... 128 Financial Assistance Activity for the Last Ten Fiscal Years .................................................... 129 Total Personal Income, Per Capita Income, Population Trends, and Unemployment Rates . 130 Organizational Chart with Detail .............................................................................................. 131 Miscellaneous Statistics - June 30, 2012 ................................................................................ 132
AUDIT COMMENTS & DISCLOSURES
Report on Internal Control Over Financial Reporting and on Compliance and Other matters Based on an Audit of Financial Statements Performed in Accordance with Government Auditing Standards.................................................................. 133 Schedule of Findings and Responses ..................................................................................... 135 Independent Auditor’s Report on Compliance and on Internal Control Over Financial Reporting Based on an Audit of Financial Statements Performed in Accordance with Oregon Minimum Standards ........................................................................ 140

Introductory Section


J. Scott Andrews
Co mmissio n Chair
Aneshka Dickson
Co mmissio ne r
John C. Mohlis
Co mmissio ne r
Steven Straus
Co mmissio ne r
Charles A. Wilhoite
Co mmissio ne r
Sam Adams
Mayo r
Patrick Quinton
Exe c utive Dire c to r
222 NW Fifth Ave nue
Po rtland, OR
97209-3859
503-823-3200 Main
503-823-3368 Fax
503-823-3366 TTY
November 23, 2012
To the Commissioners of the Portland Development Commission, Mayor and Members of the City Council, and the Citizens of the City of Portland, Oregon: The Finance & Business Operations Department and I are pleased to submit the Portland Development Commission’s (PDC or Commission) Comprehensive Annual Financial Report (CAFR) for the fiscal year ended June 30, 2012. State law requires that all local governments publish a complete set of financial statements within six months of the close of each fiscal year. This report is published to provide the Commissioners of PDC, the citizens of the City of Portland (City), city staff, and other readers with detailed information concerning the financial position and activities of the PDC.
Management assumes full responsibility for the completeness and reliability of all information presented in this report, including all disclosures, based upon a comprehensive internal control framework that it has established for this purpose. The management of PDC is responsible for establishing and maintaining an effective internal control structure to safeguard its assets, assure the reliability of its accounting records, and promote operational efficiency. Because the cost of such controls should not outweigh their benefits, PDC’s internal controls have been designed to provide reasonable rather than absolute assurance that the financial statements will be free of any material misstatements.
The Portland City charter requires the Commission to undergo an annual independent audit by a licensed municipal auditor. The accounting firm of Moss Adams, LLP conducted the audit of the PDC's FY 2011-12 financial statements. The independent auditor concluded, based upon the audit, that there was a reasonable basis for rendering an unqualified opinion that PDC’s financial statements for the fiscal year ended June 30, 2012, are fairly presented in accordance with accounting principles generally accepted in the United States of America. The independent auditor’s report is presented at the front of the financial section of this report.
Management’s Discussion and Analysis (MD&A) immediately follows the independent auditor’s report and provides a narrative introduction, overview, and analysis of the basic financial statements. This letter of transmittal is designed to complement MD&A and should be read in conjunction with it.
I

PDC Profile
PDC was created as a city agency in 1958 under Article I, Section 15 of the Charter of the City of Portland, Oregon to serves as Portland’s urban renewal and economic development agency. PDC’s principal activities are business recruitment and retention, job creation, financial assistance for rehabilitation and restoration of properties and business development, and the acquisition of real property for the purpose of removing or preventing blight. The governing body is a five-member Commission, appointed by the Mayor and approved by the City Council. PDC is a component unit of the City of Portland and is discretely reported in their Comprehensive Annual Financial Report. PDC’s mission is to ensure Portlanders enjoy a diverse, sustainable community with healthy neighborhoods, a vibrant central city, a strong regional economy, and quality jobs and housing for all. It is the linkages among these efforts and the integration of services that sets PDC apart and assures that true efficiencies are achieved. In carrying out city policy, PDC has developed and managed projects and programs which have played a major role in keeping Portland one of America’s most livable cities. PDC currently manages eleven urban renewal areas (URA’s) scattered geographically throughout the City of Portland, and works extensively in Portland’s neighborhoods to deliver a broad range of neighborhood improvement programs, and to carry out a comprehensive range of economic development programs which create jobs for residents citywide. PDC’s business is conducted at semi-monthly public meetings and all activities are guided by the annual budget. Developed in conjunction with public and private community partners, the budget concentrates PDC resources in urban renewal areas and throughout Portland’s business districts and neighborhoods. Development of the budget for business lines and key activities at the program area level is critical to PDC plans for the future. In accordance with Oregon Local Budget Law, the proposed annual budget is presented to the Portland City Council acting as the PDC Budget Committee for review and approval. Following budget committee approval, PDC submits the approved budget to the Tax Supervising and Conservation Commission (TSCC) for review and to the PDC Board of Commissioners for review, adoption, and subsequent amendment as necessary. The appropriated budget is prepared by fund and program. Relevant Financial Policies
The City charter prescribes that PDC maintain budgeting and accounting systems and prepare an annual budget in accordance with Oregon Local Budget Law. Funds are used to segregate activities in accordance with special restrictions on the use of revenue. Expenditures are recorded by fund and purpose on the modified accrual basis of accounting, and are further classified by program, project, and organizational unit for internal management information. Cash and other assets, related liabilities, and residual equity are segregated into independent self-balancing funds. All capital asset and long-term debt balances are reflected in the government-wide financial statements. City charter requires PDC’s cash to be deposited in the City of Portland’s investment pool and invested by the City Treasurer in accordance
II

with Oregon Revised Statutes 294.035 and 294.046. In addition, special accounts may be maintained if required, for example, by debt covenants. Interest is paid by the City of Portland to PDC, and is allocated based on each fund’s periodic cash balance. Local Economic Conditions
Portland is the financial, trade, transportation, manufacturing, and business service center for Oregon, southwest Washington, and the Columbia River Basin. The area's five largest private sector employers are Intel Corporation, Providence Health Systems, Oregon Health Science University, Fred Meyer, and the Kaiser Foundation. Trade, transportation, and utilities continue to comprise the largest industry segment of the regional economy and account for approximately 17% of local jobs. Portland’s economy is healthier than many in the US, ranked 9th among 100 metropolitan areas in a recent analysis weighing such factors as private-sector job growth, unemployment, housing-price appreciation, and economic output. Growth in the job market has been slow and strategies for job creation are playing a major role in keeping economic recovery on track. Job recovery in the Portland metropolitan area at 2.2% is keeping pace with that of the State of Oregon at 2.4% and that of the Nation at 2.3%. The state Office of Economic Analysis notes that recent changes in the driving forces behind the slow recovery are beginning to show positive signs, particularly in the housing market, however full recovery is still forecast to be end of the year 2014. The Portland area was recently ranked 5th in the nation for gains in construction employment over this past year and the manufacturing industry continues to show consistent improvement within the state. The Portland metro area was also ranked 4th in the nation in a list of America’s Leading High-Tech Metros based on the concentration of high-tech companies, patents per capita and average annual patent growth. The Portland metropolitan area ended June 2012 with 8.1% unemployment, slightly below the national level of 8.2% and the State of Oregon rate of 8.5% and down significantly from the 9.2% of a year ago. Oregon statute limits the amount of property that can be included in a municipality’s urban renewal areas to a maximum of 15% of assessed value and 15% of acreage. During the fiscal year just ended PDC presented to the Portland City Council 7 new URA’s, six of which are Neighborhood Prosperity Initiatives whose goal is to strengthen the economic competitiveness of neighborhood business districts. The seventh new URA is the Education URA created to leverage resources to accelerate the growth of Portland State University, create jobs, attract investment, and bring long-lasting benefit to the entire region. The aggregate amount of certified assessed value in the eighteen urban renewal areas is approximately 12.7% of the City of Portland's total overall assessed value and 14.3% of overall acreage for the City. Each of the eleven previously established URA’s are currently projected to have adequate funding capability to pursue established plans.
III

Long-term Financial Planning
At present there are no known legal or legislative challenges to the funding of urban renewal activities using tax-increment financing. It is anticipated that tax-increment resources will provide ongoing funding as detailed in the five-year forecast. Annually, PDC forecasts projected revenues and expenditures for each of the urban renewal areas. This effort results in a five-year forecast of project and program budget requirements for the funds associated with them. To a large extent, non-urban renewal area revenues and expenditure requirements are dependent on the annual allocation of resources from external funding providers. Major Initiatives
Major initiatives cited in this section are highlights based on budgeted project dollars for the fiscal year ending in June 2013. Overall, PDC has budgeted approximately $31.9 million across urban renewal areas and city-wide for financial assistance through loans or grants (e.g., Economic Opportunity Funds, Redevelopment Loan Projects, Clean Energy Works Oregon) to stimulate investment and job growth, leveraging PDC dollars with private and public funds. PDC has an important role to play in the current economy and we continue to seek new ways to get more funds into our community. The Commission has budgeted $27.2 million for new and in-progress city infrastructure improvements including parks, transportation and public facilities across most urban renewal areas. The Commission has also budgeted approximately $42.7 million for housing programs as part of the Affordable Housing Set Aside Policy and implemented via an intergovernmental agreement with the Portland Housing Bureau. The IGA with the Portland Housing Bureau consists of all homeownership, home repair, and affordable rental housing projects and programs including the preservation of existing housing. The largest dollar projects are proposed to occur in the Convention Center URA through the Portland Housing Bureau (PHB) for the rehabilitation and preservation of affordable rental housing for $9.3 million and property redevelopment projects including $22 million for the revitalization of the Rose Quarter and the Veteran's Memorial Coliseum and $4 million contribution to the Convention Center Hotel project. The River District URA: will fund $7.9 million in infrastructure projects to include the completion of The Fields ($4.1M), the third in a series of neighborhood parks outlined in the Portland River District Park System Urban Design Framework Study and improvements to Union Station ($1.2M). Housing projects of $4.1 million will be funded through PHB, and $8 million is planned in property redevelopment to include the relocation of the Portland Police Department Horse Barn. In the North Macadam URA, the highest profile projects will be; Affordable Veteran Housing, $10.7 million through PHB for the development of approximately 200 units of new rental housing targeted for households at 0-60% Median Family Income
IV

V

Portland Development Commission________________________ A Component Unit of the City of Portland, Oregon
(from left to right Aneska Colas-Dickson, Steven Straus, Patrick Quinton-Executive Director,
Scott Andrews-Chairman, John Mohlis, Charles Wilhoite)
Governing Board (As of June 30, 2012) Term Expires
Scott Andrews, Chairman July 9, 2014 Melvin Mark Companies 111 SW Columbia, Ste 1380 Portland, OR 97201 [email protected] Charles A. Wilhoite June 30, 2015 Managing Director Willamette Management Associates 111 SW Fifth Ave, Suite 2150 Portland, OR 97204 [email protected] Aneshka Colas-Dickson July 9, 2013 Vice President & CFO Colas Construction 5319 SW Westgate Drive, Suite 207 Portland, OR 97209 [email protected]
John Mohlis June 30, 2015 Executive Secretary-Treasurer Columbia Pacific Building Trades Council 17986 S. Fir Cone Ct Oregon City, OR 97045 john [email protected]
Steven Straus July 9, 2014 President Glumac 320 SW Washington St., Ste 200 Portland, OR 97204 [email protected]
Registered Agent None
VI

Portland Development Commission Organizational Chart
Citizensof
Portland
Portland Development Board of Commissioners
Executive Director
The Mayor and
City Commissioners
Administrative Departments:
Business & Social Equity Finance & Business Operations Legal Government Relations & Public Affairs
Operating Departments:
Urban Development
VII

C o l u m b i a R i v e r
W i l l a m
e t t e R
i v e r
0 52.5Miles
City of Portland
Urban Renewal Areas
City of Portland
Willamette Industrial URA
South Park Blocks URA
River District URA
Oregon Convention Center URA
North Macadam URA
Lents Town Center URA
Interstate Corridor URA
Gateway Regional Center URA
Downtown Waterfront URA
Central Eastside URA
Airport Way URA
Education URA - No TIF Budget 12/13 - Acreage Included
NPI URA's - No TIF Budget 12/13 - Acreage Included
Total Acres in Urban Renewal Plan Areas:
Total Acres in the City of Portland:
URAs as a Percentage of City Acreage
13,225.7
92,768
14.3%
VIIIVIII

Certificate of Achievement for Excellence
in Financial Reporting
Presented to
Portland Development Commission
Oregon
For its Comprehensive Annual
Financial Report
for the Fiscal Year Ended
June 30, 2011
A Certificate of Achievement for Excellence in Financial
Reporting is presented by the Government Finance Officers
Association of the United States and Canada to
government units and public employee retirement
systems whose comprehensive annual financial
reports (CAFRs) achieve the highest
standards in government accounting
and financial reporting.
President
Executive Director
IX


Financial
Section


REPORT OF INDEPENDENT AUDITORS
Board of Commissioners Portland Development Commission, Portland Oregon (A Component Unit of the City of Portland) We have audited the accompanying financial statements of the governmental activities, the business-type activities, each major fund, and the aggregate remaining fund information of the Portland Development Commission (a Component Unit of the City of Portland, Oregon) (the Commission), as of and for the year ended June 30, 2012, and the respective changes in financial position and cash flows, where applicable, thereof and the respective budgetary comparison statements for the General Fund, and the Housing and Community Development Contract Fund, which collectively comprise the Commission’s basic financial statements as listed in the table of contents. These financial statements are the responsibility of the Commission’s management. Our responsibility is to express opinions on these financial statements based on our audit. We conducted our audit in accordance with auditing standards generally accepted in the United States of America and the standards applicable to financial audits contained in Government Auditing
Standards, issued by the Comptroller General of the United States. Those standards require that we plan and perform the audit to obtain reasonable assurance about whether the financial statements are free of material misstatement. An audit includes consideration of internal control over financial reporting as a basis for designing audit procedures that are appropriate in the circumstances, but not for the purpose of expressing an opinion on the effectiveness of the Commission’s internal control over financial reporting. Accordingly, we express no such opinion. An audit also includes examining, on a test basis, evidence supporting the amounts and disclosures in the financial statements, assessing the accounting principles used and significant estimates made by management, as well as evaluating the overall financial statement presentation. We believe that our audit provides a reasonable basis for our opinions. In our opinion, the financial statements referred to previously present fairly, in all material respects, the respective financial position of the governmental activities, the business-type activities, each major fund, and the aggregate remaining fund information of the Commission, as of June 30, 2012, and the respective changes in financial position and, where applicable, cash flows thereof and for the respective budgetary comparison statements for the General Fund, and the Housing and Community Development Contract Fund, for the year then ended in conformity with accounting principles generally accepted in the United States of America. In accordance with Government Auditing Standards, we have also issued our report dated November 21, 2012, on our consideration of the Commission’s internal control over financial reporting and on our tests of its compliance with certain provisions of laws, regulations, contracts, and grant agreements and other matters. The purpose of that report is to describe the scope of our testing of internal control over financial reporting and compliance and the results of that testing, and not to provide an opinion on the internal control over financial reporting or on compliance. That report is an integral part of an audit performed in accordance with Government Auditing Standards and should be considered in assessing the results of our audit.
1

INDEPENDENT AUDITOR’S REPORT – (continued) Accounting principles generally accepted in the United States of America require that the management’s discussion and analysis on pages 3 through 18, and the post-employment healthcare benefits schedule on page 65, be presented to supplement the basic financial statements. Such information, although not a part of the basic financial statements, is required by the Governmental Accounting Standards Board who considers it to be an essential part of financial reporting for placing the basic financial statements in an appropriate operational, economic, or historical context. We have applied certain limited procedures to the required supplementary information in accordance with auditing standards generally accepted in the United States of America, which consisted of inquiries of management about the methods of preparing the information and comparing the information for consistency with management’s responses to our inquiries, the basic financial statements, and other knowledge we obtained during our audit of the basic financial statements. We do not express an opinion or provide any assurance on the information because the limited procedures do not provide us with sufficient evidence to express an opinion or provide any assurance. Our audit was conducted for the purpose of forming opinions on the financial statements that collectively comprise the Commission’s basic financial statements. The combining and individual nonmajor fund financial statements are presented for purposes of additional analysis and are not a required part of the basic financial statements. Such information is the responsibility of management and was derived from and relates directly to the underlying accounting and other records used to prepare the financial statements. The information has been subjected to the auditing procedures applied in the audit of the financial statements and certain additional procedures, including comparing and reconciling such information directly to the underlying accounting and other records used to prepare the financial statements or to the financial statements themselves, and other additional procedures in accordance with auditing standards generally accepted in the United States of America. In our opinion the combining and individual nonmajor fund financial statements are fairly stated in all material respects in relation to the financial statements as a whole. Our audit was conducted for the purpose of forming opinions on the financial statements that collectively comprise the Commission’s basic financial statements. The introductory and statistical sections are presented for the purposes of additional analysis and are not a required part of the basic financial statements. Such information has not been subjected to the auditing procedures applied in the audit of the basic financial statements, and accordingly, we do not express an opinion or provide any assurance on it.
James C. Lanzarotta, Partner for Moss Adams, LLP Eugene, Oregon November 21, 2012
2

Management’s Discussion and Analysis
As management of Portland Development Commission (PDC), we offer readers of PDC’s financial
statements this narrative overview and analysis of the financial activities of PDC for the fiscal year
ended June 30, 2012. Management’s Discussion and Analysis is intended to explain the significant
changes in financial position, as well as differences between the current and prior years. We
encourage readers to consider the information presented here in conjunction with additional
information that we have furnished in our letter of transmittal, which can be found on pages i-v of this
report. Financial Highlights
The assets of PDC exceeded the liabilities for the current year ended June 30, 2012
by $289,465,633 (net assets). Of this amount, $933,496 (unrestricted net assets)
may be used to meet PDC’s ongoing obligations to citizens and creditors.
PDC’s total net assets increased by $59,179,748 (25.7%) when compared to the
financial statements at June 30, 2011. The net asset increase is attributable to an
overall increase in general revenues and transfers of $55,792,615 or 60.2% along
with a decrease of $66,916,059 or 39.8% in expenses.
As of June 30, 2012, PDC’s governmental funds reported a combined ending fund
balance of $288,845,340, an increase of $63,241,283 from the prior year.
Approximately 1.1% or $3,085,043 of the combined ending governmental fund
balance, is available for spending (assigned and unassigned fund balances).
PDC’s total long-term liabilities increased by $3,321,875 (38.8%) during the fiscal
year ended June 30, 2012. The key factor in this increase is the addition of
contingent liabilities attached to property held for sale and vacation accruals along
with an increase for net other post-employment benefit obligation. This is offset by a
decrease of $394,230 recorded in the accrual for pollution remediation.
Gross loans receivable decreased from $100,479,307 to $91,524,165 commission-
wide, or 8.9%. The loan loss allowance decreased from $46,152,838 to
$36,566,369, a decrease of 20.3% from the prior year’s allowance, resulting in net
loans receivable of $54,957,796. Broader detail on these highlights and other topics will be presented throughout the remainder of this
report. Overview of the Financial Statements This discussion and analysis are intended to serve as an introduction to PDC’s basic financial
statements, which are comprised of three components: 1) government-wide financial statements, 2)
fund financial statements and 3) notes to the basic financial statements. This report also contains
other supplementary information in addition to the basic financial statements. Government-wide financial statements. The government-wide financial statements are designed to
provide readers with a broad overview of PDC’s finances, in a manner similar to private-sector
business statements.
3

The Statement of Net Assets presents information on all of PDC’s assets and liabilities, with the
difference between the two reported as net assets. Over time, increases or decreases in net assets
may serve as a useful indicator of whether the financial position of PDC is improving or deteriorating.
The Statement of Activities presents information showing how PDC’s net assets changed during the
most recent fiscal year. All changes in net assets are reported as soon as the underlying event giving
rise to the change occurs, regardless of the timing of related cash flows. Thus, revenues and
expenses are reported in this statement for some items that will only result in cash flows in future
fiscal periods (e.g., depreciation).
Both of the government-wide financial statements distinguish functions of PDC that are principally
supported by tax-increment debt proceeds (in lieu of tax-increment revenue) and intergovernmental
revenues (governmental activities) from other functions that are intended to recover all or a significant
portion of their costs through user fees and charges (business-type activities). The governmental
activities include general government, Housing and Community Development Contract administration,
urban renewal and redevelopment. The business-type activities include jobs, housing and
commercial financial assistance programs together with historic preservation. These activities are
mainly manifested as some form of financial assistance.
The government-wide financial statements can be found on pages 19-21 of this report.
Fund Financial Statements. A “fund” is a grouping of related accounts that is used to maintain
control over resources that have been segregated for specific activities or objectives. PDC, like other
state and local governments, uses fund accounting to ensure and demonstrate compliance with
finance-related legal requirements. The Commission adopts an annual appropriated budget for all
funds. A budgetary comparison statement has been provided for all funds to demonstrate
compliance with budgetary requirements. All of the funds of PDC can be divided into three
categories: governmental funds, proprietary funds, and fiduciary (agency) funds.
Governmental funds. Governmental funds are used to account for essentially the same functions
reported as governmental activities in the government-wide financial statements. However, unlike the
government-wide financial statements, governmental fund financial statements focus on near-term
inflows and outflows of spendable resources, as well as on balances of spendable resources
available at the end of the fiscal year. Such information may be useful in evaluating our near-term
financing requirements.
Because the focus of governmental funds is narrower than that of the government-wide financial
statements, it is useful to compare the information presented for governmental activities in the
government-wide financial statements. By doing so, readers may better understand the long-term
impact of the government’s near-term financing decisions. Both the Governmental Fund Balance
Sheet and the Governmental Fund Statement of Revenues, Expenditures, and Changes in Fund
Balances provide a reconciliation to facilitate this comparison between governmental funds and
governmental activities.
PDC maintains 17 individual governmental funds. Information is presented separately in the
Governmental Funds Balance Sheet and the Governmental Funds Statement of Revenues,
Expenditures, and Changes in Fund Balances for each of the major funds. The major governmental
funds are: General Fund (adopted as the Urban Redevelopment Fund); Housing and Community
Development (HCD) Contract Fund; North Macadam Urban Renewal Fund; River District Urban
Renewal Fund; Convention Center Urban Renewal Fund; Lents Town Center Urban Renewal Fund;
and Interstate Corridor Urban Renewal Fund. Data from the other ten governmental funds are
4

combined into a single, aggregated presentation. Individual fund data for each of the nonmajor
governmental funds is provided in the form of combining statements elsewhere in this report.
The basic governmental fund financial statements can be found on pages 22-29 of this report.
Proprietary funds. PDC maintains two different types of proprietary funds. Enterprise funds are
used to report the same functions presented as business-type activities in the government-wide
financial statements. PDC uses two enterprise funds. Internal service funds are an accounting
device used to accumulate and allocate costs internally among PDC’s various functions. PDC uses
an internal service fund to account for risk management. Because these services predominantly
benefit governmental rather than business-type functions, they have been included within
governmental activities in the government-wide financial statements. Proprietary fund statements provide the same type of information as the government-wide financial
statements, only in more detail. The enterprise fund data are combined into a single, aggregated
presentation, and includes such programs as: the Business Development Loan Fund and the Small
Business Loan Fund. Additionally, the internal service fund is presented in the proprietary fund
financial statements. Individual fund data for the internal service fund is provided elsewhere in this
report.
Enterprise Loans Fund. The Enterprise Loans Fund is used to account for revolving loan programs.
PDC intends to prevent expenses from exceeding annual income in order to preserve the original
principal of each program.
Enterprise Management Fund. The Enterprise Management Fund is used to account for the activity
related to the operation and maintenance of PDC properties or City of Portland properties PDC has
contracted to manage outside of Urban Renewal Areas.
Internal Service Fund. A Risk Management Fund is used to set aside resources to meet insurance
policy deductible amounts and other amounts not fully reimbursed from insurance proceeds, as
necessary. In certain risk areas, the deductible amount increased substantially, requiring PDC to
formally establish the program. Additional contributions may be made in future years.
The basic proprietary fund financial statements can be found on pages 30-32 of this report.
Fiduciary (agency) funds. Fiduciary funds are used to account for resources held for the benefit of
parties outside PDC. Fiduciary (agency) funds are not reflected in the government-wide financial
statement because the resources of those funds are not available to support PDC’s own programs.
The accounting used for fiduciary (agency) funds is much like that used for proprietary funds.
The basic fiduciary (agency) fund financial statement can be found on page 33 of this report.
Notes to the basic financial statements. The notes provide additional information that is essential
to a full understanding of the data provided in the government-wide and fund financial statements.
The notes to the basic financial statements can be found on pages 34-63 of this report.
Other Information. In addition to the basic financial statements and accompanying notes, this report
also presents certain required supplementary information concerning PDC’s progress in funding its
obligation to provide post-employment benefits to its employees. Required supplementary
information can be found on page 65 of this report.
5

Supplementary Data. The combining statements referred to earlier in connection with nonmajor
governmental funds are presented as supplementary data following the basic financial statements.
Combining statements and individual fund budgetary comparison schedules can be found on pages
66-98 of this report.
Government-wide Financial Analysis
As noted earlier, net assets may serve over time as a useful indicator of a government’s financial
position. PDC’s total assets exceeded liabilities by $289,465,633 for all governmental and business-
type funds at the close of the most recent fiscal year.
By far the largest portion of PDC’s net assets, $279,593,433 or 96.6%, represents resources that are
subject to external restrictions on how they may be used in governmental activities. Restricted net
assets are mainly comprised of urban renewal funds which are limited to use in the specific urban
renewal area from whence the funds originated in the form of tax-increment debt proceeds in lieu of
tax-increment revenues. The percentage of restricted net assets remained fairly constant over the
fiscal year, with the percentage of restricted net assets increasing only 30.9% from fiscal year ended
June 30, 2011.
Portland Development Commission’s Net Assets
At June 30
A small portion of PDC’s total net assets ($8,938,704 or 3.1%) reflects its investment in capital assets
(e.g., land, buildings, vehicles, and equipment). These capital assets are used to provide services to
citizens; consequently, these assets are not available for future spending.
The remaining balance of unrestricted net assets ($933,496 or 0.3%) may be used to meet PDC’s
ongoing obligations to citizens and creditors. A portion of the unrestricted net assets is contained in
the business-type activities that cannot be used to make up for the decrease reported in the
governmental activities. Note that unrestricted net assets have decreased $6,155,119 or 86.8%
2012 2011 2012 2011 2012 2011
Assets
Current and
Other Assets $ 294,769,982 $ 235,172,075 $ 3,718,716 $ 3,409,529 $ 298,488,698 $ 238,581,604
Capital Assets 8,938,704 9,602,690 - - 8,938,704 9,602,690
Total Assets 303,708,686 244,774,765 3,718,716 3,409,529 307,427,402 248,184,294
Liabilities
Other Liabilities 5,846,705 9,319,753 225,269 10,736 6,071,974 9,330,489
Long-term Liabilities 11,889,795 8,567,920 - - 11,889,795 8,567,920
Total Liabilities 17,736,500 17,887,673 225,269 10,736 17,961,769 17,898,409
Net Assets
Invested in Capital
Assets 8,938,704 9,602,690 - - 8,938,704 9,602,690
Restricted 279,593,433 213,594,580 - - 279,593,433 213,594,580
Unrestricted (2,559,951) 3,689,822 3,493,447 3,398,793 933,496 7,088,615
Total Net Asset $ 285,972,186 $ 226,887,092 $ 3,493,447 $ 3,398,793 $ 289,465,633 $ 230,285,885
Governmental
Activities
Business-Type
Activities Total
6

during fiscal year 2012. The business-type unrestricted net assets increased by 2.8%, or $94,654, a
direct result of a decrease in the loan loss allowance, while the governmental segment decreased
$6,249,773, or 169.4% as the result of changes in property held for sale and long-term liabilities.
At June 30, 2012, PDC is able to report positive balances in all three categories of net assets, for the
Commission as a whole, as well as for its separate business-type activities and in two of the three
categories of fund balance for the governmental activities, a slight change with the reporting for prior
fiscal years.
One major component of PDC’s assets is loans receivable from its customers. During this last year,
PDC’s gross portfolio decreased $8,955,142 or 8.9%, likewise the loan loss allowance also
decreased by 20.8% or $9,586,469 from the prior year. The smaller, current portion of the net
portfolio increased 22.0% while the non-current portion decreased by 0.4%, reflecting a trend in
shorter-term lending, as well as the effects of the Portfol Loan System implementation and overall
review of the loan portfolio and program designations.
Portland Development Commission’s
Loans Receivable At June 30
%
Change
Gross Loans Receivable $ 91,524,165 $ 100,479,307 $ (8,955,142) -8.9%
Allow ance & Discount (36,566,369) (46,152,838) 9,586,469 -20.8%
Total Net $ 54,957,796 $ 54,326,469 $ 631,327 1.2%
Current Portion $ 4,670,683 $ 3,828,175 $ 842,508 22.0%
Non-Current Portion 50,287,113 50,498,294 (211,181) -0.4%
Total Net $ 54,957,796 $ 54,326,469 $ 631,327 1.2%
Change2012 2011
7

PDC’s ending net assets increased by $59,179,748, or approximately 25.7%, during the current fiscal
year. In general, PDC’s overall financial position has improved over the year, the result of a
$54,166,980 (51%) increase in revenues over the prior year, coupled with a decrease in expenses of
$66,916,029 (39.8%). The increase in net assets is attributable primarily to an increase in tax-
increment debt proceeds (in lieu of tax-increment revenue) the result of bond proceeds in the
Convention Center Urban Renewal Area.
Portland Development Commission’s Changes in Net Assets
For the Fiscal Years Ended June 30
2012 2011 2012 2011 2012 2011
Revenues:
Program Revenues:
Charges for Services $ 3,291,192 $ 3,984,188 $ 1,218,447 $ 2,058,945 $ 4,509,639 $ 6,043,133
Operating Grants and
Contributions 7,170,821 7,262,870 200,000 200,092 7,370,821 7,462,962
General Revenues:
Tax-increment Debt Proceeds
(in lieu of tax-increment revenue) 133,787,307 85,287,185 - - 133,787,307 85,287,185
Unrestricted Investment
Income 525,565 664,618 7,480 14,356 533,045 678,974
Miscellaneous 14,083,247 6,644,825 - - 14,083,247 6,644,825
Total Revenues 158,858,132 103,843,686 1,425,927 2,273,393 160,284,059 106,117,079
Expenses:
Community Development 99,713,038 156,412,909 - - 99,713,038 156,412,909
Enterprise Funds - - 1,391,273 11,607,461 1,391,273 11,607,461
Total Expenses 99,713,038 156,412,909 1,391,273 11,607,461 101,104,311 168,020,370
Increase (Decrease) in Net Assets
Before Special Item and Transfers 59,145,094 (52,569,223) 34,654 (9,334,068) 59,179,748 (61,903,291)
Transfers (60,000) 50,000 60,000 (50,000) - -
Increase (Decrease) in
Net Assets
Beginning Net Assets 226,887,092 279,406,315 3,398,793 12,782,861 230,285,885 292,189,176
Ending Net Assets $ 285,972,186 $ 226,887,092 $ 3,493,447 $ 3,398,793 $ 289,465,633 $ 230,285,885
(61,903,291) (52,519,223) 59,179,748 94,654 (9,384,068)
59,085,094
Governmental
Activities Total
Business-type
Activities
8

Governmental activities. PDC’s ending net assets for governmental activities increased by
$59,085,094, while overall there was a 25.7% increase in total net assets on a government-
wide basis. This increase is due primarily to an increase in governmental revenues of
$55,014,446 or 53%, while expenditures decreased by 36.3%, or $56,699,871.
Portland Development Commission’s
Summary of Changes in Net Assets
for the Fiscal Year Ended June 30, 2012
Compared to the Fiscal Year Ended June 30, 2011
A slight decrease in charges for services offset by an increase in miscellaneous revenues added to
the increase in tax-increment proceeds (in lieu of tax-increment revenue). These increases were due
to the receipt of bond proceeds and an increase in the sale of real property. A marked decrease in
Community Development and Financial Assistance is the primary source of decreased expenses.
Governmental Business-type Total
Revenue Changes Activities Activities Change
Increase - Tax-Increment Proceeds
(in lieu of tax-increment revenue) $ 48,500,122 $ - $ 48,500,122
(Decrease) - Charges for Services (692,996) (840,498) (1,533,494)
(Decrease) - Operating Grants and Contributions (92,049) (92) (92,141)
(Decrease) - Unrestricted Investment Income (139,053) (6,876) (145,929)
Increase - Miscellaneous 7,438,422 - 7,438,422
Total Revenue Changes 55,014,446 (847,466) 54,166,980
(52,519,223) (9,384,068) (61,903,291)
Decrease in Expenses 56,699,871 10,216,188 66,916,059
Transfers In/(Out) Change (110,000) 110,000 -
Change in Net Assets Current Year $ 59,085,094 $ 94,654 $ 59,179,748
Prior Year Net Asset Increase/(Decrease)
$158,858,132
$1,425,927
$99,713,038
$1,391,273$0
$25,000,000
$50,000,000
$75,000,000
$100,000,000
$125,000,000
$150,000,000
$175,000,000
Governmental Activities Business-type Activities
Community Development Program Expensesand General Revenues
Revenues
Expenses
9

Tax-increment funding (TIF) proceeds are typically PDC’s largest annual income source, and that
was certainly the case for this fiscal year. The following schedule illustrates the TIF proceeds
received by PDC from the City of Portland over the last five years. Note that the annual allotment of
TIF proceeds received in fiscal year 2012 is significantly higher than the five-year average and any of
the last five years and that the five-year average increased, by $8,381,708 from $95,625,628 in fiscal
year 2011.
Summary History of TIF Proceeds Received by Portland Development Commission
For the Fiscal Years Ended June 30
The City of Portland receives property taxes in each of the designated urban renewal areas and forwards a portion to be allocated as TIF to the Portland Development Commission for projects. The amount of TIF allocated to PDC varies annually depending on each of the urban renewal area’s projected tax revenues, debt capacity, and existing levels of outstanding debt held by the City. Each urban renewal area has a planned expiration date after which it cannot issue additional tax-increment debt. A typical life-cycle is between ten and twenty years, however, the expiration date may be extended by the Board of Commissioners. An urban renewal area that has reached its maximum indebtedness or expiration date will no longer issue new long-term tax-increment debt, but may continue spending until its resources are exhausted and will receive tax-increment revenues until all outstanding debt is retired. The Downtown Waterfront Urban Renewal Area, South Park Blocks Urban Renewal Area, and Airport Way Urban Renewal Area have all reached their plan expiration dates and Oregon Convention Center Urban Renewal Area has issued its last tax-increment debt.
Charges for Services2%
Operating Grants5%
Intergovernmental (TIF)84%
Unrestricted Investments
0%
Miscellaneous9%
Revenues by Source - Governmental Type Activities
Year Amount Change %
2008 $ 105,929,455 $ 5-Year Average
2009 105,254,573 (674,882) -1% = 104,007,336$
2010 89,778,162 (15,476,411) -15%
2011 85,287,185 (4,490,977) -5%
2012 133,787,307 48,500,122 57%
$ 520,036,682
10

Business-type activities. PDC’s net assets for business-type activities increased by $94,654 or 2.8%, for the fiscal year ended June 30, 2012. Among the key elements in this increase are reduced revenues in Charges for Services and reduced activity in Financial Assistance.
Portland Development Commission’s
Changes In Business-type Activities Expenses
For the Fiscal Years Ended June 30
Expenses 2012 2011 Change
Personal services $ 19,732 $ 125,183 $ (105,451)
Professional services 15,868 55,680 (39,812)
Loan document costs 14,532 59,255 (44,723)
Financial assistance 209,238 7,579,456 (7,370,218)
Internal Service Reimbursements 98,423 579,270 (480,847)
Miscellaneous Expenses 1,033,480 3,208,617 (2,175,137)
Totals $ 1,391,273 $ 11,607,461 $ (10,216,188)
In fiscal year 2012, expenses decreased by $7,370,218 in financial assistance for support of small
business and miscellaneous expenses by $2,175,137 due to the transfer of the housing programs to
PHB and subsequent closing of those funds. These expenses were in addition to decreases for;
$39,812 in professional services, the results of changes in the architectural grant process, and a
decrease of $480,847 in internal service reimbursements for personal services.
The summary history below illustrates the fluctuating nature of the loan loss allowance. In 2012,
there was no net increase in the allowance expense recorded for the Enterprise Loans Fund. There
continues to be a shift in the portfolio composition towards performing amortizing loans and away
from the deferred payment and cash flow dependent loans and grants.
Portland Development Commission’s Loan Loss Allowance History
Enterprise Loans Fund For the Fiscal Years Ended June 30
Allowance Change from
Year Expense Prior year
2007 $ 406,467
2008 1,269,841 $ 863,374
2009 71,340 (1,198,501)
2010 1,393,874 1,322,534
2011 - (1,393,874)
2012 - -
11

Business-type revenues overall decreased (37.3%) over the prior year, or $847,466. Charges for
services experienced a $840,498, (40.8%) decrease, while Operating grants decreased very slightly,
Charges for Services continues to be the largest source of revenue in Business-Type Activities at this
time. Unrestricted investment income also experienced a decrease this fiscal year of $6,876 or
47.9%.
Financial Analysis of PDC’s Funds
As noted earlier, PDC uses fund accounting to ensure and demonstrate compliance with finance-
related legal requirements.
Governmental funds. The focus of PDC’s governmental funds is to provide information on near-term
inflows, outflows, and balances of spendable resources. Such information is useful in assessing
PDC’s financing requirements. In particular, unreserved fund balances may serve as a useful
measure of a government’s net resources available for spending at the end of the fiscal year.
At June 30, 2012, PDC’s governmental funds reported combined ending fund balances of
$288,845,340, an increase of $63,241,283, or 28.0% from the prior year. Of this $687,937,
unassigned fund balance, is available for spending at the Commission’s discretion. Approximately
$2,397,106 or 0.8% constitutes assigned fund balance in the General Fund for subsequent years
expenditures. The remainder of fund balance is not available for discretionary spending, these
balances are reflected as non-spendable and restricted because they have already been committed
for urban renewal programs, $280,746,121, or for other restricted purposes, $5,014,176, in the
general fund and other governmental funds.
The General Fund, adopted as the Urban Redevelopment Fund, is the primary operating fund of
PDC. During the current fiscal year ended June 30, 2012, the fund balance of the General Fund
decreased from $5,121,864 to $4,113,594. Key factors in the $1,008,270 decrease include:
Charges for Services85%
Operating Grants 14%
Unrestricted Investments
1%
Revenues by Source ‐ Business‐Type Activities
12

Revenues decreased by $92,143 primarily due to a decrease in miscellaneous
revenues and an increase in Intergovernmental Revenues, a result of the
reclassification of PHB billings to intergovernmental revenue and a reduced contract.
Smaller decreases were also experienced in charges for services and interest on
investments.
Net expenditures increased $621,711. A decrease of $559,512 in community
development for professional service contracts, public communications and
marketing, and training, travel, and meeting expenses account for the majority of the
change, the result of decreased funding for economic development efforts citywide.
Capital Outlay expenditures also decreased by $627,626 while Financial Assistance
for technical assistance and economic development increased by $1,808,849.
Transfers Out reflect planned reimbursements of $60,000 to the Enterprise Loans
Funds to support an ongoing cash flow reserve for Economic Development.
The six other major governmental funds include the Housing and Community Development Contract
Fund, North Macadam Urban Renewal Fund, River District Urban Renewal Fund, Convention Center
Urban Renewal Fund, Lents Town Center Urban Renewal Fund, and the Interstate Corridor Urban
Renewal Fund. The following table shows the change in their fund balances.
Portland Development Commission’s
Schedule of Other Major Governmental Fund Balances At June 30
As expected, the Housing and Community Development Contract Fund did not experience a
significant change in its fund balance. The bulk of the programs in this fund were transferred to the
Portland Housing Bureau.
In the North Macadam Urban Renewal Fund, fund balance increased $1,439,726 or 10.4% due
almost entirely to an increase of $3,986,961 or 3,764.5% in miscellaneous revenues caused by the
repayment and cancellation of the loan loss provision for the loans made from this fund. This is
partially offset by a decrease in community development of $2,051,009 or 39.4%.
In the River District Urban Renewal Area, the $12,847,483 or 28.9% net increase in fund balance can
be attributed to an increase in tax-increment debt proceeds (in lieu of tax-increment revenue) of
15.1% or $5,554,082 coupled with significant decreases in expenditures. Financial Assistance
experienced a decrease of $10,263,409 or 95.0% as fewer loan and grant disbursements were made
and Capital Outlay decreased $16,713,613 or 89.6% as no major projects were begun. These
Fund 2012 2011 Change
Housing and Community Development
Contract Fund $ 7,492
$ 282
$ 7,210
North Macadam Urban Renewal Fund 15,296,548 13,856,822 1,439,726
River District Urban Renewal Fund 57,345,568 44,498,085 12,847,483
Convention Center Urban Renewal Fund 71,171,583 28,150,444 43,021,139
Lents Town Center Urban Renewal Fund 22,573,355 24,422,821 (1,849,466)
Interstate Corridor Urban Renewal Fund 20,635,615 9,445,698 11,189,917
Total Fund Balances $ 187,030,161 $ 120,374,152
$ 66,656,009
13

decreases were offset by an increase in Community Development of $7,324,635 or 34.4%, which
includes housing expenditures disbursed through Portland Housing Bureau.
In fiscal year 2012, the Convention Center Urban Renewal Fund experienced a 152.8% increase in
fund balance, or $43,021,139. Most significant was an increase of $43,862,463 in tax-increment debt
proceeds (in lieu of tax-increment revenue) the result of bond proceeds and an increase of
$3,841,767 in miscellaneous revenues resulting from property transferred to PHB and property
transactions resulting from the Urban Renewal boundary changes between the Interstate Corridor
and Convention Center Urban Renewal Area. This was offset by slight decreases in expenditures.
The Lents Town Center Urban Renewal Fund experienced a decrease in fund balance of 7.6% or
$1,849,466. Tax-increment debt proceeds (in lieu of tax-increment revenue) reflect a slight increase
of $1,069,360 or 16.6%, while expenditures increased by 27.8% or $3,747,707, primarily in Capital
Outlay, $1,461,319 or 41.3%, and Financial Assistance, $2,801,231 or 70.2%, with a small increase
in Community Development of $514,843 or 8.6%.
The Interstate Corridor Urban Renewal Fund ended 2012 with an increase in fund balance of
$11,189,917 or 118.5%. Revenues experienced an overall increase of $2,643,570 (14.3%)
attributable to a small increase in tax-increment debt proceeds (in lieu of tax-increment revenue) of
$1,283,608 or 7.0% and a similar increase of $1,169,100 in miscellaneous revenue resulting from a
decrease in loan loss allowance. Expenditures decreased by $9,586,986 or 49.0%. Decreases were
experienced in the areas with Financial Assistance at 62.8% or $5,083,333 showing the greatest
decrease. Community Development decreased by $1,643,022 or 23.1% and Capital Outlay
decreased by $2,860,631 or 65.5%.
Portland Development Commission’s
Tax-Increment Funds (Debt Proceeds) Allocation For the Years Ended June 30
Proprietary funds. PDC’s proprietary fund statements provide the same type of information found in
the government-wide financial statements, but in more detail. PDC’s Enterprise Loans Fund
encompasses numerous loan programs. Net assets for the Enterprise Loans Fund increased by
$131,049 during the fiscal year ended June 30, 2012. Factors concerning the increase in net assets
of the Enterprise Loans Fund have already been addressed in the discussion of PDC’s business-type
activities. The Enterprise Management Fund accounts for activity related to non-URA property
operation and maintenance and reflects a decrease in Net Assets of $36,395 or 48.4%. At present
this fund is comprised primarily of revenues: charges for services of $977,933 and $1,140 of
investment interest. Expenditures stem from the transfer of revenue to PHB as this is a housing
project and the payment of insurance on the property.
Capital Projects Urban Renewal Funds 2012 2011 Change
North Macadam $ 6,328,679 $ 7,396,300 $ (1,067,621)
River District 42,300,815 36,746,733 5,554,082
Convention Center 48,360,212 4,497,749 43,862,463
Lents Town Center 7,516,135 6,446,775 1,069,360
Interstate Corridor 19,636,706 18,353,098 1,283,608
Other Governmental Funds 9,644,760 11,846,530 (2,201,770)
Total TIF Allocation $ 133,787,307 $ 85,287,185 $ 48,500,122
14

General Fund Budgetary Highlights
Differences between the original budget and final amended budget amounted to a $2,502,829
increase in appropriations. The major differences are summarized as follows:
Budgeted revenue increased a net $272,873 primarily due to an increase in Loan
Collections and Interest revenues from the City of Portland, as well as an increase in
miscellaneous revenues recognizing private business development grants.
Budgeted expenditures in the General Fund reflected an increase of $570,935 in the
funding of Property Redevelopment mostly related to the reclassifying of the Main
Street Program and an update to the carry over in Business Development associated
with the General Fund EOI Program.
Decreases in Administrative expenditures budgeted of $146,839 represent the timing
of Business and Technology Fund projects moving to fiscal year 2012-13.
Differences between the final amended budget and actual revenues and expenditures amounted to a
$3,489,446 decrease over projected amounts. The major differences are summarized as follows:
Actual revenues decreased $1,156,896 primarily due to decreases in intergovernmental
revenues from the City of Portland General Fund received on a reimbursement basis for
economic development activities and a decrease in Rental Income revenues.
Administrative expenditures were lower than budgeted by $1,246,796 over the final budget
due to under spending in the ACT! conversion, PORTFOL Interfaces, and other IT projects.
Budgeted contingency funds represent resources expected to be carried over to the
following fiscal year beginning balance.
Capital Assets, Property Held for Sale, and Long-Term Debt
PDC records all of its capital outlay expenditures as either capital assets to be used in the course of
business or project-related property held for sale.
Capital assets. As of June 30, 2012 capital assets amount to $8,938,704 (net of accumulated
depreciation). This investment in capital assets includes land, buildings, improvements, vehicles,
equipment, and software. The total decrease in PDC’s investment in capital assets for the fiscal year
ended June 30, 2012 was $663,986 or 6.9%.
Portland Development Commission’s Capital Assets (net of accumulated depreciation)
At June 30
Asset Type 2012 2011 Change
Land $ 4,646,050 $ 6,101,427 $ (1,455,377)
Buildings 1,407,874 1,462,022 (54,148)
Work In Progress - 854,362 (854,362)
Leasehold Improvements - 177 (177)
Vehicles and Equipment 182,198 254,308 (72,110)
Intangilbe Software 2,702,582 930,394 1,772,188
Total Assets $ 8,938,704 $ 9,602,690 $ (663,986)
Governmental Activities
15

There were no major capital asset transactions during the year. Land values decreased due to an
additional transfer of property to the Portland Housing Bureau. Other types of capitalized assets
decreased slightly in value during the fiscal year with the exception intangible software for the
purchase of new financial software. Additional information on PDC’s capital assets can be found in
note III - F. on page 50 of this report, and in the Supplementary Data on pages 99-105.
Property Held for Sale. Expenditures for acquisition and improvements of real properties intended
for sale to appropriate developers are referred to as property held for sale. This recording approach
is also used for real property slated to be transferred to the City of Portland. Following are the
changes in property held for sale for the fiscal year ended June 30, 2012.
Portland Development Commission’s
Real Property Held for Sale
For the Fiscal Year Ended June 30, 2012
Balance Disposal/ Balance
Funding Source July 1, 2011 Additions Adjustments
June 30, 2012
General Fund $ 146,754 $ - $ - $ 146,754 Housing and Community Development Contract Fund
251,456
-
-
251,456
North Macadam Urban Renewal Fund 3,730,829 6,173,152 (4) 9,903,977
River District Urban Renewal Fund 17,210,597 7,288 (510,597) 16,707,288
Convention Center Urban Renewal Fund 18,072,974 4,998 (4,800,258) 13,277,714
Lents Town Center Urban Renewal Fund 9,705,020 160,743 (351,433) 9,514,330
Interstate Corridor Urban Renewal Fund 4,304,464 2,512,176 (260,000) 6,556,640
Other Governmental Funds 43,191,396 53,340 (4,127,305) 39,117,431
$
$
$
$
Total Property Held for Sale 96,613,490 8,911,697 (10,049,597) 95,475,590
In the North Macadam Urban Renewal Area, the RiverPlace Garage was acquired at a value $6,173,152.
In the River District Urban Renewal Area, 401-439 W Burnside St-The Grove Hotel was written down to the recently appraised value of $660,000
In the Convention Center Urban Renewal Area, properties valued at $2,172,974 were transferred to
the Interstate Corridor Urban Renewal Area due to a realignment of Urban Renewal boundaries. In
addition, 910 NE MLK Blvd-Menashe Site was written down to market value based on a recent
appraisal of $1,920,000.
In the Lents Town Center Urban Renewal Area two properties, 8801 SE Foster Rd and 9320 SE
Ramona St, were written down to market value based on current appraisals for a combined total of
$300,970.
In the Interstate Urban Renewal Area, the Marco Building was disposed of for $260,000. Additionally,
properties valued at $2,172,974 was transferred from the Convention Center Urban Renewal Area
due to a realignment of Urban Renewal boundaries and property originally acquired by the EDA
Loans Fund in lieu of foreclosure was purchased for $330,000.
16

Significant real property transactions in the Other Government Funds included:
In the Downtown Waterfront Urban Renewal Area, Old Town Lofts retail space and 20 parking spaces were acquired at a value equal to loans held and written-down to market value based on a recent appraisal of $1,100,000. The 209 SW Oak St-Abandoned Jail was written down for its entire booked value of $1,730,181 due to contingent liabilities attached to the property.
In the Central Eastside Urban Renewal Area, the 1401 SE Water Ave property was disposed of to the Oregon Museum of Science and Industry for $450,000.
In the Gateway Urban Renewal Area, real property at 10225 NE Burnside St., with a value of
$804,628 transferred to the Portland Housing Bureau.
In the EDA Loans Fund, property acquired in lieu of foreclosure was sold to the Interstate
Urban Renewal Area Fund at a value of $330,000 for development.
In the Airport Way Urban Renewal Area, $143,183 was recorded as amortization of the
remaining lease rights at Cascade Station.
Additional information on PDC’s real property held for sale can be found in note III - E. on page 49 of this report, and in the Supplementary Data on pages 103-104. Long-term debt. PDC does not maintain a debt service fund. Due to the nature of the services that
PDC provides to the community, all debt activity is fully represented in the Governmental and
Enterprise Loans Fund. PDC does not issue bonds, but receives proceeds from bonds issued and carried by the City of
Portland. Additionally, the City of Portland maintains lines-of-credit to provide short-term funding for
PDC projects. The City’s lines-of-credit are ultimately repaid with the long-term financing provided by
bond sales. See the statistical section on bonds in this report and the City of Portland’s financial
statements for further information.
Economic Factors and Next Year’s Budgets and Rates The Portland metropolitan area unemployment rate for June and July 2012 was 8.1%,
and July 2011 was 9.2%. This is down slightly from the rate of 10.0% the previous June.
The unemployment rate for the United States as a whole for June 2012 remains 8.2%.
The rate of job recovery in Oregon at 2.4% from the lowest point is running only slightly
ahead of the national rate of 2.3%. Job expansion is predicted to pick up but at present
is moving excruciatingly slow. Employers are filling vacancies resulting from turnover
and filling seasonal positions but few businesses are planning to actually expand their
workforce. It is expected that recovery to peak employment levels could take until the
end of 2014. Portland's total non-farm wage and salary employment is up to 1,010,200,
2.1% higher than last fiscal year.
The Portland area office market increased vacancy slightly to 13.7% during the second
quarter with 70,634 square feet of negative absorption. At present 315,000 square feet of
new construction is underway.
The industrial market saw vacancies decrease slightly to 14.2% during this past quarter
in the Portland area after steady increases over the past two years at 16.1% and 15.2%.
The availability of developable industrial land remains a concern as developable sites are
key to attracting and retaining major manufacturing companies.
17

Inflation rate trends for the Portland metropolitan area compare slightly less favorable to
National indices for the first time since 2007. Rates projected through June 2012 are
1.7% and 2.0%, respectively. Oregonians spend far more on shelter and food, the two
largest components of the index and components where price increases have been mild.
All of the above economic indicators are occurring in the context of similar economic
improvements for the State of Oregon.
All of these factors were considered in preparing PDC’s budget for the next fiscal year ending June
30, 2013.
Requests for Information
This financial report is designed to provide a general financial overview for those with an interest in
PDC’s finances. Questions concerning any of the information provided in this report or requests for
additional financial information should be addressed to the Office of the Chief Financial Officer,
Portland Development Commission, 222 NW Fifth Avenue, Portland, Oregon, 97209.
18

PORTLAND DEVELOPMENT COMMISSION
A COMPONENT UNIT OF THE CITY OF PORTLAND, OREGON
STATEMENT OF NET ASSETS
June 30, 2012
Governmental Business-type
Activities Activities Total
ASSETS
Current assets:
Cash and cash equivalents $ 15,500 $ - $ 15,500
Cash with City of Portland
investment pool 143,004,300 2,199,448 145,203,748
Cash with fiscal agent 122,987 - 122,987
Receivables:
Due from City of Portland 1,845,055 - 1,845,055
Accounts 154,703 77,605 232,308
Internal balances (100,000) 100,000 -
Loans, net 4,044,926 625,757 4,670,683
Interest 284,485 3,702 288,187
Other 28,462 - 28,462
Prepaids 319,065 - 319,065
Property held for sale 95,475,590 - 95,475,590
Total current assets 245,195,073 3,006,512 248,201,585
Noncurrent assets:
Loans receivable, net 49,574,909 712,204 50,287,113
Capital assets not being depreciated:
Land 4,646,050 - 4,646,050
Capital assets net of accumulated depreciation:
Buildings and improvements 1,407,874 - 1,407,874
Furniture, vehicles and equipment 182,198 - 182,198
Intangible software 2,702,582 - 2,702,582
Total noncurrent assets 58,513,613 712,204 59,225,817
Total assets $ 303,708,686 $ 3,718,716 $ 307,427,402
LIABILITIES
Current liabilities:
Accounts payable $ 1,457,497 $ 1,357 $ 1,458,854
Accrued liabilities 766,364 6,970 773,334
Due to City of Portland 3,256,110 216,942 3,473,052
Due to other entitites 194,750 - 194,750
Long-term liabilities due within one year:
Pollution remediation 112,255 - 112,255
Replacement parking access 59,729 - 59,729
Total long-term liaiblities due within one year 171,984 - 171,984
Total current liabilities 5,846,705 225,269 6,071,974
Noncurrent liabilities:
Long-term liabilities:
Net other post-employment benefits obligation 679,030 - 679,030
Pollution remediation 7,423,164 - 7,423,164
Replacement parking access 268,359 - 268,359
Replacement parking construction 2,847,000 - 2,847,000
Vacation accrual 672,242 - 672,242
Total noncurrent liabilities 11,889,795 - 11,889,795
Total liabilities 17,736,500 225,269 17,961,769
NET ASSETS
Invested in capital assets 8,938,704 - 8,938,704
Restricted for:
Urban renewal 273,210,702 - 273,210,702
Other 6,382,731 - 6,382,731
Unrestricted (2,559,951) 3,493,447 933,496
Total net assets 285,972,186 3,493,447 289,465,633
Total liabilities and net assets $ 303,708,686 $ 3,718,716 $ 307,427,402
The accompanying notes are an integral part of the basic financial statements.
19

PORTLAND DEVELOPMENT COMMISSION
A COMPONENT UNIT OF THE CITY OF PORTLAND, OREGON
STATEMENT OF ACTIVITIES
For the Fiscal Year Ended June 30, 2012
Program Revenues
Charges for Operating
Expenses Services Grants
Functions/Programs
Governmental activities:
Community development $ 99,713,038 $ 3,291,192 $ 7,170,821
Business-type activities:
Enterprise loans 375,805 240,514 200,000
Enterprise management 1,015,468 977,933 -
Total $ 101,104,311 $ 4,509,639 $ 7,370,821
General Revenues:
Tax-increment debt proceeds (in lieu
of tax-increment revenue) -
intergovernmental revenues, unrestricted
Unrestricted investment income
Miscellaneous revenues
Transfers
Total general revenues and transfers
Change in net assets
Net assets - July 1, 2011
Net assets - June 30, 2012
The accompanying notes are an integral part of the basic financial statements.
20

Net Expense and Changes in Net Assets
Governmental Business-type
Activities Activities Total
$ (89,251,025) $ - $ (89,251,025)
- 64,709 64,709
- (37,535) (37,535)
(89,251,025) 27,174 (89,223,851)
133,787,307 - 133,787,307
525,565 7,480 533,045
14,083,247 - 14,083,247
(60,000) 60,000 -
148,336,119 67,480 148,403,599
59,085,094 94,654 59,179,748
226,887,092 3,398,793 230,285,885
$ 285,972,186 $ 3,493,447 $ 289,465,633
21

PORTLAND DEVELOPMENT COMMISSION
A COMPONENT UNIT OF THE CITY OF PORTLAND, OREGON
BALANCE SHEET
GOVERNMENTAL FUNDS
June 30, 2012
General
Fund
ASSETS
Cash and cash equivalents $ 15,500 $ - $ - $ -
Cash with City of Portland
investment pool 3,131,610 14,137 5,549,132 23,682,557
Cash with fiscal agent - - - -
Receivables:
Due from City of Portland 1,414,150 413,757 - -
Accounts 4,048 - - -
Loans, net 701,200 - - 18,213,371
Interest 12,383 - 10,400 22,631
Prepaids 319,065 - - -
Property held for sale 146,754 251,456 9,903,977 16,707,288
Other - - - 1,991
Total assets $ 5,744,710 $ 679,350 $ 15,463,509 $ 58,627,838
LIABILITIES AND FUND BALANCES
Liabilities:
Accounts payable $ 541,247 $ 320,402 $ 72,389 $ 43,403
Accrued liabilities 766,364 - - -
Due to City of Portland 242,336 251,456 94,572 1,238,867
Due to other entities 81,169 - - - Internal balances - 100,000 - -
Total liabilities 1,631,116 671,858 166,961 1,282,270
Fund balances:
Non-spendable
Prepaid expenditures 319,065 - - -
Loans receivable 562,732 - - -
Property held for sale 146,754 - - -
Restricted
Loans receivable - - - 18,213,371
Property held for sale - - 9,903,977 16,707,288
Accounts receivable-others - 7,492 - -
Urban renewal - - 5,392,571 22,424,909
Contractual obligations - - - -
Assigned
Subsequent year's expenditures 2,397,106 - - -
Unassigned
Ending fund balance 687,937 - - -
Total fund balances 4,113,594 7,492 15,296,548 57,345,568
Total liabilities and fund balances $ 5,744,710 $ 679,350 $ 15,463,509 $ 58,627,838
Special
Revenue Funds
The accompanying notes are an integral part of the basic financial statements.
Housing and
Community
Development
Contract Fund
North Macadam
Urban Renewal
Fund
River District
Urban Renewal
Fund
22

Capital Projects Funds
Other Total
Governmental Governmental
Funds Funds
$ - $ - $ - $ - $ 15,500
-
49,431,347 11,813,475 7,412,565 41,720,380 142,755,203
- - - 122,987 122,987
- - - 17,148 1,845,055
- - - 150,655 154,703
9,063,689 1,984,968 6,762,115 16,894,492 53,619,835
51,854 31,374 27,523 127,496 283,661
- - - - 319,065
13,277,714 9,514,330 6,556,640 39,117,431 95,475,590
- - 18,694 7,777 28,462
$ 71,824,604 $ 23,344,147 $ 20,777,537 $ 98,158,366 $ 294,620,061
$ 43,425 $ 252,567 $ 21,526 $ 162,538 $ 1,457,497
- - - - 766,364
509,596 516,770 113,455 289,058 3,256,110
100,000 1,455 6,941 5,185 194,750 - - - - 100,000
653,021 770,792 141,922 456,781 5,774,721
- - - - 319,065
- - - - 562,732
- - - - 146,754
9,063,689 1,984,968 6,762,115 16,894,492 52,918,635
13,277,714 9,514,330 6,556,640 39,117,431 95,077,380
- - - - 7,492
48,830,180 11,074,057 7,316,860 38,900,969 133,939,546
- - - 2,788,693 2,788,693
- - - - 2,397,106
- - - - 687,937
71,171,583 22,573,355 20,635,615 97,701,585 288,845,340
$ 71,824,604 $ 23,344,147 $ 20,777,537 $ 98,158,366 $ 294,620,061
Convention
Center Urban
Renewal Fund
Lents Town
Center Urban
Renewal Fund
Interstate
Corridor Urban
Renewal Fund
23


Fund balances - total governmental funds $ 288,845,340
Amounts reported for governmental activities in the Statement of Net Assets
are different because:
Capital assets used in governmental activities are not financial
resources and, therefore, are not reported in the funds 8,938,704
Net other post-employement benefit obligation
reported on the Balance Sheet (679,030)
Net vacation accrual obligation (672,242)
reported on the Balance Sheet
Pollution remediation liability (7,535,419)
Replacement parking access (328,088)
Replacement parking construction (2,847,000)
The internal service fund is used by management to charge insurance
costs to individual funds. The assets and liabilities of the internal service
fund are included in the governmental activities in the Statement
of Net Assets 249,921
Net assets of governmental activities $ 285,972,186
The accompanying notes are an integral part of the basic financial statements.
TO THE STATEMENT OF NET ASSETS
June 30, 2012
A COMPONENT UNIT OF THE CITY OF PORTLAND, OREGON
RECONCILIATION OF THE GOVERNMENTAL FUNDS BALANCE SHEET
PORTLAND DEVELOPMENT COMMISSION
24

General
Fund
REVENUES
Intergovernmental revenues $ 4,569,139 $ 2,376,034 $ - $ -
Charges for services 12,086 - 362,694 495,613
Loan collections 29,422 - 15,099 77,071
Interest on investments 28,389 189 30,908 41,705
Miscellaneous 410,220 - 4,092,870 1,058,324
Tax-increment debt proceeds
(in lieu of tax-increment revenue) - - 6,328,679 42,300,815
Total revenues 5,049,256 2,376,223 10,830,250 43,973,528
EXPENDITURES
Current:
Community development 3,247,530 333,181 3,159,637 28,636,092
Capital outlay 668,985 - - 1,946,827
Financial assistance 2,081,011 2,035,832 6,230,887 543,126
Total expenditures 5,997,526 2,369,013 9,390,524 31,126,045
Excess (deficiency) of revenues
over (under) expenditures (948,270) 7,210 1,439,726 12,847,483
OTHER FINANCING SOURCES (USES)
Transfers in - - - -
Transfers out (60,000) - - -
Total other financing sources (uses) (60,000) - - -
Net change in fund balances (1,008,270) 7,210 1,439,726 12,847,483
FUND BALANCES - July 1, 2011 5,121,864 282 13,856,822 44,498,085
FUND BALANCES - June 30, 2012 $ 4,113,594 $ 7,492 $ 15,296,548 $ 57,345,568
Special
Revenue Fund
Housing and
Coummunity
Development
Contract Fund
North Macadam
Urban Renewal
Fund
River District
Urban Renewal
District
The accompanying notes are an integral part of the basic financial statements.
For the Fiscal Year Ended June 30, 2012
GOVERNMENTAL FUNDS
PORTLAND DEVELOPMENT COMMISSION
A COMPONENT UNIT OF THE CITY OF PORTLAND, OREGON
STATEMENT OF REVENUES, EXPENDITURES, AND CHANGES IN FUND BALANCES
25

Capital Projects Fund
Other Total
Governmental Governmental
Funds Funds
$ - $ - $ - $ 225,648 $ 7,170,821
116,589 69,577 155,378 446,792 1,658,729
250,558 92,198 163,770 610,115 1,238,233
58,868 69,822 34,896 259,130 523,907
3,927,146 142,299 1,172,314 3,280,074 14,083,247
48,360,212 7,516,135 19,636,706 9,644,760 133,787,307
52,713,373 7,890,031 21,163,064 14,466,519 158,462,244
6,494,081 6,472,825 5,460,943 7,318,073 61,122,362
2,690,005 2,075,408 1,506,376 8,279,216 17,166,817
508,148 1,191,264 3,005,828 1,275,686 16,871,782
9,692,234 9,739,497 9,973,147 16,872,975 95,160,961
43,021,139 (1,849,466) 11,189,917 (2,406,456) 63,301,283
- - - - -
- - - - (60,000)
- - - - (60,000)
43,021,139 (1,849,466) 11,189,917 (2,406,456) 63,241,283
28,150,444 24,422,821 9,445,698 100,108,041 225,604,057
$ 71,171,583 $ 22,573,355 $ 20,635,615 $ 97,701,585 $ 288,845,340
Convention
Center Urban
Renewal Fund
Lents Town
Center Urban
Renewal Fund
Interstate
Corridor Urban
Renewal Fund
26

Amounts reported for governmental activities in the Statement of Activities are
different because:
Net change in fund balances - total governmental funds $ 63,241,283
Governmental funds report capital asset acquisitions as expenditures.
However, in the Statement of Activities the cost of these assets is
allocated over their estimated useful lives and reported as depreciation
expense. This is the amount by which depreciation expense exceeded
capital assets acquisitions.
Expenditures for capital assets $ 2,146,552
Less current year depreciation (165,971)
Loss on sale/disposal of assets net of depreciation (2,644,567) (663,986)
Current year expense for net other post-employment benefits obligation
payable in the Statement of Net Assets (40,759)
Current year expense for the change in vacation accrual (672,242)
Current year revenue for pollution remediation 394,230
Current year expense for parking access (328,088)
Current year expense for replacement parking construction (2,847,000)
The internal service fund is used by management to charge insurance costs
to individual funds. The change in net assets is reported with
governmental activities.
Expenditures for internal services $ (2)
Interest on investment 1,658 1,656
Change in net assets of governmental activities $ 59,085,094
The accompanying notes are an integral part of the basic financial statements.
TO THE STATEMENT OF ACTIVITIES
For the Fiscal Year Ended June 30, 2012
A COMPONENT UNIT OF THE CITY OF PORTLAND, OREGON
RECONCILIATION OF THE STATEMENT OF REVENUES, EXPENDITURES,
AND CHANGES IN FUND BALANCES OF GOVERNMENTAL FUNDS
PORTLAND DEVELOPMENT COMMISSION
27

Budgeted Amounts Variance with
Original Final Actual Final Budget
REVENUES
Intergovernmental revenues-
City of Portland, General Fund $ 5,288,326 $ 5,288,326 $ 4,569,139 $ (719,187)
Charges for services-
Application fees and charges - 3,500 3,107 (393)
Rental income 411,904 411,904 8,979 (402,925)
Loan Collections-
Principal 60,000 115,000 138,468 23,468
Interest 15,000 25,000 29,422 4,422
Interest on investments 5,000 22,373 28,389 6,016
Miscellaneous:
Reimbursements 160,258 177,258 102,727 (74,531)
Private grants and donations - 100,000 101,000 1,000
Other - 70,000 75,234 5,234
Total revenues 5,940,488 6,213,361 5,056,465 (1,156,896)
EXPENDITURES
Current:
Community development:
Business development 5,199,520 5,719,505 4,347,994 1,371,511
Property redevelopment 321,444 892,379 784,270 108,109
Administration 16,187,809 16,040,970 14,794,174 1,246,796
Total community development 21,708,773 22,652,854 19,926,438 2,726,416
Contingency 361,178 1,919,926 - 1,919,926
Total expenditures 22,069,951 24,572,780 19,926,438 4,646,342
Excess (deficiency) of revenues
over expenditures (16,129,463) (18,359,419) (14,869,973) 3,489,446
OTHER FINANCING SOURCES (USES)
Internal service reimbursements 14,318,426 14,438,426 14,318,426 (120,000)
Transfers in-
General Fund - 2,180,713 - (2,180,713)
- 135,000 135,000 -
Total transfers in - 2,315,713 135,000 (2,180,713)
Internal service reimbursements (441,092) (441,092) (441,092) -
Transfers out:
General Fund - (2,180,713) - 2,180,713
Enterprise Loans Fund - (60,000) (60,000) -
Total transfers out - (2,240,713) (60,000) 2,180,713
Total other financing sources (uses) 13,877,334 14,072,334 13,952,334 (120,000)
Net change in fund balance (2,252,129) (4,287,085) (917,639) 3,369,446
FUND BALANCE - July 1, 2011 2,252,129 4,287,085 4,183,279 (103,806)
FUND BALANCE - June 30, 2012 $ - $ - 3,265,640 3,265,640
Adjustments to generally accepted
accounting principles basis-
Loans receivable, net 701,200
Property held for sale 146,754
FUND BALANCE - June 30, 2012 (GAAP BASIS) $ 4,113,594
The accompanying notes are an integral part of the basic financial statements.
PORTLAND DEVELOPMENT COMMISSION
A COMPONENT UNIT OF THE CITY OF PORTLAND, OREGON
GENERAL FUND (adopted as Urban Redevelopment Fund)
STATEMENT OF REVENUES, EXPENDITURES, AND
CHANGES IN FUND BALANCE - BUDGET AND ACTUAL
For the Fiscal Year Ended June 30, 2012
Housing and Community
Development Contract Fund
28

PORTLAND DEVELOPMENT COMMISSION
A COMPONENT UNIT OF THE CITY OF PORTLAND, OREGON
HOUSING AND COMMUNITY DEVELOPMENT CONTRACT FUND
STATEMENT OF REVENUES, EXPENDITURES, AND
CHANGES IN FUND BALANCE - BUDGET AND ACTUAL
For the Fiscal Year Ended June 30, 2012
Budgeted Amounts Variance withOriginal Final Actual Final Budget
REVENUES
Intergovernmental revenue:
Housing and Community
Development contract $ 2,376,034 $ 2,376,034 $ 2,376,034 $ -
Interest on investments - - 189 189
Total revenues 2,376,034 2,376,034 2,376,223 189
EXPENDITURES
Current:
Community development:
Housing - - 141 (141)
Business development 2,002,720 2,178,437 2,171,127 7,310
Administration 175,569 - - -
Total Community development 2,178,289 2,178,437 2,171,268 7,169
Total expenditures 2,178,289 2,178,437 2,171,268 7,169
Excess (deficiency) of revenues
over expenditures 197,745 197,597 204,955 7,358
OTHER FINANCING SOURCES (USES)
Transfers in:
Enterprise Loans Fund - - 100,000 100,000
Total transfers in - - 100,000 100,000
Internal service reimbursements (197,745) (197,745) (197,745) -
Transfers out-
General Fund - (835,000) (835,000) -
Total transfers out - (835,000) (835,000) -
Total other financing sources (uses) (197,745) (1,032,745) (932,745) 100,000
Net change in fund balance - (835,148) (727,790) 107,358
FUND BALANCE - July 1, 2011 - 835,148 835,282 134
FUND BALANCE - June 30, 2012 $ - $ - 107,492 $ 107,492
Adjustments to generally accepted
accounting principles basis:
Interfund advances (100,000)
FUND BALANCE - June 30, 2012 (GAAP BASIS) $ 7,492
The accompanying notes are an integral part of the basic financial statements
29

Governmental
Enterprise Activities -
Enterprise Management Internal
Loans Fund Fund Totals Service Fund
ASSETS
Current assets:
Cash with City of Portland
investment pool $ 2,015,831 $ 183,617 $ 2,199,448 $ 249,097
Receivables:
Accounts 5,907 71,698 77,605 -
Internal balances 100,000 - 100,000 -
Loans, net 625,757 - 625,757 -
Interest 3,198 504 3,702 824
Total current assets 2,750,693 255,819 3,006,512 249,921
Noncurrent assets:
Loans receivable, net 712,204 - 712,204 -
Total noncurrent assets 712,204 - 712,204 -
Total assets $ 3,462,897 $ 255,819 $ 3,718,716 $ 249,921
LIABILITIES AND NET ASSETS
Liabilities:
Current liabilities:
Accounts payable $ 1,357 $ - $ 1,357 $ -
Accrued liability 6,970 - 6,970 -
Due to City of Portland - 216,942 216,942 -
Total current liabilities 8,327 216,942 225,269 -
Total liabilities 8,327 216,942 225,269 -
NET ASSETS
Unrestricted 3,454,570 38,877 3,493,447 249,921
Total net assets 3,454,570 38,877 3,493,447 249,921
Total liabilities and net assets $ 3,462,897 $ 255,819 $ 3,718,716 $ 249,921
PORTLAND DEVELOPMENT COMMISSION
The accompanying notes are an integral part of the basic financial statements.
June 30, 2012
A COMPONENT UNIT OF THE CITY OF PORTLAND, OREGON
STATEMENT OF NET ASSETS
PROPRIETARY FUNDS
Business-type Activities -Enterprise Funds, Non-major
30

Governmental
Enterprise Activities -
Enterprise Management Internal
Loans Fund Fund Totals Service Fund
OPERATING REVENUES:
Charges for services $ 41,812 $ 977,933 $ 1,019,745 $ -
Interest on loans 102,456 - 102,456 -
Miscellaneous revenues 96,246 - 96,246 -
Total operating revenues 240,514 977,933 1,218,447 -
OPERATING EXPENSES:
Personal services 19,732 - 19,732 -
Professional services 15,868 - 15,868 2
Loan document costs 14,532 - 14,532 -
Financial assistance 209,238 - 209,238 - Internal service reimbursements 98,423 - 98,423 -
Miscellaneous expenses 18,012 1,015,468 1,033,480 -
Total operating expenses 375,805 1,015,468 1,391,273 2
Operating income (loss) (135,291) (37,535) (172,826) (2)
NON-OPERATING REVENUES (EXPENSE):
Interest on investments 6,340 1,140 7,480 1,658
Intergovernmental revenues 200,000 - 200,000 -
Total non-operating revenues (expense) 206,340 1,140 207,480 1,658
Income before (loss) transfers 71,049 (36,395) 34,654 1,656
Transfers in 60,000 - 60,000 -
Change in net assets 131,049 (36,395) 94,654 1,656
Net assets - July 1, 2011 3,323,521 75,272 3,398,793 248,265
-
Net assets - June 30, 2012 $ 3,454,570 $ 38,877 $ 3,493,447 $ 249,921
The accompanying notes are an integral part of the basic financial statements.
For the Fiscal Year Ended June 30, 2012
PORTLAND DEVELOPMENT COMMISSION
A COMPONENT UNIT OF THE CITY OF PORTLAND, OREGON
STATEMENT OF REVENUES, EXPENSES, AND CHANGES IN FUND NET ASSETS
PROPRIETARY FUNDS
Business-type Activities -Enterprise Funds, Non-major
31

Governmental
Enterprise Activities-
Enterprise Management Internal
Loans Fund Fund Totals Service Fund
Cash flows from operating activities:
Loan collections from borrowers $ 806,962 $ - $ 806,962 $ -
Interest on loans from borrowers 102,456 - 102,456 -
Loan fees from customers 41,812 - 41,812 -
Rent income - 977,933 977,933 -
Payments to employees (19,732) - (19,732) -
Payments to vendors (336,703) (870,224) (1,206,927) (2)
Payments for interfund services used (98,424) - (98,424) -
Miscellaneous reimbursements 854 - 854 -
Net cash provided(used) by operating activities 497,225 107,709 604,934 (2)
Cash flows from noncapital financing activities:
Operating grant 200,000 - 200,000 -
Collection of interfund loans 625,720 - 625,720 -
Transfers from other funds 4,230,000 - 4,230,000 -
Transfers to other funds (4,170,000) - (4,170,000) -
Net cash provided by noncapital financing activities 885,720 - 885,720 -
Cash flows from investing activities:
Interest received from investing 6,910 2,156 9,066 1,856
1,389,855 109,865 1,499,720 1,854
Cash and cash equivalents-July 1, 2011 625,976 73,752 699,728 247,243
Cash and cash equivalents-June 30, 2012 $ 2,015,831 $ 183,617 $ 2,199,448 $ 249,097
Reconciliation of operating income (loss) to net cash
provided (used) by operating activities:
Net operating (loss) $ (135,291) $ (37,535) $ (172,826) $ (2)
Adjustments to reconcile net operating income (loss) to net cash provided (used) by operating activities:
Increase in due from City of Portland - 216,942 216,942 -
Decrease in loans receivable 640,832 - 640,832 -
(5,907) (71,698) (77,605) -
Decrease in accounts payable (2,409) - (2,409) -
Total adjustments 632,516 145,244 777,760 -
Net cash provided(used) by operating activities $ 497,225 $ 107,709 $ 604,934 $ (2)
The accompanying notes are an integral part of the basic financial statements.
Increase in due from other entities
PORTLAND DEVELOPMENT COMMISSION
A COMPONENT UNIT OF THE CITY OF PORTLAND, OREGON
Business-type Activities - Enterprise Funds, Non-Major
STATEMENT OF CASH FLOWS
PROPRIETARY FUNDS
For The Fiscal Year Ended June 30, 2012
32

Assets
Cash with City of Portland investment pool $ 700
Total assets $ 700
Liabilities
Accounts payable $ 700
June 30, 2012
The accompanying notes are an integral part of the financial statements.
PORTLAND DEVELOPMENT COMMISSION
A COMPONENT UNIT OF THE CITY OF PORTLAND, OREGON
STATEMENT OF FIDUCIARY ASSETS AND LIABILITIES
AGENCY FUND
33

PORTLAND DEVELOPMENT COMMISSION A Component Unit of the City of Portland, Oregon
Notes to the Basic Financial Statements June 30, 2012
I. Summary of Significant Accounting Policies
A. Reporting Entity
The Portland Development Commission (PDC) is the City of Portland’s (the City) urban renewal and
redevelopment agency. The Commission was created in 1958 under Article I, Section 15 of the Charter
of the City of Portland, Oregon to deliver projects and programs to achieve the City’s housing,
economic development and redevelopment priorities and to link citizens to jobs. PDC is governed by a
five-member Commission, appointed by the Mayor and approved by the City Council to serve a three-
year term.
PDC is a component unit of the City and its financial activities are discretely presented in a separate
column in the City’s basic financial statements.
B. Government-wide and Fund Financial Statements
The government-wide financial statements (i.e., the Statement of Net Assets and the Statement of
Activities) report information on all of the non-fiduciary activities of PDC. Governmental activities, which
normally are supported by tax-increment revenues and intergovernmental revenues, are reported
separately from business-type activities, which rely to a significant extent on fees and charges for
support.
The Statement of Activities demonstrates the degree to which the direct expenses of a given function
are offset by program revenues. Direct expenses are those that are clearly identifiable with a specific
function. Program revenues include 1) charges to customers or applicants who use or directly benefit
from services or privileges provided by the given function, and 2) grants and contributions that are
restricted to meeting the operational requirements of a particular function. Tax-increment debt
proceeds (in lieu of tax-increment revenue) and other items not properly included among program
revenues are reported as general revenues.
Separate financial statements are provided for governmental funds, proprietary funds, and fiduciary
(agency) funds, even though the latter are excluded from the government-wide financial statements.
Major individual governmental funds and the proprietary funds are reported as separate columns in the
fund financial statements. Non-major governmental funds are consolidated into a single column in the
basic financial statements. Combining schedules of the components of the Enterprise Loans Fund and
the non-major governmental funds are presented in the supplementary data section of the report.
C. Measurement Focus, Basis of Accounting, and Financial Statement Presentation
The government-wide financial statements are reported using the economic resources measurement
focus and the accrual basis of accounting, as are the proprietary fund financial statements. Revenues
are recorded when earned and expenses are recorded when a liability is incurred, regardless of the
timing of related cash flows. Grants and similar items are recognized as revenue as soon as all
eligibility requirements imposed by the provider have been met.
34

PORTLAND DEVELOPMENT COMMISSION A Component Unit of the City of Portland, Oregon
Notes to the Basic Financial Statements, Continued June 30, 2012
Governmental fund financial statements are reported using the current financial resources
measurement focus and the modified accrual basis of accounting. Revenues are recognized as soon
as they are both measurable and available. Revenues are considered to be available when they are
collectible within the current period or soon enough thereafter to pay liabilities of the current period. For
this purpose, PDC considers receivables collected within 60 days after year-end to be available and
recognizes them as revenues of the current year. Expenditures generally are recorded when a liability
is incurred, as under accrual accounting. However, debt service expenditures, as well as expenditures
related to compensated absences, are recorded only when payment is due.
Significant revenues which were measurable and available under the modified accrual basis are
comprised of certain intergovernmental revenues consisting primarily of grant proceeds and tax-
increment debt proceeds (in lieu of tax-increment revenue).
Loans Receivable and Property Held for Sale are treated as financial resources, an activity that does
not result from revenue transactions. No expenditure is recognized when property is purchased or a
loan is issued, and income is only recognized for the interest portion of loan collections and any
proceeds for property sales in excess of the property's cost basis. Expenditures are recognized if a
loan is discounted, or an allowance is recorded. Loans receivable and properties held for sale are
itemized as part of fund balance according to level of constraint of the fund.
PDC reports the following major governmental funds:
General Fund (adopted as Urban Redevelopment Fund) – this is PDC’s primary operating fund. It
accounts for the financial operations not accounted for in any other fund and for indirect administrative
costs. Principal resources are reimbursement for services to other funds, contract fees for services
provided to other agencies, miscellaneous grants, donations and interest earnings. Primary
expenditures are for personal services, operational supplies, and capital outlay.
Housing and Community Development Contract Fund – accounts for the contract with the City of
Portland Housing Bureau to administer a portion of the City’s Community Development Block Grant
Economic Opportunity Initiative programs.
North Macadam Urban Renewal Fund – accounts for resources used in the redevelopment of
the district into a major mixed-use Central City neighborhood, with a spectacular greenway
and parks system, with improved transportation infrastructure and accessibility, enhanced
public amenities and uses.
River District Urban Renewal Fund – accounts for resources used in the development and
construction of a wide range of housing units, new commercial opportunities and open space,
all oriented to the Willamette River.
Convention Center Urban Renewal Fund - accounts for resources used to develop a plan for
the area surrounding the Oregon Convention Center that will best support Convention Center
business, enhance area recreational and entertainment facilities, strengthen ties to downtown
35

PORTLAND DEVELOPMENT COMMISSION A Component Unit of the City of Portland, Oregon
Notes to the Basic Financial Statements, Continued June 30, 2012
Portland, and ensure the area’s compatibility with nearby neighborhoods and to develop the
Eastbank Riverfront park.
Lents Town Center Urban Renewal Fund – accounts for resources used in the revitalization of
commercial and residential areas in and near the existing Lents neighborhood.
Interstate Corridor Urban Renewal Fund – accounts for resources used in the construction
and preservation of a wide array of housing options, new family-wage jobs, and the
infrastructure investment to support these efforts.
PDC reports the following non-major proprietary funds:
Enterprise Loans Fund - this enterprise fund accounts for the activities of PDC’s various loan
programs.
Enterprise Management Fund – this enterprise fund provides for the activity related to the operation
and maintenance of PDC properties or City of Portland properties PDC has contracted to manage
outside Urban Renewal Areas. Currently, this fund includes operating revenues and expenses of the
Headwaters Apartments.
Risk Management Fund – the Internal Service Fund sets aside resources to meet the insurance policy
deductibles, if necessary.
Additionally, PDC reports the following fund type:
Fiduciary (Agency) Funds – accounts for contract retainage and accumulated interest held by PDC in a
fiduciary capacity. Agency funds do not have a measurement focus, but do use the accrual basis of
accounting.
Private-sector standards of accounting and financial reporting issued prior to December 1, 1989,
generally are followed in both the government-wide and proprietary fund financial statements to the
extent that those standards do not conflict with or contradict guidance of the Government Accounting
Standards Board (GASB). Governments also have the option of following subsequent private-sector
guidance for their business-type activities and enterprise funds, subject to this same limitation. PDC
has elected not to follow subsequent private-sector guidance.
As a general rule the effect of interfund activity has been eliminated from the government-wide financial
statements. Exceptions to this general rule are overhead charges allocated by the General Fund to the
Enterprise Loans Fund in the amount of $98,423. Eliminations of these charges would distort the direct
costs reported for the various programs concerned.
Amounts reported as program revenues include 1) charges to customers or applicants for services or
privileges provided, 2) operating grants and contributions. All other revenues are considered general
revenues.
36

PORTLAND DEVELOPMENT COMMISSION A Component Unit of the City of Portland, Oregon
Notes to the Basic Financial Statements, Continued June 30, 2012
Proprietary funds distinguish operating revenues and expenses from non-operating items. Operating
revenues and expenses generally result from providing services in connection with ongoing operations.
The principal operating revenues of the Enterprise Loans Fund are interest on loans and charges for
loan fees. Operating expenses include the administrative and interest expense on borrowings. All
revenues and expenses not meeting this definition are reported as non-operating revenues and
expenses.
When both restricted and unrestricted resources are available to use for the same purpose, it is PDC’s
policy to use restricted resources first, then unrestricted resources as they are needed.
D. Assets, Liabilities, and Net Assets or Equity
1. Cash and Investments
The Portland Development Commission’s cash and cash equivalents are considered to be cash on
hand, demand deposits, and short-term investments with original maturities of three months or less
from the date of acquisition.
The City Charter requires PDC to participate in the City’s cash and investment pool. Each fund’s
portion of this pool is displayed on the Balance Sheet and the Statement of Net Assets as "Cash with
City of Portland Investment Pool".
Investment pool cash balances are part of the City’s cash management activity and are considered
cash and cash equivalents. Activities undertaken by the investment pool on behalf of the proprietary
funds are not considered as part of the investing and financing activities of the funds, and details of
these investments are not reported in the Statement of Cash Flows. In general, interest earned from
pooled investments is allocated to each City fund, including PDC which appears as a single cash
account, based on average earnings rate and daily cash balance of each fund. PDC allocates and
credits interest received from the City to each individual fund based on the monthly ending cash
balance.
The types of investments in which the City may invest are restricted by State of Oregon statutes and a
Council adopted investment policy. Authorized investments include general obligations of the United
States Government and its agencies, obligations of the States of Oregon, California, Idaho and
Washington that have a rating of AA or better, A-1 rated commercial paper and banker’s acceptances,
Aa rated corporate bonds, time deposits, repurchase agreements and the State of Oregon Local
Government Investment Pool.
PDC recorded its investment in the City of Portland Investment Pool at fair value.
2. Receivables and Payables
Activities between funds that represent lending/borrowing arrangements outstanding at the end of the
fiscal year are referred to as internal balances. Reimbursements due from other governmental entities
for the CDBG Economic Opportunity Initiative (CDBG-EOI) programs are reported as accounts
receivable.
37

PORTLAND DEVELOPMENT COMMISSION A Component Unit of the City of Portland, Oregon
Notes to the Basic Financial Statements, Continued June 30, 2012
Loans receivable are recorded when the borrower has signed a promissory note and disbursements
are made in accordance with the loan agreement. In the Housing and Community Development Fund
there is one remaining economic development property which was purchased with CDBG funds in a
prior year and is offset by a Due to the City of Portland, the original provider of the funds.
PDC maintains a valuation allowance for loans receivable comprised of an allowance for risk and an
allowance for present value discount. The allowance for risk is determined based on the historical
performance of each loan type and upon continuing consideration of changes in the character of the
portfolio. The allowance for the present value discount represents an estimate of the difference
between the present value of discounted net cash flows using the weighted average interest rate for
the program within which a given loan belongs.
3. Prepaid Items
Certain payments to vendors reflect costs applicable to future accounting periods and are recorded as
prepaid items both in the government-wide and fund financial statements. The cost of prepaid items is
recorded as expenditures/expenses when consumed rather than when purchased.
4. Capital Assets
Capital assets include property, buildings, equipment, and software. Capital assets are defined as
assets with an initial, individual cost of more than $5,000 and an estimated useful life of greater than
one year. Additions or improvements that significantly extend the useful life of an asset, or that
significantly increase the capacity of an asset are capitalized. Expenditures for furniture and equipment
and real property acquisitions and improvements are stated as capital outlay expenditures in the
governmental funds. Capital assets, which are acquired and held for internal use, are stated at
historical cost, and include the costs of appraisals and demolition. Donated capital assets are recorded
at their fair market value at the date of donation.
Costs incurred for the acquisition and improvements of properties, as an agent for the owner, are not
capitalized. Maintenance and repairs of a routine nature are charged to expenditures/expenses as
incurred and are not capitalized.
Depreciation and amortization on capital assets is recorded in the Statement of Activities and is
calculated using a modified half-year convention method on a straight-line basis over the following
estimated useful lives.
Asset Years
Buildings and improvements 50
Leasehold improvements 6
Vehicles 8
Equipment 5-15
Computer software 10
Computer equipment 5
38

PORTLAND DEVELOPMENT COMMISSION A Component Unit of the City of Portland, Oregon
Notes to the Basic Financial Statements, Continued June 30, 2012
Generally, when construction projects are completed on behalf of the City of Portland, the project's
capital assets are transferred to the City at cost. Proceeds from sale of capital assets originally
purchased with grant resources are reported as due to City of Portland until recycled through the grant
program. All other proceeds from the sale of capital assets are recognized as revenue.
5. Property Held for Sale
Land and related buildings and improvements acquired for the purpose of redevelopment and sale are
recognized as assets and stated at the lower of cost (including costs of appraisal, demolition, and
relocation) or net realizable value and are offset by non-spendable or restricted fund balance
depending on the fund classification, except for those acquired with grant proceeds. Property held for
sale acquired with grant resources are offset by an amount Due to the City of Portland until cycled
through the grant program. Upon final disposition or a decline in the value of the property, gain or loss
is charged or credited to operations.
6. Compensated Absences
It is PDC’s policy to permit employees to accumulate earned but unused vacation and sick pay
benefits. There is no liability for unpaid accumulated sick leave since PDC does not have a policy to
pay any amounts when employees separate from service. All vacation pay is accrued when incurred in
the government-wide and proprietary fund financial statements. A liability for these amounts is reported
in governmental funds only if they have matured, for example, as a result of employee resignations and
retirements.
7. Long-term Obligations
Long-term bonded debt issued to finance urban development activities is not reported in the financial
statements, but is reported in the City of Portland’s financial statements since the debt is the obligation
of the City.
8. Fund Equity and Net Assets
PDC's equity is classified as follows in the government wide and proprietary fund financial statements:
Invested in capital assets. This represents PDC's total investment in capital assets, net of outstanding
debt obligations related to those capital assets.
Restricted. This represents net assets that are limited in their use by external third parties, laws or
regulations of other governments, or imposed by legislation.
Unrestricted. This represents net assets not included in other categories.
PDC's fund balance is classified as follows in the governmental fund financial statements
Non-spendable. This includes the portion of fund balance that are not in a spendable form such as
prepaids or others such as long term loans receivable, properties held for sale, prepaid expenses.
39

PORTLAND DEVELOPMENT COMMISSION A Component Unit of the City of Portland, Oregon
Notes to the Basic Financial Statements, Continued June 30, 2012
Restricted. The restriction is imposed by a third party such as creditors or regulators or enabling
legislation.
Committed. This represents resources committed by PDC’s commission. Resolutions passed by the
PDC Board of Commissioners is required to commit or release funds at this level.
Assigned. This represents resources designated by Chief Financial Officer acting in the designated
authority with the power to make the assignment as designated by the Board in adopting the
implementation of GASB 54.
Unassigned. Residual amount that is not restricted, committed, or assigned in the General Fund and
any negative amount in other funds created by expenditures exceeding restricted, committed, or
assigned resources.
PDC will spend resources in the following order as appropriate for the specific expenditures when more
than one category of fund balance exists: Restricted, Committed, Assigned, and Unassigned. Any
exceptions to this spending order must be approved by the Board of Commissioners.
9. Management Estimates
The preparation of financial statements requires management to make estimates and assumptions that
affect the reported amounts of assets and liabilities, disclosure of contingent assets and liabilities as of
June 30, 2012, and the reported amounts of revenues, expenditures, and expenses for the year then
ended. Actual results could differ from those estimates.
10. New Accounting Pronouncements
In fiscal year 2013 PDC will be subject to GASB Statement No. 60. Accounting and Financial Reporting
for Services Concession Arrangements. The objective of this statement is to improve the financial
reporting of service concession arrangements (SCAs), which are a type of public-private or public-
public partnership. As used in this Statement, an SCA is an arrangement between a transferor (a
government) and an operator (governmental or nongovernmental entity) in which (1) the transferor
conveys to an operator the right and related obligation to provide services through the use of
infrastructure or another public asset (a "facility") in exchange for significant consideration and (2) the
operator collects and is compensated by fees from third parties. PDC, at present, has no SCA
agreements.
Statement No. 61. The Financial Reporting Entity: Omnibus an amendment of GASB Statements No.
14 and No. 34 also becomes effective in fiscal year 2013. The objective of this statement is to improve
financial reporting for a governmental entity and amends the criteria for reporting component units as if
they were part of the primary government (that is, blending) in certain circumstances. New criteria are
also added to require blending of component units whose total debt outstanding is expected to be
repaid entirely or almost entirely with resources of the primary government. The blending provisions
are amended to clarify that funds of a blended component unit have the same financial reporting
40

PORTLAND DEVELOPMENT COMMISSION A Component Unit of the City of Portland, Oregon
Notes to the Basic Financial Statements, Continued June 30, 2012
requirements as a funds of the primary government. The reporting of PDC as a component unit in the
city of Portland’s CAFR will not be affected by this statement.
Statement No. 62, Codification of Accounting and Financial Reporting Guidance Contained in Pre-
November 30, 1989 FASB and AICPA Pronouncements. The Statement is intended to incorporate
guidance previously found in certain Financial Accounting Standards Board (FASB) and American
Institute of Certified Public Accountants (AICPA) pronouncements. These standards have already
been applied where applicable to PDCs CAFR.
Statement No. 63 Financial Reporting of Deferred Outflows of Resources, Deferred Inflows of
Resources, and Net Position provides financial reporting guidance incorporating deferred outflows and
deferred inflows as well as renaming the residual measure as net position rather than net assets, this
statement becomes effective fiscal year 2013.
Statement No. 64 Derivative Instruments: Application of Hedge Accounting Termination Provisions is
effective this fiscal year. PDC does not handle investment of the Commissions cash it is handled by the
city of Portland’s treasury office. Investment hedging may be affected and information related to such
transactions will be relayed from the city. Relevant information related to hedging of any of the
Commission’s cash may flow through to the Commission’s statements.
Statement No. 65 Items Previously Reported as Assets and Liabilities issued in March 2012 and
becomes effective for fiscal year 2014 will reclassify some items that were previously reported as either
assets or liabilities. PDC will implement this in fiscal year 2014.
II. Stewardship, Compliance, and Accountability
A. Budgetary Information
PDC is required by Oregon Local Budget Law to budget all funds except the Agency Funds. All funds,
except the Agency Funds, are budgeted on the modified accrual basis of accounting. The resolution
authorizing appropriations sets the maximum level of expenditures for each fund. The original budget is
adopted by the Commission by resolution prior to the beginning of the fiscal year (July 1 through
June 30). The amount reported as “fund balance” on the General Fund budgetary basis of accounting
derives from the basis of accounting used in preparing PDC’s budget. This amount differs from the
fund balance reported in the statement of revenues, expenditures, and changes in fund balances
because of the cumulative effect of the transactions in the table below.
41

PORTLAND DEVELOPMENT COMMISSION A Component Unit of the City of Portland, Oregon
Notes to the Basic Financial Statements, Continued June 30, 2012
Revenues—budgetary basis 5,056,465$
Loans receivable revenues (138,468)
Internal service reimbursement 98,423
Allowance for loans receivable 32,836
Revenues—GAAP basis 5,049,256$
Expenditures—budgetary basis 19,926,438$
internal service reimbursment (14,220,004)
Book new loans receivable (150,000)
Reclass indirect charges 441,092
Expenditures—GAAP basis 5,997,526$
Appropriations are made by organizational unit or programs; appropriating the expenditure budget by
business line. Expenditure detail is also provided by the following categories: Personal Services,
Materials and Services, Capital Outlay, Financial Assistance, Debt Service, and other levels of control
established by the resolution. Unexpected additional resources may be added to the budget through
the use of a supplemental budget. A supplemental budget may require hearings before the public and
publications in newspapers, but always requires approval by the Commission. Original and
supplemental budgets may be modified by the use of appropriation transfers between the levels of
control. Such transfers require approval by the Commission. The Commission approved three
supplemental budgets during the fiscal year. Appropriations lapse at each fiscal year-end.
B. Excess of Expenditures over Appropriations
For the fiscal year ended June 30, 2012, the following funds and programs had expenditures in excess
of appropriations:
Fund Program Excess
Housing and Community Development Contract Housing 141$
Home Grant Housing 114
Enterprise Loans Housing 32,359
III. Detailed Notes on All Funds
A. Cash and Cash Equivalents and Cash with City of Portland Investment Pool
The City maintains a cash and investment pool that is available for use by all funds including its
component units. Cash and investments are presented on the balance sheet in the basic financial
statements at fair value in accordance with GASB Statement No. 31.
All investment pool cash purchases and sales are part of the City’s cash management activity and
considered cash and cash equivalents. Activities undertaken by the pool on behalf of the proprietary
funds are not part of operating, capital, investing, or financing activities of the proprietary funds, and
details of these transactions are not reported in the Statement of Cash Flows. In general, interest
42

PORTLAND DEVELOPMENT COMMISSION A Component Unit of the City of Portland, Oregon
Notes to the Basic Financial Statements, Continued June 30, 2012
earned from pooled investments is allocated to each fund based on the average earnings rate and
daily cash balance of each fund.
Oregon Revised Statutes (ORS) 294, authorizes the City and component units to invest primarily in
general obligations of the U.S. Government and its agencies, certain bonded obligations of Oregon
municipalities, bank repurchase agreements, bankers’ acceptances, high-grade commercial paper,
high-grade corporate bonds and the State Treasurer’s Local Government Investment Pool (LGIP).
PDC’s cash balance as of June 30 is comprised of the following:
Cash on hand 500$
Deposits with financial institutions 137,987
Cash with City of Portland investment pool 145,204,448
145,342,935$
The balance is reflected in the Statement of Net Assets and Statement of Fiduciary Assets and
Liabilities as follows:
Governmental
Activities
Business-
Type
Activities
Fiduciary
Activities Total
Cash and cash equivalents 15,500$ -$ -$ 15,500$
Cash with City of Portland investment pool 143,004,300 2,199,448 700 145,204,448
Cash with fiscal agent 122,987 - - 122,987
143,142,787$ 2,199,448$ 700$ 145,342,935$
The cash with fiscal agent is an account in Wells Fargo Bank created to comply with the Economic
Development Administration’s (EDA) requirement to sequester excess program cash.
Custodial credit risk—deposits
In the case of deposits, this is the risk that in the event of a bank failure, the City’s deposits may not be
returned to it. The City’s deposit policy is in accordance with ORS 295. All deposits are collateralized
with eligible securities in amounts determined by the Office of the State Treasurer (OST). The City’s
deposit policy requires that all deposits are covered by the Federal Deposit Insurance Corporation
(FDIC), and/or are collateralized as required by and in compliance with ORS 295.
The FDIC’s standard insurance amount is $250,000 per depositor, per insured bank, for each account
ownership category. From December 31, 2010 through December 31, 2012, at all FDIC-insured
institutions, deposits held in noninterest-bearing transaction accounts will be fully insured regardless of
the amount in the account. Public Money Market Deposit Accounts (PMMDAs) and Negotiable Order
of Withdrawal (NOW) accounts are not eligible for this temporary unlimited insurance coverage,
regardless of the interest rate, even if no interest is paid
43

PORTLAND DEVELOPMENT COMMISSION A Component Unit of the City of Portland, Oregon
Notes to the Basic Financial Statements, Continued June 30, 2012
The OST’s custodian, Federal Home Loan Bank of Seattle, is the agent of the depository bank. The
securities pledged are designated as subject to the Pledge Agreement between the Depository Bank,
Custodian Bank and Office of the State Treasurer (OST) and are held for the benefit of OST on behalf
of the public depositors.
PDC bank deposits of $137,987 at Wells Fargo Bank are 100% insured by the FDIC.
Interest Rate Risk
Interest rate risk is the risk that changes in interest rates will adversely affect the fair value of an
investment.
As of June 30, 2012, the weighted average maturity of the City’s investment portfolio was 349 days. To
minimize interest rate risk, the City’s investment policy limits the portfolio to a maximum weighted
average maturity of eighteen months. In addition, no more than 50% of the projected lowest cash
balance may be invested in securities with a maturity range beyond two years. All other funds must be
invested in less than three-year maturities and must meet the City’s cash flow requirements.
Investments with maturities greater than three years may be purchased only with the approval of the
IAC.
Credit Risk
Credit risk is the financial risk of not receiving principal and interest when due from an issuer. The types
of investments permitted by the Investment Policy seeks to minimize this risk by the conservative
nature of the permissible investments and by establishing safe limits on the level of investments with
Oregon financial institutions and issuers of commercial paper, corporate debt, and monitoring their
credit quality on an ongoing basis. A portfolio policy stressing a relatively short maturity and highly
rated investment grade debt serves to additionally minimize credit risk.
The City’s investments in United States Treasury and Agency Obligations have short-term credit
ratings of P-1 / A-1+ / F1+, by Moody’s Investor Services, Standard & Poor’s, and Fitch Ratings
respectively. The City’s investments in United States Treasury and Agency Obligations have long-term
credit ratings of Aaa / AA+ / AAA, by Moody’s Investor Services, Standard & Poor’s, and Fitch Ratings
respectively. The City’s investments in Corporate Debt Obligations have short-term or long-term credit
ratings of Aa3 / AA- / AA- or better, by Moody’s Investor Services, Standard & Poor’s, and Fitch
Ratings respectively. The City’s investments in Municipal Debt Obligations have short-term credit
ratings of A-1 / SP-1 / F1 or better, by Moody’s Investor Services, Standard & Poor’s, and Fitch Ratings
respectively.
As of June 30, 2012, the LGIP was not rated.
Concentration of Credit Risk
Of the City’s total investments as of June 30, 2012, 71% percent were United States Agency Debt
Obligations or short-term investments. All other investments not explicitly guaranteed by the United
44

PORTLAND DEVELOPMENT COMMISSION A Component Unit of the City of Portland, Oregon
Notes to the Basic Financial Statements, Continued June 30, 2012
States Government were less than five percent (per issuer basis) of the City’s total investments. The
City’s investment policy addresses credit risk concentration by limiting both the types and amounts of
securities that may be held in the portfolio. These portfolio restrictions vary based upon the investment
type and issuer. These restrictions as well as other information contained in the City’s investment policy
are located at:
http://www.portlandonline.com/auditor/index.cfm?c=47787&a=200869.
Custodial credit risk–investments
For an investment, this is the risk that, in the event of failure of the counterparty, the City will not be
able to recover the value of its investments or collateral securities that are in the possession of an
outside party. All trades are executed by delivery vs. payment (DVP) to ensure that securities are
deposited in an eligible financial institution prior to the release of funds. The City’s investment policy
complies with ORS 294.035 and ORS 294.810 that lists acceptable investments. As of June 30, 2012,
the City had no investments that were held by either counterparty or the counterparty’s trust
department agent. Therefore, the City has no outstanding investments that were exposed to custodial
credit risk.
B. Internal Balances and Transfers
The composition of internal balances is as follows:
Payable Fund
Enterprise Loans
Fund Total
Liabilities
Housing and Community Development Contract Fund 100,000$ 100,000$
Governmental Fund Liabilities 100,000$
Receivable Fund
As of June 30, 2012, the Housing and Community Development Fund owes the Enterprise Loans
Fund $100,000 for short-term Interfund loans for grant expenditures not yet reimbursed by the City of
Portland and are repaid in the next accounting period.
Interfund transfers made during the year are outlined below.
Transfer In Fund
Transfer out fund
Enterprise
Loans Fund Total
General Fund 60,000$ 60,000$
The General Fund transferred $60,000 in additional resources for the support of business finance of
revolving loan funds.
45

PORTLAND DEVELOPMENT COMMISSION A Component Unit of the City of Portland, Oregon
Notes to the Basic Financial Statements, Continued June 30, 2012
C. Loans Receivable
Loans receivable are comprised of loans to qualified borrowers for rehabilitation and redevelopment of
commercial properties and commercial loans to small business to promote economic development,
which are collateralized by personal property. Net loans receivable are as follows:
Gross Allowance
Maximum Interest Loans And
Term Rate Receivable Discount
Major Funds:
General Fund:
Urban Development:
Amortized loans 10 yrs 4% $ 779,037 $ 98,970
Deferred payment loans 10 yrs 4% 49,801 28,668
828,838 127,638
701,200
River District Urban Renewal Fund:
Urban Development:
Amortized loans 20 yrs 0% to 9% 13,848,697 3,833,944
Deferred payment loans 15 yrs 0% to 5% 18,571,447 10,372,829
Total Gross River District Urban Renewal Fund 32,420,144 14,206,773
Total Net River District Urban Renewal Fund 18,213,371
Convention Center Urban Renewal Fund:
Urban Development:
Deferred payment loans 20 yrs 0% to 3% 7,276,896 4,539,939
Amortized loans 30 yrs 1% to 7% 7,564,430 1,298,501
Cash flow loans 43 yrs 1% to 9% 2,960,655 2,899,852
Total Gross Convention Center Urban Renewal Fund 17,801,981 8,738,292
`Total Net Convention Center Urban Renewal Fund 9,063,689
Lents Town Center Urban Renewal Fund:
Urban Development:
Deferred payment loans 30 yrs 0% to 3% 1,309,420 773,711
Amortized loans 26 yrs 1% to 5% 2,179,569 730,310
Total Gross Lents Town Center Urban Renewal Fund 3,488,989 1,504,021
Total Net Lents Town Center Urban Renewal Fund 1,984,968
Interstate Corridor Urban Renewal Fund:
Urban Development:
Amortized loans 20 yrs 0% to 9% 4,200,382 530,566
Deferred payment loans 20 yrs 0% to 2% 6,412,185 3,319,886
Total Gross Interstate Corridor Urban Renewal Fund 10,612,567 3,850,452
Total Net Interstate Corridor Urban Renewal Fund 6,762,115
Total Gross Major Funds 65,152,519 28,427,176
Total Net Major Funds 36,725,343
Fund and Program
Total Gross General Fund
Total Net General Fund
46

PORTLAND DEVELOPMENT COMMISSION A Component Unit of the City of Portland, Oregon
Notes to the Basic Financial Statements, Continued June 30, 2012
Gross Allowance
Maximum Interest Loans And
Term Rate Receivable Discount
Other Governmental Funds:
Other Federal Grants Fund (EDA):
Urban Development:
Amortized Loans 20 yrs 3% to 8% 1,360,789 171,349
Total Gross Other Federal Grants Fund 1,360,789 171,349
Total Net Other Federal Grants Fund 1,189,440
Downtown Waterfront Urban Renewal Fund:
Urban Development:
Amortized loans 20 yrs 1% to 5% 4,907,895 622,199
Deferred payment loans 20 yrs 0% to 3% 5,605,475 3,202,800
Total Gross Downtown Waterfront Urban Renewal Fund 10,513,370 3,824,999
Total Net Downtown Waterfront Urban Renewal Fund 6,688,371
South Park Blocks Urban Renewal Fund:
Urban Development:
Deferred payment loans 20 yrs 0% to 2% 7,800 3,900
Amortized loans 28 yrs 1% to 5% 2,284,658 250,086
Total Gross South Park Blocks Urban Renewal Fund 2,292,458 253,986
Total Net South Park Blocks Urban Renewal Fund 2,038,472
Central Eastside Urban Renewal Fund:
Urban Development:
Cash flow loans 28 yrs 4% 1,180,754 1,144,048
Amortized loans 20 yrs 0% to 9% 3,731,735 822,501
Deferred payment loans 20 yrs 4% 889,069 457,230
Total Gross Central Eastside Urban Renewal Fund 5,801,558 2,423,779
Total Net Central Eastside Urban Renewal Fund 3,377,779
Gateway Regional Center Urban Renewal Fund:
Urban Development:
Amortized loans 20 yrs 1% to 3% 241,595 30,975
Total Gross Gateway Regional Center Urban Renewal Fund 241,595 30,975
Total Net Gateway Regional Center Urban Renewal Fund 210,620
Fund and Program
47

PORTLAND DEVELOPMENT COMMISSION A Component Unit of the City of Portland, Oregon
Notes to the Basic Financial Statements, Continued June 30, 2012
Gross Allowance
Maximum Interest Loans And
Term Rate Receivable Discount
Airport Way Urban Renewal Fund:
Urban Development:
Amortized loans 20 yrs 2% to 9% 3,629,386 569,639
Deferred payment loans 20 yrs 2% to 9% 1,041,237 711,174
Total Gross Airport Way Urban Renewal Fund 4,670,623 1,280,813
Total Net Airport Way Urban Renewal Fund 3,389,810
Total Gross Other Governmental Funds 24,880,393 7,985,901
Total Net Other Governmental Funds 16,894,492
Total Gross Governmental Funds 90,032,912 36,413,077
Total Net Governmental Funds 53,619,835
Business-Type Funds:
Enterprise Loans Fund:
Urban Development:
Amortized loans 15 yrs 1% to 7% 1,491,253 153,292
Total Gross Enterprise Loans Fund 1,491,253 153,292
Total Net Enterprise Loans Fund 1,337,961
Total Gross All Funds $ 91,524,165 36,566,369
Total Net All Funds $ 54,957,796
Fund and Program
The combined loan portfolio is composed of the following:
Current Year Gross Allowance
Organizational Unit Gross Loan Loans And
and Program Percentages Receivable Discount
Urban Development:
Amortized loans 50.50% $ 46,219,426 9,112,332
Cash flow loans 4.52% 4,141,409 4,043,900
Deferred payment loans 44.98% 41,163,330 23,410,137
Urban development totals 100.00% 91,524,165 36,566,369
Total Gross Loans 100% $ 91,524,165 36,566,369
Total Net Loans $ 54,957,796
Summary Loans Receivable Aging:
Current loans receivable, net $ 4,670,683
Noncurrent loans receivable, net 50,287,113
Total Net Loans $ 54,957,796
48

PORTLAND DEVELOPMENT COMMISSION A Component Unit of the City of Portland, Oregon
Notes to the Basic Financial Statements, Continued June 30, 2012
The Loan Loss Allowance is comprised of both an interest discount factor and a loan loss risk factor.
The total allowance at June 30, 2012 is broken down as follows:
Interest Discount Factor 9,539,389$
Loan Loss Risk Factor 27,026,979
Total Allowance and Discount 36,566,368$
D. Restricted Net Assets
Restricted net assets consist of net assets with constraints placed on the use either by external parties
such as creditors, grantors, and contributors, or laws and regulations of other governments, or legally
restricted through provisions or enabling legislation. As summarized below, the government-wide
statement of net assets report $279,593,433 of restricted net assets.
Restricted by:
Enabling legislation:
Urban renewal 273,210,702$
Contributors:
Public-private partnership agreement 6,382,731
279,593,433$
E. Property Held for Sale
Property held for sale consists of real property PDC intends to sell to appropriate developers or
homeowners. The carrying amount of the property is stated at the lower of cost or net realizable value.
The carrying value of the property is as follows:
General Fund 146,754$
Housing and Community Development Contract Fund 251,456
North Macadam Urban Renewal Fund 9,903,977
River District Urban Renewal Fund 16,707,288
Convention Center Urban Renewal Fund 13,277,714
Lents Town Center Urban Renewal Fund 9,514,330
Interstate Corridor Urban Renewal Fund 6,556,640
Other Governmental Funds 39,117,431
Total Governmental Funds 95,475,590$
49

PORTLAND DEVELOPMENT COMMISSION A Component Unit of the City of Portland, Oregon
Notes to the Basic Financial Statements, Continued June 30, 2012
F. Capital Assets
PDCs capital assets are all used in community development and are composed of the following:
Beginning
Balance Increases Decreases Transfers
Ending
Balance
Capital assets, not being depreciated:
Land 6,101,427$ 10,813$ (1,466,190)$ -$ 4,646,050$
Work in progress 854,362 - (854,362) - -
Capital assets, being depreciated:
Buildings and improvements 2,707,441 - - - 2,707,441
Leasehold improvements 3,849,501 - - - 3,849,501
Vehicles and equipment 2,151,111 60,172 - (1,141,736) 1,069,547
Intangible software 930,394 2,075,567 (1,429,332) 1,125,953 2,702,582
Total capital assets being depreciated 9,638,447 2,135,739 (1,429,332) (15,783) 10,329,071
Less accumulated depreciation for:
Buildings and improvements (1,245,419) (54,148) - - (1,299,567)
Leasehold improvements (3,849,324) (177) - - (3,849,501)
Vehicles and equipment (1,896,803) (111,646) 1,105,317 15,783 (887,349)
Total accumulated depreciation (6,991,546) (165,971) 1,105,317 15,783 (6,036,417)
Total capital assets, being depreciated, net 2,646,901 1,969,768 (324,015) - 4,292,654
Governmental activities capital assets, net 9,602,690$ 1,980,581$ (2,644,567)$ -$ 8,938,704$
G. Operating Leases
As Lessee
PDC leases office space and land under operating leases. Rental expenditures amounted to
approximately $1,043,885. Future minimum lease payments under PDC's operating leases are as
follows:
Fiscal Year
Ending
Minimum
Lease
Payments
2013 1,066,524$
2014 1,098,516
2015 1,131,480
2016 1,165,416
2017 1,200,384
2018-2020 3,821,568
9,483,888$
The amounts above do not include lessee maintenance charges in excess of the stipulated minimum
rental fees. The total of such charges for the fiscal year amounted to approximately $8,400.
50

PORTLAND DEVELOPMENT COMMISSION A Component Unit of the City of Portland, Oregon
Notes to the Basic Financial Statements, Continued June 30, 2012
As Lessor
PDC functions as a lessor for office space, parking lot space, and land leases on certain property
which it has acquired as part of its urban renewal activities. The carrying value of the property being
leased is approximately $12,824,487. Rental revenue amounted to approximately $2,177,000 for the
fiscal year. The minimum future operating non-cancelable lease revenues are as follows:
Fiscal Year
Ending
Minimum
Revenue Total
2013 162,570$
2014 52,914
2015 914
2016 904
2017 902
2018-2022 56
2023-2027 55
2028-2032 55
2033-2037 55
2038-2042 55
2043-2047 55
2048-2052 25
218,560$
H. Changes in Long-term Liabilities
Long-term
Beginning
Balance Additions
Payments/
Reductions
Long-term
Ending
Balances
Due within
One Year
Governmental activities
Replacement parking access -$ 391,832$ 63,744$ 268,359$ 59,729$
Replacement parking construction - 2,847,000 - 2,847,000 -
Vacation accrual - 672,242 - 672,242 -
Post employment benefits 638,271 40,759 - 679,030 -
Pollution Remediation 7,929,649 - 394,230 7,423,164 112,255
8,567,920$ 3,951,833$ 457,974$ 11,889,795$ 171,984$
For governmental activities, vacation accruals and post employment benefits will generally be
liquidated by the general fund and pollution remediation will be liquidated by the capital project fund in
which the property is located. The replacement parking and replace parking construction liabilities will
both be liquidated by the Downtown Waterfront Urban Renewal Fund.
51

PORTLAND DEVELOPMENT COMMISSION A Component Unit of the City of Portland, Oregon
Notes to the Basic Financial Statements, Continued June 30, 2012
I. Amounts Due To and From the City of Portland
Due To the City of Portland consists principally of an amount related to property held for sale which
was acquired via grant funds under the Community Development Block Grant program that PDC
administered for the City of Portland and accounts payable for services provided by the City. Balances
of Due to the City of Portland by fund as of June 30, 2012 follow.
Property Held
for Sale
Accounts
Payable
Ending
Balance
Housing and Community
Development Contract Fund 251,456$ -$ 251,456$
General Fund - 242,336 242,336
North Macadam Urban Renewal Fund - 94,572 94,572
River District Urban Renewal Fund - 1,238,867 1,238,867
Convention Center Urban Renewal Fund - 509,596 509,596
Lents Town Center Urban Renewal Fund - 516,770 516,770
Interstate Corridor Urban Renewal Fund - 113,455 113,455
Other governmental funds - 289,058 289,058
Other business type funds - 216,942 216,942
Total 251,456$ 3,221,596$ 3,473,052$
Grant revenues under various grant programs and other inter-governmental agreements due from the
City of Portland totaled $1,845,055 at June 30, 2012.
J. Revenue
Miscellaneous revenue for the fiscal year was higher than normal. This was predominantly due to the
loan loss adjustment for the year and reimbursements as detailed below:
Reimbursements
Loan Loss
Adjustment Other
Total
Miscellaneous
Revenue
General 201,150$ 32,836$ 176,234$ 410,220$
North Macadam 6,861 4,086,009 - 4,092,870
River District 154,536 903,788 - 1,058,324
Convention Center 1,685,562 2,241,584 - 3,927,146
Lents Town Center 17,909 121,974 2,416 142,299
Interstate Corridor 50,784 791,530 330,000 1,172,314
Other Governmental 151,260 2,349,104 779,710 3,280,074
Total Governmental Fund 2,268,062$ 10,526,825$ 1,288,360$ 14,083,247$
52

PORTLAND DEVELOPMENT COMMISSION A Component Unit of the City of Portland, Oregon
Notes to the Basic Financial Statements June 30, 2012
IV. Other Information
A. Retirement and Deferred Compensation Plans
State of Oregon Public Employees Retirement System
Plan Description
The State of Oregon Public Employees Retirement System (PERS), a cost-sharing multi-employer
defined benefit plan, administers a retirement plan for the City and its component units. PDC, as a
component unit, has a cost-sharing arrangement with the City. All PDC full-time employees are
participants under one or more plans currently available through PERS.
There are currently two programs with eligibility determined by the date of employment. Those
employed prior to August 29, 2003 are PERS Program members. Those employed on or after August
29, 2003 are Oregon Public Service Retirement Plan (OPSRP) Program members.
OPSRP is a hybrid retirement plan with two components: 1) the Pension Program (defined benefit;
established and maintained as a tax-qualified governmental defined benefit plan), and 2) the Individual
Account Program (IAP) (defined contribution; established and maintained as a tax-qualified
governmental defined contribution plan).
Beginning January 1, 2004, all employees who are active members of PERS became members of the
OPSRP IAP Program. PERS plan member contributions (the employee contribution, whether made by
the employee or “picked-up” by the employer) go into the IAP portion of OPSRP. PERS plan members
retain their existing PERS accounts, but any future member contributions will be deposited in the
members IAP, not into the member’s PERS account.
Oregon PERS issues a publicly available financial report that includes financial statements and
required supplementary information. The report may be obtained by writing to Oregon Public
Employees Retirement System, P.O. Box 23700, Tigard, Oregon 97281-3700, or on the internet at
URL: http://oregon.gov/PERS/section/financial_reports/financials.shtml, or by calling 1-503-598-7377.
Benefits generally vest after contributions are made in five consecutive calendar years or when
employee has reached 50 years of age. Retirement is allowed at age 58 (age 60 for Tier Two
members) or with 30 years of service with unreduced benefits, but retirement is generally available
after age 55 with reduced benefits. Retirement benefits, based on final average salary and length of
service, are calculated using either a money match, full formula, or a formula plus annuity computation,
if a greater benefit results, and are payable in a lump sum or monthly using several payment options.
PERS also provides death and disability benefits. These benefit provisions and other requirements are
established by state statutes.
53

PORTLAND DEVELOPMENT COMMISSION A Component Unit of the City of Portland, Oregon
Notes to the Basic Financial Statements, Continued June 30, 2012
Funding Policy
Employer contributions are required by state statute and are made at actuarially determined rates as
adopted by the Oregon Public Employees Retirement Board. Contributions made by PDC for the year
ended June 30, 2012 on behalf of qualifying employees represented 6% of covered payroll.
Risk Pooling and Revised PERS Contribution Rates
Effective January 1, 2000, the City elected to participate in the Local Government Rate Pool (LGRP).
The LGRP was created by legislative act of the State of Oregon and provided governments the option
to pool their PERS related assets and liabilities with others that elected to participate in the pool,
whereby contribution rates are determined based on the overall experience of the pool versus the
potentially more volatile experience of individual employers. The LGRP was expanded and replaced by
the State and Local Government Rate Pool (the SLGRP). The City made the election to join the
SLGRP as of January 1, 2002.
The most recent actuarial valuation was prepared for the period ending December 31, 2009. In
September 2010, the City was notified by the PERS actuarial firm that based on the most recent
actuarial valuation the City’s contribution rate for the fiscal year was 8.4% for Tier 1 and Tier 2
members and 6.79% for OPSRP members, this rate will continue for fiscal year 2013.
Annual Pension Cost
PERS sets the rate for the SLGRP, based on the independent actuarial study that is performed every
two years. This rate establishes the annual required contribution for the City and PDC.
Other Supplementary Information
Schedule of Rates expressed as a percentage of covered payroll
2010
PERS OPSRP PERS OPSRP PERS OPSRP
PERS Defined Benefit Plan 4.30% 5.04% 4.30% 5.04% 9.30% 7.69%
Employee IAP* 6.00% 6.00% 6.00% 6.00% 6.00% 6.00%
10.30% 11.04% 10.30% 11.04% 15.30% 13.69%
*PDC has chosen to pay the employee contributions to the IAP as an additional employee benefit
2011 2012
Fiscal Year
The amounts contributed to PERS during the years ended June 30, 2010, 2011, and 2012 were equal
to the required contributions for each year. The approximate covered payroll and actual amounts
contributed by PDC were as follows:
54

PORTLAND DEVELOPMENT COMMISSION A Component Unit of the City of Portland, Oregon
Notes to the Basic Financial Statements, Continued June 30, 2012
Schedule of Employer Contributions
2010 2011 2012
Covered Payroll 15,778,255$ 11,921,205$ 10,570,046$
PERS Contributions* 1,711,281 1,266,681 1,435,201 *As provided by Oregon PERS
In 1997, as a result of changing legislation and a court decision mandating taxation of state PERS
benefits for retirees, the actuaries determined that the PERS unfunded liability for the City's plan was
$257 million. This unfunded liability would have created extremely high contributions percentages each
employer, including PDC, would need to come up with each year. In order to help the City, and the
organizations meet the financial demands of the liability, the City issued a 30 year bond for $300
million. $257 million was put directly into PERS to offset the unfunded liability, and make the annual
contributions a more manageable amount. PDC’s contributions to the City’s Annual Pension Cost for
its share of their PERS liability over the last three fiscal years were as follows:
Fiscal Year
Ended Amount
2010 384,883$ 2011 467,363 2012 499,262
B. Other Post-employment Benefits
Plan Description. PDC does not have a formal post-employment benefits plan for any employee
groups; however the PDC is required by Oregon Revised Statutes 243.303 to provide retirees with
group health and dental insurance from the date of retirement to age 65 at the same rate provided to
current employees. GASB 45 is applicable to the PDC due only to the implicit rate subsidy. This "plan"
is not a stand-alone plan and therefore does not issue its own financial statements.
Funding Policy. In addition to the pension benefits described in Note IV.A., PDC provides post-
retirement health care benefits in accordance with PDC Personnel Policy XIII. Employee Benefits. This
PDC policy, in line with Oregon law, provides that retired employees and their dependents are eligible
to participate in group insurance coverage at their own cost until age 65, or when they are otherwise
eligible for Medicare. Eligibility is contingent on meeting the requirements to receive retirement benefits
from PERS as discussed in the previous section. Dependents of a retired PDC Employee may
participate in group coverage at the time of retirement; only so long as the retiree is covered by a PDC
plan. As of June 30, 2012, PDC has 16 eligible post-retirement participants enrolled and paying the full
cost of their premiums.
Annual Other Post-employment Benefits Cost and Net Other Post-employment Benefits Obligation.
The PDC's annual other post-employment benefit cost is calculated based on the annual required
contribution of the employer (ARC), an amount actuarially determined in accordance with the
parameters of GASB Statement 45. The ARC represents a level of funding that, if paid on an ongoing
basis, is projected to cover normal cost each year and amortize any unfunded actuarial liabilities over a
period of 15 years. The following table shows the components of the PDC's annual other post-
55

PORTLAND DEVELOPMENT COMMISSION A Component Unit of the City of Portland, Oregon
Notes to the Basic Financial Statements, Continued June 30, 2012
employment benefit cost for the year, the amount actually contributed to the plan, and changes in the
PDC's other post-employment benefit obligation to the plan. PDC participates in a cost-sharing multi-
employer plan.
Net OPEB Obligation at FYE 2011 638,271$
Annual OPEB Cost/Annual Required Contribution (a) 164,427
Interest on net OPEB obligataion (b) 25,531
Adjustment to the ARC (c) (43,376)
Net annual OPEB cost (a + b + c) 146,582
Dollars contributed this FY (implicit benefit payments) (d) (105,823)
Increase/Decrease in the Net OPEB Obligation during FY (a+b+c+d) 40,759
Net OPEB Obligation at FYE 2012 679,030$
Funding Status and Funding Progress. As of August 1, 2010, the actuarial accrued liability for benefits
was $1,082,727 and the actuarial value of assets was $0, resulting in an unfunded actuarial accrued
liability (UAAL) of $1,082,727. The covered payroll (annual payroll of active employees covered by the
plan) was $10,570,046 for fiscal year 2012 and the ratio of the UAAL to the covered payroll was
10.3%. Actuarial valuations of an ongoing plan involve estimates of the value of reported amounts and
assumptions about the probability of occurrence of events into the future. Examples include
assumptions about future employment, mortality, and the healthcare cost trends. Amounts determined
regarding the funded status of the plan and the annual required contributions of the employer are
subject to continual revisions as actual results are compared with past expectations and new estimates
are made about the future. The schedule of funding progress, presented as required supplementary
information following the notes to the financial statements, presents multi-year trend information about
whether the actuarial value of plan assets is increasing or decreasing over time relative to the actuarial
accrued liabilities for benefits.
Fiscal Year
Ended June 30,
Annual
OPEB Cost
Percentage of
Annual OPEB
Cost Paid
Net OPEB
Obligation
2012 40,759$ 33.44% 679,030$
2011 215,310 39.16% 638,271
2010 203,726 33.44% 507,267
Actuarial Methods and Assumptions. Projections of benefits for financial reporting purposes are based
on the substantive plan (the plan as understood by the employer and plan members) includes the
types of benefits provided at the time of each valuation and the historical pattern of sharing of benefit
costs between the employer and plan member to that point. The actuarial methods and assumptions
used include techniques that are designed to reduce short-term volatility in actuarial accrued liabilities
and the actuarial value of assets, consistent with the long-term perspective of the calculations.
In the August 2010 actuarial valuation performed by Milliman the projected unit credit cost method was
used. The economic actuarial assumptions included a 2.75% inflation rate and a 4.0% investment rate
of return, and annual healthcare cost trend rate of 8.5% for the first year that is graded down to 6.0 for
56

PORTLAND DEVELOPMENT COMMISSION A Component Unit of the City of Portland, Oregon
Notes to the Basic Financial Statements, Continued June 30, 2012
the fourth through 23rd year, and 5.5% for the 24th through 47th year and 5.0% thereafter. Dental costs
are assumed to increase 5.0% per year. Demographic assumptions were based on assumptions used
by Oregon PERS for its 2009 actuarial valuation of retirement benefits.
In addition, PDC contributes to Oregon Public Employees Retirement System’s (OPERS) Retirement
Health Insurance Account (RHIA) for each of its eligible employees. RHIA is a cost-sharing multiple-
employer defined benefit other post-employment benefit plan administered by OPERS. The plan is
closed to new entrants after January 1, 2004. OPERS issues a publicly available financial report that
includes financial statements and required supplementary information. That report may be obtained by
writing to Oregon Public Employees Retirement System, PO Box 23700, Tigard, OR 97281-3700.
The RHIA plan was created by enabling legislation (ORS 238.420) and therefore the contribution
requirements of the plan members and the participating employers were established and may be
amended only by the Oregon Legislature. ORS require that an amount equal to $60 or the total
monthly cost of Medicare companion health insurance premiums coverage, whichever is less, shall be
paid from the RHIA established by the employer, and any monthly cost in excess of $60 shall be paid
by the eligible retired member in the manner provided in ORS 238.410. To be eligible to receive this
monthly payment toward the premium cost the member must: (1) have eight years or more of
qualifying service in PERS at the time of retirement or receive a disability allowance as if the member
had eight years or more of creditable service in PERS, (2) receive both Medicare Parts A and B
coverage, and (3) enroll in a PERS-sponsored health plan. A surviving spouse or dependent of a
deceased PERS retiree who was eligible to receive the subsidy is eligible to receive the subsidy if he or
she (1) is receiving a retirement benefit or allowance from PERS or (2) was insured at the time the
member died and the member retired before May 1, 1991.
Participating local governments are contractually required to contribute to RHIA at a rate assessed
each year by OPERS, currently 0.59% for Tier 1 and 2 accounts and 0.50% for OPSRP accounts of
annual covered payroll. The OPERS Board of Trustees sets the employer contribution rate based on
the annual required contribution of the employers (ARC), an amount actuarially determined in
accordance with the parameters of GASB Statement 45. The ARC represents a level of funding that, if
paid on an ongoing basis, is projected to cover normal cost each year and amortize any unfunded
actuarial liabilities (or funding excess) of the plan over a period not to exceed thirty years. Amortized as
a level percentage of payroll; UAL (10 year) amortization period is closed. An inflation rate of 2.75% is
used for this agent multiple-employer postemployment benefit plan. Required and actual contributions
are reported below:
Fiscal Year
Ended June 30,
Annual
Required
Contribution
Actual
Contribution
2012 57,323$ 57,323$
2011 29,329 29,329
2010 29,978 29,978
57

PORTLAND DEVELOPMENT COMMISSION A Component Unit of the City of Portland, Oregon
Notes to the Basic Financial Statements, Continued June 30, 2012
C. Commitments
Contractual and other commitments for subsequent years’ expenditures amounting to $50,372,214 are
included in the restricted fund balances indicating tentative plans for utilization in future periods. In
addition, PDC has contractual and other commitments relating to future expenditures for grant projects,
grant funded loan commitments, and Enterprise Loans Fund loan commitments aggregating $51,044.
Commitments for subsequent year’s expenditures are as follows:
Fund Balance for:
Restricted for
Urban Renewal
Restricted for
contractual
obligation Total
North Macadam Urban Renewal Area $ 5,392,574 $ - $ 5,392,574
River District Urban Renewal Area 22,424,911 - 22,424,911
Convention Center Urban Renewal Area 2,792,128 - 2,792,128
Lents Town Center Urban Renewal Area 6,367,307 - 6,367,307
Interstate Corridor Urban Renewal Area 7,316,861 - 7,316,861
Other governmental funds 5,608,707 399,726 6,008,433
Total $ 49,902,488 $ 399,726 $ 50,302,214
D. PDC’s Use of the City of Portland’s Conduit Debt
The City has issued Economic Development Revenue Bonds (bonds). The proceeds of these bond
sales are used by private developers to finance capital expansion in urban renewal areas.
The City's and PDC's participation in the financing of these projects enables the developer to utilize
applicable provisions of the United States Internal Revenue Code (IRC Section 103) of 1954, as
amended. IRC Section 103 encourages the construction of certain facilities and the public financing
thereof through revenue bonds by providing that the interest on such bonds, as contrasted with any
bonds issued by the developer itself, will be exempt from federal income tax. This tax exemption
enables the purchasers of the bonds to accept a lower rate of interest and, since the developer in effect
pays the interest on the bonds, reduces the interest cost of the project financing to the developer.
The bond indentures provide that the bonds shall never constitute a general obligation of, an
indebtedness of, or a charge against the general credit of the City or PDC. Nor are the bonds payable
in any manner from revenue raised by taxation. Rather, the bonds will be special obligations of the City
payable solely from the revenues, receipts, and resources pledged under the indentures and not from
other revenues, funds, or assets of the City.
The bonds are collateralized solely by the specific project and payments are made by the developers.
The bonds shall not be payable from or a charge against any other funds or assets, nor shall the City
or PDC be subject to any liability thereon. No holder or holders of the bonds shall ever have the right to
compel any exercise of the taxing power of the City to pay the bonds or the interest thereon, nor to
enforce payment thereof against any property of the City or PDC except the specific project. Upon
completion of the repayment of the debt by the developer, the assets constructed become the property
58

PORTLAND DEVELOPMENT COMMISSION A Component Unit of the City of Portland, Oregon
Notes to the Basic Financial Statements, Continued June 30, 2012
of the developer. At June 30, 2012, the total of the City’s conduit debt outstanding as related to PDC
development projects is $7,280,000. This amount may differ from actual amounts reported in the City
CAFR because not all conduit debt issued by the City is related to PDC projects.
E. Contingencies
In the normal course of business PDC is subject to litigation. The opinion of PDC’s General Counsel is
that the outcome of any litigation will not have a significant effect on the financial statements.
Contingent Liability
In 2002, PDC acquired property in the Downtown Waterfront Urban Renewal Area with the intent of
using the property for Housing development. The property included an abandoned structure not used
in more than 20 years and a basement parking garage. Attached to the acquisition of the property were
three agreements between the former owner and the owner of the adjacent property regarding the
basement parking. The first lease between former owner (as landlord) and the owner of the adjacent
property (as tenant) dated December 12, 1997 (the “Basement Parking Lease”) leased the basement
of any current or future building located on the Property to the tenant for use as parking. The initial term
of the Basement Parking Lease is 99 years and the tenant has the option to renew the lease for two
successive terms of 99 years each for a total maximum term of 297 years.
Under a second agreement also dated December 12, 1997 (the “Parking Leaseback Lease”). The
tenant leased back to the former owner, for use by future tenants of the new building to be constructed
on the Property, certain parking in the basement of the Property and on nearby property owned by the
tenant. The term of the lease commences upon occupancy of the new building to be constructed on
the Property and continues for 99 years. The former owner has the option to renew the lease for two
successive terms of 99 years each for a total maximum term of 297 years.
The final agreement (“Basement Use Agreement”) requires the owner of the property to pay the cost of
replacement parking during any period in which some or all of the basement parking is not accessible
for use. This replacement parking payment obligation commences one year after the earlier of
demolition of the existing building or the date when the basement parking otherwise becomes
inaccessible. The existing building on the property was demolished in January 2007, making the
parking inaccessible, and triggering the payment for replacement parking beginning in January 2008.
This obligation passed to PDC with the purchase of the land.
The Downtown Waterfront Urban Renewal Area issued its remaining maximum indebtedness in April
2008 and is anticipated to wind down its operations over the next five years. The subject property is
included in PDC’s Strategic Real Estate Disposition Plan as being disposed of within the next five
years. The remaining resources of the URA have been budgeted towards investment in
entrepreneurship and cluster industry job growth in the Old Town / Chinatown Creative Corridor and
neighborhood enhancement through the redevelopment of underutilized blocks in Old Town /
Chinatown. If PDC were intent on holding the property and not developing the site, the liability is
estimated to be approximately $9,397,604 for the first lease term, PDC does not see this as a probable
59

PORTLAND DEVELOPMENT COMMISSION A Component Unit of the City of Portland, Oregon
Notes to the Basic Financial Statements, Continued June 30, 2012
outcome. Given the plans for the URA, the Strategic Real Estate Disposition Plan, and the re-focus on
economic development, PDC has concluded three possible options for minimizing the liability to occur
within these five years;
1. The property is sold and PDC no longer holds fee title (the obligation would pass with the
property).
2. PDC reaches a consensual settlement with the other party to the agreement to terminate
the obligation.
3. PDC constructs basement parking on the property that satisfies the requirements of the
underlying agreement.
It is more than likely that the property will be disposed of within the five years included in the long term
liability section of these notes. Should a disposition not occur in a reasonable amount of time within the
five year period, PDC would construct the replacement parking before the end of the period to relieve
the obligation. Based on current construction costs escalated at 2.5%, the liability for replacement
parking is estimated at $2,847,000.
F. Risk Management
PDC is not part of the City of Portland’s self-insurance program and purchases a variety of commercial
insurance policies to protect itself against loss. Like most other large public agencies, PDC is exposed
to various risk of loss related to torts, errors and omissions, general liability, property damage, worker’s
compensation, and unemployment claims.
PDC is insured by the State Accident Insurance Fund (SAIF) against losses from employee workers’
compensation claims up to a limit of $500,000 for each incident and each employee.
PDC is covered by Glatfelters American Alternative Insurance for: a commercial general liability policy
in the amount of $1,000,000 per occurrence, $3,000,000 aggregate and an additional $5,000,000
excess liability policy subject to $5,000 deductible for each wrongful act or occurrence; public officials
errors and omission coverage in the amount of $1,000,000 with a $3,000,000 aggregate and a
deductible of $5,000 per claim.; automobile coverage for PDC fleet vehicles in the amount of
$1,000,000 for bodily injury/property damage with a $250 deductible for comprehensive and $500
deductible for collision. Umbrella policy provides an additional $8,000,000 under the excess liability
umbrella policy. A blanket property policy through Lloyd’s of London for $100,000,000. A separate
policy provides coverage for faithful performance (employee dishonesty) through Hartford Insurance in
the amount of $300,000, providing protection from losses from forgery, alteration, theft, and
disappearance. Employment practices liability coverage is provided through Zurich American
Insurance in the amount of $3,000,000 per claim with a $150,000 deductible per claim. PDC has an
aggressive risk management policy of transferring liability to contractors, lessees, event sponsors, and
other entities through specific indemnification and insurance requirements in all contracts and
agreements. PDC has been successful in resolving claims and has not suffered any significant losses
60

PORTLAND DEVELOPMENT COMMISSION A Component Unit of the City of Portland, Oregon
Notes to the Basic Financial Statements, Continued June 30, 2012
over the past year. In addition, there have been minimal reductions in insurance coverage and no
insurance settlements have exceeded insurance coverage limits in any of the past seven fiscal years.
The Internal Service Fund has equity of $249,921 to meet insurance policy deductible amounts and
other amounts not fully reimbursed from insurance proceeds, as necessary. Of this amount, $213,714
is an insurance deductible reserve as required by the Rivers East LLC Rent Abatement Agreement.
Changes in the balances of claims liabilities including incurred but not reported (IBNR) liabilities during
the past two fiscal years are as follows:
2012 2011
Unpaid claims, beginning of year -$ 550,000$
Incurred claims (including IBNRs) - -
Claim payments - (550,000)
Unpaid claims, end of fiscal year -$ -$
Environmental Risk
GASBS 49 provides guidance for state and local governments in estimating and reporting the potential
costs of pollution remediation. While GASBS 49 does not require the PDC to search for pollution, it
does require PDC to reasonably estimate and report a remediation liability when any of the following
obligating events has occurred:
Pollution poses an imminent danger to the public and PDC is compelled to take action; PDC is in violation of a pollution related permit or license; PDC is named or has evidence that it will be named as responsible party by a regulator; PDC is named or has evidence that it will be named in a lawsuit to enforce a cleanup; or PDC commence or legally obligates itself to conduct remediation activities.
Site investigation, planning and design, cleanup and site monitoring are typical remediation activities
underway across the many PDC properties. PDC has programs, rules, and regulations that routinely
deal with remediation related issues. Much of PDCs mission is to deal with blighted properties which
sometimes include pollution conditions. PDC has the knowledge and expertise to estimate the
remediation but also employs consultants when expedient. The obligations presented herein are based
on estimates by both PDC staff and consultants and are based upon prior experience in identifying and
funding similar remediation activities. The standards require PDC to calculate pollution remediation
liabilities using the expected cash flow technique. Where PDC cannot reasonably estimate a pollution
remediation obligation, it does not report a liability.
The remediation obligation estimates that appear in this report are subject to change over time. Cost
may vary due to price fluctuation, changes in technology, changes in potential responsible parties,
results of environmental studies, changes to statutes or regulation and other factors that could result in
revisions to these estimates. Prospective recoveries from responsible parties may reduce PDC’s
obligation.
61

PORTLAND DEVELOPMENT COMMISSION A Component Unit of the City of Portland, Oregon
Notes to the Basic Financial Statements, Continued June 30, 2012
During the fiscal year, PDC recognized estimated revenue which decreased the liability by $394,230.
At June 30, 2012, PDC had a total outstanding pollution remediation liability of $7,535,419. The current
portion is $112,255.
Portland Harbor Superfund
In January 2008, the City of Portland, and subsequently PDC, was notified of a CERCLA 104 (e)
records request and therefore potential liability with respect to the Portland Harbor Superfund that may
include 46 current and previously-owned PDC parcels on or adjacent to the lower reach of the
Willamette River. The Portland Harbor Superfund matter is still in the early discovery stage, and it is
likely to be several years before any potential liability is known.
G. Related Party Transactions
Portland Family of Funds Holdings, Inc.
Portland Development Commission has a working relationship with Portland New Markets Fund I, LLC
(PNMF), a subsidiary owned by the Portland Family of Funds Holdings, Inc., an Oregon mutual-benefit
corporation (PFF), for purposes of obtaining New Market Tax Credit (NMTC) Allocations from the U.S.
Treasury.
PNMF was certified as a Community Development Entity in August 2002, by the Community
Development Financial Institutions Fund of the U.S. Department of the Treasury in order to become
eligible for tax credits through the NMTC program. PNMF was awarded $100 million in NMTC
allocation authority as part of the NMTC program established by Congress. All of the tax credits
awarded have been committed to City of Portland projects.
It is intended that through the NMTC program and PNMF, PDC will be able to advance beneficial
development projects in the City of Portland. The "NMTC Collaboration Agreement" between PDC,
PFF, and PNMF dated May 11th, 2005, outlines the respective roles and responsibilities of the working
relationship between the entities. This agreement will continue in force for any future awards of NMTC
allocation authority given to PFF or any of its subsidiaries.
PDC's role consists of project identification and sourcing, as well as veto and joint approval rights of
proposed projects. The functions of PNMF include ongoing day-to-day management control and
fundraising activities, and all tax-credit related financial transactions will be recorded by PNMF. PNMF
is charged with activities for raising private equity capital, lending their own credit, and owning private
equity. Such activities are constitutionally prohibited to PDC by Article XI, Section 9 of the Oregon
Constitution.
Portland Small Business Investment Fund, LLC (PSB) is a subsidiary of PFF. PDC has an unsecured
non-recourse loan with PSB, in a maximum amount of $4,000,000. The purpose of this program is to
finance subordinated loans to qualified small businesses to enable them to use New Market Tax
Credits. PDC underwrites these borrowers. At present six fund-level loans between PDC and PSB
62

PORTLAND DEVELOPMENT COMMISSION A Component Unit of the City of Portland, Oregon
Notes to the Basic Financial Statements, Continued June 30, 2012
have a total balance of $4,000,000 at June 30, 2012. Each advance to PSB was exactly matched by a
corresponding note and deed of trust from a small business borrower in favor of PSB. PSB passes on
payments received to PDC.
All such loans are interest-only and are unsecured during the seven-year holding period required to
obtain the maximum benefit from New Market Tax Credits. Borrowers may not prepay loans during this
period, interest rates during the first seven years range from 1% to 3%. The loans then convert to fully
amortizing loans at interest rates ranging from 3% to 6% for the next 13 years, at that time PDC
receives a security interest in the loans. Interstate Corridor URA, Lents URA, and Oregon Convention
Center URA all reserve these loans at a 10% rate.
Unrelated to the tax credit program are two deferred payment loans for the historic Armory restoration
project totaling $4,600,000 to the Portland New Markets Investment Fund, a PFF subsidiary. One loan
for $2,600,000 carries an interest rate of 3%, and the other loan for $2,000,000 has no stated interest
rate. Both loans mature in January 2013. They are reserved at 50% in the River District Urban
Renewal Fund.
A former PDC Commissioner now serves as Portland Family of Funds chairman, chief executive officer
and executive chair of the board of directors. Additionally, one former PDC executive director serves on
the PFF board of directors.
Other
In the course of carrying out the City of Portland’s development policies, PDC engaged in numerous
transactions with the City, including but not limited to the provision of materials and services, real
property acquisition, development, transfers, and sales. PDC also participates in the City of Portland’s
cash investment pool.
H. Reviews by Grantor Agencies
Costs of each grant project are subject to review by the grantor agency to assure that such costs are in
accordance with or further the purpose of the grant program. Any costs disallowed as the result of the
review would become a liability and could require the return of such amounts to the grantor agency.
63

REQUIRED SUPPLEMENTARY INFORMATION
64

Other Postemployment Healthcare Benefits Schedule of Fund Progress
Actuarial Valuation
Date
Actuarial Value of Assets
Actuarial Accrued Liability
Unfunded Accrued Liability (UAAL)
Funded Ratio
Covered Payroll
UAAL as a % of
Covered Payroll
8/1/06 $ - $ 994,779 $ 994,779 0.0% $13,272,207 7.5%
8/1/08 - 1,176,724 1,176,724 0.0% 14,305,934 8.2%
8/1/10 - 1,082,727 1,082,727 0.0% 10,561,717 10.3%
65

Supplementary Data
Combining Statements and Schedules, Budgetary Schedules, and Schedules of Capital Assets Used in the Operation of Governmental Funds


NONMAJOR GOVERNMENTAL FUNDS
SPECIAL REVENUE FUNDS Special revenue funds are used to account for specific revenues that are legally restricted to expenditure for particular purposes. HOME Grants Fund - accounts for revenues and expenditures under the Housing and Urban Development HOME Grant. Other Federal Grants Fund - accounts for revenues and expenditures for an EDA Grant. Ambassador Program Fund - accounts for monies donated by private businesses for outreach activities. Enterprise Zone Fund - accounts for monies received from participating Enterprise Zone companies to provide the North/Northeast Portland community with workforce and business development opportunities.
CAPITAL PROJECTS FUNDS
Capital projects funds are used to account for the acquisition and construction of major capital facilities other than those financed by proprietary funds. Downtown Waterfront Urban Renewal Fund - accounts for resources used in redeveloping property around Union Station for a variety of public and private uses, including: multifamily housing, redevelopment, and continued rail passenger service; improving the 73-acre south Waterfront Project area, including public streets, riverfront, and park improvements.
South Park Blocks Urban Renewal Fund - accounts for resources used in the development and improvement of the south park blocks.
Central Eastside Urban Renewal Fund - accounts for resources used in the development and improvement of the central eastside while maintaining a good environment for existing businesses by making improvements and developing the Eastbank Riverfront park.
Gateway Regional Center Urban Renewal Fund - accounts for resources used to transform the area into a Regional Center with enhanced housing, employment, recreational and cultural opportunities.
Airport Way Urban Renewal Fund - accounts for resources used for: acquisitions and construction related to the Riverside Parkway projects; projects to increase job density by attracting and retaining businesses; supporting transit and other infrastructure investments; increasing Portland’s inventory of developable land for industry and creation of quality jobs; and protecting the natural resources of the greater Portland area.
Willamette Industrial Urban Renewal Fund - accounts for resources used to attract new industrial, high-technology, manufacturing, and distributing businesses to the currently vacant or unused parcels of land.
66

Total
Nonmajor
Special Capital Governmental
Revenue Projects Funds
ASSETS
Cash with City of Portland
investment pool $ 2,571,343 $ 39,149,037 $ 41,720,380
Cash with fiscal agent 122,987 - 122,987
Receivables:
Due from City of Portland 17,148 - 17,148
Accounts 150,655 - 150,655
Loans, net 1,189,440 15,705,052 16,894,492
Interest 8,372 119,124 127,496
Property held for sale - 39,117,431 39,117,431
Other - 7,777 7,777
Total assets $ 4,059,945 $ 94,098,421 $ 98,158,366
LIABILITIES AND FUND BALANCES
Liabilities:
Accounts payable $ 81,812 $ 80,726 $ 162,538
Due to City of Portland - 289,058 289,058
Due to other entities - 5,185 5,185
Total liabilities 81,812 374,969 456,781
Fund balances:
Restricted
Loans receivable 1,189,440 15,705,052 16,894,492
Property held for sale - 39,117,431 39,117,431
Urban renewal - 38,900,969 38,900,969
Contractual obligations 2,788,693 - 2,788,693
Total fund balances 3,978,133 93,723,452 97,701,585
Total liabilities and fund balances $ 4,059,945 $ 94,098,421 $ 98,158,366
PORTLAND DEVELOPMENT COMMISSION
NONMAJOR GOVERNMENTAL FUNDS
June 30, 2012
A COMPONENT UNIT OF THE CITY OF PORTLAND, OREGON
COMBINING BALANCE SHEET
67

Total
Nonmajor
Special Capital Governmental
Revenue Projects Funds
REVENUES
Intergovernmental revenues $ 17,148 $ 208,500 $ 225,648
Charges for services 116,995 329,797 446,792
Loan interest collections 62,645 547,470 610,115
Interest on investments 15,802 243,328 259,130
Miscellaneous 780,573 2,499,501 3,280,074
Tax-increment debt proceeds
(in lieu of tax-increment revenue) - 9,644,760 9,644,760
Total revenues 993,163 13,473,356 14,466,519
EXPENDITURES
Current:
Community development 443,743 6,874,330 7,318,073
Capital outlay 86,430 8,192,786 8,279,216
Financial assistance 67,580 1,208,106 1,275,686
Total expenditures 597,753 16,275,222 16,872,975
Excess (deficiency) of revenues
over expenditures 395,410 (2,801,866) (2,406,456)
Net change in fund balances 395,410 (2,801,866) (2,406,456)
FUND BALANCES - July 1, 2011 3,582,723 96,525,318 100,108,041
FUND BALANCES - June 30, 2012 $ 3,978,133 $ 93,723,452 $ 97,701,585
PORTLAND DEVELOPMENT COMMISSION
A COMPONENT UNIT OF THE CITY OF PORTLAND, OREGON
COMBINING STATEMENT OF REVENUES, EXPENDITURES, AND CHANGES IN FUND BALANCES
NONMAJOR GOVERNMENTAL FUNDS
For the Fiscal Year Ended June 30, 2012
68

Total
ASSETS
Cash with City of Portland
investment pool $ - $ 787,561 $ 19,911 $ 1,763,871 $ 2,571,343 Cash with fiscal agent - 122,987 - - 122,987
Receivables:
Due from City of Portland - 17,148 - - 17,148
Accounts - - - 150,655 150,655
Loans receivable, net - 1,189,440 - - 1,189,440
Interest - 2,568 63 5,741 8,372
Total assets $ - $ 2,119,704 $ 19,974 $ 1,920,267 $ 4,059,945
LIABILITIES AND FUND BALANCES
Liabilities:
Accounts payable $ - $ - $ - $ 81,812 $ 81,812
Total liabilities - - - 81,812 81,812
Fund balances:
Restricted
Loans receivable - 1,189,440 - - 1,189,440
Contractual obligations - 930,264 19,974 1,838,455 2,788,693
Total fund balances - 2,119,704 19,974 1,838,455 3,978,133
Total liabilities and fund balances $ - $ 2,119,704 $ 19,974 $ 1,920,267 $ 4,059,945
PORTLAND DEVELOPMENT COMMISSION
A COMPONENT UNIT OF THE CITY OF PORTLAND, OREGON
COMBINING BALANCE SHEET
NONMAJOR SPECIAL REVENUE FUNDS
June 30, 2012
HOME
Grant Fund
Other Federal
Grants Fund
Ambassador
Program Fund
Enterprise
Zone Fund
69

PORTLAND DEVELOPMENT COMMISSION
A COMPONENT UNIT OF THE CITY OF PORTLAND, OREGON
COMBINING STATEMENT OF REVENUES, EXPENDITURES, AND CHANGES IN FUND BALANCES
NONMAJOR GOVERNMENTAL FUNDS
NONMAJOR SPECIAL REVENUE FUNDS
For the Fiscal Year Ended June 30, 2012
REVENUES
Intergovernmental revenues $ - $ 17,148 $ - $ - $ 17,148
Charges for services - # 7,295 # - # 109,700 # 116,995
Loan collections 0 - # 62,645 # - # - # 62,645
Interest on investments 0 - # 4,687 # 123 # 10,992 # 15,802
Miscellaneous 0 - # 77,592 # - # 702,981 # 780,573
0
Total revenues 0 - 169,367 123 823,673 993,163
0
EXPENDITURES 0
Current: 0
Community development 0 114 82,398 918 360,313 443,743
Capital outlay 0 - 86,430 - - 86,430
Financial assistance 0 - 67,580 - - 67,580
0
Total expenditures 0 114 236,408 918 360,313 597,753
0
Excess (deficiency) of revenues 0
over (under) expenditures 0 (114) (67,041) (795) 463,360 395,410
0
Net change in fund balances 0 (114) (67,041) (795) 463,360 395,410
0
FUND BALANCES - July 1, 2011 0 114 2,186,745 20,769 1,375,095 3,582,723
0
FUND BALANCES - June 30, 2012 $ - $ 2,119,704 $ 19,974 $ 1,838,455 $ 3,978,133
Total
HOME
Grant
Fund
Other Federal
Grants Fund
Ambassador
Program
Fund
Enterprise Zone
Fund
70

PORTLAND DEVELOPMENT COMMISSION
A COMPONENT UNIT OF THE CITY OF PORTLAND, OREGON
HOME GRANT FUND
SCHEDULE OF REVENUES, EXPENDITURES, AND
CHANGES IN FUND BALANCE - BUDGET AND ACTUAL
For the Fiscal Year Ended June 30, 2012
Budgeted Amounts Variance withOriginal Final Actual Final Budget
EXPENDITURES
Current:
Community development:
Housing $ - $ - $ 114 $ (114)
Total Community development - - 114 (114)
Excess (deficiency) of revenues
over expenditures - - (114) (114)
FUND BALANCE - July 1, 2011 - - 114 114
FUND BALANCE - June 30, 2012 $ - $ - $ - $ -
71

PORTLAND DEVELOPMENT COMMISSION
A COMPONENT UNIT OF THE CITY OF PORTLAND, OREGON
OTHER FEDERAL GRANTS FUND
SCHEDULE OF REVENUES, EXPENDITURES, AND
CHANGES IN FUND BALANCE - BUDGET AND ACTUAL
For the Fiscal Year Ended June 30, 2012
Budgeted Amounts Variance withOriginal Final Actual Final Budget
REVENUES
Intergovernmental revenue:
Federal grants $ - $ 539,050 $ 17,148 $ (521,902)
Charges for services:
Application fees and charges - - 7,295 7,295
Loan Collections:
Principal 96,000 96,000 186,003 90,003
Interest 64,000 64,000 62,645 (1,355)
Interest on investments - 2,500 4,687 2,187
Miscellaneous:
Recovery of bad loan debt - - 25,000 25,000
Reimbursements - - 116 116
Sale of real property 250,000 330,000 330,000 -
Total revenues 410,000 1,031,550 632,894 (398,656)
EXPENDITURES
Current:
Community development:
Business development 443,715 1,142,765 132,425 1,010,340
Total Community development 443,715 1,142,765 132,425 1,010,340
Contingency 9,521 292,827 - 292,827
Total expenditures 453,236 1,435,592 132,425 1,303,167
Excess (deficiency) of revenues
over expenditures (43,236) (404,042) 500,469 904,511
OTHER FINANCING USES
Internal service reimbursements (38,830) (38,830) (38,830) -
Transfers out-
General Fund - (25,721) - 25,721
Total transfers out - (25,721) - 25,721
Total other financing uses (38,830) (64,551) (38,830) 25,721
Net change in fund balance (82,066) (468,593) 461,639 930,232
FUND BALANCE - July 1, 2011 82,066 468,593 468,625 32
FUND BALANCE - June 30, 2012 $ - $ - 930,264 $ 930,264
Adjustments to generally accepted
accounting principles basis:
Loans receivable, net 1,189,440
FUND BALANCE - June 30, 2012 (GAAP BASIS) $ 2,119,704
72

PORTLAND DEVELOPMENT COMMISSION
A COMPONENT UNIT OF THE CITY OF PORTLAND, OREGON
AMBASSADOR PROGRAM FUND
SCHEDULE OF REVENUES, EXPENDITURES, AND
CHANGES IN FUND BALANCE - BUDGET AND ACTUAL
For the Fiscal Year Ended June 30, 2012
Budgeted Amounts Variance withOriginal Final Actual Final Budget
REVENUES
Interest on investments $ - $ - $ 123 $ 123
Total revenues - - 123 123
EXPENDITURES
Current:
Business development 23,554 20,324 472 19,852
Total Community development 23,554 20,324 472 19,852
Total expenditures 23,554 20,324 472 19,852
Excess (deficiency) of revenues
over expenditures (23,554) (20,324) (349) 19,975
OTHER FINANCING USES
Internal service reimbursements (446) (446) (446) -
Total other financing uses (446) (446) (446) -
Net change in fund balance (24,000) (20,770) (795) 19,975
FUND BALANCE - July 1, 2011 24,000 20,770 20,769 (1)
FUND BALANCE - June 30, 2012 $ - $ - $ 19,974 $ 19,974
73

PORTLAND DEVELOPMENT COMMISSION
A COMPONENT UNIT OF THE CITY OF PORTLAND, OREGON
ENTERPRISE ZONE FUND
SCHEDULE OF REVENUES, EXPENDITURES, AND
CHANGES IN FUND BALANCE - BUDGET AND ACTUAL
For the Fiscal Year Ended June 30, 2012
Budgeted Amounts Variance withOriginal Final Actual Final Budget
REVENUES
Charges for services:
Application fees and charges $ - $ 100,742 $ 109,700 $ 8,958
Interest on investments 13,000 11,000 10,992 (8)
Miscellaneous:
Other 430,781 517,603 702,981 185,378
Total revenues 443,781 629,345 823,673 194,328
EXPENDITURES
Current:
Business development 755,000 755,000 308,333 446,667
Administration 82,302 110,302 51,120 59,182
Total Community development 837,302 865,302 359,453 505,849
Contingency 217,459 1,138,279 - 1,138,279
Total expenditures 1,054,761 2,003,581 359,453 1,644,128
Excess (deficiency) of revenues
over expenditures (610,980) (1,374,236) 464,220 1,838,456
OTHER FINANCING USES
Internal service reimbursements (860) (860) (860) -
Total other financing uses (860) (860) (860) -
Net change in fund balance (611,840) (1,375,096) 463,360 1,838,456
FUND BALANCE - July 1, 2011 611,840 1,375,096 1,375,095 (1)
FUND BALANCE - June 30, 2012 $ - $ - $ 1,838,455 $ 1,838,455
74

ASSETS
Cash with City of Portland
investment pool $ 14,280,845 $ 10,934,443 $ 3,223,323 Loans, net 6,688,371 2,038,472 3,377,779 Interest 45,881 37,631 5,573
Property held for sale 5,444,888 3,863,482 13,529,403 Other - - 7,777
Total assets $ 26,459,985 $ 16,874,028 $ 20,143,855
LIABILITIES AND FUND BALANCES
Liabilities:
Accounts payable $ 3,659 $ 10,711 $ 31,170 Due to City of Portland 19,746 36,632 51,611 Due to other entities 5,185 - -
Total liabilities 28,590 47,343 82,781
Fund balances:
Restricted
Loans receivable 6,688,371 2,038,472 3,377,779 Property held for sale 5,444,888 3,863,482 13,529,403 Urban renewal 14,298,136 10,924,731 3,153,892
Total fund balances 26,431,395 16,826,685 20,061,074
Total liabilities and fund balances $ 26,459,985 $ 16,874,028 $ 20,143,855
June 30, 2012
PORTLAND DEVELOPMENT COMMISSION
A COMPONENT UNIT OF THE CITY OF PORTLAND, OREGON
COMBINING BALANCE SHEET
NONMAJOR GOVERNMENTAL FUNDS
NONMAJOR CAPITAL PROJECTS FUNDS
Downtown
Waterfront
Urban Renewal
Fund
South Park
Blocks Urban
Renewal Fund
Central Eastside
Urban Renewal
Fund
75

Total
$ 4,160,552 $ 3,878,636 $ 2,671,238 $ 39,149,037 210,620 3,389,810 - 15,705,052
10,722 13,353 5,964 119,124 4,068,519 12,211,139 - 39,117,431
- - - 7,777
$ 8,450,413 $ 19,492,938 $ 2,677,202 $ 94,098,421
$ 29,310 $ 5,876 $ - $ 80,726 180,716 50 303 289,058
- - - 5,185
210,026 5,926 303 374,969
210,620 3,389,810 - 15,705,052 4,068,519 12,211,139 - 39,117,431 3,961,248 3,886,063 2,676,899 38,900,969
8,240,387 19,487,012 2,676,899 93,723,452
$ 8,450,413 $ 19,492,938 $ 2,677,202 $ 94,098,421
Airport Way
Urban Renewal
Fund
Willamette
Industrial Urban
Renewal Fund
Gateway
Regional Urban
Renewal Fund
76

REVENUES
Intergovernmental revenues $ - $ - $ - Charges for services 154,190 36,122 124,375 Loan collections 252,561 60,457 123,679 Interest on investments 89,787 79,629 10,909 Miscellaneous 1,151,882 264,898 535,706 Tax-increment debt proceeds
(in lieu of tax-increment revenue) - - 5,864,661
Total revenues 1,648,420 441,106 6,659,330
EXPENDITURES
Current:
Community development 685,105 772,288 2,286,658 Capital outlay 2,540,330 1,016,621 3,119,297 Financial assistance 682,981 145,298 263,009
Total expenditures 3,908,416 1,934,207 5,668,964
Excess (deficiency) of revenues
over (under) expenditures (2,259,996) (1,493,101) 990,366
Net change in fund balances (2,259,996) (1,493,101) 990,366
FUND BALANCES - July 1, 2011 28,691,391 18,319,786 19,070,708
FUND BALANCES - June 30, 2012 $ 26,431,395 $ 16,826,685 $ 20,061,074
Central Eastside
Urban Renewal
Fund
PORTLAND DEVELOPMENT COMMISSION
A COMPONENT UNIT OF THE CITY OF PORTLAND, OREGON
COMBINING STATEMENT OF REVENUES, EXPENDITURES, AND CHANGES IN FUND BALANCES
NONMAJOR GOVERNMENTAL FUNDS
NONMAJOR CAPITAL PROJECTS FUNDS
For the Fiscal Year Ended June 30, 2012
Downtown
Waterfront
Urban Renewal
Fund
South Park
Blocks Urban
Renewal Fund
77

$ 208,500 $ - $ - $ 208,500 4,975 10,135 - 329,797 6,004 104,769 - - 547,470
21,514 29,084 12,405 - 243,328 40,872 506,143 - - 2,499,501
2,844,599 - 935,500 - 9,644,760
3,126,464 650,131 947,905 13,473,356
2,166,482 721,306 242,491 6,874,330 1,194,070 322,468 - 8,192,786
86,818 30,000 - 1,208,106
3,447,370 1,073,774 242,491 16,275,222
(320,906) (423,643) 705,414 (2,801,866)
(320,906) (423,643) 705,414 (2,801,866)
8,561,293 19,910,655 1,971,485 96,525,318
$ 8,240,387 $ 19,487,012 $ 2,676,899 $ 93,723,452
Gateway
Regional Urban
Renewal Fund
Airport Way
Urban Renewal
Fund Total
Willamette
Industrial Urban
Renewal Fund
78

PORTLAND DEVELOPMENT COMMISSION
A COMPONENT UNIT OF THE CITY OF PORTLAND, OREGON
DOWNTOWN WATERFRONT URBAN RENEWAL FUND
SCHEDULE OF REVENUES, EXPENDITURES, AND
CHANGES IN FUND BALANCE - BUDGET AND ACTUAL
For the Fiscal Year Ended June 30, 2012
Budgeted Amounts Variance with
Original Final Actual Final Budget
REVENUES
Charges for services:
Application fees and charges $ - $ - $ 6,830 $ 6,830
Rental income 700 700 147,360 146,660
Loan Collections:
Principal 560,164 1,595,148 1,548,123 (47,025)
Interest - 130,342 259,522 129,180
Interest on investments 50,000 50,000 89,788 39,788
Miscellaneous:
Recovery of bad loan debt - - 737,744 737,744
Reimbursements - - 138,352 138,352
Other - - 35 35
Total revenues 610,864 1,776,190 2,927,754 1,151,564
EXPENDITURES
Current:
Community development:
Housing 517,400 - - -
Business development 253,913 753,913 24,338 729,575
Property redevelopment 1,337,329 1,764,342 1,062,364 701,978
Infrastructure 2,851 62,851 32,471 30,380
Administration 38,778 53,343 5,452 47,891
Total Community development 2,150,271 2,634,449 1,124,625 1,509,824
Contingency 9,915,451 11,636,749 - 11,636,749
Total expenditures 12,065,722 14,271,198 1,124,625 13,146,573
Excess (deficiency) of revenues
over expenditures (11,454,858) (12,495,008) 1,803,129 14,298,137
OTHER FINANCING USES
Internal service reimbursements (273,352) (273,352) (273,352) -
Total other financing uses (273,352) (273,352) (273,352) -
Net change in fund balance (11,728,210) (12,768,360) 1,529,777 14,298,137
FUND BALANCE - July 1, 2011 11,728,210 12,768,360 12,768,359 (1)
FUND BALANCE - June 30, 2012 $ - $ - 14,298,136 $ 14,298,136
Adjustments to generally accepted
accounting principles basis:
Loans receivable, net 6,688,371
Property held for sale 5,444,888
FUND BALANCE - June 30, 2012 (GAAP BASIS) $ 26,431,395
79

PORTLAND DEVELOPMENT COMMISSION
A COMPONENT UNIT OF THE CITY OF PORTLAND, OREGON
NORTH MACADAM URBAN RENEWAL FUND
SCHEDULE OF REVENUES, EXPENDITURES, AND
CHANGES IN FUND BALANCE - BUDGET AND ACTUAL
For the Fiscal Year Ended June 30, 2012
Budgeted Amounts Variance with
Original Final Actual Final Budget
REVENUES
Charges for services:
Rental income $ 15,000 $ 15,000 $ 47,222 $ 32,222
Contractual service charges 315,472 315,472 315,472 -
Loan Collections:
Principal 128,880 132,090 49,342 (82,748)
Interest - 34,845 15,099 (19,746)
Interest on investments 25,000 25,000 30,908 5,908
Miscellaneous:
Reimbursements - - 6,861 6,861
Tax-increment debt proceeds
(in lieu of tax-increment revenue) 8,717,552 10,075,513 6,328,679 (3,746,834)
Total revenues 9,201,904 10,597,920 6,793,583 (3,804,337)
EXPENDITURES
Current:
Community development:
Housing 5,653,877 7,103,877 6,882,979 220,898
Business development 1,297,176 1,447,176 64,189 1,382,987
Property redevelopment 915,682 922,992 274,834 648,158
Infrastructure 3,817,138 5,894,909 1,332,186 4,562,723
Administration 53,601 67,526 31,344 36,182
Total Community development 11,737,474 15,436,480 8,585,532 6,850,948
Contingency 672,225 2,345,962 - 2,345,962
Total expenditures 12,409,699 17,782,442 8,585,532 9,196,910
Excess (deficiency) of revenues
over expenditures (3,207,795) (7,184,522) (1,791,949) 5,392,573
OTHER FINANCING USES
Internal service reimbursements (772,253) (772,253) (772,253) -
Total other financing uses (772,253) (772,253) (772,253) -
Net change in fund balance (3,980,048) (7,956,775) (2,564,202) 5,392,573
FUND BALANCE - July 1, 2011 3,980,048 7,956,775 7,956,773 (2)
FUND BALANCE - June 30, 2012 $ - $ - 5,392,571 $ 5,392,571
Adjustments to generally accepted
accounting principles basis:
Property held for sale 9,903,977
FUND BALANCE - June 30, 2012 (GAAP BASIS) $ 15,296,548
80

PORTLAND DEVELOPMENT COMMISSION
A COMPONENT UNIT OF THE CITY OF PORTLAND, OREGON
RIVER DISTRICT URBAN RENEWAL FUND
SCHEDULE OF REVENUES, EXPENDITURES, AND
CHANGES IN FUND BALANCE - BUDGET AND ACTUAL
For the Fiscal Year Ended June 30, 2012
Budgeted Amounts Variance with
Original Final Actual Final Budget
REVENUES
Charges for services:
Application fees and charges $ - $ - $ 1,605 $ 1,605
Rental income 582,348 582,348 494,008 (88,340)
Loan Collections:
Principal 450,000 450,000 239,132 (210,868)
Interest - - 77,071 77,071
Interest on investments 30,000 30,000 41,705 11,705
Miscellaneous:
Reimbursements 200,000 200,000 154,536 (45,464)
Tax-increment debt proceeds
(in lieu of tax-increment revenue) 50,450,100 44,735,955 42,300,815 (2,435,140)
Total revenues 51,712,448 45,998,303 43,308,872 (2,689,431)
EXPENDITURES
Current:
Community development:
Housing 26,270,298 28,624,140 24,358,448 4,265,692
Business development 3,457,330 2,457,330 143,178 2,314,152
Property redevelopment 9,564,804 6,445,005 1,523,641 4,921,364
Infrastructure 3,840,230 3,681,154 1,405,221 2,275,933
Administration 69,908 247,547 192,081 55,466
Total Community development 43,202,570 41,455,176 27,622,569 13,832,607
Contingency 11,907,767 11,161,734 - 11,161,734
Total expenditures 55,110,337 52,616,910 27,622,569 24,994,341
Excess (deficiency) of revenues
over expenditures (3,397,889) (6,618,607) 15,686,303 22,304,910
OTHER FINANCING USES
Internal service reimbursements (3,204,879) (3,324,879) (3,204,879) 120,000
Total other financing uses (3,204,879) (3,324,879) (3,204,879) 120,000
Net change in fund balance (6,602,768) (9,943,486) 12,481,424 22,424,910
FUND BALANCE - July 1, 2011 6,602,768 9,943,486 9,943,485 (1)
FUND BALANCE - June 30, 2012 $ - $ - 22,424,909 $ 22,424,909
Adjustments to generally accepted
accounting principles basis:
Loans receivable, net 18,213,371
Property held for sale 16,707,288
FUND BALANCE - June 30, 2012 (GAAP BASIS) $ 57,345,568
81

PORTLAND DEVELOPMENT COMMISSION
A COMPONENT UNIT OF THE CITY OF PORTLAND, OREGON
SOUTH PARK BLOCKS URBAN RENEWAL FUND
SCHEDULE OF REVENUES, EXPENDITURES, AND
CHANGES IN FUND BALANCE - BUDGET AND ACTUAL
For the Fiscal Year Ended June 30, 2012
Budgeted Amounts Variance with
Original Final Actual Final Budget
REVENUES
Charges for services:
Application fees and charges $ - $ - $ 122 $ 122
Rental income - - 36,000 36,000
Loan Collections:
Principal 98,400 66,815 66,816 1
Interest - 60,387 60,457 70
Interest on investments 25,000 25,000 79,629 54,629
Miscellaneous:
Reimbursements - - 10,000 10,000
Sale of real property - 1,800,000 - (1,800,000)
Total revenues 123,400 1,952,202 253,024 (1,699,178)
EXPENDITURES
Current:
Community development:
Housing 2,301,727 802,270 429,838 372,432
Business development 454,694 954,385 23,460 930,925
Property redevelopment 178,353 7,251,664 1,439,013 5,812,651
Infrastructure 100,000 170,000 54,142 115,858
Administration 10,000 26,059 5,713 20,346
Total Community development 3,044,774 9,204,378 1,952,166 7,252,212
Contingency 2,833,864 5,371,699 - 5,371,699
Total expenditures 5,878,638 14,576,077 1,952,166 12,623,911
Excess (deficiency) of revenues
over expenditures (5,755,238) (12,623,875) (1,699,142) 10,924,733
OTHER FINANCING USES
Internal service reimbursements (46,701) (46,701) (46,701) -
Total other financing uses (46,701) (46,701) (46,701) -
Net change in fund balance (5,801,939) (12,670,576) (1,745,843) 10,924,733
FUND BALANCE - July 1, 2011 5,801,939 12,670,576 12,670,574 (2)
FUND BALANCE - June 30, 2012 $ - $ - 10,924,731 $ 10,924,731
Adjustments to generally accepted
accounting principles basis:
Loans receivable, net 2,038,472
Property held for sale 3,863,482
FUND BALANCE - June 30, 2012 (GAAP BASIS) $ 16,826,685
82

PORTLAND DEVELOPMENT COMMISSION
A COMPONENT UNIT OF THE CITY OF PORTLAND, OREGON
CONVENTION CENTER URBAN RENEWAL FUND
SCHEDULE OF REVENUES, EXPENDITURES, AND
CHANGES IN FUND BALANCE - BUDGET AND ACTUAL
For the Fiscal Year Ended June 30, 2012
Budgeted Amounts Variance with
Original Final Actual Final Budget
REVENUES
Charges for services:
Application fees and charges $ - $ - $ 6,347 $ 6,347
Rental income 1,003,827 1,003,827 110,242 (893,585)
Loan Collections:
Principal 325,000 1,000,000 1,247,501 247,501
Interest - 200,000 250,558 50,558
Interest on investments 50,000 - 58,868 58,868
Miscellaneous:
Reimbursements - 1,473,339 1,685,562 212,223
Sale of real property - 2,260,923 2,172,976 (87,947)
Tax-increment debt proceeds
(in lieu of tax-increment revenue) 20,495,500 47,800,000 48,360,212 560,212
Total revenues 21,874,327 53,738,089 53,892,266 154,177
EXPENDITURES
Current:
Community development:
Housing 3,010,967 2,540,418 1,019,723 1,520,695
Business development 969,370 731,370 57,395 673,975
Property redevelopment 15,014,857 24,629,659 2,741,772 21,887,887
Infrastructure 547,323 84,277 21,645 62,632
Administration 97,144 88,816 45,728 43,088
Total Community development 19,639,661 28,074,540 3,886,263 24,188,277
Contingency 1,856,034 24,487,725 - 24,487,725
Total expenditures 21,495,695 52,562,265 3,886,263 48,676,002
Excess (deficiency) of revenues
over expenditures 378,632 1,175,824 50,006,003 48,830,179
OTHER FINANCING USES
Internal service reimbursements (2,873,053) (2,873,053) (2,873,053) -
Total other financing uses (2,873,053) (2,873,053) (2,873,053) -
Net change in fund balance (2,494,421) (1,697,229) 47,132,950 48,830,179
FUND BALANCE - July 1, 2011 2,494,421 1,697,229 1,697,230 1
FUND BALANCE - June 30, 2012 $ - $ - 48,830,180 $ 48,830,180
Adjustments to generally accepted
accounting principles basis:
Loans receivable, net 9,063,689
Property held for sale 13,277,714
FUND BALANCE - June 30, 2012 (GAAP BASIS) $ 71,171,583
83
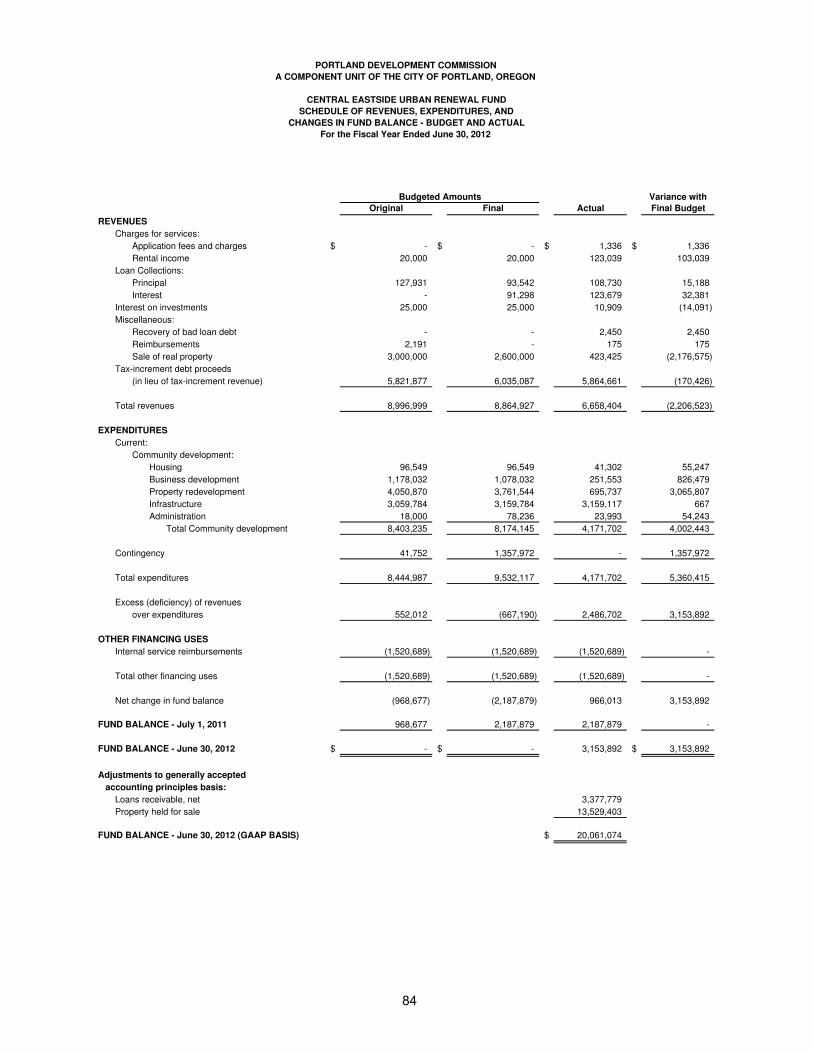
PORTLAND DEVELOPMENT COMMISSION
A COMPONENT UNIT OF THE CITY OF PORTLAND, OREGON
CENTRAL EASTSIDE URBAN RENEWAL FUND
SCHEDULE OF REVENUES, EXPENDITURES, AND
CHANGES IN FUND BALANCE - BUDGET AND ACTUAL
For the Fiscal Year Ended June 30, 2012
Budgeted Amounts Variance with
Original Final Actual Final Budget
REVENUES
Charges for services:
Application fees and charges $ - $ - $ 1,336 $ 1,336
Rental income 20,000 20,000 123,039 103,039
Loan Collections:
Principal 127,931 93,542 108,730 15,188
Interest - 91,298 123,679 32,381
Interest on investments 25,000 25,000 10,909 (14,091)
Miscellaneous:
Recovery of bad loan debt - - 2,450 2,450
Reimbursements 2,191 - 175 175
Sale of real property 3,000,000 2,600,000 423,425 (2,176,575)
Tax-increment debt proceeds
(in lieu of tax-increment revenue) 5,821,877 6,035,087 5,864,661 (170,426)
Total revenues 8,996,999 8,864,927 6,658,404 (2,206,523)
EXPENDITURES
Current:
Community development:
Housing 96,549 96,549 41,302 55,247
Business development 1,178,032 1,078,032 251,553 826,479
Property redevelopment 4,050,870 3,761,544 695,737 3,065,807
Infrastructure 3,059,784 3,159,784 3,159,117 667
Administration 18,000 78,236 23,993 54,243
Total Community development 8,403,235 8,174,145 4,171,702 4,002,443
Contingency 41,752 1,357,972 - 1,357,972
Total expenditures 8,444,987 9,532,117 4,171,702 5,360,415
Excess (deficiency) of revenues
over expenditures 552,012 (667,190) 2,486,702 3,153,892
OTHER FINANCING USES
Internal service reimbursements (1,520,689) (1,520,689) (1,520,689) -
Total other financing uses (1,520,689) (1,520,689) (1,520,689) -
Net change in fund balance (968,677) (2,187,879) 966,013 3,153,892
FUND BALANCE - July 1, 2011 968,677 2,187,879 2,187,879 -
FUND BALANCE - June 30, 2012 $ - $ - 3,153,892 $ 3,153,892
Adjustments to generally accepted
accounting principles basis:
Loans receivable, net 3,377,779
Property held for sale 13,529,403
FUND BALANCE - June 30, 2012 (GAAP BASIS) $ 20,061,074
84

PORTLAND DEVELOPMENT COMMISSION
A COMPONENT UNIT OF THE CITY OF PORTLAND, OREGON
LENTS TOWN CENTER URBAN RENEWAL FUND
SCHEDULE OF REVENUES, EXPENDITURES, AND
CHANGES IN FUND BALANCE - BUDGET AND ACTUAL
For the Fiscal Year Ended June 30, 2012
Budgeted Amounts Variance with
Original Final Actual Final Budget
REVENUES
Intergovernmental revenue:
State and local $ 250,000 $ - $ - $ -
Charges for services:
Application fees and charges - - 799 799
Rental income - 20,000 68,778 48,778
Loan Collections:
Principal 108,000 108,000 60,451 (47,549)
Interest - 41,000 92,198 51,198
Interest on investments 6,000 6,000 69,822 63,822
Miscellaneous:
Recovery of bad loan debt - - 2,350 2,350
Reimbursements - - 17,909 17,909
Sale of real property 1,151,264 - - -
Other - - 66 66
Tax-increment debt proceeds
(in lieu of tax-increment revenue) 8,217,702 7,562,840 7,516,135 (46,705)
Total revenues 9,732,966 7,737,840 7,828,508 90,668
EXPENDITURES
Current:
Community development:
Housing 6,850,546 8,360,687 3,941,626 4,419,061
Business development 1,544,902 1,544,902 246,935 1,297,967
Property redevelopment 3,843,904 4,644,323 2,102,503 2,541,820
Infrastructure 2,907,340 2,907,340 1,714,737 1,192,603
Administration 10,000 96,659 37,397 59,262
Total Community development 15,156,692 17,553,911 8,043,198 9,510,713
Contingency 315,207 1,472,677 - 1,472,677
Total expenditures 15,471,899 19,026,588 8,043,198 10,983,390
Excess (deficiency) of revenues
over expenditures (5,738,933) (11,288,748) (214,690) 11,074,058
OTHER FINANCING USES
Internal service reimbursements (1,500,338) (1,500,338) (1,500,338) -
Total other financing uses (1,500,338) (1,500,338) (1,500,338) -
Net change in fund balance (7,239,271) (12,789,086) (1,715,028) 11,074,058
FUND BALANCE - July 1, 2011 7,239,271 12,789,086 12,789,085 (1)
FUND BALANCE - June 30, 2012 $ - $ - 11,074,057 $ 11,074,057
Adjustments to generally accepted
accounting principles basis:
Loans receivable, net 1,984,968
Property held for sale 9,514,330
FUND BALANCE - June 30, 2012 (GAAP BASIS) $ 22,573,355
85

PORTLAND DEVELOPMENT COMMISSION
A COMPONENT UNIT OF THE CITY OF PORTLAND, OREGON
INTERSTATE CORRIDOR URBAN RENEWAL FUND
SCHEDULE OF REVENUES, EXPENDITURES, AND
CHANGES IN FUND BALANCE - BUDGET AND ACTUAL
For the Fiscal Year Ended June 30, 2012
Budgeted Amounts Variance with
Original Final Actual Final Budget
REVENUES
Charges for services:
Application fees and charges $ - $ - $ 2,997 $ 2,997
Rental income - - 152,381 152,381
Loan Collections:
Principal 3,499,287 3,549,287 338,686 (3,210,601)
Interest - - 163,770 163,770
Interest on investments 20,000 20,000 34,896 14,896
Miscellaneous:
Reimbursements - - 50,784 50,784
Sale of real property 500,000 600,000 258,650 (341,350)
Tax-increment debt proceeds
(in lieu of tax-increment revenue) 10,195,290 21,843,969 19,636,706 (2,207,263)
Total revenues 14,214,577 26,013,256 20,638,870 (5,374,386)
EXPENDITURES
Current:
Community development:
Housing 5,067,326 5,499,297 2,381,926 3,117,371
Business development 3,074,666 1,874,666 220,602 1,654,064
Property redevelopment 10,083,299 11,088,748 7,965,472 3,123,276
Infrastructure 3,060,574 2,860,574 723,014 2,137,560
Administration 124,013 118,432 36,520 81,912
Total Community development 21,409,878 21,441,717 11,327,534 10,114,183
Contingency 3,641,154 2,577,063 - 2,577,063
Total expenditures 25,051,032 24,018,780 11,327,534 12,691,246
Excess (deficiency) of revenues
over expenditures (10,836,455) 1,994,476 9,311,336 7,316,860
OTHER FINANCING USES
Internal service reimbursements (2,011,381) (2,011,381) (2,011,381) -
Total other financing uses (2,011,381) (2,011,381) (2,011,381) -
Net change in fund balance (12,847,836) (16,905) 7,299,955 7,316,860
FUND BALANCE - July 1, 2011 12,847,836 16,905 16,905 -
FUND BALANCE - June 30, 2012 $ - $ - 7,316,860 $ 7,316,860
Adjustments to generally accepted
accounting principles basis:
Loans receivable, net 6,762,115
Property held for sale 6,556,640
FUND BALANCE - June 30, 2012 (GAAP BASIS) $ 20,635,615
86

PORTLAND DEVELOPMENT COMMISSION
A COMPONENT UNIT OF THE CITY OF PORTLAND, OREGON
GATEWAY REGIONAL CENTER URBAN RENEWAL FUND
SCHEDULE OF REVENUES, EXPENDITURES, AND
CHANGES IN FUND BALANCE - BUDGET AND ACTUAL
For the Fiscal Year Ended June 30, 2012
Budgeted Amounts Variance with
Original Final Actual Final Budget
REVENUES
Intergovernmental revenue:
State and local $ 208,500 $ 208,500 $ 208,500 $ -
Charges for services:
Application fees and charges - - 536 536
Rental income - - 4,439 4,439
Loan Collections:
Principal 18,402 18,402 6,700 (11,702)
Interest - 4,300 6,004 1,704
Interest on investments 7,000 7,000 21,514 14,514
Miscellaneous:
Reimbursements - 1,706 1,706 -
Tax-increment debt proceeds
(in lieu of tax-increment revenue) 2,990,410 3,315,963 2,844,599 (471,364)
Total revenues 3,224,312 3,555,871 3,093,998 (461,873)
EXPENDITURES
Current:
Community development:
Housing 938,081 1,672,281 1,090,910 581,371
Business development 653,695 653,695 22,032 631,663
Property redevelopment 999,172 1,059,338 513,067 546,271
Infrastructure 937,732 784,747 399,113 385,634
Administration 10,000 70,234 14,976 55,258
Total Community development 3,538,680 4,240,295 2,040,098 2,200,197
Contingency 1,352,353 2,237,325 - 2,237,325
Total expenditures 4,891,033 6,477,620 2,040,098 4,437,522
Excess (deficiency) of revenues
over expenditures (1,666,721) (2,921,749) 1,053,900 3,975,649
OTHER FINANCING USES
Internal service reimbursements (671,711) (671,711) (671,711) -
Total other financing uses (671,711) (671,711) (671,711) -
Net change in fund balance (2,338,432) (3,593,460) 382,189 3,975,649
FUND BALANCE - July 1, 2011 2,338,432 3,593,460 3,579,059 (14,401)
FUND BALANCE - June 30, 2012 $ - $ - 3,961,248 $ 3,961,248
Adjustments to generally accepted
accounting principles basis:
Loans receivable, net 210,620
Property held for sale 4,068,519
FUND BALANCE - June 30, 2012 (GAAP BASIS) $ 8,240,387
87

PORTLAND DEVELOPMENT COMMISSION
A COMPONENT UNIT OF THE CITY OF PORTLAND, OREGON
AIRPORT WAY URBAN RENEWAL FUND
SCHEDULE OF REVENUES, EXPENDITURES, AND
CHANGES IN FUND BALANCE - BUDGET AND ACTUAL
For the Fiscal Year Ended June 30, 2012
Budgeted Amounts Variance with
Original Final Actual Final Budget
REVENUES
Charges for services:
Application fees and charges $ - $ 10,000 $ 3,132 $ (6,868)
Rental income - 10,000 7,003 (2,997)
Loan Collections:
Principal 181,536 181,536 54,974 (126,562)
Interest - 70,000 104,769 34,769
Interest on investments 30,000 30,000 29,084 (916)
Miscellaneous:
Reimbursements 5,000 10,000 911 (9,089)
Sale of real property 1,000,000 - - -
Total revenues 1,216,536 311,536 199,873 (111,663)
EXPENDITURES
Current:
Business development 1,460,889 860,889 570,557 290,332
Property redevelopment 825,701 1,144,762 443,731 701,031
Administration 21,459 61,150 4,278 56,872
Total Community development 2,308,049 2,066,801 1,018,566 1,048,235
Contingency 1,543,559 2,949,492 - 2,949,492
Total expenditures 3,851,608 5,016,293 1,018,566 3,997,727
Excess (deficiency) of revenues
over expenditures (2,635,072) (4,704,757) (818,693) 3,886,064
OTHER FINANCING USES
Internal service reimbursements (451,313) (451,313) (451,313) -
Total other financing uses (451,313) (451,313) (451,313) -
Net change in fund balance (3,086,385) (5,156,070) (1,270,006) 3,886,064
FUND BALANCE - July 1, 2011 3,086,385 5,156,070 5,156,069 (1)
FUND BALANCE - June 30, 2012 $ - $ - 3,886,063 $ 3,886,063
Adjustments to generally accepted
accounting principles basis:
Loans receivable, net 3,389,810
Property held for sale 12,211,139
FUND BALANCE - June 30, 2012 (GAAP BASIS) $ 19,487,012
88

PORTLAND DEVELOPMENT COMMISSION
A COMPONENT UNIT OF THE CITY OF PORTLAND, OREGON
WILLAMETTE INDUSTRIAL URBAN RENEWAL FUND
SCHEDULE OF REVENUES, EXPENDITURES, AND
CHANGES IN FUND BALANCE - BUDGET AND ACTUAL
For the Fiscal Year Ended June 30, 2012
Budgeted Amounts Variance with
Original Final Actual Final Budget
REVENUES
Interest on investments $ 5,000 $ 10,000 $ 12,405 $ 2,405
Tax-increment debt proceeds
(in lieu of tax-increment revenue) 999,000 999,000 935,500 (63,500)
Total revenues 1,004,000 1,009,000 947,905 (61,095)
EXPENDITURES
Current:
Business development 884,721 884,721 19,015 865,706
Property redevelopment 194,000 181,652 6,480 175,172
Administration 5,446 17,794 1,636 16,158
Total Community development 1,084,167 1,084,167 27,131 1,057,036
Contingency 718,640 1,680,959 - 1,680,959
Total expenditures 1,802,807 2,765,126 27,131 2,737,995
Excess (deficiency) of revenues
over expenditures (798,807) (1,756,126) 920,774 2,676,900
OTHER FINANCING USES
Internal service reimbursements (215,360) (215,360) (215,360) -
Total other financing uses (215,360) (215,360) (215,360) -
Net change in fund balance (1,014,167) (1,971,486) 705,414 2,676,900
FUND BALANCE - July 1, 2011 1,014,167 1,971,486 1,971,485 (1)
FUND BALANCE - June 30, 2012 $ - $ - $ 2,676,899 $ 2,676,899
89

PROPRIETARY FUNDS
ENTERPRISE FUNDS
Enterprise funds are used to report an activity for which a fee is charged to external users for goods or services. PDC has two Enterprise type funds. Enterprise Loans Fund - this fund accounts for the various loan programs which are not required to be accounted for in another fund. Small Business Loan Fund Portland Startup Fund PLPA Bank of America Fund
Housing Investment Fund Rental Rehabilitation Reloan Fund Neighborhood Housing Loan Fund Business Development Loan Fund Program Reserve Fund Workforce Training/Hiring Fund Combining Schedules are presented by loan program. These include a Combining Schedule of Net Assets and a Combining Schedule of Revenues, Expenses, and Changes in Fund Net Assets. Enterprise Management Fund - provides for the activity related to the operations and management of PDC properties or City of Portland properties PDC has contracted to manage outside of Urban Renewal Areas. Currently, this fund includes the operating revenues and expenses of the Headwaters Apartments.
INTERNAL SERVICE FUND
Internal service funds are used to report any activity that provides services to other funds on a cost reimbursement basis. Risk Management Fund – this fund was established to set aside resources that would be used to meet insurance policy deductibles, if necessary.
90


PORTLAND DEVELOPMENT COMMISSION
A COMPONENT UNIT OF THE CITY OF PORTLAND, OREGON
ENTERPRISE LOANS FUND
SCHEDULE OF REVENUES, EXPENDITURES, AND
CHANGES IN FUND BALANCE - BUDGET AND ACTUAL
(NON-GAAP BUDGETARY BASIS)
For The Fiscal Year Ended June 30, 2012
Actual Actual GAAP to Actual
Budgeted Amounts (GAAP Actual Budgetary (Budgetary Variance with
Original Final Basis) Adjustments Basis) Final Budget
REVENUES
Intergovernmental revenue:
City of Portland, General Fund $ 500,000 $ 500,000 $ 200,000 $ - $ 200,000 $ (300,000)
Charges for services-
Application fees and charges - - 41,812 - 41,812 41,812
Loan Collections: .
Principal 123,000 123,000 - 806,962 806,962 683,962
Interest 82,000 82,000 102,456 - 102,456 20,456
Interest on investments - 1,500 6,340 - 6,340 4,840
Miscellaneous:
Reimbursements - - 10,819 - 10,819 10,819
Other - - 85,431 (59,711) 25,720 25,720
Total revenues 705,000 706,500 446,858 747,251 1,194,109 487,609
EXPENDITURES
Current:
Community development:
Housing - - 32,359 - 32,359 (32,359)
Business development 980,682 1,628,420 343,450 (17,721) 325,729 1,302,691
Total community development 980,682 1,628,420 375,809 (17,721) 358,088 1,270,332
Contingency 4,399 118,140 - - - 118,140
Total expenditures 985,081 1,746,560 375,809 (17,721) 358,088 1,388,472
Excess (deficiency) of revenues
over expenditures (280,081) (1,040,060) 71,049 764,972 836,021 1,876,081
Transfers in:
General Fund - 85,721 60,000 - 60,000 (25,721)
Housing and Community
Development Contract Fund - 700,000 - 700,000 700,000 -
Total transfers in - 785,721 60,000 700,000 760,000 (25,721)
Internal service reimbursements (98,423) (98,423) - (98,423) (98,423) -
Transfers out:
Housing and Community
Development Contract Fund - - - (100,000) (100,000) (100,000)
Total transfers out - - - (100,000) (100,000) (100,000)
Total transfers (98,423) 687,298 60,000 501,577 561,577 (125,721)
Net change in fund balance (378,504) (352,762) 131,049 1,266,549 1,397,598 1,750,360
FUND EQUITY - July 1, 2011 378,504 352,762 3,323,521 (2,677,181) 646,340 293,578
FUND EQUITY - June 30, 2012 $ - $ - $ 3,454,570 $ (1,410,632) $ 2,043,938 $ 2,043,938
91

PORTLAND DEVELOPMENT COMMISSION
A COMPONENT UNIT OF THE CITY OF PORTLAND, OREGON
COMBINING SCHEDULE OF NET ASSETS
FOR COMPONENTS OF THE ENTERPRISE LOANS FUND
June 30, 2012
ASSETS
Current assets:
Cash with City of Portland
investment pool $ 927,434 $ 61,625 $ - $ - $ -
Receivables:
Accounts - - - - -
Due from other funds 100,000 - - - -
Loans, net 497,026 - - - -
Interest 1,155 143 - - -
Total current assets 1,525,615 61,768 - - -
Noncurrent assets:
Loans receivable, net - - - - -
Total noncurrent assets - - - - -
Total assets 1,525,615 61,768 - - -
LIABILITIES AND NET ASSETS
Liabilities:
Current liabilities:
Accounts payable - - - - -
Accrued liability - - - - -
Total current liabilities - - - - -
Total liabilities - - - - -
Net Assets:
Unrestricted $ 1,525,615 $ 61,768 $ - $ - $ -
Small
Business
Loan Fund
Portland
Startup Fund
PLPA Bank
of America
Fund
Housing
Investment Fund
Rental
Rehabilitation
Reloan Fund
92

Total
Enterprise
Loans Fund
$ 192,263 $ 777,029 $ - $ 57,480 $ 2,015,831
5,907 - - - 5,907
- - - - 100,000
- 128,731 - - 625,757
- 1,708 - 192 3,198
198,170 907,468 - 57,672 2,750,693
- 712,204 - - 712,204
- 712,204 - - 712,204
198,170 1,619,672 - 57,672 3,462,897
770 587 - - 1,357
6,970 - - - 6,970
7,740 587 - - 8,327
7,740 587 - - 8,327
$ 190,430 $ 1,619,085 $ - $ 57,672 $ 3,454,570
Neighborhood
Housing Loan
Fund
Business
Development
Loan Fund
Program
Reserve Fund
Workforce
Training/Hiring
Fund
93

OPERATING REVENUES:
Charges for services $ 26,103 $ - $ - $ - $ -
Interest on loans 71,342 - - - -
Miscellaneous revenues 60,482 - - - -
Total operating revenues 157,927 - - - -
OPERATING EXPENSES:
Personal services 6,405 - - - -
Professional services - - - - -
Loan document costs - - - - -
Financial assistance 7,417 200,000 - - -
Internal service reimbursements 39,016 - - - -
Miscellaneous expenses 80 - 3,540 5,323 578
Total operating expenses 52,918 200,000 3,540 5,323 578
Operating income (loss) 105,009 (200,000) (3,540) (5,323) (578)
NON-OPERATING REVENUES (EXPENSE):
Interest on investment 2,496 348 3 6 -
Intergovernmental revenues - 200,000 - - -
Total non-operating revenues (expense) 2,496 200,348 3 6 -
Income (loss) before transfers 107,505 348 (3,537) (5,317) (578)
TRANSFERS
Transfers in 30,000 - - - -
Total transfers 30,000 - - - -
Change in net assets 137,505 348 (3,537) (5,317) (578)
Net assets - July 1, 2011 1,388,110 61,420 3,537 5,317 578
Net assets - June 30, 2012 $ 1,525,615 $ 61,768 $ - $ - $ -
Rental
Rehabilitation
Reloan Fund
PORTLAND DEVELOPMENT COMMISSION
A COMPONENT UNIT OF THE CITY OF PORTLAND, OREGON
COMBINING SCHEDULE OF REVENUES, EXPENSES, AND CHANGES IN FUND NET ASSETS
FOR COMPONENTS OF THE ENTERPRISE LOANS FUND
Small Business
Loan Fund
Portland
Startup Fund
PLPA Bank of
America Fund
Housing
Investment Fund
For the Fiscal Year Ended June 30, 2012
94

Total
Enterprise
Loans Fund
$ 13,617 $ 2,092 $ - $ - $ 41,812
- 31,114 - - 102,456
50 35,714 - - 96,246
13,667 68,920 - - 240,514
3,447 9,880 - - 19,732
- 15,868 - - 15,868
13,552 980 - - 14,532
- 1,821 - - 209,238
- 59,407 - - 98,423
500 2,576 5,415 - 18,012
17,499 90,532 5,415 - 375,805
(3,832) (21,612) (5,415) - (135,291)
145 2,953 6 383 6,340
- - - - 200,000
145 2,953 6 383 206,340
(3,687) (18,659) (5,409) 383 71,049
- 30,000 - - 60,000
- 30,000 - - 60,000
(3,687) 11,341 (5,409) 383 131,049
194,117 1,607,744 5,409 57,289 3,323,521
$ 190,430 $ 1,619,085 $ - $ 57,672 $ 3,454,570
Program
Reserve Fund
Workforce
Training/Hiring
Fund
Neighborhood
Housing Loan
Fund
Business
Development
Loan Fund
95

PORTLAND DEVELOPMENT COMMISSION
A COMPONENT UNIT OF THE CITY OF PORTLAND, OREGON
ENTERPRISE MANAGEMENT FUND
SCHEDULE OF REVENUES, EXPENDITURES, AND
CHANGES IN FUND BALANCE - BUDGET AND ACTUAL
(NON-GAAP BUDGETARY BASIS)
For The Fiscal Year Ended June 30, 2012
Actual
Budgeted Amounts (Budgetary Variance withOriginal Final Basis) Final Budget
REVENUES
Charges for services-
Rental income $ 1,287,564 $ 1,287,564 $ 977,933 $ (309,631)
Interest on investments - - 1,140 1,140
Total revenues 1,287,564 1,287,564 979,073 (308,491)
EXPENDITURES
Current:
Community development:
Housing 1,287,564 1,287,564 1,015,468 272,096
Total community development 1,287,564 1,287,564 1,015,468 272,096
Total expenditures 1,287,564 1,287,564 1,015,468 272,096
Net change in fund balance - - (36,395) (36,395)
FUND EQUITY - July 1, 2011 - - 75,272 75,272
FUND EQUITY - June 30, 2012 $ - $ - $ 38,877 $ 38,877
96

PORTLAND DEVELOPMENT COMMISSION
A COMPONENT UNIT OF THE CITY OF PORTLAND, OREGON
RISK MANAGEMENT FUND
SCHEDULE OF REVENUES, EXPENDITURES, AND
CHANGES IN FUND BALANCE - BUDGET AND ACTUAL
(NON-GAAP BUDGETARY BASIS)
For the Fiscal Year Ended June 30, 2012
Budgeted Amounts Variance with
Original Final Actual Final Budget
REVENUES
Interest on investments $ - $ 500 $ 1,658 $ 1,158
Total revenues - 500 1,658 1,158
EXPENDITURES
Current:
Administration 240,000 248,765 2 248,763
Total community development 240,000 248,765 2 248,763
Total expenditures 240,000 248,765 2 248,763
Excess (deficiency) of revenues
over expenditures (240,000) (248,265) 1,656 249,921
Net change in fund balance (240,000) (248,265) 1,656 249,921
FUND BALANCE - July 1, 2011 240,000 248,265 248,265 -
FUND BALANCE - June 30, 2012 $ - $ - $ 249,921 $ 249,921
97

Balance Balance
July 1, 2011 Additions Deductions June 30, 2012
Assets:
Cash with City of Portland investment pool $ 19 $ 95,337 $ 94,656 $ 700
Interest receivable 8 3,559 3,567 -
Total assets $ 27 $ 98,896 $ 98,223 $ 700
Liabilities -
Accounts payable $ 26 $ 93,102 $ 92,428 $ 700
For the Fiscal Year Ended June 30, 2012
PORTLAND DEVELOPMENT COMMISSION
A COMPONENT UNIT OF THE CITY OF PORTLAND, OREGON
STATEMENT OF CHANGES IN ASSETS AND LIABILITIES
AGENCY FUND
98

CAPITAL ASSETS
USED IN THE OPERATION
OF GOVERNMENTAL FUNDS
99

PORTLAND DEVELOPMENT COMMISSION
A COMPONENT UNIT OF THE CITY OF PORTLAND, OREGON
SCHEDULE BY SOURCE
June 30, 2012
Governmental funds capital assets:
Land $ 4,646,050
Buildings and improvements 2,707,441
Leasehold improvements 3,849,501
Vehicles, and equipment 1,069,547
Intangible software 2,702,582
Accumulated depreciation (6,036,417)
Total governmental funds capital assets $ 8,938,704
Investment in governmental funds capital assets by source:
General Fund $ 3,778,642
Capital Projects Funds 11,196,479
Accumulated depreciation (6,036,417)
Total governmental funds capital assets $ 8,938,704
This schedule presents only the capital asset balances related to governmental funds.
CAPITAL ASSETS USED IN THE OPERATION OF GOVERNMENTAL FUNDS
100

PORTLAND DEVELOPMENT COMMISSION
A COMPONENT UNIT OF THE CITY OF PORTLAND, OREGON
CAPITAL ASSETS USED IN THE OPERATION OF GOVERNMENTAL FUNDS
SCHEDULE BY FUNCTION AND ACTIVITY
JUNE 30, 2012
Buildings
and Leasehold Vehicles and
Function and Activity Land Improvements Improvements Equipment Software Total
Community development
Revitalization 4,646,050$ 2,707,441$ -$ -$ -$ 7,353,491$
Administration - - 3,849,501 1,069,547 2,702,582 7,621,630
Total Community development 4,646,050 2,707,441 3,849,501 1,069,547 2,702,582 14,975,121
Less: Accumulated depreciation - (1,299,567) (3,849,501) (887,349) - (6,036,417)
Total governmental funds capital assets 4,646,050$ 1,407,874$ -$ 182,198$ 2,702,582$ 8,938,704$
101

PORTLAND DEVELOPMENT COMMISSIONA COMPONENT UNIT OF THE CITY OF PORTLAND, OREGON
CAPITAL ASSETS USED IN THE OPERATION OF GOVERNMENTAL FUNDS
SCHEDULE OF CHANGES BY FUNCTION AND ACTIVITY
For the Fiscal Year Ended June 30, 2012
Governmental Governmental
Funds Capital Funds Capital
Assets Assets
Program July 1, 2011 Additions Deductions June 30, 2012
Community development:
Revitalization $ 8,808,866 $ 10,815 $ (1,466,190) $ 7,353,491
Adminstration 7,785,370 1,281,377 (1,445,117) 7,621,630
Total Community development 16,594,236 1,292,192 (2,911,307) 14,975,121
Less: Accumulated depreciation (6,991,546) (164,755) 1,119,884 (6,036,417)
Total governmental funds capital assets $ 9,602,690 $ 1,127,437 $ (1,791,423) $ 8,938,704
This schedule presents only the capital asset balances related to governmental funds.
102

Funding Source
Balance
July 1, 2011 Additions
Sales/
Adjustment
Balance
June 30, 2012
General Fund (Urban Redevelopment Fund):* Woodstock & Foster Rd-Dagel Site-LTC 100,000$ -$ -$ 100,000$ * 9330 SE Harold St-Boys & Girls Club-LTC 46,754 - - 46,754 South Auditorium Park Block C 2 - - 2 Upshur- Willamette Heights Lot 7 & 8 6,501 - - 6,501 Block 103-SW Montgomery Street 1 - - 1 Block 101-1510 SW Harbor Way 1 - - 1 Block 111-Market/Clay/Front 1 - - 1 Tom McCall Waterfront Park 7 - - 7
Total 153,267 - - 153,267
Housing and Community Development Fund:* 5815 SE 92nd-Lents Plaza Mcgalliard Site 251,456 - - 251,456
Total 251,456 - - 251,456
Other Federal Grants Fund:* 6931 NE MLK JR Blvd 416,430 - (416,430) -
Total 416,430 - (416,430) -
Downtown Waterfront Urban Renewal Fund:* NW Naito Parkway 3,000 70,597 - 73,597 * 209 SW Oak St-Abandoned Jail 1,730,179 - (1,730,179) - * 820-838 SW 3rd Ave-Cossette Site 1,761,290 - - 1,761,290 Union Station Parcels 8,795,945 10,813 (1,466,190) 7,340,568
* NW Davis BLK 8 2,500,001 - - 2,500,001 * 411 NW Flanders Unit 100 1,303,566 - (503,566) 800,000 * 411 NW Flanders Prk (20 units) 532,500 - (222,500) 310,000
Total 16,626,481 81,410 (3,922,435) 12,785,456
North Macadam Urban Renewal Fund:* South Waterfront Development Sites 3,730,829 - (4) 3,730,825 * RiverPlace Garage - 6,173,152 - 6,173,152
Total 3,730,829 6,173,152 (4) 9,903,977
River District Urban Renewal Fund:* NW Naito Parkway 193,516 - (70,597) 122,919 * Broadway Hoyt/Glisan/6th-Block R 72,283 - - 72,283 * 1362 NW Naito Prkwy-Centennial Mill 2,650,000 - - 2,650,000 * 800 NW 6th Ave Parking Site-Block Y 487,039 - - 487,039 * 9th & Lovejoy-Station Place 1,053,464 7,288 - 1,060,752 * Station Place Garage 9,277,726 - - 9,277,726 * Union Station Parcels-Old Fire Station & Lot 5 260,220 - - 260,220 * 401-439 West Burnside St-Grove Hotel 1,100,000 - (440,000) 660,000
** WIP Postal Site 2,116,349 - - 2,116,349
Total 17,210,597 7,288 (510,597) 16,707,288
South Park Blocks Urban Renewal Fund:* 5th & SW Montgomery St-PSU Carpool Lot 2,700,000 8,560 - 2,708,560 * 401 SW Harrison St-Jasmine Tree 1,106,623 48,299 - 1,154,922
Total 3,806,623 56,859 - 3,863,482
Convention Center Urban Renewal Fund:* 5001 NE MLK Blvd-Living Color Site 815,321 - (815,321) - * NE Hol/MLK Blvd-Christie-Block 47 455,843 - - 455,843 * 1st/Multnomah /2nd/Holladay Sts-Block 49 1,747,754 - - 1,747,754 * 420 Holladay St-Inn @ Convention Center 5,493,803 - - 5,493,803 * 831-834 NE MLK Blvd-Sizzler Site 2,779,188 4,998 - 2,784,186 * 5029 NW MLK Blvd-Walnut Park Theater 362,582 - (362,582) - * 5125-5131 NE MLK Blvd-Wirf Sites 933,183 - (933,183) - * 84 NE Weidler St-B & K Site 876,128 - - 876,128 * 910 NE MLK-Menashe Site 4,547,284 - (2,627,284) 1,920,000 * 3620 NE MLK Blvd-Parking Lot 61,888 - (61,888) -
Total 18,072,974 4,998 (4,800,258) 13,277,714
PORTLAND DEVELOPMENT COMMISSION
A COMPONENT UNIT OF THE CITY OF PORTLAND, OREGON
SCHEDULE OF ACTIVITY OF REAL PROPERTY
HELD BY THE COMMISSION
For The Fiscal Year Ended June 30, 2012
103

Funding Source
Balance
July 1, 2011 Additions
Sales/
Adjustment
Balance
June 30, 2012
PORTLAND DEVELOPMENT COMMISSION
A COMPONENT UNIT OF THE CITY OF PORTLAND, OREGON
SCHEDULE OF ACTIVITY OF REAL PROPERTY
HELD BY THE COMMISSION
For The Fiscal Year Ended June 30, 2012
Central Eastside Urban Renewal Fund:* 240 NE MLK Blvd 152,397 2 - 152,399 * 11 NE MLK Blvd-Unocal Site 574,950 - - 574,950 * 313 E Burnside St-Recovery Inn-Block 76 566,422 - - 566,422 * 5-13 NE 3rd Ave-Block 67 312,728 - - 312,728 * 1401 SE Water Ave-OMSI Crescent Site 450,000 - (450,000) - * 318 NE Couch St-Fischels Site 534,525 - - 534,525 * 123 NE 3rd Ave-Convention Center Plaza 10,085,780 - - 10,085,780 * 111 NE MLK Blvd-Block 75 1,302,599 - - 1,302,599
Total 13,979,401 2 (450,000) 13,529,403
Lents Town Center Urban Renewal Fund:* 9316 SE Woodstock Blvd-Glendville 123,278 - - 123,278 * 9330 SE Harold St-Boys and Girls Club 1,241,745 78,448 - 1,320,193 * 6116 SE 93rd-Davis Property 103,975 - - 103,975 * 5728 SE 91St & 5808 SE 91St-Rssn Ch & Hse 337,000 - - 337,000 * 9117-9123 SE Foster Rd 116,300 54,385 - 170,685 * 5916 SE 91st Ave 770,267 17,749 - 788,016 * 5933 SE 92nd Ave Lot 3-5 1,076,019 - - 1,076,019 * 9231 SE Foster Rd 1,278,977 - - 1,278,977 * 5716 SE 92nd Ave 2,151,149 - - 2,151,149 * 8801 SE Foster Rd 399,148 - (219,148) 180,000 * 9320 SE Ramona St 253,255 - (132,285) 120,970 * SE Foster Rd Lents Town Center II 372,966 - - 372,966 * 7104-7120, 7126-7130, 7238 SE Foster Rd 1,380,111 - - 1,380,111 * SE Reedway St 100,830 10,161 - 110,991
Total 9,705,020 160,743 (351,433) 9,514,330
Interstate Corridor Urban Renewal Fund:* 5001 NE MLK Blvd-Living Color Site - 815,321 - 815,321 * 5029 NW MLK Blvd-Walnut Park Theater - 362,582 - 362,582 * 5125-5131 NE MLK Blvd-Wirf Sites - 933,183 - 933,183 4500 N Albina 6,410 - - 6,410
* 5116 NE Garfield St-Reiss Site 304,110 - - 304,110 * Marco Bldg 260,000 - (260,000) - * 3620 NE MLK Blvd-Parking Lot - 61,888 - 61,888 * 8411 N Denver Ave 1,034,719 2,301 - 1,037,020 * 8419 N Denver Ave 245,314 2,301 - 247,615 * 2221 N Argyle St 1,031,795 2,300 - 1,034,095 * 2221 N Argyle St 1,428,526 2,300 - 1,430,826 * 6931 NE MLK JR Blvd - 330,000 - 330,000
Total 4,310,874 2,512,176 (260,000) 6,563,050
Gateway Regional Center Urban Renewal Fund:* 10225 NE Burnside St-Childrens Receiving Ctr 794,135 10,493 (804,628) - * 9707 NE Multnomah Blvd-Gateway Transit Ctr 848,094 - - 848,094 * 10520 NE Halsey St 1,152,811 - - 1,152,811 * 10506-10512 NE Halsey St 2,009,041 58,573 - 2,067,614
Total 4,804,081 69,066 (804,628) 4,068,519
Airport Way Urban Renewal Fund:* NE 185th Riverside Parkway-Spada 1,563,627 - - 1,563,627 * Holman St Site 5,000 - - 5,000 * 13328 NE Airport Way-Damonte 140,500 - - 140,500 * 12824 NE Airport Way-Danner South 192,850 - - 192,850 * Cascade Station Lease Rights 10,452,345 (143,183) - 10,309,162
Total 12,354,322 (143,183) - 12,211,139
Total all funds 105,422,355 8,922,511$ (11,515,785)$ 102,829,081
Add: Vehicles and equipment 2,151,111 1,069,547 Leasehold improvements 3,849,501 3,849,501 Software 930,394 2,702,582
** WIP-software 854,362 - Less: Property held for sale (96,613,487) (95,475,590)
Accumulated depreciation-NHFS (6,991,546) (6,036,417)
Total Capital Assets 9,602,690$ 8,938,704$
* Represents property held for sale
** Represents work in process
104

Statistical
Section


STATISTICAL SECTION
This part of PDC’s Comprehensive Annual Financial Report presents detailed information as a context for understanding what the information in the financial statements, note disclosures, and required information says about the Commission’s overall financial health. Contents Page
Financial Trends 106
These schedules contain trend information to help the reader understand how the Commission’s financial performance and well-being have changed over time.
Revenue Capacity 110
These schedules contain information to help the reader assess the Commission’s most significant local revenue source, tax increment debt proceeds (in lieu of tax increment revenue).
Debt Capacity 112
These schedules present information to help the reader assess the affordability of the Commission’s current levels of understanding debt and it’s ability to issue additional debt in the future.
Demographics and Economic Information 128
These schedules offer demographic and economic indicators to help the reader understand the environment within which the Commission’s financial activities take place.
Operating Information 130
These schedules contain service data to help the reader understand how the information in the Commission’s financial report relates to the services the Commission provides and the activities it performs.
105
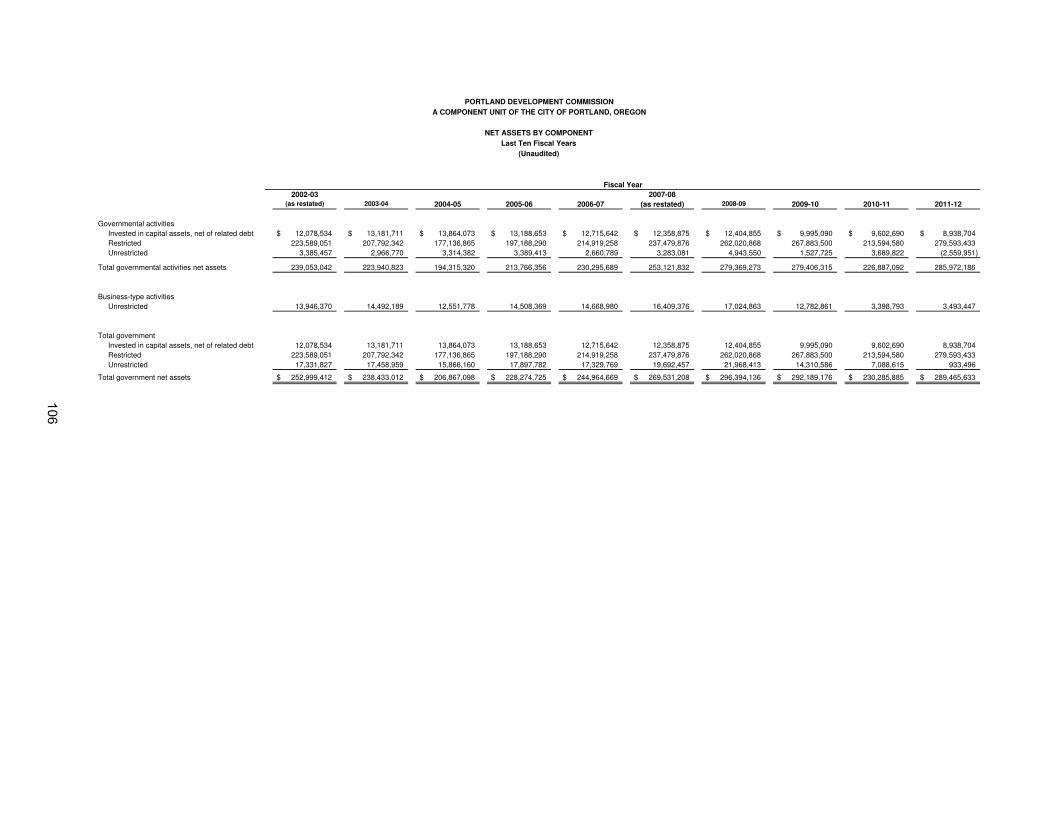
2002-03 2007-08(as restated) 2003-04 2004-05 2005-06 2006-07 (as restated) 2008-09 2009-10 2010-11 2011-12
Governmental activities
Invested in capital assets, net of related debt 12,078,534$ 13,181,711$ 13,864,073$ 13,188,653$ 12,715,642$ 12,358,875$ 12,404,855$ 9,995,090$ 9,602,690$ 8,938,704$
Restricted 223,589,051 207,792,342 177,136,865 197,188,290 214,919,258 237,479,876 262,020,868 267,883,500 213,594,580 279,593,433
Unrestricted 3,385,457 2,966,770 3,314,382 3,389,413 2,660,789 3,283,081 4,943,550 1,527,725 3,689,822 (2,559,951)
Total governmental activities net assets 239,053,042 223,940,823 194,315,320 213,766,356 230,295,689 253,121,832 279,369,273 279,406,315 226,887,092 285,972,186
Business-type activities
Unrestricted 13,946,370 14,492,189 12,551,778 14,508,369 14,668,980 16,409,376 17,024,863 12,782,861 3,398,793 3,493,447
Total government
Invested in capital assets, net of related debt 12,078,534 13,181,711 13,864,073 13,188,653 12,715,642 12,358,875 12,404,855 9,995,090 9,602,690 8,938,704
Restricted 223,589,051 207,792,342 177,136,865 197,188,290 214,919,258 237,479,876 262,020,868 267,883,500 213,594,580 279,593,433
Unrestricted 17,331,827 17,458,959 15,866,160 17,897,782 17,329,769 19,692,457 21,968,413 14,310,586 7,088,615 933,496
Total government net assets 252,999,412$ 238,433,012$ 206,867,098$ 228,274,725$ 244,964,669$ 269,531,208$ 296,394,136$ 292,189,176$ 230,285,885$ 289,465,633$
(Unaudited)
Fiscal Year
PORTLAND DEVELOPMENT COMMISSION
A COMPONENT UNIT OF THE CITY OF PORTLAND, OREGON
NET ASSETS BY COMPONENT
Last Ten Fiscal Years
106

2002-03 2007-08(as restated) 2003-04 2004-05 2005-06 2006-07 (as restated) 2008-09 2009-10 2010-11 2011-12
Expenses
Governmental activities:
Community development 58,007,849$ 75,311,799$ 99,462,500$ 100,446,658$ 116,101,082$ 105,412,401$ 103,984,411$ 130,439,659$ 156,412,909$ 99,713,038$
Enterprise loans 10,510,950 866,407 5,010,245 1,239,307 2,322,045 8,105,250 9,936,353 10,450,636 10,621,790 375,805
Enterprise management - - - - - - - 1,112,560 985,671 1,015,468
Total expenses 68,518,799 76,178,206 104,472,745 101,685,965 118,423,127 113,517,651 113,920,764 142,002,855 168,020,370 101,104,311
Program Revenues
Governmental activities:
Charges for services 6,312,913 5,101,044 6,957,708 9,142,846 5,692,711 5,322,051 4,609,577 5,423,765 3,984,188 3,291,192
Operating grants and contributions 4,698,443 9,935,888 14,481,639 16,386,221 8,669,663 12,007,140 9,537,786 17,538,107 7,262,870 7,170,821
Total governmental activities program revenues 11,011,356 15,036,932 21,439,347 25,529,067 14,362,374 17,329,191 14,147,363 22,961,872 11,247,058 10,462,013
Business-type activities:
Charges for services 2,101,629 1,350,925 2,999,021 2,676,027 2,037,570 3,211,791 3,643,684 2,299,955 2,058,945 1,218,447
Operating grants and contributions - - - - 138,814 6,365,519 6,840,790 6,747,695 200,092 200,000
Total business-type activities program revenues 2,101,629 1,350,925 2,999,021 2,676,027 2,176,384 9,577,310 10,484,474 9,047,650 2,259,037 1,418,447
Total revenues 13,112,985 16,387,857 24,438,368 28,205,094 16,538,758 26,906,501 24,631,837 32,009,522 13,506,095 11,880,460
Net (expense)/revenue:
Governmental activities (46,996,493) (60,274,867) (78,023,153) (74,917,591) (101,738,708) (88,083,210) (89,837,048) (107,477,787) (145,165,851) (89,251,025)
Business-type activities 2,101,629 1,350,925 2,999,021 2,676,027 2,176,384 9,577,310 10,484,474 (2,515,546) (9,348,424) 27,174
Total net expenses (44,894,864) (58,923,942) (75,024,132) (72,241,564) (99,562,324) (78,505,900) (79,352,574) (109,993,333) (154,514,275) (89,223,851)
General Revenues and Other Changes in Net Assets
Governmental activities:
Tax-increment debt proceeds
(in lieu of tax-increment revenue) 64,390,903 (1)
36,906,756 43,671,683 82,974,088 (2)
91,878,764 (2)
105,929,455 105,254,573 89,778,162 85,287,185 133,787,307
Unrestricted investment income 2,441,664 1,473,943 2,009,751 2,890,426 3,491,587 2,489,775 2,872,087 1,190,507 664,618 525,565
Miscellaneous 2,941,489 6,768,486 2,707,265 8,911,725 8,458,224 2,627,865 7,920,829 14,769,846 6,644,825 14,083,247
Special Item - Cascade Station lease rights - - - - 14,550,302 - - - - -
Transfers 433,570 13,463 8,951 (407,612) (110,836) (137,742) 37,000 1,776,314 50,000 (60,000)
Total governmental activities 70,207,626 45,162,648 48,397,650 94,368,627 118,268,041 110,909,353 116,084,489 107,514,829 92,646,628 148,336,119
Business-type activities:
Unrestricted investment income 156,279 74,764 79,764 112,259 195,423 130,594 74,339 49,858 14,356 7,480
Miscellaneous (433,570) - - - - - 30,027 - - -
Transfers - (13,463) (8,951) 407,612 110,836 137,742 (37,000) (1,776,314) (50,000) 60,000
Total business-type activities (277,291) 61,301 70,813 519,871 306,259 268,336 67,366 (1,726,456) (35,644) 67,480
Total 69,930,335 45,223,949 48,468,463 94,888,498 118,574,300 111,177,689 116,151,855 105,788,373 92,610,984 148,403,599
Changes in Net Assets
Governmental activities 23,211,133 (15,112,219) (29,625,503) 19,451,036 16,529,333 22,826,143 26,247,441 37,042 (52,519,223) 59,085,094
Business-type activities (8,686,612) 545,819 (1,940,411) 1,956,591 160,598 1,740,396 10,551,840 (4,242,002) (9,384,068) 94,654
Total 14,524,521$ (14,566,400)$ (31,565,914)$ 21,407,627$ 16,689,931$ 24,566,539$ 36,799,281$ (4,204,960)$ (61,903,291)$ 59,179,748$
(1) Increase is due to bonds issued for River District urban renewal area.
(2) Increase is due to City of Portland Line of Credit reimbursements received for capital outlay.
Last Ten Fiscal Years
(Unaudited)
Business-type activities:
Fiscal Year
PORTLAND DEVELOPMENT COMMISSION
A COMPONENT UNIT OF THE CITY OF PORTLAND, OREGON
CHANGES IN NET ASSETS
107

2002-03 2007-08(as restated) 2003-04 2004-05 2005-06 2006-07 (as restated) 2008-09 2009-10 2010-11 2011-12
General Fund
Non-spendable 3,129,527$ 2,707,267$ 2,452,654$ 1,444,428$ 476,064$ 466,175$ 569,765$ 673,358$ 1,042,036$ 1,028,551$
Assigned - - - - - - - 3,069,788 2,397,106
Unassigned - - 701,254 1,471,055 1,788,615 2,789,504 4,391,564 4,632,922 1,010,040 687,937
Total general fund 3,129,527$ 2,707,267$ 3,153,908$ 2,915,483$ 2,264,679$ 3,255,679$ 4,961,329$ 5,306,280$ 5,121,864$ 4,113,594$
All other governmental funds
Reserved 129,823,503$ 125,008,341$ 113,678,934$ 127,770,229$ 165,555,407$ 174,306,280$ 182,333,262$ 187,587,202$ -$ -$
Unreserved, report in:
Special revenue funds 1,360,203 935,674 1,048,085 734,202 928,313 747,264 371,923 1,070,851 - -
Capital projects funds 92,405,345 82,491,391 62,649,846 68,683,859 48,435,539 70,007,265 88,815,802 84,843,645 - -
Restricted
Special revenue funds - - - - - - - - 3,583,005 7,492
Capital projects funds - - - - - - - - 216,899,188 284,724,254
Total all other government funds 223,589,051$ 208,435,406$ 177,376,865$ 197,188,290$ 214,919,259$ 245,060,809$ 271,520,987$ 273,501,698$ 220,482,193$ 284,731,746$
(Unaudited)
Fiscal Year
PORTLAND DEVELOPMENT COMMISSION
A COMPONENT UNIT OF THE CITY OF PORTLAND, OREGON
FUND BALANCES OF GOVERNMENTAL FUNDS
Last Ten Fiscal Years
108

2002-03 2007-08(as restated) 2003-04 2004-05 2005-06 2006-07 (as restated) 2008-09 2009-10 2010-11 2011-12
Revenues
Intergovernmental revenues 4,698,443$ 9,935,888$ 14,481,639$ 16,386,221$ 8,669,663$ 12,007,140$ 9,537,786$ 17,538,107$ 7,262,870$ 7,170,821$
Charges for services 1,770,616 1,517,374 3,064,571 3,304,810 2,153,263 2,206,948 1,525,351 1,914,924 1,764,096 1,658,729
Loan collections 4,542,297 4,226,734 3,893,137 5,838,036 3,539,448 3,115,103 3,084,226 3,508,841 1,010,555 1,238,233
Interest on investments 2,436,580 1,470,370 2,004,595 2,881,904 3,468,091 2,471,816 2,861,153 1,186,801 662,945 523,907
Miscellaneous 2,941,489 6,768,486 2,707,265 8,911,725 8,458,224 2,627,865 7,920,829 14,100,415 6,644,825 14,083,247
Tax-increment debt proceeds
(in lieu of tax-increment revenue) 64,390,903 36,906,756 43,671,683 82,974,088 91,878,764 (2)
105,929,455 (3)
105,254,573 89,778,162 85,287,185 133,787,307
Total revenues 80,780,328 60,825,608 69,822,890 120,296,784 118,167,453 128,358,327 130,183,918 128,027,250 102,632,476 158,462,244
Expenditures
Community development 24,143,208 26,242,691 32,096,129 29,618,462 63,600,425 38,092,378 37,508,986 42,361,435 63,899,297 61,122,362
Capital outlay 15,288,758 13,492,269 30,724,590 42,727,841 17,090,870 25,019,143 36,518,711 35,237,650 45,311,997 17,166,817
Financial assistance 18,274,514 36,677,660 37,608,692 27,663,186 34,835,459 33,887,263 28,597,158 49,840,026 45,947,640 16,871,782
Debt service -
Interest - 2,356 14,330 - - 89,250 - 38,927 727,463 -
Total expenditures 57,706,480 76,414,976 100,443,741 100,009,489 115,526,754 97,088,034 102,624,855 127,478,038 155,886,397 95,160,961
Excess of revenues
over (under) expenditures 23,073,848 (15,589,368) (30,620,851) 20,287,295 2,640,699 31,270,293 27,559,063 549,212 (53,253,921) 63,301,283
Other financing sources (uses)
Internal service reimbursements - - - - - - - 569,901 - -
Transfers in 727,944 491,511 804,960 3,971,121 1,937,319 4,581,453 19,923,389 16,001,799 50,000 (4)
135,000
Transfers out (294,374) (478,048) (796,009) (4,685,416) (2,048,155) (4,719,195) (19,886,389) (14,225,485) - (4)
(195,000)
Total other financing sources (uses) 433,570 13,463 8,951 (714,295) (110,836) (137,742) 37,000 2,346,215 50,000 (60,000)
Special Item - Cascade Station lease rights - - - - 14,550,302 - - - - -
Net change in fund balances 23,507,418$ (15,575,905)$ (30,611,900)$ 19,573,000$ 17,080,165$ 31,132,551$ 27,596,063$ 2,895,427$ (53,203,921)$ 63,241,283$
(1) Increase is due to bonds issued for River District urban renewal area.
(2) Increase is due to City of Portland Line of Credit reimbursements received for capital outlay.
(3) Increase is due to issuance of bonds for Downtown Waterfront urban renewal area
(4) Decrease in transfers is due to the elimination of major federal grant programs and related required transfers with the transition of housing to the Portland Housing Bureau.
(Unaudited)
Fiscal Year
PORTLAND DEVELOPMENT COMMISSION
A COMPONENT UNIT OF THE CITY OF PORTLAND, OREGON
CHANGES IN FUND BALANCES OF GOVERNMENTAL FUNDS
Last Ten Fiscal Years
109

Tax-increment
Debt Proceeds
Inter- Charges (in lieu of
Fiscal Governmental for Loan Investment Service tax-increment
Year Revenues Services Collections (1)
Income Miscellaneous Reimbursements revenue) (2)
Total
2002-03 5,328,175$ 2,236,099$ 14,430,643$ 2,597,430$ 6,923,527$ 11,305,170$ 64,390,903$ 107,211,947$ (3)
2003-04 13,423,445 1,629,205 14,728,499 1,547,852 16,865,270 14,617,997 36,906,756 99,719,024(4)
2004-05 15,614,350 3,128,250 13,857,498 2,088,352 4,769,740 22,238,125 43,671,683 105,367,998(5)
2005-06 16,386,221 3,470,247 25,053,209 2,993,474 5,006,640 23,126,825 82,974,088 159,010,704(6)
2006-07 8,808,477 2,471,383 14,432,249 3,678,696 8,088,537 26,533,745 91,878,764 155,891,851
2007-08 18,372,659 3,369,928 16,939,460 2,648,707 5,748,141 29,660,046 105,929,455 182,668,396(7)
2008-09 16,378,576 1,695,463 20,243,983 2,976,453 6,881,900 32,987,672 105,254,573 186,418,620
2009-10 24,285,794 3,051,256 19,965,068 1,236,665 9,968,223 - 89,778,162 148,285,168 (8)
2010-11 4,159,959 2,574,277 4,321,335 678,974 11,124,848 - 85,287,185 108,146,578
2011-12 7,370,821 2,636,662 5,398,916 533,046 7,038,089 - 133,787,307 156,764,841
Source: Portland Development Commission records on a budgetary basis for all funds.
(1) Interest earned on loans is included in Loan Collections.
(2) Through fiscal year 1996-97, transfers from City of Portland Debt Service Funds were included in Miscellaneous. Beginning with
with fiscal year 1997-98, transfers from City of Portland Debt Service Funds are included in tax-increment Debt Proceeds (in lieu of tax
increment revenue).
(3) Increase is due to bonds issued for River District urban renewal area and for overhead charges budgeted as service reimbursements.
In prior years, Service Reimbursements were budgeted as Interfund Transfers.
(4) Increase in Home and CDBG grant revenues and revenues received from the sale of property held for sale has increased the intergovern-
mental and miscellaneous revenues. No bonds were issued during the fiscal year, thereby the reduction of the tax-increment debt proceeds.
(5) Increase in Service Reimbursements is due to the change in methodology of Personal Services beginning Fiscal Year 2004-05. In prior
years Personal Services were expended directly to individual funds.
(6) Increase in tax-increment Debt Proceeds was due to City of Portland Line of Credit reimbursements for Capital Outlay.
(7) Increase was due to bonds issued for Downtown Waterfront urban renewal area.
(8) Internal service reimbursements were reclassified to a transfer.
(Unaudited)
PORTLAND DEVELOPMENT COMMISSION
A COMPONENT UNIT OF THE CITY OF PORTLAND, OREGON
GENERAL GOVERNMENT REVENUESFor The Last Ten Fiscal Years
110

Fiscal Personal Materials Capital Financial Debt
Year Services and Services Outlay Assistance Service Total
2002-03 12,797,482$ 22,306,881$ (1) 26,293,552$ 27,808,001$ 2,867,083$ 92,072,999$
2003-04 15,089,965 25,926,709 37,335,990 (2) 43,957,311 (2) 2,738,977 125,048,952
2004-05 20,501,767 31,805,745 35,920,409 50,698,697 3,299,652 142,226,270
2005-06 22,373,756 27,902,737 61,417,936 (3) 51,208,537 1,522,868 164,425,834
2006-07 24,601,713 63,212,456 (4) 26,616,600 57,005,317 1,062,549 172,498,635
2007-08 27,904,908 40,464,287 40,139,330 49,894,489 2,868,011 161,271,025
2008-09 28,520,035 42,124,266 35,660,038 52,267,819 8,315,206 166,887,364
2009-10 22,175,426 22,981,345 (5) 36,771,943 66,245,765 8,467,384 156,641,863
2010-11 17,904,488 49,598,814 (6) 27,269,642 32,918,717 3,016,545 130,708,206
2011-12 15,440,575 52,000,490 14,186,295 12,576,846 - 94,204,206
Source: Portland Development Commission records on a budgetary basis for all funds.
(1) In fiscal year 2002-03, due to a change in Budget presentation, Service Reimbursements were budgeted
as Materials and Services. In prior years, they were budgeted as Interfund Transfers.
(2) Increase due to the acquisition of $16.6 million in property held for sale in the River District Urban Renewal Area.
(3) Increase due to added infrastucture and transportation in the Gateway and Lents Urban Renewal Areas and the
acquistition of the Headquarters Hotel property held for sale in the Convention Center Urban Renewal Area.
(4) Increase is due to added infrastructure and transportation for the Light Rail Expansion, Portland Aerial Tram,
and the Portland Streetcar.
(5) Decrease due to reclass of internal service charges being classified as interfund transfer.
(6) Increase due principally to reimbursement payments to Portland Housing Bureau
(Unaudited)
PORTLAND DEVELOPMENT COMMISSION
A COMPONENT UNIT OF THE CITY OF PORTLAND, OREGON
GENERAL GOVERNMENT EXPENDITURESFor The Last Ten Fiscal Years
111

2002-03 5.2719$ 8.1893$ 0.0701$ 0.2900$ 0.1080$ 0.4576$ 14.3869$ 0.4039$
2003-04 5.2785 7.9791 0.0701 0.2838 0.1104 0.4576 14.1795 0.3897
2004-05 5.3065 7.9181 0.0701 0.2841 0.1191 0.4576 14.1555 0.3754
2005-06 5.2949 7.8128 0.0701 0.2782 0.0973 0.4576 14.0109 0.3588
2006-07 5.4171 7.9024 0.0701 0.4289 0.0856 0.4576 14.3617 0.4250
2007-08 5.3936 7.3924 0.0701 0.3984 0.0803 0.4576 13.7924 0.3235
2008-09 5.4026 7.8235 0.0701 0.4368 0.0863 0.4576 14.2769 0.3100
2009-10 5.4026 7.8235 0.0701 0.4368 0.0863 0.4576 14.2769 0.3100
2010-11 5.3846 7.8077 0.0701 0.4088 0.0878 0.4576 14.2166 0.3009
2011-12 5.4403 7.9806 0.0701 0.3154 0.0583 0.4576 14.3223 0.2926
Tax rates are expressed in terms of dollars and cents per $1,000 of assessed value. Multnomah County collects all
property taxes and distributes the taxes collected to each taxing district at least monthly. No charges are made to
the taxing districts for these services. The sequestered tax increment revenue property taxes are recorded in the
debt service funds of the City of Portland and are disclosed in the City's annual financial report.
(1) Special levy applied only to Option 3 urban renewal areas: Oregon Convention Center, South Park Blocks,
Downtown Waterfront, and Airport Way.
(2) Applies to all areas except Gateway Regional Center Urban Renewal Area with the exception of a small
number of properties.
(3) Applies to Gateway Regional Center and Airport Way urban renewal areas
(4) Applies only to the Airport Way Urban Renewal Area.
(5) Applies to the following urban renewal areas: Lents Town Center, Gateway Regional Center, Interstate
Corridor, Willamette Industrial, Airport Way, Oregon Convention Center, and Central Eastside
(6) Applies to the following urban renewal areas: River District, North Macadam, South Park Blocks, and
Downtown Waterfront.
(7) Applies to the Lents Town Center, Gateway Regional Center, and Airport Way urban renewal areas.
(8) Applies to Lents Town Center, and Gateway Regional Center urban renewal areas.
Source: Multnomah County Tax Supervising and Conservation Commission Annual Reports.
Fiscal
Year
PORTLAND DEVELOPMENT COMMISSION
A COMPONENT UNIT OF THE CITY OF PORTLAND, OREGON
URBAN RENEWAL AREA CONSOLIDATED TAX RATES
For The Last Ten Fiscal Years
(Unaudited)
Districts Common to All Areas
Multnomah
County
City of
Portland
Port of
Portland
Metro
Service
District
Multnomah
County ESD
Tri-County
Metropolitan
Transportation
District
City of
Portland
Urban
Renewal (1)
Subtotal
112

7.1160$ 6.9056$ 6.0259$ 6.6373$ -$ -$ 0.5118$ 0.5137$
7.1792 6.6952 6.0431 6.5923 - - 0.5099 0.4981
4.7743 6.3294 6.0151 6.5495 0.0413 - 0.4950 0.4917
5.2781 6.2635 5.9497 6.8335 0.0326 - 0.4889 0.4917
6.5281 5.9247 5.8339 6.8590 0.0715 0.0378 0.5051 0.4917
6.5281 5.8887 5.8147 6.8731 0.0877 0.0369 0.5031 0.4917
6.5281 6.1391 5.6033 6.5048 0.1000 0.0391 0.6325 0.4917
6.5281 6.1391 5.6033 6.5048 0.1000 0.0391 0.6325 0.4917
6.5281 6.0049 5.5958 6.4276 0.1000 0.0469 0.6359 0.4917
7.2681 5.8923 5.7789 6.3955 0.1000 0.0732 0.5981 0.4917
East
Multnomah
County Soil
& Water
Conservation
District (5)
West
Multnomah
County Soil &
Water
Conservation
District (6)
Portland
Community
College (2)
Mt. Hood
Community
College (7)
Portland
Public School
District #1 (2)
Parkrose
School
District #3 (3)
David
Douglas
School
District #40 (8)
Reynolds
School
District #7 (4)
113

2005
Series A & B
2000
Series A & B
2008
Series A & B
2011
Series A & B
2004
Series A
2011
Series A & B
2011
Series A
2012-13 3,815,000$ 3,525,000$ 1,870,000$ 175,000$ 1,380,000$ 1,515,000$ 4,125,000$
2013-14 4,010,000 - 1,960,000 3,845,000 1,435,000 1,555,000 3,260,000
2014-15 4,210,000 - 2,050,000 3,970,000 1,490,000 1,600,000 3,785,000
2015-16 4,420,000 - 2,160,000 4,090,000 1,550,000 1,655,000 3,935,000
2016-17 4,640,000 - 2,275,000 4,255,000 1,625,000 1,715,000 4,130,000
2017-18 4,875,000 - 2,390,000 4,430,000 1,710,000 1,790,000 4,335,000
2018-19 5,120,000 - 2,520,000 4,645,000 1,800,000 1,875,000 4,550,000
2019-20 5,375,000 - 2,680,000 4,880,000 1,890,000 1,965,000 4,780,000
2020-21 - - 5,415,000 - 1,990,000 2,065,000 -
2021-22 - - 5,760,000 - 2,095,000 2,175,000 -
2022-23 - - 6,120,000 - 2,190,000 2,315,000 -
2023-24 - - 7,000,000 - 2,295,000 2,460,000 -
2024-25 - - - - 2,410,000 2,615,000 -
2025-26 - - - - - 2,780,000 -
2026-27 - - - - - 2,940,000 -
2027-28 - - - - - 3,085,000 -
2028-29 - - - - - 3,230,000 -
2029-30 - - - - - 3,390,000 -
2030-31 - - - - - 3,560,000 -
2031-32 - - - - - - -
Total 36,465,000$ 3,525,000$ 42,200,000$ 30,290,000$ 23,860,000$ 44,285,000$ 32,900,000$
Source: Amortization schedule for each bond.
Note 1: Bonds are debt of the City of Portland and are disclosed in the City's Comprehensive Annual Financial Report.
This information is included in this report to assist the reader in determining future financing capacity.
PORTLAND DEVELOPMENT COMMISSION
A COMPONENT UNIT OF THE CITY OF PORTLAND, OREGON
URBAN RENEWAL AND REDEVELOPMENT BONDS
FUTURE BOND PRINCIPAL REQUIREMENTS
As of June 30, 2012
(Unaudited)
Convention
Center Urban
Renewal BondsFiscal Year
Interstate
Corridor Urban
Renewal Bonds
Airport Way
Urban Renewal
Bonds
Downtown
Waterfront
Urban Renewal
Bonds
Downtown
Waterfront
Urban Renewal
Bonds
Downtown
Waterfront
Urban
Renewal
Bonds
Interstate
Corridor Urban
Renewal Bonds
114

2012
Series A
2003
Series B
2012
Series A, B & C
2008
Series A & B
2011
Series A
2010
Series A & B
2011
Series A & B
2010
Series A & B
-$ 2,855,000$ 1,480,000$ 3,485,000$ 210,000$ 1,190,000$ 985,000$ 2,220,000$
- 2,970,000 1,460,000 4,015,000 - 1,235,000 1,015,000 2,290,000
- 655,000 3,920,000 4,250,000 - 1,290,000 1,050,000 2,370,000
- - 4,700,000 4,510,000 - 1,350,000 1,095,000 2,465,000
- - 4,865,000 4,780,000 - 1,425,000 1,145,000 2,600,000
- - 5,070,000 5,070,000 - 1,510,000 1,205,000 2,740,000
- - 5,290,000 8,690,000 - 1,595,000 1,270,000 2,885,000
500,000 - 5,490,000 5,845,000 - 1,690,000 1,345,000 3,040,000
14,075,000 - 5,735,000 4,060,000 - 1,785,000 1,425,000 3,205,000
14,600,000 - 5,965,000 4,265,000 - 1,900,000 1,490,000 3,380,000
15,165,000 - 6,235,000 4,480,000 - 2,015,000 1,555,000 3,525,000
15,775,000 - 2,165,000 8,040,000 - 2,145,000 1,625,000 3,655,000
9,645,000 - 2,255,000 - - 2,275,000 1,700,000 3,840,000
- - 2,350,000 - - 2,390,000 1,780,000 3,995,000
- - 2,465,000 - - 2,500,000 1,870,000 4,150,000
- - 2,570,000 - - 2,625,000 1,960,000 4,320,000
- - 2,700,000 - - 2,755,000 2,060,000 4,500,000
- - 2,835,000 - - 2,885,000 2,165,000 4,725,000
- - 2,985,000 - - - 2,280,000 -
- - 3,130,000 - - - - -
69,760,000$ 6,480,000$ 73,665,000$ 61,490,000$ 210,000$ 34,560,000$ 29,020,000$ 59,905,000$
North Macadam
Urban Renewal
Bonds
Convention
Center Urban
Renewal Bonds
River District
Urban Renewal
Bonds
South
ParkBlocks
Urban Renewal
Bonds
Lents Town
Center Urban
Renewal Bonds
South
ParkBlocks
Urban Renewal
Bonds
River District
Urban Renewal
Bonds
Central
Eastside Urban
Renewal Bonds
115

2005
Series A & B
2000
Series A & B
2008
Series A & B
2011
Series A & B
2004
Series A
2011
Series A & B
2011
Series A
2012-13 1,769,500$ 255,915$ 2,508,928$ 1,258,000$ 1,155,331$ 2,222,859$ 1,466,115$
2013-14 1,578,750 - 2,421,599 1,254,500 1,100,131 2,184,560 1,368,300
2014-15 1,378,250 - 2,324,383 1,139,150 1,042,731 2,138,610 1,237,900
2015-16 1,167,750 - 2,219,628 1,020,050 983,131 2,085,282 1,086,500
2016-17 946,750 - 2,107,092 856,450 905,631 2,022,673 889,750
2017-18 714,750 - 1,986,289 686,250 824,381 1,948,517 683,250
2018-19 471,000 - 1,858,185 464,750 734,606 1,865,747 466,500
2019-20 215,000 - 1,699,425 232,500 640,106 1,772,484 239,000
2020-21 - - 1,530,585 - 540,881 1,670,815 -
2021-22 - - 1,189,440 - 436,406 1,560,875 -
2022-23 - - 826,560 - 344,750 1,423,980 -
2023-24 - - 441,000 - 235,250 1,278,274 -
2024-25 - - - - 120,500 1,123,442 -
2025-26 - - - - - 958,854 -
2026-27 - - - - - 802,538 -
2027-28 - - - - - 655,538 -
2028-29 - - - - - 509,000 -
2029-30 - - - - - 347,500 -
2030-31 - - - - - 178,000 -
2031-32 - - - - - - -
Total 8,241,750$ 255,915$ 21,113,114$ 6,911,650$ 9,063,838$ 26,749,548$ 7,437,315$
Source: Amortization schedule for each bond.
Note 1: Bonds are debt of the City of Portland and are disclosed in the City's Comprehensive Annual Financial Report.
This information is included in this report to assist the reader in determining future financing capacity.
Interstate
Corridor Urban
Renewal Bonds
Convention
Center Urban
Renewal Bonds
Interstate
Corridor Urban
Renewal Bonds
PORTLAND DEVELOPMENT COMMISSION
A COMPONENT UNIT OF THE CITY OF PORTLAND, OREGON
URBAN RENEWAL AND REDEVELOPMENT BONDS
FUTURE BOND INTEREST REQUIREMENTS
As of June 30, 2012
(Unaudited)
Fiscal Year
Airport Way
Urban Renewal
Bonds
Downtown
Waterfront
Urban Renewal
Bonds
Downtown
Waterfront
Urban Renewal
Bonds
Downtown
Waterfront
Urban
Renewal
Bonds
116

2012
Series A
2003
Series B
2012
Series A, B & C
2008
Series A & B
2011
Series A
2010
Series A & B
2011
Series A & B
2010
Series A & B
3,010,144$ 258,165$ 2,845,888$ 3,353,565$ 4,620$ 1,838,784$ 1,418,815$ 2,744,770$
2,792,917 146,249 3,039,723 3,169,835 - 1,793,850 1,388,693 2,673,730
2,792,917 26,855 3,016,144 2,927,691 - 1,741,326 1,351,828 2,591,061
2,792,917 - 2,916,278 2,671,373 - 1,682,592 1,308,253 2,497,209
2,792,917 - 2,751,983 2,399,375 - 1,604,508 1,257,883 2,364,740
2,792,917 - 2,546,720 2,111,093 - 1,522,086 1,199,660 2,225,016
2,792,917 - 2,325,793 1,805,322 - 1,434,747 1,132,963 2,077,769
2,792,917 - 2,125,132 1,334,500 - 1,342,493 1,059,989 1,922,729
2,774,802 - 1,878,047 1,042,250 - 1,244,743 978,671 1,759,359
2,250,790 - 1,653,858 839,250 - 1,132,574 912,125 1,580,712
1,685,332 - 1,380,069 626,000 - 1,013,178 848,800 1,439,188
1,075,244 - 1,089,535 402,000 - 886,555 780,769 1,307,000
416,953 - 1,000,121 - - 756,238 705,613 1,124,250
- - 903,607 - - 642,488 624,863 970,650
- - 788,700 - - 527,738 535,863 810,850
- - 677,950 - - 402,738 442,363 644,850
- - 549,450 - - 275,113 344,363 461,250
- - 414,450 - - 144,250 236,213 236,250
- - 272,700 - - - 122,550 -
- - 125,200 - - - - -
30,763,687$ 431,269$ 32,301,348$ 22,682,254$ 4,620$ 19,986,001$ 16,650,275$ 29,431,383$
South
ParkBlocks
Urban Renewal
Bonds
Lents Town
Center Urban
Renewal Bonds
Central
Eastside Urban
Renewal Bonds
North Macadam
Urban Renewal
Bonds
Convention
Center Urban
Renewal Bonds
River District
Urban Renewal
Bonds
River District
Urban Renewal
Bonds
South
ParkBlocks
Urban Renewal
Bonds
117


Tax Revenue for
Increased Urban Renewal
Tax Year Tax Rate (1)
Base Value Value Debt (1)
2002-03 $ 19.71 $ 358,684,364 $ 360,419,813 $ 7,103,606
2003-04 20.36 358,684,364 460,215,910 9,369,834
2004-05 20.45 358,684,364 532,780,808 10,893,010
2005-06 18.50 358,684,364 744,785,705 13,775,847
2006-07 18.96 358,684,364 940,187,466 17,822,132
2007 08 20 43 358 684 364 991 749 182 20 265 457
PORTLAND DEVELOPMENT COMMISSION
A COMPONENT UNIT OF THE CITY OF PORTLAND, OREGON
PROPERTY VALUES, TAX INCREMENT, AND PROJECTED DEMOGRAPHICSFor The Last Ten Fiscal Years Or Since Inception
RIVER DISTRICT URBAN RENEWAL FUND
(Unaudited)
0
400,000
800,000
1,200,000
1,600,000
2,000,000
2,400,000 $
Th
ou
sa
nd
s
Tax Year
Property Values
Increased Value
Base Value
2007-08 20.43 358,684,364 991,749,182 20,265,457
2008-09 19.94 358,684,364 1,177,770,363 23,482,535
2009-10 20.38 358,684,364 1,411,486,318 28,760,647
2010-11 20.08 358,684,364 1,488,594,879 29,883,737
2011-12 19.83 461,577,974 1,602,807,681 31,571,279
Source: Multnomah County Division of Assessment and Taxation
URA Portland
Current Projected Current Projected
2010 2015 2010 2015
Population 5,654 6,843 582,051 619,141
Per Capita Income $ 35,636 $ 43,896 $ 29,282 $ 33,577
4,069 5,074 266,332 284,555
1,043 1,323 136,959 145,384
2,454 3,042 110,429 118,355
Source:
(1)
Total Housing Units
Tax rate is the average, imputed tax rate based on Tax Revenue for Urban Renewal Debt (taxes
imposed) and Increased Value.
The 2010/2015 forecasted demographic figures have been derived using ESRI’s
Business Analyst Software. Forecasts are developed by incorporating all the
Census 2010 data as well as using postcensus trends in the population which
are captured from a variety of data sources and applied to the most accurate
update for 2010. This change is then extrapolated five years to 2015. The 2010
update represents current events; the 2015 forecast illustrates the effects of
current events and the expected recovery from the recession. PDC GIS
Renter Occupied Housing
Units
Owner Occupied Housing
Units
118

Tax Revenue for
Increased Urban Renewal
Tax Year Tax Rate (1)
Base Value Value Debt (1)
2002-03 $ 20.70 247,728,838$ 634,324,294$ 5,439,991$
2003-04 21.91 247,728,838 669,453,106 5,304,200
2004-05 21.73 247,728,838 668,865,098 5,348,082
2005-06 19.33 248,214,131 701,773,824 5,441,875
2006-07 19.68 248,689,281 725,955,191 5,475,275
2007 08 21 30 248 689 281 751 940 292 5 438 655
PORTLAND DEVELOPMENT COMMISSION
(Unaudited)
A COMPONENT UNIT OF THE CITY OF PORTLAND, OREGON
CONVENTION CENTER URBAN RENEWAL FUND
PROPERTY VALUES, TAX INCREMENT, AND PROJECTED DEMOGRAPHICSFor The Last Ten Fiscal Years Or Since Inception
0
200,000
400,000
600,000
800,000
1,000,000
1,200,000 $
Th
ou
sa
nd
s
Tax Year
Property Values
Increased Value
Base Value
2007-08 21.30 248,689,281 751,940,292 5,438,655
2008-09 20.76 248,689,281 824,599,717 5,454,893
2009-10 21.41 248,951,143 804,685,182 5,419,374
2010-11 21.31 248,951,143 822,947,836 5,346,748
2011-12 21.79 248,951,143 852,646,229 5,141,484
Source: Multnomah County Division of Assessment and Taxation
URA Portland
Current Projected Current Projected
2010 2015 2010 2015
Population 1,366 1,515 582,051 619,141
Per Capita Income $ 35,300 $ 41,436 $ 29,282 $ 33,577
1,140 1,264 266,332 284,555
212 236 136,959 145,384
733 814 110,429 118,355
Source:
(1) Tax rate is the average, imputed tax rate based on Tax Revenue for Urban Renewal Debt (taxes
imposed) and Increased Value.
The 2010/2015 forecasted demographic figures have been derived using ESRI’s
Business Analyst Software. Forecasts are developed by incorporating all the
Census 2010 data as well as using postcensus trends in the population which are
captured from a variety of data sources and applied to the most accurate update
for 2010. This change is then extrapolated five years to 2015. The 2010 update
represents current events; the 2015 forecast illustrates the effects of current
events and the expected recovery from the recession. PDC GIS
Total Housing Units
Owner Occupied Housing
Units
Renter Occupied Housing
Units
119

Tax Revenue for
Increased Urban Renewal
Tax Year Tax Rate (1)
Base Value Value Debt (1)
2002-03 $ 20.67 378,055,680$ 502,592,163$ 5,356,909$
2003-04 21.91 378,055,680 508,799,241 5,231,174
2004-05 21.76 378,055,680 540,333,579 5,280,064
2005-06 19.31 378,055,680 540,982,035 5,370,006
2006-07 19.66 378,055,680 566,120,167 5,403,278
2007 08 21 32 378 055 680 700 363 924 5 376 221
PORTLAND DEVELOPMENT COMMISSION
A COMPONENT UNIT OF THE CITY OF PORTLAND, OREGON
SOUTH PARK BLOCKS URBAN RENEWAL FUND
PROPERTY VALUES, TAX INCREMENT, AND PROJECTED DEMOGRAPHICSFor The Last Ten Fiscal Years Or Since Inception
(Unaudited)
0
400,000
800,000
1,200,000
1,600,000
$ T
ho
us
an
ds
Tax Year
Property Values
Increased Value
Base Value
2007-08 21.32 378,055,680 700,363,924 5,376,221
2008-09 20.72 378,055,680 727,733,672 5,381,549
2009-10 21.33 376,066,574 778,265,484 5,341,041
2010-11 21.30 376,066,574 858,446,906 5,281,167
2011-12 21.77 376,066,574 885,549,998 5,072,867
Source: Multnomah County Division of Assessment and Taxation
URA Portland
Current Projected Current Projected
2010 2015 2010 2015
Population 3,005 3,310 582,051 619,141
Per Capita Income $ 18,516 $ 20,948 $ 29,282 $ 33,577
2,318 2,602 266,332 284,555
55 63 136,959 145,384
2,051 2,304 110,429 118,355
Source:
(1)
The 2010/2015 forecasted demographic figures have been derived using ESRI’s
Business Analyst Software. Forecasts are developed by incorporating all the
Census 2010 data as well as using postcensus trends in the population which are
captured from a variety of data sources and applied to the most accurate update
for 2010. This change is then extrapolated five years to 2015. The 2010 update
represents current events; the 2015 forecast illustrates the effects of current
events and the expected recovery from the recession. PDC GIS
Total Housing Units
Owner Occupied Housing
Units
Renter Occupied Housing
Units
Tax rate is the average, imputed tax rate based on Tax Revenue for Urban Renewal Debt (taxes
imposed) and Increased Value.
120

A COMPONENT UNIT OF THE CITY OF PORTLAND, OREGON
DOWNTOWN WATERFRONT URBAN RENEWAL FUND
PROPERTY VALUES, TAX INCREMENT, AND PROJECTED DEMOGRAPHICSFor The Last Ten Fiscal Years Or Since Inception
(Unaudited)
Tax Revenue for
Increased Urban Renewal
Tax Year Tax Rate (1)
Base Value Value Debt (1)
2002-03 $ 20.75 70,866,644$ 759,787,319$ 7,323,468$
2003-04 22.44 70,866,644 772,959,655 7,310,380
2004-05 21.58 70,866,644 807,467,176 7,128,198
2005-06 19.02 70,866,644 828,313,148 7,199,233
2006-07 19.57 70,866,644 854,990,000 7,322,396
2007 08 21 46 70 866 644 881 338 267 7 373 237
PORTLAND DEVELOPMENT COMMISSION
0
200,000
400,000
600,000
800,000
1,000,000
1,200,000 $ T
ho
usan
ds
Tax Year
Property Values
Increased Value
Base Value
2007-08 21.46 70,866,644 881,338,267 7,373,237
2008-09 20.68 70,866,644 893,495,927 7,315,259
2009-10 21.53 55,674,313 850,698,640 7,344,233
2010-11 21.56 55,674,313 863,116,698 7,288,146
2011-12 21.83 55,674,313 910,075,667 6,925,883
Source: Multnomah County Division of Assessment and Taxation
URA Portland
Current Projected Current Projected
2010 2015 2010 2015
Population 3,185 3,722 582,051 619,141
Per Capita Income $ 31,707 $ 39,038 $ 29,282 $ 33,577
2,691 3,225 266,332 284,555
520 649 136,959 145,384
1,718 2,023 110,429 118,355
Source:
(1)
The 2010/2015 forecasted demographic figures have been derived using ESRI’s
Business Analyst Software. Forecasts are developed by incorporating all the
Census 2010 data as well as using postcensus trends in the population which are
captured from a variety of data sources and applied to the most accurate update
for 2010. This change is then extrapolated five years to 2015. The 2010 update
represents current events; the 2015 forecast illustrates the effects of current
events and the expected recovery from the recession. PDC GIS
Total Housing Units
Owner Occupied Housing
Units
Renter Occupied Housing
Units
Tax rate is the average, imputed tax rate based on Tax Revenue for Urban Renewal Debt (taxes
imposed) and Increased Value.
121

PORTLAND DEVELOPMENT COMMISSION
A COMPONENT UNIT OF THE CITY OF PORTLAND, OREGON
NORTH MACADAM URBAN RENEWAL FUND
PROPERTY VALUES, TAX INCREMENT, AND PROJECTED DEMOGRAPHICSFor The Last Ten Fiscal Years Or Since Inception
(Unaudited)
Tax Revenue for
Increased Urban Renewal
Tax Year Tax Rate (1)
Base Value Value Debt (1)
2002-03 $ 20.36 $ 180,450,967 $ 62,791,415 $ 1,217,321
2003-04 21.53 180,450,967 71,592,763 1,432,961
2004-05 21.46 180,450,967 98,624,297 1,984,570
2005-06 18.94 192,609,397 77,592,382 1,403,366
2006-07 19.51 192,609,397 86,887,411 1,627,714
2007-08 21.35 192,609,397 336,699,090 6,862,754
2008 09 20 78 192 609 397 415 675 637 8 269 705
0
200,000
400,000
600,000
800,000
1,000,000 $
Th
ou
sa
nd
s
Tax Year
Property Values
Increased Value
Base Value
2008-09 20.78 192,609,397 415,675,637 8,269,705
2009-10 21.39 192,609,397 587,134,026 11,932,266
2010-11 21.35 192,609,397 655,671,677 13,139,779
2011-12 21.90 192,609,397 590,963,588 11,699,128
Source: Multnomah County Division of Assessment and Taxation
URA Portland
Current Projected Current Projected
2010 2015 2010 2015
Population 2,011 2,269 582,051 619,141
Per Capita Income $ 58,949 $ 68,437 $ 29,282 $ 33,577
1,597 1,789 266,332 284,555
490 551 136,959 145,384
839 944 110,429 118,355
Source:
(1) Tax rate is the average, imputed tax rate based on Tax Revenue for Urban Renewal Debt (taxes
imposed) and Increased Value.
Total Housing Units
Owner Occupied Housing
Units
Renter Occupied Housing
Units
The 2010/2015 forecasted demographic figures have been derived using ESRI’s
Business Analyst Software. Forecasts are developed by incorporating all the
Census 2010 data as well as using postcensus trends in the population which are
captured from a variety of data sources and applied to the most accurate update
for 2010. This change is then extrapolated five years to 2015. The 2010 update
represents current events; the 2015 forecast illustrates the effects of current events
and the expected recovery from the recession. PDC GIS
122

Tax Revenue for
Increased Urban Renewal
Tax Year Tax Rate (1)
Base Value Value Debt (1)
2002-03 $ 20.64 224,605,349$ 208,600,216$ 4,098,740$
2003-04 20.33 224,605,349 210,497,285 4,063,491
2004-05 20.21 224,605,349 215,708,847 4,164,087
2005-06 17.78 224,605,349 230,380,503 3,973,027
2006-07 18.14 224,605,349 243,532,862 4,296,871
2007 08 18 24 224 605 349 257 850 367 4 578 234
PORTLAND DEVELOPMENT COMMISSION
A COMPONENT UNIT OF THE CITY OF PORTLAND, OREGON
CENTRAL EASTSIDE URBAN RENEWAL FUND
PROPERTY VALUES, TAX INCREMENT, AND PROJECTED DEMOGRAPHICSFor The Last Ten Fiscal Years Or Since Inception
(Unaudited)
0
125,000
250,000
375,000
500,000
625,000
$ T
ho
us
an
ds
Tax Year
Property Values
Increased Value
Base Value
2007-08 18.24 224,605,349 257,850,367 4,578,234
2008-09 18.51 224,605,349 279,998,617 5,030,994
2009-10 18.51 224,605,349 325,868,916 5,843,346
2010-11 18.00 224,605,349 314,667,331 5,460,067
2011-12 17.76 224,626,739 323,222,477 5,472,135
Source: Multnomah County Division of Assessment and Taxation
URA Portland
Current Projected Current Projected
2010 2015 2010 2015
Population 1,714 1,757 582,051 619,141
Per Capita Income $ 25,963 $ 30,479 $ 29,282 $ 33,577
960 986 266,332 284,555
137 143 136,959 145,384
713 732 110,429 118,355
Source:
(1)
The 2010/2015 forecasted demographic figures have been derived using ESRI’s
Business Analyst Software. Forecasts are developed by incorporating all the
Census 2010 data as well as using postcensus trends in the population which are
captured from a variety of data sources and applied to the most accurate update
for 2010. This change is then extrapolated five years to 2015. The 2010 update
represents current events; the 2015 forecast illustrates the effects of current
events and the expected recovery from the recession. PDC GIS
Total Housing Units
Owner Occupied Housing
Units
Renter Occupied Housing
Units
Tax rate is the average, imputed tax rate based on Tax Revenue for Urban Renewal Debt (taxes
imposed) and Increased Value.
123

PORTLAND DEVELOPMENT COMMISSION
A COMPONENT UNIT OF THE CITY OF PORTLAND, OREGON
INTERSTATE CORRIDOR URBAN RENEWAL FUND
PROPERTY VALUES, TAX INCREMENT, AND PROJECTED DEMOGRAPHICSFor The Last Ten Fiscal Years Or Since Inception
(Unaudited)
Tax Revenue for
Increased Urban Renewal
Tax Year Tax Rate (1)
Base Value Value Debt (1)
2002-03 $ 20.54 $ 1,019,794,975 $ 104,464,625 $ 2,042,785
2003-04 21.74 1,019,794,975 144,893,801 2,925,355
2004-05 21.70 1,033,372,876 209,114,965 4,253,560
2005-06 19.30 1,033,372,876 276,592,476 5,096,500
2006-07 19.73 1,033,372,876 363,829,663 6,890,757
2007-08 21.38 1,033,372,876 447,042,428 9,124,210
2008-09 20.86 1,033,372,876 520,098,507 10,382,389
2009-10 21.48 1,051,408,349 603,067,607 12,307,811
2010 11 21 39 1 051 408 349 667 154 843 13 395 188
800,000
1,200,000
1,600,000
2,000,000
$ T
ho
usan
ds
Tax Year
Property Values
Increased Value
Base Value
2010-11 21.39 1,051,408,349 667,154,843 13,395,188
2011-12 21.93 1,051,408,349 732,982,715 14,532,562
Source: Multnomah County Division of Assessment and Taxation
URA Portland
Current Projected Current Projected
2010 2015 2010 2015
Population 34,780 37,332 582,051 619,141
Per Capita Income $ 20,137 $ 23,031 $ 29,282 $ 33,577
Total Housing Units 14,437 15,479 266,332 284,555
6,965 7,478 136,959 145,384
6,176 6,607 110,429 118,355
Source:
(1) Tax rate is the average, imputed tax rate based on Tax Revenue for Urban Renewal Debt (taxes
imposed) and Increased Value.
Owner Occupied Housing
Units
Renter Occupied Housing
Units
The 2010/2015 forecasted demographic figures have been derived using ESRI’s
Business Analyst Software. Forecasts are developed by incorporating all the
Census 2010 data as well as using postcensus trends in the population which
are captured from a variety of data sources and applied to the most accurate
update for 2010. This change is then extrapolated five years to 2015. The 2010
update represents current events; the 2015 forecast illustrates the effects of
current events and the expected recovery from the recession. PDC GIS
124

PORTLAND DEVELOPMENT COMMISSION
A COMPONENT UNIT OF THE CITY OF PORTLAND, OREGON
LENTS TOWN CENTER URBAN RENEWAL FUND
PROPERTY VALUES, TAX INCREMENT, AND PROJECTED DEMOGRAPHICSFor The Last Ten Fiscal Years Or Since Inception
(Unaudited)
Tax Revenue for
Increased Urban Renewal
Tax Year Tax Rate (1)
Base Value Value Debt (1)
2002-03 $ 20.45 $ 620,720,135 $ 179,595,927 $ 3,510,832
2003-04 21.66 620,720,135 208,029,051 4,205,914
2004-05 21.52 640,177,922 243,212,853 4,929,404
2005-06 19.91 640,177,922 275,822,211 5,249,632
2006-07 20.24 640,177,922 312,317,448 6,077,743
2007-08 21.44 640,177,922 358,801,970 7,375,650
400,000
600,000
800,000
1,000,000
1,200,000
1,400,000 $ T
ho
usan
ds
Tax Year
Property Values
Increased Value
Base Value
2008-09 20.91 640,177,922 400,982,105 8,056,078
2009-10 21.40 736,224,033 457,950,622 9,344,988
2010-11 21.30 736,224,033 482,455,121 9,685,618
2011-12 21.58 736,224,033 515,771,987 10,098,006
Source: Multnomah County Division of Assessment and Taxation
URA Portland
Current Projected Current Projected
2010 2015 2010 2015
Population 26,968 28,687 582,051 619,141
Per Capita Income $ 19,965 $ 22,362 $ 29,282 $ 33,577
10,728 11,426 266,332 284,555
5,657 5,952 136,959 145,384
4,210 4,541 110,429 118,355
Source:
(1) Tax rate is the average, imputed tax rate based on Tax Revenue for Urban Renewal Debt
(taxes imposed) and Increased Value.
Total Housing Units
Owner Occupied Housing
Units
Renter Occupied Housing
Units
The 2010/2015 forecasted demographic figures have been derived using ESRI’s
Business Analyst Software. Forecasts are developed by incorporating all the
Census 2010 data as well as using postcensus trends in the population which are
captured from a variety of data sources and applied to the most accurate update
for 2010. This change is then extrapolated five years to 2015. The 2010 update
represents current events; the 2015 forecast illustrates the effects of current
events and the expected recovery from the recession. PDC GIS
125

PORTLAND DEVELOPMENT COMMISSION
A COMPONENT UNIT OF THE CITY OF PORTLAND, OREGON
GATEWAY REGIONAL CENTER URBAN RENEWAL FUND
PROPERTY VALUES, TAX INCREMENT, AND PROJECTED DEMOGRAPHICSFor The Last Ten Fiscal Years Or Since Inception
(Unaudited)
Tax Revenue for
Increased Urban Renewal
Tax Year Tax Rate (1)Base Value Value Debt
(1)
2002-03 $ 19.70 $ 307,174,681 $ 35,847,381 $ 681,489
2003-04 20.96 307,174,681 53,283,385 1,053,666
2004-05 20.86 307,174,681 68,476,163 1,356,824
2005-06 20.85 307,174,681 68,766,041 1,375,408
2006-07 21.07 307,174,681 86,192,591 1,751,370
2007-08 21.44 307,174,681 105,057,959 2,174,962
2008-09 20.91 307,174,681 129,631,176 2,623,998
2009-10 21.15 307,174,681 147,626,654 3,001,090
2010 11 20 97 307 174 681 162 221 215 3 228 472
200,000
300,000
400,000
500,000
600,000
$ T
ho
us
an
ds
Tax Year
Property Values
Increased Value
Base Value
2010-11 20.97 307,174,681 162,221,215 3,228,472
2011-12 20.77 307,174,681 165,778,737 3,149,978
Source: Multnomah County Division of Assessment and Taxation
URA Portland
Current Projected Current Projected
2010 2015 2010 2015
Population 6,390 7,091 582,051 619,141
Per Capita Income $ 22,321 $ 25,476 $ 29,282 $ 33,577
2,852 3,165 266,332 284,555
1,047 1,143 136,959 145,384
1,529 1,714 110,429 118,355
Source:
(1) Tax rate is the average, imputed tax rate based on Tax Revenue for Urban Renewal Debt (taxes
imposed) and Increased Value.
Total Housing Units
Owner Occupied Housing
Units
Renter Occupied Housing
Units
The 2010/2015 forecasted demographic figures have been derived using ESRI’s
Business Analyst Software. Forecasts are developed by incorporating all the
Census 2010 data as well as using postcensus trends in the population which
are captured from a variety of data sources and applied to the most accurate
update for 2010. This change is then extrapolated five years to 2015. The 2010
update represents current events; the 2015 forecast illustrates the effects of
current events and the expected recovery from the recession. PDC GIS
126

AIRPORT WAY URBAN RENEWAL FUND
For The Last Ten Fiscal Years Or Since Inception
(Unaudited)
Tax Revenue for
Increased Urban Renewal
Tax Year Tax Rate (1)
Base Value Value Debt (1)
2002-03 $ 19.94 129,701,177$ 708,692,948$ 2,392,481$
2003-04 21.38 129,701,177 701,262,923 2,328,250
2004-05 21.02 129,701,177 708,712,135 2,347,588
2005-06 20.45 129,701,177 739,905,461 2,373,451
2006-07 20.33 129,701,177 779,770,869 2,389,518
2007 08 20 59 129 701 177 886 308 606 2 386 745
PROPERTY VALUES, TAX INCREMENT, AND PROJECTED DEMOGRAPHICS
PORTLAND DEVELOPMENT COMMISSION
A COMPONENT UNIT OF THE CITY OF PORTLAND, OREGON
0
200,000
400,000
600,000
800,000
1,000,000
1,200,000
1,400,000
$ T
ho
us
an
ds
Tax Year
Property Values
Increased Value
Base Value
2007-08 20.59 129,701,177 886,308,606 2,386,745
2008-09 19.99 129,701,177 965,779,764 2,390,141
2009-10 20.55 129,701,177 1,043,109,736 2,374,741
2010-11 20.34 129,701,177 1,077,899,700 2,340,489
2011-12 20.22 124,710,301 992,524,455 2,276,718
Source: Multnomah County Division of Assessment and Taxation
(1)
Population and housing data are not included for Airport Way Urban Renewal Area because it is primarily an industrial area.
Tax rate is the average, imputed tax rate based on Tax Revenue for Urban Renewal Debt (taxes
imposed) and Increased Value.
127

PORTLAND DEVELOPMENT COMMISSION
A COMPONENT UNIT OF THE CITY OF PORTLAND, OREGON
WILLAMETTE INDUSTRIAL URBAN RENEWAL FUND
For The Last Ten Fiscal Years Or Since Inception
(Unaudited)
Tax Revenue for
Increased Urban Renewal
Tax Year Tax Rate (1)
Base Value Value Debt (1)
2005-06 $ 0.00 $ 278,034,345 $ - $ -
2006-07 15.15 278,034,345 5,655,915 85,706
2007-08 16.84 278,034,345 23,273,744 391,905
2008-09 17.92 278,034,345 41,284,536 739,979
2009-10 18.03 278,034,345 46,707,594 842,243
2010-11 17.63 278,034,345 69,552,044 1,226,407
2011-12 17.13 278,034,345 46,606,563 798,540
PROPERTY VALUES, TAX INCREMENT, AND PROJECTED DEMOGRAPHICS
200,000
300,000
400,000
$ T
ho
usan
ds
Tax Year
Property Values
Increased Value
Base Value
2011 12 17.13 278,034,345 46,606,563 798,540
Willamette Industrial URA consists of Multnomah County tax districts 730 and 731. Only data for tax
district 731 is shown. Tax district 730 has a frozen tax base of $203,408,790, and assessed property
values for this district decreased by $122,340,860 from fiscal year 2005-06 through 2011-12.
Source: Multnomah County Division of Assessment and Taxation
(1)
Population and housing data are not included for Willamette Industrial Urban Renewal Area because it is primarily an industrial area.
Tax rate is the average, imputed tax rate based on Tax Revenue for Urban Renewal Debt (taxes
imposed) and Increased Value.
128

PORTLAND DEVELOPMENT COMMISSION
A COMPONENT UNIT OF THE CITY OF PORTLAND, OREGON
Financial AssistanceFor The Last Ten Fiscal Years
(Unaudited)
Business Financial Assistance
Number
of loans Dollar
Fiscal Year and grants Amount
2002-03 25 5,767,290$
2003-04 42 7,148,345
2004-05 52 10,590,559
2005-06 59 14,505,900
2006-07 54 12,466,365
2007-08 47 5,499,620
2008-09 258 15,391,215
2009-10 269 10,631,493
2010-11 264 33,764,995
2011-12 236 7,547,956
Source: Commission loan system.
Notes: Financial assistance may include assistance for building repair, facility expansion,
new equipment, storefront improvements, or working capital as well as a myriad of
other small assistance programs.
129

Personal Income (Thousands) Per Capita Income
Portland/ Portland/
Vancouver/ U.S. Vancouver/ U.S.
Year Beaverton MSA Oregon Total Beaverton MSA Oregon Total
2002 64,909 101,882 8,872,871 32,255 28,924 30,810
2003 65,959 103,890 9,157,257 32,328 29,161 31,484
2004 69,853 109,757 9,705,504 33,875 30,561 33,050
2005 73,806 116,889 10,251,639 35,215 32,103 34,586
2006 79,399 124,589 10,870,319 37,145 33,666 36,307
2007 83,765 133,871 11,652,339 38,511 35,027 38,632
2008 87,053 136,277 12,086,534 39,436 35,956 39,751
2009 86,822 133,907 11,852,715 39,443 35,159 38,637
2010 88,965 137,820 12,308,496 39,843 35,906 39,791
2011 93,449 145,300 12,949,905 41,302 37,527 41,560
Sources: U.S. Department of Commerce, Bureau of Economic Analysis as of 9/30/10
Oregon Office of Economic Analysis
Portland/ Portland Oregon
Vancouver/ U.S. Unemployment Unemployment
Year Portland (1)
Beaverton MSA (1)
Oregon (1)
Total (1)
% Rate (2)
%Rate (2)
2002 538,095 1,989,550 3,523,529 288,125,973 7.8 7.5
2003 538,843 2,019,250 3,561,155 290,796,023 9.0 8.5
2004 532,742 2,050,650 3,589,168 293,638,158 7.2 7.4
2005 533,467 2,082,240 3,638,871 296,507,061 6.1 6.4
2006 537,081 2,137,540 3,700,758 299,398,484 5.2 5.3
2007 568,380 2,159,720 3,745,455 301,621,157 4.9 5.2
2008 557,706 2,207,462 3,790,060 304,059,724 5.8 5.4
2009 582,130 2,241,841 3,808,600 309,771,529 11.0 11.6
2010 581,484 2,235,580 3,831,074 309,330,219 (3) 10.5 10.8
2011 583,546 2,246,083 3,857,625 311,591,917 9.1 9.5
Source: (1) U.S. Department of Commerce, Bureau of Economic Analysis as of 9/30/10
Oregon Office of Economic Analysis(2) Oregon Employment Department(3) US Census 2011
POPULATION TRENDS UNEMPLOYMENT RATES
PORTLAND/VANCOUVER/BEAVERTON MSA, OREGON, AND THE UNITED STATES
POPULATION TRENDS, AND UNEMPLOYMENT RATES
PORTLAND DEVELOPMENT COMMISSION
A COMPONENT UNIT OF THE CITY OF PORTLAND, OREGON
TOTAL PERSONAL INCOME, PER CAPITA INCOME,
(Unaudited)
130

Board of CommissionersCommissioners
Executive Director135.3 Total FTE / 3.0 Total LTE
LEGALSTRATEGY AND OPERATIONS
BUSINESS AND SOCIAL EQUITY
6 FTE
General Counsel2 FTE
Operations
Strategy
2 FTE
MWESB
Workforce Diversity
FINANCE & BUSINESS
OPERATIONS
58 FTE / 2 LTE
URBAN DEVELOPMENT DEPARTMENT
58.3 FTE
GOVERNMENT RELATIONS /
PUBLIC AFFAIRS
9 FTE / 1 LTE
Business Operations
Finance & Accounting
Human Resources
Information Technology
Business & Industry
Central City
Neighborhood
Community Relations
Public Affairs
Resource Development / URA Planning
NOTE: FTE=Full Time Employee; LTE=Limited Term Employee
131

Date of Charter Amendment creating agency May 16, 1958
Form of Government Commission, Appointed by City Mayor
Approved by City Council
Number of Employees:
As of June 30
FTE LTE FTE LTE FTE LTE FTE LTE FTE LTE
Development 42.5 1.0 42.5 1.0 0.0 0.0 0.0 0.0 0.0 0.0
Urban Development 0.0 0.0 0.0 0.0 71.1 3.0(2)
58.3 0.0 58.3 0.0
Economic Development 26.0 0.0 30.0 0.0 0.0 0.0 0.0 0.0 0.0 0.0
Housing 42.0 1.0 42.0 1.0 37.0 1.0 0.0 0.0(3)
0.0 0.0
Executive 42.0 0.0(1)
42.0 0.0 42.0 2.0 19.0 1.0 19.0 1.0
Central Services 60.0 0.0(1)
66.0 0.0 63.0 0.0 0.0 0.0 0.0 0.0
0.0 0.0 0.0 0.0 0.0 0.0 58.0 2.0(3)
58.0 2.0
Total 212.5 2.0 222.5 2.0 213.1 6.0 135.3 3.0 135.3 3.0
(1) In FY2007-08 Department reorganization resulted in staffing redistribution between Executive and
Central Services of the former People & Technology and Community Relations & Business Equity Departments.
(2) In FY 2009-10 the previously named Development and Economic Development Departments were merged into
the Urban Development Department.
(3) In FY 2010-11 the Housing function was transferred to the Portland Housing Bureau, the Central Service Department
was renamed Finance & Business Operations, and the former Executive Department was split into the Government
Relations & Public Affairs, Strategy & Operations, Business & Social Equity, and Legal Departments.
Urban Renewal District Land Area and Base Values
As of June 30, 2012
District Acres
42nd Avenue (1)
136.2
82nd Avenue and Division (1)
108.8
Airport Way 1,841.4
Central Eastside 692.3
Cully Blvd (1)
164.6
Division-Midway (1)
115.9
Downtown Waterfront 233.1
Education District(1)
144.0
Gateway Regional Center 658.5
Interstate Corridor(2)
3,990.0
Lents Town Center 2,846.3
North Macadam 401.9
Oregon Convention Center(2)
410.0
Parkrose (1)
142.6
River District 351.2
Rosewood (1)
135.6
South Park Blocks(3)
97.9
Willamette Industrial 755.5
Total URA Land Data 13,225.8
Total City Land Data(4)
92,773
14.3%
(2) Amendments occurred in FY11/12 and revised base values will not be reflected until FY12/13
(3) Amendment occurred in FY11/12 and revised base value will not be reflected until FY13/14
(4) City land data from 11/12 TSCC report
481,443,135
42,375,411,465
Finance &
Business Operations
461,577,974
78,774,383
Base
Value
192,609,397
248,951,143
FY2007-08
PORTLAND DEVELOPMENT COMMISSION
A COMPONENT UNIT OF THE CITY OF PORTLAND, OREGON
MISCELLANEOUS STATISTICS
As of June 30, 2012
(Unaudited)
FY2011-12FY2010-11FY2008-09 FY2009-10
(1) For newly created urban renewal areas, frozen base reflects the
value from fiscal year 2011-12 and could be adjusted to include
additional utility and personal property values.
81,011,867
81,523,638
124,710,301
224,626,739
81,000,273
80,201,117
55,674,313
620,993,235
307,174,681
736,224,033
12.7%
1,051,408,349
5,364,464,926
80,493,774
376,066,574
132


Audit Comments
and Disclosures


REPORT OF INDEPENDENT AUDITORS ON INTERNAL CONTROL OVER
FINANCIAL REPORTING AND ON COMPLIANCE AND OTHER MATTERS
BASED ON AN AUDIT OF FINANCIAL STATEMENTS PERFORMED IN
ACCORDANCE WITH GOVERNMENT AUDITING STANDARDS.
Board of Commissioners, Portland Development Commission Portland Development Commission, Portland Oregon (A Component Unit of the City of Portland) We have audited the financial statements of the governmental activities, the business-type activities, each major fund, and the aggregate remaining fund information of the Portland Development Commission (a Component Unit of the City of Portland Oregon) (the Commission) as of and for the year ended June 30, 2012, and the respective changes in financial position and cash flows, where applicable, thereof and the respective budgetary comparison statements for the General Fund, and the Housing and Community Development Contract Fund, which collectively comprise the Commission’s basic financial statements and have issued our report thereon dated November 21, 2012. We conducted our audit in accordance with auditing standards generally accepted in the United States of America and the standards applicable to financial audits contained in Government Auditing Standards, issued by the Comptroller General of the United States.
Internal Control Over Financial Reporting
Management of the Commission is responsible for establishing and maintaining effective internal control over financial reporting. In planning and performing our audit, we considered the Commission’s internal control over financial reporting as a basis for designing our auditing procedures for the purpose of expressing our opinion on the financial statements, but not for the purpose of expressing an opinion on the effectiveness of the Commission’s internal control over financial reporting. Accordingly, we do not express an opinion on the effectiveness of the Commission’s internal control over financial reporting.
A deficiency in internal control exists when the design or operation of a control does not allow management or employees, in the normal course of performing their assigned functions, to prevent, or detect and correct misstatements on a timely basis. A material
weakness is a deficiency, or combination of deficiencies, in internal control such that there is a reasonable possibility that a material misstatement of the entity’s financial statements will not be prevented, or detected and corrected on a timely basis.
133

Our consideration of internal control over financial reporting was for the limited purpose described in the first paragraph of this section and was not designed to identify all deficiencies in internal control over financial reporting that might be deficiencies, significant deficiencies or material weaknesses. We did not identify any deficiencies in internal control over financial reporting that we consider to be material weaknesses, as defined previously. However, we identified certain deficiencies in internal control over financial reporting, described in the accompanying Schedule of Findings and Responses that we consider to be significant deficiencies in internal control over financial reporting as items 2012-01, 2012-02, 2012-03, 2012-04 and 2012-05. A significant deficiency is a deficiency, or a combination of deficiencies, in internal control that is less severe than a material weakness, yet important enough to merit attention by those charged with governance. Compliance and Other Matters As part of obtaining reasonable assurance about whether the Commission’s financial statements are free of material misstatement, we performed tests of its compliance with certain provisions of laws, regulations, contracts, and grant agreements, noncompliance with which could have a direct and material effect on the determination of financial statement amounts. However, providing an opinion on compliance with those provisions was not an objective of our audit and, accordingly, we do not express such an opinion. The results of our tests disclosed no instances of noncompliance or other matters that are required to be reported under Government Auditing Standards. The Commission’s responses to the findings identified in our audit are described in a separate letter that we did not audit and, accordingly, we express no opinion on them. This report is intended solely for the information and use of the Board of Commissioners, management, state agencies and federal awarding agencies and pass-through entities and is not intended to be and should not be used by anyone other than these specified parties.
Eugene, Oregon November 21, 2012
134

PORTLAND DEVELOPMENT COMMISSION
SCHEDULE OF FINDINGS AND RESPONSES
FOR THE YEAR ENDED JUNE 30, 2012
FINDING 2012-01 – Revenue/Expense Recognition – Governmental Funds – Significant
Deficiency in Controls
Criteria: Per GASB 33, nonexchange transaction revenues should be recognized in the period when use of the resources is required or first permitted, and the resources have been received. Expenditures should be recorded when goods and services have been received and a related liability incurred.
Condition: During our revenue confirmation testing procedures, PDC management found that it had not recorded revenues for Tax Increment Financing (TIF) proceeds and related expenditures totaling $13.5 million. Context: PDC received TIF revenue totaling $134 million during the fiscal year ended June 30, 2012 recorded within its various urban renewal district funds. Cause: In December 2011, PDC requested, and the City processed, TIF proceeds from a line of credit draw in the amount of $13.5 million for a project. The draw was for approved invoices and was used to discharge a 2009 bond obligation for the project. The City deposited the proceeds into a City holding account that it also used to pay the approved invoices. The cash transaction normally prompts the recording of the transactions in PDC’s financial system. The timing of the transaction caused the cash to sit in a holding account over the New Year’s weekend. By recording the receipt and disbursement through the City’s holding account, the City’s financial system netted the cash entries, resulting in no transactions hitting PDC’s cash account. Since the cash transactions would ordinarily have triggered PDC to record the transactions, no transactions were recorded. In prior years, PDC had a control in place to reconcile TIF revenues against tax increment debt issuances recorded by the City, State limits for each urban renewal district, TIF proceeds transferred to PDC, and against TIF revenues recorded in PDC’s general ledger. This control has not been followed by PDC staff for some time, and therefore did not catch the under-reported TIF revenues and related expenditures in the transaction noted above. Effect: An adjustment was made to record the transaction before the financial statements were completed. Although the net effect of the adjustment to fund balance and net assets was $0, prior to the adjustment, revenues and expenditures were understated by $13.5 million. Recommendation: We suggest that management work with the City of Portland to record two separate entries, one to record the draw receipt into PDC’s cash account and a second one to record disbursements. Further, we recommend that PDC re-institute the procedure to review TIF revenues against TIF debt issuances by the City, TIF proceeds transferred to PDC, State debt limits for each urban renewal district, and TIF revenues recorded in PDC’s general ledger.
135

Management Response: Management responses will be included in a separately issued ‘Management’s Responses’ document.
FINDING 2012-02 – Write-down of Property Held For Sale – Governmental Funds – Significant
Deficiency in Controls
Criteria: Accounting principles applicable to property held for resale require recording the property at the lower of original cost or fair value.
Condition: During our testing procedures on property held for resale, we identified two properties whose fair values had dropped below historical cost as evidenced by real estate appraisals PDC had obtained during the year. However, PDC did not reduce the recorded values pursuant to their policies and applicable accounting standards. The first property’s value declined by $2.6 million and the second property’s value declined by $.4 million. Context: The Commission has a portfolio of properties held for resale with recorded costs or values totaling approximately $95.5 million. Cause: Management has controls and procedures in place to evaluate properties whose values have potentially declined below historical or recorded costs at various times during the year, and at year-end. Such procedures include a review against assessed values according to County Assessor records, obtaining periodic real estate appraisals, and a review of possible changes in intended future use or zoning. The two properties noted above had recent appraisals that PDC had received that indicated a decline in value as noted above. However, our inquiries revealed that a decision was made not to adjust to the lower appraised value because the properties involved were in the process of being advertised for sale and development. The decision not to adjust was inconsistent with PDC’s policies and generally accepted accounting principles (GAAP). Effect: Management did make the adjustment before completing the financial statements. However, prior to posting that adjustment, property held for sale was overstated by a total of $3 million. Recommendation: PDC should consider providing training to staff involved in the accounting for property held for resale to ensure they are fully aware of policies and procedures. In addition, the review and oversight control should be reviewed to ensure the review and approval for final values is conducted by appropriate finance management staff sufficient to identify if a property is not properly valued. Management Response: Management responses will be included in a separately issued ‘Management’s Responses’ document.
136

FINDING 2012-03 – Liability Recognition – Governmental Funds – Significant Deficiency in
Controls
Criteria: GAAP require that the values of property held for resale be reduced, a liability recognized, or both, by the discounted value of estimated future outflows of resources deemed necessary to meet obligations included in property purchase contracts or other related agreements.
Condition: During the financial close and reporting process, management identified that it was subject to, and making monthly payments for, a contractual provision in a property purchase and related agreements. The agreements had provisions requiring PDC to cover the cost of a fixed number of parking spaces, should PDC demolish or otherwise remove parking spaces from a specific property PDC owns. The agreement has a 99-year term, with two 99-year renewal options. PDC demolished the parking structure on the subject property, thereby triggering a requirement to make the monthly payments to reimburse a third party for the cost of replacing the parking spaces. Management had not reduced the recorded value of the subject property, nor had they recognized a liability, for the estimated present value of providing reimbursements for the cost of the parking spaces. Context: The current value of providing the parking spaces is approximately $5,000 per month. The estimated cost of constructing a parking structure on the subject property is estimated by PDC to approximate $2.8 million. The present value of the first 99-year term of the obligation to cover the cost of the parking spaces is $9.4 million. Management recorded an audit adjustment to recognize a liability in the amount of approximately $3.2 million. The adjustment covers management’s estimate of the cost of building a replacement parking structure plus the cost of providing the monthly reimbursements until the structure could be built. Cause: There is an apparent lack of communication of contractual obligations associated with property purchase and or related agreements between staff responsible for development projects and finance. As a result, finance staff were unaware an obligation with accounting and reporting significance existed. Effect: A liability with an estimated present value of $3.2 million was not recognized in the financial statements. Recommendation: Management should provide training to staff responsible for development projects on the need to share agreement provisions with potential accounting and reporting implications. In addition, controls should be reviewed and revised as appropriate to ensure finance staff become aware of contractual provisions with reporting significance. Management Response: Management responses will be included in a separately issued ‘Management’s Responses’ document.
137

FINDING 2012-04 – Accounts Payable Cut-off – Governmental Funds – Significant Deficiency
in Controls
Criteria: Generally accepted accounting principles (GAAP) require expenses to be recognized in the same period when goods and/or services are received.
Condition: During our search for unrecorded liabilities, we identified four transactions recorded in fiscal year 2013 that should have been recorded in fiscal year 2012 totaling $.9 million. Context: Total recorded current liabilities at year end in the governmental funds totaled $5.8 million. Cause: As a result of automated system changes, the invoices were entered into the accounting records later than in previous years. In addition, although PDC staff are aware of GAAP, they failed to recognize that these invoices required recording as of year-end. Effect: Expenses and accounts payable were understated by $.9 million. Recommendation: We suggest that management continue to emphasize the need by PDC staff to scrutinize invoices as necessary to make a correct determination on the period the expense and related liability were incurred. If there are software changes or other disruptions to the normal procedures around year end, or in addition to routine procedures, an additional review procedure could be considered of checks issued subsequent to year end looking for possible unrecorded liabilities. Management Response: Management responses will be included in a separately issued ‘Management’s Responses’ document.
138

FINDING 2012-05 – Net Asset Classification – Government Wide Financial Statements –
Significant Deficiency in Controls
Criteria: GASB 34 requires reporting net assets by level of constraint. Restricted net assets are defined as unspent resources containing restrictions from third parties like grantor agencies or due to provisions of enabling legislation. Unassigned net assets are defined as spendable resources that do not carry any associated constraints.
Condition: During our testing of net asset classifications, we identified two items that were classified incorrectly. At the fund level, certain resources were reported as assigned to use for ensuing year’s expenditures. In addition, there were certain liabilities that were not includable in the fund statements but recognized only at the government wide statement level that will be payable from restricted resources if and when paid that were incorrectly offset against unrestricted net assets. Context: Total net assets as reported are comprised of $8.9 million of invested in capital assets, $279.6 million of restricted, and $.9 million unrestricted. Cause: There was an apparent misunderstanding of where the items noted above would be reported in the government wide statements to meet requirements of the applicable accounting standards.
Effect: The impact of the two issues is an overstatement of restricted net assets and an
understatement of unrestricted net assets by $5.6 million. Recommendation: Finance staff responsible for the drafting of the government wide financial statements should consider a thorough review of GASB 34 requirements. Alternatively, or in addition, PDC could consider appropriate continuing education courses that would facilitate a better understanding of the net asset classification definitions. Management Response: Management responses will be included in a separately issued ‘Management’s Responses’ document.
139

1
REPORT OF INDEPENDENT AUDITORS ON COMPLIANCE AND ON
INTERNAL CONTROL OVER FINANCIAL REPORTING BASED ON AN
AUDIT OF FINANCIAL STATEMENTS PERFORMED IN ACCORDANCE
WITH OREGON AUDITING STANDARDS
Board of Commissioners, Portland Development Commission Portland Development Commission, Portland Oregon (A Component Unit of the City of Portland)
We have audited the basic financial statements of the Portland Development Commission (a Component Unit of the City of Portland Oregon) (the Commission), as of and for the year ended June 30, 2012, and have issued our report thereon dated November 21, 2012. We conducted our audit in accordance with auditing standards generally accepted in the United States of America and the provisions of the Minimum Standards for Audits of Oregon Municipal Corporations, prescribed by the Oregon Secretary of State. Those standards require that we plan and perform the audit to obtain reasonable assurance about whether the basic financial statements are free of material misstatement. Compliance
As part of obtaining reasonable assurance about whether the Commission’s basic financial statements are free of material misstatement, we performed tests of its compliance with certain provisions of laws, regulations, contracts, grants, including provisions of Oregon Revised Statutes as specified in Oregon Administrative Rules OAR 162-10-000 to 162-10-330, as set forth below, noncompliance with which could have a direct and material effect on the determination of financial statement amounts: The accounting records and related internal control structure. The use of various depositories to secure the deposit of public funds. The requirements relating to debt. The requirements relating to the preparation, adoption and execution of the
annual budgets for fiscal years 2012 and 2013. The requirements relating to insurance and fidelity bond coverage. The appropriate laws, rules and regulations pertaining to programs funded wholly or partially by other governmental agencies. The statutory requirements pertaining to the investment of public funds. The requirements pertaining to the awarding of public contracts and the construction of public improvements.
140

INDEPENDENT AUDITOR’S REPORT ON COMPLIANCE AND ON
INTERNAL CONTROL OVER FINANCIAL REPORTING BASED ON AN
AUDIT OF FINANCIAL STATEMENTS PERFORMED IN ACCORDANCE
WITH OREGON AUDITING STANDARDS – (continued)
However, providing an opinion on compliance with those provisions was not an objective of our audit and, accordingly, we do not express such an opinion. The results of our tests disclosed no instances of noncompliance other than the following that are required to be reported under Minimum Standards for Audits of Oregon Municipal Corporations, prescribed by the Secretary of State, except as noted below. As described in Note II, Stewardship, Compliance, and Accountability, the results of our testing indicated instances of non-compliance related to excess expenditures over appropriations in the Housing and Community Development Contract, Home Grant, and Enterprise Loan funds. Internal Control Over Financial Reporting
Management of the Commission is responsible for establishing and maintaining effective internal control over financial reporting. In planning and performing our audit, we considered the Commission’s internal control over financial reporting as a basis for designing our auditing procedures for the purpose of expressing our opinion on the financial statements, but not for the purpose of expressing an opinion on the effectiveness of the Commission’s internal control over financial reporting. Accordingly, we do not express an opinion on the effectiveness of the Commission’s internal control over financial reporting.
A deficiency in internal control exists when the design or operation of a control does not allow management or employees, in the normal course of performing their assigned functions, to prevent, or detect and correct misstatements on a timely basis. A material
weakness is a deficiency, or combination of deficiencies, in internal control such that there is a reasonable possibility that a material misstatement of the entity’s financial statements will not be prevented, or detected and corrected on a timely basis. Our consideration of internal control over financial reporting was for the limited purpose described in the first paragraph of this section and was not designed to identify all deficiencies in internal control over financial reporting that might be deficiencies, significant deficiencies or material weaknesses. We did not identify any deficiencies in internal control over financial reporting that we consider to be material weaknesses, as defined previously. However, we identified certain deficiencies in internal control over financial reporting, described in the Schedule of Findings and Responses accompanying the Government Auditing Standards report on internal controls and compliance that we
141

consider to be significant deficiencies in internal control over financial reporting. See finding numbers 2012-01, 2012-02, 2012-03, 2012-04 and 2012-05. A significant
deficiency is a deficiency, or a combination of deficiencies, in internal control that is less severe than a material weakness, yet important enough to merit attention by those charged with governance. We noted certain matters that we reported to management of the Commission in a separate letter dated November 21, 2012. This report is intended solely for the information of the Board of Commissioners, management, and the State of Oregon and is not intended to be and should not be used by anyone other than those specified parties.
James C. Lanzarotta, Partner for Moss Adams LLP Eugene, Oregon November 21, 2012
142

222 NW FIFTH AVENUE • PORTLAND, OR 97209

To the Audit Committee of the Portland Development Commission, Portland Oregon (A Component Unit of the City of Portland), and LaVonne Griffin-Valade, Auditor, City of Portland We have audited the financial statements of the Portland Development Commission (a Component Unit of the City of Portland, Oregon) (the “Commission”), as of and for the year ended June 30, 2012, and have issued our report thereon dated November 21, 2012. Professional standards require that we provide you with the following information related to our audit. OUR RESPONSIBILITY UNDER AUDITING STANDARDS GENERALLY ACCEPTED IN THEUNITEDSTATESOFAMERICAAs stated in our audit contract dated May , , our responsibility, as described byprofessional standards, is to form and express an opinion about whether the financialstatements preparedbymanagementwith your oversight are fairly presented, in allmaterialrespects, in conformity with U.S. generally accepted accounting principles. Our audit of thefinancialstatementsdoesnotrelieveyouormanagementofyourresponsibilities.Our responsibility is to plan and perform the audit in accordance with generally acceptedauditingstandardsandtodesigntheaudittoobtainreasonable,ratherthanabsolute,assuranceaboutwhetherthefinancialstatementsarefreeofmaterialmisstatement.Anauditoffinancialstatements includes consideration of internal control over financial reporting as a basis fordesigningauditproceduresthatareappropriateinthecircumstances,butnotforthepurposeofexpressinganopinionon theeffectivenessof theCommission s internal controlover financialreporting.Accordingly,weconsideredtheCommission sinternalcontrolsolelyforthepurposesof determining our audit procedures and not to provide assurance concerning such internalcontrol.Wearealsoresponsibleforcommunicatingsignificantmattersrelatedtothefinancialstatementauditthat,inourprofessionaljudgment,arerelevanttoyourresponsibilitiesinoverseeingthefinancialreportingprocess.(owever,wearenotrequiredtodesignproceduresforthepurposeofidentifyingothermatterstocommunicatetoyou.OTHERINFORMATIONINDOCUMENTSCONTAININGAUDITEDFINANCIALSTATEMENTSOurresponsibilityforotherinformationinthefinancialstatementsdoesnotextendbeyondthefinancial information identified in our report. We do not have an obligation to perform anyprocedurestocorroborateotherinformationcontainedinthesedocuments.(owever,wehaveread the information and nothing came to our attention that caused us to believe that suchinformation or its manner of presentation is materially inconsistent with the information ormannerofitspresentationappearinginthefinancialstatements.
Board Resolution – Comprehensive Annual Financial Report for Fiscal Year 2011-12
January 9, 2013
Exhibit B
Page 1 of 4

PLANNEDSCOPEANDTIMINGOFTHEAUDITWeperformedtheauditaccordingtotheplannedscopeandtimingpreviouslycommunicatedtoyouinourplanningmeetingheldwithyouonSeptember , .SIGNIFICANTAUDITFINDINGS
QualitativeAspectsofAccountingPracticesManagement is responsible for the selection and use of appropriate accounting policies. ThesignificantaccountingpoliciesusedbytheCommissionaredescribedinNote tothefinancialstatements.Therewerenochangesintheapplicationofexistingpoliciesduring exceptforthe following: as described in Note . to the financial statements, the Commissionimplemented several new accounting standards of the Governmental Accounting StandardsBoard GASB : GASB –CodificationofAccountingandFinancialReportingGuidanceContained inPre‐November , FASBandA)CPAPronouncements; GASB –Derivative)nstruments–TerminationProvisions.Management performed an assessment of these pronouncements and determined there wasminimaleffecttotheCommissionandhasincorporatedthesepronouncementsintothecurrentyearComprehensiveAnnualFinancialReport.WenotednotransactionsenteredintobytheCommissionduringtheyearforwhichthereisalackofauthoritativeguidanceorconsensus.Therearenosignificanttransactionsthathavebeenrecognizedinthefinancialstatementsinadifferentperiodthanwhenthetransactionoccurred.SignificantAccountingEstimatesAccountingestimatesareanintegralpartofthefinancialstatementspreparedbymanagementandarebasedonmanagement sknowledgeandexperienceaboutpastandcurrenteventsandassumptions about future events. Certain accounting estimates are particularly sensitivebecause of their significance to the financial statements and because of the possibility thatfutureeventsaffecting themmaydiffer significantly from thoseexpected. Themost sensitiveestimatesaffectingtheCommission sfinancialstatementsare: the determination of the allowance for discounts and uncollectible loans and other
receivables, useful lives of property and equipment, claims liability, employee benefit plan accruals, overhead allocations, and pollution remediation costs. Based upon our audit procedures, we concur with the significant estimates and assumptions made by management in the preparation of the financial statements.
Board Resolution – Comprehensive Annual Financial Report for Fiscal Year 2011-12
January 9, 2013
Exhibit B
Page 2 of 4

FinancialStatementDisclosuresThe disclosures in the financial statements are consistent, clear and understandable. Certainfinancial statement disclosures are particularly sensitive because of their significance tofinancialstatementusers. Themostsensitivedisclosuresaffectingthefinancialstatementsarethe loans receivable and related allowances, properties held for sale, employee pension plandisclosures,contingentliabilities,andtheCommission senvironmentalliability.SignificantDifficultiesEncounteredinPerformingtheAuditWe encountered no significant difficulties in dealing with management in performing andcompletingouraudit.CorrectedandUncorrectedMisstatementsProfessionalstandardsrequireustoaccumulateallknownandlikelymisstatementsidentifiedduring the audit, other than those that are trivial, and communicate them to the appropriatelevel of management. We identified four misstatements, two of which were corrected bymanagement,andmanagementidentifiedonemisstatementwhichitcorrectedassummarizedbelow.We found that twoproperties held for sale haddeclined in value as evidencedby real estateappraisalsobtainedbyPDCduringtheyear,buttherecordedvaluehadnotbeenadjustedpriorto identification of the issue during our audit testing. Management made the adjustmentresultinginareductionintherecordedvaluesof$ million.As a result of our confirmation procedures of Tax )ncrement Financing T)F revenues, weidentifieda$ . millionT)FrevenuetransactionandrelatedexpenditurethatwasnotinitiallyrecordedbyPDC.Managementmadetheadjustmenttorecord$ . millioninT)Frevenueandtheoffsetting$ . inexpenditurewhichresultedinnochangetothenetfundbalance.)noursearchforpossibleunrecordedliabilities,weidentifiedfourinvoicestotaling$. millionthatwererelatedtogoodsandservicesreceivedpriortoJune , ,butwerenotincludedinaccountspayableasofthatdate.Managementhasdecidedtopassonmakinganadjustmentfortheseinvoicesbecausetheyarenotmaterialtotheopinionunitsinvolved,andweconcurwiththatdecision.Fromourtestingofnetassetclassificationsandreportedbalances,wefoundthatunrestrictednet assetswereunderstated and restrictednet assets areoverstatedby $ . milliondue to amisunderstandingofhowassignedamountsat the fund level, and liabilities recognizedat thegovernment‐wide level only, are classified. Management has decided to pass on making anadjustmentbecauseitisnotmaterialtothegovernment‐widefinancialstatements,andthereisnochangetototalnetassets.Management identified that PDC was making payments on, and honoring provisions in, apropertypurchaseandrelatedagreements.AneventhadtakenplaceinaprioryearobligatingPDCtomakecertainpaymentstoathirdpartythathadnotbeenreflectedaseitherareductioninthevalueoftheunderlyingproperty,oraliabilityforthepresentvalueofanestimateofthepayments required, under these agreements. As the amount is immaterial, Managementrecognized both the expense and liability in the current year for $ . million as opposed topostingapriorperiodadjustment,andweconcurwiththatdecision.
Board Resolution – Comprehensive Annual Financial Report for Fiscal Year 2011-12
January 9, 2013
Exhibit B
Page 3 of 4

DisagreementswithManagementForpurposesofthisletter,professionalstandardsdefineadisagreementwithmanagementasafinancialaccounting,reporting,orauditingmatter,whetherornotresolvedtooursatisfaction,thatcouldbesignificant to the financial statementsor theauditor s report.Wearepleased toreportthatnosuchdisagreementsaroseduringthecourseofouraudit.ManagementRepresentationsWe have requested certain representations from management that are included in themanagementrepresentationletterdatedNovember , .ManagementConsultationswithOtherIndependentAccountants)nsomecases,managementmaydecide toconsultwithotheraccountantsaboutauditingandaccounting matters, similar to obtaining a second opinion on certain situations. )f aconsultation involves application of an accounting principle to the Commission s financialstatementsoradeterminationofthetypeofauditor sopinionthatmaybeexpressedonthosestatements, our professional standards require the consulting accountant to checkwith us todeterminethattheconsultanthasalltherelevantfacts.Toourknowledge,therewerenosuchconsultationswithotheraccountants.OtherSignificantAuditFindingsorIssuesWegenerallydiscussavarietyofmatters,includingtheapplicationofaccountingprinciplesandauditingstandards,withmanagementeachyearpriortoretentionasPDC sauditors.(owever,these discussions occurred in the normal course of our professional relationship and ourresponseswerenotaconditiontoourretention.Weissueda Reporton)nternalControloverFinancialReportingandonComplianceandOtherMattersBasedonanAuditofFinancialStatementsPerformed inAccordancewithGovernmentAuditingStandards . Thatreportdisclosedfivesignificantdeficiencies,notedas item ‐ ,‐ , ‐ , ‐ and ‐ . The Schedule of Findings and Questioned CostswithintheCommission sfinancialstatementsreportsthesesignificantdeficienciesindetail.ThisinformationisintendedsolelyfortheuseoftheauditcommitteeandmanagementofPDC,isnotintendedtobe,andshouldnotbeusedbyanyoneotherthanthesespecifiedparties.
Eugene,OregonNovember ,
Board Resolution – Comprehensive Annual Financial Report for Fiscal Year 2011-12
January 9, 2013
Exhibit B
Page 4 of 4

Responses to Moss Adams Management Letter for Audit Committee
The Report on Internal Control over Financial Reporting and on Compliance and Other Matters Based on an Audit of Financial Statements Performed in Accordance with Government Auditing Standards’ disclosed five significant deficiencies identified in the Schedule of Findings and Questioned Costs, these findings are also listed in the Moss Adams Management Letter and the PDC staff responses are as follows.
Corrected and Uncorrected Misstatements
Professional Standards require us to accumulate all known and likely misstatements identified during the audit, other than those that are trivial, and communicate them to the appropriate level of management. We identified four misstatements, two of which were corrected by management, and management identified one misstatement which it corrected as summarized below;
Audit Adjustments Corrected: We found that two properties held for sale had declined in value as evidenced by real estate appraisals obtained by PDC during the year, but the recorded value had not been adjusted prior to identification of the issue during our audit testing. Management made the adjustment resulting in a reduction in the recorded values of $3 million.
Recommendation: PDC should consider providing training to staff involved in the accounting for property held for resale to ensure they are fully aware of policies and procedures. In addition, the review and oversight control should be reviewed to ensure the review and approval for final values is conducted by appropriate finance management staff sufficient to identify if a property is not properly valued.
Management Response: Management agrees that the properties should have been written down to their appraised value regardless of pending disposition and have provided training to staff and strengthened our Year-End Property Evaluation procedures to include recording a write down of the value of a property as applicable whenever a current appraisal is available. Audit Adjustments Corrected: As a result of our confirmation procedures of Tax Increment Financing (TIF) revenues, we identified a $13.5 million TIF revenue transaction and related expenditure that was not initially recorded by PDC. Management made the adjustment to record $13.5 million in TIF revenue and the offsetting $13.5 in expenditure which resulted in no change to the net fund balance.
Recommendation: We suggest that management work with the City of Portland to record two separate entries, one to record the draw receipt into PDC’s cash
Board Resolution – Comprehensive Annual Financial Report for Fiscal Year 2011-12
January 9, 2013
Exhibit C
Page 1 of 3

account and a second one to record disbursements. Further, we recommend that PDC re-institute the procedure to review TIF revenues against TIF debt issuances by the City, TIF proceeds transferred to PDC, State debt limits for each urban renewal district, and TIF revenues recorded in PDC’s general ledger.
Management Response: Management agrees that an error occurred in the recording of the RAC LOC draw and expenditure. This was caused by an extraordinary sequence of events. Procedures with the City of Portland to record transactions such as these have been updated to record the receipt and expenditures in separate journal entries to ensure that the system does not net them together should this occur in the future. In addition PDC processes to verify TIF Revenues have been updated to include the reconciliation of TIF with the
City and the reconciliation with General Ledger recorded transactions.
Audit Adjustments Uncorrected: In our search for possible unrecorded liabilities, we identified four invoices totaling $.9 million that were related to goods and services received prior to June 30, 2012, but were not included in accounts payable as of that date. Management has decided to pass on making an adjustment for these invoices because they are not material to the opinion units involved, and we concur with that decision.
Recommendation: We suggest that management continue to emphasize the need by PDC staff to scrutinize invoices as necessary to make a correct determination on the period the expense and related liability were incurred. If there are software changes or other disruptions to the normal procedures around year end, or in addition to routine procedures, an additional review procedure could be considered of checks issued subsequent to year end looking for possible unrecorded liabilities.
Management Response: Management recognizes the importance of scrutinizing subsequent transactions for reporting in the proper accounting period and has strengthened procedures and review of expenditures occurring around the fiscal year end to ensure all unrecorded liabilities have been accounted for.
Audit Adjustments Uncorrected: From our testing of net asset classifications and reported balances, we found that unrestricted net assets were understated and restricted net assets are overstated by $5.6 million due to a misunderstanding of how assigned amounts at the fund level, and liabilities recognized at the government-wide level only, are classified. Management has decided to pass on making an adjustment because it is not material to the government-wide financial statements, and there is no change to total net assets.
Recommendation: Finance staff responsible for the drafting of the government wide financial statements should consider a thorough review of GASB 34 requirements. Alternatively, or in addition, PDC could consider appropriate
Board Resolution – Comprehensive Annual Financial Report for Fiscal Year 2011-12
January 9, 2013
Exhibit C
Page 2 of 3

continuing education courses that would facilitate a better understanding of the net asset classification definitions.
Management Response: Management agrees that there were incorrect net asset classifications and recognizes the importance of reviewing the source available for the satisfaction of subsequent liabilities in order to properly classify their inclusion in the Government Wide Financial Statements. Finance staff will review the requirements of GASB 34 and update procedures as needed to ensure the appropriate classification of net assets.
Audit Adjustments Uncorrected: Management identified that PDC was making payments on, and honoring provisions in, a property purchase and related agreements. An event had taken place in a prior year obligating PDC to make certain payments to a third party that had not been reflected as either a reduction in the value of the underlying property, or a liability for the present value of an estimate of the payments required, under these agreements. As the amount is immaterial, Management recognized both the expense and liability in the current year for $3.2 million as opposed to posting a prior period adjustment, and we concur with that decision.
Recommendation: Management should provide training to staff responsible for development projects on the need to share agreement provisions with potential accounting and reporting implications. In addition, controls should be reviewed and revised as appropriate to ensure finance staff become aware of contractual provisions with reporting significance.
Management Response: Management agrees that such contractual obligations need to be recognized as soon as triggering events occur and have recorded both the expense and liability in the current year as opposed to posting a prior period adjustment. Procedures for the review of contracts and agreements with contingent financial implications have been strengthened and the staff responsible for the negotiation of such contingent liabilities will be trained on when to include the finance staff on future transactions.
Conclusion
In closing, the comments and suggestions provided by the external auditor each year are highly appreciated by management. We continue to find value in this feedback and will endeavor to implement appropriate policies and procedures in response. Finally, we welcome additional feedback and guidance from the PDC Audit Committee on these and other issues.
Board Resolution – Comprehensive Annual Financial Report for Fiscal Year 2011-12
January 9, 2013
Exhibit C
Page 3 of 3


![SAM3S8 / SAM3SD8 · 2019. 10. 13. · pioa / piob piodc[7:0] high speed mci datrg pdc pdc pdc pdc pdc pdc pdc pdc pdc pdc pdc pdc pdc dac0 dac1 timer counter 0 tc[0..2] ad[0..14]](https://static.fdocuments.in/doc/165x107/61180b84f50fc135d32d7973/sam3s8-sam3sd8-2019-10-13-pioa-piob-piodc70-high-speed-mci-datrg-pdc.jpg)


![AVR 32 Microcontroller · interface 0/1 two-wire interface pdc pdc pdc miso, mosi npcs[3..1] pwm[6..0] scl sda pdc usart1 rxd txd clk rts, cts dsr, dtr, dcd, ri usart0 usart2 pdc](https://static.fdocuments.in/doc/165x107/5f0949bf7e708231d4261bba/avr-32-microcontroller-interface-01-two-wire-interface-pdc-pdc-pdc-miso-mosi-npcs31.jpg)
![ARM-based Flash MCU - produktinfo.conrad.com · 128-Byte RX UART1 PDC Real-time Events PIO High Speed MCI DMA PDC PDC PDC PDC Timer Counter A TC[0..2] UART0 TWCK0 TWD0 TWD1 UTXD0](https://static.fdocuments.in/doc/165x107/5c387e4109d3f23f308b764d/arm-based-flash-mcu-128-byte-rx-uart1-pdc-real-time-events-pio-high-speed.jpg)