Audio -Frequency Power Amplifiers Principles of -Pull...
21
Americas Oldest Radio fchoo L=0P0/(O OR ,311fP,YfQ /JIthOlQ NOME OFFICE 75ic. S/reef, ,;, Ns , BOTH THE VOLTAGE AND POWER AMPLIFIERS IN THIS EQUIPMENT ARE BUILT INTO A SINGLE UNIT LOCATED IN THIS UPPER COMPARTMENT. TWO UX-112A TUBES (LEFT) AND FOUR UX-200 TUBES (RIGHT) ARE IN PUSH-PULL ARRANGEMENT. Audio -Frequency Power Amplifiers Principles of Push -Pull Amplification VOL,14 , No. 2 Dewey Classification R 140
Transcript of Audio -Frequency Power Amplifiers Principles of -Pull...
Americas Oldest Radio fchoo
L=0P0/(O OR
,311fP,YfQ /JIthOlQ
NOME OFFICE 75ic. S/reef, ,;, Ns ,
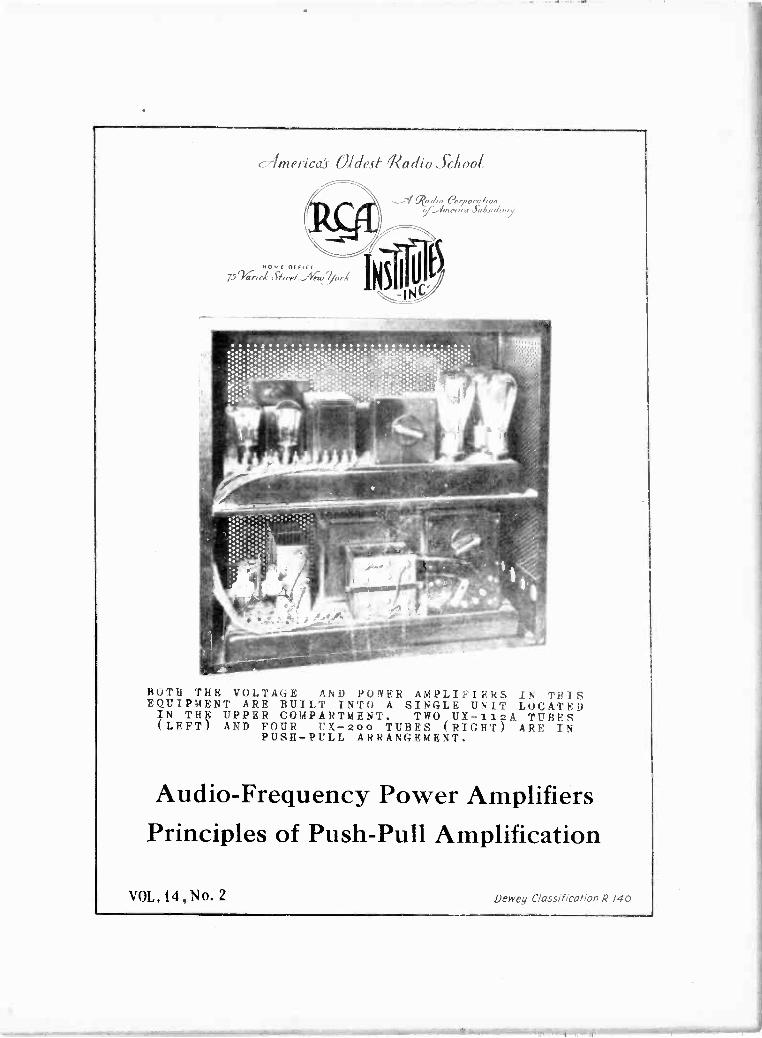
BOTH THE VOLTAGE AND POWER AMPLIFIERS IN THIS EQUIPMENT ARE BUILT INTO A SINGLE UNIT LOCATED IN THIS UPPER COMPARTMENT. TWO UX-112A TUBES (LEFT) AND FOUR UX-200 TUBES (RIGHT) ARE IN
PUSH-PULL ARRANGEMENT.
Audio -Frequency Power Amplifiers Principles of Push -Pull Amplification
VOL,14 , No. 2 Dewey Classification R 140
FOREWORD
This lesson deals with the
principles underlying the theory
of push-pull audio -frequency am-
plification. The text, written by
members of the instruction staff
at R.C.A. Institutes for "Motion
Picture Projectionist" and "Radio
News", is presented with illustra-
tions by courtesy of these publi-
cations.
V-14 #2
1 .. 1 1 Y
c-%nrrüa't OÍdert ealliO . )chnnl
°1 ° INSTI -_I N
AUDIO -FREQUENCY POWER AMPLIFIERS
PRINCIPLES OF PUSH-PULL AMPLIFICATION
Although numerous amplifier circuits have been brought out from time to time which are departures from generally accepted practice, there is one type of circuit that has been accorded a steadily increasing popularity since its invention and introduction to the field. To- day it is more firmly entrenched in technical favor than ever before. We refer to the push-pull circuit.
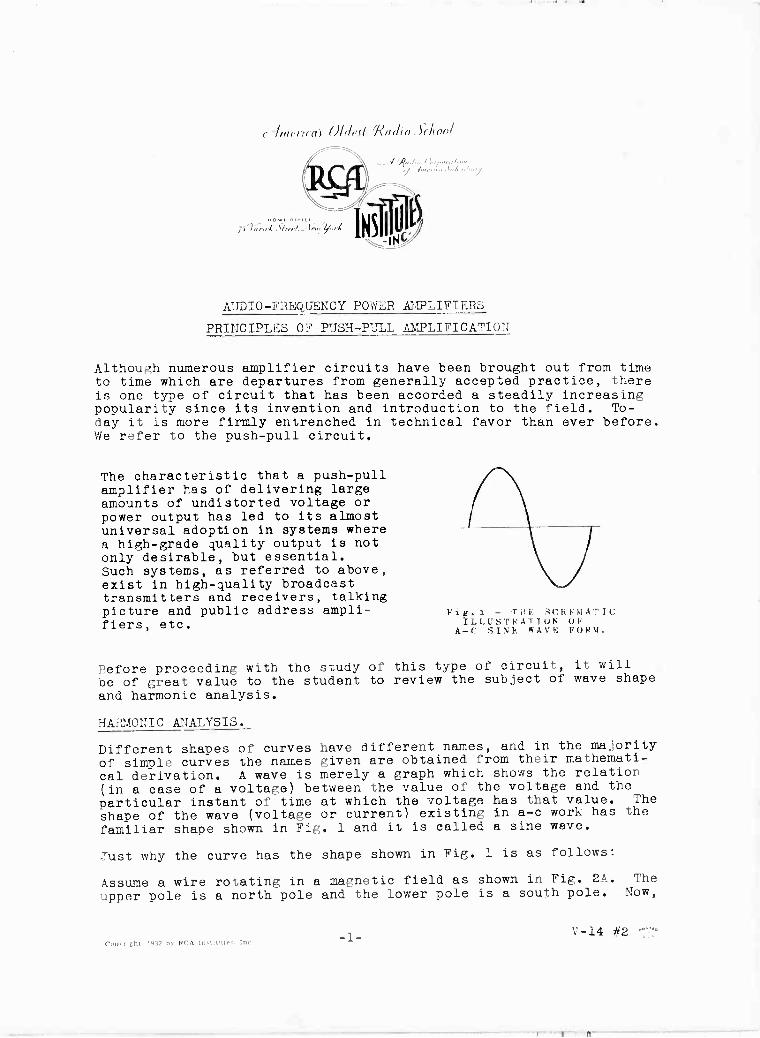
The characteristic that a push-pull amplifier has of delivering large amounts of undistorted voltage or power output has led to its almost universal adoption in systems where a high-grade quality output is not only desirable, but essential. Such systems, as referred to above, exist in high -quality broadcast transmitters and receivers, talking picture and public address ampli- fiers, etc.
Fig.1 - '1i E SCHEMATIC ILLUSTRATION OF
A -C SINE NAVE FORM.
Before proceeding with the study of this type of circuit, it will
be of great value to the student to review the subject of wave shape
and harmonic analysis.
HARMONIC ANALYSIS.
Different shapes of curves have different names, and in the majority of simple curves the names given are obtained from their mathemati-
cal derivation. A wave is merely a graph which shows the relation (in a case of a voltage) between the value of the voltage and the
particular instant of time at which the voltage has that value. The
shape of the wave (voltage or current) existing in a -c work has the
familiar shape shown in Fig. 1 and it is called a sine wave.
Just why the curve has the shape shown in Fig. 1 is as follows:
Assume a wire rotating in a magnetic field as shown in Fig. 2A. The
upper pole is a north pole and the lower pole is a south pole. Now,
Cum right 1932 by HCA 111,,t1tiite.,. Inc -1- V-14 #2
rt
2
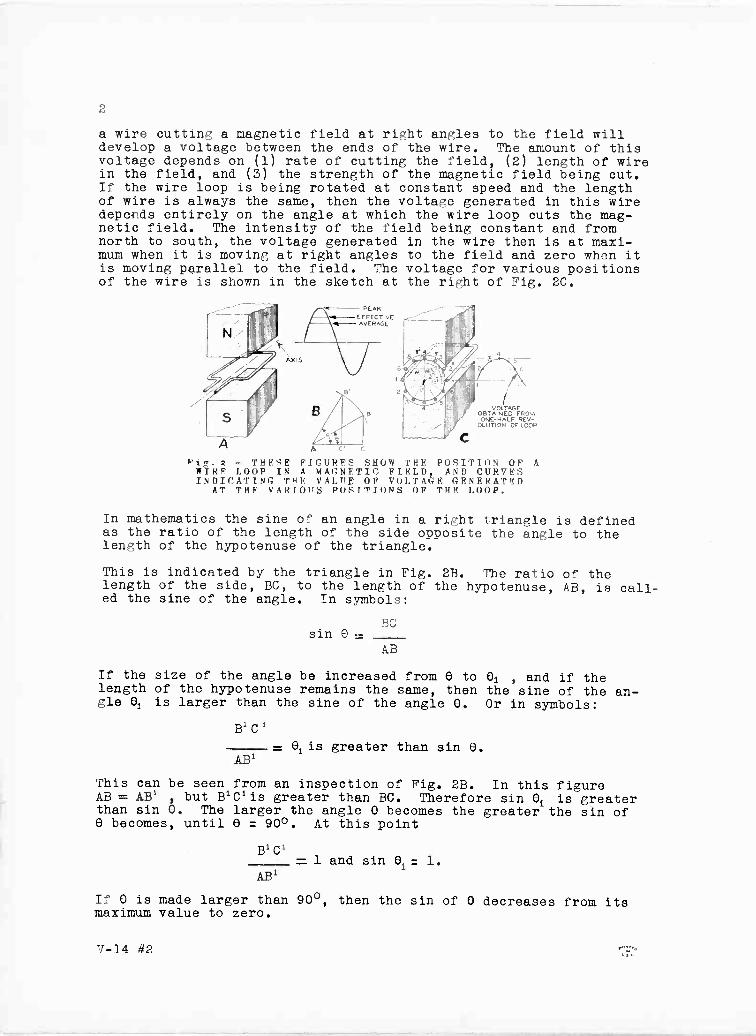
a wire cutting a magnetic field at right angles to the field will develop a voltage between the ends of the wire. The amount of this voltage depends on (1) rate of cutting the field, (2) length of wire in the field, and (3) the strength of the magnetic field being cut. If the wire loop is being rotated at constant speed and the length of wire is always the same, then the voltage generated in this wire depends entirely on the angle at which the wire loop cuts the mag- netic field. The intensity of the field being constant and from north to south, the voltage generated in the wire then is at maxi- mum when it is moving at right angles to the field and zero when it is moving parallel to the field. The voltage for various positions of the wire is shown in the sketch at the right of Fig. 2C.
A
PEAK EFFECTIVE !- AVERAGE
VOLTAGE OBTAINED FROM ONE-HALF REV-
OLUTION OF LOOP
A C C
Fig.2 - THESE FIGURES SHOW THE POSITION OF A WIRE LOOP IN A MAGNETIC FIELD AND CURVES INDICATING THE VALUE OF VOLTAGE GENERATED
AT THE VARIOUS POSITIONS OF THE LOOP.
In mathematics the sine of an angle in a right triangle is defined as the ratio of the length of the side opposite the angle to the length of the hypotenuse of the triangle.
This is indicated by the triangle in Fig. 2B. The ratio of the length of the side, BC, to the length of the hypotenuse, AB, is call- ed the sine of the angle. In symbols:
sin 0 - BC
AB
If the size of the angle be increased from 6 to 61 , and if the length of the hypotenuse remains the same, then the sine of the an- gle 61 is larger than the sine of the angle O. Or in symbols:
B1 C'
- O1 is greater than sin O. AB'
This can be seen from an inspection of Fig. 2B. In this figure AB = AB' , but B'C'is greater than BC. Therefore sin O1 is greater than sin 6. The larger the angle 6 becomes the greater the sin of O becomes, until 6 = 900. At this point
AB'
If 0 is made larger than 90°, then the sin of 6 decreases from its maximum value to zero.
7-14 42
B1 Cl = 1 and sin 01 = 1.

3
Consider now the diagram of Fig. 2C. When the ends of the wire are in position 1 no voltage is generated, since the wire is moving par- allel to the main field. In position 2 the voltage generated is
small, being given by the length BtC1. When the wire reaches posi- tions 3 and 4 the magnitude of the voltage generated is given by the lengths BZCZ and B3C3, respectively. For position 4 the voltage generated is at maximum, the wire cutting the field at right angles. The lengths BIC, BzCz, B3C3correspond to the instantaneous values of the voltage generated when the wire reaches positions 2, 3 and 4,
which also correspond to angles 01,0 and 03.
For any position of the loop, the sine of the angle made with res- pect to the horizontal position (which corresponds to zero voltage in the wire) is given as the ratio of instantaneous value of the voltage to the maximum value. Thus:
or,in symbols:
sine O = instantaneous value
maximum value
sine e = Ern
or: = Er.,.sine e
where: e = instantaneous value Ew,. = maximum value
The shape of the curve merely shows the manner in which the instan- taneous value of the voltage varies as the loop completes one revo- lution. It must not be supposed that if it were possible to see the voltage existing between the terminals of the loop, it would have the shape as shown in Fig. 1. The proper viewpoint to assume is that the intensity of the voltage existing would vary from instant to in- stant in the manner pictorially represented by Fig. 1. The effec- tive (r.m.s.) average and peak values are as indicated in Fig. 2.
By definition any wave is a distorted wave if it does not follow the variations, specified by a sine shape. Since all calculations are based'on the assumption of a pure sine wave, then, if a dis- torted wave is present, the proper corrections must be applied to compensate for this irregularity. Distorted waves result from vari- ous causes, such as unsymmetrical design of an alternator, overload- ing of a vacuum tube or by the use of iron -core inductances. The
latter two will be discussed more in detail later.
If a distorted wave is present, then formulas which were originally derived on the assumption of the application of a pure sine wave will yield erroneous results if a distorted wave is used. For convenience a distorted wave may be resolved into a pure sine wave of the same frequency as the distorted wave (which pure sine wave is known as the fundamental), plus pure sine waves of frequencies which are mul- tiples of the fundamental frequency. These latter waves are known as harmonics. Any distorted wave is a composite of a fundamental and harmonic frequency. This is illustrated in Fig. 3.
V-14 0/2
4
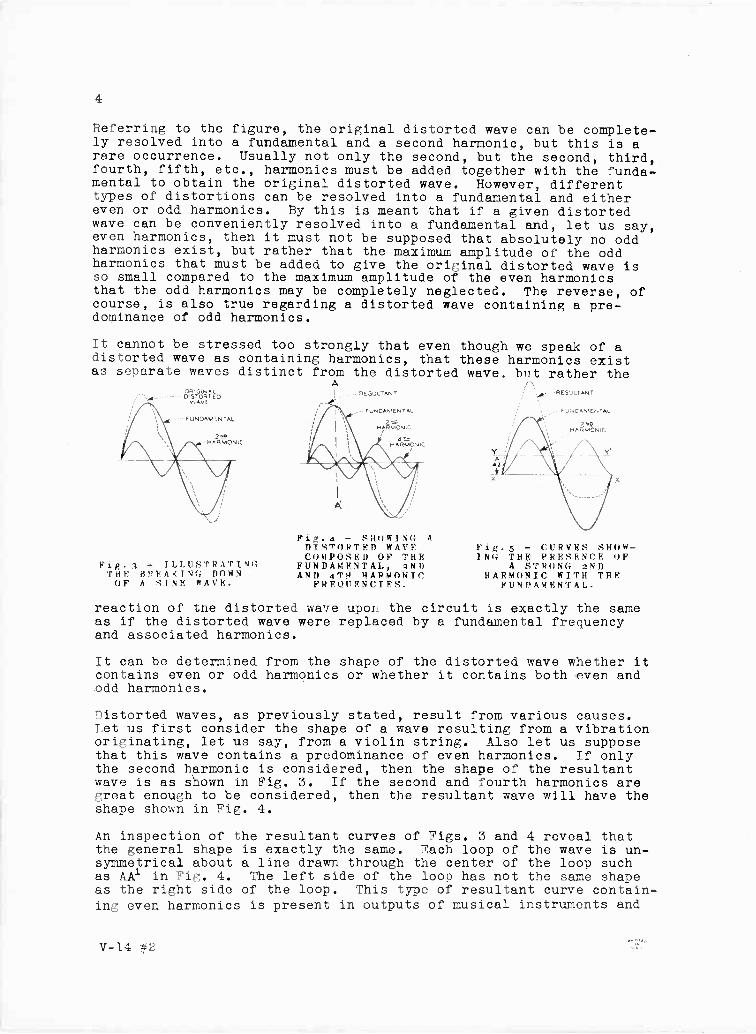
Referring to the figure, the original distorted wave can be complete- ly resolved into a fundamental and a second harmonic, but this is a rare occurrence. Usually not only the second, but the second, third, fourth, fifth, etc., harmonics must be added together with the funda- mental to obtain the original distorted wave. However, different types of distortions can be resolved into a fundamental and either even or odd harmonics. By this is meant that if a given distorted wave can be conveniently resolved into a fundamental and, let us say, even harmonics, then it must not be supposed that absolutely no odd harmonics exist, but rather that the maximum amplitude of the odd harmonics that must be added to give the original distorted wave is so small compared to the maximum amplitude of the even harmonics that the odd harmonics may be completely neglected. The reverse, of course, is also true regarding a distorted wave containing a pre- dominance of odd harmonics.
It cannot be stressed too strongly that even though we speak of a distorted wave as containing harmonics, that these harmonics exist as separate waves distinct from the distorted wave, but rather the
ORIGINAL -DiSTORTED
wAV E
. UNDAMENTAL
2 2 MARM( ilk A - -
Fig.3 - ILLUSTRATING' THE BREAKING DOWN OF A SINE WAVE.
A
Fig.4 - SHOWING A DISTORTED WAVE COMPOSED OF THE.
FUNDAMENTAL, 2ND AND 4TH HARMONIC
FREQUENCIES.
; ' - RE5',LTANT
Fig.5 - CURVES SHOW- ING THE PRESENCE OF
A STRUNG 2ND HARMONIC WITH THE
FUNDAMENTAL.
reaction of the distorted wave upon the circuit is exactly the same as if the distorted wave were replaced by a fundamental frequency and associated harmonics.
It can be determined from the shape of the distorted wave whether it contains even or odd harmonics or whether it contains both even and -odd harmonics.
Distorted waves, as previously stated, result from various causes. Let us first consider the shape of a wave resulting from a vibration originating, let us say, from a violin string. Also let us suppose that this wave contains a predominance of even harmonics. If only the second harmonic is considered, then the shape of the resultant wave is as shown in Fig. 3. If the second and fourth harmonics are great enough to be considered, then the resultant wave will have the shape shown in Fig. 4.
An inspection of the resultant curves of Figs. 3 and 4 reveal that the general shape is exactly the same. Each loop of the wave is un- symmetrical about a line drawn through the center of the loop such as AA1 in Fig. 4. The left side of the loop has not the same shape as the right side of the loop. This type of resultant curve contain- ing even harmonics is present in outputs of musical instruments and
V-14 #2
5
voice. The currents flowing through the primary of a transformer,
with the secondary open and no direct current flowing through the
primary, has the shape of the curve in Fig. 3, which is due to the
hysteresis loop of the iron. It should be noted that the amplitude
of the upper loop is equal to the amplitude of the lower loop.
There exists another type of distorted wave which bears a very de- finite relation to quality of reproduction. This type of wave is
the main cause of distortion in amplifiers and is shown in Fig. 5.
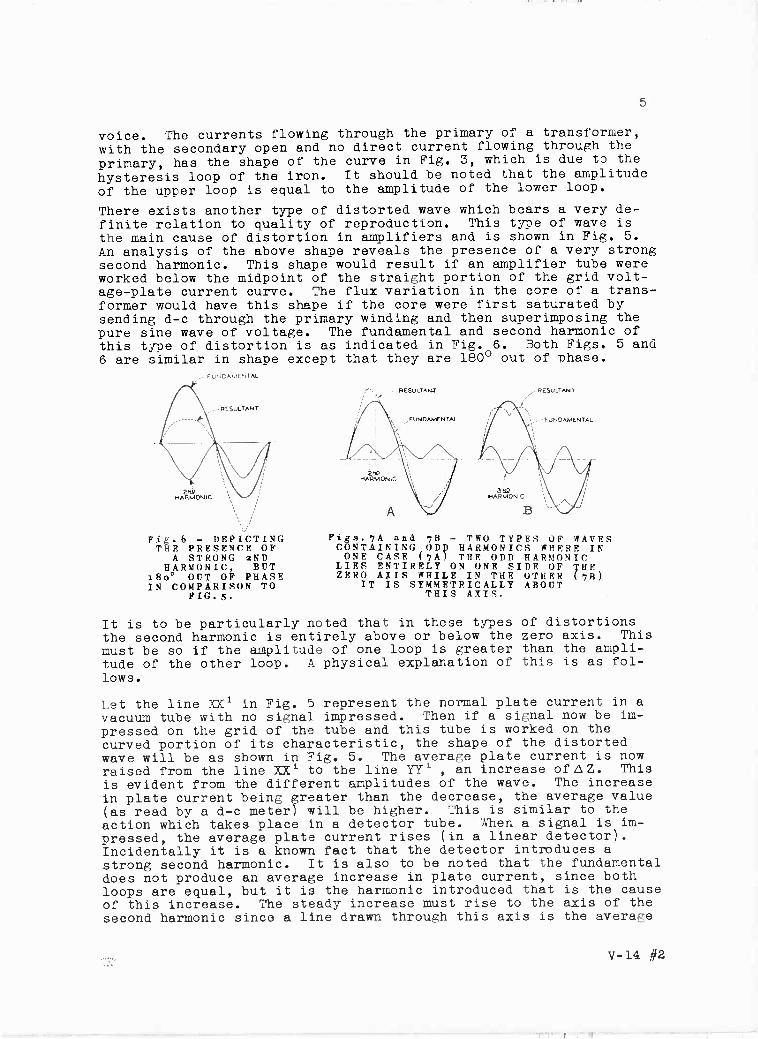
An analysis of the above shape reveals the presence of a very strong second harmonic. This shape would result if an amplifier tube were worked below the midpoint of the straight portion of the grid volt- age -plate current curve. The flux variation in the core of a trans- former would have this shape if the core were first saturated by sending d -c through the primary winding and then superimposing the pure sine wave of voltage. The fundamental and second harmonic of this type of distortion is as indicated in Fig. 6. Both Figs. 5 and 6 are similar in shape except that they are 180° out of phase.
FUNDAMEI,TAL
Figg b - DEPICTING THE PRESENCE OF
A STRONG 2ND HARMONIC BUT
1820 OUT O1 PHASE IN COMPARISON TO
FIG. s.
/-RESULTANi
FUNDAMENTAL
Figa.7A and 7B - TWO TYPES OF WAVES CONTAINING ODp HARMONICS WHERE IN ONE CASE (TA) THE ODD HARMONIC
LIES ENTIRELY ON ONE SIDR OF THE ZERO AXIS WHILE IN THE OTHER (,03)
IT IS SYMMETRICALLY ABOUT THIS AXIS.
It is to be particularly noted that in these types of distortions the second harmonic is entirely above or below the zero axis. This must be so if the amplitude of one loop is greater than the ampli- tude of the other loop. A physical explanation of this is as fol- lows.
Let the line XX1 in Fig. 5 represent the normal plate current in a
vacuum tube with no signal impressed. Then if a signal now be im-
pressed on the grid of the tube and this tube is worked on the curved portion of its characteristic, the shape of the distorted wave will be as shown in Fig. 5. The average plate current is now raised from the line XX1 to the line YY1 , an increase of 0 Z. This is evident from the different amplitudes of the wave. The increase in plate current being greater than the decrease, the average value (as read by a d -c meter) will be higher. This is similar to the
action which takes place in a detector tube. When a signal is im- pressed, the average plate current rises (in a linear detector). Incidentally it is a known fact that the detector introduces a strong second harmonic. It is also to be noted that the fundamental does not produce an average increase in plate current, since both loops are equal, but it is the harmonic introduced that is the cause of this increase. The steady increase must rise to the axis of the second harmonic since a line drawn through this axis is the average
V-14 #2
,
6
of the harmonic wave. It therefore follows that if in any wave shape having one loop greater than the other a strong second harmon- ic exists which lies on the side of the zero line having the greater loop.
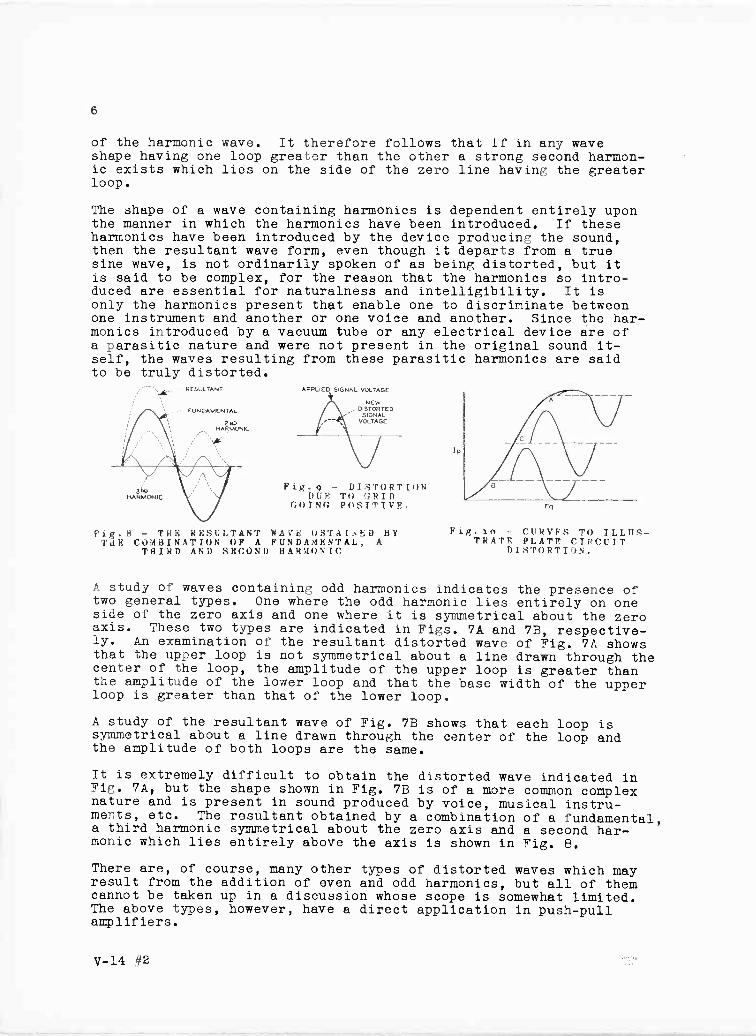
The shape of a wave containing harmonics is dependent entirely upon the manner in which the harmonics have been introduced. If these harmonics have been introduced by the device producing the sound, then the resultant wave form, even though it departs from a true sine wave, is not ordinarily spoken of as being distorted, but it is said to be complex, for the reason that the harmonics so intro- duced are essential for naturalness and intelligibility. It is only the harmonics present that enable one to discriminate between one instrument and another or one voice and another. Since the har- monics introduced by a vacuum tube or any electrical device are of a parasitic nature and were not present in the original sound it- self, the waves resulting from these parasitic harmonics are said to be truly distorted.
APPLIED SIGNAL VOLTAGE
ANEW DISTORTED
SIGNAL VOLTAGE
Fig.9 - DISTORTION DUE TO GRID
GOING POSITIVE.
Pig.8 - THE RESULTANT WAVE OBTAINED BY THE COMBINATION OF A FUNDAMENTAL, A
THIRD AND SECOND HARMONIC
Ip
Eg
Fig.io - CURVES TO ILLUS- TRATE PLATE CIRCUIT
DISTORTION.
A study of waves containing odd harmonics indicates the presence of two general types. One where the odd harmonic lies entirely on one side of the zero axis and one where it is symmetrical about the zero axis. These two types are indicated in Figs. 7A and 7B, respective- ly. An examination of the resultant distorted wave of Fig. 7A shows that the upper loop is not symmetrical about a line drawn through the center of the loop, the amplitude of the upper loop is greater than the amplitude of the lower loop and that the base width of the upper loop is .greater than that of the lower loop.
A study of the resultant wave of Fig. 7B shows that each loop is symmetrical about a line drawn through the center of the loop and the amplitude of both loops are the same.
It is extremely difficult to obtain the distorted wave indicated in Fig. 7A, but the shape shown in Fig. 7B is of a more common complex nature and is present in sound produced by voice, musical instru- ments, etc. The resultant obtained by a combination of a fundamental, a third harmonic symmetrical about the zero axis and a second har- monic which lies entirely above the axis is shown in Fig. 8.
There are, of course, many other types of distorted waves which may result from the addition of even and odd harmonics, but all of them cannot be taken up in a discussion whose scope is somewhat limited. The above types, however, have a direct application in push-pull amplifiers.
V-14 #2
7
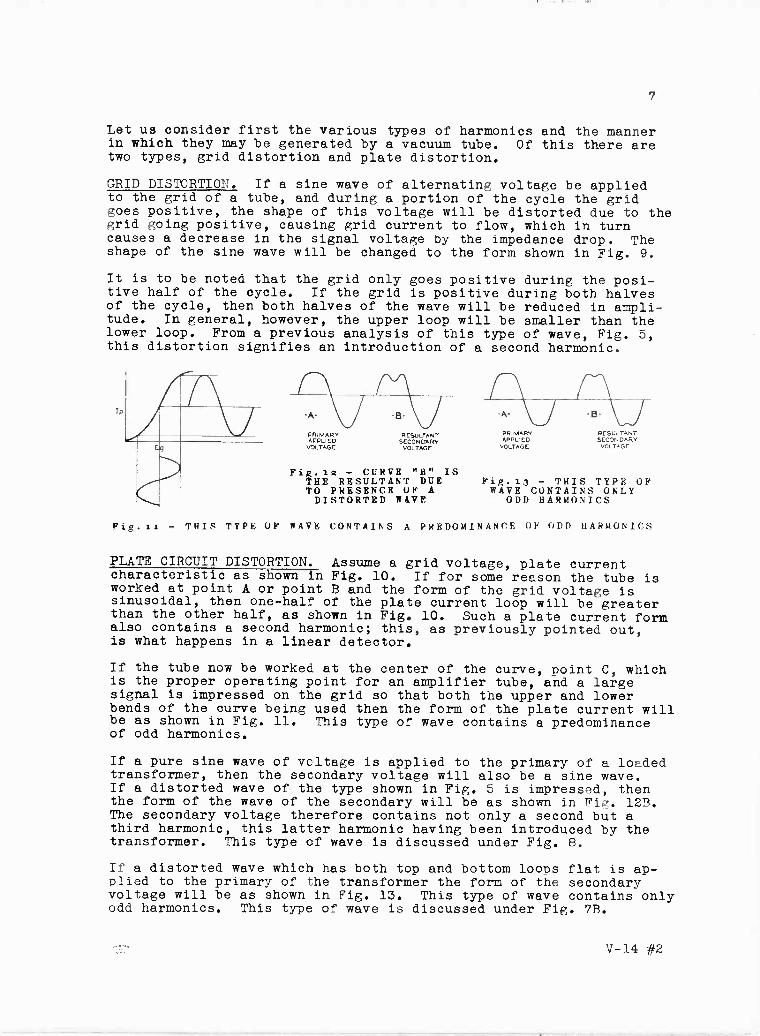
Let us consider first the various types of harmonics and the manner in which they may be generated by a vacuum tube. Of this there are two types, grid distortion and plate distortion.
GRID DISTORTION. If a sine wave of alternating voltage be applied to the grid of a tube, and during a portion of the cycle the grid goes positive, the shape of this voltage will be distorted due to the grid going positive, causing grid current to flow, which in turn causes a decrease in the signal voltage by the impedance drop. The shape of the sine wave will be changed to the form shown in Fig. 9.
It is to be noted that the grid only goes positive during the posi- tive half of the cycle. If the grid is positive during both halves of the cycle, then both halves of the wave will be reduced in ampli- tude. In general, however, the upper loop will be smaller than the lower loop. From a previous analysis of this type of wave, Fig. 5, this distortion signifies an introduction of a second harmonic.
PRIMARY APPLIED VOLTAGE
RESULTANT SECONDARY
VOLTAGE
Fig.12 - CURVE "B" IS THE RESULTANT DUE TO PRESENCE OF A DISTORTED WAVE
-A-
PR ,K1 ARV APPLIED
VOLTAGE
-B-
RESULTANT SECONDARY
VOLTAGE
Fig.i3 - THIS TYPE OF WAVE CONTAINS ONLY
ODD HARMONICS
Fio.ii - THIS TYPE OF WAVE CONTAINS A PREDOMINANCE OF ODD HARMONICS
PLATE CIRCUIT DISTORTION. Assume a grid voltage, plate current characteristic as shown in Fig. 10. If for some reason the tube is worked at point A or point B and the form of the grid voltage is sinusoidal, then one-half of the plate current loop will be greater than the other half, as shown in Fig. 10. Such a plate current form also contains a second harmonic; this, as previously pointed out, is what happens in a linear detector.
If the tube now be worked at the center of the curve, point C, which is the proper operating point for an amplifier tube, and a large signal is impressed on the grid so that both the upper and lower bends of the curve being used then the form of the plate current will be as shown in Fig. 11. This type of wave contains a predominance of odd harmonics.
If a pure sine wave of voltage is applied to the primary of a loaded transformer, then the secondary voltage will also be a sine wave. If a distorted wave of the type shown in Fig. 5 is impressed, then the form of the wave of the secondary will be as shown in Fig. 12B. The secondary voltage therefore contains not only a second but a third harmonic, this latter harmonic having been introduced by the transformer. This type of wave is discussed under Fig. 8.
If a distorted wave which has both top and bottom loops flat is ap- plied to the primary of the transformer the form of the secondary voltage will be as shown in Fig. 13. This type of wave contains only odd harmonics. This type of wave is discussed under Fig. 7B.
V-14 #2
8
In any case where the primary voltage is flat-topped the secondary voltage contains a dip. This is evident from the fact that the secon- dary voltage depends upon the change in primary voltage. During the flat portion of the wave the change in voltage is practically zero, which means that during this flat portion the secondary voltage will drop.
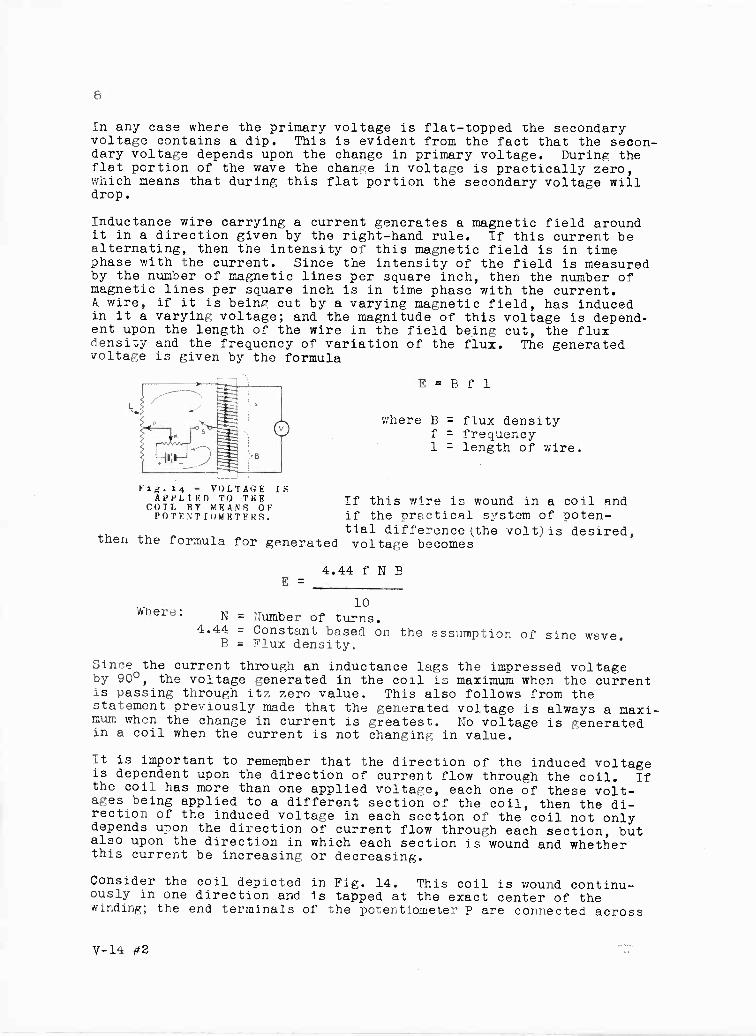
Inductance wire carrying a current generates a magnetic field around it in a direction given by the right-hand rule. If this current be alternating, then the intensity of this magnetic field is in time phase with the current. Since the intensity of the field is measured by the number of magnetic lines per square inch, then the number of magnetic lines per square inch is in time phase with the current. A wire, if it is being cut by a varying magnetic field, has induced in it a varying voltage; and the magnitude of this voltage is depend- ent upon the length of the wire in the field being cut, the flux density and the frequency of variation of the flux. The generated voltage is given by the formula
118.14 - VOLTAGE IS APPLIED TO THE
COIL BY MEANS OF POTENTIOMETFRS.
E = B f 1
where B = flux density f = frequency 1 = length of wire.
If this wire is wound in a coil and if the practical system of poten- tial difference(the volt)is desired,
then the formula for generated voltage becomes
Where:
4.44 f N B E _
10 N = Number of turns.
4.44 = Constant based on the assumption of sine wave. B = Flux density.
Since the current through an inductance lags the impressed voltage by 90°, the voltage generated in the coil is maximum when the current is passing through itz zero value. This also follows from the statement previously made that the generated voltage is always a maxi- mum when the change in current is greatest. No voltage is generated in a coil when the current is not changing in value.
It is important to remember that the direction of the induced voltage is dependent upon the direction of current flow through the coil. If the coil has more than one applied voltage, each one of these volt- ages being applied to a different section of the coil, then the di- rection of the induced voltage in each section of the coil not only depends upon the direction of current flow through each section, but also upon the direction in which each section is wound and whether this current be increasing or decreasing.
Consider the coil depicted in Fig. 14. This coil is wound continu- ously in one direction and is tapped at the exact center of the winding; the end terminals of the potentiometer P are connected across
V-14 #2
9
the extreme terminals of the coil. A variable voltage is interposed between the slider on P and the center tap of the winding. The variable voltage is obtained by means of an additional potentiometer K placed across the battery. The voltmeter V is placed across the ends of the coil to indicate the total generated voltage across the coil.
CASE I. Suppose both potentiometer sliders be kept in their center positions and switch S suddenly closed, current will flow through the circuit and through the coil in the directions shown in Fig. 14. Since the coil is wound continously in one direction and the current in section A is flowing in the opposite direction to the current in section B, the voltage generated in section A will be opposed to the voltage generated in section B (these being 1800 out of phase) and the voltmeter V which indicates the total voltage generated across the entire coil will not show any indication.
CASE II. Suppose switch S be open and the potentiometer slider be moved to point L, then if switch S be suddenly closed the current through section A of the coil will be greater than the current through section B. The voltage generated across section A will be greater than the voltage generated across section B. The voltmeter V will indicate and its indication will be equal to the difference between the voltages generated in sections A and B.
It should be noted that thus far the circuit is merely a simple bridge affair and the considerations outlined in cases I and II apply when the bridge is balanced and when it is unbalanced.
CASE III. Suppose switch S is now closed and the sliders of both potentiometers be kept at their center positions. A steady current will flow through the windings of the coil. If the slider of poten- tiometer P now be moved to position L the current through section A increases above its normal value, generating a certain voltage across section A. At the same time the current through section B decreases below its normal value, generating a voltage in section B which adds to the voltage generated in section A, producing a volt- age across the entire coil which is the sum of the voltages in each section. The reason for the voltage generated in section B now being additive is that, whereas, in case II the currents in each section were increasing in opposite directions, the voltages gener- ated were 180° out of phase, while in this consideration the current through section B suffered a different type of change. That is, it was decreasing instead of increasing, which resulted in a reversal of the polarity of the voltage generated in section B.
With the above facts in mind, we can now proceed to study the push- pull amplifier, and the reasons for its use.
In the early days of the art, if more power was desired from an am- plifier, there were two means of obtaining it. One way was to double up on the number of output tubes used, i.e., connect another tube in parallel with the first. This meant that the two grids and the two plates were connected together respectively. In operation, the pair of tubes functioned practically as one tube of twice the dimensions and hence twice the power output.
V-14 #2
10
The second method was actually to use a larger tube. This, however, is essentially the same as using two tubes in parallel, at least from a theoretical viewpoint.
The push-pull circuit was invented by Colpitts. Basically, the arrangement was such that the grids of the two tubes acted opposite to each other upon their respective plate currents, and the latter were so coupled to the load as to have an additive effect. The net effect was that the two tubes acted as if they were connected in series to the load, much like two locomotives coupled to a freight train.
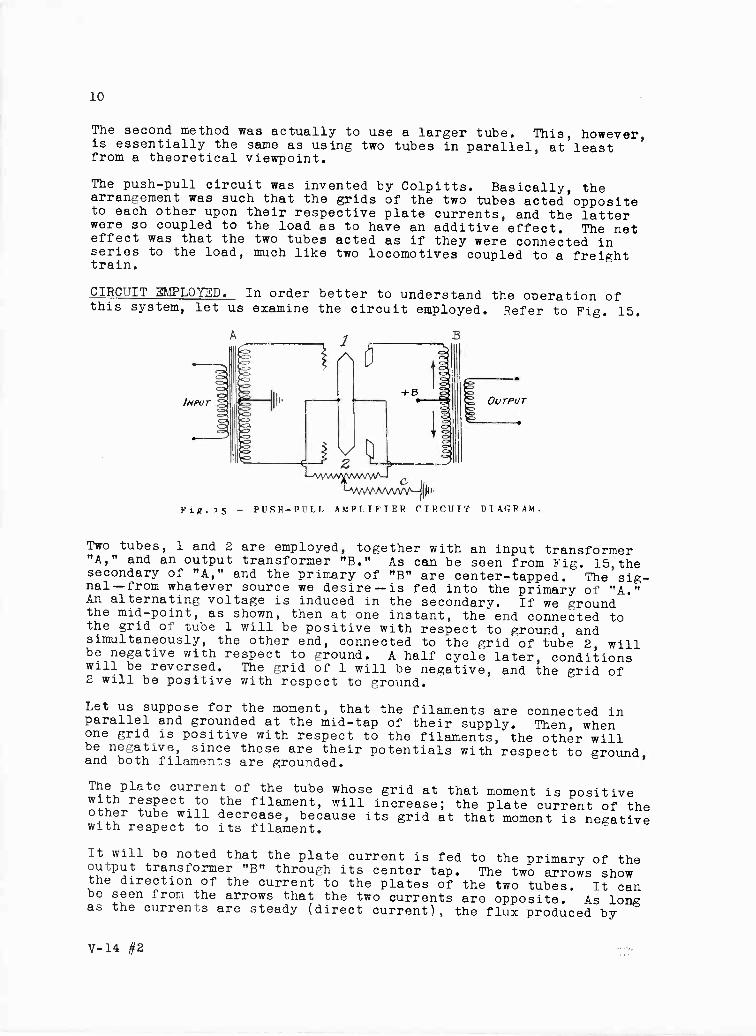
CIRCUIT EMPLOYED. In order better to understand the operation of this system, let us examine the circuit employed. Refer to Fig. 15.
Fig.15 - PUSH-PULL AMPLIFIER CIRCUIT DIAGRAM.
Two tubes, 1 and 2 are employed, together with an input transformer "A," and an output transformer "B." As can be seen from Fig. 15,the secondary of "A," and the primary of "B" are center -tapped. The sig- nal --from whatever source we desire --is fed into the primary of "A." An alternating voltage is induced in the secondary. If we ground the mid -point, as shown, then at one instant, the end connected to the grid of tube 1 will be positive with respect to ground, and simultaneously, the other end, connected to the grid of tube 2, will be negative with respect to ground. A half cycle later, conditions will be reversed. The grid of 1 will be negative, and the grid of 2 will be positive with respect to ground.
Let us suppose for the moment, that the filaments are connected in parallel and grounded at the mid -tap of their supply. Then, when one grid is positive with respect to the filaments, the other will be negative, since these are their potentials with respect to ground, and both filaments are grounded.
The plate current of the tube whose grid at that moment is positive with respect to the filament, will increase; the plate current of the other tube will decrease, because its grid at that moment is negative with respect to its filament.
It will be noted that the plate current is fed to the primary of the output transformer "B" through its center tap. The two arrows show the direction of the current to the plates of the two tubes. It can be seen from the arrows that the two currents are opposite. As long as the currents are steady (direct current), the flux produced by
V-14 #2
11
either will be steady. However, if the two currents are equal, the flux produced will be zero, since the currents flow in opposite di- rections through the primary windings, and nullify each other magneti- cally.
EFFECTS ADDITIVE. If the current to tube 1 increases for instance, its flux increases. This change in flux induces a voltage in the secondary of "B" in the direction, let us say, toward the top of the drawing. Now if the current to tube 2 decreases, it will not "buck" the current going to tube 1 as much as before, so that the latter current can produce more flux than it otherwise could. The result is that the flux change will be greater than before, and the voltage in the secondary of "B" will be increased. Thus, an increase in the current to tube 1, or a decrease in the current to tube 2, will each induce a voltage in the same direction in the secondary of "B," i.e., the current changes are additive in effect, and one current change is just as effective as the other in inducing voltage in the secon- dary. Thus, the two tubes act in series, as far as the secondary is concerned, since their voltage inducing effects in the secondary are in the same direction and hence additive.
When the grids of the two tubes assume polarities opposite to those assumed above, the current in tube 1 decreases, and that in tube 2
increases, and a voltage is induced in the secondary in the opposite direction but, nevertheless, the two tubes are still additive in
their effects.
In this way twice the alternating voltage is induced in the secondary by the two tubes as compared to that which one tube alone could pro- duce, so that the two tubes at all times act in series. By a simi- lar method of reasoning it can be seen that the internal plate re- sistances of the two tubes are in series, so that we have twice the plate voltage of one tube acting through twice the plate resistance of one tube to feed current into the output transformer and load.
APPLICATION OF BIAS. So far we have considered the circuit as oper- ating without any grid bias, i.e., if no signal is impressed upon the grids, they are at ground potential, and hence at the same poten- tial as the filaments. By inserting resistor "C" between the center tap of the filament supply (here obtained by means of a potentiometer and ground) the plate currents, in flowing back to the filaments,
have to pass through "C," and cause a voltage drop in it of such di-
rection as to make the filaments positive with respect to ground.
Since the grids are normally at ground potential, they are now nega-
tive with respect to the filaments, that is, have a negative bias
with respect to the filaments. Resistor "C" is thus the well-known
grid biasing resistor, only a by-pass condenser is not usually con- nected in parallel with it, as will be explained later.
In this arrangement, if one grid receives a positive voltage from the
incoming signal, its negative bias is reduced. The other grid simul-
taneously receives a negative voltage from the incoming signal, so
that its negative bias is increased. The signal must be below the
value that would make the first -mentioned grid go actually positive
with respect to the filaments, or the other grid go so negative that
the plate current is reduced to zero before the grid has reached its
lowest negative value. These limitations to signal strength are
exactly the same as those for a single tube amplifier operating with -
V -14 #2
12
out distortion. In short, a push-pull amplifier does not work the tubes any more completely than an ordinary amplifier, so that each tube delivers the same output in either case. Hence the output of the two tubes in push-pull arrangement is approximately twice that in a single tube amplifier, and not three to four times as much, as is so often claimed.
OUTPUT POWER. So far it would appear we have gained nothing by put- ting the-tés in push-pull arrangement instead of in parallel. It is seen that the transformers used require center taps, and hence are apparently more expensive to manufacture than those used in the ordinary cascade amplifier. Now suppose there is greater capacity between the turns of one-half the secondary of "A" than the other, the phase between the voltages applied to the two grids will not be the same, i.e., the voltages applied to the two grids will not go through their maximum values simultaneously.
A similar effect may be obtained if the leakage reactance between one- half of the primary of "B" with respect to the secondary is not the same as that of the other half. In either case the output will not be twice that of one tube, but somewhat less, depending upon the phase angle between the two voltages, so that the full benefit of the two tubes is not realized.
ADVANTAGES OF THE CIRCUIT. Nevertheless, this circuit has so many important advantages that the above consideration is of little com- parative consequence. In the first place, examination of Fig. 15 shows that the steady or average value of the d -c current of either tube (as measured by a d -c milliammeter), flows in a direction through its half of the primary of "B" opposite to that of the plate current of the other tube. Thus, if the tubes have nearly equal plate cur- rents, they practically balance each other magnetically, and produce little or no steady (d -c) flux in the core of "B." Thus, the core can be made smaller without any danger arising of its becoming satur- ated, and the importance of this may be appreciated when it is rea- lized that the plate current of either power tube is quite large and would saturate even a larger core if present there by itself. Of course, on the other hand, care must be taken in operation to see that the plate currents are nearly balanced, otherwise saturation will occur. As an example in a certain output transformer designed for use with two UX-245 tubes, the difference between the two plate cur- rents must not exceed five milliamperes. In the case of large tubes, they are arranged so that the grid bias of each may be adjusted inde- pendently, so that the plate currents can be matched.
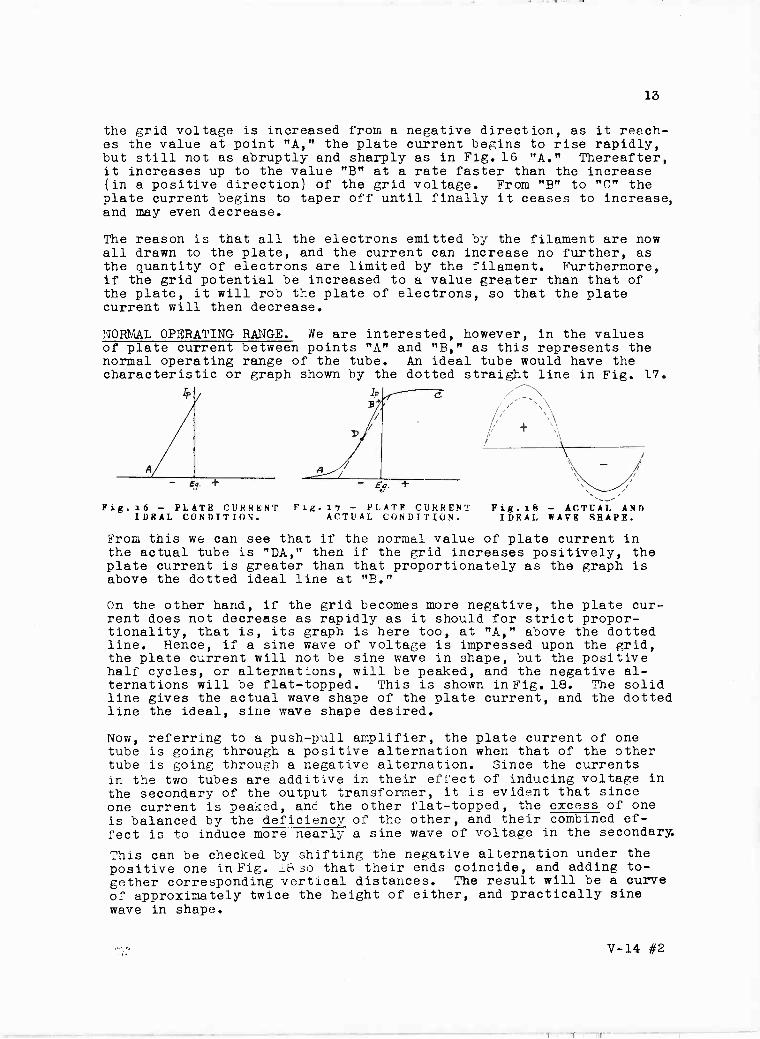
The second advantage --that of cancellation of the second harmonic, is more generally appreciated. To demonstrate this effect, we shall refer to Figs. 16,17 and 18. In Fig. 16 we have plotted the variation in plate current Ip with that of grid voltage Eg for an ideal tube. In such a tube the plate current (measured along the vertical axis) is strictly proportional to the grid voltage (measured along the horizontal axis), and the graph is a straight line, because only in the case of a straight line is the rise in proportion to the distance along the horizontal direction. In particular, if the voltage ap- plied to the grid were of sine wave in shape, the variation in the plate current would be sine wave in shape.
In practice, however, tubes do not have such ideal characteristics. Instead, the graph is that shown in Fig. 17 (solid line). Here, as
V-14 #2
13
the grid voltage is increased from a negative direction, as it reach- es the value at point "A," the plate current begins to rise rapidly, but still not as abruptly and sharply as in Fig. 16 "A." Thereafter, it increases up to the value "B" at a rate faster than the increase (in a positive direction) of the grid voltage. From "B" to "C" the plate current begins to taper off until finally it ceases to increase, and may even decrease.
The reason is that all the electrons emitted by the filament are now all drawn to the plate, and the current can increase no further, as the quantity of electrons are limited by the filament. Furthermore, if the grid potential be increased to a value greater than that of the plate, it will rob the plate of electrons, so that the plate current will then decrease.
NORMAL OPERATING RANGE. Ne are interested, however, in the values of plate current between points "A" and "B," as this represents the normal operating range of the tube. An ideal tube would have the characteristic or graph shown by the dotted straight line in Fig. 17.
Ip k a \
Fig.i6 - PLATE CURRENT IDEAL CONDITION.
Ei.
Fig.iry - PLATE CURRENT ACTUAL CONDITION.
Fig. 18 - ACTUAL AND IDEAL FADE SHAPE.
From this we can see that if the normal value of plate current in the actual tube is "DA," then if the grid increases positively, the plate current is greater than that proportionately as the graph is above the dotted ideal line at "B."
On the other hand, if the grid becomes more negative, the plate cur- rent does not decrease as rapidly as it should for strict propor- tionality, that is, its graph is here too, at "A," above the dotted line. Hence, if a sine wave of voltage is impressed upon the grid, the plate current will not be sine wave in shape, but the positive half cycles, or alternations, will be peaked, and the negative al- ternations will be flat-topped. This is shown in Fig. 18. The solid line gives the actual wave shape of the plate current, and the dotted line the ideal, sine wave shape desired.
Now, referring to a push-pull amplifier, the plate current of one tube is going through a positive alternation when that of the other tube is going through a negative alternation. Since the currents in the two tubes are additive in their effect of inducing voltage in
the secondary of the output transformer, it is evident that since one current is peaked, and the other flat-topped, the excess of one is balanced by the deficiency of the other, and their combined ef-
fect is to induce more nearly a sine wave of voltage in the secondary.
This can be checked by shifting the negative alternation under the positive one in Fig._csso that their ends coincide, and adding to- gether corresponding vertical distances. The result will be a curve of approximately twice the height of either, and practically sine wave in shape.
V-14 #2
14
Thus, by causing the plate currents of the two tubes to vary oppo- sitely to each other, the distorting effect of one is balanced by the oppositely distorting effect of the other, and the net result is more faithful amplification. The distortion of either tube con- sists mainly of the second harmonic of the sine wave to be amplified, and it is this harmonic that is practically eliminated by a push- pull amplifier. Note that if the two tubes were in parallel, their plate currents would both simultaneously increase and decrease, so that no cancellation of the second harmonic could occur. Also, it is to be noted that both plate currents would flow through the same primary in the same direction, so that the d -c or steady flux would be doubled instead of cancelled, as is the case in the push-pull am- plifier.
PLATE CURRENT. Since when the plate current of one tube is increas- ing, that in the other is decreasing, the sum of the two is practi- cally constant, so that there is no audio component flowing into the center tap of the output transformer --"B," Fig. 15. This means that the last condenser in the plate supply filter circuit does not have to be so large, since it does not have to by-pass a large audio com- ponent coming from the power tubes. Also high regulation of the plate supply voltage has no bad effects, as it would on a single pow- er tube, or two connected in parallel. Furthermore, since there is no appreciable audio component flowing through the grid biasing re- sistor, it does not have to be by-passed with a condenser, and this, too, represents a considerable saving, since for power tubes the plate current is large, the grid biasing resistor is low, and there- fore otherwise has to be by-passed with a large condenser.
EQUALIZING EFFECT OF GRID BIAS RESISTOR. It was stated in the pre- ceding paragraph that the increase in plate current in one tube was balanced by the decrease in the other, so that the total plate cur- rent is constant. This is, however, not strictly so, for it will be remembered that due to the curvature of the tube characteristic, as shown in Fig. 17, the increase in plate current is greater than the decrease for equal and opposite grid voltages. Consequently, there is a second harmonic current of small magnitude --flowing in the cir- cuit, and in particular, through the grid biasing resistor.
Now, in general, an increase in plate current tends to increase the grid bias, and thus depress the grid voltage, and consequently de- crease the plate current. In other words, as the grid tends to in- crease the plate current, the latter tends to prevent this through its action on the grid biasing resistor. This is known as degenera- tion, and is the reason for the large by-pass condenser across the resistor in single tube amplifiers.
In a push-pull amplifier, however, this opposing effect of the plate current of the tube on its own grid potential is an aiding effect upon the grid of the other tube, since that grid is swinging in po- tential in the opposite direction. Hence, each tube has a degener- ating effect upon itself, and a regenerating effect upon the other tube.
The net consequence of all this is that the second harmonic current mentioned above, in flowing through the grid biasing resistor, tends to reduce the peak of the positive alternation of the one tube, and to peak the flat-topped wave shape of the negative alternation, and
V-14 #2
15
so tends to destroy itself. As a result, the second harmonic is
even further wiped out, in addition to the cancelling effects of the
two tubes, as described previously.
There is another beneficial effect due to this action. If one tube
is stronger than the other, i.e., if the change in its plate current is greater than that in the other tube for the same grid swing, then
the excess current will flow through the grid bias resistor, and cut down the excess current of the stronger tube, and raise that of the weaker tube, thus equalizing their outputs. Thus the grid bias re- sistor tends to make the mutual conductances of the two tubes more nearly equal.
It is evident that if the plate supply current, coming in through the center tap of the output transformer, increases, it increases in both halves of the primary. The two halves therefore induce equal and opposite voltages in the secondary, or no net voltage at all. The same argument holds for a decrease in plate supply current. Hence, if the voltage supply is not very perfectly filtered, no hum
T
T2
Fig. 20 - THIS IS r2 THE FORM WHEN
THE VOLTAGES OF EACH RALF ARE
ADDITIVE.
Fig 19 - THE PLATE CURRENT IN EACH TUBE IS ABOVE
SATURATION POINT.
CURRENT CURVES
VOLTAGE CURVES
"!2
Fig.21 - THE TUBES ARE BEING WORKED OFF THE
CENTER OF THE STRAIGHT PORTION OF THE CURVE.
RESULTANT 3^R HARMONIC
ONLY \
RESULTANT OUTPUT CURVES
Fig.22 - DEPICTING 'TOTAL VOLTAGE
GENERATED ACROSS PRIMARY OF OUTPUT
TRANSFORMER.
will be heard in the loud speaker anyway. A similar argument holds if there is a ripple in the grid bias voltage, or even filament sup- ply, so that the push-pull amplifier is much more free from hum than the single tube or parallel tube type of amplifier.
Now that we understand the normal action of the push-pull amplifier, let us examine its action under abnormal conditions, such as exces- sively large signal applied to the grids of the tubes.
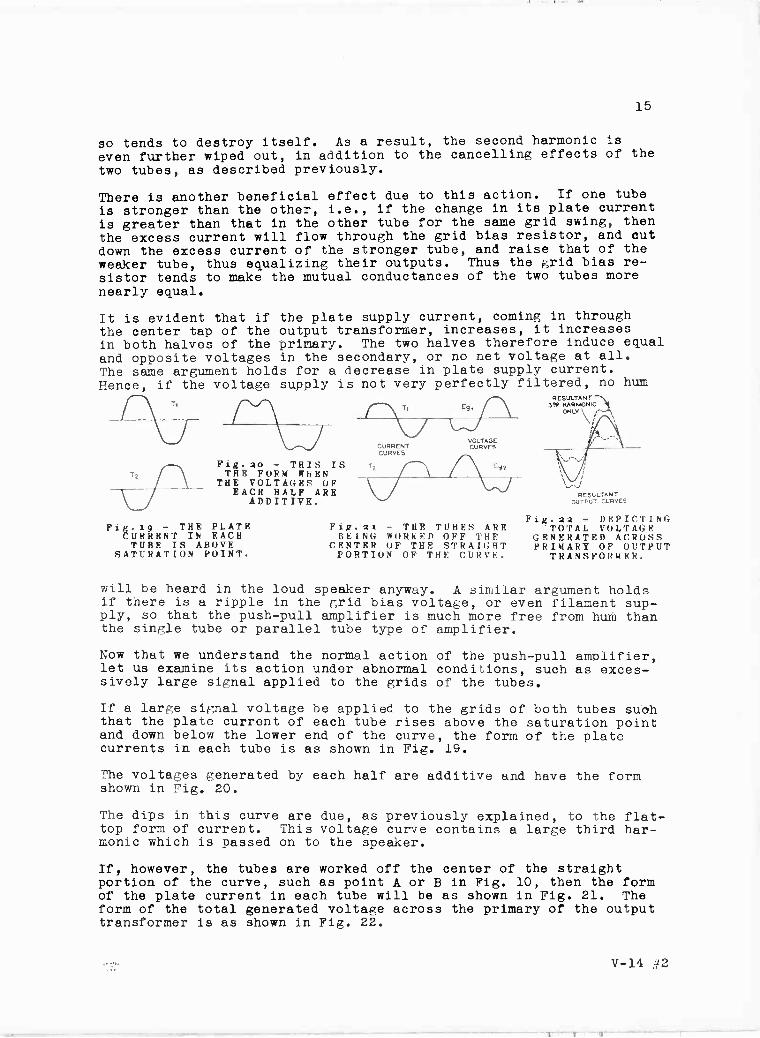
If a large signal voltage be applied to the grids of both tubes suoh that the plate current of each tube rises above the saturation point and down below the lower end of the curve, the form of the plate currents in each tube is as shown in Fig. 19.
The voltages generated by each half are additive and have the form shown in Fig. 20.
The dips in this curve are due, as previously explained, to the flat- top form of current. This voltage curve contains a large third har- monic which is passed on to the speaker.
If, however, the tubes are worked off the center of the straight portion of the curve, such as point A or B in Fig. 10, then the form of the plate current in each tube will be as shown in Fig. 21. The form of the total generated voltage across the primary of the output transformer is as shown in Fig. 22.
V-14 #2
16
The form of the voltage curves depicted in Fig. 21 shows the pre- sence of a second and third harmonic as was previously analyzed. The resultant of the two voltages shown in Fig. 22 indicates the presence of only the third harmonic, the second harmonic having been eliminated. The magnitude of the third harmonic that is usually present is small enough to be neglected.
It was previously mentioned that the current is about 900 out of phase with the voltage. This is true only in a simple inductance; but in a transformer under load the phase relation between primary current and the applied voltage depends upon the power factor of the load on the transformer, neglecting the magnetizing current. It is assumed in this discussion that the load on the secondary of an
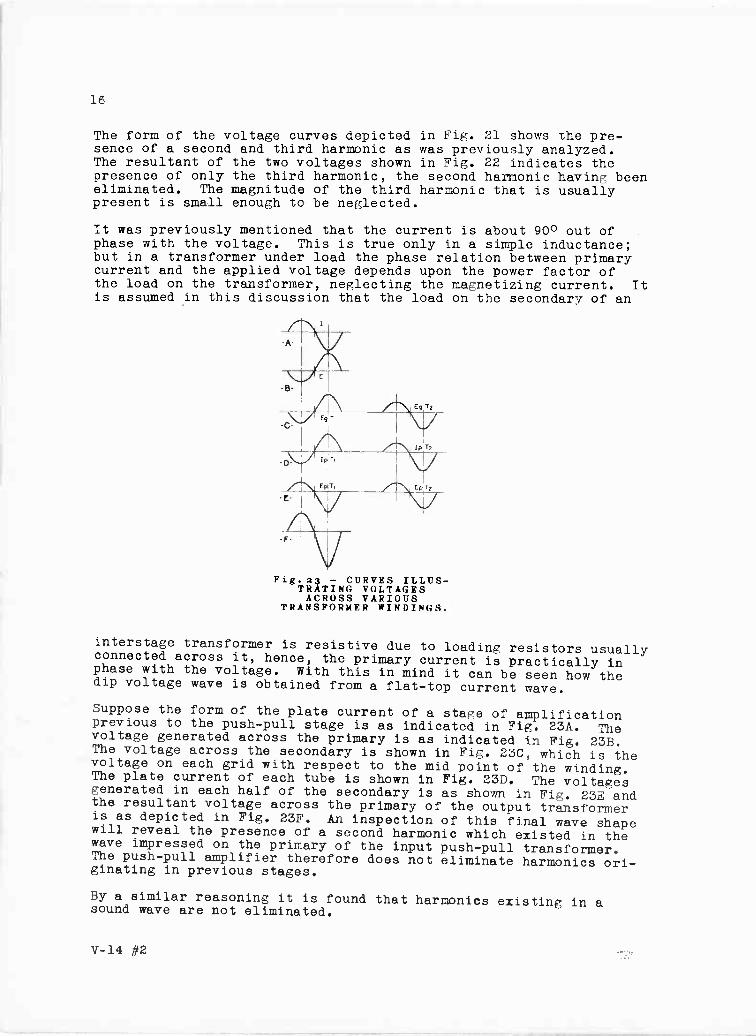
Fig.23 - CURVES ILLUS- TRATING VOLTAGES ACROSS VARIOUS
TRANSFORMER WINDINGS.
interstage transformer is resistive due to loading resistors usually connected across it, hence, the primary current is practically in phase with the voltage. With this in mind it can be seen how the dip voltage wave is obtained from a flat -top current wave.
Suppose the form of the plate current of a stage of amplification previous to the push-pull stage is as indicated in Fig. 23A. The voltage generated across the primary is as indicated in Fig. 23B. The voltage across the secondary is shown in Fig. 23C, which is the voltage on each grid with respect to the mid point of the winding. The plate current of each tube is shown in Fig. 23D. The voltages generated in each half of the secondary is as shown in Fig. 23E and the resultant voltage across the primary of the output transformer is as depicted in Fig. 23F. An inspection of this final wave shape will reveal the presence of a second harmonic which existed in the wave impressed on the primary of the input push-pull transformer. The push-pull amplifier therefore does not eliminate harmonics ori- ginating in previous stages.
By a similar reasoning it is found that harmonics existing in a sound wave are not eliminated.
V-14 #2
17
The sweeping conclusion is that the only even harmonics that are eliminated are those that would be present if push-pull amplifica- tion were not used.
Maximum power output is obtained from a tube when the load impedance equals the impedance of the tube. If the load impedance is made equal to the tube impedance in a straight amplifier, maximum output will be obtained, but the percentage of the second harmonic present due to the curvature of the characteristic prohibits the use of this one-to-one ratio. The ratio of load impedance to tube imped- ance is usually two to one, in order to minimize distortion. In a push-pull amplifier in which the second harmonics due to overloading are eliminated the load impedance may he equal to the tube impedance and so a greater output may be realized. Usually about 12* per cent more undistorted output is obtained with two tubes in push-pull than with two tubes in parallel.
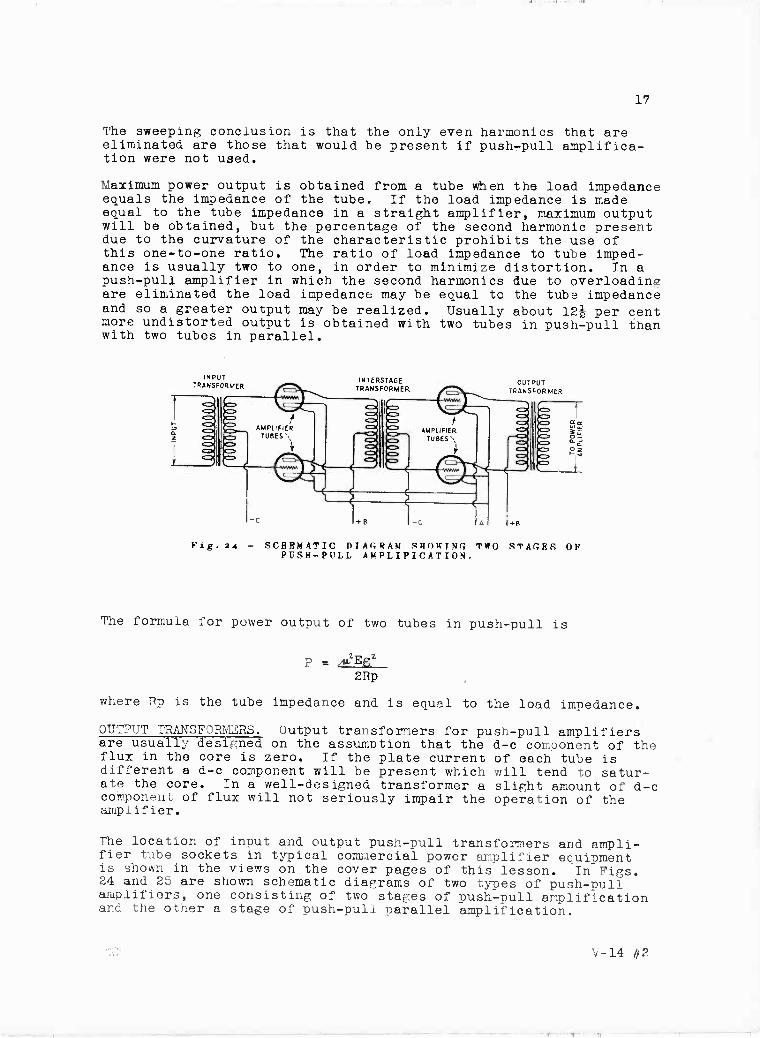
INPUT TRANSFORMER
INTERSTAGE OUTPUT TRANSFORMER t TRANSFORMER
Fig. º4 - SCHEMATIC DIAGRAM SHOWING TWO STAGES OF PUSH-PULL AMPLIFICATION.
The formula for power output of two tubes in push-pull is
AzEgz 2Rp
where Rp is the tube impedance and is equal to the load impedance.
OUTPUT TRANSFORMERS. Output transformers for push-pull amplifiers are usually designed on the assumption that the d -c component of the flux in the core is zero. If the plate current of each tube is different a d -c component will be present which will tend to satur- ate the core. In a well -designed transformer a slight amount of d -c component of flux will not seriously impair the operation of the amplifier.
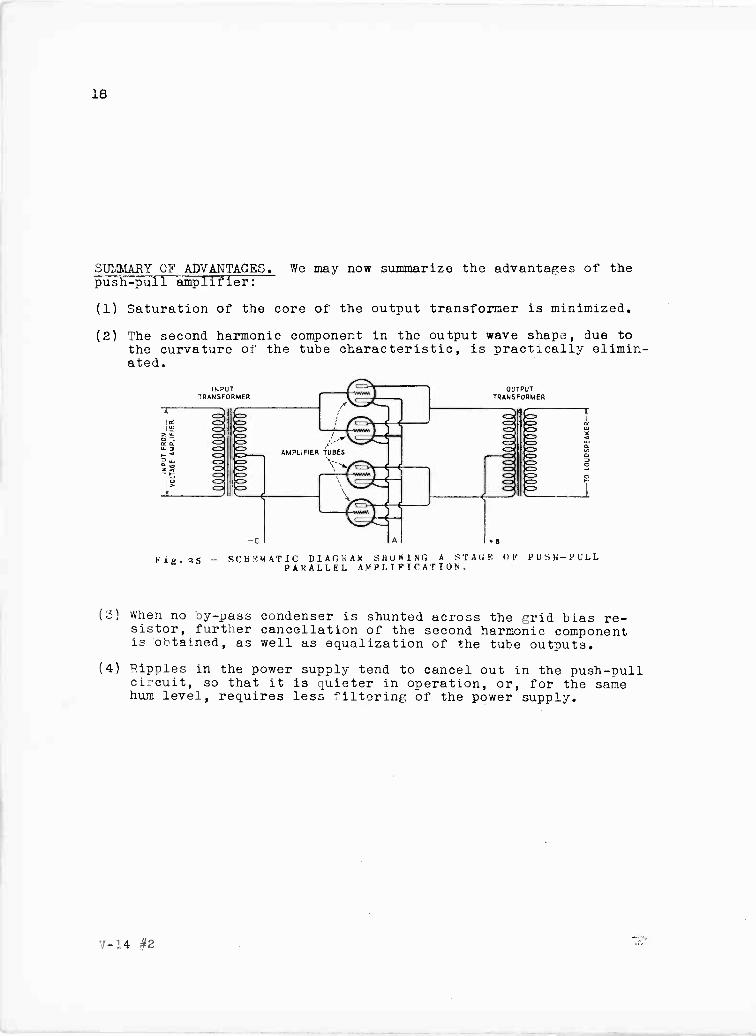
The location of input and output push-pull transformers and ampli- fier tube sockets in typical commercial power amplifier equipment is shown in the views on the cover pages of this lesson. In Pigs. 24 and 25 are shown schematic diagrams of two types of push-pull amplifiers, one consisting of two stages of push-pull amplification and the other a stage of push-pull parallel amplification.
V-14 #2
-r
18
.3UP;2JiARY OF ADVANTAGES. We may now summarize the advantages of the push-pull amplifier:
(1) Saturation of the core of the output transformer is minimized.
(2) The second harmonic component in the output wave shape, due to the curvature of the tube characteristic, is practically elimin- ated.
INPUT OUTPUT TRANSFORMER TRANSFORMER
-C A +e
Fig.25 - SCHRMATIC DIAGRAM SHOWING A STAGE OF PUSH-PULL PARALLEL AMPLIFICATION.
(3) When no by-pass condenser is shunted across the grid bias re- sistor, further cancellation of the second harmonic component is obtained, as well as equalization of the tube outputs.
(4) Ripples in the power supply tend to cancel out in the push-pull circuit, so that it is quieter in operation, or, for the same hum level, requires less filtering of the power supply.
V-14 4
19
EXAMINATION QUESTIONS
1. Name at least two advantages of a push-pull audio -frequency am- plifier over other types.
2. If the d -c plate current is greater through one tube than the other in a push-pull circuit what is the resultant effect upon the output transformer wnen a signal voltage is applied?
3. Give a brief explanation of the operation of a push-pull a -f amplifier with the aid of a simple schematic diagram.
4. What is the comparative difference in the effect of the d -c plate currents which flow in two tubes when connected in parallel and when connected in push-pull?
5. (a) What causes the presence of a second harmonic in a distorted wave?
(b) Is a second harmonic usually comparatively strong or weak? (c) If present, is a third harmonic usually strong or weak?
6. What means are employed to reduce the magnitude of a second har- monic?
7. Explain what is meant when it is said that the current changes are additive in effect in a push-pull amplifier.
8- Is it possible to obtain from two tubes in a push-pull amplifier much more than approximately twice the output provided by one of the tubes when operated in a single tube amplifier? Explain.
9. What is the effect on grid potential when plate current varies through the grid biasing resistor in a single tube amplifier?
10. In a push-pull amplifier what is the effect produced on the respective grids due to increases and decreases in plate current through each tube?
V-14 #2