Lecture 5 Audio and Video Compression. Audio Compression- DPCM Principles.
AudioCompressionusingEntropyCodingandPerceptualNoiseSubstitution
KapilKrishnamurthyandTamerDeifMUSIC422
StanfordUniversity‐Winter2009
1Motivation/BackgroundWhencompressinganaudiosignal thereare twomainconcerns, thecompressionrateand thequalityof thedecompressedaudio. Tradeoffsoccuraccording to theapplicationinwhichthecodecwillbeused.Forexample,ifitisusedfortelephonysystemscompressionrate ismore important thanquality,ofcourseas longasthequalityoftheoutputspeechisacceptable.In our implementation of our codec we were concerned about achieving highercompression rates than our original (class) codecwhile, at least,maintaining thesamequalityasouroriginalcodec.Inotherwords,foragivenbitrate,thequalityofthenewcodecshouldbebetterthantheoldone.Aswestudied in thisclass, thereare twomainstrategies to increasecompressionratewithoutdeterioratingthequality;eitherlosslesscompression,whichdoesnotaffectthequalityofthesignalatall,orlossycompressionthatgroupsitsartifactsinnon‐perceivablerangesbythehumanauditorysystem.Inthesuggestedcodecthetwostrategieshadbeenused.Therearetwomainadditionstoouroriginalcodec;the first one is “Perceptual Noise Substitution” (PNS) and the second is “EntropyCoding”(morespecifically,HuffmanCoding).PNSisalossycompressiontechniquethatisbasedontheassumptionthatallwhitenoisesoundssimilartothehumanbeing.Thetechniqueisfoundedondetectingthe“white‐noise” like frequencies of a given audio signal and coding their power andfrequencyrangesinsteadofcodingtheoriginaldata.Infact,whatPNSdoesisthatitchecksnoisybandsinthesignal.Ifabandisfoundtobenoisy,thenthewholebandiscodedbythepowerof thesignal in it,whichmeansonlyoneparameter (noisepower) describes the data in the whole band. This is also an introduction toparametriccoding.Ontheotherhand,onthedecoderside,theflaggednoisybandsarecheckedonablock‐by‐blockbasisand“white‐noise” isgeneratedand injectedintothesignalatthosefrequencyranges.
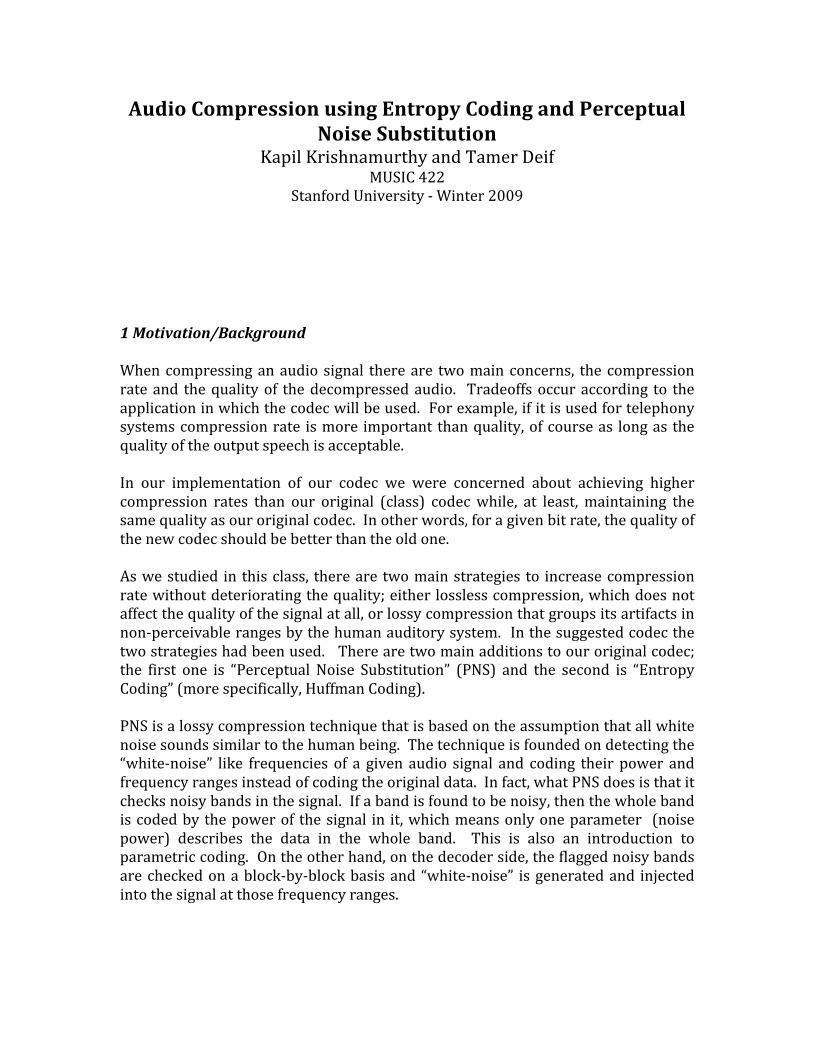
Clearlythistechniquesavesbitsinthecaseofnoisyaudiosignals,howeverthemoretonal the signal is, the less bits it saves. The number of bits saved, hence, varyaccording to the characteristics of the input signal,whether it is noisyornot andwhich bands are the noisy ones. In the following sections a more detailedimplementationwillbediscussed.ThedifferentmotivationsbehindimplementingPNS,apartfrombitratereduction,arethat it takesadvantageoftheperceptionofthehumanauditorysystem,whichfind tobe an interesting topic, and that it introducesus to the ideaof parametriccoding.The definition for entropy is basically the measure of randomness of a system.Entropycoding isa formofcodingthatreplacesaparticularsymbol inagivenbitstream by a unique code word. The code word may be constructed in severaldifferentwaysdependingonthemethodemployed.Similarly,bythesamemethodwecanobtaintheoriginalsymbolbackfromthecodeword.Entropy coding is done past the quantization stage prior to bit packing andtransmitting the bit stream. The main motivation for using entropy coding is toachievelosslesscompression.Usingentropycoding,webasicallyreplacefrequentlyoccurringsymbolsinthemantissaforeachcriticalbandwithacodethatistypicallysmaller than the original symbol. In this manner, we reduce the number oftransmitteddatabits,whichgivesusmorecompressionofthestoredaudiofile.There are several types of entropy coding. Some of the commonly used ones areHuffman coding, Arithmetic coding andRice coding. For our coder,we have usedHuffmanentropycoding.2SystemOverviewThe overall system is very similar to the typical perceptual audio coder; figure 1showsablockdiagramofthesystem.Ontheencoderside,normally,therearetwopaths; one for the actual encoding and the other is for perceptualmodeling. Theperceptual modeling determines masking effects and bit allocation. In ourimplementationwe added a thirdbranch forprediction andnoisedetection. Theoutputof those twoblocks is thenoisesubstitution flags for the frequencybands.Theseflagsarethenusedbythemainstreamcodingstepstodetecthowtocodethedata (determine bit allocation for noisy bands aswell as data to put in the scalefactor).Afterthebitallocation,quantizationtakesplaceandthenHuffmancoding.
Figure1:GeneralSystemBlockDiagram
The exact opposite of the mainstream coding steps take place on the decoder.Huffmandecodingisdone,followedbyde‐quantizationofthenon‐noisybandsandthen generatingnoisewith the correspondingpower for thenoisy bands. Finallyandtimetransformisrunonthedatatoreconstructthetimedomainsignal.2.1PNSThePNSalgorithmisasimpleone.Theinputsignalisfedtoafrequencytransformstage,andthenthespectrumofthesignalisexaminedfornoisybands. Oneofthereasonsforwhichthenoisedetectionisdoneonbandbasisisthatitwillbesimplerto encode/decode as will be shown later on in the implementation section. Todetectnoise,apredictionalgorithmisusedwherethepredictortries toanticipatethefollowingsampleofthesignalbasedonprevioussampledfromthesamesignal.Thereasonthisworks is that,basically,whitenoise isunpredictable,sowheneverthepredictorfailstofollowthesignalanoisybandispresent(onasidenote,thisisthe same for measuring tonality in a signal; the more accurately the predictorfollowsthesignal,thehigheritstonalityindexis).A decision stage comes after the noise has been detected, where the systemdetermineswhethertosubstitutethenoiseinthedetectedbandsornot.Thereareseveral issues to consider before substituting for the detected bands with noise.Oneoftheissuesistheriskthatourdetectormighthavedetectedatonalbandasnoise. Of course, if a tonal band is substituted forbynoise, then signal quality isimmediatelydestroyed. Inorder toavoid thiscase, fewmeasuresareconsidered.The first one is the variation among different bands; if a noisy band is detectedhoweveritsneighboringbands(immediateleftandrightneighbors)arenotnoisyaswell, then it is considered tonal and noise substitution is not conducted for thatband. Another measure is the power distribution within a noisy band, if the
variance between the powers of the individual frequency lines in a noisy band ishigh (to be more precise, some measures like variance‐to‐mean ratio areconducted), then the content of this band is considered tonal and no noisesubstitutionisdone.Someothermeasurescanbeconducted,likevariationofnoisepowerwithagroupofthreebands.Inadditiontotheperviousissue,thereareotherproblemsthathavetodowithhumanperceptionthatmustbetakenintoaccount.Forexample,usuallynonoisesubstitutionisdoneforfrequenciesbelow5KHz.Ourauditorysystemisverysensitiveinthatfrequencyrange,andthereforetheearcanmore distinctively detect noise. Another concern is the amount of noise injectedintothesignal,PNScanbepotentiallyoverusedifweimplementit foreverynoisyband detected. This in generalwould lead to degrading the quality of the signal.Hence,usuallythenoisybandsaresortedintermsoftheirnoisinessandonlyfewofthem(20‐40%)gothroughnoisesubstitution(ofcourseafterpassingtherestofthetestsmentionedabove).Afterexaminingthenoisybands,thepoweroftheonesthatpasstheprevioustestsaremeasured and stored in the scale factor bits for the corresponding sub‐band.Themantissabits for thosebandsare free tobeusedbyother “non‐noisy”bands,whichallowsforhighercompressionrates.Finally,thenoisybandhastobeflaggedsomehowsothatthedecoderunderstandsthem.Onepossiblewaytodothisistoouttheflaginformationintheheaderofeachblock.Anotherpossiblewayistouseaspecialcodeandallocatebitsforthatcodetobesentforonlynoisybands.Onthedecoderside,thefirstthingthatisdoneischeckingtheflags(regardlesstheway thearesent). Then for thecorrespondingbands,whitenoise isgenerated inthe frequency domainwith power equal to the values read from the noisy bandsscale factors. Finally, an inverse frequency transform is conducted to have thesignalbackintimedomain.
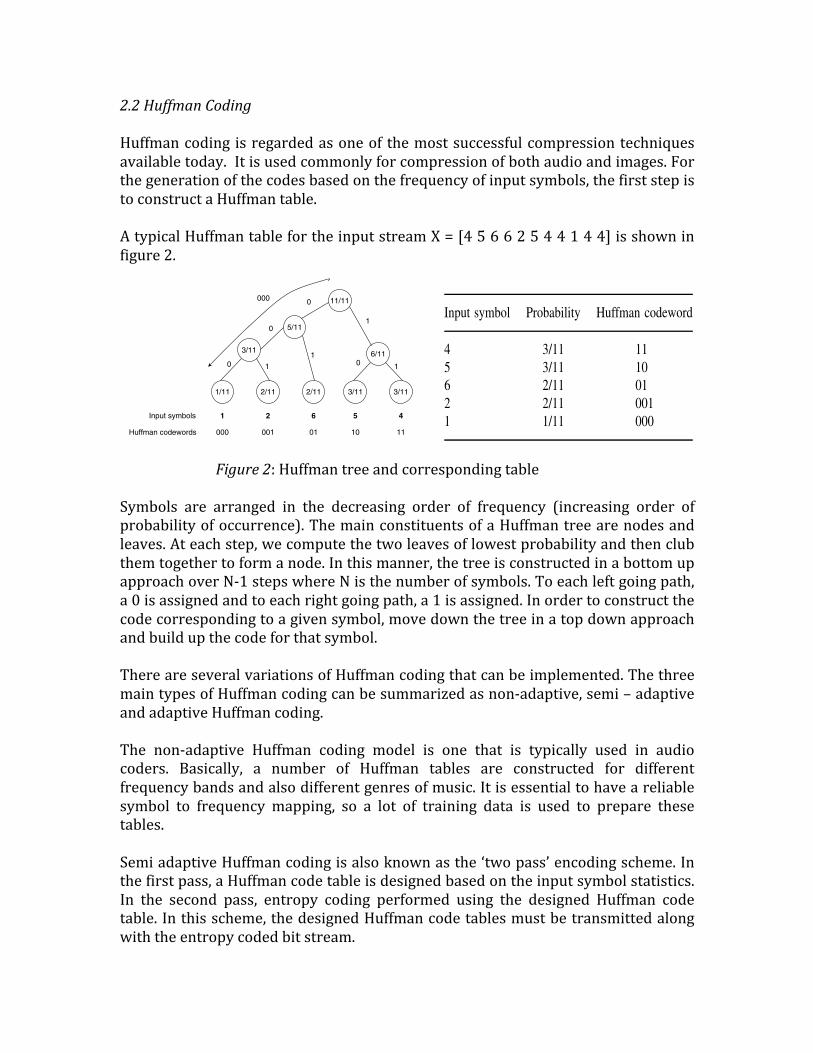
2.2HuffmanCodingHuffmancoding isregardedasoneof themostsuccessfulcompressiontechniquesavailabletoday.Itisusedcommonlyforcompressionofbothaudioandimages.Forthegenerationofthecodesbasedonthefrequencyofinputsymbols,thefirststepistoconstructaHuffmantable.AtypicalHuffmantablefortheinputstreamX=[45662544144]isshowninfigure2.
Figure2:Huffmantreeandcorrespondingtable
Symbols are arranged in the decreasing order of frequency (increasing order ofprobabilityofoccurrence).ThemainconstituentsofaHuffmantreearenodesandleaves.Ateachstep,wecomputethetwoleavesoflowestprobabilityandthenclubthemtogethertoformanode.Inthismanner,thetreeisconstructedinabottomupapproachoverN‐1stepswhereNisthenumberofsymbols.Toeachleftgoingpath,a0isassignedandtoeachrightgoingpath,a1isassigned.Inordertoconstructthecodecorrespondingtoagivensymbol,movedownthetreeinatopdownapproachandbuildupthecodeforthatsymbol.ThereareseveralvariationsofHuffmancodingthatcanbeimplemented.ThethreemaintypesofHuffmancodingcanbesummarizedasnon‐adaptive,semi–adaptiveandadaptiveHuffmancoding.The non‐adaptive Huffman coding model is one that is typically used in audiocoders. Basically, a number of Huffman tables are constructed for differentfrequencybandsandalsodifferentgenresofmusic.Itisessentialtohaveareliablesymbol to frequency mapping, so a lot of training data is used to prepare thesetables.SemiadaptiveHuffmancodingisalsoknownasthe‘twopass’encodingscheme.Inthefirstpass,aHuffmancodetableisdesignedbasedontheinputsymbolstatistics.In the second pass, entropy coding performed using the designed Huffman codetable.Inthisscheme,thedesignedHuffmancodetablesmustbetransmittedalongwiththeentropycodedbitstream.
80 QUANTIZATION AND ENTROPY CODING
2/11 2/11 3/11 3/11
5/11
2 6 5
0 1
001 01 10 11
Input symbols
Huffman codewords
000
1/11
1
3/11
1
0
1
11/110
1
0
000
6/11
4
Figure 3.19. Huffman coding tree for Example 3.6.
Table 3.5. Huffman codetable for the inputbitstream Y = [2 5 6 6 2 5 5 4 1 4 4].
Input symbol Probability Huffman codeword
4 3/11 115 3/11 106 2/11 012 2/11 0011 1/11 000
the Huffman codes designed beforehand, i.e., nonadaptive Huffman coding.In particular, a training process involving a large database of input symbolsis employed to design Huffman codes. These Huffman code tables will beavailable both at the encoder and at the decoder. It is important to note thatthis approach may not (always) result in minimum redundancy encoding. Forexample, if the Huffman bitmapping given in Table 3.5 is used to encodethe input bitstream X = [4 5 6 6 2 5 4 4 1 4 4] given in Example 3.3,the resulting total number of bits is LHF = 24 bits, i.e., one bit more com-pared to Example 3.4. Therefore, in order to obtain better compression, areliable symbol-frequency model is necessary. A series of Huffman codetables (in the range of 10–32) based on the symbol probabilities is usuallyemployed in order to overcome the aforementioned shortcomings. The non-adaptive Huffman coding method is typically employed in a variety of audiocoding standards [ISOI92] [ISOI94] [ISOI96] [John96]. Second, Huffman cod-ing based on an iterative design/encode procedure, i.e., semi-adaptive Huffmancoding. In the entropy coding literature, this approach is typically called the“two-pass” encoding scheme. In the first pass, a Huffman codetable is designed

Adaptive Huffman coding uses prediction techniques to compute the symbolfrequenciesbasedontheprevioussamples.Theadvantagetothisisthatthesourcecanbecodedinrealtime.However,asingleerrorcanleadtothelossofallthedata.Thenextsectionshowsmoredetailsoftheimplementationofthedescribedsteps.3ImplementationOurimplementationisbuiltonthecodedimplementedinclass,sointhissectionwewillonlydiscussourimplementationtotheaddedfeaturestothecodec,namelyPNSandHuffmanCoding.FortheNoisedetectionstageofthePNSweimplementedapredictor.Thefunctionofthepredictor,asmentionedearlier,istopredictthesignalfromitspastsamplesanddependingonhowsuccessfulitiswedecidehownoisyisoursignal(rememberthatnoiseisimpossibletopredict).Thefunctionusedforpredictionis:
Where
€
P^n( ) is thepredictionof the current sample, and
€
P n −1( ), P n − 2( ) are theactualvaluesofthetwoprevioussamples.ThepredictionstageisconductedontheFFT of the original signal. FFT is chosenbecause it provides a higher frequencyresolutionthanMDCT.After prediction a noise index for each band is measured using the followingequation:
€
jN m,n( ) =
^
P j i( ) − jP i( )i=m
n
∑
jP i( )i=m
n
∑
Wherejistheindexforthesub‐bandnumber,iistheindexforthesamplenumberinthejthsub‐band,PisthesameasbeforeandNisthenoiseindex.Thisfunctionisjust a normalized summation of the error of the predictor, which represents ournoise index. For a sub‐band to be noisy, its noise indexmust be above a certainthreshold. After testing on awhite noise signal and observing the average noiseindex for the sub‐bands, a threshold of 0.5 was determined. More accuratethresholds can be obtained using different combinations of data; also anindependent threshold canbeused foreachband. Figure3 showsagraphof thenoiseindexforatonalsignalvs.whitenoise.
€
P^n( ) = 2* P n −1( ) − P n − 2( )
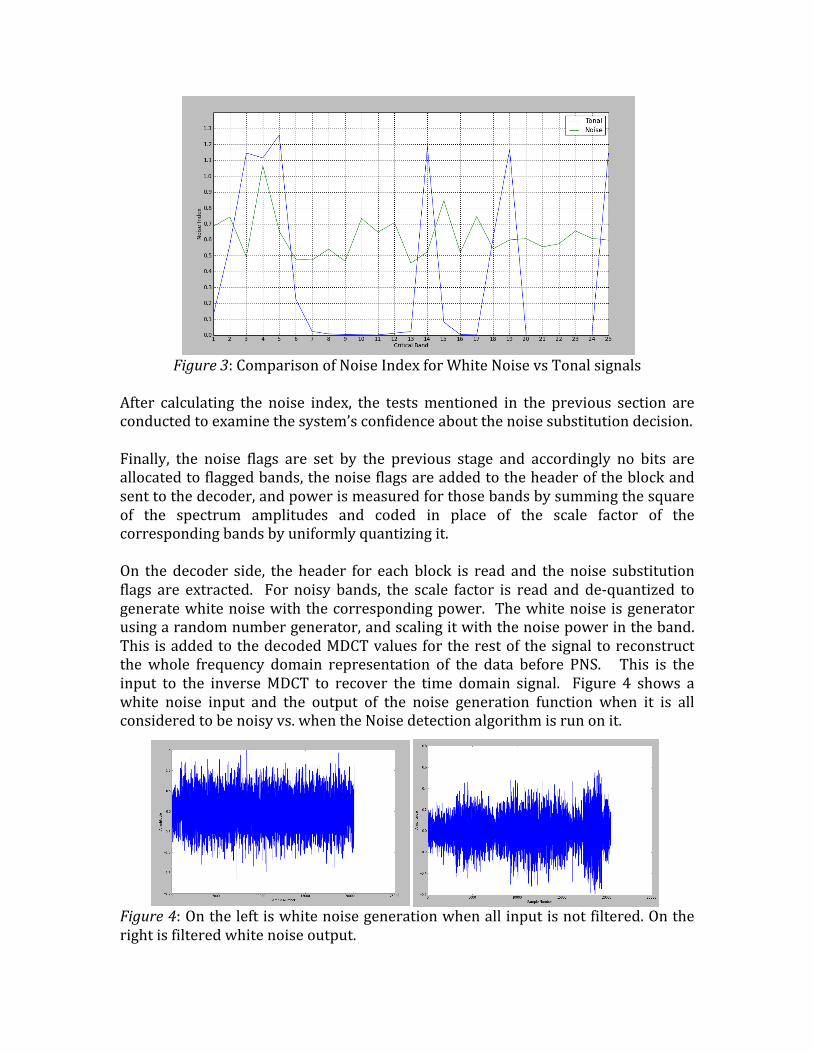
Figure3:ComparisonofNoiseIndexforWhiteNoisevsTonalsignals
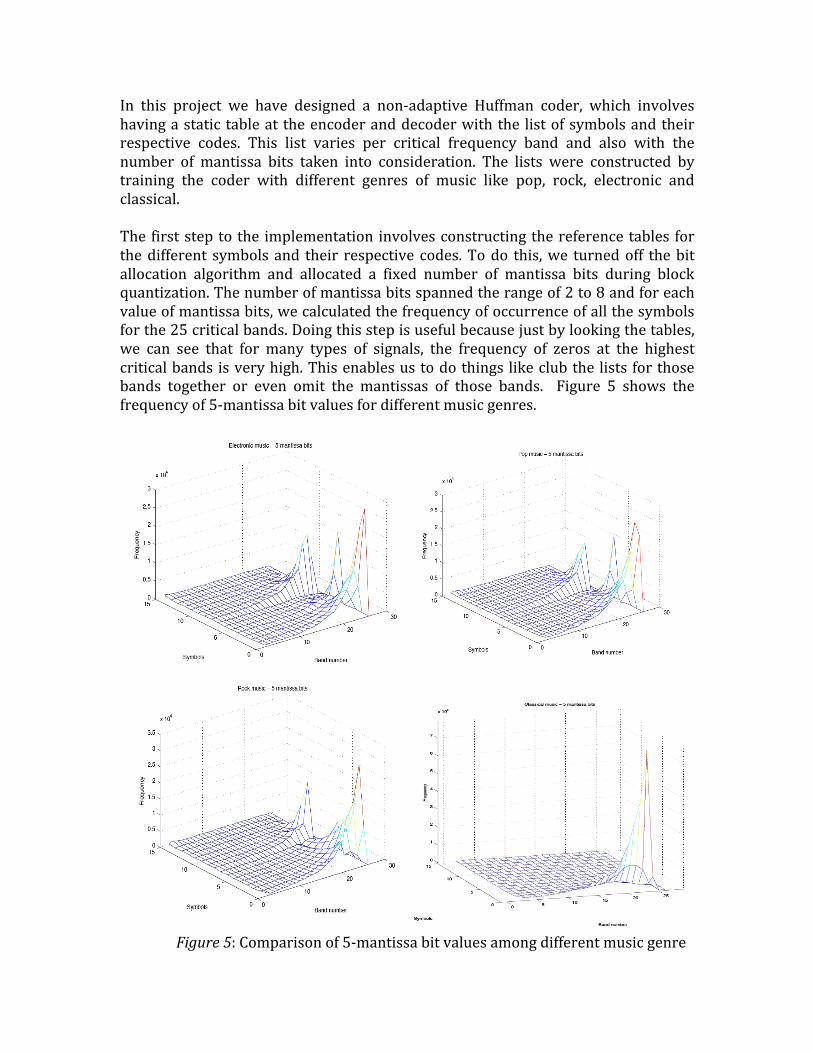
After calculating the noise index, the testsmentioned in the previous section areconductedtoexaminethesystem’sconfidenceaboutthenoisesubstitutiondecision.Finally, the noise flags are set by the previous stage and accordingly no bits areallocatedtoflaggedbands,thenoiseflagsareaddedtotheheaderoftheblockandsenttothedecoder,andpowerismeasuredforthosebandsbysummingthesquareof the spectrum amplitudes and coded in place of the scale factor of thecorrespondingbandsbyuniformlyquantizingit.On the decoder side, the header for each block is read and the noise substitutionflags are extracted. For noisy bands, the scale factor is read and de‐quantized togeneratewhitenoisewiththecorrespondingpower. Thewhitenoiseisgeneratorusingarandomnumbergenerator,andscalingitwiththenoisepowerintheband.This isaddedtothedecodedMDCTvalues fortherestof thesignal toreconstructthewhole frequency domain representation of the data before PNS. This is theinput to the inverseMDCT to recover the time domain signal. Figure 4 shows awhite noise input and the output of the noise generation function when it is allconsideredtobenoisyvs.whentheNoisedetectionalgorithmisrunonit.
Figure4:Ontheleftiswhitenoisegenerationwhenallinputisnotfiltered.Ontherightisfilteredwhitenoiseoutput.
In this project we have designed a non‐adaptive Huffman coder, which involveshavingastatic tableat theencoderanddecoderwiththe listofsymbolsandtheirrespective codes. This list varies per critical frequency band and also with thenumber of mantissa bits taken into consideration. The lists were constructed bytraining the coder with different genres of music like pop, rock, electronic andclassical.The firststeptothe implementation involvesconstructingthereferencetables forthedifferent symbolsand their respective codes.Todo this,we turnedoff thebitallocation algorithm and allocated a fixed number of mantissa bits during blockquantization.Thenumberofmantissabitsspannedtherangeof2to8andforeachvalueofmantissabits,wecalculatedthefrequencyofoccurrenceofallthesymbolsforthe25criticalbands.Doingthisstepisusefulbecausejustbylookingthetables,we can see that for many types of signals, the frequency of zeros at the highestcriticalbandsisveryhigh.Thisenablesustodothingslikeclubthelistsforthosebands together or even omit the mantissas of those bands. Figure 5 shows thefrequencyof5‐mantissabitvaluesfordifferentmusicgenres.
Figure5:Comparisonof5‐mantissabitvaluesamongdifferentmusicgenre

Thenext step involvesconverting the frequenciesofall thesymbols toequivalentHuffmancodesbyconstructingaHuffmantable foreachcriticalband. Inourcase,thiswasdonewiththehelpofMatlab.UsingtheMatlabfileI/Ooptions,wehadtheHuffmantableinareferenceableformat.At the encoder end, once the bit allocation algorithm is completed and certainnumber of bits have been allocated to each of the critical bands for blockquantization, we use the Huffman functions to search for the equivalent codecorresponding to themantissa symbol.This code iswritten into thebit stream inplace of the mantissa. The important factor to be considered here is that themantissaisfirstseparatedintoitsmagnitudeandsignpartsandtheyarecodedinseparately.Similarly,atthedecoderend,oncealltheusualparameterssuchasthescalefactorsandbitallocationinformationhavebeenretrievedfromthebitstream,weextracttheHuffman code and the sign.Using this information,we can locate the originalmantissasymbolfromthetableandapplyitssignbacktoit.4ResultsThe following table shows a comparison between the compression rates of threedifferentdecoders.Thefirstoneisthenormal128Kbpsdecoder,theothertwoareHuffmanandHuffmanwithPNS.Theresultsofthistableareallbasedon128Kbpstargetrate.
Codec Classical Rock Dance Pop Castanets Organ Speech128 5.514 5.505 5.580 5.358 5.368 5.530 5.281
Huffman 6.637 6.400 6.500 6.312 6.051 7.353 6.035Huffman/PNS 6.700 6.650 6.908 6.583 6.163 7.353 6.260ItisobviousthatHuffmangivesussamequality,foratargetbitrate,butwithhighercompression,forallkindsofaudio.ThemostoutstandingresultwasfortheOrgan,which is a highly tonal signal. Moreover, the PNS increases compression rate inmost cases. However, it is noticeable that PNS did not add anything to thecompressionrateintheOrgansignal,whichisaverytonalsignalandapparentlynonoisewasdetectedinit.The next figure summarizes the performance of the codecs in terms of quality ofoutput. The tests arebasedon the ITU‐R5‐grade impairment scale, double‐blindtriple‐stimulus tests. Note that the maximum number of bits per mantissa waslimitedto8bits,duetotheavailabilityofHuffmantablesonlyuptothatnumberofmantissabits.Thiswouldreducethequalityofthecodecsingeneral,butrelativetoeachothertheyshouldremainthesame.
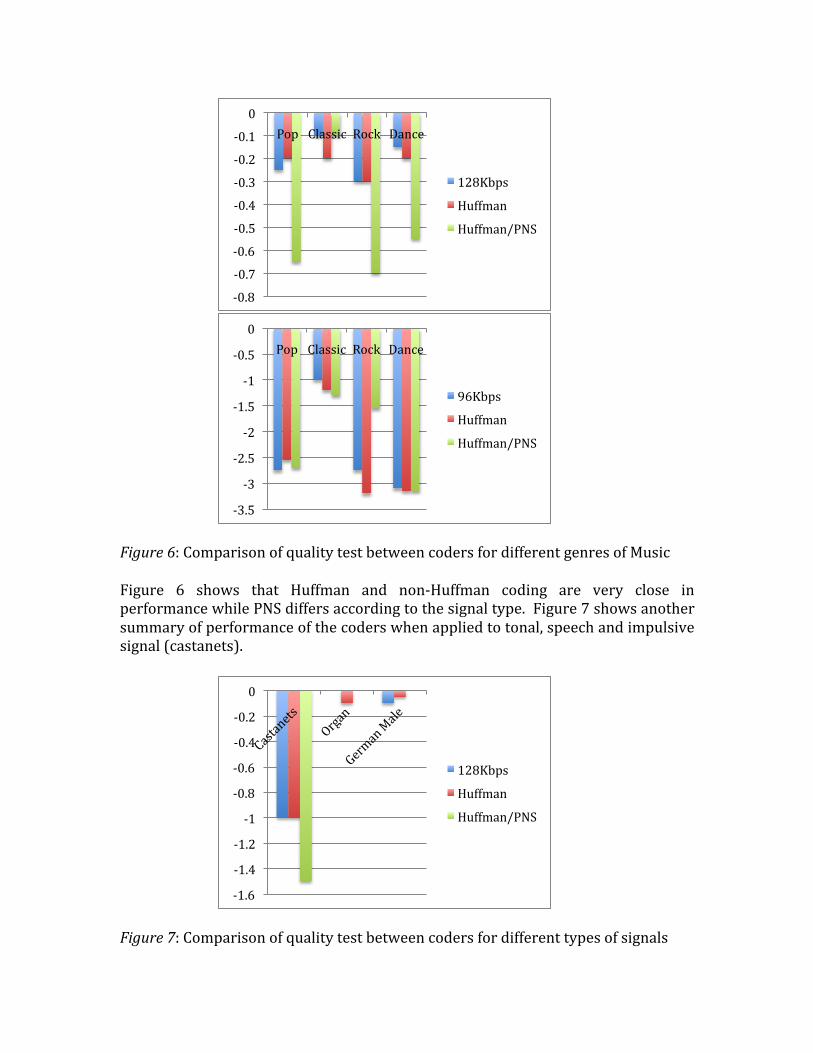
Figure6:ComparisonofqualitytestbetweencodersfordifferentgenresofMusicFigure 6 shows that Huffman and non‐Huffman coding are very close inperformancewhilePNSdiffersaccordingtothesignaltype.Figure7showsanothersummaryofperformanceofthecoderswhenappliedtotonal,speechandimpulsivesignal(castanets).
Figure7:Comparisonofqualitytestbetweencodersfordifferenttypesofsignals
‐0.8
‐0.7
‐0.6
‐0.5
‐0.4
‐0.3
‐0.2
‐0.1
0Pop Classic Rock Dance
128Kbps
Huffman
Huffman/PNS
‐3.5
‐3
‐2.5
‐2
‐1.5
‐1
‐0.5
0Pop Classic Rock Dance
96Kbps
Huffman
Huffman/PNS
‐1.6
‐1.4
‐1.2
‐1
‐0.8
‐0.6
‐0.4
‐0.2
0
128Kbps
Huffman
Huffman/PNS
5Conclusion/FutureworkAstheresultsshowed,Huffmancodinggivesagreatdealofcompressiongain. Ofcoursethefactthatthisislossless,makesitaveryattractiveoptionforanycoder–high compression ratewith no degradation in quality. Themain disadvantage ofHuffmancodingisthatitrequiresmorecomputationalpowerandtime.Thismightbeaproblemforreal‐timecodec(e.g.streamingapplications),howeverwithsomecodeoptimizationand thecontinuousadvancement inprocessorspower it shouldbefine.Ontheotherhand,PNSisnotaspowerfulasHuffmanforfewreasons.Thefirstisthat it is a lossy coding technique, so the coded signal can never be exactlyreconstructed.Anotherreasonisthatitdoesnotprovidehighcompressionrate,ithelps but not too much. Although, both, Huffman and PNS provide variablecompressionrates thataredependenton the input to thecodec,Huffman ismoreguaranteedtocompressthesignal.Forexampleifthesignalisnotnoisy,i.e.highlytonal, then theoretically no PNS takes place and hence no compression at all,howeverthis isnotthecasewithHuffman(itwouldonlyfail forabnormalsignalswithallvaluescorrespondingtothelongerHuffmancodes).Meanwhile,PNSwouldbeagreatadditionfornoisysignals.ItmustbesaidthatthereisahugeamountofworkthatcanbedonetoextendbothPNS andHuffman. So for PNS, somework canbedone onbetter noise detectionalgorithm, especially with coming upwithmore accurate thresholds. Also,morework to decide whether a band is noisy or not, for example some algorithmsmeasure the variance in average power between groups of three bands and highvariancemeansthesignalisnotnoisy.AnotherissuetobetakencareofisNSwithstereo coding (which was not implemented here). In stereo coding, noisesubstitutionsmay lead to undesired correlation/non‐correlation between the twochannels that is not present in the original signal. This is one of the reasons fordoingNSonlyforbandsabove5KHz,becausebelowthosefrequenciesistherangewherethehumanauditorysystemismostsensitivetothoseartifacts.ForHuffmancoding,weonlyimplementedstraightforwardcodingonasymbol‐by‐symbol basis. There are a lot of extensions that can be done and lead to highercompressionrate.Forexample,vectorizedHuffmancodingforselectcriticalbandsisveryfamous(whereyouapplyHuffmanonseveralsymbolsinsteadofonlyone).This is beneficial in bands where there is a high repetition of certain symbols.Usually the last 2 – 3 critical bands have a high percentage of zeros because theinput signal lacks high frequency content of that order. Using vectorized coding,severalbitscanbesavedbygroupingtherepeatingsymbolstogetherandreplacingthembyasinglecode.Vectorizedquantizationcanalsobeappliedtomorethanjusta few bands if we have a higher probability of several symbols being groupedtogether.Toachievethis,wecanusetheBurrow‐WheelertransformcoupledwiththeMovetoFrontalgorithm.ThesetwomodulesareappliedonthemantissaofthecodeandthensenttothevectorizedHuffmanroutine.
Also, the entropy coding technique can be applied on the scale factor and headerinformation for further compression. Onemore thing that canbe implemented iscodingofrunstreamsofzerosorones(kindofsimilartovectorizedHuffman).6References
1) ‘AudioSignalProcessingandCoding’byAndreasSpanias,TedPainterandVenkatramanAtti
2) ‘Sampled‐DataAudioSignalCompressionwithHuffmanCoding’byShinjiro Ashida, Hironori Kakemizu, Masaaki Nagahara and Yutaka Yamamoto
3) ‘ImprovingAudioCodecsbyNoiseSubstitution’byDonaldSchulz
4) ‘The MPEG-4 General Audio Coder’ by Bernhard Grill
5) ‘ATutorialonMPEG/AudioCompression‘byDavisPan
6) ‘Implementation of MPEG-4 Audio Components on Various Platforms’ by
Bernhard Grill, S tefan Geyersberger, Johannes Hilpert, and Bodo Teichmann
7) ‘Extending the MPEG-4 AAC Codec by Perceptual Noise Substitution’ by Jiirgen
Herre, Donald Schulz
8) ‘Advanced Software Implementation of MPEG-4 AAC Audio Encoder’ by
Danijel Domazet, Mario Kovac
9) ‘An Overview of MPEG-4 Audio Version 2’ by Heiko Purnhagen
10) ‘An MDCT Domain Frame-Loss Concealment Technique For MPEG Advanced
Audio Coding’ by Sang-Uk Ryu and Kenneth Rose


![Lossless compression of digital audio - HP LabsLossless compression of digital audio - HP Labs ... y > ] > ...](https://static.fdocuments.in/doc/165x107/5e8ec5c8b729fb6de750814f/lossless-compression-of-digital-audio-hp-labs-lossless-compression-of-digital.jpg)