Atucha-I report final vf - rsicc.ornl.gov · iii ABSTRACT The Argentina Nuclear Regulatory...
49
Prepared by
Transcript of Atucha-I report final vf - rsicc.ornl.gov · iii ABSTRACT The Argentina Nuclear Regulatory...

Prepared by

DOCUMENT AVAILABILITY
Reports produced after January 1, 1996, are generally available free via the U.S. Department ofEnergy (DOE) Information Bridge:
Web site: http://www.osti.gov/bridge
Reports produced before January 1, 1996, may be purchased by members of the public from thefollowing source:
National Technical Information Service5285 Port Royal RoadSpringfield, VA 22161Telephone: 703-605-6000 (1-800-553-6847)TDD: 703-487-4639Fax: 703-605-6900E-mail: [email protected] site: http://www.ntis.gov/support/ordernowabout.htm
Reports are available to DOE employees, DOE contractors, Energy Technology Data Exchange(ETDE) representatives, and International Nuclear Information System (INIS) representativesfrom the following source:
Office of Scientific and Technical InformationP.O. Box 62Oak Ridge, TN 37831Telephone: 865-576-8401Fax: 865-576-5728E-mail: [email protected] site: http://www.osti.gov/contact.html
This report was prepared as an account of work sponsored by an agency ofthe United States Government. Neither the United States government norany agency thereof, nor any of their employees, makes any warranty,express or implied, or assumes any legal liability or responsibility for theaccuracy, completeness, or usefulness of any information, apparatus,product, or process disclosed, or represents that its use would not infringeprivately owned rights. Reference herein to any specific commercial product,process, or service by trade name, trademark, manufacturer, or otherwise,does not necessarily constitute or imply its endorsement, recommendation,or favoring by the United States Government or any agency thereof. Theviews and opinions of authors expressed herein do not necessarily state orreflect those of the United States Government or any agency thereof.

Prepared by theOAK RIDGE NATIONAL LABORATORY
P.O. Box 2008Oak Ridge, Tennessee 37831-6285
managed byUT-BATTELLE, LLC
for theU.S. DEPARTMENT OF ENERGY
under contract DE-AC05-00OR22725
Nuclear Science and Technology Division


iii
ABSTRACT
The Argentina Nuclear Regulatory Authority (ARN) requested that Oak Ridge National Laboratory (ORNL) review and evaluate the reactor pressure vessel (RPV) surveillance data related to the Atucha-I Nuclear Power Plant (NPP), located in the Province of Buenos Aires, Argentina. Atucha-I NPP was the first plant to generate nuclear power in Latin America. The issues regarding the validity of Atucha-I surveillance data and Framatome VAK accelerated surveillance data as applied to the RPV integrity study were investigated. The primary purpose of this report is to provide ARN with an independent interpretation of the Atucha-I surveillance data with respect to U.S. nuclear codes and standards. Another important purpose was to provide an independent evaluation of neutron dose rate and spectra effect in regard to the RPV radiation embrittlement data.
The evaluation concluded that the surveillance program data Sets #1& #2 are not adequate for a lifetime estimate of Atucha-I RPV, due to extremely high thermal- (E<0.4eV) to fast-neutron (E>1MeV) fluence ratio at surveillance capsule position, about 1000:1, compared to that at the RPV inner wall position, about 10:1. The surrogate data from the VAK surveillance program data, which has thermal- to fast-neutron ratio around 4:1 and has slightly harder spectrum compared to that at Atucha-I RPV inner wall position, can be applied to Atucha-I RPV surveillance. However, due to the extreme low embrittlement rate of VAK data compared to that of the U.S. power reactor data, further validation of the VAK accelerated data is required before it can be used for a lifetime estimate of Atucha-I. Two key issues must be addressed by the German vendor to explain the low embrittlement observed in the VAK surrogate data, namely, the irradiation temperature of VAK capsules and the related dose-rate effect. Furthermore, evidence of a neutron dose-rate effect are identified from the U.S. power reactor surveillance embrittlement database (PR-EDB) and material test reactor database (TR-EDB) for this study. The dose-rate effect and neutron spectra effect, and their implications to the radiation embrittlement of the Atucha-I surveillance program, are also discussed.
Two suggestions are proposed to evaluate the lifetime of Atucha-I RPV.
1. Use VAK data based on its validation from the German vendor. A designated safety margin of the estimated radiation damage index will be required to cover the uncertainty due to the dose-rate effect and spectrum effect.
2. Use PR-EDB forging data that have similar chemistry compositions as that of Atucha-I beltline materials to develop an RPV embrittlement model that takes into account the neutron spectrum effect and can be used for a lifetime estimate of Atucha-I RPV.


v
Table of Contents ABSTRACT....................................................................................................................... iii 1. INTRODUCTION ...................................................................................................... 1 2. BACKGROUND OF ATUCHA-I SURVEILLANCE PROGRAM.......................... 2
2.1 RPV Surveillance Program of Atucha-I NPP ......................................................... 2 2.2 Results from Set 1 of the Atucha-I Surveillance Program...................................... 3 2.3 VAK Surveillance Program .................................................................................... 4 2.4 Fracture Toughness Approach for Improving Reference Temperature (RTNDT).... 4 2.5 Results from Set 2 of the Atucha-I Surveillance Program...................................... 4 2.6 Improved Fluence Evaluation of the Atucha-I EX-Vessel Dosimetry Program..... 5 2.7 Atucha-I Surveillance Status and Future Recommendation ................................... 5
2.7.1 Status........................................................................................................... 5 2.7.2 Recommendations for Current Issues ......................................................... 6 2.7.3 Recommendations for Future Issues and Life Extension ........................... 7
3. COMPARISON OF ATUCHA-I SURVEILLANCE WITH POWER REACTOR DATABASE (PR-EDB) AND TEST REACTOR DATABASE (TR-EDB) ..................... 8
3.1 Background of U.S. NRC Regulatory Guide 1.99, Rev. 2 ..................................... 8 3.2 Atucha-I Surveillance Results................................................................................. 9
4. SPECTRUM EFFECTS AND DAMAGE EFFICIENCY ....................................... 12 4.1 Radiation Embrittlement Correlation Index.......................................................... 12 4.2 Residual Defects and Damage Efficiency............................................................. 12
5. SURROGATE GERMAN VAK DATA FOR ATUCHA-I RPV SURVEILLANCE......................................................................................................14
5.1 The VAK Reactor ................................................................................................. 14 5.2 Radiation Environment of VAK Surveillance Capsules....................................... 14 5.3 VAK Surveillance Capsule Temperature.............................................................. 17 5.4 Evaluation of Projected VAK Fast Fluence from Atucha-I RPV Fluence ........... 17 5.5 Applying Damage Efficiency to IAEA JF Data from Atucha-I and CRP-II ........ 19
6. DOSE RATE EFFECT ............................................................................................. 20 6.1 Background of the Dose Rate Effect .................................................................... 20 6.2 Dose-Rate Effect Study from HSST A533B1 Standard Reference Materials ...... 22 6.3 Dose-Rate Effect Study on PR-EDB Base Material ............................................. 26 6.4 Impact of Reactor Design and Operation to Dose-Rate Effect............................. 27 6.5 General Trends of Dose-Rate Dependence from PR-EDB................................... 29
7. DISCUSSION........................................................................................................... 32 7.1 Issue Regarding Flaws in the RPV ....................................................................... 32 7.2 Fracture Toughness of the RPV Steel................................................................... 33 7.3 Preliminary Estimate of the ART at the End of 2002........................................... 33 7.4 Safety Margin Imposed on the Transition Temperature Shift of VAK Program . 33 7.5 Validity of VAK Data for Atucha-I RPV Surveillance ........................................ 34 7.6 Potential Damage Mechanisms Involved in Atucha-I Surveillance Data............. 34
8. CONCLUSION......................................................................................................... 36 9. ACKNOWLEDGEMENT ........................................................................................ 37 10. REFERENCE............................................................................................................ 37
vi
List of Figures
Figure 1. Schematic diagram of Atucha-I surveillance position. ........................................3 Figure 2. Comparison of Atucha-I surveillance data and PR-EDB forging. .................... 10 Figure 3. Comparison of Atucha-I surveillance data and RG1.99/R2.............................. 10 Figure 4a. JF irradiated data from IAEA CRP-II and Atucha-I........................................ 11 Figure 4b. Atucha-I and CRP-II JF shift data vs. dpa.......................................................11 Figure 5. VAK capsule positions ......................................................................................14 Figure 6. Flux ratio per four energy-group flux for E8, IS and VAK............................. 15 Figure 7. Normalized dpa-rate spectrum at IS, E8, and BA1. ......................................... 15 Figure 8. Dpa fractions per four neutron energy groups for E8, IS and VAK................ 16 Figure 9. Comparison of VAK data with that of U.S. power reactor data...................... 16 Figure 10. Atucha-I and CRP-II JF shift data vs. effective dpa........................................19 Figure 11. Radiation embrittlement of ASTM SRM (A302B) material. ......................... 21 Figure 12. Radiation embrittlement of ASTM SRM materials irradiated at 550°F ......... 22 Figure 13. Embrittlement trend curves of PR-EDB HSST02 SRM material .................. 23 Figure 14. Comparison of embrittlement trends for PR and TR data............................... 24 Figure 15. HSST03 SRM Material embrittlement trend at 550°F irradiation
temperature. .............................................................................................................. 24 Figure 16. SASTM Material embrittlement trends ...........................................................25 Figure 17. Normalized SASTM A302B data trend curves, at RG1.99/R2 FF=1. .......... 25 Figure 18. Embrittlement trend curves for plate and forging. ......................................... 26 Figure 19. Embrittlement trend curves of normalized shift for plate and forging.......... 26 Figure 20. Dose-rate effect of normalized shift for plate and forging. ........................... 27 Figure 21. Trend curves of base surveillance data, PR-EDB ............................................27 Figure 22. Embrittlement trends of base surveillance data from PR-EDB...................... 28 Figure 23. Embrittlement trends of weld surveillance data from PR-EDB. .................... 28 Figure 24. Embrittlement trends of normalized weld data from PR-EDB. ..................... 29 Figure 25. Embrittlement trends of normalized base metals with CF=115°F from PR-
EDB........................................................................................................................... 30 Figure 26. Embrittlement trends of normalized base metals with CF=115°F from PR-
EDB........................................................................................................................... 30 Figure 27. Embrittlement trends of normalized base data with CF=115°F from PR-EDB.
................................................................................................................................... 31 Figure 28. Embrittlement trends of normalized weld data with CF=44.8°F from PR-EDB.
................................................................................................................................... 31 Figure 29. Embrittlement trends of normalized weld data with CF=153°F from PR-EDB.
................................................................................................................................... 32 Figure 30. With two order-of-magnitude adjustments on fast fluence for Atucha-I Set # 3
data, the IAEA CRP-II JF data and Atucha-I JF data can be fit into one single trend.................................................................................................................................... 36

1
1. INTRODUCTION
The Argentina Nuclear Regulatory Authority (ARN) requested that Oak Ridge National Laboratory (ORNL) review and evaluate the reactor pressure vessel (RPV) surveillance data for the Atucha-I Nuclear Power Plant (NPP). This ORNL and ARN collaborative research program “Reactor Pressure Vessel Embrittlement of Atucha-I,” was carried out as part of the Reactor Safety activity sponsored by DOE. The aging and degradation of light-water reactor (LWR) pressure vessels is of particular concern because of their relevance to plant safety and the magnitude of the expected irradiation embrittlement. Ferritic reactor pressure vessel materials undergo a transition in fracture behavior from ductile to brittle at a low temperature, usually below room temperature. Neutron irradiation to fluence above about 5×10¹⁷ n/cm² causes an upward shift in this ductile-to-brittle transition temperature (DBTT) and a drop in the toughness of RPV steels. Charpy V-notch tests are conducted in the nuclear industry to monitor changes in the fracture behavior during irradiation. The nuclear industry indexes the DBTT at 30 ft-lbs (41J) of absorbed energy and the shift in the DBTT is referred as ∆T30. The failure of an RPV due to embrittlement by neutron irradiation could lead to a loss of coolant and a rapid core meltdown generating high pressure and temperature loading, possibly above those for which containments are designed. The radiation embrittlement of RPV materials depends on many different factors such as neutron flux, fluence, fluence spectrum, irradiation temperature, pre-irradiation material history and its chemical compositions [1, 2]. These factors must be considered in order to reliably predict the pressure-vessel embrittlement and to ensure the safe operation of the reactor. To provide a comprehensive basis for cataloging and understanding radiation embrittlement of RPVs two embrittlement data bases, one for power reactor surveillance data (PR-EDB) and the other for test reactor experiments (TR-EDB) have been established. Assessment of new data in terms of the EDBs can be used to determine the validity of the data and to predict a safe lifetime for a vessel. Based on embrittlement predictions, decisions can be made concerning operating parameters, low-leakage-fuel management, possible life extension, and the need for annealing of the pressure vessel [3]. Large amounts of data obtained from surveillance capsules and test reactor experiments are needed, comprising many different materials and different irradiation conditions, to develop generally applicable damage prediction models that can be used for industry standards and regulatory guides. This study’s purpose is to provide ARN an independent analysis of the Atucha-I RPV surveillance data with respect to U.S. nuclear codes and surveillance data. Another important purpose was to provide an independent evaluation of the neutron dose-rate effect and neutron spectrum effect on RPV embrittlement. The scope of the review encompasses the following elements.
1. Assessment of the surveillance data with respect to U.S. Nuclear Regulatory Commission (NRC) Regulatory Guide, Rev. 2.
2. Comparison of the surveillance data with U.S. results for similar materials. 3. Assessment of neutron spectrum effect on RPV embrittlement.

2
4. Assessment of the effects of dose-rate and irradiation temperature on RPV embrittlement.
2. BACKGROUND OF ATUCHA-I SURVEILLANCE PROGRAM
Atucha-I NPP is located in Lima, some 100 km northwest of Buenos Aires. With a net electric power capacity of 335 MW, Atucha-I began its commercial operation in 1974. It was the first nuclear power plant in Latin America [4]. The main builder and designer of Atucha-I NPP was Siemens-KWU AG. The reactor is a pressurized heavy water reactor (PHWR). According to the original design, Atucha-I is fueled with natural uranium (0.72%), but fuel elements of a new design have been incorporated. These have slightly enriched uranium (0.85% U-235), so that the reactor core is now partly loaded with slightly enriched fuel, and partly with natural uranium fuel. The reactor is moderated and cooled with heavy water. The reactor core contains 252 cooling channels. It is inside these channels that fuel elements are lodged. Refueling is performed during normal operation at an average of 1.2 fuel elements per day at full power, so the top of the RPV has not been removed since its inception. Thus, the interior RPV components have never been examined. Nucleoelectrica Argentina S.A. (NASA) is in charge of the production of the electrical energy produced by nuclear power plants Atucha-I and Embalse and of the construction of Atucha-II which is about 81% completed. The Atucha-I Surveillance Program is briefly described below.
2.1 RPV Surveillance Program of Atucha-I NPP
The RPV of Atucha-I NPP has a height of 12.0 m (472 in.) and inner diameter of 5.36 m (211 in.). Its wall thickness in the beltline region is 220 mm (8.66 in.). The base material of the RPV is DIN 22 NiMoCr 37 (similar to ASTM A508 Class 2 forging) with a 5-mm thick cladding of stainless steel DIN X5 CrNiNb 19/9 at the inner wall. The temperature of the cooling fluid is 260°C in the inlet nozzle and 320°C in the outlet nozzle. The surveillance capsules are located in the coolant channels below the reactor core. Figure 1 shows a schematic diagram of the Atucha-I RPV design. In 1968 the Atomic Energy Commission of Argentina (CNEA) asked Siemens AG to carry out an RPV surveillance program [5]. At that time, Siemens AG did not consider it necessary to implement a surveillance program since the postulated RPV brittle fracture condition would not be reached for 32 effective full-power years (EFPY) of operation. However, due to continuing requests from CNEA, Siemens AG offered a surveillance program in 1974 that included tensile, Charpy impact, and 1X-WOL specimens made of base, weld and heat-affected zone materials. The program included 30 irradiation capsules located under the core in the lower part of some of the fuel channels. In 1980 the first set of 15 capsules was withdrawn and the irradiated specimens were analyzed and tested by the designer. At the same time, 10 capsules containing specimens of the same type but made of A508 cl.3 (normalized material of Japan forging) were also installed. The purpose of the additional surveillance data was to correlate the irradiation of Atucha-I material with the reference material. The inclusion of these new specimens in the surveillance program was

3
performed under the scope of a research program established in 1977 by contract between CNEA and International Atomic Energy Agency (IAEA) with the corresponding Siemens AG’s agreement. Siemens AG and CNEA estimated that the ratio between fast neutrons (E > 1 MeV) and thermal neutrons (E < 0.4 eV) is 1:1000 at the Atucha-I surveillance capsule position and 1:10 at the inner wall of the RPV in the beltline region. At the Atucha-I surveillance specimen positions about 85% of the dpa (displacement per atom) are generated by thermal neutrons. That means that the dpa caused by thermal neutrons play the dominant role. Therefore, Atucha-I surveillance data required a detailed study of the spectrum effect, such as damage efficiency of thermal neutrons, etc., before it can be directly applied to the RPV surveillance program.
2.2 Results from Set 1 of the Atucha-I Surveillance Program
The tests performed by Siemens AG on baseline and irradiated specimens from the capsules withdrawn in 1980 [6] had the following results, where base material is determined as the limiting material:
1. The unirradiated RTNDT for the base material was determined to be 10°C, which is different from the 1968 Siemens AG’s evaluation of RTNDT, which gave -12°C.
2. The transition temperature shift at 41 Joule, ∆T41J, is 91°C at 32 EFPY.
The adjusted RTNDT (ART) at 32 EFPY are estimated as 101°C and 79°C for RTNDT values evaluated in 1980 and 1968, respectively. However, both the ART values exceed the admissible value of RTNDT = 32°C from the analysis of a loss of coolant accident (LOCA) initiated by a small break in a primary circuit pipe. Therefore, it was decided to develop a new surveillance program.
Surveillance Capsule
Figure 1. Schematic diagram of Atucha-I surveillance position.

4
2.3 VAK Surveillance Program
CNEA and the Siemens AG agreed to carry out a new program of tests that included a set of specimens irradiated at 265ºC in the VAK reactor, a BWR experimental reactor of 16 MW(e) located in Kahl, Germany [7]. It was also agreed the damage function dpa would be used because it was able to account for the difference in the energy spectrum. However, it is important to emphasize that an accurate calculation of dpa requires a detailed and accurate neutron flux calculation especially in the range of thermal energies. The estimated values of the brittle-ductile transition temperature shift, ∆T41J, for the irradiated material were 91ºC for the first set of capsules and 67ºC for VAK. Both results correspond to 32 EFPY, a fast fluence of 1.28 × 10¹⁹ n /cm2 (E >1 MeV) at the beltline on the inner wall of Atucha-I RPV, which corresponds to 3.8 × 10⁻² dpa. Attention was focused on the fluence rate effect for the VAK accelerated surveillance data. According to the results obtained later, under research agreements between CNEA and IAEA, it was concluded that the VAK results (obtained with a lead factor of ~110) might not represent a conservative estimate for the transition temperature shift, ∆T41J, of Atucha-I at 32 EFPY.
2.4 Fracture Toughness Approach for Improving Reference Temperature (RTNDT)
Siemens AG also used fracture toughness data to improve the estimate of the nil ductility reference temperature, RTNDT. Six unirradiated 1T-CT specimens were tested; a reference temperature RTNDT(KIC) = - 32 ºC was determined.
Finally, according to the analysis performed by Siemens AG in 1985, the reference temperature RTNDT = - 32ºC was added to the brittle-ductile transition temperature shift ∆T41J = + 67ºC, obtained from the VAK irradiation program, resulting in a maximum reference adjusted temperature of ART = + 35ºC for the RPV material at 32 EFPY.
At the same time the value of RTlim-RPV = + 32ºC for the RPV limiting permissible temperature obtained in 1983 was improved. The curve KIC from the ASME code was used and a new value of + 36ºC was obtained which means there is only a margin of 1ºC after 32 EFPY. All of this implies that in the event of the considered loss of coolant accident (LOCA) taking place close to the end of the reactor lifetime the temperature of the material would be only one degree below the brittle-ductile transition temperature.
2.5 Results from Set 2 of the Atucha-I Surveillance Program
During 1987 the 2nd set of Atucha-I surveillance capsules was withdrawn. Set 2 was examined by CNEA and the mechanical tests were completed in 1993 [8]. The results confirmed the trend observed with Set 1. The same objections as those made at the time of the analysis of Set 1 are also valid for Set 2. The final report on the Atucha-I surveillance program, issued at the end of 1993, recommended accepting the validity of the complementary program performed by Siemens AG in the VAK reactor and with additional guidelines to reduce the program uncertainties.

5
2.6 Improved Fluence Evaluation of the Atucha-I EX-Vessel Dosimetry Program
Due to the physical constraints of the Atucha-I RPV design, the in-vessel surveillance capsules are located in positions where environmental conditions are substantially different from those at the RPV inner wall. Consequently, uncertainties in the RPV surveillance program increase, emphasizing the necessity for comprehensive ex-vessel dosimetry. As a continuation of the surveillance program efforts started in 1994, the ex-vessel dosimetry experiment was reevaluated [9]. Three sets of activation dosimeters were attached to the outer wall of the Atucha-I reactor pressure vessel at a different azimuthal position in an axial level very near to the core mid-height. In 1996, experimental data were used to consolidate the calculated spectrum at the outer wall of Atucha-I RPV. From this work, an improved reevaluation of the spectrum was obtained based on up-to-date neutron transport and adjustment codes. Nevertheless, some inconsistencies remain unresolved, mainly, the fast energy region. Several possible causes for these inconsistencies in the Calculated/Measured (C/M) values were investigated.
2.7 Atucha-I Surveillance Status and Future Recommendation
During the 2002 Atucha-I Workshop, the available documentation and presentation materials of the Atucha-I Surveillance Program were reviewed by the foreign team , which included Dr. Elisabeth Keim (Framatome), Dr. Jy-An John Wang (ORNL), Dr. Uwe Jendrich, (GRS), and Dr. Kim Wallin (VTT). The summary statement on the status and recommendations prepared for the Atucha-I Surveillance Program is stated below.
2.7.1 Status
Neutronic analysis:
• The new 3D TORT code plus updated cross-section library BUGLE 96, calculations are already quite good, but discrepancies related to copper and iron dosimeters still need to be examined. Due to the use of cavity dosimetry the uncertainty of the best fluence estimate is approximately 20-30%.
• The neutronic analysis of the VAK irradiation is not presently updated to the new standard procedures used in Atucha-I RPV fluence evaluation.
Initial material properties:
• The original vendor’s data regarding the Atucha-I RPV are not included in the document list. The existing data show that the critical material in the Atucha-I RPV is the base material.
• The 1980 value of RTNDT (+10ºC) is overly conservative compared to newer, more advanced definitions of transition temperature.
• The uncertainty in the transition temperature, defined as RTKIC, is a function of the number of tests. Being a lower bound fit, the parameter is strongly affected by statistical sampling.

6
• The Master Curve based RTT0 is basically equivalent to RTKIC, but since it is based on a mean fit to the data it is less affected by statistical sampling. This definition of transition temperature shows the smallest uncertainty.
• The Master Curve data generated by CNEA with 10×10 mm bend specimens and 25 mm CT specimens is consistent with the previous data generated by Siemens. This implies that the 41.1 forging is homogeneous from a fracture toughness point of view. Since highly constrained bend specimens have been used no additional margins to the transition temperature of -27.2ºC are required.
• The T41J values for the initial forging 31.3 indicate only a small difference between L-T and T-L orientation. For the forging 41.1 there are two conflicting data sets for orientation L-T. One data set indicates a significant difference between L-T and T-L orientation while the other set does not.
Irradiated material properties:
• The surveillance data is clearly affected by a high thermal/fast neutron ratio, which makes the test results overly conservative as compared to that of U.S. RPV surveillance data and it cannot be used directly for the safety assessment. More detailed investigation needs to be carried out for Atucha-I surveillance data.
• Based on present knowledge, the VAK irradiation seems to have similar irradiation conditions as the Atucha-I RPV with the exception of high lead factor (≈100). The general view is that flux rate effects are small. However, this has not been demonstrated for this material and these irradiation conditions.
• Due to the conflicting T41J values for the initial forging 41.1, there is some uncertainty regarding the shift of 67ºC determined in VAK. A reevaluation of the Charpy v-notch (CVN) data could decrease this shift. The use of transition shift based on CVN in combination of RTT0 for the initial values may require the use of a comparatively large safety margin to compensate for the generally observed uncertainty in CVN versus fracture toughness shifts.
• No fracture toughness values for the VAK irradiation are available.
2.7.2 Recommendations for Current Issues
Neutronic analysis:
• An in-vessel dosimetry program should be considered since this can help reduce the uncertainties in the fluence estimates to or by 10-15%. This exercise will also help the assessment of how representative the VAK data is.
• Method and codes applied for fluence calculations should be consistent with the current state-of-the art methods.
• Update the VAK fluence estimation to the new standard procedures used in the Atucha-I RPV.
Initial material properties:

7
• The original vendor data regarding the Atucha-I RPV and all other relevant data should be collected and reanalyzed to better describe the material’s homogeneity. The chemistry variability in the materials used should also be checked.
• Since the T41J values for the initial state of both forgings 31.3 and 41.1 (including the new results by CNEA) produce similar values, the criticality of forging 31.3 should be examined in more detail. The recommendation is to generate RTT0 estimates for the initial state of forging 31.3 also. The weld should also be tested to confirm that the forging is the limiting material. The orientation should be T-L since this is generally considered to be the more critical orientation.
Irradiated material properties:
• The representation of the VAK irradiation has to be demonstrated both with respect to spectrum differences and dose-rate effect. Any required safety margins due to these differences must be defined. This demonstration and definition of possible safety margins should be based on Siemens data from VAK and other databases on forgings like USA BWR surveillance data and IAEA. The demonstration must either show that the effects on toughness are smaller than the experimental uncertainty or quantify the magnitude of the differences.
• Determine the RTT0 for the materials irradiated in VAK. Both fluences and both forgings (31.3 and 41.1) should be tested. The need to test the weld material depends on the outcome of the initial property investigation. If the T0 for the weld is lower than for the forgings, the weld need not be tested. A sufficient number of specimens should be tested to minimize the uncertainty in the RTT0 estimate, usually 12–15 specimens for each material.
2.7.3 Recommendations for Future Issues and Life Extension In case the proposed measures regarding the material investigations and dosimetry are unable to ensure safe operation until the designed end of life, the focus should be directed towards the mitigation of the maximum loading and more detailed structural integrity analysis. This includes the improvement of flaw detectability and sizing by NDE to decrease the uncertainty in the possible flaw size.
New irradiation program
Life extension beyond present end of life fluence requires a new irradiation program. Preferably this program should be based on irradiations in the Atucha-I RPV, if the proper irradiation conditions can be achieved. The lead factor should not be greater than 10. The maximum lead factor depends on the results from the evaluation of the VAK data. Other options are irradiations in either LWR surveillance positions or test reactors, where the proper irradiation temperature and spectrum can be obtained. The test program should include fracture toughness and tensile specimens. The irradiation capsules must include a verified dosimetry program and temperature measurement.

8
3. COMPARISON OF ATUCHA-I SURVEILLANCE WITH POWER REACTOR DATABASE (PR-EDB) AND TEST REACTOR DATABASE (TR-EDB)
Research laboratories and nuclear industries in many countries are actively involved in assessing the effects of nuclear radiation on the properties of pressure vessel steels. Results have been obtained in many cases under different test conditions for different types of steels and with the use of different samples. The power reactor database (PR-EDB) and test reactor database (TR-EDB) which were developed and are maintained at ORNL [10-12] are very comprehensive collections.
For U.S. commercial nuclear-power reactor surveillance data, the current version of PR-EDB contains the Charpy test data from 271 capsules in 101 reactors and consists of 222 data points of heat-affected-zone (HAZ) materials (102 different HAZ), 246 data points for weld materials (110 different welds), and 561 data points from base materials. The 561 data points for base materials include 321 for plates (103 different plates), 125 for forgings (35 different forgings), and 115 for standard reference plate materials (SRM). For TR-EDB, information is available for 1308 different irradiated sets (352 from plates, 186 from forgings, 303 from SRM, 396 from welds, and 71 from HAZs) and 268 different irradiated plus annealed data sets (89 from plates, 4 from forgings, 11 from SRM, and 164 from weld materials).
The ductile-to-brittle transition temperature shift at the 30 ft-lb energy level obtained from Charpy impact tests was used as the primary index for RPV embrittlement in the current study.
3.1 Background of U.S. NRC Regulatory Guide 1.99, Rev. 2
Revision 2 of Regulatory Guide 1.99 (RG1.99/R2) [13] was published in May 1988 following a period of public comment. A detailed description of the data and analysis upon which the Guide is based can be found in “Basis for Revision 2 of U.S. NRC Regulatory Guide 1.99” [14]. The analyses that resulted in the predictive equation contained in the Guide were performed by G. L. Guthrie [15] and G. R. Odette [16]. Only commercial power reactor surveillance data were used in the analysis. The development of RG1.99/R2 resulted in the establishment of two methods, designated regulatory positions, for determining the adjusted reference temperature (ART) for a given material. The ART for each material in the beltline is given by the following expression:
ART = Initial RTNDT + ∆RTNDT + Margin,
Where initial RTNDT is the reference temperature for the unirradiated material and ∆RTNDT is the mean value of the adjustment in reference temperature caused by radiation. The first method (Regulatory Position 1) is a calculative procedure based on the copper and nickel contents and the fast neutron fluence. The ∆RTNDT should be calculated as follows:
∆RTNDT = (CF) f (0.28-0.10log f)
where CF (°F) is the chemistry factor, a function of copper and nickel content, determined separately for welds and base metals, and f (in unit 1019 n/cm², E>1MeV) is

9
the neutron fast fluence. Margin is the quantity (°F) that is added to obtain conservative, upper-bound values of ART and is calculated as follows:
Margin = 2 √(σI2 + σ∆
2),
Where, σI is the standard deviation for the initial RTNDT and is usually assumed to be equal to zero in the U.S. (except when generic data are used); σ∆ is the standard deviation for ∆RTNDT and is 28°F for welds and 17°F for base metal. The Guide specifies that σ∆
need not exceed 0.5 times the mean value of the ∆RTNDT.
The second method (Regulatory Position 2) for determining ART is through the use of Charpy surveillance data. If two or more credible surveillance data sets are available for the reactor, the Guide presents a method by which one develops a relationship of ∆RTNDT to fluence for the reactor. Regulatory Position 2 describes a procedure in which the same equation for ∆RTNDT is to be used with the fluence factor retained, but the effective value of the chemistry factor is determined by the plant surveillance data.
3.2 Atucha-I Surveillance Results
The chemical compositions of Atucha-I RPV surveillance materials are listed in Table 1.
Table 1aBase Steel: 22 NiMoCr 37, forging material Material C Si Mn P S Cr Mo Ni Cu GW 31.3 0.19 0.21 0.69 0.009 0.012 0.41 0.63 0.81 0.12 GW 41.1 0.22 0.26 0.75 0.016 0.010 0.40 0.65 0.82 0.14
Table 1bWeld material: Material C Si Mn P S Cr Mo Ni Cu SG 0.09 0.18 1.84 0.009 0.017 0.10 0.55 0.08 0.08
Table 1cIAEA JF forging material Material C Si Mn P S Cr Mo Ni Cu IAEA JF 0.18 0.26 1.34 0.007 0.005 0.11 0.50 0.77 0.04
Based on the thermal monitors in Atucha-I surveillance capsules, the capsule temperatures of Atucha-I Set #1 and Set #2 data are between 271°C (520°F) and 290°C (554°F). This temperature range is consistent with that of the RG1.99/R2’s temperature ranges, thus no temperature adjustment was considered in comparison to U.S. power reactor data. Based on RG1.99/R2, the mean chemistry factor for GW31.3 and GW41.1 of Atucha-I surveillance materials is 100°F per unit fluence, where forging is considered to be the critical material for Atucha-I RPV embrittlement.
3.1.1 Atucha-I Surveillance Set #1 and Set #2 data
Set #1 and Set #2 of Atucha-I surveillance forging materials, shown in Figs. 2–3, show a consistent trend. The fitting methods used to develop trend curves are also described in the legend. The U.S. power reactor data for A5082 forging materials with copper content between 0.10 to 0.15 wt% and nickel content within 0.70 to 0.90 wt% are also included in the plots for comparison purposes. Figure 3 also provides RG1.99/R2’s trend curve and

10
two sigma bounds. The trend curve for Atucha-I surveillance data appears to indicate accelerated embrittlement compared to the U.S. power reactor trend curve. The transition temperature shift of Atucha-I surveillance data is much higher than the predicted values from RG1.99/R2, while most of the PR-EDB data are within the Guide’s bounds as shown in Fig. 3. The main reason for this accelerated embrittlement is attributed to the neutron spectrum effect of Atucha-I surveillance capsules as compared to that of U.S. power reactor surveillance capsules. The ratio of the thermal neutrons to fast neutrons for the Atucha-I surveillance capsule positions is about 1000:1, while that for U.S. power reactors is around 1:1.
Figure 2. Comparison of Atucha-I surveillance data and PR-EDB forging.
Figure 3. Comparison of Atucha-I surveillance data and RG1.99/R2.
Transition Temperature Shift for Forging Material w/ 0.1wt% < Copper < 0.15 wt%
0
50
100
150
200
250
300
350
1.00E+18 1.00E+19 1.00E+20
Fast Fluence, E > 1 MeV [n/cm²]
Tran
sitio
n Te
mpe
ratu
re S
hift,
[°F
]
PR-EDB Atucha-I 31.3,41.1 Pow er (PR-EDB) Pow er (Atucha-I 31.3,41.1)
Transition Temperature Shift for Forging Material w/ 0.1wt% < Copper < 0.15 wt%
0
50
100
150
200
250
300
350
1.00E+18 6.00E+18 1.10E+19 1.60E+19 2.10E+19 2.60E+19
Fast Fluence, E > 1 MeV [n/cm²]
Tran
sitio
n Te
mpe
ratu
re S
hift,
[°F
]
PR-EDB Atucha-I 31.3,41.1 RG1.99/R2 w ith CF=100°Ftw o sigma bound 34°F Pow er (PR-EDB) Pow er (Atucha-I 31.3,41.1)
11
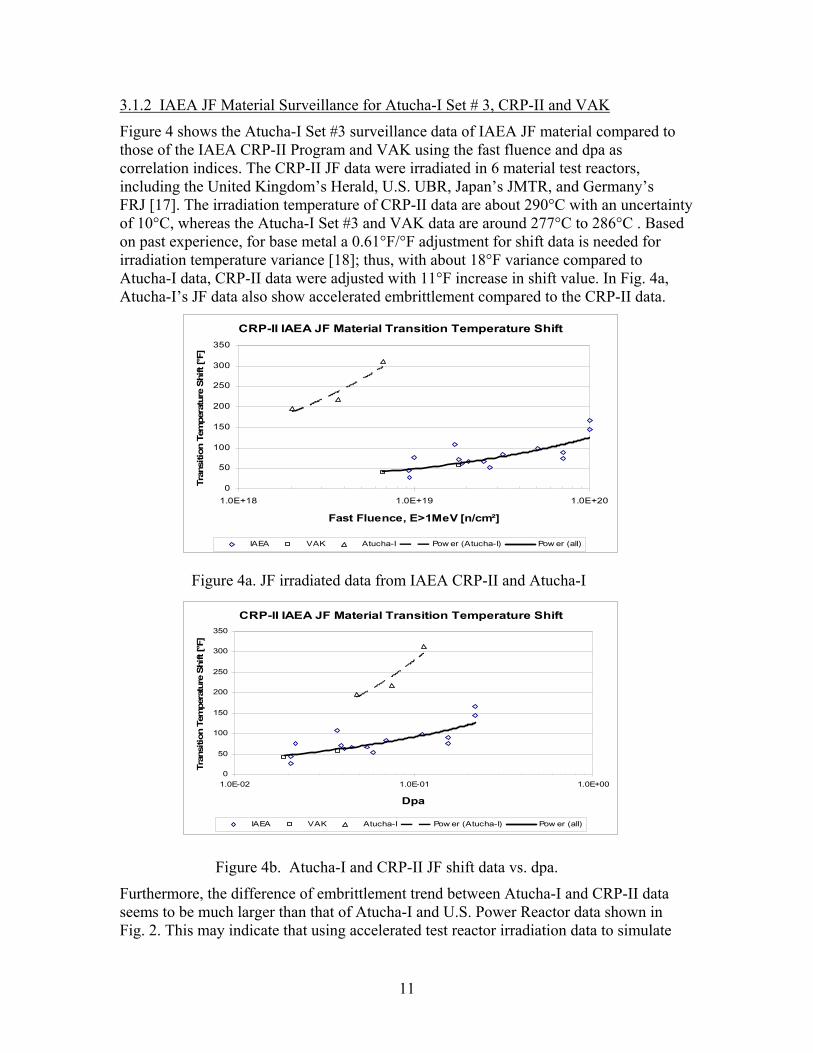
3.1.2 IAEA JF Material Surveillance for Atucha-I Set # 3, CRP-II and VAK
Figure 4 shows the Atucha-I Set #3 surveillance data of IAEA JF material compared to those of the IAEA CRP-II Program and VAK using the fast fluence and dpa as correlation indices. The CRP-II JF data were irradiated in 6 material test reactors, including the United Kingdom’s Herald, U.S. UBR, Japan’s JMTR, and Germany’s FRJ [17]. The irradiation temperature of CRP-II data are about 290°C with an uncertainty of 10°C, whereas the Atucha-I Set #3 and VAK data are around 277°C to 286°C . Based on past experience, for base metal a 0.61°F/°F adjustment for shift data is needed for irradiation temperature variance [18]; thus, with about 18°F variance compared to Atucha-I data, CRP-II data were adjusted with 11°F increase in shift value. In Fig. 4a, Atucha-I’s JF data also show accelerated embrittlement compared to the CRP-II data.
Furthermore, the difference of embrittlement trend between Atucha-I and CRP-II data seems to be much larger than that of Atucha-I and U.S. Power Reactor data shown in Fig. 2. This may indicate that using accelerated test reactor irradiation data to simulate
Figure 4a. JF irradiated data from IAEA CRP-II and Atucha-I
Figure 4b. Atucha-I and CRP-II JF shift data vs. dpa.
CRP-II IAEA JF Material Transition Temperature Shift
0
50
100
150
200
250
300
350
1.0E+18 1.0E+19 1.0E+20
Fast Fluence, E>1MeV [n/cm²]
Tran
sitio
n Te
mpe
ratu
re S
hift
[°F]
IAEA VAK Atucha-I Pow er (Atucha-I) Pow er (all)
CRP-II IAEA JF Material Transition Temperature Shift
0
50
100
150
200
250
300
350
1.0E-02 1.0E-01 1.0E+00
Dpa
Tran
sitio
n Te
mpe
ratu
re S
hift
[°F]
IAEA VAK Atucha-I Pow er (Atucha-I) Pow er (all)
12
Atucha-I data may be relatively non conservative compared to using power reactor data. In order to take into account the contribution of the lower part of the neutron energy spectrum to Atucha-I data, total dpa is used as the damage correlation index in Fig. 4b. This appears to reduce the degree of the embrittlement acceleration; but the higher embrittlement rate of Atucha-I shift data can still be observed. This may be the result of damage efficiency and will be discussed in the next section.
4. SPECTRUM EFFECTS AND DAMAGE EFFICIENCY
4.1 Radiation Embrittlement Correlation Index
Meaningful comparison of mechanical property changes of materials irradiated in different neutron environments requires a damage correlation parameter that accounts for the effects of the spectrum of neutron energies in the materials. Comparing property changes on the basis of the measured fast neutron fluence (e.g., E > 1 MeV) only recognizes that more defects per neutron are produced by higher energy neutrons. How well this works depends on the neutron spectra involved. Clearly, damage in a largely thermal neutron spectrum, which can produce recoil atoms through thermal neutron-gamma capture reactions, is poorly represented by the fast neutron flux [19]. Therefore, the outcome of using fast neutrons as the primary index for comparing RPV embrittlement from high thermal-to-fast neutron ratio environments will be misleading as demonstrated in Atucha-I surveillance data.
Dpa is widely used as an exposure index and as a correlation parameter [20, 21]. It is a measure of the average number of times an atom of the material is displaced from a stable defect position during an irradiation, and it takes into account the energy lost to inelastic processes that cannot produce displacement damage. The displacement cross section can be calculated for a given neutron spectrum and material. Calculation of dpa requires a neutron spectrum, a set of neutron reaction cross sections, a model of the kinematics of the reactions that produce primary atomic recoils, a model for the dissipation of the primary recoil energy as electronic excitation and damage energy, and a model for the conversion of damage energy into dpa.
4.2 Residual Defects and Damage Efficiency
It is generally accepted that radiation-induced hardening and embrittlement in metals are partially caused by clusters of vacancies and interstitials atoms and solute atoms that impede the motion of slip dislocations. The degree of embrittlement is conventionally correlated with fast-neutron fluence or with total displacements per atom (dpa), which are measures of the production rate of point defects. However, radiation effects such as swelling, solute segregation, and embrittlement, are driven not by the total atoms displaced but by the small fraction of point defects that avoid annihilation by mutual recombination and are available to form clusters or to diffuse to sinks [22–25]. In short, radiation effects are determined by the survival rate of point defects, not by their production rate. It follows that the rate of development of radiation effects under different irradiation conditions will not necessarily scale with fast fluence or with dpa unless the survival rate of point defects for each different irradiation also scales with the production

13
rate. Therefore, dpa is a measure of the potential to create point defects. It is not equal to the actual number of residual point defects. The actual number of point defects present in a material depends on the temperature and sink density, and the material’s history, including the neutron fluence. It also depends on the number of defects produced during primary damage production in the recoil events, which is dependent on the recoil energy [26–29].
Within a collision cascade created through high-energy recoil, a significant fraction of initially produced point-defect pairs (Frenkel pairs of vacant sites and self-interstitial atoms, referred to here as “vacancies” and “interstitials”) will recombine as the locally high energy density in the cascade region dissipates. Of the remaining defects, many form clusters (the stability of which depends on the crystal temperature), while a small fraction escapes the cascade region, becoming freely migrating defects. The fractions of initially produced defects that recombine or become freely migrating defects are constant above a minimum recoil energy (on the order of 10 KeV). At the other end of the energy scale, low-energy recoils create only a few isolated defect pairs with little clustering; nearly all the defects produced become freely migrating defects. Thus, the efficiency of production of residual point defects relative to calculated dpa values is a function of recoil energy; the efficiency decreases with increasing neutron energy and becomes constant at higher energies.
Generally speaking, dpa is a good first approximation for the correlation of radiation embrittlement for a flux consisting mainly of fast neutrons. The differences in pka (or recoil atom) spectra from various hard neutron spectra are not expected to strongly affect the point defect availability factor. However, additional modification should be considered for those spectra having a high thermal-to-fast neutron ratio, or displacement damage energy deposited by thermal neutrons within an order of magnitude of that deposited by fast neutrons. Especially where the material temperature is low, it would be prudent to analyze the point defects availability factor. The reason for the large difference presented in Fig. 4b among the embrittlement trend curves may be mainly due to a high thermal neutron flux existing at the Atucha-I surveillance capsule position and possible gamma dpa effects as identified in HFIR accelerated embrittlement phenomena [30].
Therefore, one can conclude that dpa can be an effective damage correlation parameter for irradiation in different neutron environments only if the property change of interest is influenced by a quantity that is proportional to dpa. Proportionality of the damage to dpa can be influenced by the rate of damage production as well as the spectrum. Since environments with different neutron spectra usually have different damage rates, failure to correlate data on the basis of dpa has often been attributed to rate effects. The rate effect will be further investigated in the dose-rate section.

14
5. SURROGATE GERMAN VAK DATA FOR ATUCHA-I RPV SURVEILLANCE
5.1 The VAK Reactor
From 1975 to 1984, Siemens KWU used the VAK reactor as an irradiation facility. The VAK reactor, now out of operation, was a small experimental boiling water reactor with an electric power production of 15 MW. The neutron spectrum is comparable to the other Siemens KWU PWRs, but at the capsule position, the neutron flux density was higher than at the surveillance position of power reactors. The VAK RPV had three irradiation positions (90°, 180°, and 270°). The VAK was capable of irradiating large capsules with a square area of 100 mm× 146.5 mm. The VAK RPV capsules are located at the core edge as shown in Fig. 5.
In order to validate the VAK surrogate data for Atucha-I RPV surveillance, the detailed neutron flux of the VAK surveillance capsule and Atucha-I RPV wall position were investigated by both Seimens and CNEA.
5.2 Radiation Environment of VAK Surveillance Capsules
The VAK capsules are located inside the core shroud and have a fast-neutron (E > 1MeV) flux-density of about 1E12 n/cm²s. Table 2 shows the lead factor of the VAK surveillance position in comparison to the Atucha-I RPV inner-wall position [7].
Table 2Lead factors of VAK surveillance capsules compared to Atucha-I RPV
Energy range Atucha-I RPV VAK capsule
E>1 MeV 1 174
0.1 MeV <E< 1 MeV 1 103
0.4 eV <E< 0.1 MeV 1 27
E < 0.4eV 1 62
Table 2 clearly shows the spectrum difference between VAK and Atucha-I RPV due to different lead factors for the four different energy ranges.
Spectral differences are also clearly seen by comparing the neutron spectrum in three surveillance positions: the Atucha-I surveillance capsule position at channel E8, the inner surface (IS) of the Atucha-I RPV wall, and VAK surveillance capsule position, Fig. 5. Preliminary neutron transport calculations were carried out in 1981 with the P3S8 approximation using the discrete-ordinate transport-code DOT 3.5, and the cross section library in the 53 energy-group structure derived from VITAMIN-C. The analysis of these
CapsuleFigure 5. VAK capsule positions.

15
results in the usual four energy-group structure shows that neutrons in the last group, E < 0.4 eV, contribute 97% of the total flux at the surveillance positions (see E8 in Fig. 6) which is based on input from M. Caro [31] of CNEA. The spectral composition at CNA-1’s inner wall (IS) is substantially different. The thermal group contribution to the total flux is about 27%. Neutrons with energies above 0.1 MeV contribute 8% to the total flux at IS. Figure 6 also shows that the neutron spectrum at VAK is harder than that of the CNA-1 RPV inner wall, i.e. 22% of the neutrons have energies E > 0.1 MeV.
Due to the large spectral differences at these three positions, dpa was used as a measure of neutron exposure. The normalized dpa-rate spectra are shown in Fig. 7 and as grouped percentages of total dpa in Fig. 8. At the Atucha-I surveillance position E8, more than 80% of the total dpa is produced by thermal neutrons. The dpa spectrum at IS is quite different from the E8 position. At IS 81% of the total dpa comes from neutrons with E > 0.1 MeV. The VAK spectrum is relatively harder than that of IS and most of the damage (~ 95%) originates from neutron energies greater than 0.1 MeV.
Figure 6. Flux ratio per four energy-group flux for E8, IS and VAK.
Figure 7. Normalized dpa-rate spectrum at IS, E8, and BA1.
Normalized DPA-RATE
1.E-06
1.E-05
1.E-04
1.E-03
1.E-02
1.E-01
1.E+00
1.E-05 1.E-03 1.E-01 1.E+01 1.E+03 1.E+05 1.E+07
Energy [eV]
Nor
mal
ized
DPA
-rat
e Sp
ectr
um IS
E8
VAK
97
3
27
53
6525
10
53
12
0% 10% 20% 30% 40% 50% 60% 70% 80% 90%
100%
E8: CNA-1 IS: CNA-1 BA1: VAK
E > 1 MeV 1 MeV < E < 0.1 MeV 0.1 MeV < E < 0.4 eV E < 0.4 eV

16
For the purpose of comparison, the VAK surrogate data were added to the plot of Fig. 3, as shown in Fig. 9. VAK’s data were for irradiation at 509°F (265°C), which has a variance of 40°F compared to U.S. power reactor data at 550°F, thus an adjustment of 24.4°F was added to VAK’s shift data shown in Fig. 9. According to Fig. 9, VAK’s data is significantly lower than that of the predictions in RG1.99/R2 and U.S. power reactor data. The VAK trend curve shows a bias of -50°F compared to the U.S. power reactor trend curve. It’s not clear whether this is caused by VAK capsule temperature or a dose rate effect of the VAK irradiation environment, which has a lead factor of about 100 for fast-neutron fluence compared to that of PR-EDB data.
Figure 8. Dpa fractions per four neutron energy groups for E8, IS and VAK.
Figure 9. Comparison of VAK data with that of U.S. power reactor data.
Transition Temperature Shift for A5082 Forging Material w/ 0.11 < Cu < 0.13 wt% & 0.74<Ni<0.86 wt%
0
50
100
150
200
250
300
350
1.00E+18 6.00E+18 1.10E+19 1.60E+19 2.10E+19
Fast Fluence, E > 1 MeV [n/cm²]
Tran
sitio
n Te
mpe
ratu
re S
hift,
[°F
]
PR-EDB Atucha-I 31.3,41.1 RG1.99/R2 w ith CF=100°Ftw o sigma bound 34°F VAK Pow er (PR-EDB)Pow er (Atucha-I 31.3,41.1) Pow er (VAK)
83
5
14
23
17
13
58
78
3
2
2
2
0%
20%
40%
60%
80%
100%
E8 IS VAK
E > 1 MeV 0.1 MeV < E < 1 MeV
0.4 eV < E < 0.1 MeV E< 0.4 eV

17
5.3 VAK Surveillance Capsule Temperature
Two major concerns were raised by the author after examining the summary report of the VAK surveillance program regarding the irradiation temperature of the VAK surveillance capsule, stated as 265°C in the VAK report.
First, the VAK capsule is located near the edge of the core and is in front of the thermal shield. Thus, in the VAK capsule position, it is anticipated that the capsule will experience a much higher gamma heating environment compared to surveillance capsules located behind the thermal shield, as normal surveillance capsules of power reactors are [32], because one major function of the thermal shield is to mitigate the gamma heating effect of the vessel and indirectly for capsules as well.
Second, as mentioned in the report, the VAK capsule is designed according to the “collapsed can” principle. This means that the irradiated specimens are in close contact with the capsule and there is no cavity or void between the capsule wall and surveillance specimen during irradiation. However, this is purely a hypothesis and further verification from detailed thermal-mechanical stress analysis is needed to justify this concept. The VAK capsule size is relatively large compared to that of U.S. PWR surveillance capsules, thus it is anticipated that VAK capsules will experience more gamma heating deposition compared to that of the U.S. surveillance capsules. The VAK capsule contains multi-layers of surveillance specimens throughout its length. Even with no voids or cavities in the capsule, those specimens with no direct contact with the capsule wall the layer interface will reduce heat transfer from the inner layers. Thus, the VAK capsule will take a longer transient period to balance the temperature between the capsule and coolant. In addition, there are always gaps between specimens and between specimens and the capsule wall due to initial specimen loading conditions, thermal expansion, and other factors. Therefore, the capsule temperature will continue to increase until it reaches a steady-state temperature balanced by gamma heating deposition and the heat transfer of the deposited heat within specimens to the coolant boundary. In order to resolve this specimen irradiation temperature issue, the VAK capsule temperature needs to be further investigated through a detailed neutronic-thermal-mechanical analysis of the VAK surveillance capsule, which was not provided in the current VAK surveillance report.
5.4 Evaluation of Projected VAK Fast Fluence from Atucha-I RPV Fluence
For the VAK surrogate surveillance program, it was intended to choose an irradiation time so the VAK irradiated specimens would receive the same embrittlement as that of the RPV wall of Atucha-I at 32 effective full-power years, which will have a neutron fluence 1.3E+19 n/cm² (E > 1 MeV). To take into account the differences between the neutron spectra at the inner wall of Atucha-I and at the irradiated position of the VAK surveillance capsules, the ratio of the total dpa to fast fluence (E>1MeV) was used in VAK fluence evaluation. This approach forms the basis of the “scaling factor” concept used in evaluating the required end-of-life (EOL) fast fluence for the VAK surveillance program. The scaling factor is defined as follows:
Scaling Factor = (Total dpa / Fast fluence)Atucha-I / (Total dpa / Fast fluence)VAK .

18
Based on the above formula, the evaluated scaling factor is equal to 1.34, and the projected VAK fluence corresponding to EOL Atucha-I fluence is equal to
1.34 × 1.3E19 n/cm² = 1.74 E19 n/cm². To apply and validate this scaling factor methodology, one must ensure that “VAK and Atucha-I spectra are similar,” i.e., total dpa can be used to scale Atucha-I's EOL fluence to VAK if, and only if, the two neutron energy spectra are similar. However, based on the dpa ratio and neutron fluence ratio stated in Table 2 and Figs. 6–8, VAK and Atucha-I neutron spectra are not similar due to large differences in fluence ratio and total dpa ratio in the corresponding energy ranges.
As pointed out in Section 4, since the thermal neutron has much higher damage efficiency than the fast neutron, special attention is needed when comparing the similarity of different neutron energy spectra. The mechanism of radiation damage production by thermal neutrons is briefly described below. Thermal neutron damage formation is mainly through radioactive capture, or thermal neutron capture, which produces many gamma rays in the 5 MeV to 10 MeV energy range. When a gamma-ray photon is emitted by the excited compound nucleus formed by neutron capture, the target atom suffers recoil. This recoil energy is often large enough to displace the atom from its equilibrium position and produce a small displacement cascade. The maximum energy of a gamma ray accompanying a (n,γ) reaction is in the range between 6 MeV and 8 MeV. For an element of low atomic mass (about 10), the recoil energy could be 2 keV to 3 keV, which is much greater than the 25 eV necessary to displace an atom. For iron (or RPV steel) this recoil energy is about 400eV. Thus, in order to validate the VAK scaling factor, the effective dpa, accounting for the damage efficiency, needs to replace the “total dpa” used in the scaling factor evaluation. A simplified approach that uses the mean residual defect in four energy ranges to evaluate the scaling factor is summarized in Table 3. Roger Stoller’s formulation [33–34] for damage efficiency was used in evaluating the effective dpa, where the issue of PKA or recoil energy was investigated by displacement cascade simulations using the method of molecular dynamics (MD). This formula is stated below. η = 0.5608 EMD
-0.3029 + 3.227 × 10⁻³ EMD
Table 3Scaling factor (SF) evaluation
Energy range DPA/s
Atucha IS DPA/s VAK
EMD KeV
damage efficiency
Effective dpa/s Atucha
Effective dpa/s VAK
>1MeV 2.04E-11 3.54E-09 30 0.297 6.05829E-12 1.05129E-09
0.1 MeV<E<1MeV 8.25E-12 8.51E-10 13.48 0.299 2.46304E-12 2.54066E-10
0.4eV<E<0.1MeV 4.87E-12 1.30E-10 1.368 0.514 2.5053E-12 6.68765E-11
E<0.4eV 1.40E-12 8.66E-11 0.4 0.741 1.03808E-12 6.42124E-11
Total dpa 3.492E-11 4.6076E-09 Total effective dpa 1.20647E-11 1.43645E-09
SF (total dpa ratio) 0.007578783 SF(effective dpa ratio) 0.008398991
Ratio ( effective dpa ratio/total dpa ratio) 1.108224274

19
From Table 2, the ratio of “Effective dpa ratio” and “Total dpa ratio” is 1.108, which can be used to modify the VAK scaling factor to obtain a new scaling factor that takes into account the residual defect concept. The new effective scaling factor can be written as 1.34 * 1.108= 1.487; the new projected VAK fast fluence will be 1.4847*1.3E19 n/cm² = 1.930E19 n/cm². Thus, the critical transition shift value obtained from the VAK experiment based on the 1.74E19 n/cm² fast fluence is no longer a conservative estimate, and the VAK transition temperature shift value needs to be adjusted accordingly.
5.5 Applying Damage Efficiency to IAEA JF Data from Atucha-I and CRP-II
The Atucha-I Set #3 surveillance data of IAEA JF material are compared to those of the CRP-II Program and VAK using the fast fluence and dpa as correlation index and are shown in Fig. 4. The effective dpa for the Atucha-I Set #3 data are calculated according to the methodology in Table 3 and is illustrated in Table 4.
Table 4Effective dpa of Atucha-I Set #3 data
Energy range Atucha E8 dpa ratio
dpa 1 dpa 2 dpa 3 Effective
dpa 1
Effective
dpa 2
Effective
dpa 3
>1MeV 0.13 6.24E-03 9.88E-03 1.48E-02 1.85E-03 2.93E-03 4.38E-03
0.1 MeV<E<1MeV 0.02 9.60E-04 1.52E-03 2.27E-03 2.87E-04 4.54E-04 6.79E-04
0.4eV<E<0.1MeV 0.02 9.60E-04 1.52E-03 2.27E-03 4.93E-04 7.81E-04 1.17E-03
E<0.4eV 0.83 3.98E-02 6.31E-02 9.42E-02 2.95E-02 4.67E-02 6.98E-02
Total dpa 4.80E-02 7.60E-02 1.14E-01 3.22E-02 5.09E-02 7.60E-02
The dpa of CRP-II JF data were scaled with a factor of 0.3116 to obtain their effective dpa. The effective dpa vs. shift data for IAEA JF material irradiated in Atucha-I and CRP-II Program are illustrated in Fig. 10. It shows that a large discrepancy between the Atucha-I Set #3 and the CRP-II JF data still exists even while the residual dpa concept was considered. This indicates that other potential damage mechanisms or neutron sources, which may contribute to the embrittlement shown in the Atucha-I Set #3 JF data, were not taken into consideration.
CRP-II IAEA JF Material Transition Temperature Shift
0
50
100
150
200
250
300
350
1.0E-03 1.0E-02 1.0E-01 1.0E+00
Effective Dpa
Tran
sitio
n Te
mpe
ratu
re S
hift
[°F]
IAEA VAK Atucha-I Pow er (Atucha-I) Pow er (all)
Figure 10. Atucha-I and CRP-II JF shift data vs. effective dpa.

20
6. DOSE RATE EFFECT
6.1 Background of the Dose Rate Effect
A “dose-rate effect” for low-alloy steel is based on the premise that radiation damage will be greater for a given fluence of neutrons when irradiation takes place at a low flux level over a long time than for irradiation at a high flux level for a short time. This is a very important consideration because these are the conditions under which accelerated irradiation is performed for short times to establish anticipated lifetime mechanical property changes in reactor vessel components that will be under irradiation for a long time at low flux levels. Accelerated irradiations typically are conducted at flux levels of 1012 to 1014 n/cm²sec for a period of several months, but reactor components are subjected to fluxes of about 1010 or 1011 n/cm²sec for up to 40 years. Thus, if there were a dose-rate effect of even a few percent embrittlement rate, this could amount to a very significant effect over a 40-year period and could possibly alter the safety of a component to an untenable degree.
The question of fluence-rate or dose-rate effects on radiation-induced embrittlement in nuclear service has its origins in the 1950s when accelerated irradiation exposures were first applied to study EOL nuclear service effects. Material testing reactors such as MTR and ETR in Idaho, the LITR and ORR in Tennessee, and UBR and UCRR in New York have been vehicles for high dose-rate exposures of reactor structural materials including RPV steels. In these reactors, radiation exposures of a few weeks or a few months in duration can equal projected EOL fluences for commercial power-reactor vessels. Whether or not the same magnitude of damage would be exhibited by materials irradiated under “fast” versus “slow” fluence accumulation conditions was a recognized uncertainty by the 1960s. This uncertainty was one key reason that power-reactor vessel surveillance programs were undertaken. To guide such efforts, ASTM E185, Standard Practice for Conducting Surveillance Tests for Light-Water Cooled Nuclear Power Reactor Vessels, was drafted.
The possible existence of a dose-rate effect for neutron irradiation of low-alloy pressure-vessel steel was approached theoretically as early as 1959 by Gray [35]. He showed that a dose-rate effect exists for reactor materials when irradiated under conditions of simultaneous thermal annealing. However, this work did not take into account the point defects lost to the obstacles and sinks in the matrix, such as grain boundaries or dislocation loops. The earliest known experiment to study the dose-rate effect was conducted in 1963 by Harries, Barton, and Wright [36] in the study of tensile specimen hardening, at fluences up to 2.0E+17 n/cm² and the work performed by Hinkle et al., in 1966 [37]. The two experiments were performed under conditions wherein the neutron spectrum at each flux level was essentially the same over the entire study. This is really the only way to accurately evaluate the possibility of a dose-rate effect. However, due to the low irradiation dose, no conclusive results were achieved. International efforts on the dose-rate effect were carried out through the IAEA CRP Program, and the major experimental efforts done in the U.S. included Hawthorne’s dose-rate effect research funded by the NRC [38] and a dose-rate effect study done earlier at the Reactor Division

21
of the Naval Research Laboratory. These data have been collected and integrated into ORNL’s TR-EDB.
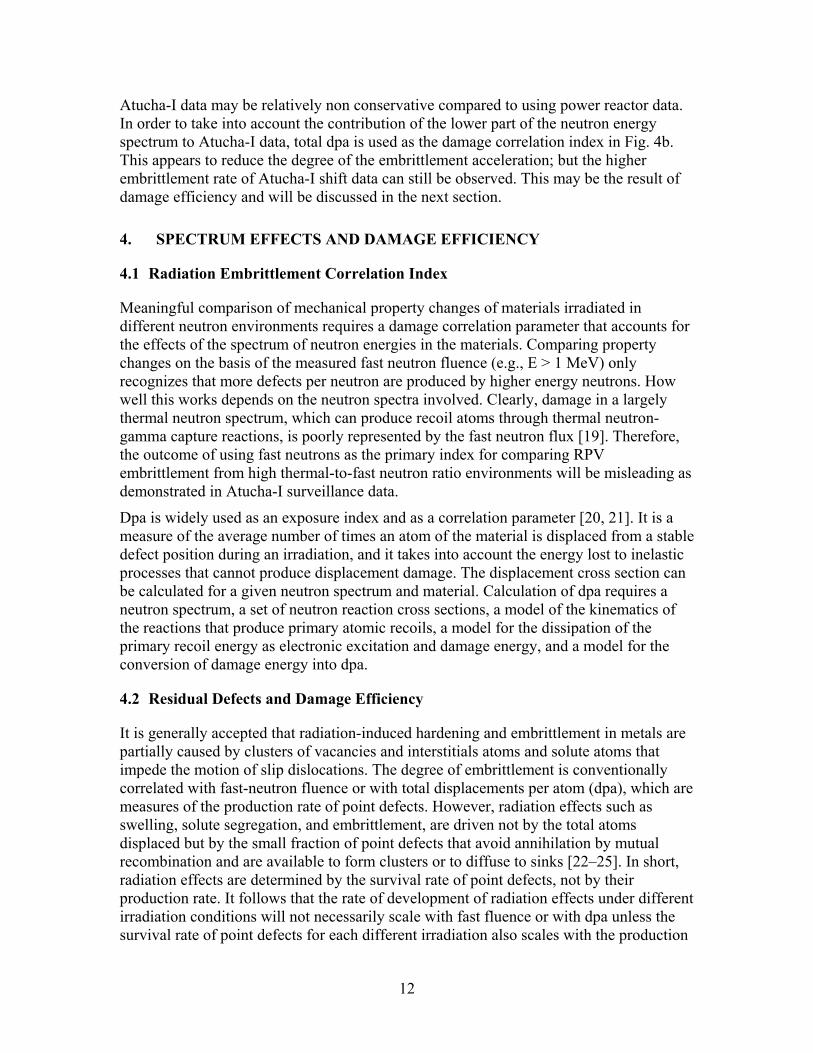
Comparison of embrittlement data from long-term, low-dose-rate sources (power reactors, PR-EDB) and short-term high-dose-rate sources (test reactors, TR-EDB) tend to suggest that there is a time-temperature dependence of the embrittlement process. In most cases the database did not provide a one to one comparison for a specific material. Rather, the dose-rate effect is inferred from comparison of material embrittlement trends. As illustrated in Figs. 11–12 for A302B standard reference materials (SRM), the power reactor data was illustrated with RG 1.99/R2’s trend curve to resemble the embrittlement trend at 550°F irradiation temperature. The RG 1.99/R2’s trend curve shows an early saturation and a lower embrittlement rate compared to that of test reactor data with relative lower irradiation temperatures. Furthermore, at 550°F irradiation temperature, there seems to be a consistent trend between the test reactor data and the power reactor trend curve up to the fluence value at 1.5E+19 n/cm², whereas, for fluence value greater than 1.5E+19 n/cm², the test reactor data show higher embrittlement rate compared to that of RG1.99/Rev.2’s trend curve and the power-reactor surveillance data’s trend curve as illustrated in Fig. 12.
SRMs, such as ASTM A302B reference plate (SASTM) or plates of the Heavy Section Steel Technology Program (HSST Plates 01, 02, and 03), were included in the surveillance program and permit a bridge to other irradiation environments and detect the anomalous behavior of the service reactors [39].
Figure 11. Radiation embrittlement of ASTM SRM (A302B) material.
Trend Curve for ASTM (A302B) Reference Materialper TR-EDB as Reported Data
0
50
100
150
200
250
300
350
400
450
0 5E+18 1E+19 1.5E+19 2E+19 2.5E+19 3E+19 3.5E+19 4E+19
Fluence, E>1MeV [n/cm²]
Tran
sitio
n Te
mpe
ratu
re S
hift
[F°]
R.G. 199 Prediction w/Cu=0.20, Ni=0.18 wt% Two Sigma 34°FIrrad. temp. <= 300°F Irrad. temp. = 400°F449 < Irrad. temp. <= 500°F Irrad. temp. = 550°F585<Irrad. temp. < 600°F Irrad. temp. = 650°FIrrad. temp = 700°F Irrad. temp. = 750°F
22
A further obstacle for dose-rate effects studies is the general tie between flux level and neutron spectrum. Decoupling these two factors experimentally is difficult. Progress made in neutron methodology in recent years offers partial solutions to this problem. Calculations of actual neutron spectra conditions, for example, are now available. Their use replaces the former practice of assuming a fission spectrum neutron energy distribution. Also, the exposure unit dpa has become more accepted as a measure of damage production potential and is an alternative to non weighted measures such as fast fluence.
The general objective of this dose-rate effect study was to clarify and confirm the significance of dose-rate effect to the Atucha-I surveillance program. Dose-rate effects were to be judged from the relative change in transition temperature shift determined with the Charpy-V notch impact test data listed in the PR-EDB and TR-EDB.
6.2 Dose-Rate Effect Study from HSST A533B1 Standard Reference Materials
The HSST01, HSST02, and HSST03 SRM contained in the PR-EDB and TR-EDB for an irradiation temperature around 550°F are used in this rate-effect study. The great benefit of using SRM materials in the rate-effect study is that the impact of material variability to the analysis can be minimized. This study shows that the irradiation temperature has a strong impact on the radiation embrittlement rate as shown in HSST02 SRM data. Based on Figs.13–16, the study seems to support the following statements:
• HSST02 data show a dose-rate effect that is temperature dependent.
Figure 12. Radiation embrittlement of ASTM SRM materials irradiated at 550°F
Trend Curve for ASTM (A302B) SRM Data Irradiated at 550°F for Fluence > 1.5 E+19 n/cm²
0
20
40
60
80
100
120
140
160
180
200
0 1E+19 2E+19 3E+19 4E+19 5E+19 6E+19 7E+19
Fluence, E > 1 MeV [n/cm²]
Tran
sitio
n Te
mpe
ratu
re S
hift
[°F]
R.G.1.99 Prediction w/Cu=0.20, Ni=0.18wt%
Two Sigma 34°F
TR-EDB Data w/Flux > 2.5 E+12 n/cm²s
TR-EDB Data w/Flux < 1.1 E+12 n/cm²s
PR-EDB TANH Fit Results
Power (PR-EDB TANH Fit Results)
Power (TR-EDB Data w/Flux > 2.5 E+12 n/cm²s)

23
• HSST03 data show a fluence or time dependence on dose-rate effect. • SASTM normalized shift data show different rate-effect trends for TR and PR.
Figure 13 reveals two different trends for Westinghouse and B&W surveillance data, where B&W have a much lower transition temperature shift value and embrittlement rate. Based on melt wire thermal monitors, the B&W data has an irradiation temperature around 610°F; the Westinghouse data, around 570°F. However, both Westinghouse and B&W data sets are from PWR environments and have similar coolant inlet temperatures. Note that the host reactors of B&W data have a unique operating procedure compared to that of Westinghouse data’s vendors. This indicates that different capsule temperatures and/or operating procedures can result in different embrittlement rates as revealed by this transition temperature shift plot.
TR-EDB data and the RG1.99/R2 trend curve (thin line) were added to Fig 13 as shown in Fig. 14. TR-EDB data were also added to the plot, where the reported irradiation temperature for these test reactor data is 572°F. By comparing Westinghouse data and TR-EDB data, the steady state irradiation temperature of Westinghouse data is around 550°F, thus TR-EDB data should have a bias around 22°F in shift downward compared to that of Westinghouse data. However, TR-EDB data show a decrease in shift data from 70°F at a fluence of 1.0E+19 n/cm² to 50°F at a fluence of 5.0E+19 n/cm². The reduction in shift may be due to the high flux of TR-EDB, which is greater than 2.3E+13 n/cm²s, or a combined effect of higher irradiation temperature and higher neutron flux effect.
Figure 13. Embrittlement trend curves of PR-EDB HSST02 SRM material
HSST02 A533B1 SRM Shift Data per PR-EDB
0
50
100
150
200
250
1E+17 1E+18 1E+19 1E+20
Fast Fluence, E>1MeV, n/cm²
Tran
stio
n Te
nper
atur
e Sh
ift,
F°
B&W Westinghouse Log. (B&W) Log. (Westinghouse)

24
The fluence-dependent dose-rate effect was identified from Fig. 15 for the HSST03. The trend curve of the test reactor data intersects the RG1.99/R2 trend curve at fluence around 3E+19 n/cm². Below the intersection point, the test reactor data show less embrittlement; above the intersection, more embrittlement, compared to the RG1.99/R2 prediction of lower dose-rate power-reactor environment.
Figure 14. Comparison of embrittlement trends for PR and TR data.
Figure 15. HSST03 SRM Material embrittlement trend at 550°F irradiation temperature.
HSST02 A533B1 SRM Shift Data
0
50
100
150
200
250
1E+17 1E+18 1E+19 1E+20 1E+21
Fast Fluence, E>1MeV, n/cm²
Tran
stio
n Te
nper
atur
e Sh
ift, F
°
B&W WestinghouseTR-EDB, at 572°F Flux > 2.3E13 n/cm²s RG199/R2
Log. (B&W) Log. (Westinghouse)Log. (TR-EDB, at 572°F Flux > 2.3E13 n/cm²s)
Trend Curve for HSST03 (A533B-1) SRM Data at 550°F
0
50
100
150
200
250
0.00E+00 1.00E+19 2.00E+19 3.00E+19 4.00E+19 5.00E+19 6.00E+19 7.00E+19 8.00E+19 9.00E+19 1.00E+20
Fluence, E > 1 MeV [n/cm²]
Tran
sitio
n Te
mpe
ratu
re S
hift
[°F] R.G. 199, Prediction w/Cu=0.12, Ni=0.56
wt%, w/ 1E10<Flux<1E11 n/cm²sTwo Sigma 34°F
ORRPSF Experiment
TR-EDB Data w/ Flux>2.0E12 n/cm²s
Power (TR-EDB Data w/ Flux>2.0E12/ ² )

25
Figure 16 indicates that the mean trend curves of SASTM A302B SRM data for PR and TR are very close to each other and no dose-rate effect can be identified from this fast fluence vs. shift plot. Further investigation on SASTM SRM material was carried out with a normalization procedure applied to SASTM shift data. In Fig. 17, the shift data were normalized with RG1.99/R2 fluence factor (FF) at fluence level of 1E+19 n/cm². Due to the nature of these uncontrolled data, large data scatters were observed from the plot. Nevertheless, the mean trend curves of the normalized data reveal different trends for PR and TR data, respectively. The mean trend curve of TR data shows an increasing embrittlement rate with increasing flux, and PR data show a decreasing embrittlement rate with increasing flux. However, due to very large data scatter for PR-EDB data, no definite conclusion can be made.
Based on the above dose-rate effect study for SRM materials, there is an indication that the dose-rate effect exists and deserves attention.
Figure 17. Normalized SASTM A302B data trend curves, at RG1.99/R2 FF=1.
SASTM Shift at 550°F, Normalized w/ RG199/R2's FF, at 1E19n/cm²
40
60
80
100
120
140
160
1.E+09 1.E+10 1.E+11 1.E+12 1.E+13 1.E+14
Fast Flux, E>1MeV, n/cm²s
Nor
mal
ized
Tra
nstio
n Te
nper
atur
e Sh
ift, F
°
PR-EDB TR-EDB Log. (PR-EDB) Log. (TR-EDB)
Figure 16. SASTM Material embrittlement trends.
SASTM SRM Transition Temperature Shift, at 550°F
0
20
40
60
80
100
120
140
160
180
200
1E+18 1E+19 1E+20
Fast Fluence, E>1MeV, n/cm²
Tran
stio
n Te
nper
atur
e Sh
ift, F
°
PR-EDB Data TR-EDB Log. (PR-EDB Data) Log. (TR-EDB)
26
6.3 Dose-Rate Effect Study on PR-EDB Base Material
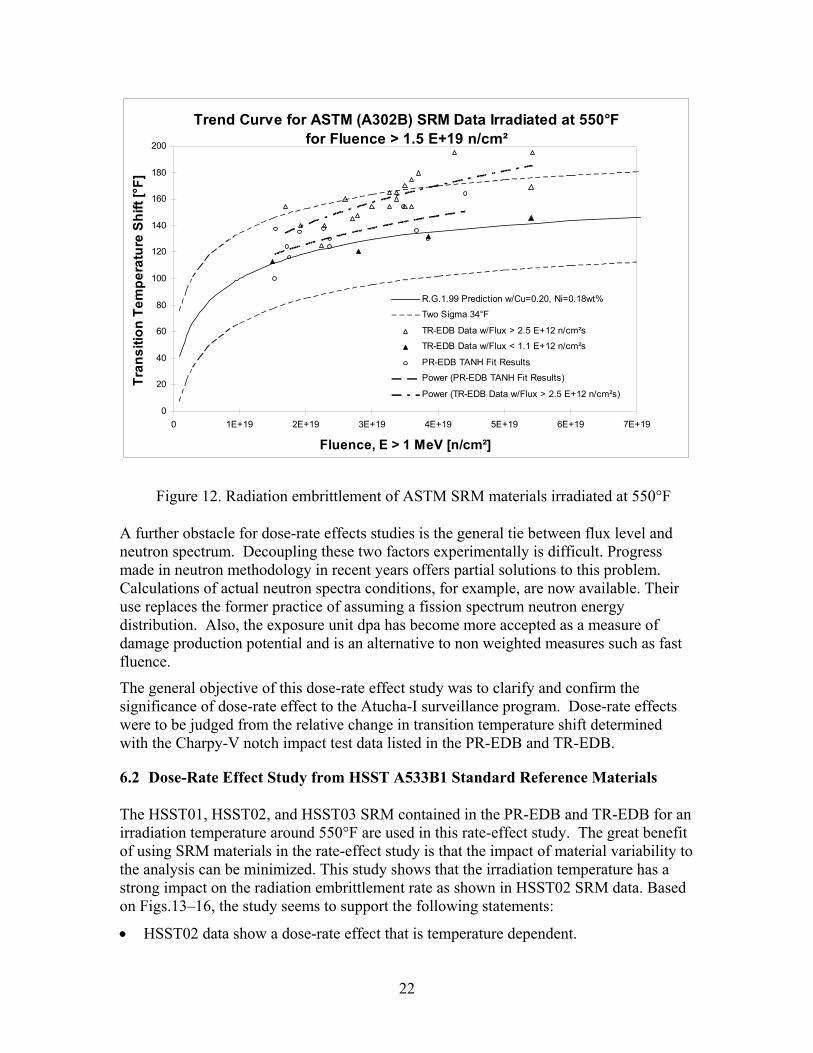
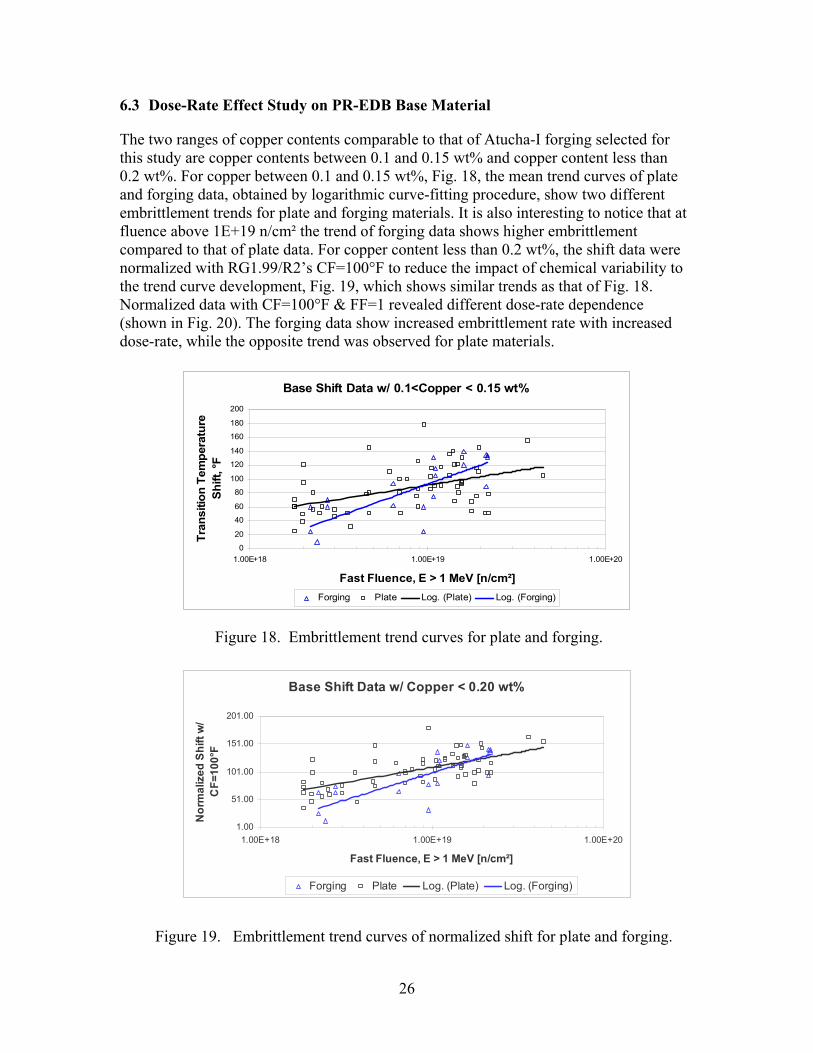
The two ranges of copper contents comparable to that of Atucha-I forging selected for this study are copper contents between 0.1 and 0.15 wt% and copper content less than 0.2 wt%. For copper between 0.1 and 0.15 wt%, Fig. 18, the mean trend curves of plate and forging data, obtained by logarithmic curve-fitting procedure, show two different embrittlement trends for plate and forging materials. It is also interesting to notice that at fluence above 1E+19 n/cm² the trend of forging data shows higher embrittlement compared to that of plate data. For copper content less than 0.2 wt%, the shift data were normalized with RG1.99/R2’s CF=100°F to reduce the impact of chemical variability to the trend curve development, Fig. 19, which shows similar trends as that of Fig. 18. Normalized data with CF=100°F & FF=1 revealed different dose-rate dependence (shown in Fig. 20). The forging data show increased embrittlement rate with increased dose-rate, while the opposite trend was observed for plate materials.
Figure 18. Embrittlement trend curves for plate and forging.
Figure 19. Embrittlement trend curves of normalized shift for plate and forging.
Base Shift Data w/ 0.1<Copper < 0.15 wt%
0
20
40
60
80
100
120
140
160
180
200
1.00E+18 1.00E+19 1.00E+20
Fast Fluence, E > 1 MeV [n/cm²]
Tran
sitio
n Te
mpe
ratu
re
Shift
, °F
Forging Plate Log. (Plate) Log. (Forging)
Base Shift Data w/ Copper < 0.20 wt%
1.00
51.00
101.00
151.00
201.00
1.00E+18 1.00E+19 1.00E+20
Fast Fluence, E > 1 MeV [n/cm²]
Nor
mal
ized
Shi
ft w
/ C
F=10
0°F
Forging Plate Log. (Plate) Log. (Forging)

27
6.4 Impact of Reactor Design and Operation to Dose-Rate Effect
This section is intended to investigate the issue of embrittlement to service environment and reactor operating history. Base and weld surveillance data listed PR-EDB from four vendors [namely, Babcock & Wilcox (B&W), Combustion Engineering (CE), General Electric, and Westinghouse] used in this study. Each vendor has its unique reactor designs and reactor operation procedures, thus the impact of reactor design and operating history on the dose-rate effect can be obtained from studying the vendors’ specific data. In order to minimize the impact of chemistry variability on trend curve development, the shift data were normalized with RG1.99/R2’s CF=100°F. Embrittlement trends and dose-rate effect on base surveillance data are shown in Figs.21–22. The mean trend curves of Fig. 21 seem to indicate that embrittlement trends are vendor dependent. The GE trend curve shows the highest embrittlement rate until a fluence of about 3.0E+19 n/cm², the CE and Westinghouse trend curves merge into a single line, and the B&W trend curve appears to have the lowest embrittlement rate. To evaluate the dose-rate effect, the base shift data were normalized with RG1.99/R2’s CF=100°F and FF=1, as shown in Fig. 22. The trend curves of base shift data reveal the vendor-specific dose-rate dependence, where all the vendor-specific trends show decreasing
Figure 20. Dose-rate effect of normalized shift for plate and forging.
Base Shift Data w/ Copper < 0.20 wt%
0.00
50.00
100.00
150.00
200.00
250.00
1.00E+10 1.00E+11 1.00E+12
Fast Flux, E > 1 MeV [n/cm²s]
Nor
mal
ized
Shi
ft w
/ C
F=10
0°F
& F
F=1
Forging Plate Log. (Forging) Log. (Plate)
Base Shift Data
10
60
110
160
210
260
310
1.00E+17 1.00E+18 1.00E+19 1.00E+20
Fast Fluence, E > 1 MeV [n/cm²]
Nor
mal
ized
Shi
ft w
/ CF=
100°
F
B&W CE GEWestinghouse Log. (CE) Log. (B&W)Log. (GE) Log. (Westinghouse)
Figure 21. Trend curves of base surveillance data, PR-EDB.

28
embrittlement with increasing dose-rate, except CE’s trend curve. Again, here the B&W trend curve reveals the highest decreased embrittlement rate with increased dose-rate among the four vendors.
Embrittlement trends and dose-rate effect on weld surveillance data are shown in Figs. 23–24. Figure 23 indicates that embrittlement trends are vendor dependent. GE and Westinghouse had very similar trends; the B&W weld trend curve appears to have the lowest embrittlement rate among the vendors’ data.
Figure 22. Embrittlement trends of base surveillance data from PR-EDB.
Figure 23. Embrittlement trends of weld surveillance data from PR-EDB.
Base Shift Data
10
60
110
160
210
260
310
360
1.0E+08 1.0E+09 1.0E+10 1.0E+11 1.0E+12 1.0E+13
Fast Flux, E > 1 MeV [n/cm²s]
Nor
mal
ized
Shi
ft w
/ C
F=10
0°F&
FF=
1
B&W CE GEWestinghouse Log. (CE) Log. (B&W)Power (GE) Power (Westinghouse)
PR-EDB Weld Shift Data
0
50
100
150
200
250
1.00E+17 1.00E+18 1.00E+19 1.00E+20 1.00E+21
Fast Fluence, E > 1 MeV [n/cm²]
Nor
mal
ized
Shi
ft w
/ C
F=10
0°F
B&W CE GEWestinghouse Log. (CE) Log. (B&W)Log. (GE) Log. (Westinghouse)

29
In order to evaluate the dose-rate effect, the weld-shift data were also normalized with RG1.99/R2’s CF=100°F and FF=1, as shown in Fig. 24. The mean trend curves for weld shift data reveal the vendor specific dose-rate dependence, where all the vendor specific trends show decreasing embrittlement with increasing dose-rate, except CE’s trend curve. Again, the B&W trend curve reveals the highest decreased embrittlement rate with increased dose-rate among the four vendors.
6.5 General Trends of Dose-Rate Dependence from PR-EDB
For base materials, the normalized shift data reveal different trends with different neutron fluxes as illustrated in Figs. 25–27. Atucha-I’s flux is 1.29E+10 n/cm²s, thus a flux range of 1.0E+10 and 5.0E+10 n/cm²s was also selected in the study. As for flux greater than 1.0E+12 n/cm²s, the data obtained at core positions show much higher embrittlement compared to others, largely due to the spectral effect of these surveillance data at core positions instead of dose-rate effect only. To better compare with the Atucha-I material, surveillance base metal data were further narrowed down to those having similar chemistry compositions to that of Atucha-I. Based on normalized shift plots, it can be seen that the trend curves of flux between 1.0E+10 and 1.0E+11 n/cm²s (Flux A, typical LWR service range) and flux between 1.0E+11 and 1.0E+12 n/cm²s (Flux B) intersect near 1.0E+19 n/cm² fast-fluence range; below 1.0E+19 n/cm² fast fluence, Flux A shows more embrittlement than Flux B. For fast fluence greater than 1.0E+19 n/cm² Flux B shows more embrittlement than Flux A.
For weld materials, two different chemistry factors were used to simulate those of two Atucha-I weld materials. As shown in Figs. 28–29, beltline axial weld data (with normalized chemistry of 44°F) indicates that the embrittlement rate at Flux A is greater than that at Flux B for up to 5.0 to 6.0 E19 n/cm² fast fluence; while as for the other axial weld material, it indicates a similar trend for fast fluence up to 3.0 to 4.0 E+19 n/cm².
Figure 24. Embrittlement trends of normalized weld data from PR-EDB.
PR-EDB Weld Shift Data
0
50
100
150
200
250
1.00E+08 1.00E+09 1.00E+10 1.00E+11 1.00E+12 1.00E+13
Fast Flux, E > 1 MeV [n/cm²s]
Nor
mal
ized
Shi
ft w
/ C
F=10
0°F
& F
F=1
B&W CE GEWestinghouse Log. (CE) Log. (B&W)Log. (GE) Log. (Westinghouse) Log. (B&W)

30
Figure 25. Embrittlement trends of normalized base metals with CF=115°F from PR-EDB.
Figure 26. Embrittlement trends of normalized base metals with CF=115°F from PR-EDB.
Transition Temperature Shift, Base Metals
0
50
100
150
200
250
300
350
1E+16 1E+17 1E+18 1E+19 1E+20 1E+21
Fluence, n/cm² (E>1 MeV)
Nor
mal
ized
Shi
ft w
ith
CF=
115°
F
Flux<1E10 n/cm²s 1E10 < Flux < 5E10 n/cm²s5E10 < Flux < 1E11 n/cm²s Flux>1E12 n/cm²s1E11<Flux<1E12 n/cm²s Log. (Flux<1E10 n/cm²s)Log. (1E10 < Flux < 5E10 n/cm²s) Log. (5E10 < Flux < 1E11 n/cm²s)Log. (Flux>1E12 n/cm²s) Log. (1E11<Flux<1E12 n/cm²s)
Normalized Shift, Base Metals w/ 0.1<Cu<0.3wt% 0.5<Ni<0.90wt%
0
50
100
150
200
250
300
350
1E+16 1E+17 1E+18 1E+19 1E+20 1E+21
Fluence, n/cm² (E>1 MeV)
Nor
mal
ized
Shi
ft ew
ith C
F=11
5°F
Flux<1E10 n/cm²s 1E10 < Flux < 1E11 n/cm²sFlux>1E12 n/cm²s 1E11<Flux<1E12 n/cm²sLog. (Flux<1E10 n/cm²s) Log. (1E10 < Flux < 1E11 n/cm²s)Log. (Flux>1E12 n/cm²s) Log. (1E11<Flux<1E12 n/cm²s)

31
Figure 27. Embrittlement trends of normalized base data with CF=115°F from PR-EDB.
Figure 28. Embrittlement trends of normalized weld data with CF=44.8°F from PR-EDB.
DTT30 for 0.1wt%<Cu<0.2 wt%, 0.5<Ni<0.86 wt%
0
50
100
150
200
250
1.00E+16 1.00E+17 1.00E+18 1.00E+19 1.00E+20
Fast Fluence n/cm² (E>1MeV)
Nor
mal
ized
Shi
ft w
ith C
AN
-1
CF=
115.
3°F,
F°
1.0E11<Flux<1.0E12n/cm²s Flux>1E12n/cm²s 5E10<Flux<1E11n/cm²s
1E10<Flux<5E10n/cm²s Flux<1E10n/cm²s Log. (1.0E11<Flux<1.0E12n/cm²s)
Log. (Flux>1E12n/cm²s) Log. (5E10<Flux<1E11n/cm²s) Log. (1E10<Flux<5E10n/cm²s)
Log. (Flux<1E10n/cm²s)
Shift for 0.05wt%<Cu<0.15 wt%, 0.05<Ni<1.0 wt%
0
20
40
60
80
100
120
1E+17 1E+18 1E+19 1E+20
Fast Fluence n/cm² (E>1MeV)
Nor
mal
ized
Shi
ft w
ith C
AN
-1
wel
d C
F=44
.8°F
, F°
1.0E11<Flux<1.0E12n/cm²s 1E10<Flux<1E11n/cm²s Flux<1E10n/cm²s
Log. (1.0E11<Flux<1.0E12n/cm²s) Log. (1E10<Flux<1E11n/cm²s) Log. (Flux<1E10n/cm²s)

32
7. DISCUSSION
From ARN’s evaluation, Atucha-I NPP will have reached its expected lifetime in December 2002. However, in light of new methods for evaluating reference temperature and the surrogate surveillance data from the German VAK program and the IAEA JM data, the expected lifetime of Atucha-I needs to be reassessed. Part of the effort to determine the validity of applying VAK surrogate data to Atucha-I RPV surveillance was carried out in this project. Other main focuses regarding Atucha-I RPV integrity are on the critical flaw used in the Atucha-I safety analysis, the safety margin for RTNDT obtained from the master curve approach, and the status of ARN position in RPV integrity of Atucha-I NPP.
7.1 Issue Regarding Flaws in the RPV
The maximum flaw size within the RPV must be known to carry out a pressurized thermal shock (PTS) analysis. The maximum defect depth should be registered in an RPV fabrication report. Normally the report does not describe the technique used in the nondestructive evaluation. Siemens has reports on flaws at the under-cladding and circumferential welds. The French authority has asked their utilities to validate the minimum flaw depth (6 mm) by new ultrasonic inspections. After an extensive program of validation, the inspections detected cracks with a depth of 10 mm. Therefore, the new
Figure 29. Embrittlement trends of normalized weld data with CF=153°F from PR-EDB.
Shift for 0.1wt%<Cu<0.2 wt%, 0.5<Ni<1.20 wt%
020406080
100120140160180200
1E+16 1E+17 1E+18 1E+19 1E+20
Fast Fluence n/cm² (E>1MeV)
Nor
mal
ized
Shi
ft w
ith C
AN
-1
wel
d C
F=15
3°F,
F°
1.0E11<Flux<1.0E12n/cm²s 1E10<Flux<1E11n/cm²s Flux<1E10n/cm²s
Log. (1.0E11<Flux<1.0E12n/cm²s) Log. (1E10<Flux<1E11n/cm²s) Log. (Flux<1E10n/cm²s)

33
minimum defect depth was set to 10 mm. Based on the initial results of the Atucha-I surveillance program, the limiting material is the base material instead of the weld. Therefore, a 10-mm depth of flaw used in the PTS analysis is a more conservative estimate.
7.2 Fracture Toughness of the RPV Steel
The base material 41.1 has a reference temperature of RTT0= -27ºC obtained by applying the Master Curve method and the ASME Code Case N-629. However, from the regulatory viewpoint, a safety margin should be considered to cover material inhomogeneity such as chemical composition and microstructure variability. The other heat, base material 31.3, and the weld material also need to be tested to verify the limits of materials before and after irradiation. If the ASTM E 1921 and Code Case N-629 are applied on the irradiated specimens, it will not be necessary to verify and include the results from the Charpy tests.
7.3 Preliminary Estimate of the ART at the End of 2002
At the EOL fluence, 1.28×10¹⁹ n/cm², the transition temperature shift, ∆T, is equal to 67ºC (from the VAK irradiation program). At the end of 2002, Atucha-I would have reached 60% of its EOL, and ∆T ≅ 58 ºC was estimated by using RG1.99, Rev. 2’s equation. RTT0 obtained from fracture toughness tests is equal to –27ºC. Before applying the RG1.99/R2 to estimate ART, the margin from Charpy shift based on Position 2 of RG1.99/R2 is assigned as 10 ºC and the margin for mixing the master curve and ∆T41J methodology is assigned as 10 ºC. The total safety margin is 20 ºC. The estimated ART is -27ºC + 58ºC + 20ºC = 51ºC. This ART value coincides with the value given by NASA with RTNDT = 51 ºC for the worst LOCA.
7.4 Safety Margin Imposed on the Transition Temperature Shift of VAK Program
The following procedure can be utilized to obtain a safety margin to be added to the ∆RTNDT = 67 ºC from the VAK program. The procedure is as follows:
• First, the data from the VAK program should be plotted in a ∆T vs. φt plot with a regression of those points to estimate the standard deviation of the mean trend curve.
• Second, the IAEA data should be analyzed with a similar approach as that of the VAK data.
• Third, the ORNL PR-EDB (power reactor embrittlement database) and the TR-EDB (test reactor embrittlement database) should be analyzed with a similar procedure.
From those three steps, a reasonable conservative margin for the ∆T can be obtained and added to the ∆RTNDT = 67ºC from the VAK program.
∆RTNDT = 67 ºC + Margin.

34
From the regulatory point of view, the dose-rate effect of the VAK accelerated program must be established for the Atucha-I surveillance program through the development of the safety margin.
7.5 Validity of VAK Data for Atucha-I RPV Surveillance
At the EOL fluence of 1.28×10¹⁹ n/cm², the transition temperature shift is equal to 67ºC as obtained from VAK irradiation program. However, findings from this study indicate that the VAK data is highly nonconservative compared to that of the same class of forging with similar chemical composition irradiated in U.S. power reactor environment. Thus, in order to validate VAK data for Atucha-I surveillance, two key issues must be addressed by the vendor to explain the low embrittlement phenomenon of the VAK surrogate data. These are the irradiation temperature of VAK surveillance capsules and the impact of dose-rate effect on the VAK data.
7.6 Potential Damage Mechanisms Involved in Atucha-I Surveillance Data
A. Alberman et al. [40], carried out a study on the influence of thermal neutrons on the brittleness of a ferritic A537 steel. The specimens were irradiated in the French EL3 heavy-water research reactor with thermal- to fast-neutron ratio around 1000 for an irradiation temperature of 60°C. The experimental study shows that about 50 to 70% of the embrittlement is caused by thermal neutrons. However, this thermal neutron effect alone can not mend the gap between Atucha-I JF shift data and that of IAEA CRP-II JF shift data as shown in Fig. 4a, where at the lowest fluence of IAEA CRP-II data, the Atucha-I shift data appear to be 5 times of that of IAEA CRP-II. Furthermore, by taking into account the spectral effect and the damage efficiency into IAEA JF data irradiated in Atucha-I and IAEA CRP-II Program, the gap between Atucha-I Set #3 JF data and CRP-II JF data as shown in Fig. 10 seems to be less intense, but a large discrepancy still exists. Based on the dose-rate effect study, the limited changes due to the dose-rate effect cannot fully the large discrepancy shown in Fig. 10. Thus, the other potential damage mechanisms or neutron source maybe overlooked for the Atucha-I irradiation environment. There are two potential candidates, namely, gamma-induced dpa and photoneutron-induced damage. Based on our experience in HFIR accelerated embrittlement [30], the comprehensive dosimetry experiments revealed the presence of an intense gamma field at HFIR. This finding precipitated an assessment of the gamma-induced dpa rate, which was found to exceed the neutron-induced dpa rate at all locations analyzed. The HFIR accelerated embrittlement is therefore explained in terms of uncounted dpa induced by gamma rays. Currently, due to lack of detailed gamma spectra at the Atucha-I surveillance position, no conclusion can be drawn on this gamma-induced displacement effect. However, a comprehensive in-vessel dosimetry program at Atucha-I may further provide valuable information on such an issue and provide guidelines for utilizing Atucha-I surveillance data in RPV lifetime estimates with proper margin. Highly energetic gamma from the core can stream through the heavy-water reflector relatively unimpeded. Likewise, highly energetic gamma released by thermal neutron

35
(n,γ) reactions in the reflector boundary or coolant channels also enter the heavy-water reflector. Because gamma above 2.225 MeV may cause (γ,n) reactions in deuterium comprising the heavy water, the effect of such reactions has to be evaluated. A. F. Albornoz et al. [41], carried out an improved evaluation of the Atucha-I ex-vessel dosimetry. The activation dosimetries were irradiated at the cavity behind the RPV during 1994−1995. The C/M ratios in thermal neutron range were substantially improved. Nevertheless, a very large discrepancy still exists in Cu63(n,α)Co60 reaction, where C/M=0.52 suggests that the spectrum shape at high energies is not good enough. Since deuterium is one of the isotopes in nature with the lowest energy threshold for production of photoneutrons, it was considered relevant to estimate the magnitude of the photoneutron source and its contribution to neutron flux at different energy ranges. However, the Albornoz et al. [41] calculation shows less than 3% contribution was found at the inner surface of the RPV in the energy range 0.1MeV<E<1MeV. Another independent study on photoneutron evaluation in heavy water was done by J. A. Bucholz [42]. He carried out a global 2-D shielding analysis of the 2-element, heavy-water-cooled and reflected Advanced Neutron Source (ANS) reactor. Fast-flux results at near reflector boundary obtained from 2-D DORT analysis with photoneutrons show much higher–about 1000 times higher−than that of analysis without photoneutrons. Even though Bucholz’s ANS analysis is for a highly enriched core design, the results seem to be more relevant to the Atucha-I surveillance position than the work done by Albornoz. Furthermore, thermal (n,γ) reactions in the coolant channels, heavy-water boundary, and/or near the Atucha-I surveillance position will produce gammas of sufficiently high energy to cause fast photoneutrons to be produced in the surrounding heavy water. It is interesting to note here that with a hypothetical increase of 100 times for Atucha-I’s fast fluence at surveillance positions, both the IAEA CRP-II JF data and Atucha-I Set # 3 data can be collapsed into one single trend curve as shown in Fig. 30. Thus, a detailed fluence analysis with consideration of photoneutrons at Atucha-I surveillance positions may provide a direct answer to resolve the issue related to Atucha-I accelerated surveillance data.

36
8. CONCLUSION
This evaluation concludes that surveillance data Sets #1& #2 of the Atucha-I surveillance program are not adequate for estimating the lifetime of Atucha-I RPV, due to extremely high thermal (E<0.4eV) to fast neutron (E>1MeV) fluence ratio of about 1000:1 at the surveillance capsule position, compared to that at the RPV inner-wall position, about 10:1. The surrogate surveillance data from VAK surveillance capsules, which has thermal- to fast-neutron ratio around 4:1 and a slightly harder spectrum compared to that of the Atucha-I RPV inner-wall position, can be applied to Atucha-I RPV surveillance. However, due to the extremely low embrittlement rate of VAK data compared to that of U.S. power reactor data, further validation of the VAK accelerated data is required before it can be used for estimating the lifetime of Atucha-I. Two key issues must be addressed to explain the low embrittlement of the VAK surrogate data, namely, the irradiation temperature of VAK capsules and the dose-rate effect. Furthermore, evidence of neutron dose-rate effects is identified from the U.S. power reactor surveillance database (PR-EDB) and the material test reactor database (TR-EDB) from this study. The dose-rate effect and neutron spectrum effect and their implications with respect to the radiation embrittlement data from the Atucha-I surveillance program, deserve special attention. Furthermore, the detailed fluence analysis with consideration of gamma spectrum and photoneutrons needs to be carried out for the Atucha-I environment. Furthermore, the impact of this analysis to Atucha-I core supporting structure, heavy-water reflector tank and heavy-water coolant boundary of RPV needs to be evaluated.
Figure 30. With two order-of-magnitude adjustments on fast fluence for Atucha-I Set # 3 data, the IAEA CRP-II JF data and Atucha-I JF data can be fit into one single trend.
CRP-II IAEA JF Material Transition Temperature Shift
0
50
100
150
200
250
300
350
1.0E+17 1.0E+18 1.0E+19 1.0E+20 1.0E+21 1.0E+22 1.0E+23
Fast Fluence, E>1MeV [n/cm²]
Tran
sitio
n Te
mpe
ratu
re S
hift
[°F]
IAEA VAK Atucha-I Pow er (All)

37
Two approaches can be used to evaluate the lifetime of Atucha-I’s RPV as stated below.
1. Use the VAK data upon its further validation from the German vendor. A designated safety margin on the estimated radiation damage index will be required to cover the uncertainty due to the dose-rate effect and spectrum effect.
2. Use PR-EDB forging data that have chemical compositions similar to that of Atucha-I beltline materials to develop RPV embrittlement models that take into account the neutron spectrum effect.
9. ACKNOWLEDGEMENT
The author would like to thank Ing. Nicolas Riga of the ARN for providing the detailed documents related to Atucha-I Surveillance Program and the liaison among ORNL, Argentina ARN, CNEA, and the German vendor. The author would like to thank Dr. Ken Farrell and Dr. Roger Stoller for reviewing this report and providing valuable comments. The author also would like to thank Dr. Mike Whitaker for supporting this project. The funding was provided by the U.S. Department of Energy under contract DE-AC05-00OR22725.
10. REFERENCE
1. Odette, G. R., Lombrozo, P. M., and Wullaert, R. A., “Relationship Between Irradiation Hardening and Embrittlement of Pressure Vessel Steels,” Effects of Radiation on Materials, Twelfth International Symposium, ASTM STP 870, pp 840–860, Garner, F. A. and Perrin, J.S., eds., American Society for Testing and Materials, Philadelphia, 1985.
2. Lucas, G. E., Odette, G. R., Lombrozo, P. M., and Sheckherd, J. W., “Effects of Composition, Microstructure, and Temperature on Irradiation Hardening of Pressure Vessel Steels,” Effects of Radiation on Materials, Twelfth International Symposium, ASTM STP 870, pp 900–930, Garner, F. A. and Perrin, J.S., eds., American Society for Testing and Materials, Philadelphia, 1985.
3. Shah, V. N., Server, W. L., Odette, G. R., and Amar, A. S., “Residual Life Assessment of Light Water Reactor Pressure Vessels,” Effects of Radiation on Materials, ASTM STP 1011, pp 161–175, American Society for Testing and Materials, Philadelphia, 1989.
4. Atucha Nuclear Power Plant Technical Data, Published by Nucleoelectrica Argentina S.A., 1995.
5. Memo from Nicolas Riga of ARN, “Anallisis de la Integridad del Recipiente de Presion de la Central Nuclear Atucha-I,” N Riga, F. Canepa, IT N° 31=61, 26-10-96.
6. Koban, J. and Leitz, Discussion on the CAN-1 RPV surveillance program results and consequences, Technical report R423/83/e02, January 1983.
7. Koban, J., “Atucha-I RPV Representativity of VAK Irradiation Results,” TGM/2002/en/0313, October 2002.
8. Ing. Chomik, Ing. Iorio, Safety Analysis of the CAN-1 RPV Surveillance Program, report number N° 007/93.October 1993.

38
9. Albornoz, A. F., Blaumann, H, Lopasso, E. M., Serra, O., “Improved Evaluation of the Atucha-I Ex-Vessel Dosimetry,” Reactor Dosimetry, ASTM STP 1398, American Society for Testing and Materials, 2002.
10. Stallmann, F. W., Wang, J. A., Kam, F. B. K., and Taylor, B. J., PR-EDB: Power Reactor Embrittlement Data Base, Version 2, NUREG/CR-4816, 1994.
11. Stallmann, F. W., Wang, J. A., and Kam, F. B. K., TR-EDB: Test Reactor Embrittlement Data Base, Version 1, NUREG/CR-6076, 1994.
12. Wang, J. A., Embrittlement Data Base, Version 1, NUREG/CR-6506, ORNL/TM-13327, Oak Ridge National Laboratory, 1998
13. U.S. Nuclear Regulatory Commission Guide 1.99, Revision 2, Radiation Embrittlement of Reactor Vessel Materials, May 1988.
14. Randall, P. R., “Basis for Revision 2 of the U.S. Nuclear Regulatory Commission's Regulatory Guide 1.99,” ASTM STP 909, pp 149–162, Steele, L. E., ed., American Society for Testing and Materials, Philadelphia, 1986.
15. Guthrie, G. L., Charpy Trend Curves Based on 177 PWR Data Points, NUREG/CR-3391, U.S. Nuclear Regulatory Commission, 1983.
16. Odette, G. R., Lombrozo, P. M., Perrin, J. F., and Wullaert, R. A., Physically Based Regression Correlations of Embrittlement Data From Reactor Pressure Vessel Surveillance Programs, EPRI NP-3319, Electric Power Research Institute, 1984.
17. Final Report of IAEA Co-Operated Research Program, 1977-1983, Analysis of the Behavior of Advanced Reactor Pressure Vessel Steels Under Neutron Irradiation, IAEA, Vienna, 1986.
18. Wang, J. A., Kam, F. B. K., and Stallmann, F. W., “The Embrittlement Data Base (EDB) and Its Applications,” Effects of Radiation on Materials: 17th Symposium, ASTM STP 1270, David S. Gelles, Randy K. Nanstad, Arvind S. Kumar, and Edward A. Little, Editors, American Society for Testing and Materials, Philadelphia, 1996.
19. Mansur, L. K. and Farrell, K., “On Mechanisms by which a Soft Neutron may Induce Accelerated Embrittlement,” J. Nucl. Mater., 170 (1990) 236–245.
20. ASTM E693-01 Standard Practice for Characterizing Neutron Exposures in Iron and Low Alloy Steels in Terms of Displacements Per Atom (DPA), E706 (ID) Developed by Subcommittee: E10.05., American Society for Testing and Materials.
21. Stoller, R. E. and Odette, G. R., “Recommendations on Damage Exposure Units for Ferritic Steel Embrittlement Correlations,” J. Nucl. Mater., Vol. 186, pp 203-205, 1992.
22. Wiedersich, H., “Effects of The Primary Recoil Spectrum on long-Range Migration of Defects,” Radiation Effects and Defects in Solids, 1990, Vol 113, pp 97-107.
23. Rehn, L. E., Okamoto, P. R., and Averback, R. S., “Relative Efficiencies of Different Ions for Producing Freely Migrating Defects,” Phys. Rev. B, 30(6):3073–3080, (1984).
24. Heinsich, H. L., "Correlation of Mechanical Property Changes in Neutron Irradiated Pressure Vessel Steels on the Basis of Spectral Effects," Fusion Reactor Quarterly Progress Report, DOE/ERD-0313/6, 1990.
25. Stoller, R. E., “Modeling the Influence of Irradiation Temperature and Displacement Rate on Hardening Due to Point Defect Clusters in Ferritic Steels,” Effects of Radiation on Materials: 16th International Symposium, ASTM STP 1175, pp 394–

39
423, Arvind S. Kumar, David S. Gelles, Randy K. Nanstad, and Edward A. Little, eds., American Society for Testing and Materials, 1993.
26. Jung, P., “Relevance of the Displacement Damage Concept for the Evaluation of Radiation Effects in Metals,” Radiation Effects and Defects in Solids, Vol. 113, pp 109–118, 1990.
27. English, C. A., “Recoil Effects in Radiation Damage,” Radiation Effects and Defects in Solids, Vol. 113, pp 15–28, 1990.
28. Simons, R. L., “Damage Rate and Spectrum Effects in Ferritic Steel NDTT Data,” Influence of Radiation on Material Properties: 13th International Symposium (Part II), ASTM STP 956, pp 535–551, F.A. Garner, C. H. Henager, Jr., and N. Igata, eds., American Society for Testing and Materials, Philadelphia, 1987.
29. Odette, G. R., and Sheeks, C. K., “A Model for Displacement Cascade-Induced Microvoid and Precipitator Formation in Dilute Iron-Copper Alloys,” Phase Stability During Irradiation, J. R. Holland, L. K. Mansur, and D. I. Potter, Eds., Metallurgical Society of the American Institute of Mining, Metallurgical and Petroleum Engineers, (1982), p 415.
30. Remec, I., Wang, J. A., Kam, F. B. K., and Farrell, K., “Effects of Gamma-Induced Displacements on HFIR Pressure Vessel Materials,” J. Nucl. Mater., 217(3): 258–268, 1994.
31. Caro, M., “Discussion for IAEA JF Data,” October 2003. 32. Siman-Tov, I. I., Heat Transfer Analysis of the LWR Pressure Vessel Steel Irradiation
Capsules in the Oak Ridge Research Reactor-Pressure Vessel Benchmark Facility, NUREG/CR-2053 (ORNL/TM-427), April 1982.
33. Stoller, Roger E. and Greenwood, L. R., “An Evaluation of Neutron Energy Spectrum Effects in Iron Based on Molecular Dynamics Displacement Cascade Simulations,” ASTM 1366, pp 548-559, American Society for Testing and Materials, 2000.
34. Stoller, R. E., Modeling the Influence of Irradiation Temperature and Displacement Rate on Radiation-Induced Hardening in Ferritic Steels, NUREG/CR-5859 (ORNL/TM-12073), July 1992.
35. Gray, D. L., An Effect of Neutron Flux Level Upon Damage Accumulation, USAEC R&D Report HW-61287, July 30, 1959.
36. Harries, D. R., Barton, P. J., and Wright, S. B., “Effects of Neutron Spectrum and Dose Rate on Radiation Hardening and Embrittlement in Steels,” ASTM STP 341 p 276, American Society for Testing and Materials, 1963.
37. Hinkle, N. E., Ohr, S. M., and Wechsler, M. S., “Dose Rate, Annealing, and Stress Relaxation Studies of Radiation Hardening in Iron,” ASTM STP 426, p 573-591, American Society for Testing and Materials, 1966.
38. Hawthorne, J. R., and Hiser, A. L., Influence of Fluence Rate on Radiation-Induced Mechanical Property Changes in Reactor Pressure Vessels Steels, NUREG/CR-5493, MEA-2376, March 1990.
39. Stelzman, W. J., Berggren, R. G., and Jones, Jr., T. N., ORNL Characterization of Heavy-Section Steel Technology Program Plates 01, 02, and 03, NUREG/CR-4092, ORNL/TM-9491, April 1985.
40. Alberman, A., Bley, G., Pepin, P., and Soulat, P., “Influence of Thermal-Neutrons on the Brittleness of High-Temperature Gas-Cooled Reactor Liner Steel,” Nucl. Techno., 66 (3) 639–646, September 1984.

40
41. Albornoz, A. F., Blaumann, H., Lopasso, E. M., Blanco, A., Gennuso, G., and Serra, O., “Improved Evaluation of the Atucha-I Ex-Vessel Dosimetry,” ASTM STP 1398, pp 69–76, American Society for Testing and Materials, 2001.
42. Bucholz, J. A., “Global Shielding Analysis of the 2-Element ANS Core and Reflector with Photoneutrons,” ANS Symposium on Reactor Shielding, 1996.

41
ORNL/TM-2004/44
DISTRIBUTION
1. B. R. Bass 2. E. E. Bloom 3. Ken Farrell 4. Susan Hayes 5. David J. Hill 6. H. T. Hunter 7. D. T. Ingersoll 8. Edgar Lara-Curzio 9. B. L. Kirk
10. L. K. Mansur 11. G. E. Michaels 12. R. K. Nanstad
13. C. V. Parks 14. T. M. Rosseel 15. J. E. Rushton 16. J. J. Simpson 17. M. A. Sokolov 18. R. E. Stoller
19-24. J. A. Wang 25-27. J. Michael Whitaker
28. S. J. Zinkle 29. Laboratory Records for OSTI 30. Laboratory Records, ORNL-RC 31. Central Research Library
EXTERNAL DISTRIBUTION
32. Nilesh C. Chokshi, U.S. NRC, TWFN 10 E7, 10 E10, RES/DET/MEB, Two White Flint North 11545 Rockville Pike, Rockville, MD 20852-2738
33. Carolyn J. Fairbanks, U.S. NRC, TWFN, 10 G7, 10 E10, RES/DET/MEB, Two White Flint North 11545 Rockville Pike, Rockville, MD 20852-2738
34. Ron Cherry NA243- International Safeguards Division, Off. of Non-Proliferation & Natl. Sec., U.S. Department of Energy, Washington, DC 20585.
35. Margaret Manning, NA243- International Safeguards Division, Off. of Non-Proliferation & Natl. Sec., U.S. Department of Energy, Washington, DC 20585.
36. G. H. Marcus, Deputy Director, Office of Nuclear Energy, DOE, Washington, DC 20585.
37. Michael E. Mayfield, U.S. NRC, TWFN, 10 E7, 10 D20, RES/DET, Two White Flint North 11545 Rockville Pike, Rockville, MD 20852-2738
38. J. M. Steele, Route Symbol: NR-1, Building: 104, Naval Sea Systems Command 333 Isaac Hull Avenue S. E., Washington Navy Yard, D.C. 20376
39. Ashok C. Thadani, Director, Office of Nuclear Regulatory Research, USNRC, T10-F12, Washington, DC 20555-0001