Attributing Past and Future Climate Variations with ... Past and Future Climate Variations with...
17
Attributing Past and Future Climate Variations with Ensemble Simulations, Data Assimilation, and Climate Predictions Masayoshi ISHII (MRI/JMA) Many collaborators from JMA, Univ.s of Tokyo, Kyoto, and Nagoya, NIES, and JAMSTEC 4ICESM August 29, 2017 Hamburg Toward Detecting and
Transcript of Attributing Past and Future Climate Variations with ... Past and Future Climate Variations with...
Attributing Past and Future Climate Variations with Ensemble Simulations,
Data Assimilation, and Climate Predictions
Masayoshi ISHII (MRI/JMA) Many collaborators from JMA, Univ.s of Tokyo, Kyoto, and
Nagoya, NIES, and JAMSTEC
4ICESM August 29, 2017 Hamburg
Toward Detecting and
2017
2012
2007
2002
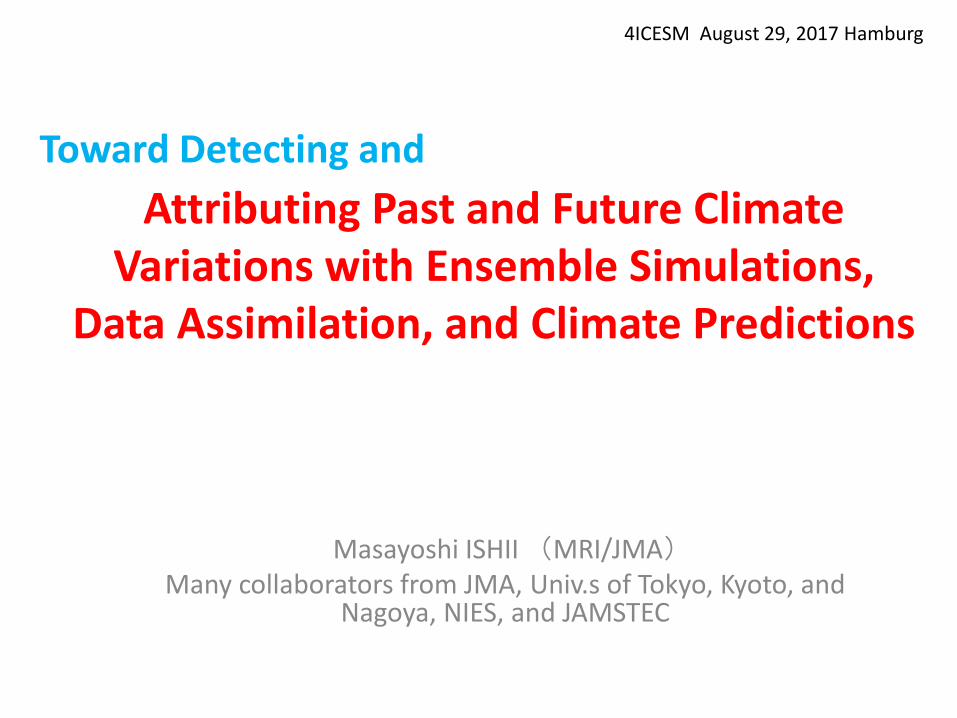
Japanese Research Programs on Global Warming
KYOUSEI
IPCC AR4
IPCC AR5
IPCC AR6
IPCC FAR-TAR
Earth Simulator 1
共生 Coexistence of Human, Nature, and Earth
革新 innovative Program of Climate Change Projection for the 21st Century
創生 Program for Risk Information on Climate Change
ES2
ES3
統合 Integrated Research Program for Advancing Climate Models
TOUGOU
focus more on * climate sensitivity, * carbon cycle, * scenario uncertainty. to provide a wider range of climate information achieving a scientific consensus on mechanisms of climate variations.
Climate predic, earth system modeling,
High-res simu. & DDS, impact assessment

Database for Policy Decision making for Future climate change: d4PDF
AGCM(水平解像度約60km)
NHRCM(水平格子間隔20km)
(画像:気象庁提供)
Six CMIP5 warming
trends (ΔT)
COBE-SST2
(detrended) Monthly PTBs
Observational
uncertainties (dT) Mizuta et al. (2017, BAMS) and 15 papers
aiming at uses for the adaptation decision making High-res Global and regional Atmos climate
simulations
Past-climate simulations: 60 yrs X 100 ens. Future-climate simulations: 60 yrs X 90 ens. under
+4K SAT warming relative to the preindustrial different Initial-conditions and monthly SST
pertutbations. Data volume: 2PB
MRI-AGCM 60km NHRCM 20 km
http://www.miroc-gcm.jp/~pub/d4PDF/index_en.html
Smoother PDF as more mem.

Daily precipitation of 10-yr return period
1 member 90 members
Past
Climate
+4K Future
Changes
(%)
Less noisy in space helps to estimate local climate changes
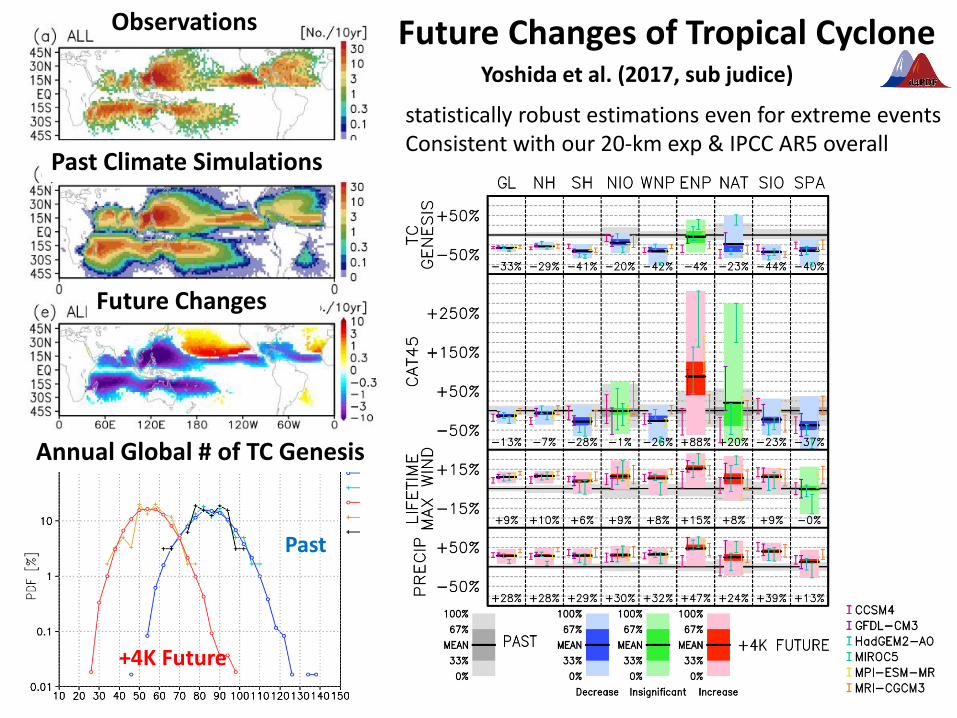
Yoshida et al. (2017, sub judice)
Future Changes of Tropical Cyclone
statistically robust estimations even for extreme events Consistent with our 20-km exp & IPCC AR5 overall
Observations
Past Climate Simulations
Future Changes
Annual Global # of TC Genesis
Past
+4K Future

an application of d4PDF for impact-assessment study
Future changes in coastal risks 50-year return values of surface wind and storm surges
Wind Speed Storm Surges (along coastal lines)
Mori et al. (2017, submitted) Obviously, risk of storm surge will increases, corresponding to the future changes of ocean surface wind.

+2K
+4K PAST
+2K future climate simulations
Daily Maximum Temperature Frequencies in August at TOKYO
MEXT
year 2040 cond. of RCP8.5 for assessment of the differences of future changes of mean climates and extreme events between +2K and +4K exp.

Event Attribution
Attributing how much natural variations and global warming contribute to specific climate/weather extreme events by comparing a number of simulations w/ observed SST & natural and anthropogenic forcing (“factual“; d4PDF past-clim sim. ) to simulations w/o SST trend & anthropogenic forcing (“counterfactual“; a subset of d4PDF)
BAMS special report
2015
Russian Heat Wave in 2010 Watanabe et al. (2013)
factual counterfactual climate
Is this extreme event due to the past human activity?
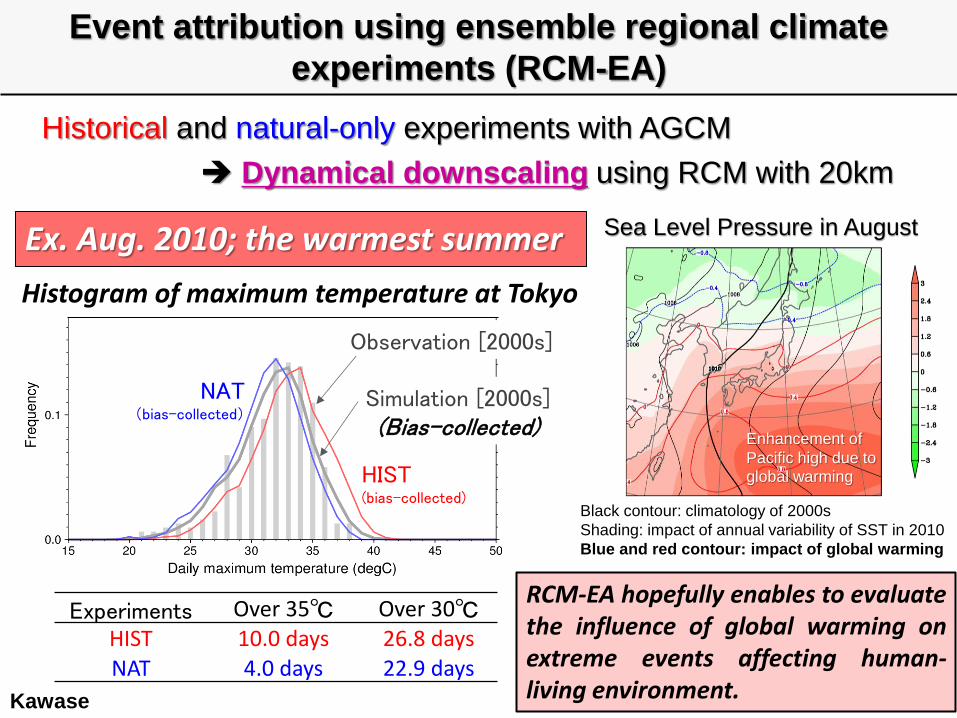
Event attribution using ensemble regional climate
experiments (RCM-EA)
Historical and natural-only experiments with AGCM
Dynamical downscaling using RCM with 20km
Experiments Over 35℃ Over 30℃ HIST 10.0 days 26.8 days NAT 4.0 days 22.9 days
NAT (bias-collected)
HIST (bias-collected)
Observation [2000s]
Simulation [2000s] (Bias-collected)
Enhancement of
Pacific high due to global warming
Sea Level Pressure in August
Black contour: climatology of 2000s
Shading: impact of annual variability of SST in 2010
Blue and red contour: impact of global warming
RCM-EA hopefully enables to evaluate the influence of global warming on extreme events affecting human-living environment.
Histogram of maximum temperature at Tokyo
Ex. Aug. 2010; the warmest summer
Kawase

Missing Air-Sea Interactions (1)
Future Changes in Summer-Time Monsoon JJA Precipitation
In AGCM (d4PDF), - Clock-wise circulation around Philippine no future change/drier state over Japan In CMIP5 - opposite signs Hidden uncertainties must be considered,
AG
CM
(d
4P
DF)
C
MIP
5
Endo
Air-sea interactions are intrinsically missing in AGCM simulations. This point has to be taking into account when we discuss the uncertainties in past and future climate changes.
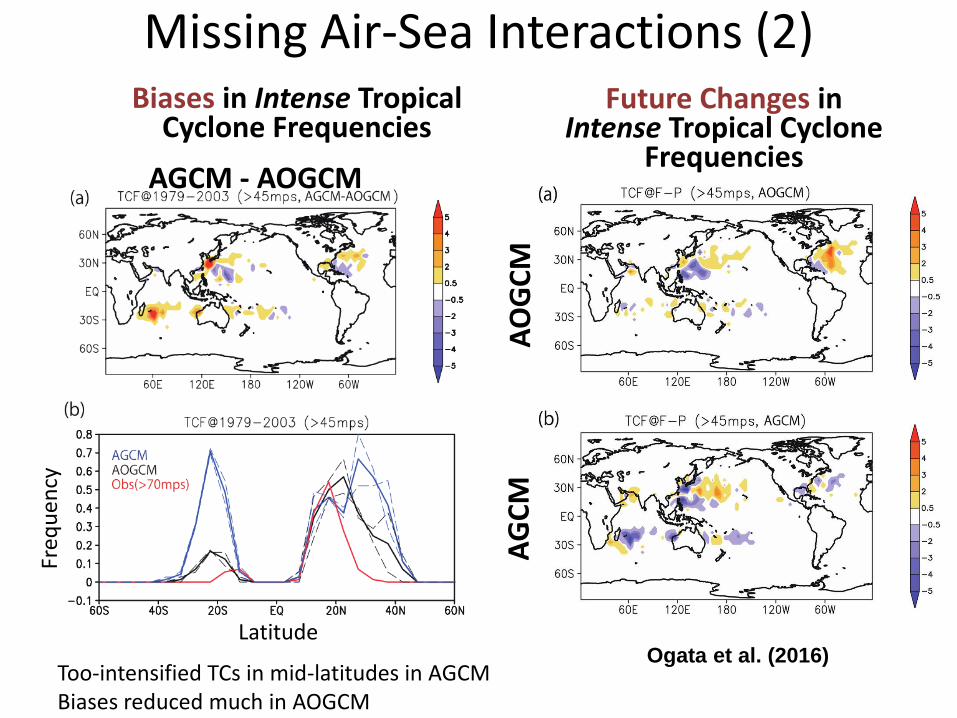
Missing Air-Sea Interactions (2) Biases in Intense Tropical
Cyclone Frequencies
AGCM - AOGCM
Future Changes in Intense Tropical Cyclone
Frequencies
Ogata et al. (2016)
AG
CM
A
OG
CM
Too-intensified TCs in mid-latitudes in AGCM Biases reduced much in AOGCM
Freq
ue
ncy
Latitude

Models/Systems used currently and next
1) MRI-ESM2 2) Initialization and Ensemble-generation schemes
incorporated to the MRI-ESM2
Yukimoto et al. (2017, in prep)
MRI-ESM2 Participating in CMIP6 Many minor revisions after CMIP5 --- biases reduced in cloud, sea ice, and etc. --- realistic QBO
Yoshida’s poster #100
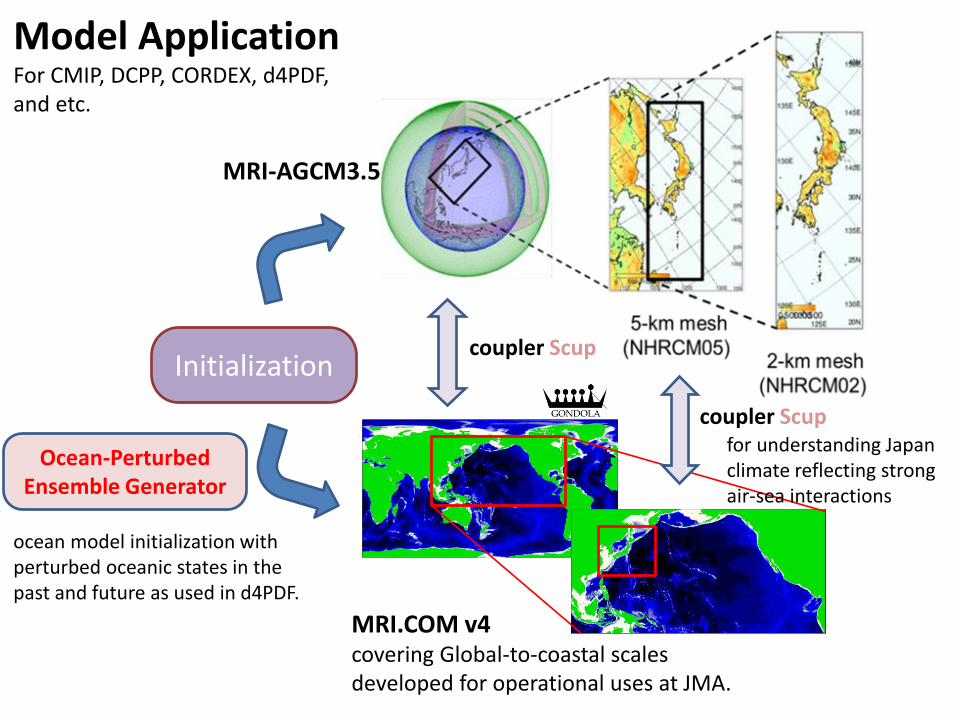
Initialization
Ocean-Perturbed Ensemble Generator
MRI-AGCM3.5
MRI.COM v4 covering Global-to-coastal scales developed for operational uses at JMA.
coupler Scup
coupler Scup
Model Application For CMIP, DCPP, CORDEX, d4PDF, and etc.
ocean model initialization with perturbed oceanic states in the past and future as used in d4PDF.
for understanding Japan climate reflecting strong air-sea interactions

Climate Reanalysis
Global SAT anomaly @LAND
shade: EnKF spred
ISPD-archived data distribution before WW-II (courtesy of Kubota)
LETKF (Hunt et al. 2007) Variables to be assimilated
Atmos: T, q, u, v Ocean: T, S, u, v Sea ice: c, h, s, u, v
Assimilation interval: 6 hours for Atmos. and 5 days for Ocean
Observations • Surface Pressure (ISPD v.3.2.8) • Typhoon tracks (IBTrACS v03) • SST: COBE-SST2 (Hirahara et al. 2014) +
SST perturbations • Updated ocean subsurface T and S
(Ishii et al. 2017) • Sea ice concentration
Loosely coupled
Surface pressure observations over
Japan are very few before WW-II.
Data rescue is an urgent work!
• EnKF-based scheme for model initialization and 150-yr climate reanalysis.
• tested for climate reanalysis with MIROC3
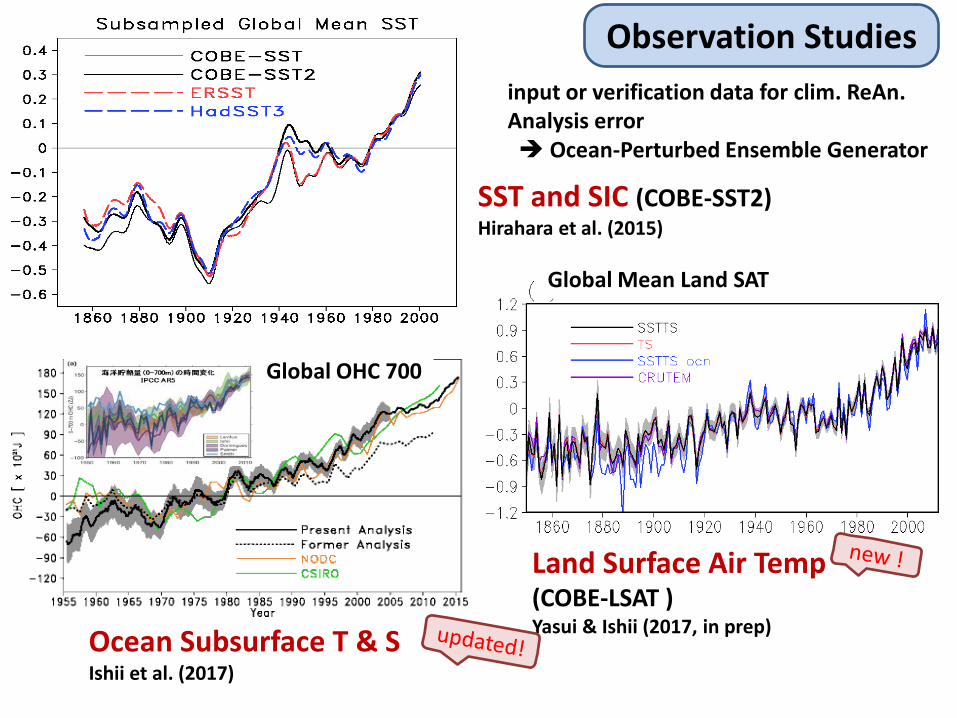
SST and SIC (COBE-SST2) Hirahara et al. (2015)
Land Surface Air Temp (COBE-LSAT ) Yasui & Ishii (2017, in prep)
Ocean Subsurface T & S Ishii et al. (2017)
Observation Studies
Global OHC 700
Global Mean Land SAT
input or verification data for clim. ReAn. Analysis error Ocean-Perturbed Ensemble Generator
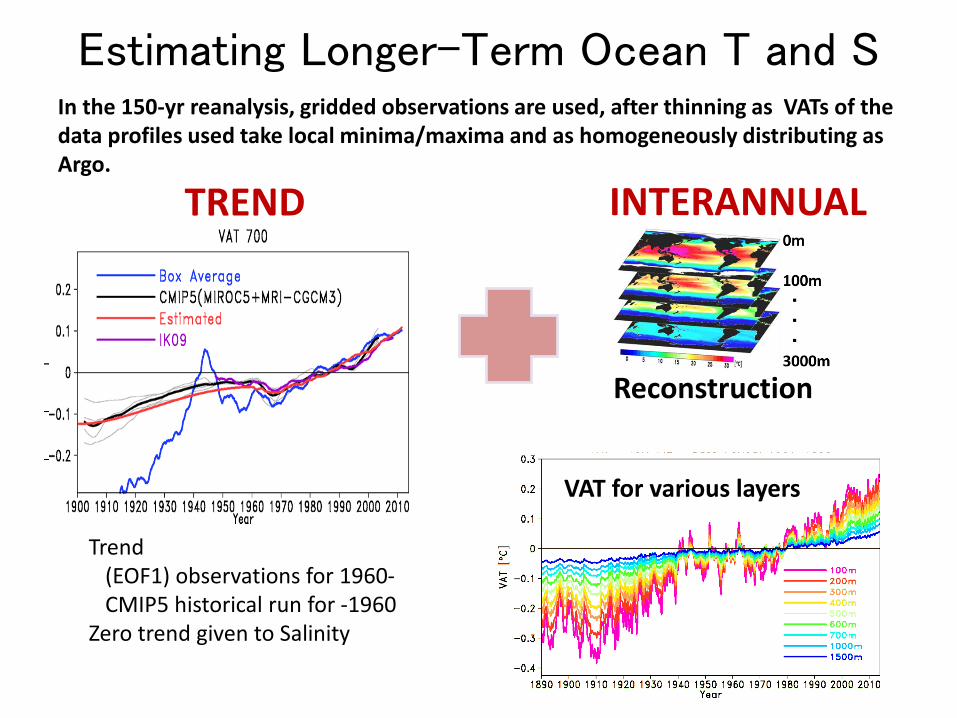
Estimating Longer-Term Ocean T and S
Trend (EOF1) observations for 1960- CMIP5 historical run for -1960 Zero trend given to Salinity
In the 150-yr reanalysis, gridded observations are used, after thinning as VATs of the data profiles used take local minima/maxima and as homogeneously distributing as Argo.
TREND INTERANNUAL
VAT for various layers
Reconstruction

Summary
Large ensemble data base of past, present-day, and future climate states by model simulation, data assimilation, and prediction. The data base are useful for detecting & attributing climate signals
and long-term climate prediction as well as impact assessment studies.
d4PDF (past) CMIP (historical) Climate Reanalysis
d4PDF (future) CMIP (RCPx) DCPP
E/A
Ensemble Database