Attitudes towards the EU in the United Kingdom Analytical report › commfrontoffice ›...
78
page 1 Flash Eurobarometer 318 – The Gallup Organization Flash Eurobarometer Attitudes towards the EU in the United Kingdom Analytical report Fieldwork: November 2010 Publication: March 2011 This survey was requested by Directorate-General Communication This document does not represent the point of view of the European Commission. The interpretations and opinions contained in it are solely those of the authors. European Commission
Transcript of Attitudes towards the EU in the United Kingdom Analytical report › commfrontoffice ›...
page 1
Flas
h E
urob
arom
eter
318
– T
he G
allu
p O
rgan
izat
ion
Flash Eurobarometer
Attitudes towards the EU in the United Kingdom Analytical report Fieldwork: November 2010
Publication: March 2011
This survey was requested by Directorate-General Communication This document does not represent the point of view of the European Commission. The interpretations and opinions contained in it are solely those of the authors.
European Commission

Flash EB Series #318
Attitudes towards the EU in the United Kingdom
Survey conducted by The Gallup Organization, Hungary upon the request of
Directorate-General Communication
Coordinated by Directorate-General Communication
This document does not represent the point
of view of the European Commission. The interpretations and opinions contained
in it are solely those of the authors.
THE GALLUP ORGANIZATION
Flash EB No 318 – Attitudes towards the EU in the UK Analytical report
page 3
Table of contents
Introduction .......................................................................................................................................... 4
Main findings ........................................................................................................................................ 5
1. Information about the EU ................................................................................................................ 6
1.1 Self-perceived level of knowledge about the EU ...................................................................... 6 1.2 Information supply .................................................................................................................... 7 1.3 Interest in information .............................................................................................................. 7 1.4 Likeliness to deal with simpler and clearer information ...................................................... 9 1.5 Information providers ............................................................................................................... 9 1.6 Objectivity of the British media ............................................................................................. 10
2. Support for the EU ......................................................................................................................... 12
2.1 Public perception of the EU and the UK’s membership ..................................................... 12 2.2 Assessment of the economic costs and benefits of EU membership ................................ 12 2.3 Emotional and rational assessment of the EU and the UK’s membership ..................... 13
3. The UK’s contribution to the EU .................................................................................................. 15
3.1 Financial contribution ............................................................................................................. 15 3.2 Influence on EU legislation .................................................................................................... 16
4. Priorities, benefits and impact of EU policies .............................................................................. 18
4.1 The EU’s role in certain policy areas ..................................................................................... 18 4.2 Awareness of the EU’s benefits ............................................................................................. 18 4.3 Awareness of EU initiatives ................................................................................................... 19 4.4 Importance of the initiatives’ benefits .................................................................................. 20 4.5 Impact of EU initiatives on attitudes towards the EU ........................................................ 22 4.6 Benefits of EU membership ................................................................................................... 22 4.7 Willingness to accept a loss of benefits ................................................................................ 25
5. Political parties and European elections ...................................................................................... 26
5.1 Importance of European issues at last general election ..................................................... 26 5.2 Representation of views on the EU ....................................................................................... 26
I. Annex tables .................................................................................................................................... 29
II. Survey details ................................................................................................................................. 71
III. Questionnaire ............................................................................................................................... 73
Analytical report Flash EB No 318 – Attitudes towards the EU in the UK
page 4
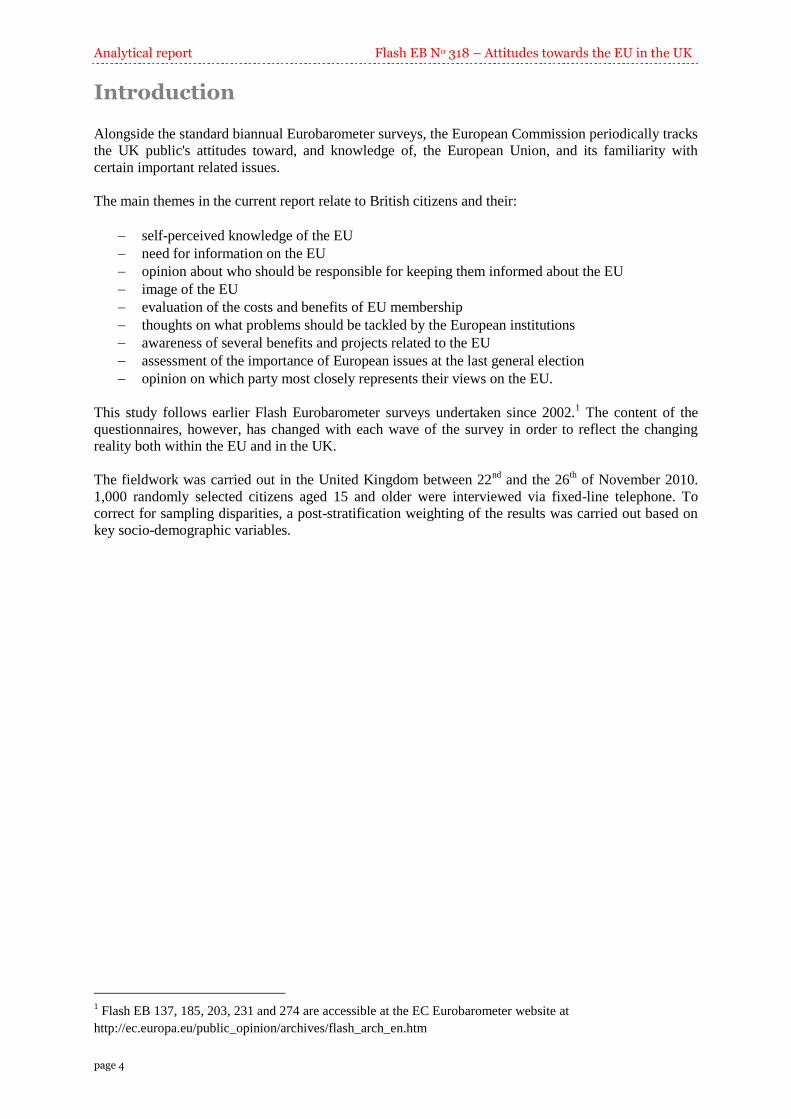
Introduction Alongside the standard biannual Eurobarometer surveys, the European Commission periodically tracks
the UK public's attitudes toward, and knowledge of, the European Union, and its familiarity with
certain important related issues.
The main themes in the current report relate to British citizens and their:
self-perceived knowledge of the EU
need for information on the EU
opinion about who should be responsible for keeping them informed about the EU
image of the EU
evaluation of the costs and benefits of EU membership
thoughts on what problems should be tackled by the European institutions
awareness of several benefits and projects related to the EU
assessment of the importance of European issues at the last general election
opinion on which party most closely represents their views on the EU.
This study follows earlier Flash Eurobarometer surveys undertaken since 2002.1 The content of the
questionnaires, however, has changed with each wave of the survey in order to reflect the changing
reality both within the EU and in the UK.
The fieldwork was carried out in the United Kingdom between 22nd
and the 26th of November 2010.
1,000 randomly selected citizens aged 15 and older were interviewed via fixed-line telephone. To
correct for sampling disparities, a post-stratification weighting of the results was carried out based on
key socio-demographic variables.
1 Flash EB 137, 185, 203, 231 and 274 are accessible at the EC Eurobarometer website at
http://ec.europa.eu/public_opinion/archives/flash_arch_en.htm
Flash EB No 318 – Attitudes towards the EU in the UK Analytical report
page 5
Main findings
Information about the EU
18% of UK respondents felt informed about the EU. However, 82% said they knew little or
nothing.
Only a small minority “strongly” agreed that the information available on EU affairs was
simple and clear (5%), and 3 in 10 agreed to “some extent”.
Respondents felt that EU reports on television, the radio and, particularly, in the written press
were too negative. Almost half (48%) perceived a negative bias in press reports. Six in ten
British respondents indicated that they did not want to receive more information about the EU.
British citizens tend to expect their government to inform them about the European Union and
its decisions (48%).
Support for the EU
Respondents were divided on the “image” of the EU: 42% had a rather positive image of the
EU, while almost as many had a rather negative one (39%).
A third of respondents felt that the economic benefits of the UK being a member of the EU
outweighed the associated costs; 4 in 10 held the opposite view.
Taking an overview of the questions concerning the EU’s “image” and the “cost-benefit
analysis” of membership, the youngest respondents, full-time students and highly-educated
respondents were the most likely to give a consistently positive evaluation of the EU and the
UK’s membership in it.
The UK’s contribution to the EU
The UK contributes more than it directly receives from the EU budget. In 2009, this difference
amounted to 0.12% of Gross National Income (GNI).
When asked to estimate the UK’s net contribution to the EU budget, only 9% of respondents
said it was below 3% of the country’s GNI. On average, respondents estimated that the UK
annually transferred 19% of its GNI to the EU. Almost 4 in 10 (38%) did not or could not
answer.
Politically, respondents were evenly split between those who felt that the UK had a lot or a fair
amount of influence on the way EU laws are made and those who did not (both 49%).
EU policies affecting the UK
Most respondents acknowledged that the EU had a role in tackling some of the most pressing
international issues.
Clear majorities considered all eight EU initiatives presented to them important.
More than half of respondents (54%) said that the fact that these initiatives had been started
and developed by the European Union made them feel more positive about the European
Union.
Most interviewees said they would care if any of the listed benefits were lost.
Political parties and European elections
55% of British respondents felt that European issues had not been important in the last general
election in May 2010.
Respondents were equally split as to whether the Conservatives or Labour best represented
their views on Europe (24% and 23%, respectively.)
Analytical report Flash EB No 318 – Attitudes towards the EU in the UK
page 6
1. Information about the EU
Almost one fifth of UK respondents felt informed about the EU. However,
82% said they knew little or nothing about it.
Only a tiny minority “strongly” agreed that the information available on EU
affairs was simple and clear (5%), and 3 in 10 agreed to some extent.
Respondents felt that EU reports on television, the radio and particularly in
the written press were too negative. Almost half (48%) perceived a negative
bias in press reports. Six in ten British respondents indicated that they did
not want to receive more information about the EU.
British citizens mainly expect their government to inform them about the
European Union and its decisions (48%).
1.1 Self-perceived level of knowledge about the EU
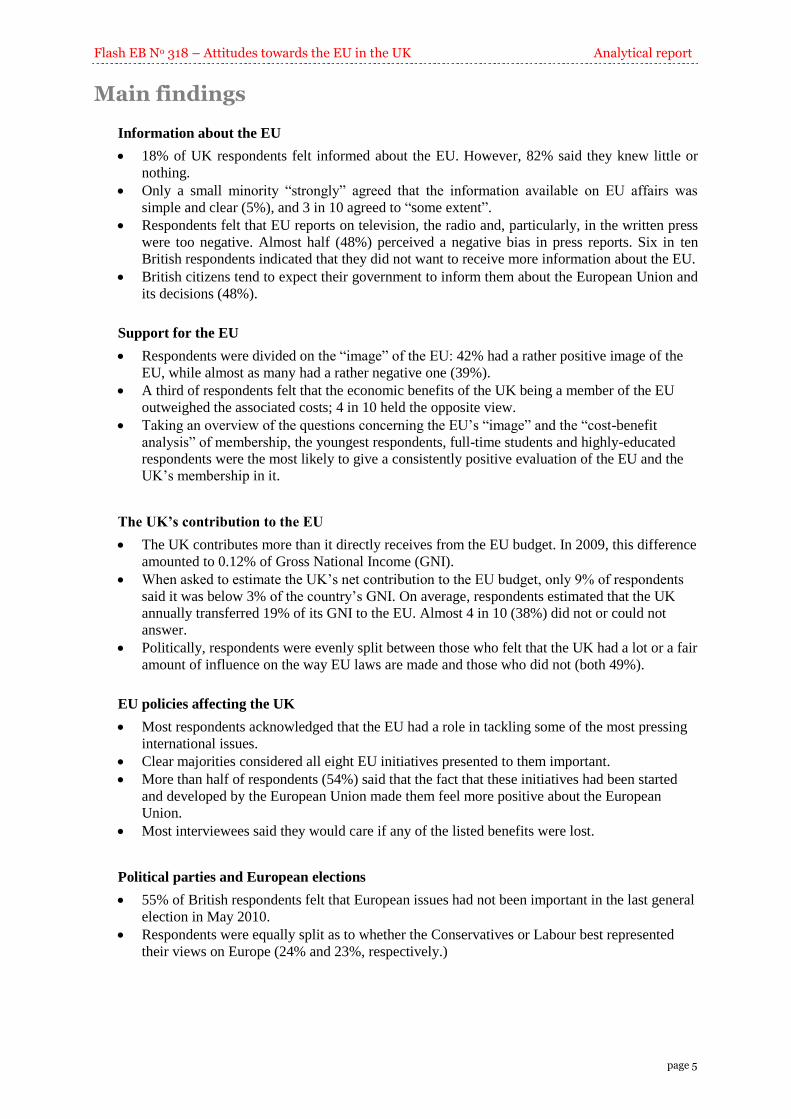
The vast majority of Britons (82%) said that
they knew either little (68%) or nothing (14%)
about the EU’s institutions and policies. The
results have changed very little since May 2009
survey.
In a similar vein, over the last year and a half
there has been little change in the proportion of
respondents feeling very informed. The latest
figures show that 2% of respondents said they
knew a great deal and 16% quite a lot about the
EU.
Men felt more knowledgeable about EU matters
(25% vs. 11% of women said they knew either a
great deal or quite a lot). The youngest
respondents (15-24 years) were the least likely of all socio-demographic groups to feel informed (6%).
Respondents with the highest level of education (who attended college/school beyond the age of 20)
were the most informed. But even in this group, just slightly more than a quarter felt they knew quite a
lot or a great deal about the EU (27%). Looking at occupational groups, the self-employed (22%)
were more than twice as likely as manual workers (8%) to feel informed.
Women, the youngest respondents, those with low levels of education and manual workers were more
likely to say they knew nothing about the EU than to say they knew quite a lot or a great deal. For
example, among those with the lowest level of education (who left school at the age of 15 or earlier),
13% said they were informed and 24% said they knew nothing at all.
We define an attitudinal typology in section 2.1. Looking at attitudinal segments according to their
stance towards the EU, the proportion of well-informed citizens was highest among those who held a
consistently favourable opinion of the EU and the UK’s membership in it (30%), followed by those
who provided a consistently sceptical opinion (23%). The self-perceived level of information was at its
lowest among those with inconsistent views about the EU (11%).
(For further details, see Annex Table 34.)
Knowledge of the EU, its policies and institutions
Q14 (2010-2009) / Q1 (2006-2002). How much do you feel you know about the European Union, its policies, its
institutions? Would you say you know ...?%, Base: all respondents
14
14
29
29
68
69
56
58
16
17
13
11
2
1
2
1
Fl318 (2010)
Fl274 (2009)
Fl185 (2006)
Fl137 (2002)
nothing at all a little quite a lot a great deal

Flash EB No 318 – Attitudes towards the EU in the UK Analytical report
page 7
1.2 Information supply
No more than 5% of British respondents strongly agreed that the information available on EU
affairs was simple and clear and 3 in 10 (30%) agreed to some extent. A larger share of respondents
felt that EU-related information was not easy to digest: 20% strongly disagreed and an additional 35%
disagreed. Finally, 1 in 10 survey participants did not know or did not want to answer this question.
There were only minor changes from the previous wave.
Information available on the EU is simple and clear
5
30
35
20
10
Strongly agree
Agree
Disagree
Strongly disagree
DK/NA
Q15. Would you agree that current information available on the European Union is simple and clear enough?
%, Base: all respondents
4
34
33
20
8
Fl274 (2009)Fl318 (2010)
A deeper analysis of the responses did not confirm a strong relationship between the perceived
simplicity (or complexity) of information available on EU affairs and respondents’ supposed
awareness level. About one in five of those who felt informed as well as of those who felt uninformed
on EU matters strongly disagreed that the current information about the EU was clear and simple (22%
and 20%, respectively).
Interestingly, the results of the socio-demographic analysis showed that although the youngest
respondents (15-24 year-olds) were among the least likely to feel informed about EU matters, almost 6
in 10 (58%) of them said that the available information was clear enough, compared to 28%-39%
across other age groups.
The opposite pattern was observed when looking at occupational groups. The self-employed were
more likely to feel informed about the EU, but less likely to find EU-related information clear and
simple (26% vs. 34%-36% of others).
Full-time students were by far the most likely to agree that EU information was simple and clear (63%
vs. 26% of those with the lowest level of education and 32%-35% of those who remained in school at
least until the age of 16). Residents of metropolitan areas also tended to be more satisfied with the
information available (39% vs. 33% of others).
While 4 in 10 of those who had a consistently positive stance towards the EU (see section 2.1 for a
description of how groups were defined) said that EU-related information was easily understandable,
this proportion decreased to 23% for those who had a consistently unfavourable opinion.
(For further details, see Annex Table 35.)
1.3 Interest in information
A majority of respondents indicated that they were not interested in receiving more information
about the EU: 22% said they were quite uninterested and 38% were not interested at all. The
proportion of those uninterested in receiving more information has increased by six percentage points
compared to May 2009.

Analytical report Flash EB No 318 – Attitudes towards the EU in the UK
page 8
Overall, 4 in 10 (41%) respondents were interested in receiving more information; with 8% saying
they were very interested and 33% quite interested in learning more about the EU (-5 points since
2009).
Interest in receiving more information about the EU
8
33
22
38
0
Very interested
Quite interested
Quite uninterested
Not at all interested
DK/NA
Q16. How interested are you in receiving more information about the EU?%, Base: all respondents
9
38
23
31
0
Fl274 (2009)Fl318 (2010)
The proportions of those interested in receiving further information essentially matched the current
pattern of knowledge: the segments most interested in receiving further information were those that
were already relatively well informed about the EU. Half (51%) of those citizens who saw themselves
as informed about the EU were also quite or very interested in receiving more information, in
comparison to 41% of the those who said they knew little about the EU and a quarter of those who
knew nothing at all.
In May 2009, the differences between “informed” and “uninformed” respondents were even more
pronounced. Almost 6 in 10 (58%) respondents who claimed to be well-informed about the EU
showed an interest in receiving more information about the EU, compared to 22% of those who knew
nothing at all about EU affairs.
17
8
3
41
40
19
17
23
27
24
29
50
Knows a great deal and quite a lot
Knows a little
Knows nothing at all
14
8
1
37
33
24
18
24
17
30
35
58
Knows a great deal and quite a lot
Knows a little
Knows nothing at all
Q14. How much do you feel you know about the European Union, its policies, its institutions? Would you say you know ...?
Q16. How interested are you in receiving more information about the EU?%, Base: all respondents
Knowledge of the EU and interest in receiving more information
Knows a great deal and quite a lotVery interested Quite interested Quite uninterested Not at all interested
Fl274 (2009)Fl318 (2010)
Among socio-demographic groups, those with the highest level of education were most likely to
express an interest in obtaining more information (52%; compared to about 32% of those with the
lowest level of education). The youngest respondents (15-24 year-olds) were less inclined to be
interested in more information (32% vs. 40%-44% of other age groups). Residents of metropolitan
areas were more likely to show such an interest (47% vs. 41% of residents of small cities and 36% of
respondents from rural areas). Finally, consistent “supporters” of the EU and the UK’s membership
were more than twice as likely as consistent “opponents” to say that they were interested in receiving
more information about the EU (63% vs. 28%). (For further details see Annex Table 36.)

Flash EB No 318 – Attitudes towards the EU in the UK Analytical report
page 9
1.4 Likeliness to deal with simpler and clearer information
Next, the survey asked those who criticised EU-related information for its lack of simplicity and
clarity if they would be more open to such information were it less difficult to understand. Somewhat
more than a quarter (27%) of respondents said that it was very likely, and a further 54% that it was
likely, that they would be more open to EU-related information if it were easier to digest. A tenth
of respondents stated that it was not likely that they would deal with EU-related information if it was
simpler and clearer, while 9% said it was not at all likely.
Likeliness to deal with EU-related information if it was simpler and clearer
27
54
10
9 0
Very likely
Likely
Not likely
Not likely at all
DK/NA
Q17. If more simple and clear information on the European Union were available, how likely would you be to read /listen /watch it?
%, Base: those who think information on the EU in not simple and clear or those who are interested in receiving more information about the EU
29
54
8
9 0
Fl274 (2009)Fl318 (2010)
A closer look at the various segments further corroborated the assumption that there were people who
were simply not interested in EU-related information, no matter how simple or clear. Those segments
who felt better informed and were more interested in receiving additional information were also the
most likely to indicate that they would consume even more information if it were simpler to
understand. A clear indication of this pattern is that 39% of those who already felt informed about the
EU said that they would be very likely to read or watch more such news if it was easier to digest, while
24% of the uninformed group shared this opinion.
(For further details see Annex Table 37.)
1.5 Information providers
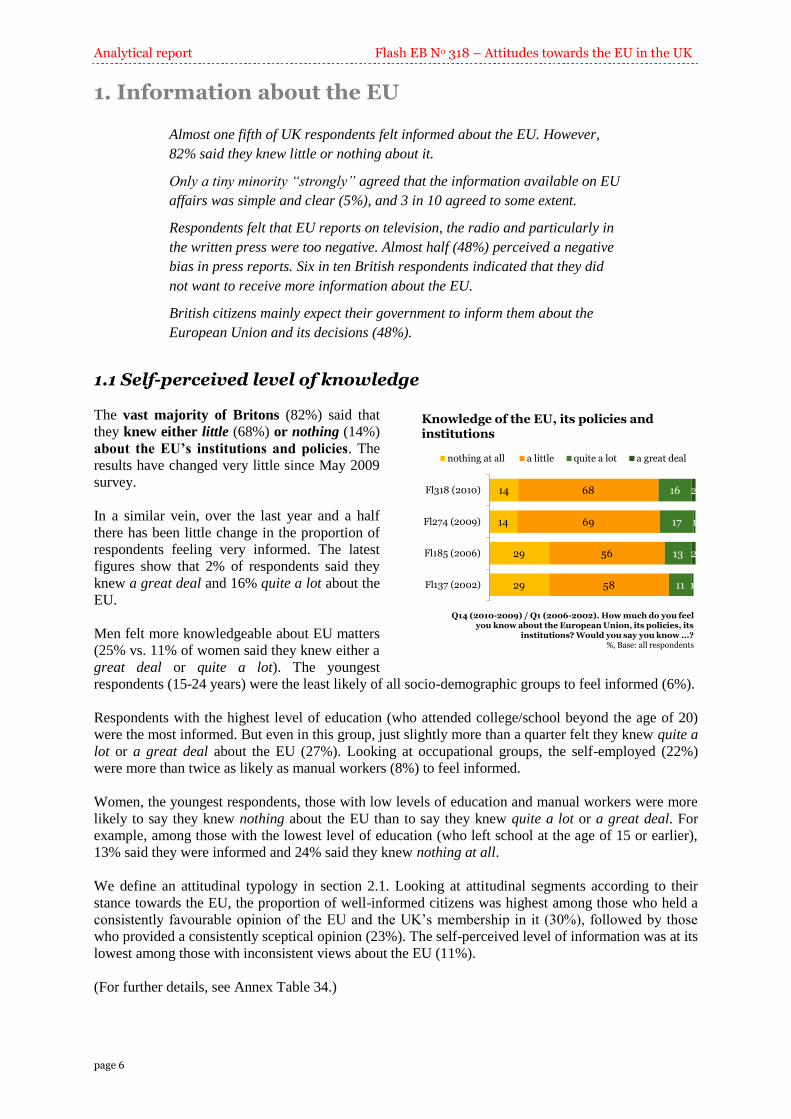
Nearly half (48%) of British citizens expected their government to inform them about the EU: This is
far higher than any other information provider and represents an increase of five percentage points from
2009, reaching the same level as in 2007.
A sixth (17%) of the British public felt that the responsibility of providing information about the EU
lies with media outlets, and 12% with local government. Fewer citizens thought it was the EU's job:
roughly 1 in 10 (11%) thought that the UK’s EU information centres were primarily responsible and
half that number (6%) felt that this should be the responsibility of EU institutions. Only political
parties scored lower than the EU: 4% saw them as primarily responsible.
Analytical report Flash EB No 318 – Attitudes towards the EU in the UK
page 10
46
15
18
10
5
3
3
The Britishgovernment
Newspapers/television
Local government
EU informationcentres in the UK
The EUinstitutions
Political parties
DK/NA
48
19
16
5
4
3
4
The Britishgovernment
Newspapers/television
Local government
EU informationcentres in the UK
The EUinstitutions
Political parties
DK/NA
43
20
14
11
6
4
3
The Britishgovernment
Newspapers/television
Local government
EU informationcentres in the UK
The EUinstitutions
Political parties
DK/NA
48
17
12
11
6
4
2
The Britishgovernment
Newspapers/television
Local government
EU informationcentres in the UK
The EUinstitutions
Political parties
DK/NA
Q18 (2010-2009) / Q5 (2007) / Q4 (2006). Who do you think should be responsible for keeping you informed about the EU and its decisions? Please choose ONE from the list that I am going to read to you.
%, Base: all respondents
Responsibility for keeping citizens informed about the EU and its decisions
Fl274 (2009)Fl318 (2010) Fl203 (2007) Fl185 (2006)
Opinions were rather homogenous in the various socio-demographic segments; each respondent group
was most likely to answer that it was up to the British government to provide information. Full-time
students proved to be an exception to the rule; they were as likely to name newspapers and television
as they were to mention the British government (33% and 35%, respectively). Manual workers were
the most likely of all groups to see a role for the local government (28%).
Unlike in 2009, those who had a consistently favourable opinion of the EU were not more inclined to
assign such responsibility to EU institutions. Yet, they were still three times as likely as respondents
with consistently unfavourable attitudes towards the EU to mention EU information centres in the UK
(19% vs. 6%).
(For further details see Annex Table 38.)
1.6 Objectivity of the British media
The survey also asked British citizens whether or not the information the various news media
conveyed about the EU was objective or biased. Respondents’ replies indicate a generally perceived
negative bias in reporting on EU affairs on television, radio and in the written press: the “too
negative” replies outnumbered the “too positive” responses.
Reports appearing in the written press were seen to be the most negative: almost half of respondents
(48%) indicated that reports about the EU tended to be unnecessarily negative. Even those respondents
who expressed consistently unfavourable opinions about the EU and the UK’s membership mostly
agreed that press reports about the EU were too negative (41% vs. 31% who saw them as objective and
16% who felt the reports were too positive).
Television was perceived to be negatively biased when reporting on the EU by more than a quarter of
British respondents (27%), compared to 17% who saw a positive bias and 44% who thought that it
usually reported in an objective way.
As in the previous wave, the gap between those who thought that a medium was reporting on the EU
too negatively and those who said the opposite was smallest in the case of radio broadcasts. While
18% felt that British radio broadcasts were presenting the EU in a too negative light, 14% held the
opposite view and 41% said they were objective. Almost 3 in 10 (27%) did not comment on the
objectivity of radio programmes.
Flash EB No 318 – Attitudes towards the EU in the UK Analytical report
page 11
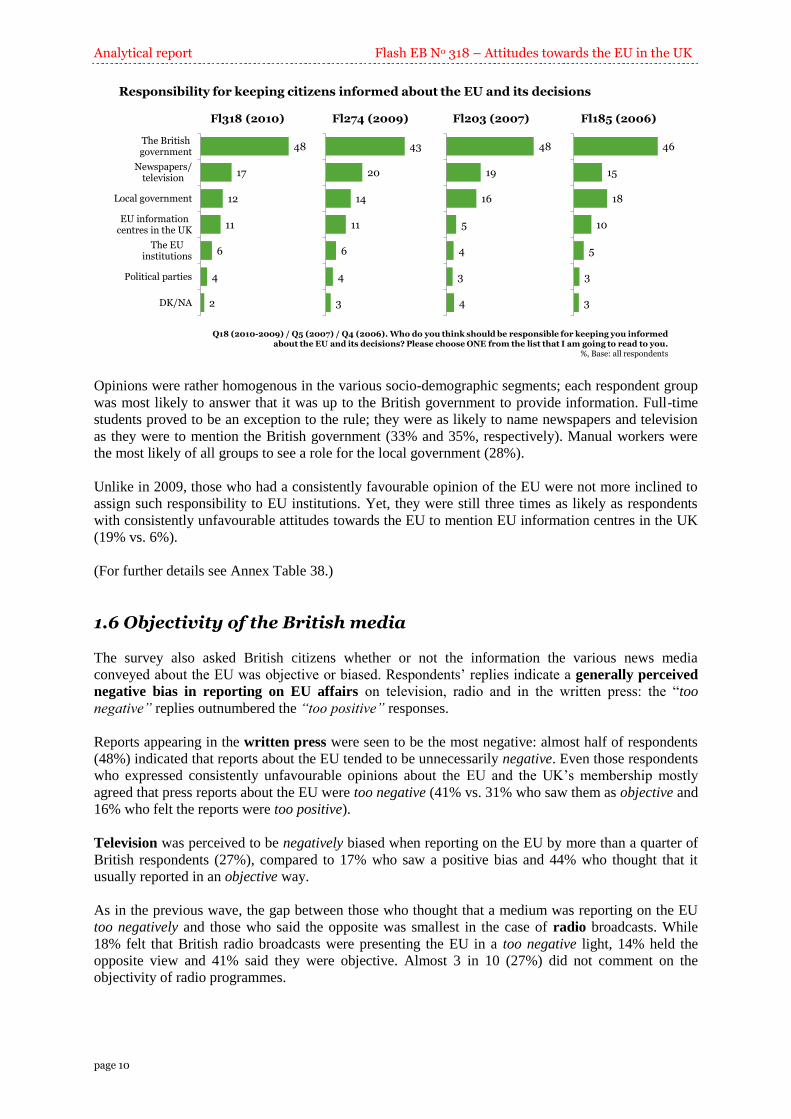
14
12
13
36
33
27
25
17
38
25
39
22
Television
Radio
Press
19
18
16
36
38
26
33
21
48
13
23
11
Television
Radio
Press
17
14
13
44
41
26
27
18
48
13
27
12
Television
Radio
Press
Q13 (2010-2009) / Q11 (2007) / Q12 (2006). Do you think that the British ... presents the European Union too positively, too negatively or objectively?
%, Base: all respondents
Perception of the British media
Fl274 (2009)Fl318 (2010) Fl203 (2007)
TelevisionToo positively Objectively Too negatively DK/NA
Comparing these latest results with those from May 2009, the biggest changes took place in the
perceived objectivity of television stations. The share of those who thought that television broadcasts
portrayed the EU in too negative a light dropped by six percentage points, while the proportion of
those who saw them as objective increased by eight points.
Those who felt informed about EU matters were more likely to criticise media coverage as having a
“positive” or “negative” bias. Generally, the most systematic difference across the various socio-
demographic and attitudinal segments was the proportion of the “don’t know” replies, which were
consistently higher among women, the oldest respondents (older than 54) and those with lower levels
of education.
The youngest respondents (15-24 year-olds), and those still in education were more likely to say that
British TV and radio broadcasts were positively biased when reporting on the EU than to claim the
opposite. For example, a quarter of 15-24 year-olds, as well as 3 in 10 full-time students, perceived
British television programmes as too positive, compared to 14% and 18%, respectively, who saw a
negative bias.
Men (53%), the highly educated (63%) and the self-employed (59%) were more likely than their
socio-demographic counterparts to say that the press was negatively biased.
(For further details see Annex Tables 31-34.)
Analytical report Flash EB No 318 – Attitudes towards the EU in the UK
page 12
2. Support for the EU
Respondents were divided on the “image” of the EU: a share of 42 % had a
rather positive image of the EU, while almost as many interviewees held the
opposite view (39%).
A third of respondents felt the economic benefits of the UK being a member
of the EU outweighed the costs and 4 in 10 took the opposite viewpoint.
The youngest respondents, full-time students and highly-educated
respondents were the most inclined to evaluate the EU and the UK’s
membership consistently positively.
This section looks at how British citizens perceive the EU’s image and their opinion about the
economic costs and benefits of the UK’s membership.
2.1 Public perception of the EU and the UK’s membership
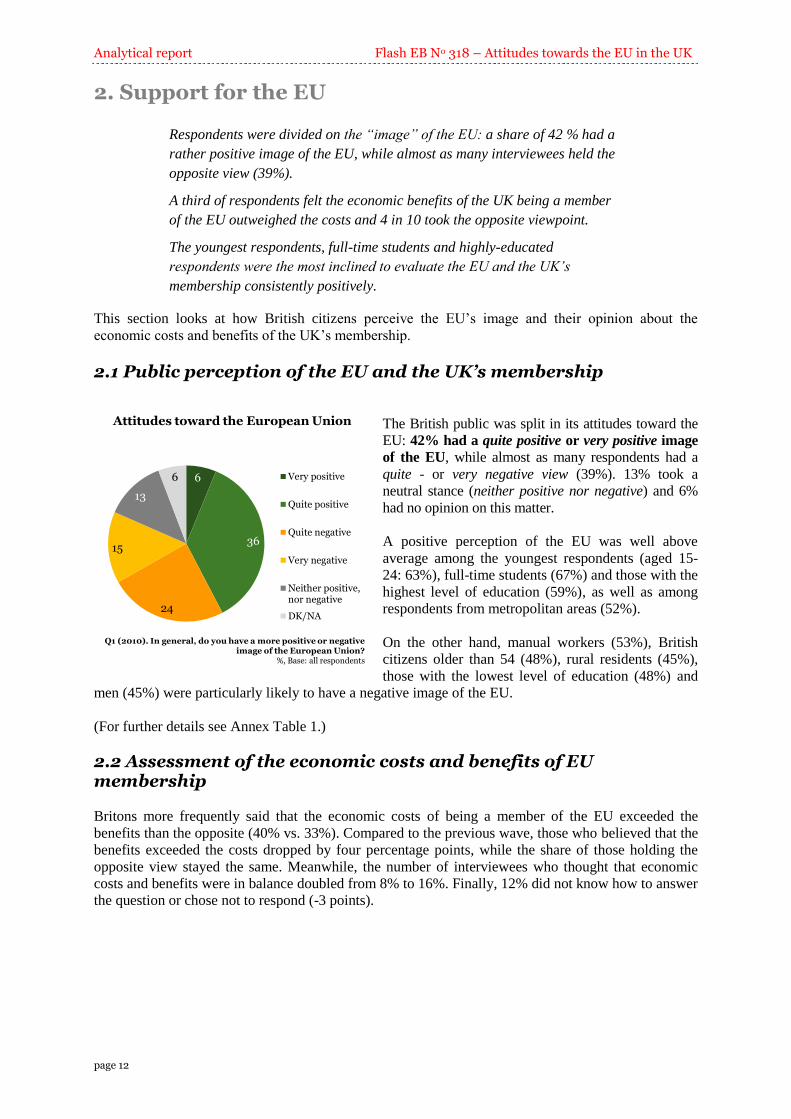
The British public was split in its attitudes toward the
EU: 42% had a quite positive or very positive image
of the EU, while almost as many respondents had a
quite - or very negative view (39%). 13% took a
neutral stance (neither positive nor negative) and 6%
had no opinion on this matter.
A positive perception of the EU was well above
average among the youngest respondents (aged 15-
24: 63%), full-time students (67%) and those with the
highest level of education (59%), as well as among
respondents from metropolitan areas (52%).
On the other hand, manual workers (53%), British
citizens older than 54 (48%), rural residents (45%),
those with the lowest level of education (48%) and
men (45%) were particularly likely to have a negative image of the EU.
(For further details see Annex Table 1.)
2.2 Assessment of the economic costs and benefits of EU membership
Britons more frequently said that the economic costs of being a member of the EU exceeded the
benefits than the opposite (40% vs. 33%). Compared to the previous wave, those who believed that the
benefits exceeded the costs dropped by four percentage points, while the share of those holding the
opposite view stayed the same. Meanwhile, the number of interviewees who thought that economic
costs and benefits were in balance doubled from 8% to 16%. Finally, 12% did not know how to answer
the question or chose not to respond (-3 points).
Attitudes toward the European Union
6
36
24
15
13
6 Very positive
Quite positive
Quite negative
Very negative
Neither positive,nor negative
DK/NA
Q1 (2010). In general, do you have a more positive or negative image of the European Union?
%, Base: all respondents

Flash EB No 318 – Attitudes towards the EU in the UK Analytical report
page 13
Economic costs vs. benefits of being in the EU
33
40
16
12The benefits exceed theeconomic costs
The economic costs exceedthe benefits
They are in balance
DK/NA
Q7. In your opinion, do the economic costs of being in the EU exceed the benefits or do the benefits exceed the costs?
%, Base: all respondents
37
40
8
15
Fl274 (2009)Fl318 (2010)
In fact, respondents aware of the size of the UK’s contribution to the EU were the minority (see 3.1).
An interesting finding was that among those who gave a correct estimate of this figure (in the range of
0%-3% of GNI), the proportion of those who felt that benefits exceeded costs was pretty similar to the
share of respondents who did not (41% vs. 42%). In other words, even when British respondents were
aware that their country’s contribution did not surpass 3% of its GNI, they still were not necessarily
convinced that the benefits exceeded the economic costs. This finding stands in sharp contrast with the
results of the 2009 wave, when 62% of respondents who gave a correct estimate of the UK’s
contribution thought that the benefits exceeded the economic costs.
The groups most inclined to have a negative image of the EU were also more inclined to believe that
the economic costs exceeded the benefits of EU membership: respondents over 54 (48%), those with
the average and low levels of education (44%-45%) and rural residents (44%).
Respondents with high levels of education and full-time students were the most likely to believe that
the benefits exceeded the costs (both 44%). Men were also more liable to perceive a net economic gain
accruing from the UK’s membership (37% vs. 28% of women).
Survey participants who regarded themselves as informed about EU affairs were as likely to say that
the benefits of EU membership outweighed economic costs as to say that this balance of costs and
benefits was negative (both 43%).
(For further details see Annex Table 20.)
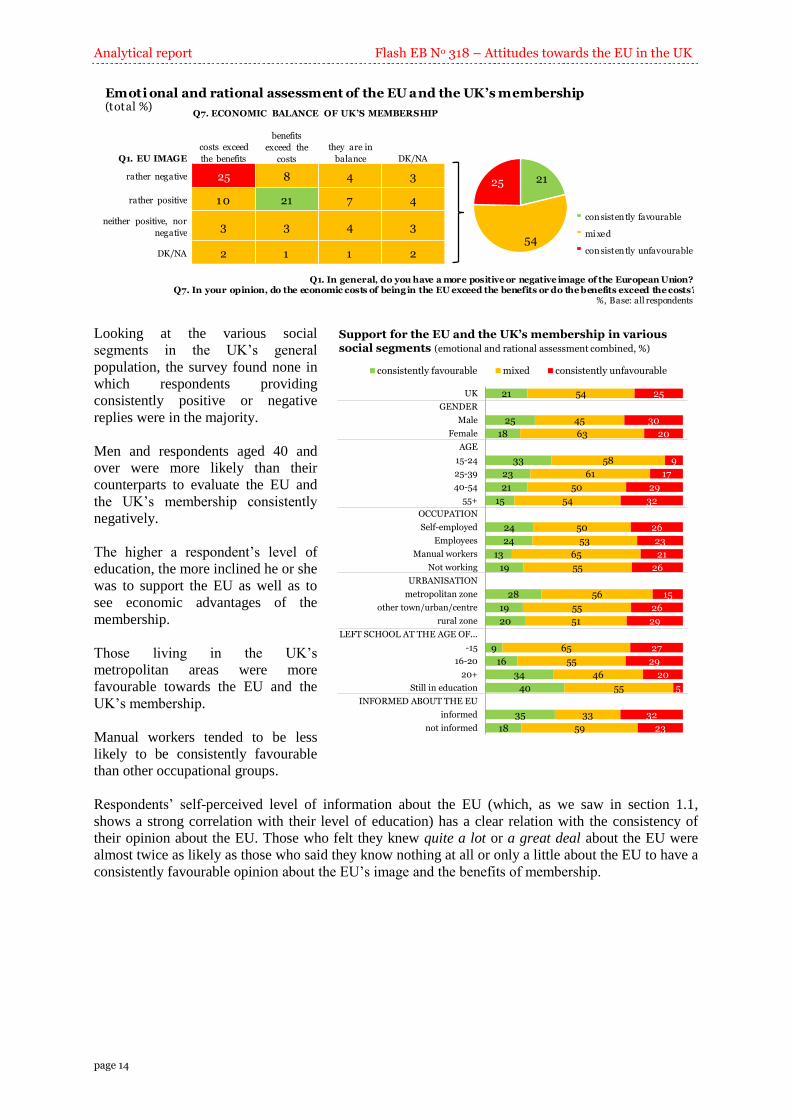
2.3 Emotional and rational assessment of the EU and the UK’s membership The following figure shows the result of a cross-tabulation of the two questions presented in this
chapter to show how many respondents gave consistent answers- meaning that if they had a positive
image of the EU they thought the benefits of EU membership exceeded the economic costs (hereafter
called the “consistently favourable”) and if they had a rather negative image of the EU they thought
that the economic costs exceeded the benefits (hereafter called the “consistently unfavourable”). As
the table shows, a quarter of British respondents were consistently unfavourable vis-à-vis the EU and
their country’s membership, while 21% were consistently favourable.
Analytical report Flash EB No 318 – Attitudes towards the EU in the UK
page 14
Q7. ECONOMIC BALANCE OF UK’S MEMBERSHIP
Q1. EU IMAGE
costs exceed
the benefits
benefits
exceed the
costs
they are in
balance DK/NA
rather negative 25 8 4 3
rather positive 1 0 21 7 4
neither positive, nor
negative3 3 4 3
DK/NA 2 1 1 2
21
54
25
consistently favourable
mi xed
consistently unfavourable
Emoti onal and rational assessment of the EU and the UK’s membership (total %)
Q1. In general, do you have a more positive or negative image of the European Union?Q7. In your opinion, do the economic costs of being in the EU exceed the benefits or do the benefits exceed the costs?
%, Base: all respondents
Looking at the various social
segments in the UK’s general
population, the survey found none in
which respondents providing
consistently positive or negative
replies were in the majority.
Men and respondents aged 40 and
over were more likely than their
counterparts to evaluate the EU and
the UK’s membership consistently
negatively.
The higher a respondent’s level of
education, the more inclined he or she
was to support the EU as well as to
see economic advantages of the
membership.
Those living in the UK’s
metropolitan areas were more
favourable towards the EU and the
UK’s membership.
Manual workers tended to be less
likely to be consistently favourable
than other occupational groups.
Respondents’ self-perceived level of information about the EU (which, as we saw in section 1.1,
shows a strong correlation with their level of education) has a clear relation with the consistency of
their opinion about the EU. Those who felt they knew quite a lot or a great deal about the EU were
almost twice as likely as those who said they know nothing at all or only a little about the EU to have a
consistently favourable opinion about the EU’s image and the benefits of membership.
21
25
18
33
23
21
15
24
24
13
19
28
19
20
9
16
34
40
35
18
54
45
63
58
61
50
54
50
53
65
55
56
55
51
65
55
46
55
33
59
25
30
20
9
17
29
32
26
23
21
26
15
26
29
27
29
20
5
32
23
UK
GENDER
Male
Female
AGE
15-24
25-39
40-54
55+
OCCUPATION
Self-employed
Employees
Manual workers
Not working
URBANISATION
metropolitan zone
other town/urban/centre
rural zone
LEFT SCHOOL AT THE AGE OF...
-15
16-20
20+
Still in education
INFORMED ABOUT THE EU
informed
not informed
consistently favourable mixed consistently unfavourable
Support for the EU and the UK’s membership in various social segments (emotional and rational assessment combined, %)

Flash EB No 318 – Attitudes towards the EU in the UK Analytical report
page 15
3. The UK’s contribution to the EU
The UK contributes more than it directly receives from the EU budget. In
2009 this difference amounted to 0.12% of Gross National Income (GNI).
When asked to estimate the UK’s net contribution to the EU budget, only 9%
of respondents said it was below 3% the country’s GNI. On average,
respondents estimated that the UK transferred, annually, 19% of its GNI to
the EU. Almost 4 in 10 (38%) did not or could not answer.
Politically, respondents were evenly split between those who felt that the UK
has a lot or a fair amount of influence on the way EU laws were made and
those who thought the opposite (both 49%).
This section looks at the public’s perceptions of the UK’s role in: a) financing the EU and b) the EU’s
legislation-making process.
3.1 Financial contribution
The UK pays an annual contribution to the EU on the basis of the rules laid out in the 2007-2013
multi-annual budget framework. In 2007, the UK’s contribution to the EU budget was approximately
0.5% of the UK’s Gross National Income (GNI). The UK has a negative net position in the EU,
meaning that it pays more than it directly receives from the EU budget. In 2009, this difference
amounted to about 0.12% of GNI.2
Public perception of this financial contribution was not even close to reality. 38% of British
respondents said that they simply did not know about the UK’s contribution to the EU budget. 1 in 10
(9%) knew that the UK contributed less than 3% of its GNI (note: 3% of all respondents said their
country did not transfer more than 1% of its GNI to the EU). The average estimated proportion of
the UK’s national income transferred to the EU was 19%; this shows that most citizens do not
seem to understand these figures. Even the most educated segment estimated the UK’s contribution to
the EU budget to be about 12% of GNI.
9
11
15
11
9
8
38
0-3 %
4-5 %'
6-10 %
11-20 %
21-40 %
41-100 %
DK/NA
Q6 (2010). What percentage of the UK's gross national income do you think goes towards the EU budget?Q6 (2009). How much percent of the UK's gross national income do you think goes towards the EU budget?
%, Base: all respondents
Percentage of the UK’s gross national income that goes towards the EU budget
6
8
11
9
9
10
48
0-3 %
4-5 %'
6-10 %
11-20 %
21-40 %
41-100 %
DK/NA
Fl274 (2009)Fl318 (2010)
2 Both GNI figures are available at: http://ec.europa.eu/budget/library/publications/fin_reports/fin_report_09_data.xls the last two rows show
the net contribution by Member State

Analytical report Flash EB No 318 – Attitudes towards the EU in the UK
page 16
Comparing these results with those of the previous wave, the proportion of respondents giving an
estimate close to the real percentage (0%-3%) rose by three percentage points, while the proportion of
those who did not give an answer fell by ten points.
Men (14%), respondents between 25-54 years of age (13%), the highly educated (16%), residents of
large cities (18%) and the self-employed (20%) were the most likely within their respective segment to
give a correct estimate.
The UK’s contribution was overestimated to a greater extent by the groups that expressed consistently
unfavourable views about the EU and the UK’s membership.
About one in seven (15%) of those who felt informed about EU matters thought that the UK’s
contribution was below 3% of GNI.
(For further details see Annex Table 19.)
3.2 Influence on EU legislation Through various established channels, all EU Member States participate in the decision-making
processes that discuss future European legislation. The British public was divided in its perceptions of
their country’s influence on EU laws: roughly half (49%) of respondents felt that the UK had a lot
(10%) or a fair amount of influence (39%) on the way EU laws were made. The same proportion,
on the other hand, felt that the UK had little (31%) or very little (18%) influence.
Compared to the results from May 2009, the share of those who believed that the UK had an impact on
European legislation grew by five percentage points (from 44% to 49%).
Influence of the UK government on EU legislation
10
39
31
18
2
A lot
A fair amount
Little
Very little
DK/NA
Q8. According to you, how much say has the UK government in the way that EU laws are made ...? %, Base: all respondents
11
33
28
23
5
Fl274 (2009)Fl318 (2010)
Those who were most content with the UK’s role in EU decision-making (stating that it has a lot or a
fair amount of say in how EU laws are formulated) were full-time students (75%), the youngest
respondents (15-24 years: 69%), the most educated (55%) and those living in metropolitan zones
(54%).
A share of 56% of those who felt informed about EU matters thought that the UK had at least a fair
amount of influence on how EU laws were made (vs. 48% of those who did not feel informed about
the EU). Finally, those with consistently positive views about the EU were almost four times as likely
to agree that the UK has a fair share in shaping legislation (79%) as those who were consistently
sceptical (24%).
(For more details see Annex Table 21.)
The majority of respondents (59%) agreed that if the UK government always had a say in the way
EU laws were made they would feel more positive about the UK’s EU membership. 17% would

Flash EB No 318 – Attitudes towards the EU in the UK Analytical report
page 17
not change their opinion about membership and a bit more than 2 in 10 (22%) would be even more
critical about the UK’s participation in the EU. Results have changed little since last year.
If the UK government always had a say in the way EU laws are made, that would make you feel ...
5922
17
2More positive about theUK's EU membership
Less positive about theUK's EU membership
Would not change, feel thesame way
DK/NA
Q9. If you knew the UK government always had a say in the way EU laws were made, that would make you feel:%, Base: all respondents
62
22
142
Fl274 (2009)Fl318 (2010)
As Annex Table 22 shows, the majority in each of the various segments stated that their opinion would
change for the better upon learning that the UK was involved in all EU decisions.
Even so, the other replies revealed some intriguing details. More than a quarter of the least educated
(36%), manual workers (34%) and of the oldest respondents (aged 55 or over: 28%) claimed that they
would become more critical towards the EU if the UK was always involved in the EU’s decision-
making processes.
Those who claimed to be informed about EU matters were more likely to indicate that their opinion
would not change in light of this information (22% for “informed” vs. 16% for “uniformed”;
presumably because they were already more aware of the multilateral nature of EU decision-making),
but they were more likely to become more critical (29% vs. 21%) and less likely to change their views
in a positive direction (48% vs. 62%).
Another important detail is that those who expressed consistently unfavourable opinions towards the
EU and the UK’s EU membership were slightly more likely to become more positive about the UK’s
EU membership if the UK always had a say in the formulation of EU laws (40%) than to become more
negative about it (36%).

Analytical report Flash EB No 318 – Attitudes towards the EU in the UK
page 18
4. Priorities, benefits and impact of EU policies
Most respondents acknowledged that the EU had a role in tackling some of
the most pressing international issues.
Clear majorities considered all eight EU initiatives presented to them
important.
More than half of respondents (54%) said that the fact that these initiatives
had been created and developed by the European Union made them feel
more positive about the European Union.
Most interviewees would care if any of the listed benefits were lost.
This section discusses UK respondents’ understanding of some specific EU policy areas and the EU’s
role in combating international problems.
4.1 The EU’s role in certain policy areas Most British citizens acknowledged that the EU has a role in tackling some of the most pressing
issues – each of which have clear international dimensions.
The most widely acknowledged roles of
the European Union were the protection
of human rights (85% felt that the EU
had a role), tackling cross-border crime
(80%), countering global terrorism
(76%) and fighting climate change
(76%). About 7 in 10 (71%) survey
participants thought the EU had a role to
play in reducing global poverty, in
regulating financial markets (70%) and
in economic governance (69%). Finally,
more than 6 in 10 (62%) respondents
felt the EU had a role in guaranteeing
the security of energy supplies.
Across all socio-demographic segments,
a majority of respondents believed that
the EU has a role in dealing with each
of these key problems. Even among those with consistently unfavourable views of the EU and the
UK’s membership in it, a clear majority felt that the Union was needed to address seven out of eight
issues - the exception being the fight against global poverty.
(For further details see Annex Table 30.)
4.2 Awareness of the EU’s benefits
Looking at the perceptions of specific benefits citizens may attribute to the EU, most Britons (87%)
confirmed that EU citizens have the right to freely move across Member States. Fewer than 1 in
10 respondents (8%) believed that this was not the case. At least three-quarters of respondents (78%)
in each socio-demographic segment thought that free movement of persons across Member States was
now a reality in the EU.
85
80
76
76
71
70
69
62
Protecting human rights
Tackling cross-border crime
Global terrorism
Tackling climate change
Global poverty
Regulating financial markets
Economic governance
The security of energy supplies
Q12. Which of the following issues do you feel the EU has a role in?% of ”The EU has a role” shown
Base: all respondents
EU has a role in tackling various issues

Flash EB No 318 – Attitudes towards the EU in the UK Analytical report
page 19
87
75
73
58
42
23
8
15
21
28
41
65
4
11
6
14
17
12
All EU citizens have the right to travel to, or studyin, another EU country
The EU budget is larger than the UK's
The EU has very strict food-safety standards
Mobile phone charges (roaming charges, prices, etc.)have decreased for anyone travelling within the EU
There is an EU tax
The EU has a standing army
True False DK/NA
Q5. I will now list a series of statements. For each one, please tell me if you think they are true or false?
%, Base: all respondents
True or false?
Three-quarters of British respondents believed that the EU budget was larger than the UK’s. (In
fact the UK’s budget is almost six times larger than the EU’s.3) About 1 in 7 (15%) survey participants
were aware of this, and 1 in 10 (11%) said they did not know. Clear majorities in all socio-
demographic groups gave an incorrect answer.
Almost three-quarters (73%) of Britons believed that the EU had very strict food safety standards.
58% of the British public was aware that an EU law introduced in the summer of 2007 capped cross-
border roaming tariffs in the EU.
42% falsely believed in the existence of an EU tax, while a similar share (41%) gave the right answer.
Men, the most educated, the self-employed and residents of metropolitan areas were more likely to
know that the EU was not financed through such a tax.
Britons were better informed when it came to the military characteristics of the EU. Almost two-thirds
(65%) were aware that the EU had no standing army: roughly a quarter (23%) incorrectly believed
that such an army existed. (For further details see Annex Tables 13-18.)
4.3 Awareness of EU initiatives
The survey asked respondents if they
had heard of nine core EU initiatives.
More than 6 in 10 (62%) respondents
were aware of the new EU pet
passport, which allows pets to travel
more easily between member countries
without undergoing quarantine.
Women, the most educated, citizens
from rural areas and the self-employed
were more likely to be aware of the pet
passport than their respective socio-
demographic counterparts.
About 6 in 10 (61%) respondents knew
about the existence of the European
Health Insurance Card that allows
3 The EU budget for 2010 amounts to 141,5 billion EUR, for details visit:
http://ec.europa.eu/budget/documents/2010_en.htm?go=t1_0#table-1_0 ; while the UK treasury’s planned budget for 2010-2011 amounts to
697 billion £, approx. 823 billion EUR, for details visit: http://www.hm-treasury.gov.uk/junebudget_diagrams.htm
62
61
47
32
28
27
23
22
14
The pet passport
The European Health Insurance Card
The Blue Flag Guide
The Air Passenger Rights Regulation
The hedge fund proposal
The European Arrest Warrant
Guidelines for pay in financialinstitutions
The Bathing Water Report
The citizens' initiative for launching EU-level legislation
Q2. Have you heard of any of the following?%, Base: all respondents
Awareness of initiatives

Analytical report Flash EB No 318 – Attitudes towards the EU in the UK
page 20
citizens to receive medical treatment in any other EU country. In comparison to May 2009, awareness
has increased by seven percentage points. Awareness of this card was higher among the most
educated, the self-employed, women and 40-54 year-olds.
The Blue Flag Guide, which is an eco-label for beaches in Europe and beyond was familiar to 47% of
interviewees (+6 percentage points since 2009). The Blue Flag Guide was more widely known among
respondents who were older than 39, the most educated, manual workers and the self-employed.
Roughly a third of the British public (32%) knew about the Air Passenger Rights Regulation that
details what an airline owes you in case of cancellation, denied boarding or severe delay. Men, the
highly educated and respondents from rural areas were more likely to be aware of this EU regulation.
Roughly 3 in 10 (28%) Britons had heard of the hedge fund proposal providing harmonized standards
and greater transparency on alternative investment fund management. Men, respondents older than 39,
the highly educated, residents from rural areas and the self-employed showed higher levels of
awareness concerning this proposal.
Somewhat more than a quarter (27%) of respondents reported having heard of the European Arrest
Warrant (+9 points since 2009). Men, respondents aged between 40-54, the most educated, large city
residents, the self-employed were more likely than their respective counterparts to be familiar with the
term.
A little less than a quarter (23%) have heard of guidelines for pay in financial institutions. Men, 25-
54 year-olds and manual workers were more likely to be aware of the guideline.
In the current survey 22% of Britons said they had heard of the Bathing Water Report (that informs
citizens about the safety and cleanliness standards of Europe’s beaches + 6 points since 2009). Men,
respondents older than 39, highly educated respondents, rural residents and manual workers were more
likely to be aware of this report.
Finally, the citizens’ initiative for launching EU legislation was the least widely known of all nine
listed EU initiatives; only 14% said they had heard of it. The youngest respondents and full-time
students more often said they had heard about the existence of this initiative that enables a million
signatories from a number of EU countries to oblige the EU to make a legislative proposal.
(For further details see Annex Table 2.)
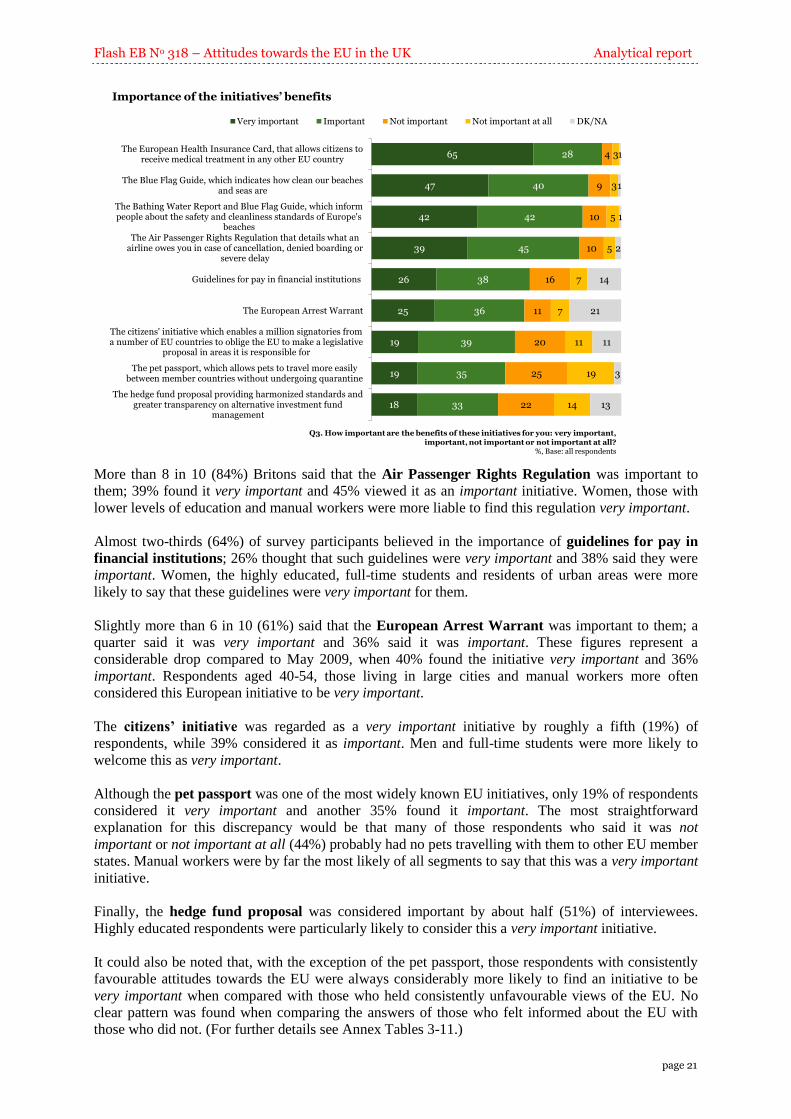
4.4 Importance of the initiatives’ benefits
Next, respondents were asked about the importance of these initiatives for them. Overall, the majority
of the UK public rated the EU initiatives in each of the eight areas as important or very important. This
was especially true for the European Health Insurance Card: 65% of UK respondents felt that this
was a very important initiative for them, and a further 28% stated that they considered it important.
Women, the youngest respondents, full-time students and manual workers were particularly inclined to
consider this card very important.
The EU-coordinated beach water quality monitoring – the Bathing Water Report and the Blue Flag
Guide – was considered to be very important by 42% of respondents and important by a further 42%.
Similar results were found when asking respondents about the importance of the Blue Flag Guide
only: 47% said this initiative was very important and another 40% said it was important. Women, the
oldest respondents, those with lower levels of education and manual workers were more likely to say
that these two initiatives were very important for them.
Flash EB No 318 – Attitudes towards the EU in the UK Analytical report
page 21
65
47
42
39
26
25
19
19
18
28
40
42
45
38
36
39
35
33
4
9
10
10
16
11
20
25
22
3
3
5
5
7
7
11
19
14
1
1
1
2
14
21
11
3
13
The European Health Insurance Card, that allows citizens toreceive medical treatment in any other EU country
The Blue Flag Guide, which indicates how clean our beachesand seas are
The Bathing Water Report and Blue Flag Guide, which informpeople about the safety and cleanliness standards of Europe's
beachesThe Air Passenger Rights Regulation that details what an
airline owes you in case of cancellation, denied boarding orsevere delay
Guidelines for pay in financial institutions
The European Arrest Warrant
The citizens' initiative which enables a million signatories froma number of EU countries to oblige the EU to make a legislative
proposal in areas it is responsible for
The pet passport, which allows pets to travel more easilybetween member countries without undergoing quarantine
The hedge fund proposal providing harmonized standards andgreater transparency on alternative investment fund
management
Very important Important Not important Not important at all DK/NA
Q3. How important are the benefits of these initiatives for you: very important, important, not important or not important at all?
%, Base: all respondents
Importance of the initiatives’ benefits
More than 8 in 10 (84%) Britons said that the Air Passenger Rights Regulation was important to
them; 39% found it very important and 45% viewed it as an important initiative. Women, those with
lower levels of education and manual workers were more liable to find this regulation very important.
Almost two-thirds (64%) of survey participants believed in the importance of guidelines for pay in
financial institutions; 26% thought that such guidelines were very important and 38% said they were
important. Women, the highly educated, full-time students and residents of urban areas were more
likely to say that these guidelines were very important for them.
Slightly more than 6 in 10 (61%) said that the European Arrest Warrant was important to them; a
quarter said it was very important and 36% said it was important. These figures represent a
considerable drop compared to May 2009, when 40% found the initiative very important and 36%
important. Respondents aged 40-54, those living in large cities and manual workers more often
considered this European initiative to be very important.
The citizens’ initiative was regarded as a very important initiative by roughly a fifth (19%) of
respondents, while 39% considered it as important. Men and full-time students were more likely to
welcome this as very important.
Although the pet passport was one of the most widely known EU initiatives, only 19% of respondents
considered it very important and another 35% found it important. The most straightforward
explanation for this discrepancy would be that many of those respondents who said it was not
important or not important at all (44%) probably had no pets travelling with them to other EU member
states. Manual workers were by far the most likely of all segments to say that this was a very important
initiative.
Finally, the hedge fund proposal was considered important by about half (51%) of interviewees.
Highly educated respondents were particularly likely to consider this a very important initiative.
It could also be noted that, with the exception of the pet passport, those respondents with consistently
favourable attitudes towards the EU were always considerably more likely to find an initiative to be
very important when compared with those who held consistently unfavourable views of the EU. No
clear pattern was found when comparing the answers of those who felt informed about the EU with
those who did not. (For further details see Annex Tables 3-11.)

Analytical report Flash EB No 318 – Attitudes towards the EU in the UK
page 22
4.5 Impact of EU initiatives on attitudes towards the EU
More than half of respondents (54%) said
that the EU’s role in initiating and
developing the above-mentioned initiative
made them feel more positive about the EU,
while almost a quarter (23%) reported that
they did not. About a fifth (19%) said that
despite the nine initiatives mentioned they
still thought the same way about the EU.
The survey found considerable differences
between the various socio-demographic
groups. Women (56%), the youngest
respondents (15-24 year-olds; 77%), the
highly educated (62%), full-time students
(83%), respondents from metropolitan areas
(63%) and employees (59%) were more
likely to feel more positively about the EU after having heard about several EU initiatives.
Furthermore, those who did not feel informed about EU matters were slightly more inclined than
informed respondents to be positively influenced (55% vs. 50%). (For further details see Annex Table
12.)
4.6 Benefits of EU membership
The survey tested six areas where citizens might see a benefit from the UK’s membership in the EU:
prosecution of criminals, the Single Market, the environment, leverage in global trade negotiations, the
regulation of financial markets and working conditions.
In all six instances, a majority of respondents agreed that each of these might be a benefit of EU
membership. Seven in 10 Britons agreed that criminals can no longer escape prosecution by moving
to another EU member state (29% strongly agreed, 41% agreed). A similar number (69%) agreed that
the UK benefited from the single market. A bit more than 6 in 10 (62%) thought that being a member
of the EU meant a cleaner environment. Almost 6 in 10 (57%) felt that the EU gave the UK a greater
say in global trade talks, while 55% were convinced that EU membership brought improvements in
working conditions (+6 points since 2009). Finally, 54% believed that thanks to EU membership
financial markets could be regulated more effectively.
29
18
14
13
14
11
41
51
48
44
41
43
18
15
26
24
26
26
9
7
8
10
13
11
4
10
5
9
5
8
Criminals can no longer escape prosecution bymoving to another EU member state
UK consumers benefit from the free movement ofgoods resulting from the European Single Market
There is a cleaner environment
The UK has more say in global trade negotiations
There are improved working conditions in the UK
We can regulate financial markets more effectively
Strongly agree Agree Disagree Strongly disagree DK/NA
Q10. Do you agree or disagree with the following statements? Being part of the EU means that ...?%, Base: all respondents
Being part of the EU means that ...
EU initiatives make you feel ...
54
23
19
3More positive about theEuropean Union
Less positive about theEuropean Union
The same way about theEuropean Union
DK/NA
Q4. Does the fact that these initiatives have been initiated and developed by the European Union make you feel...
%, Base: all respondents
Flash EB No 318 – Attitudes towards the EU in the UK Analytical report
page 23
Women, the highly educated, full-time students, residents of metropolitan areas and the self-employed
were the most likely within their respective segments to agree that criminals can no longer escape
prosecution by moving to another EU member state.
Benefits to the consumer due to the European Single Market were clearly seen by the majority in
each socio-demographic and attitudinal segment; even those who otherwise had a consistently
unfavourable opinion on the EU and the UK’s membership mostly agreed (51%). The perception that
consumers were benefiting was exceptionally high among the self-employed, full-time students, the
most educated and metropolitan residents.
Improved working conditions in the UK were seen as a benefit of EU membership by high numbers
of full-time students, young respondents, the self-employed, the highly educated and residents of large
cities.
Respondents aged 25-39, the highly educated and large city residents were more likely than their
socio-demographic counterparts to expect environmental benefits.
The opinion that EU membership would benefit the UK’s role in global trade negotiations was
higher among full-time students, 15-24 year-olds, the highly-educated, residents of metropolitan areas,
the self-employed and employees.
Women, the youngest respondents, full-time students, the highly educated, the self-employed and
showed the highest levels of agreement in their respective segments concerning the statement that
being member of the EU would allow for a better regulation of financial markets.
Analytical report Flash EB No 318 – Attitudes towards the EU in the UK
page 24
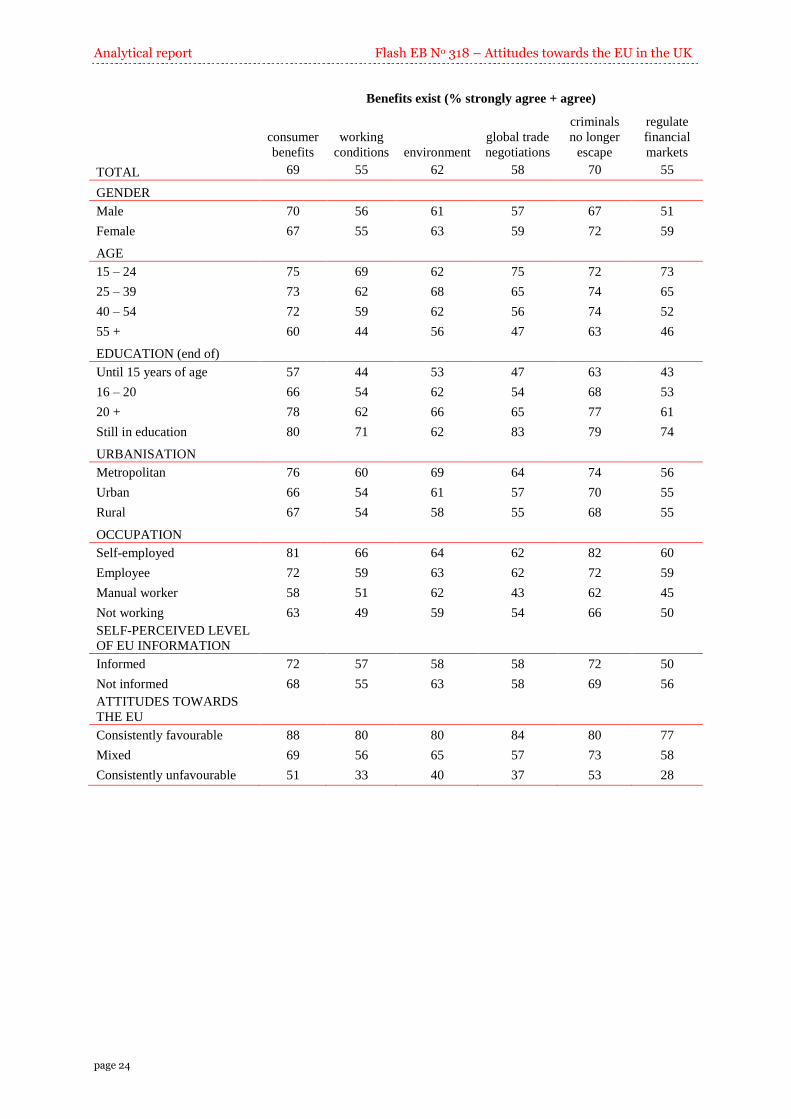
Benefits exist (% strongly agree + agree)
consumer
benefits
working
conditions environment
global trade
negotiations
criminals
no longer
escape
regulate
financial
markets
TOTAL 69 55 62 58 70 55
GENDER
Male 70 56 61 57 67 51
Female 67 55 63 59 72 59
AGE
15 – 24 75 69 62 75 72 73
25 – 39 73 62 68 65 74 65
40 – 54 72 59 62 56 74 52
55 + 60 44 56 47 63 46
EDUCATION (end of)
Until 15 years of age 57 44 53 47 63 43
16 – 20 66 54 62 54 68 53
20 + 78 62 66 65 77 61
Still in education 80 71 62 83 79 74
URBANISATION
Metropolitan 76 60 69 64 74 56
Urban 66 54 61 57 70 55
Rural 67 54 58 55 68 55
OCCUPATION
Self-employed 81 66 64 62 82 60
Employee 72 59 63 62 72 59
Manual worker 58 51 62 43 62 45
Not working 63 49 59 54 66 50
SELF-PERCEIVED LEVEL
OF EU INFORMATION
Informed 72 57 58 58 72 50
Not informed 68 55 63 58 69 56
ATTITUDES TOWARDS
THE EU
Consistently favourable 88 80 80 84 80 77
Mixed 69 56 65 57 73 58
Consistently unfavourable 51 33 40 37 53 28

Flash EB No 318 – Attitudes towards the EU in the UK Analytical report
page 25
4.7 Willingness to accept a loss of benefits
Most interviewees would care (at least a bit) if any of the above-listed benefits were lost, e.g. by
not being a member of the EU. Over a third (35%) of interviewees would care greatly if any of these
benefits were lost, and 46% would care a bit. A sixth (17%) or respondents would not mind losing
these benefits if the UK left the EU. These numbers have been quite stable since May 2009.
If the UK was not in the EU ...
35
46
17
3
I would care greatly if we lost oneor more of these benefits
I would care a bit if we lost oneor more of these benefits
I wouldn't care if we lost any ofthese benefits
DK/NA
Q11. If we were not in the EU and were unable to secure a free-trade agreement with it, which of the following best describes your opinion?
%, Base: all respondents
36
45
16
3
Fl274 (2009)Fl318 (2010)
Large majorities across all attitudinal and socio-demographic segments would care at least a bit if any
of the listed benefits were lost, should the UK no longer be a member of the EU. Even among those
who were consistently critical of the EU and the UK’s membership, 61% would care at least a bit if
these benefits were lost. Nonetheless, the proportion of those who would greatly care if these
advantages disappeared varied significantly across the various socio-demographic segments: the
highly educated; full-time students and metropolitan residents cared most about losing these benefits.
The survey discovered a very sharp difference across the groups created according to the respondents’
stance towards the EU in general; roughly two-thirds (64%) of those who were consistently favourable
of the EU and the UK’s membership would greatly care if these benefits were lost, a view shared by
only 13% of those who expressed consistently critical opinions.
(For further details see Annex Table 29.)

Analytical report Flash EB No 318 – Attitudes towards the EU in the UK
page 26
5. Political parties and European elections
55% of British respondents felt that European issues had not been important in the last
general election in May 2010.
Equal shares of respondents felt that the Conservatives or Labour, respectively, best
represented their views on Europe (24% and 23%).
5.1 Importance of European issues at last general election
When asked about how important European issues had been in the last general election (May 2010),
41% of Britons said Europe had been an important topic (9% “very important” and 32% “quite
important”. A slim majority (55%), however, said that European topics had not been key issues during
the election campaign. More precisely, 32% said Europe had not been an important issue, while 23%
even said it had been irrelevant.
Women, full-time students, the youngest
respondents, respondents from urban areas and non-
working respondents were more likely to state that
European issues had played an important role during
the last general election. Respondents with
consistently favourable attitudes towards the
European project were considerably more inclined to
feel that Europe had been a central issue (50% vs.
33% of those with consistently unfavourable views
of the EU).
(For further details see Annex Table 40.)
5.2 Representation of views on the EU
Roughly a quarter (24%) of British
respondents selected the Conservatives
as the party that most closely
represented their views on the EU. A
similar share (23%) felt that their views
on European issues were most in line
with those of the Labour Party.
The Liberal Democrats were mentioned
by 13% of respondents, followed by the
United Kingdom Independence Party
(8%). All other parties were mentioned
by not more than 2% of the British
public: the British National Party, the
Scottish National Party and Plaid Cymru.
Almost a quarter (24%) chose not to
answer this question.
Men, respondents with low and average
levels of education, rural residents and the self-employed as well as those who regarded themselves as
informed about Europe were more likely to cite the Tories as most closely representative of their views
Importance of European issues at the last general election in May 2010
9
32
32
23
5
Very
Quite
Not very
Irrelevant
DK/NA
Q20. How important were European issues at the last general election in May 2010?
%, Base: all respondents
24
23
13
8
2
2
1
5
24
Conservative
Labour
Liberal Democrat
United Kingdom Independence Party
British National Party
Scottish National Party
Plaid Cymru
Other
DK/NA
Q19. Which of the main parties most closely represents your views on the European Union?
%, Base: all respondents
Political party that most closely represents respondents’ views on the EU
Flash EB No 318 – Attitudes towards the EU in the UK Analytical report
page 27
on the EU. In addition, EU sceptics were almost twice as likely as EU supporters to name the
Conservative Party.
The youngest respondents, full-time students, large city dwellers, employees and manual workers were
more inclined than their counterparts to conclude that Labour was the party that best represented their
views on the EU.4 Interviewees who were consistently supportive of the EU were more than four times
as likely as EU sceptics to choose the Labour Party.
The Liberal Democrats’ views of Europe were particularly popular among women, the highly
educated, full-time students, citizens from metropolitan and urban areas, the self-employed, those who
were informed about the EU as well as among consistent EU supporters.
The United Kingdom Independence Party, which as the name suggests campaigns for the UK
leaving the EU, was on average most often named as the party that most closely represented their
views on the EU by the oldest respondents (aged 40 and over), manual workers, those who considered
themselves informed about the EU, men, urban and rural residents. Unsurprisingly, those with
consistently unfavourable views of the EU were almost three times as likely to name the UKIP as the
average respondent.
The youngest respondents as well as manual workers were more likely to say that the British National
Party most closely represented their attitudes towards the EU.
Finally, at least a quarter of the following groups did not know which party most closely represented
their views on Europe or simply did not want to answer this question: women, full-time students,
employees, those not informed about the EU, respondents aged 15-39 years and respondents from
rural areas.
(For further details see Annex Table 39.)
4 It should be noted that manual workers were as likely to mention the Conservatives as the party that best represented their views on Europe.

Flash EB Series #318
Attitudes towards the EU in the United Kingdom
Annex tables and
survey details
THE GALLUP ORGANIZATION

Flash EB No 318 – Attitudes towards the EU in the UK Annex
page 29
I. Annex tables Table 1. Attitudes toward the European Union .................................................................................... 31
Table 1. Attitudes toward the European Union .................................................................................... 31
Table 2. Awareness of initiatives ......................................................................................................... 32
Table 3. Importance of the initiatives’ benefits: The European Health Insurance Card....................... 33
Table 4. Importance of the initiatives’ benefits: The Bathing Water Report and Blue Flag Guide
(about safety and cleanliness standards of Europe's beaches) .............................................................. 34
Table 5. Importance of the initiatives’ benefits: The Blue Flag Guide (about cleanliness of UK’s
beaches and seas) .................................................................................................................................. 35
Table 6. Importance of the initiatives’ benefits: The European Arrest Warrant .................................. 36
Table 7. Importance of the initiatives’ benefits: The Air Passenger Rights Regulation ...................... 37
Table 8. Importance of the initiatives’ benefits: The pet passport ....................................................... 38
Table 9. Importance of the initiatives’ benefits: The hedge fund proposal .......................................... 39
Table 10. Importance of the initiatives’ benefits: Guidelines for pay in financial institutions ............ 40
Table 11. Importance of the initiatives’ benefits: The citizens' initiative ............................................. 41
Table 12. EU initiatives make you feel ... ............................................................................................ 42
Table 13. True or false: All EU citizens have the right to travel to, or study in, another EU
country .................................................................................................................................................. 43
Table 14. True or false: Mobile phone charges have decreased for anyone travelling within the
EU ......................................................................................................................................................... 44
Table 15. True or false: The EU has very strict food-safety standards ................................................ 45
Table 16. True or false: The EU has a standing army .......................................................................... 46
Table 17. True or false: There is an EU tax .......................................................................................... 47
Table 18. True or false: The EU budget is larger than the UK's .......................................................... 48
Table 19. Percentage of the UK’s gross national income that goes towards the EU budget ................ 49
Table 20. Economic costs vs. benefits of being in the EU ................................................................... 50
Table 21. Influence of the UK government on EU legislation ............................................................. 51
Table 22. If the UK government had influence on all EU legislation, that would make you feel ... .... 52
Table 23. Being part of the EU means that: UK consumers benefit from the free movement of
goods resulting from the European Single Market ............................................................................... 53
Table 24. Being part of the EU means that: There are improved working conditions in the UK ........ 54
Table 25. Being part of the EU means that: There is a cleaner environment ....................................... 55
Table 26. Being part of the EU means that: The UK has more say in global trade negotiations ......... 56
Table 27. Being part of the EU means that: Criminals can no longer escape prosecution by
moving to another EU member state .................................................................................................... 57
Table 28. Being part of the EU means that: We can regulate financial markets more effectively ....... 58
Table 29. If the UK was not in the EU ... ............................................................................................ 59
Table 30. EU has a role in tackling various issues ............................................................................... 60
Table 31. Perception of the British television ...................................................................................... 61
Table 32. Perception of the British radio .............................................................................................. 62
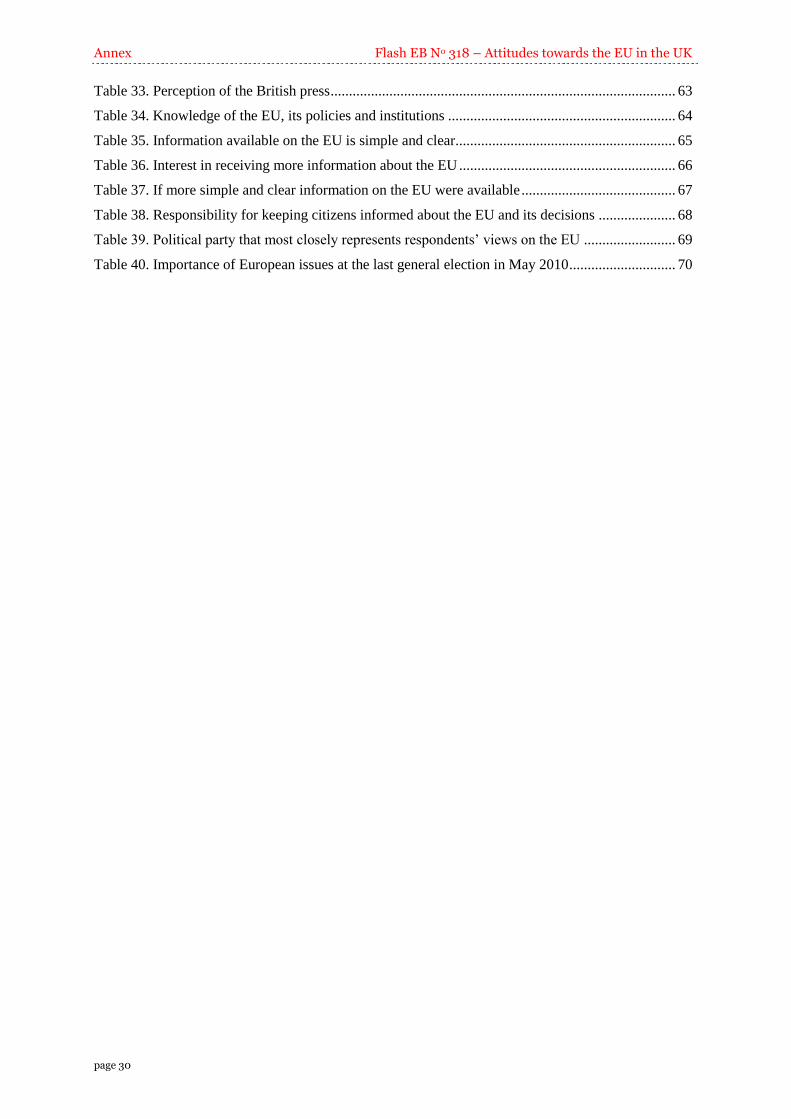
Annex Flash EB No 318 – Attitudes towards the EU in the UK
page 30
Table 33. Perception of the British press .............................................................................................. 63
Table 34. Knowledge of the EU, its policies and institutions .............................................................. 64
Table 35. Information available on the EU is simple and clear ............................................................ 65
Table 36. Interest in receiving more information about the EU ........................................................... 66
Table 37. If more simple and clear information on the EU were available .......................................... 67
Table 38. Responsibility for keeping citizens informed about the EU and its decisions ..................... 68
Table 39. Political party that most closely represents respondents’ views on the EU ......................... 69
Table 40. Importance of European issues at the last general election in May 2010 ............................. 70
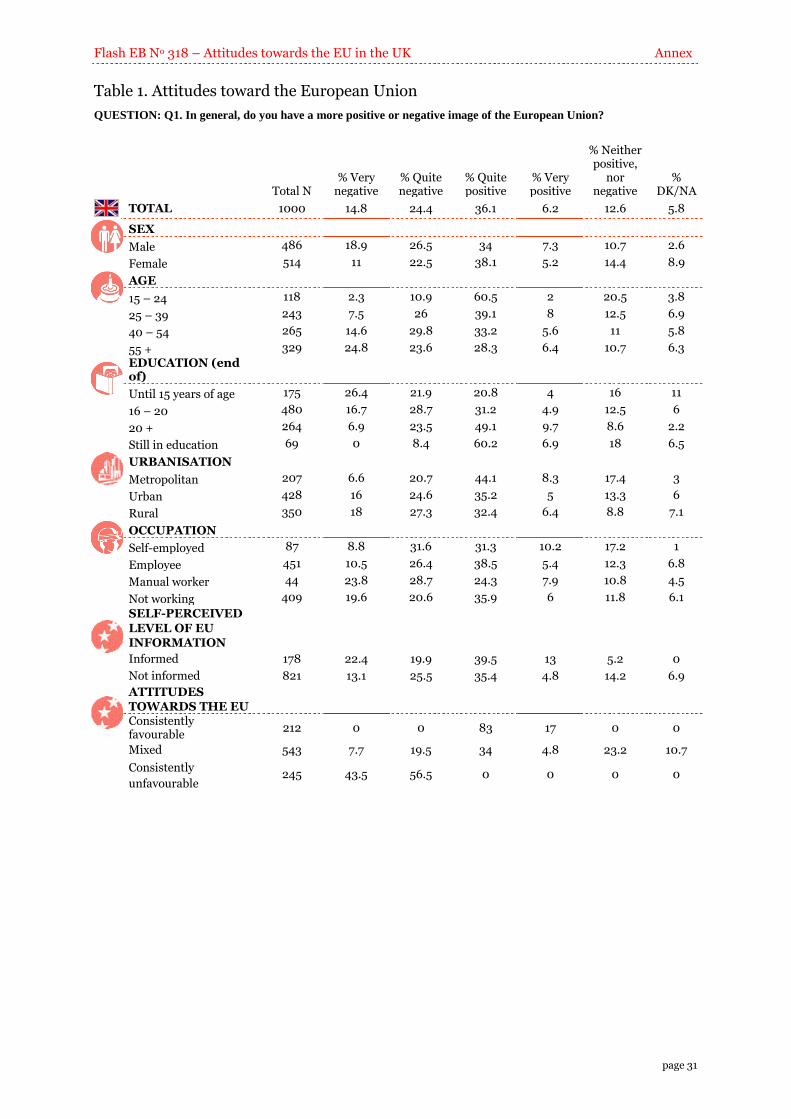
Flash EB No 318 – Attitudes towards the EU in the UK Annex
page 31
Table 1. Attitudes toward the European Union
QUESTION: Q1. In general, do you have a more positive or negative image of the European Union?
Total N % Very
negative % Quite negative
% Quite positive
% Very positive
% Neither positive,
nor negative
% DK/NA
TOTAL 1000 14.8 24.4 36.1 6.2 12.6 5.8
SEX
Male 486 18.9 26.5 34 7.3 10.7 2.6
Female 514 11 22.5 38.1 5.2 14.4 8.9
AGE
15 – 24 118 2.3 10.9 60.5 2 20.5 3.8
25 – 39 243 7.5 26 39.1 8 12.5 6.9
40 – 54 265 14.6 29.8 33.2 5.6 11 5.8
55 + 329 24.8 23.6 28.3 6.4 10.7 6.3
EDUCATION (end of)
Until 15 years of age 175 26.4 21.9 20.8 4 16 11
16 – 20 480 16.7 28.7 31.2 4.9 12.5 6
20 + 264 6.9 23.5 49.1 9.7 8.6 2.2
Still in education 69 0 8.4 60.2 6.9 18 6.5
URBANISATION
Metropolitan 207 6.6 20.7 44.1 8.3 17.4 3
Urban 428 16 24.6 35.2 5 13.3 6
Rural 350 18 27.3 32.4 6.4 8.8 7.1
OCCUPATION
Self-employed 87 8.8 31.6 31.3 10.2 17.2 1
Employee 451 10.5 26.4 38.5 5.4 12.3 6.8
Manual worker 44 23.8 28.7 24.3 7.9 10.8 4.5
Not working 409 19.6 20.6 35.9 6 11.8 6.1
SELF-PERCEIVED
LEVEL OF EU INFORMATION
Informed 178 22.4 19.9 39.5 13 5.2 0
Not informed 821 13.1 25.5 35.4 4.8 14.2 6.9
ATTITUDES TOWARDS THE EU
Consistently favourable
212 0 0 83 17 0 0
Mixed 543 7.7 19.5 34 4.8 23.2 10.7
Consistently
unfavourable 245 43.5 56.5 0 0 0 0

Annex Flash EB No 318 – Attitudes towards the EU in the UK
page 32
Table 2. Awareness of initiatives QUESTION: Q2_A-I. Have you heard of any of the following?
% of “Yes” shown
To
tal
N
Th
e E
uro
pea
n H
ealt
h
Insu
ran
ce C
ard
Th
e B
ath
ing
Wa
ter
Rep
ort
Th
e B
lue
Fla
g G
uid
e
Th
e E
uro
pea
n A
rres
t W
arr
an
t
Th
e A
ir P
ass
eng
er
Rig
hts
Reg
ula
tio
n
Th
e p
et p
ass
po
rt
Th
e h
edg
e fu
nd
p
rop
osa
l
Gu
idel
ines
fo
r p
ay
in
fi
na
nci
al
inst
itu
tio
ns
Th
e ci
tize
ns'
in
itia
tiv
e fo
r la
un
chin
g E
U-l
evel
le
gis
lati
on
TOTAL 1000 61 22.3 46.8 26.8 32.1 61.6 28.3 22.5 14.3
SEX
Male 486 55.8 24.6 47.6 34.4 33.9 59 31.3 24.5 13.6
Female 514 66 20.2 46.1 19.6 30.5 64 25.4 20.7 14.9
AGE
15 – 24 118 57.8 3.8 14.4 18.9 18.5 35.5 19 14.4 18.2
25 – 39 243 57.3 18.7 34.8 21.1 33.2 64.5 24.9 27.4 14.3
40 – 54 265 66.3 27.7 57.6 32.5 33.8 67.7 28.3 25.1 12.8
55 + 329 60.3 25.7 55.7 28.5 35.3 61.8 30.7 18.7 13.5
EDUCATION (end of)
Until 15 years of age 175 46.9 18.6 46.9 22.1 27.3 58.4 20.4 17.6 11.4
16 – 20 480 60.1 21.5 46 20.9 31.3 60.9 28.6 23.5 15.2
20 + 264 72.9 29.6 57.4 40.1 40.5 71.9 35.3 24.3 12.7
Still in education 69 63 13.4 16 29.4 20.2 39 20.4 21.2 21
URBANISATION
Metropolitan 207 62.6 21.1 41.4 32.6 29.7 55.7 27.6 22.3 13.9
Urban 428 63.5 19.9 47.1 25.5 30.6 59.9 26.4 24.7 16.4
Rural 350 59.1 26.5 50.3 25.6 36.2 68 31.9 20.8 11.8
OCCUPATION
Self-employed 87 68.8 20.4 53 40.5 33 70.6 42.4 26.4 6.7
Employee 451 63.9 21.3 45.3 23 29.2 64.2 25.9 23.5 13.8
Manual worker 44 42.4 28.8 54.7 20.9 30.1 65.7 37.7 37 9.6
Not working 409 59.2 23.6 46.6 28.6 35.6 56.5 27.3 19.3 17.1
SELF-PERCEIVED LEVEL OF EU
INFORMATION
Informed 178 77.8 44.6 66.6 55.6 54.7 80.9 44.4 38.8 23.4
Not informed 821 57.5 17.5 42.6 20.5 27.1 57.4 24.8 19 12.2
ATTITUDES
TOWARDS THE
EU
Consistently
favourable 212 69.4 31.8 51.3 40.5 38.3 64.2 33.6 25.7 22.7
Mixed 543 55.6 15.7 39.5 18.9 28.8 55.9 24 19.8 11.9
Consistently
unfavourable 245 65.8 28.6 59.1 32.4 34.1 71.8 33.2 25.8 12.2
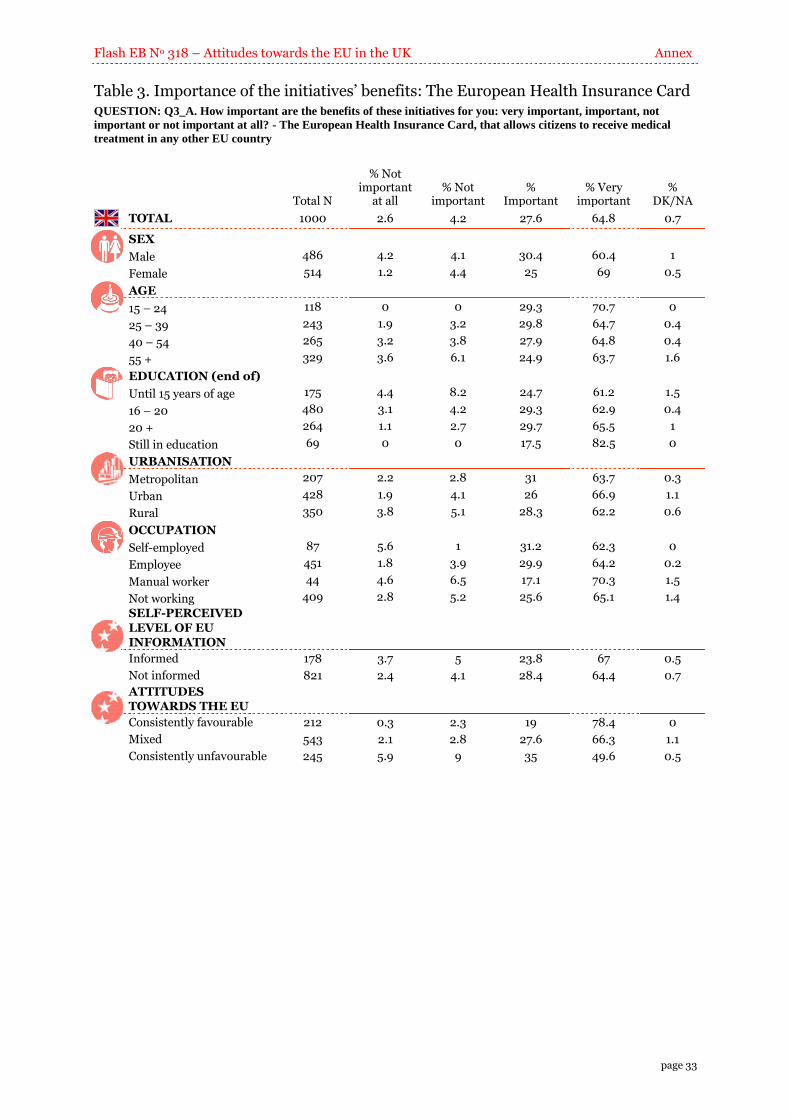
Flash EB No 318 – Attitudes towards the EU in the UK Annex
page 33
Table 3. Importance of the initiatives’ benefits: The European Health Insurance Card QUESTION: Q3_A. How important are the benefits of these initiatives for you: very important, important, not
important or not important at all? - The European Health Insurance Card, that allows citizens to receive medical
treatment in any other EU country
Total N
% Not important
at all % Not
important %
Important % Very
important %
DK/NA
TOTAL 1000 2.6 4.2 27.6 64.8 0.7
SEX
Male 486 4.2 4.1 30.4 60.4 1
Female 514 1.2 4.4 25 69 0.5
AGE
15 – 24 118 0 0 29.3 70.7 0
25 – 39 243 1.9 3.2 29.8 64.7 0.4
40 – 54 265 3.2 3.8 27.9 64.8 0.4
55 + 329 3.6 6.1 24.9 63.7 1.6
EDUCATION (end of)
Until 15 years of age 175 4.4 8.2 24.7 61.2 1.5
16 – 20 480 3.1 4.2 29.3 62.9 0.4
20 + 264 1.1 2.7 29.7 65.5 1
Still in education 69 0 0 17.5 82.5 0
URBANISATION
Metropolitan 207 2.2 2.8 31 63.7 0.3
Urban 428 1.9 4.1 26 66.9 1.1
Rural 350 3.8 5.1 28.3 62.2 0.6
OCCUPATION
Self-employed 87 5.6 1 31.2 62.3 0
Employee 451 1.8 3.9 29.9 64.2 0.2
Manual worker 44 4.6 6.5 17.1 70.3 1.5
Not working 409 2.8 5.2 25.6 65.1 1.4
SELF-PERCEIVED
LEVEL OF EU INFORMATION
Informed 178 3.7 5 23.8 67 0.5
Not informed 821 2.4 4.1 28.4 64.4 0.7
ATTITUDES TOWARDS THE EU
Consistently favourable 212 0.3 2.3 19 78.4 0
Mixed 543 2.1 2.8 27.6 66.3 1.1
Consistently unfavourable 245 5.9 9 35 49.6 0.5

Annex Flash EB No 318 – Attitudes towards the EU in the UK
page 34
Table 4. Importance of the initiatives’ benefits: The Bathing Water Report and Blue Flag Guide (about safety and cleanliness standards of Europe's beaches) QUESTION: Q3_B. How important are the benefits of these initiatives for you: very important, important, not
important or not important at all? - The Bathing Water Report and Blue Flag Guide, which inform people about the
safety and cleanliness standards of Europe's beaches
Total N
% Not important
at all % Not
important %
Important % Very
important %
DK/NA
TOTAL 1000 5 9.6 42.2 42.4 0.9
SEX
Male 486 6.6 12 40.4 40.1 0.9
Female 514 3.5 7.2 43.9 44.5 0.9
AGE
15 – 24 118 8.4 10.1 46.5 33 2
25 – 39 243 4.6 9.2 51.6 34.3 0.4
40 – 54 265 5.1 12.1 38.2 43.6 1.1
55 + 329 4.4 8.3 36.6 49.8 0.9
EDUCATION (end of)
Until 15 years of age 175 5.3 7.5 35.1 51.7 0.4
16 – 20 480 4.5 10.5 40 44.2 0.8
20 + 264 4.8 7.9 49.8 36.8 0.8
Still in education 69 7 15.3 43.6 30.7 3.4
URBANISATION
Metropolitan 207 5.7 9.2 44.9 37.5 2.8
Urban 428 4.2 8.4 43.2 43.6 0.6
Rural 350 5.4 11.1 39.1 44.1 0.2
OCCUPATION
Self-employed 87 3.1 11.5 42.7 41.2 1.5
Employee 451 4.1 10.3 48.5 36.8 0.3
Manual worker 44 2 12.3 22.4 59.7 3.7
Not working 409 6.6 8.2 37 47 1.1
SELF-PERCEIVED
LEVEL OF EU
INFORMATION
Informed 178 6 12.6 41 39.9 0.5
Not informed 821 4.8 8.9 42.3 43 1
ATTITUDES
TOWARDS THE EU
Consistently favourable 212 3.7 7 43.3 46.1 0
Mixed 543 3.7 7.5 45.3 42.1 1.4
Consistently unfavourable 245 8.8 16.4 34.5 39.7 0.5
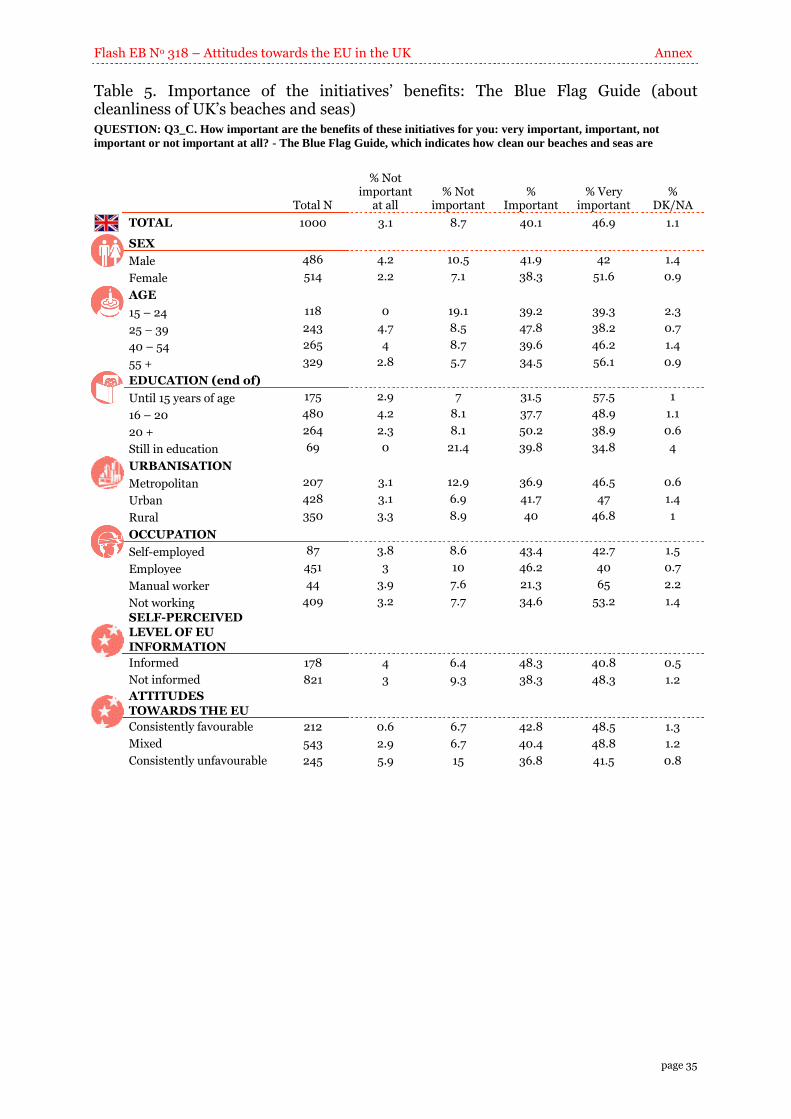
Flash EB No 318 – Attitudes towards the EU in the UK Annex
page 35
Table 5. Importance of the initiatives’ benefits: The Blue Flag Guide (about cleanliness of UK’s beaches and seas) QUESTION: Q3_C. How important are the benefits of these initiatives for you: very important, important, not
important or not important at all? - The Blue Flag Guide, which indicates how clean our beaches and seas are
Total N
% Not important
at all % Not
important %
Important % Very
important %
DK/NA
TOTAL 1000 3.1 8.7 40.1 46.9 1.1
SEX
Male 486 4.2 10.5 41.9 42 1.4
Female 514 2.2 7.1 38.3 51.6 0.9
AGE
15 – 24 118 0 19.1 39.2 39.3 2.3
25 – 39 243 4.7 8.5 47.8 38.2 0.7
40 – 54 265 4 8.7 39.6 46.2 1.4
55 + 329 2.8 5.7 34.5 56.1 0.9
EDUCATION (end of)
Until 15 years of age 175 2.9 7 31.5 57.5 1
16 – 20 480 4.2 8.1 37.7 48.9 1.1
20 + 264 2.3 8.1 50.2 38.9 0.6
Still in education 69 0 21.4 39.8 34.8 4
URBANISATION
Metropolitan 207 3.1 12.9 36.9 46.5 0.6
Urban 428 3.1 6.9 41.7 47 1.4
Rural 350 3.3 8.9 40 46.8 1
OCCUPATION
Self-employed 87 3.8 8.6 43.4 42.7 1.5
Employee 451 3 10 46.2 40 0.7
Manual worker 44 3.9 7.6 21.3 65 2.2
Not working 409 3.2 7.7 34.6 53.2 1.4
SELF-PERCEIVED
LEVEL OF EU
INFORMATION
Informed 178 4 6.4 48.3 40.8 0.5
Not informed 821 3 9.3 38.3 48.3 1.2
ATTITUDES
TOWARDS THE EU
Consistently favourable 212 0.6 6.7 42.8 48.5 1.3
Mixed 543 2.9 6.7 40.4 48.8 1.2
Consistently unfavourable 245 5.9 15 36.8 41.5 0.8

Annex Flash EB No 318 – Attitudes towards the EU in the UK
page 36
Table 6. Importance of the initiatives’ benefits: The European Arrest Warrant QUESTION: Q3_D. How important are the benefits of these initiatives for you: very important, important, not
important or not important at all? - The European Arrest Warrant
Total N
% Not important
at all % Not
important %
Important % Very
important %
DK/NA
TOTAL 1000 7.3 10.6 35.9 25.4 20.8
SEX
Male 486 9.5 12.5 37.1 24.5 16.4
Female 514 5.1 8.8 34.8 26.3 24.9
AGE
15 – 24 118 6.5 10.3 54.2 12.6 16.4
25 – 39 243 5 10.8 40.7 22.5 21
40 – 54 265 6.2 11 32.6 30.7 19.5
55 + 329 9.6 11.3 29.1 26.8 23.1
EDUCATION (end of)
Until 15 years of age 175 12.5 13.4 28.1 26.4 19.6
16 – 20 480 6.1 10 34.9 27.3 21.8
20 + 264 6 11.3 39.3 24 19.5
Still in education 69 7.3 7.3 50.2 13.6 21.6
URBANISATION
Metropolitan 207 5.3 12.4 35.6 29.8 16.8
Urban 428 7.6 9.1 35.7 24.2 23.3
Rural 350 8.1 11.8 36.6 24.1 19.5
OCCUPATION
Self-employed 87 6.8 13.8 37.3 27.1 14.9
Employee 451 5.5 9.8 38.6 24 22.2
Manual worker 44 2 19.6 16.8 43.1 18.6
Not working 409 10.1 10.1 34.7 24.6 20.5
SELF-PERCEIVED
LEVEL OF EU
INFORMATION
Informed 178 8.1 11 39.2 27.7 14
Not informed 821 7.1 10.6 35.2 24.9 22.2
ATTITUDES
TOWARDS THE EU
Consistently favourable 212 2.6 9.5 42.3 32.3 13.2
Mixed 543 6.3 8.1 39.4 23.2 23.1
Consistently unfavourable 245 13.4 17.1 22.7 24.4 22.4

Flash EB No 318 – Attitudes towards the EU in the UK Annex
page 37
Table 7. Importance of the initiatives’ benefits: The Air Passenger Rights Regulation QUESTION: Q3_E. How important are the benefits of these initiatives for you: very important, important, not
important or not important at all? - The Air Passenger Rights Regulation that details what an airline owes you in case
of cancellation, denied boarding or severe delay
Total N
% Not important
at all % Not
important %
Important % Very
important %
DK/NA
TOTAL 1000 4.6 9.7 44.8 38.6 2.3
SEX
Male 486 6.8 11.9 44.5 34.7 2.1
Female 514 2.5 7.6 45.2 42.3 2.4
AGE
15 – 24 118 4.3 6.5 66.4 20.5 2.3
25 – 39 243 1.7 9.1 47 40.3 1.8
40 – 54 265 4.9 10.2 42.7 39.8 2.5
55 + 329 6.4 11.2 39.1 41 2.4
EDUCATION (end of)
Until 15 years of age 175 6.1 12.3 31.3 46.5 3.9
16 – 20 480 3.9 10.1 44 40.5 1.5
20 + 264 3.3 8.1 49.6 36.1 2.8
Still in education 69 7.5 8 67.7 16.9 0
URBANISATION
Metropolitan 207 5.4 8.8 47.2 37.9 0.7
Urban 428 4.4 9.3 44.9 39.1 2.3
Rural 350 3.9 11 43.3 38.7 3
OCCUPATION
Self-employed 87 4.6 11.2 50.3 34 0
Employee 451 2.9 7.8 50.5 36.8 2
Manual worker 44 4.6 11.3 33.6 48.3 2.2
Not working 409 5.8 11.6 38.6 40.9 3.1
SELF-PERCEIVED
LEVEL OF EU INFORMATION
Informed 178 6.5 10.1 42.6 39.3 1.4
Not informed 821 4.2 9.6 45.4 38.5 2.4
ATTITUDES TOWARDS THE EU
Consistently favourable 212 0.7 6.6 50 42.3 0.4
Mixed 543 5.1 6.8 46.6 39 2.5
Consistently unfavourable 245 6.8 18.9 36.6 34.4 3.4
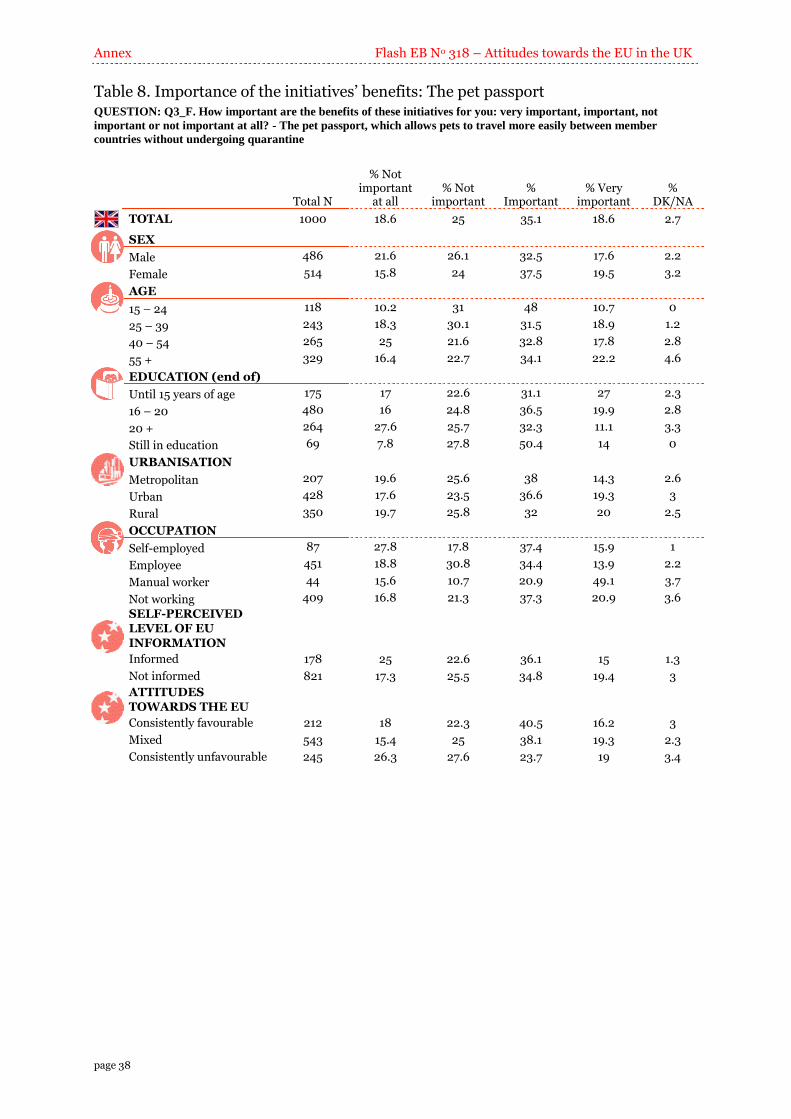
Annex Flash EB No 318 – Attitudes towards the EU in the UK
page 38
Table 8. Importance of the initiatives’ benefits: The pet passport QUESTION: Q3_F. How important are the benefits of these initiatives for you: very important, important, not
important or not important at all? - The pet passport, which allows pets to travel more easily between member
countries without undergoing quarantine
Total N
% Not important
at all % Not
important %
Important % Very
important %
DK/NA
TOTAL 1000 18.6 25 35.1 18.6 2.7
SEX
Male 486 21.6 26.1 32.5 17.6 2.2
Female 514 15.8 24 37.5 19.5 3.2
AGE
15 – 24 118 10.2 31 48 10.7 0
25 – 39 243 18.3 30.1 31.5 18.9 1.2
40 – 54 265 25 21.6 32.8 17.8 2.8
55 + 329 16.4 22.7 34.1 22.2 4.6
EDUCATION (end of)
Until 15 years of age 175 17 22.6 31.1 27 2.3
16 – 20 480 16 24.8 36.5 19.9 2.8
20 + 264 27.6 25.7 32.3 11.1 3.3
Still in education 69 7.8 27.8 50.4 14 0
URBANISATION
Metropolitan 207 19.6 25.6 38 14.3 2.6
Urban 428 17.6 23.5 36.6 19.3 3
Rural 350 19.7 25.8 32 20 2.5
OCCUPATION
Self-employed 87 27.8 17.8 37.4 15.9 1
Employee 451 18.8 30.8 34.4 13.9 2.2
Manual worker 44 15.6 10.7 20.9 49.1 3.7
Not working 409 16.8 21.3 37.3 20.9 3.6
SELF-PERCEIVED LEVEL OF EU
INFORMATION
Informed 178 25 22.6 36.1 15 1.3
Not informed 821 17.3 25.5 34.8 19.4 3
ATTITUDES
TOWARDS THE EU
Consistently favourable 212 18 22.3 40.5 16.2 3
Mixed 543 15.4 25 38.1 19.3 2.3
Consistently unfavourable 245 26.3 27.6 23.7 19 3.4
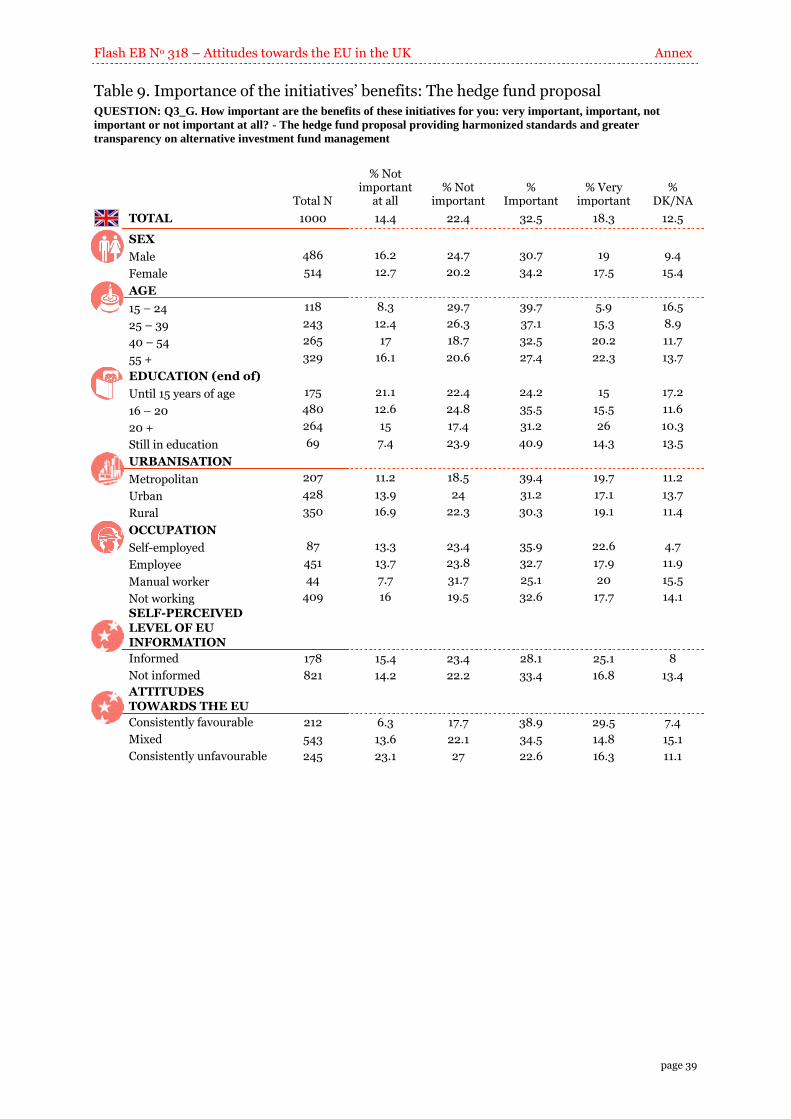
Flash EB No 318 – Attitudes towards the EU in the UK Annex
page 39
Table 9. Importance of the initiatives’ benefits: The hedge fund proposal QUESTION: Q3_G. How important are the benefits of these initiatives for you: very important, important, not
important or not important at all? - The hedge fund proposal providing harmonized standards and greater
transparency on alternative investment fund management
Total N
% Not important
at all % Not
important %
Important % Very
important %
DK/NA
TOTAL 1000 14.4 22.4 32.5 18.3 12.5
SEX
Male 486 16.2 24.7 30.7 19 9.4
Female 514 12.7 20.2 34.2 17.5 15.4
AGE
15 – 24 118 8.3 29.7 39.7 5.9 16.5
25 – 39 243 12.4 26.3 37.1 15.3 8.9
40 – 54 265 17 18.7 32.5 20.2 11.7
55 + 329 16.1 20.6 27.4 22.3 13.7
EDUCATION (end of)
Until 15 years of age 175 21.1 22.4 24.2 15 17.2
16 – 20 480 12.6 24.8 35.5 15.5 11.6
20 + 264 15 17.4 31.2 26 10.3
Still in education 69 7.4 23.9 40.9 14.3 13.5
URBANISATION
Metropolitan 207 11.2 18.5 39.4 19.7 11.2
Urban 428 13.9 24 31.2 17.1 13.7
Rural 350 16.9 22.3 30.3 19.1 11.4
OCCUPATION
Self-employed 87 13.3 23.4 35.9 22.6 4.7
Employee 451 13.7 23.8 32.7 17.9 11.9
Manual worker 44 7.7 31.7 25.1 20 15.5
Not working 409 16 19.5 32.6 17.7 14.1
SELF-PERCEIVED
LEVEL OF EU INFORMATION
Informed 178 15.4 23.4 28.1 25.1 8
Not informed 821 14.2 22.2 33.4 16.8 13.4
ATTITUDES TOWARDS THE EU
Consistently favourable 212 6.3 17.7 38.9 29.5 7.4
Mixed 543 13.6 22.1 34.5 14.8 15.1
Consistently unfavourable 245 23.1 27 22.6 16.3 11.1
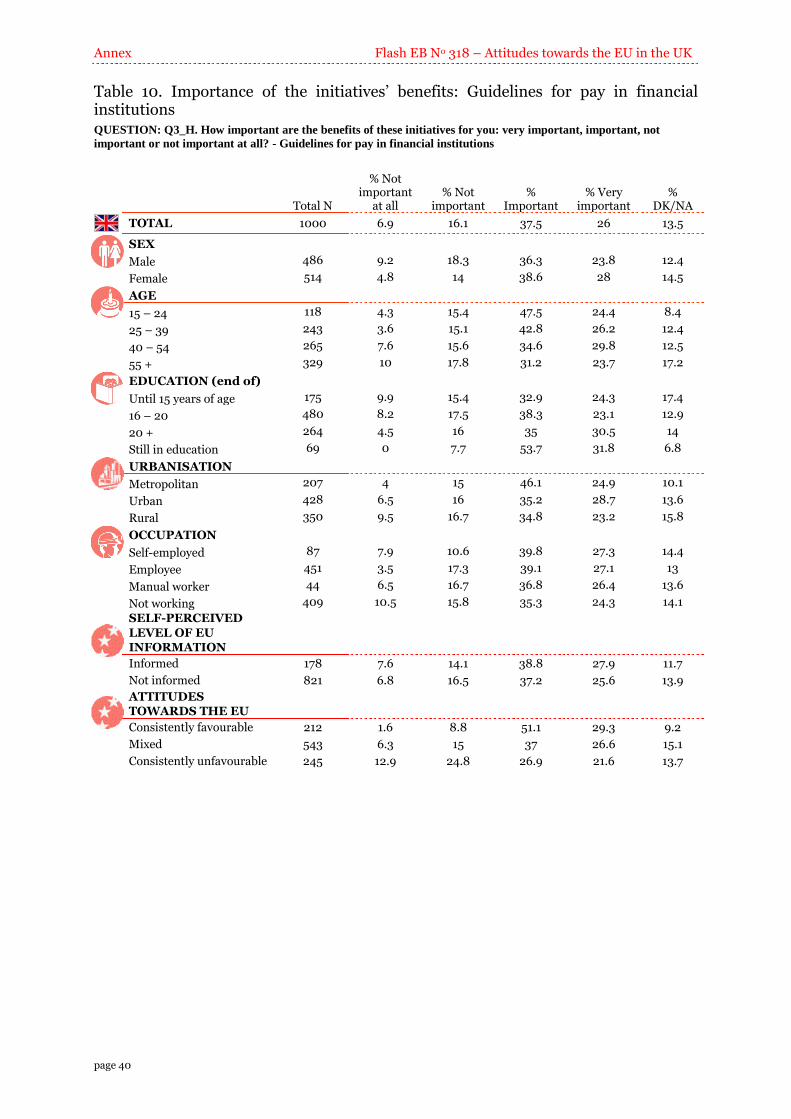
Annex Flash EB No 318 – Attitudes towards the EU in the UK
page 40
Table 10. Importance of the initiatives’ benefits: Guidelines for pay in financial institutions QUESTION: Q3_H. How important are the benefits of these initiatives for you: very important, important, not
important or not important at all? - Guidelines for pay in financial institutions
Total N
% Not important
at all % Not
important %
Important % Very
important %
DK/NA
TOTAL 1000 6.9 16.1 37.5 26 13.5
SEX
Male 486 9.2 18.3 36.3 23.8 12.4
Female 514 4.8 14 38.6 28 14.5
AGE
15 – 24 118 4.3 15.4 47.5 24.4 8.4
25 – 39 243 3.6 15.1 42.8 26.2 12.4
40 – 54 265 7.6 15.6 34.6 29.8 12.5
55 + 329 10 17.8 31.2 23.7 17.2
EDUCATION (end of)
Until 15 years of age 175 9.9 15.4 32.9 24.3 17.4
16 – 20 480 8.2 17.5 38.3 23.1 12.9
20 + 264 4.5 16 35 30.5 14
Still in education 69 0 7.7 53.7 31.8 6.8
URBANISATION
Metropolitan 207 4 15 46.1 24.9 10.1
Urban 428 6.5 16 35.2 28.7 13.6
Rural 350 9.5 16.7 34.8 23.2 15.8
OCCUPATION
Self-employed 87 7.9 10.6 39.8 27.3 14.4
Employee 451 3.5 17.3 39.1 27.1 13
Manual worker 44 6.5 16.7 36.8 26.4 13.6
Not working 409 10.5 15.8 35.3 24.3 14.1
SELF-PERCEIVED
LEVEL OF EU INFORMATION
Informed 178 7.6 14.1 38.8 27.9 11.7
Not informed 821 6.8 16.5 37.2 25.6 13.9
ATTITUDES TOWARDS THE EU
Consistently favourable 212 1.6 8.8 51.1 29.3 9.2
Mixed 543 6.3 15 37 26.6 15.1
Consistently unfavourable 245 12.9 24.8 26.9 21.6 13.7
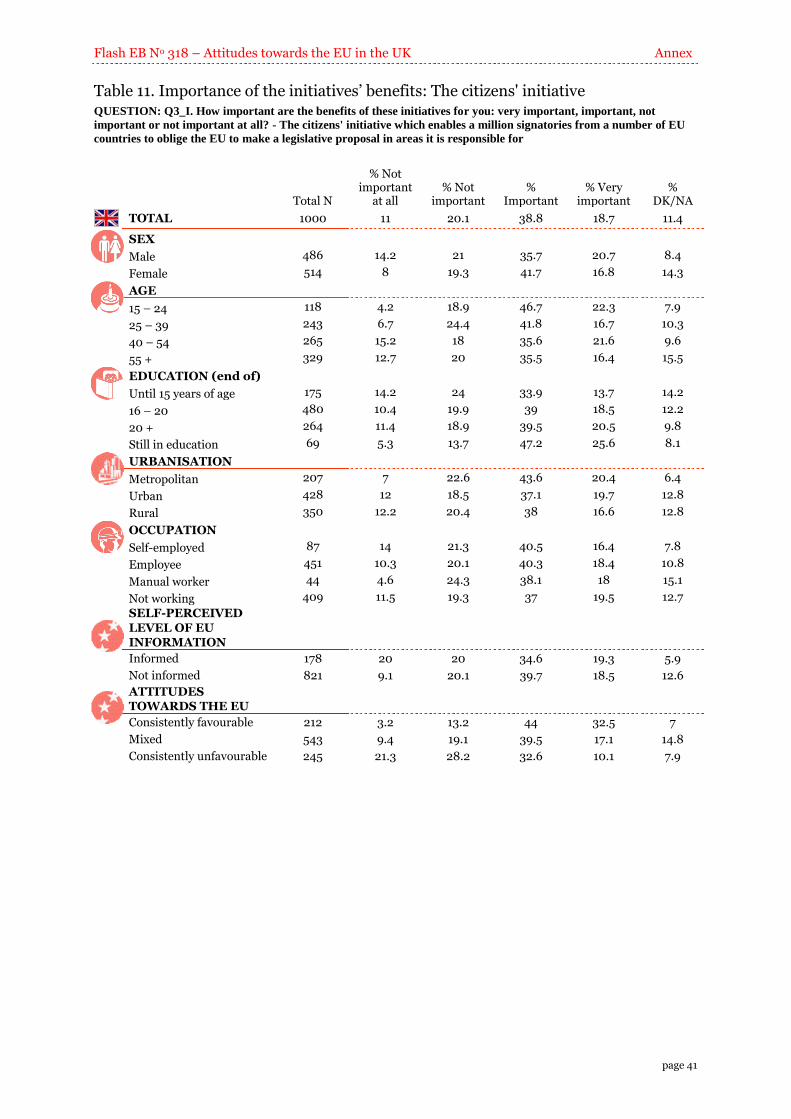
Flash EB No 318 – Attitudes towards the EU in the UK Annex
page 41
Table 11. Importance of the initiatives’ benefits: The citizens' initiative QUESTION: Q3_I. How important are the benefits of these initiatives for you: very important, important, not
important or not important at all? - The citizens' initiative which enables a million signatories from a number of EU
countries to oblige the EU to make a legislative proposal in areas it is responsible for
Total N
% Not important
at all % Not
important %
Important % Very
important %
DK/NA
TOTAL 1000 11 20.1 38.8 18.7 11.4
SEX
Male 486 14.2 21 35.7 20.7 8.4
Female 514 8 19.3 41.7 16.8 14.3
AGE
15 – 24 118 4.2 18.9 46.7 22.3 7.9
25 – 39 243 6.7 24.4 41.8 16.7 10.3
40 – 54 265 15.2 18 35.6 21.6 9.6
55 + 329 12.7 20 35.5 16.4 15.5
EDUCATION (end of)
Until 15 years of age 175 14.2 24 33.9 13.7 14.2
16 – 20 480 10.4 19.9 39 18.5 12.2
20 + 264 11.4 18.9 39.5 20.5 9.8
Still in education 69 5.3 13.7 47.2 25.6 8.1
URBANISATION
Metropolitan 207 7 22.6 43.6 20.4 6.4
Urban 428 12 18.5 37.1 19.7 12.8
Rural 350 12.2 20.4 38 16.6 12.8
OCCUPATION
Self-employed 87 14 21.3 40.5 16.4 7.8
Employee 451 10.3 20.1 40.3 18.4 10.8
Manual worker 44 4.6 24.3 38.1 18 15.1
Not working 409 11.5 19.3 37 19.5 12.7
SELF-PERCEIVED
LEVEL OF EU INFORMATION
Informed 178 20 20 34.6 19.3 5.9
Not informed 821 9.1 20.1 39.7 18.5 12.6
ATTITUDES TOWARDS THE EU
Consistently favourable 212 3.2 13.2 44 32.5 7
Mixed 543 9.4 19.1 39.5 17.1 14.8
Consistently unfavourable 245 21.3 28.2 32.6 10.1 7.9
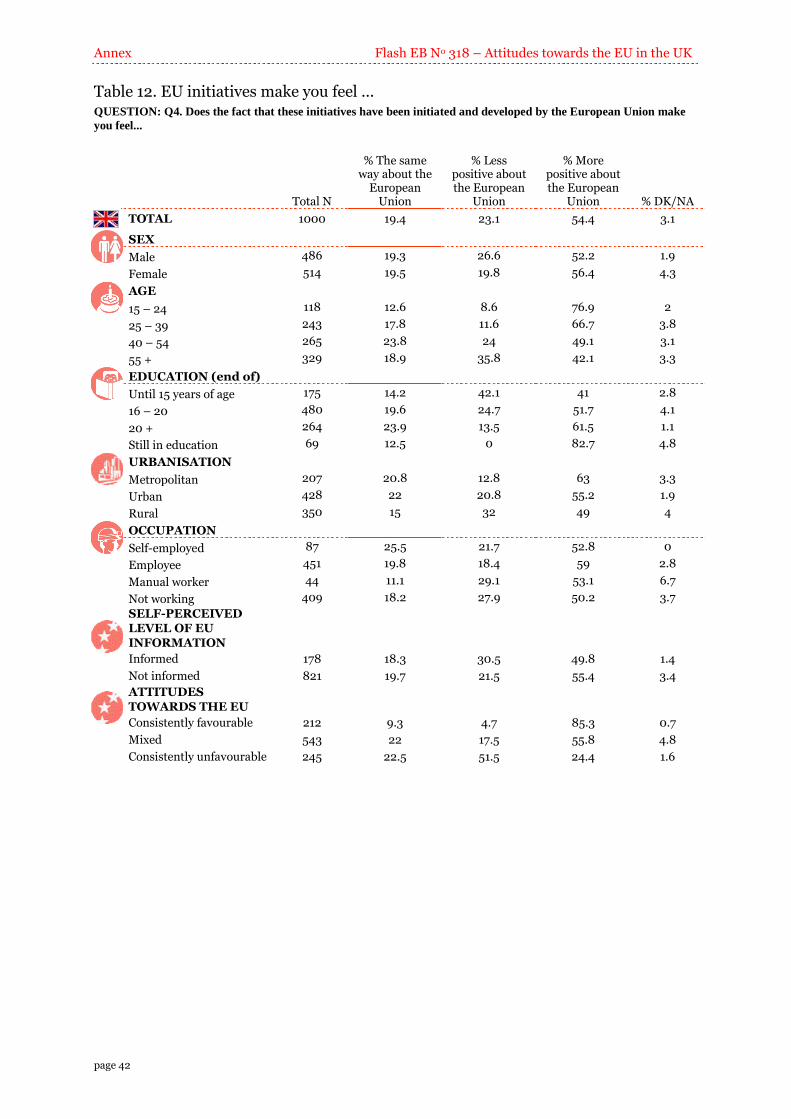
Annex Flash EB No 318 – Attitudes towards the EU in the UK
page 42
Table 12. EU initiatives make you feel ... QUESTION: Q4. Does the fact that these initiatives have been initiated and developed by the European Union make
you feel...
Total N
% The same way about the
European Union
% Less positive about the European
Union
% More positive about the European
Union % DK/NA
TOTAL 1000 19.4 23.1 54.4 3.1
SEX
Male 486 19.3 26.6 52.2 1.9
Female 514 19.5 19.8 56.4 4.3
AGE
15 – 24 118 12.6 8.6 76.9 2
25 – 39 243 17.8 11.6 66.7 3.8
40 – 54 265 23.8 24 49.1 3.1
55 + 329 18.9 35.8 42.1 3.3
EDUCATION (end of)
Until 15 years of age 175 14.2 42.1 41 2.8
16 – 20 480 19.6 24.7 51.7 4.1
20 + 264 23.9 13.5 61.5 1.1
Still in education 69 12.5 0 82.7 4.8
URBANISATION
Metropolitan 207 20.8 12.8 63 3.3
Urban 428 22 20.8 55.2 1.9
Rural 350 15 32 49 4
OCCUPATION
Self-employed 87 25.5 21.7 52.8 0
Employee 451 19.8 18.4 59 2.8
Manual worker 44 11.1 29.1 53.1 6.7
Not working 409 18.2 27.9 50.2 3.7
SELF-PERCEIVED LEVEL OF EU
INFORMATION
Informed 178 18.3 30.5 49.8 1.4
Not informed 821 19.7 21.5 55.4 3.4
ATTITUDES
TOWARDS THE EU
Consistently favourable 212 9.3 4.7 85.3 0.7
Mixed 543 22 17.5 55.8 4.8
Consistently unfavourable 245 22.5 51.5 24.4 1.6
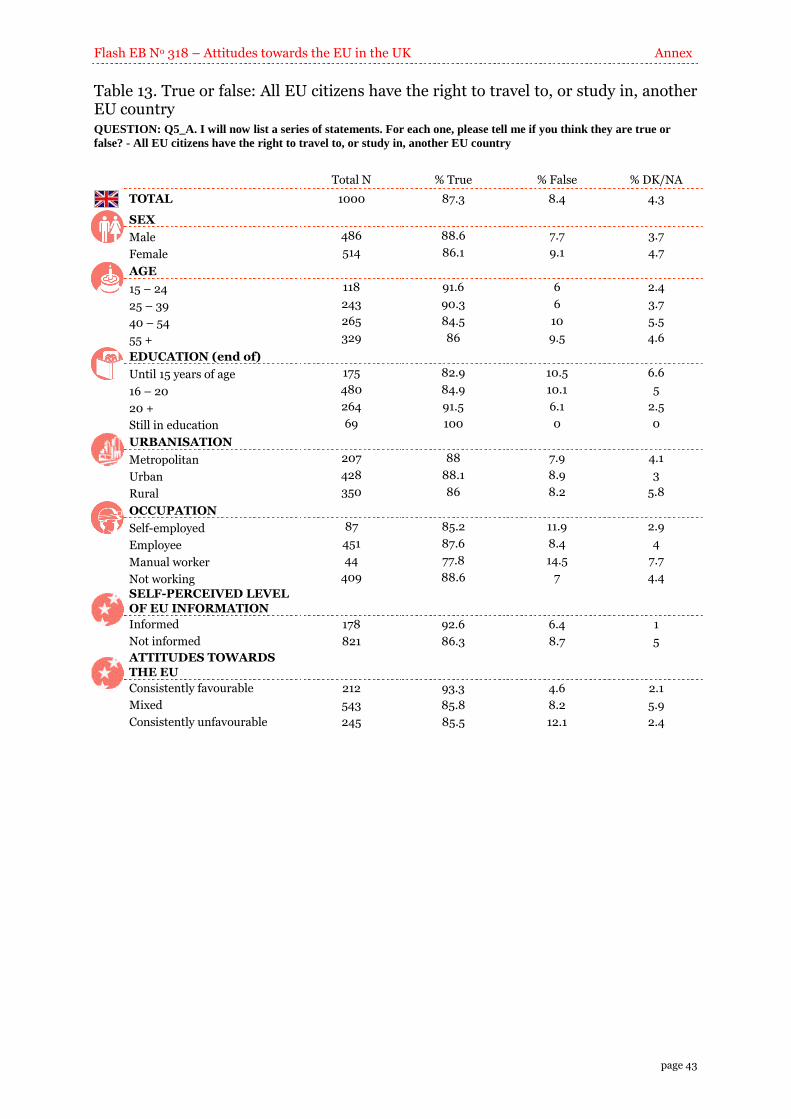
Flash EB No 318 – Attitudes towards the EU in the UK Annex
page 43
Table 13. True or false: All EU citizens have the right to travel to, or study in, another EU country QUESTION: Q5_A. I will now list a series of statements. For each one, please tell me if you think they are true or
false? - All EU citizens have the right to travel to, or study in, another EU country
Total N % True % False % DK/NA
TOTAL 1000 87.3 8.4 4.3
SEX
Male 486 88.6 7.7 3.7
Female 514 86.1 9.1 4.7
AGE
15 – 24 118 91.6 6 2.4
25 – 39 243 90.3 6 3.7
40 – 54 265 84.5 10 5.5
55 + 329 86 9.5 4.6
EDUCATION (end of)
Until 15 years of age 175 82.9 10.5 6.6
16 – 20 480 84.9 10.1 5
20 + 264 91.5 6.1 2.5
Still in education 69 100 0 0
URBANISATION
Metropolitan 207 88 7.9 4.1
Urban 428 88.1 8.9 3
Rural 350 86 8.2 5.8
OCCUPATION
Self-employed 87 85.2 11.9 2.9
Employee 451 87.6 8.4 4
Manual worker 44 77.8 14.5 7.7
Not working 409 88.6 7 4.4
SELF-PERCEIVED LEVEL
OF EU INFORMATION
Informed 178 92.6 6.4 1
Not informed 821 86.3 8.7 5
ATTITUDES TOWARDS
THE EU
Consistently favourable 212 93.3 4.6 2.1
Mixed 543 85.8 8.2 5.9
Consistently unfavourable 245 85.5 12.1 2.4
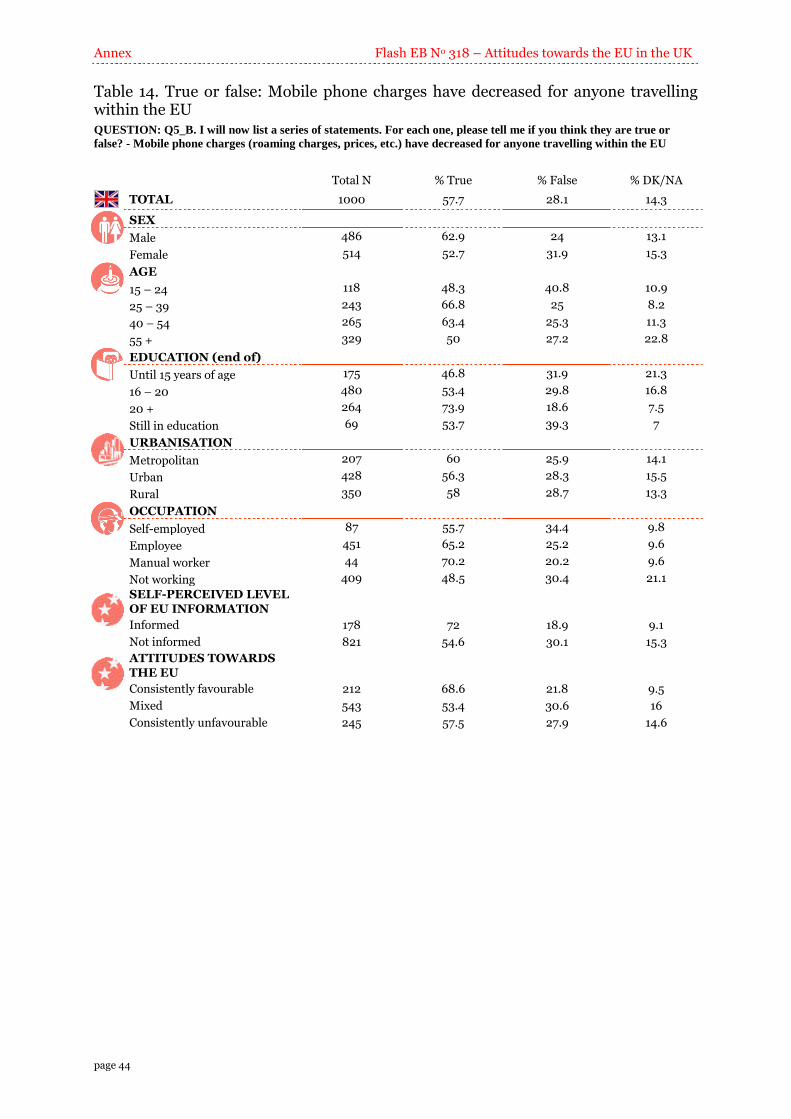
Annex Flash EB No 318 – Attitudes towards the EU in the UK
page 44
Table 14. True or false: Mobile phone charges have decreased for anyone travelling within the EU QUESTION: Q5_B. I will now list a series of statements. For each one, please tell me if you think they are true or
false? - Mobile phone charges (roaming charges, prices, etc.) have decreased for anyone travelling within the EU
Total N % True % False % DK/NA
TOTAL 1000 57.7 28.1 14.3
SEX
Male 486 62.9 24 13.1
Female 514 52.7 31.9 15.3
AGE
15 – 24 118 48.3 40.8 10.9
25 – 39 243 66.8 25 8.2
40 – 54 265 63.4 25.3 11.3
55 + 329 50 27.2 22.8
EDUCATION (end of)
Until 15 years of age 175 46.8 31.9 21.3
16 – 20 480 53.4 29.8 16.8
20 + 264 73.9 18.6 7.5
Still in education 69 53.7 39.3 7
URBANISATION
Metropolitan 207 60 25.9 14.1
Urban 428 56.3 28.3 15.5
Rural 350 58 28.7 13.3
OCCUPATION
Self-employed 87 55.7 34.4 9.8
Employee 451 65.2 25.2 9.6
Manual worker 44 70.2 20.2 9.6
Not working 409 48.5 30.4 21.1
SELF-PERCEIVED LEVEL OF EU INFORMATION
Informed 178 72 18.9 9.1
Not informed 821 54.6 30.1 15.3
ATTITUDES TOWARDS THE EU
Consistently favourable 212 68.6 21.8 9.5
Mixed 543 53.4 30.6 16
Consistently unfavourable 245 57.5 27.9 14.6

Flash EB No 318 – Attitudes towards the EU in the UK Annex
page 45
Table 15. True or false: The EU has very strict food-safety standards QUESTION: Q5_C. I will now list a series of statements. For each one, please tell me if you think they are true or
false? - The EU has very strict food-safety standards
Total N % True % False % DK/NA
TOTAL 1000 73.4 21 5.6
SEX
Male 486 70.3 23.9 5.9
Female 514 76.5 18.2 5.3
AGE
15 – 24 118 80.8 12.5 6.7
25 – 39 243 81.3 15.5 3.1
40 – 54 265 72 22.1 6
55 + 329 66.1 27.1 6.7
EDUCATION (end of)
Until 15 years of age 175 65.2 28.3 6.5
16 – 20 480 73.6 19.3 7.1
20 + 264 79.3 18 2.7
Still in education 69 73.3 23.5 3.3
URBANISATION
Metropolitan 207 71.5 20.4 8.1
Urban 428 76.3 18.6 5.1
Rural 350 71.2 24.3 4.5
OCCUPATION
Self-employed 87 77.2 19.6 3.2
Employee 451 77.1 19.9 3
Manual worker 44 71.7 22.2 6.1
Not working 409 68.6 22.4 9
SELF-PERCEIVED LEVEL
OF EU INFORMATION
Informed 178 72.7 25.1 2.2
Not informed 821 73.5 20.2 6.3
ATTITUDES TOWARDS
THE EU
Consistently favourable 212 84 14 2
Mixed 543 72.8 19.9 7.3
Consistently unfavourable 245 65.7 29.5 4.8

Annex Flash EB No 318 – Attitudes towards the EU in the UK
page 46
Table 16. True or false: The EU has a standing army QUESTION: Q5_D. I will now list a series of statements. For each one, please tell me if you think they are true or
false? - The EU has a standing army
Total N % True % False % DK/NA
TOTAL 1000 22.9 65 12
SEX
Male 486 21.9 70.1 8
Female 514 23.9 60.2 15.9
AGE
15 – 24 118 36.2 51.8 12
25 – 39 243 32.5 55.9 11.6
40 – 54 265 16.5 71 12.5
55 + 329 16.7 70.3 13
EDUCATION (end of)
Until 15 years of age 175 29.2 54 16.7
16 – 20 480 27.4 57.7 14.9
20 + 264 9 85.6 5.4
Still in education 69 25.7 66.6 7.7
URBANISATION
Metropolitan 207 23.8 67.6 8.6
Urban 428 20.2 66.2 13.5
Rural 350 25 63.3 11.7
OCCUPATION
Self-employed 87 24.2 69.6 6.2
Employee 451 23.2 64.7 12.1
Manual worker 44 15 72 13
Not working 409 22.6 64.1 13.3
SELF-PERCEIVED LEVEL
OF EU INFORMATION
Informed 178 14.8 80.1 5.1
Not informed 821 24.8 61.8 13.5
ATTITUDES TOWARDS
THE EU
Consistently favourable 212 21.1 73.2 5.7
Mixed 543 27.2 56.3 16.5
Consistently unfavourable 245 15.2 77.2 7.6
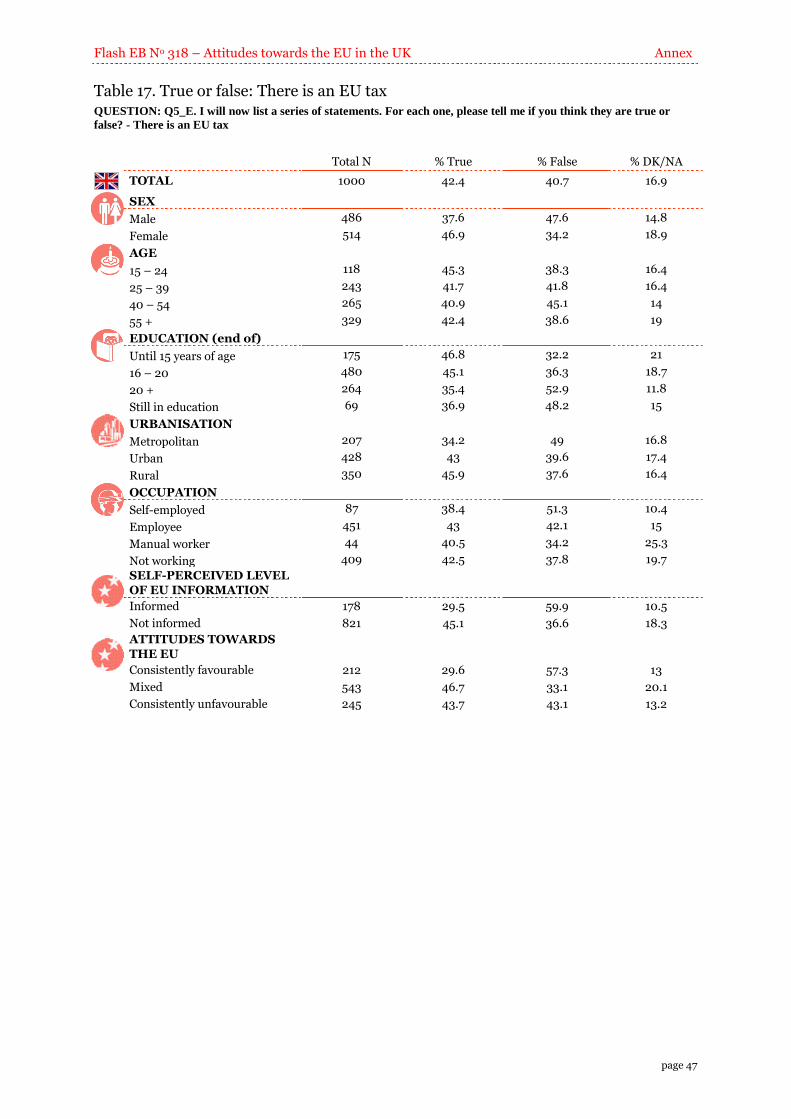
Flash EB No 318 – Attitudes towards the EU in the UK Annex
page 47
Table 17. True or false: There is an EU tax QUESTION: Q5_E. I will now list a series of statements. For each one, please tell me if you think they are true or
false? - There is an EU tax
Total N % True % False % DK/NA
TOTAL 1000 42.4 40.7 16.9
SEX
Male 486 37.6 47.6 14.8
Female 514 46.9 34.2 18.9
AGE
15 – 24 118 45.3 38.3 16.4
25 – 39 243 41.7 41.8 16.4
40 – 54 265 40.9 45.1 14
55 + 329 42.4 38.6 19
EDUCATION (end of)
Until 15 years of age 175 46.8 32.2 21
16 – 20 480 45.1 36.3 18.7
20 + 264 35.4 52.9 11.8
Still in education 69 36.9 48.2 15
URBANISATION
Metropolitan 207 34.2 49 16.8
Urban 428 43 39.6 17.4
Rural 350 45.9 37.6 16.4
OCCUPATION
Self-employed 87 38.4 51.3 10.4
Employee 451 43 42.1 15
Manual worker 44 40.5 34.2 25.3
Not working 409 42.5 37.8 19.7
SELF-PERCEIVED LEVEL
OF EU INFORMATION
Informed 178 29.5 59.9 10.5
Not informed 821 45.1 36.6 18.3
ATTITUDES TOWARDS
THE EU
Consistently favourable 212 29.6 57.3 13
Mixed 543 46.7 33.1 20.1
Consistently unfavourable 245 43.7 43.1 13.2

Annex Flash EB No 318 – Attitudes towards the EU in the UK
page 48
Table 18. True or false: The EU budget is larger than the UK's QUESTION: Q5_F. I will now list a series of statements. For each one, please tell me if you think they are true or
false? - The EU budget is larger than the UK's
Total N % True % False % DK/NA
TOTAL 1000 74.9 14.7 10.5
SEX
Male 486 76 16.4 7.6
Female 514 73.8 13 13.2
AGE
15 – 24 118 65.1 17.1 17.8
25 – 39 243 76.5 16.1 7.4
40 – 54 265 74.1 15.6 10.3
55 + 329 79.3 10.5 10.2
EDUCATION (end of)
Until 15 years of age 175 72 13.7 14.3
16 – 20 480 80.2 11.9 7.9
20 + 264 70.6 19.2 10.2
Still in education 69 64.1 18 17.9
URBANISATION
Metropolitan 207 64.2 21.3 14.5
Urban 428 75.8 13.7 10.4
Rural 350 80.9 10.9 8.2
OCCUPATION
Self-employed 87 71.4 21.7 6.9
Employee 451 75.2 15.3 9.5
Manual worker 44 88.3 11.7 0
Not working 409 74.2 12.3 13.5
SELF-PERCEIVED LEVEL
OF EU INFORMATION
Informed 178 76.4 16.4 7.2
Not informed 821 74.6 14.2 11.2
ATTITUDES TOWARDS
THE EU
Consistently favourable 212 69.7 20.5 9.9
Mixed 543 74.3 12.4 13.2
Consistently unfavourable 245 80.5 14.6 4.9
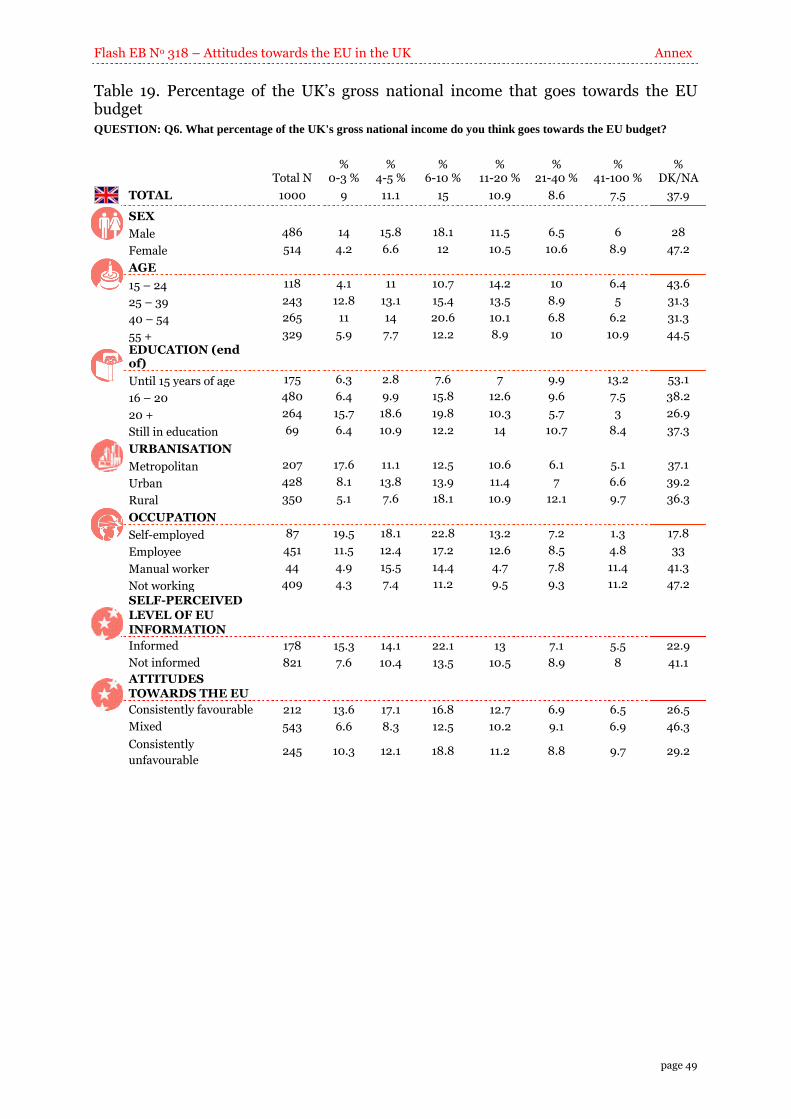
Flash EB No 318 – Attitudes towards the EU in the UK Annex
page 49
Table 19. Percentage of the UK’s gross national income that goes towards the EU budget QUESTION: Q6. What percentage of the UK's gross national income do you think goes towards the EU budget?
Total N
% 0-3 %
% 4-5 %
% 6-10 %
% 11-20 %
% 21-40 %
% 41-100 %
% DK/NA
TOTAL 1000 9 11.1 15 10.9 8.6 7.5 37.9
SEX
Male 486 14 15.8 18.1 11.5 6.5 6 28
Female 514 4.2 6.6 12 10.5 10.6 8.9 47.2
AGE
15 – 24 118 4.1 11 10.7 14.2 10 6.4 43.6
25 – 39 243 12.8 13.1 15.4 13.5 8.9 5 31.3
40 – 54 265 11 14 20.6 10.1 6.8 6.2 31.3
55 + 329 5.9 7.7 12.2 8.9 10 10.9 44.5
EDUCATION (end of)
Until 15 years of age 175 6.3 2.8 7.6 7 9.9 13.2 53.1
16 – 20 480 6.4 9.9 15.8 12.6 9.6 7.5 38.2
20 + 264 15.7 18.6 19.8 10.3 5.7 3 26.9
Still in education 69 6.4 10.9 12.2 14 10.7 8.4 37.3
URBANISATION
Metropolitan 207 17.6 11.1 12.5 10.6 6.1 5.1 37.1
Urban 428 8.1 13.8 13.9 11.4 7 6.6 39.2
Rural 350 5.1 7.6 18.1 10.9 12.1 9.7 36.3
OCCUPATION
Self-employed 87 19.5 18.1 22.8 13.2 7.2 1.3 17.8
Employee 451 11.5 12.4 17.2 12.6 8.5 4.8 33
Manual worker 44 4.9 15.5 14.4 4.7 7.8 11.4 41.3
Not working 409 4.3 7.4 11.2 9.5 9.3 11.2 47.2
SELF-PERCEIVED
LEVEL OF EU INFORMATION
Informed 178 15.3 14.1 22.1 13 7.1 5.5 22.9
Not informed 821 7.6 10.4 13.5 10.5 8.9 8 41.1
ATTITUDES TOWARDS THE EU
Consistently favourable 212 13.6 17.1 16.8 12.7 6.9 6.5 26.5
Mixed 543 6.6 8.3 12.5 10.2 9.1 6.9 46.3
Consistently
unfavourable 245 10.3 12.1 18.8 11.2 8.8 9.7 29.2

Annex Flash EB No 318 – Attitudes towards the EU in the UK
page 50
Table 20. Economic costs vs. benefits of being in the EU QUESTION: Q7. In your opinion, do the economic costs of being in the EU exceed the benefits or do the benefits
exceed the cost?
Total N
% The economic costs exceed the
benefits
% The benefits exceed the
economic costs
% They are in
balance %
DK/NA
TOTAL 1000 39.7 32.5 15.8 12.1
SEX
Male 486 41 37 14.7 7.3
Female 514 38.4 28.2 16.9 16.6
AGE
15 – 24 118 23 37.3 23.4 16.3
25 – 39 243 32.5 36.3 17.4 13.8
40 – 54 265 42.7 34 13.8 9.5
55 + 329 48.4 26.4 13.8 11.3
EDUCATION (end of)
Until 15 years of age 175 45.3 22.2 14.7 17.9
16 – 20 480 43.5 28.4 16.9 11.2
20 + 264 34.9 43.6 14.9 6.5
Still in education 69 18.2 43.5 16 22.3
URBANISATION
Metropolitan 207 30.9 34 23.2 11.8
Urban 428 40.7 31.2 14.5 13.6
Rural 350 44 32.9 13.5 9.6
OCCUPATION
Self-employed 87 34.5 36.4 20.4 8.8
Employee 451 37.8 36.2 14.3 11.8
Manual worker 44 45.8 33.1 7.2 13.9
Not working 409 42.4 27.4 17.6 12.6
SELF-PERCEIVED
LEVEL OF EU
INFORMATION
Informed 178 43.4 42.7 8.3 5.6
Not informed 821 38.9 30.3 17.4 13.4
ATTITUDES TOWARDS
THE EU
Consistently favourable 212 0 100 0 0
Mixed 543 27.9 20.7 29.1 22.2
Consistently unfavourable 245 100 0 0 0
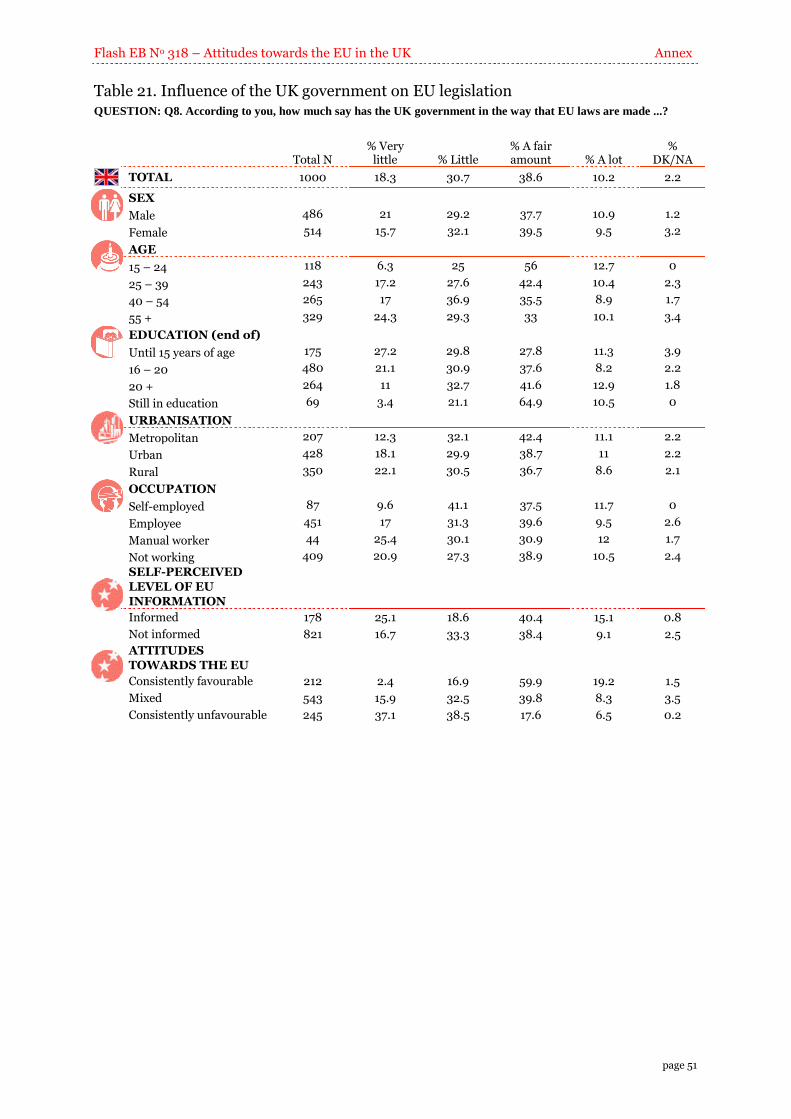
Flash EB No 318 – Attitudes towards the EU in the UK Annex
page 51
Table 21. Influence of the UK government on EU legislation QUESTION: Q8. According to you, how much say has the UK government in the way that EU laws are made ...?
Total N
% Very little % Little
% A fair amount % A lot
% DK/NA
TOTAL 1000 18.3 30.7 38.6 10.2 2.2
SEX
Male 486 21 29.2 37.7 10.9 1.2
Female 514 15.7 32.1 39.5 9.5 3.2
AGE
15 – 24 118 6.3 25 56 12.7 0
25 – 39 243 17.2 27.6 42.4 10.4 2.3
40 – 54 265 17 36.9 35.5 8.9 1.7
55 + 329 24.3 29.3 33 10.1 3.4
EDUCATION (end of)
Until 15 years of age 175 27.2 29.8 27.8 11.3 3.9
16 – 20 480 21.1 30.9 37.6 8.2 2.2
20 + 264 11 32.7 41.6 12.9 1.8
Still in education 69 3.4 21.1 64.9 10.5 0
URBANISATION
Metropolitan 207 12.3 32.1 42.4 11.1 2.2
Urban 428 18.1 29.9 38.7 11 2.2
Rural 350 22.1 30.5 36.7 8.6 2.1
OCCUPATION
Self-employed 87 9.6 41.1 37.5 11.7 0
Employee 451 17 31.3 39.6 9.5 2.6
Manual worker 44 25.4 30.1 30.9 12 1.7
Not working 409 20.9 27.3 38.9 10.5 2.4
SELF-PERCEIVED
LEVEL OF EU
INFORMATION
Informed 178 25.1 18.6 40.4 15.1 0.8
Not informed 821 16.7 33.3 38.4 9.1 2.5
ATTITUDES
TOWARDS THE EU
Consistently favourable 212 2.4 16.9 59.9 19.2 1.5
Mixed 543 15.9 32.5 39.8 8.3 3.5
Consistently unfavourable 245 37.1 38.5 17.6 6.5 0.2

Annex Flash EB No 318 – Attitudes towards the EU in the UK
page 52
Table 22. If the UK government had influence on all EU legislation, that would make you feel ... QUESTION: Q9. If you knew the UK government always had a say in the way EU laws were made, that would make
you feel:
Total N
% Would not change, feel
the same way
% Less positive about UK
membership of the EU
% More positive about UK
membership of the EU
% DK/NA
TOTAL 1000 16.9 22 59.2 2
SEX
Male 486 18 25.2 55 1.8
Female 514 15.8 19 63.1 2.2
AGE
15 – 24 118 10.9 10.1 74.6 4.4
25 – 39 243 17.6 15.8 64.8 1.7
40 – 54 265 19.8 23 56 1.2
55 + 329 16.1 27.6 54.1 2.2
EDUCATION (end of)
Until 15 years of age 175 11.5 35.9 50.4 2.2
16 – 20 480 13.3 23.1 61.5 2.1
20 + 264 27.7 13.8 57.1 1.4
Still in education 69 16.7 8.9 71 3.4
URBANISATION
Metropolitan 207 19.4 13.2 62 5.4
Urban 428 17 20.6 61.8 0.7
Rural 350 15.3 29.2 54.1 1.4
OCCUPATION
Self-employed 87 22 18.6 59.5 0
Employee 451 18.3 19.1 61 1.6
Manual worker 44 7.5 33.9 58.7 0
Not working 409 15.3 24.7 56.8 3.1
SELF-PERCEIVED
LEVEL OF EU
INFORMATION
Informed 178 21.5 28.8 47.7 2
Not informed 821 15.8 20.5 61.7 2
ATTITUDES TOWARDS
THE EU
Consistently favourable 212 10.5 7.6 80.7 1.3
Mixed 543 16.3 21.2 59.6 2.9
Consistently unfavourable 245 23.6 36.2 39.6 0.6

Flash EB No 318 – Attitudes towards the EU in the UK Annex
page 53
Table 23. Being part of the EU means that: UK consumers benefit from the free movement of goods resulting from the European Single Market QUESTION: Q10_A. Do you agree or disagree with the following statements? Being part of the EU means that ... -
UK consumers benefit from the free movement of goods resulting from the European Single Market
Total N
% Strongly disagree
% Disagree % Agree
% Strongly agree
% DK/NA
TOTAL 1000 6.8 15.1 51 17.5 9.6
SEX
Male 486 9.1 14.5 47.5 22.6 6.3
Female 514 4.6 15.6 54.3 12.7 12.7
AGE
15 – 24 118 2.3 10.1 58 17.4 12.3
25 – 39 243 5.7 14.3 55 18.1 7
40 – 54 265 6.3 14.1 49.9 21.8 7.9
55 + 329 9.7 17.6 46.7 13.7 12.3
EDUCATION (end of)
Until 15 years of age 175 10.7 15.2 43.8 12.7 17.6
16 – 20 480 7.9 16.6 53.5 12.8 9.3
20 + 264 3.1 12.9 50.2 28 5.7
Still in education 69 1.9 11.4 54.5 25.6 6.6
URBANISATION
Metropolitan 207 2.6 12.1 53.7 22.7 8.8
Urban 428 6.4 16.4 47.8 18.4 10.9
Rural 350 9.8 14.9 53.3 14.1 7.9
OCCUPATION
Self-employed 87 4.8 10.1 58.5 22 4.6
Employee 451 6.6 12.9 53.1 19.3 8.1
Manual worker 44 5.4 21 51.4 6.8 15.4
Not working 409 7.5 17.9 47 15.9 11.6
SELF-PERCEIVED
LEVEL OF EU INFORMATION
Informed 178 11.7 11.9 37.1 35 4.3
Not informed 821 5.8 15.7 54.1 13.8 10.6
ATTITUDES TOWARDS THE EU
Consistently favourable 212 2.2 7.8 49.2 38.7 2.1
Mixed 543 4.3 12.7 56.7 12.2 14.2
Consistently unfavourable 245 16.3 26.7 40.1 11.1 5.9

Annex Flash EB No 318 – Attitudes towards the EU in the UK
page 54
Table 24. Being part of the EU means that: There are improved working conditions in the UK QUESTION: Q10_B. Do you agree or disagree with the following statements? Being part of the EU means that ... -
There are improved working conditions in the UK
Total N
% Strongly disagree
% Disagree % Agree
% Strongly agree
% DK/NA
TOTAL 1000 13 26.4 41.1 14.3 5.2
SEX
Male 486 13.8 25 40.3 15.6 5.2
Female 514 12.3 27.8 41.8 13 5.1
AGE
15 – 24 118 6.3 24.7 62.5 6.5 0
25 – 39 243 8.9 25.6 42 19.9 3.6
40 – 54 265 12.7 23.8 41.5 17.4 4.6
55 + 329 17.8 29.8 33.5 10.4 8.4
EDUCATION (end of)
Until 15 years of age 175 22.9 24.7 31.1 12.5 8.8
16 – 20 480 14.4 27.7 41.1 12.9 3.9
20 + 264 6.9 25.7 42.1 19.4 5.8
Still in education 69 1.9 26.1 59.9 11.1 1
URBANISATION
Metropolitan 207 10.3 21.7 43.8 16.5 7.7
Urban 428 14.9 26 38.1 15.6 5.5
Rural 350 12.7 29.8 42.2 12 3.3
OCCUPATION
Self-employed 87 16.7 13.5 55.8 9.8 4.3
Employee 451 8.7 27.8 43.1 16.1 4.3
Manual worker 44 11.8 28.8 35.1 15.7 8.7
Not working 409 17.3 27.6 35.9 13.4 5.9
SELF-PERCEIVED
LEVEL OF EU INFORMATION
Informed 178 17.9 21.8 35 21.7 3.6
Not informed 821 11.9 27.5 42.4 12.7 5.4
ATTITUDES TOWARDS THE EU
Consistently favourable 212 2.8 16.1 53.6 25.9 1.6
Mixed 543 11.5 25.2 42.4 13.8 7.1
Consistently unfavourable 245 25.4 38.1 27.3 5.2 4
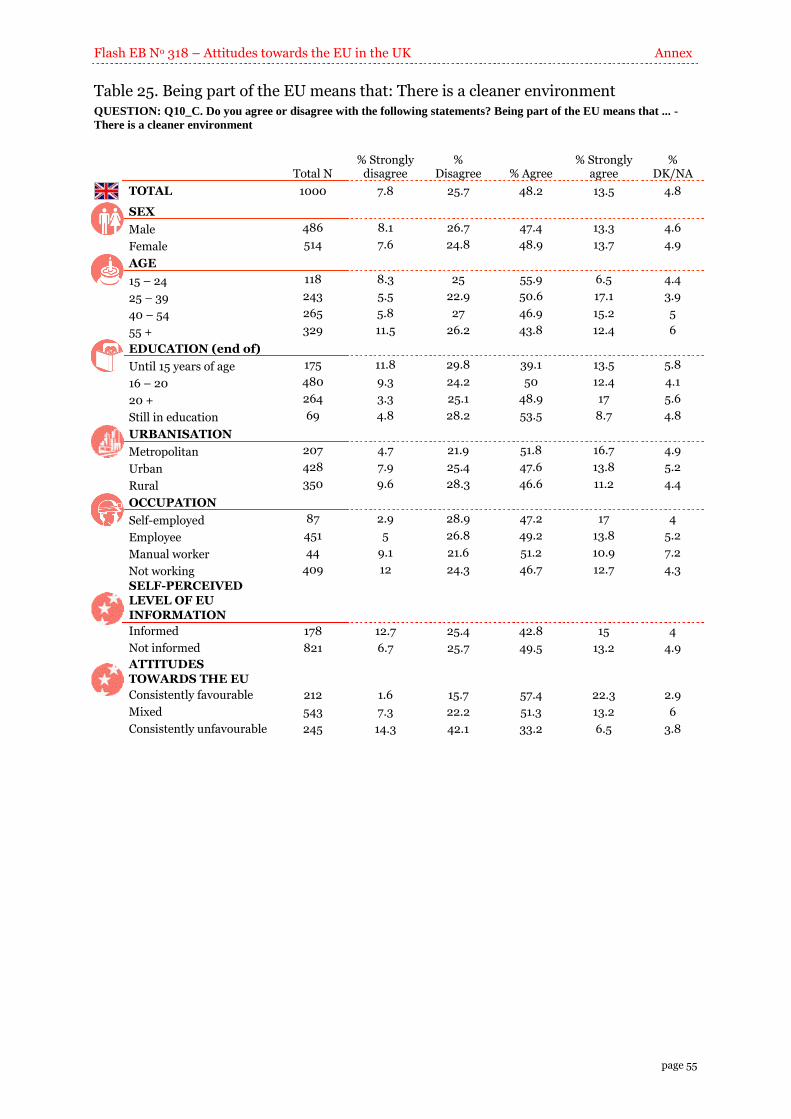
Flash EB No 318 – Attitudes towards the EU in the UK Annex
page 55
Table 25. Being part of the EU means that: There is a cleaner environment QUESTION: Q10_C. Do you agree or disagree with the following statements? Being part of the EU means that ... -
There is a cleaner environment
Total N
% Strongly disagree
% Disagree % Agree
% Strongly agree
% DK/NA
TOTAL 1000 7.8 25.7 48.2 13.5 4.8
SEX
Male 486 8.1 26.7 47.4 13.3 4.6
Female 514 7.6 24.8 48.9 13.7 4.9
AGE
15 – 24 118 8.3 25 55.9 6.5 4.4
25 – 39 243 5.5 22.9 50.6 17.1 3.9
40 – 54 265 5.8 27 46.9 15.2 5
55 + 329 11.5 26.2 43.8 12.4 6
EDUCATION (end of)
Until 15 years of age 175 11.8 29.8 39.1 13.5 5.8
16 – 20 480 9.3 24.2 50 12.4 4.1
20 + 264 3.3 25.1 48.9 17 5.6
Still in education 69 4.8 28.2 53.5 8.7 4.8
URBANISATION
Metropolitan 207 4.7 21.9 51.8 16.7 4.9
Urban 428 7.9 25.4 47.6 13.8 5.2
Rural 350 9.6 28.3 46.6 11.2 4.4
OCCUPATION
Self-employed 87 2.9 28.9 47.2 17 4
Employee 451 5 26.8 49.2 13.8 5.2
Manual worker 44 9.1 21.6 51.2 10.9 7.2
Not working 409 12 24.3 46.7 12.7 4.3
SELF-PERCEIVED LEVEL OF EU
INFORMATION
Informed 178 12.7 25.4 42.8 15 4
Not informed 821 6.7 25.7 49.5 13.2 4.9
ATTITUDES
TOWARDS THE EU
Consistently favourable 212 1.6 15.7 57.4 22.3 2.9
Mixed 543 7.3 22.2 51.3 13.2 6
Consistently unfavourable 245 14.3 42.1 33.2 6.5 3.8

Annex Flash EB No 318 – Attitudes towards the EU in the UK
page 56
Table 26. Being part of the EU means that: The UK has more say in global trade negotiations QUESTION: Q10_D. Do you agree or disagree with the following statements? Being part of the EU means that ... -
The UK has more say in global trade negotiations
Total N
% Strongly disagree
% Disagree % Agree
% Strongly agree
% DK/NA
TOTAL 1000 9.5 23.6 44.4 13.3 9.2
SEX
Male 486 12.1 25 41.7 15.2 6
Female 514 7.1 22.3 47 11.5 12.1
AGE
15 – 24 118 4.3 12.3 66.4 8.9 8
25 – 39 243 4.2 20.9 47 17.9 9.9
40 – 54 265 11.6 24.4 42.4 13.3 8.4
55 + 329 13.7 28.6 36.7 10.7 10.3
EDUCATION (end of)
Until 15 years of age 175 12.3 27.2 33.4 13.3 13.7
16 – 20 480 10.5 26.4 45.3 9.1 8.7
20 + 264 7.3 19.5 44.1 20.7 8.4
Still in education 69 3.5 9.8 67.1 16.3 3.3
URBANISATION
Metropolitan 207 4.2 22.5 47 16.9 9.4
Urban 428 11.5 22 44.1 12.4 10
Rural 350 10.3 26.8 42.7 12.6 7.6
OCCUPATION
Self-employed 87 11.8 19.8 51.8 10.2 6.4
Employee 451 6.2 23.4 48.3 13.3 8.8
Manual worker 44 11.8 27.6 31.8 10.8 18
Not working 409 12.5 24.5 39.7 14.5 8.8
SELF-PERCEIVED
LEVEL OF EU INFORMATION
Informed 178 17.6 21.2 34.3 23.5 3.3
Not informed 821 7.8 24.1 46.7 11.1 10.3
ATTITUDES TOWARDS THE EU
Consistently favourable 212 3.6 10.5 57.4 26.4 2.1
Mixed 543 7 22.2 45.2 11.7 13.8
Consistently unfavourable 245 20.3 38.2 31.2 5.4 4.9
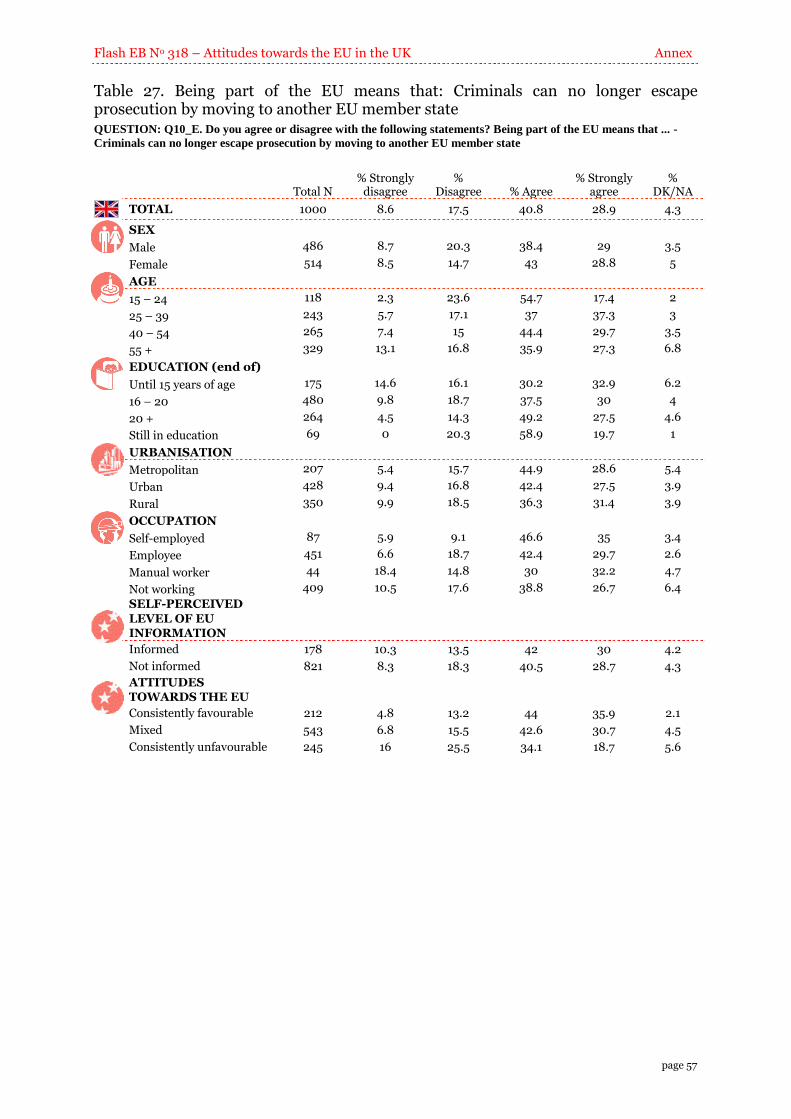
Flash EB No 318 – Attitudes towards the EU in the UK Annex
page 57
Table 27. Being part of the EU means that: Criminals can no longer escape prosecution by moving to another EU member state QUESTION: Q10_E. Do you agree or disagree with the following statements? Being part of the EU means that ... -
Criminals can no longer escape prosecution by moving to another EU member state
Total N
% Strongly disagree
% Disagree % Agree
% Strongly agree
% DK/NA
TOTAL 1000 8.6 17.5 40.8 28.9 4.3
SEX
Male 486 8.7 20.3 38.4 29 3.5
Female 514 8.5 14.7 43 28.8 5
AGE
15 – 24 118 2.3 23.6 54.7 17.4 2
25 – 39 243 5.7 17.1 37 37.3 3
40 – 54 265 7.4 15 44.4 29.7 3.5
55 + 329 13.1 16.8 35.9 27.3 6.8
EDUCATION (end of)
Until 15 years of age 175 14.6 16.1 30.2 32.9 6.2
16 – 20 480 9.8 18.7 37.5 30 4
20 + 264 4.5 14.3 49.2 27.5 4.6
Still in education 69 0 20.3 58.9 19.7 1
URBANISATION
Metropolitan 207 5.4 15.7 44.9 28.6 5.4
Urban 428 9.4 16.8 42.4 27.5 3.9
Rural 350 9.9 18.5 36.3 31.4 3.9
OCCUPATION
Self-employed 87 5.9 9.1 46.6 35 3.4
Employee 451 6.6 18.7 42.4 29.7 2.6
Manual worker 44 18.4 14.8 30 32.2 4.7
Not working 409 10.5 17.6 38.8 26.7 6.4
SELF-PERCEIVED
LEVEL OF EU INFORMATION
Informed 178 10.3 13.5 42 30 4.2
Not informed 821 8.3 18.3 40.5 28.7 4.3
ATTITUDES TOWARDS THE EU
Consistently favourable 212 4.8 13.2 44 35.9 2.1
Mixed 543 6.8 15.5 42.6 30.7 4.5
Consistently unfavourable 245 16 25.5 34.1 18.7 5.6

Annex Flash EB No 318 – Attitudes towards the EU in the UK
page 58
Table 28. Being part of the EU means that: We can regulate financial markets more effectively QUESTION: Q10_F. Do you agree or disagree with the following statements? Being part of the EU means that ... - We
can regulate financial markets more effectively
Total N
% Strongly disagree
% Disagree % Agree
% Strongly agree
% DK/NA
TOTAL 1000 11.1 26 43.4 11.4 8.1
SEX
Male 486 15 27.8 37.7 13 6.5
Female 514 7.4 24.2 48.8 9.9 9.7
AGE
15 – 24 118 4.3 14.5 62.3 10.6 8.3
25 – 39 243 6.8 21 50.7 14.4 7.1
40 – 54 265 12.6 28.6 41.3 11.1 6.4
55 + 329 14.4 29.1 35.4 10.2 10.9
EDUCATION (end of)
Until 15 years of age 175 10.8 32.7 32.6 10.4 13.5
16 – 20 480 12.5 26.1 43.7 9.6 8
20 + 264 9.6 24.6 46.4 14.9 4.5
Still in education 69 5.4 12 58.9 14.7 9
URBANISATION
Metropolitan 207 7.4 27.1 43.3 12.3 10
Urban 428 12.2 23.9 43.4 11.3 9.2
Rural 350 11.8 28.6 43.1 11.5 5.1
OCCUPATION
Self-employed 87 8.8 30.7 46.6 13 0.8
Employee 451 9 24.3 47.4 11.9 7.4
Manual worker 44 11.8 31.1 40.2 4.9 12
Not working 409 13.6 26.6 38.5 11.5 9.8
SELF-PERCEIVED
LEVEL OF EU INFORMATION
Informed 178 19.4 25.8 33.7 16.7 4.4
Not informed 821 9.3 26 45.6 10.3 8.8
ATTITUDES TOWARDS THE EU
Consistently favourable 212 4.1 14.6 55 22.1 4.2
Mixed 543 7.6 23.1 48.4 10 10.9
Consistently unfavourable 245 24.9 42.1 22.5 5.3 5.3

Flash EB No 318 – Attitudes towards the EU in the UK Annex
page 59
Table 29. If the UK was not in the EU ... QUESTION: Q11. If we were not in the EU and were unable to secure a free-trade agreement with it, which of the
following best describes your opinion?
Total N
% I wouldn't care if we lost any of
these benefits
% I would care a bit if we lost one or more of these benefits
% I would care greatly if we lost one or
more of these benefits % DK/NA
TOTAL 1000 16.6 45.8 34.7 2.9
SEX
Male 486 21 42.8 34.2 1.9
Female 514 12.3 48.6 35.2 3.9
AGE
15 – 24 118 3.9 66.7 29.4 0
25 – 39 243 11.9 46.8 37.5 3.8
40 – 54 265 16.6 45 37.8 0.6
55 + 329 23.5 39.5 31.3 5.7
EDUCATION (end of)
Until 15 years of age 175 27 40.4 25.5 7.1
16 – 20 480 15.5 50 32.2 2.3
20 + 264 12.9 40.9 44.4 1.8
Still in education 69 9.6 48.7 41.7 0
URBANISATION
Metropolitan 207 13.2 43.1 41.6 2.1
Urban 428 14.9 46.9 34.8 3.4
Rural 350 20.9 46.1 30.4 2.6
OCCUPATION
Self-employed 87 9.8 48.8 39.1 2.3
Employee 451 13.3 51 34.5 1.2
Manual worker 44 14.5 45.9 30.8 8.8
Not working 409 21.8 39.4 34.6 4.2
SELF-PERCEIVED
LEVEL OF EU
INFORMATION
Informed 178 23.7 31.2 43.1 2
Not informed 821 15 49 33 3.1
ATTITUDES
TOWARDS THE EU
Consistently favourable 212 3.6 31.5 63.8 1
Mixed 543 12 50.5 33.1 4.5
Consistently unfavourable 245 38 47.7 13.1 1.2

Annex Flash EB No 318 – Attitudes towards the EU in the UK
page 60
Table 30. EU has a role in tackling various issues QUESTION: Q12_A-H. Which of the following issues do you feel the EU has a role in?
% of “The EU has a role” shown
To
tal
N
Eco
no
mic
g
ov
ern
an
ce
Reg
ula
tin
g
fin
an
cia
l m
ark
ets
Pro
tect
ing
hu
ma
n
rig
hts
Glo
ba
l p
ov
erty
Th
e se
curi
ty o
f en
erg
y s
up
pli
es
Ta
ckli
ng
cli
ma
te
cha
ng
e
Glo
ba
l te
rro
rism
Ta
ckli
ng
cro
ss-
bo
rder
cri
me
TOTAL 1000 68.7 70 84.7 71.1 62.1 76.2 76.3 79.8
SEX
Male 486 69 66 82 69.3 62.1 77.2 73.8 77.7
Female 514 68.4 73.7 87.3 72.8 62.1 75.3 78.6 81.7
AGE
15 – 24 118 79 70.8 89.6 68.1 59.8 81.6 81.9 79
25 – 39 243 76.2 80.2 90.7 77.8 69.4 83.7 78.4 87
40 – 54 265 66.4 69.8 83.1 69.7 62.1 76.3 76.8 80.1
55 + 329 61 62.7 80.4 68.6 58.3 69 71 75.9
EDUCATION (end of)
Until 15 years of age 175 54.7 56.2 78.2 65 55.4 66.8 67.7 70.3
16 – 20 480 65.5 68.8 83.3 69.2 59.4 74.4 77.9 78.3
20 + 264 81.3 80.6 91.4 77.2 71.8 84.8 78.6 89.8
Still in education 69 82.7 73.5 89.3 76.9 59.8 82.6 77.4 77.1
URBANISATION
Metropolitan 207 71.5 77.7 88.9 74 64.7 79.4 74.7 85.6
Urban 428 66.1 67.9 86 71.3 64.6 76.7 77.5 81.4
Rural 350 70.7 68.2 80.9 68.9 57 74 75.6 74.4
OCCUPATION
Self-employed 87 68.2 68.5 89 64.9 55 81.9 76.6 80.5
Employee 451 73.1 74.6 86.3 73.7 65.7 81 80 83.6
Manual worker 44 59.4 67.4 79.4 70.6 63.4 64.5 76.5 66.8
Not working 409 65.4 65.7 82.8 69.7 59.5 71.4 72.4 77.1
SELF-PERCEIVED
LEVEL OF EU
INFORMATION
Informed 178 70.2 67.9 78.4 70.6 63.4 77.9 71.7 79.4
Not informed 821 68.4 70.4 86.1 71.2 62 75.9 77.4 80
ATTITUDES TOWARDS
THE EU
Consistently favourable 212 81.3 78.9 95.1 81.5 73.4 87.8 84 88.2
Mixed 543 69.8 71.9 85 72.5 64.9 78.5 78.9 80.6
Consistently unfavourable 245 55.3 57.8 75.1 59 46.1 61.2 63.8 70.7

Flash EB No 318 – Attitudes towards the EU in the UK Annex
page 61
Table 31. Perception of the British television QUESTION: Q13_A. Do you think that British ...[READ A-C] presents the European Union too positively, too
negatively or objectively? - Television
Total N
% Too positively
% Too negatively
% Objectively % DK/NA
TOTAL 1000 16.5 26.8 43.8 12.9
SEX
Male 486 19 28.2 43.7 9.1
Female 514 14.1 25.6 43.9 16.4
AGE
15 – 24 118 24.9 14.4 51.7 8.9
25 – 39 243 14.2 25.2 49.8 10.8
40 – 54 265 11.9 31.3 45.5 11.3
55 + 329 18.9 28.3 36.7 16.1
EDUCATION (end of)
Until 15 years of age 175 22.2 26.7 34.5 16.5
16 – 20 480 14.8 25.7 46.9 12.7
20 + 264 12 31.9 45.2 10.9
Still in education 69 29.8 17.7 43.8 8.8
URBANISATION
Metropolitan 207 13.9 31.2 39.5 15.5
Urban 428 16.3 27.2 44.3 12.2
Rural 350 18.1 24.8 46 11.2
OCCUPATION
Self-employed 87 14 39.1 40.6 6.2
Employee 451 13.7 26.6 48.7 11
Manual worker 44 18 31.3 37.1 13.6
Not working 409 19.6 24.4 40 16
SELF-PERCEIVED LEVEL OF EU
INFORMATION
Informed 178 25.9 32.1 34.4 7.6
Not informed 821 14.4 25.8 45.9 13.9
ATTITUDES
TOWARDS THE EU
Consistently favourable 212 11.2 41.4 39.8 7.7
Mixed 543 14.2 24 45.9 15.9
Consistently unfavourable 245 26.1 20.6 42.6 10.7
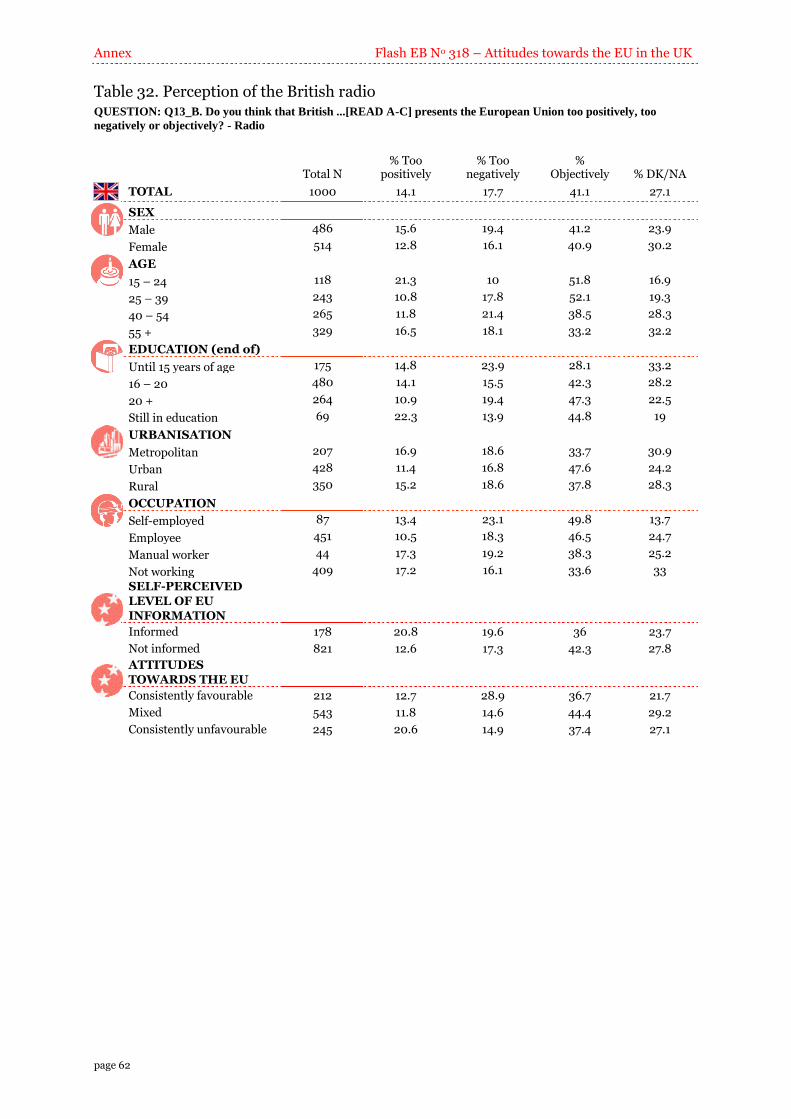
Annex Flash EB No 318 – Attitudes towards the EU in the UK
page 62
Table 32. Perception of the British radio QUESTION: Q13_B. Do you think that British ...[READ A-C] presents the European Union too positively, too
negatively or objectively? - Radio
Total N
% Too positively
% Too negatively
% Objectively % DK/NA
TOTAL 1000 14.1 17.7 41.1 27.1
SEX
Male 486 15.6 19.4 41.2 23.9
Female 514 12.8 16.1 40.9 30.2
AGE
15 – 24 118 21.3 10 51.8 16.9
25 – 39 243 10.8 17.8 52.1 19.3
40 – 54 265 11.8 21.4 38.5 28.3
55 + 329 16.5 18.1 33.2 32.2
EDUCATION (end of)
Until 15 years of age 175 14.8 23.9 28.1 33.2
16 – 20 480 14.1 15.5 42.3 28.2
20 + 264 10.9 19.4 47.3 22.5
Still in education 69 22.3 13.9 44.8 19
URBANISATION
Metropolitan 207 16.9 18.6 33.7 30.9
Urban 428 11.4 16.8 47.6 24.2
Rural 350 15.2 18.6 37.8 28.3
OCCUPATION
Self-employed 87 13.4 23.1 49.8 13.7
Employee 451 10.5 18.3 46.5 24.7
Manual worker 44 17.3 19.2 38.3 25.2
Not working 409 17.2 16.1 33.6 33
SELF-PERCEIVED
LEVEL OF EU
INFORMATION
Informed 178 20.8 19.6 36 23.7
Not informed 821 12.6 17.3 42.3 27.8
ATTITUDES
TOWARDS THE EU
Consistently favourable 212 12.7 28.9 36.7 21.7
Mixed 543 11.8 14.6 44.4 29.2
Consistently unfavourable 245 20.6 14.9 37.4 27.1
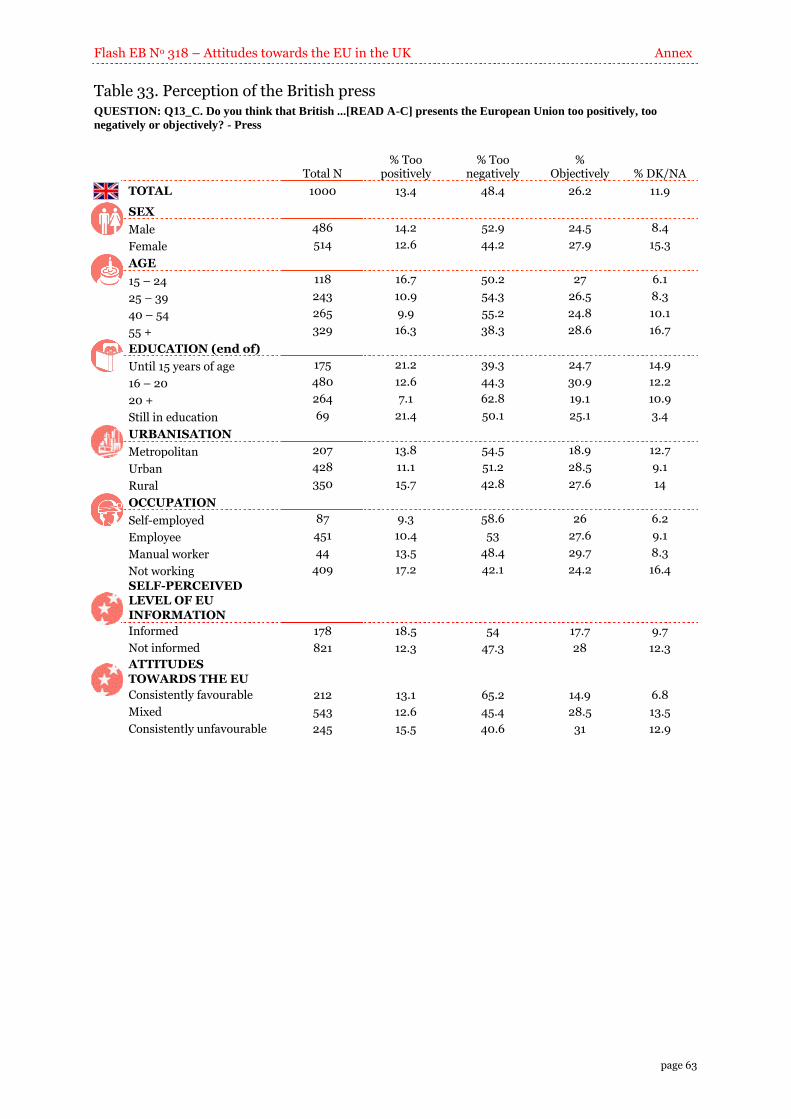
Flash EB No 318 – Attitudes towards the EU in the UK Annex
page 63
Table 33. Perception of the British press QUESTION: Q13_C. Do you think that British ...[READ A-C] presents the European Union too positively, too
negatively or objectively? - Press
Total N
% Too positively
% Too negatively
% Objectively % DK/NA
TOTAL 1000 13.4 48.4 26.2 11.9
SEX
Male 486 14.2 52.9 24.5 8.4
Female 514 12.6 44.2 27.9 15.3
AGE
15 – 24 118 16.7 50.2 27 6.1
25 – 39 243 10.9 54.3 26.5 8.3
40 – 54 265 9.9 55.2 24.8 10.1
55 + 329 16.3 38.3 28.6 16.7
EDUCATION (end of)
Until 15 years of age 175 21.2 39.3 24.7 14.9
16 – 20 480 12.6 44.3 30.9 12.2
20 + 264 7.1 62.8 19.1 10.9
Still in education 69 21.4 50.1 25.1 3.4
URBANISATION
Metropolitan 207 13.8 54.5 18.9 12.7
Urban 428 11.1 51.2 28.5 9.1
Rural 350 15.7 42.8 27.6 14
OCCUPATION
Self-employed 87 9.3 58.6 26 6.2
Employee 451 10.4 53 27.6 9.1
Manual worker 44 13.5 48.4 29.7 8.3
Not working 409 17.2 42.1 24.2 16.4
SELF-PERCEIVED LEVEL OF EU
INFORMATION
Informed 178 18.5 54 17.7 9.7
Not informed 821 12.3 47.3 28 12.3
ATTITUDES
TOWARDS THE EU
Consistently favourable 212 13.1 65.2 14.9 6.8
Mixed 543 12.6 45.4 28.5 13.5
Consistently unfavourable 245 15.5 40.6 31 12.9

Annex Flash EB No 318 – Attitudes towards the EU in the UK
page 64
Table 34. Knowledge of the EU, its policies and institutions QUESTION: Q14. How much do you feel you know about the European Union, its policies, its institutions? Would
you say you know ...?
Total N
% A great deal
% Quite a lot % A little
% Nothing at all
% DK/NA
TOTAL 1000 1.7 16.1 68.3 13.7 0.2
SEX
Male 486 2.3 22.4 65.4 9.6 0.3
Female 514 1 10.1 71.1 17.7 0.1
AGE
15 – 24 118 0 6.3 73.5 20.3 0
25 – 39 243 2.6 15.2 63.1 19 0
40 – 54 265 1.4 17 71.8 9.8 0
55 + 329 1.8 17.9 67.8 11.9 0.6
EDUCATION (end of)
Until 15 years of age 175 0.8 11.8 63 23.7 0.7
16 – 20 480 0.5 14.3 71.7 13.3 0.1
20 + 264 3.3 24 65.8 6.9 0
Still in education 69 3.4 12.1 67.7 16.7 0
URBANISATION
Metropolitan 207 2.9 16.6 68.2 11.8 0.6
Urban 428 1.3 15.2 70.6 12.7 0.2
Rural 350 0.9 17.3 66.2 15.5 0
OCCUPATION
Self-employed 87 3 18.9 72.1 6 0
Employee 451 1.6 15.6 68 14.8 0
Manual worker 44 0 8.3 70.5 21.2 0
Not working 409 1.2 17 67.9 13.4 0.5
SELF-PERCEIVED
LEVEL OF EU
INFORMATION
Informed 178 9.3 90.7 0 0 0
Not informed 821 0 0 83.2 16.8 0
ATTITUDES
TOWARDS THE EU
Consistently favourable 212 4.3 25.2 61 9.6 0
Mixed 543 0.5 10.4 69.7 19.1 0.2
Consistently unfavourable 245 2 20.9 71.4 5.4 0.3

Flash EB No 318 – Attitudes towards the EU in the UK Annex
page 65
Table 35. Information available on the EU is simple and clear QUESTION: Q15. Would you agree that the current information available on the European Union is simple and clear
enough?
Total N
% Strongly disagree
% Disagree % Agree
% Strongly agree
% DK/NA
TOTAL 1000 20.3 34.9 29.5 5 10.4
SEX
Male 486 22.1 33.1 27.5 7.3 10
Female 514 18.6 36.5 31.3 2.9 10.7
AGE
15 – 24 118 2 25.4 46.9 10.8 14.9
25 – 39 243 14 35.7 34 4.9 11.5
40 – 54 265 26 37 23.9 4.2 8.8
55 + 329 26.2 35.7 25 3.2 9.9
EDUCATION (end of)
Until 15 years of age 175 28.1 37.5 22.7 3.2 8.5
16 – 20 480 21 33.8 30.4 4.3 10.4
20 + 264 18.4 37.6 27.8 4.1 12.1
Still in education 69 4.8 23.2 45 18.4 8.5
URBANISATION
Metropolitan 207 19.1 31.2 32.9 5.9 10.9
Urban 428 20.9 35.8 28.5 4.6 10.2
Rural 350 20.3 36.2 28.4 5 10
OCCUPATION
Self-employed 87 19.9 41.5 22.2 3.3 13.3
Employee 451 18.6 35.7 30.3 4.8 10.7
Manual worker 44 27 32.6 19.6 14.4 6.5
Not working 409 21.8 33 31 4.5 9.7
SELF-PERCEIVED LEVEL OF EU
INFORMATION
Informed 178 22 35.5 29.7 7.6 5.1
Not informed 821 19.9 34.7 29.5 4.5 11.5
ATTITUDES
TOWARDS THE EU
Consistently favourable 212 5.7 41.5 31.3 9 12.5
Mixed 543 19.3 32.1 32.5 5 11.1
Consistently unfavourable 245 35 35.4 21 1.7 6.9
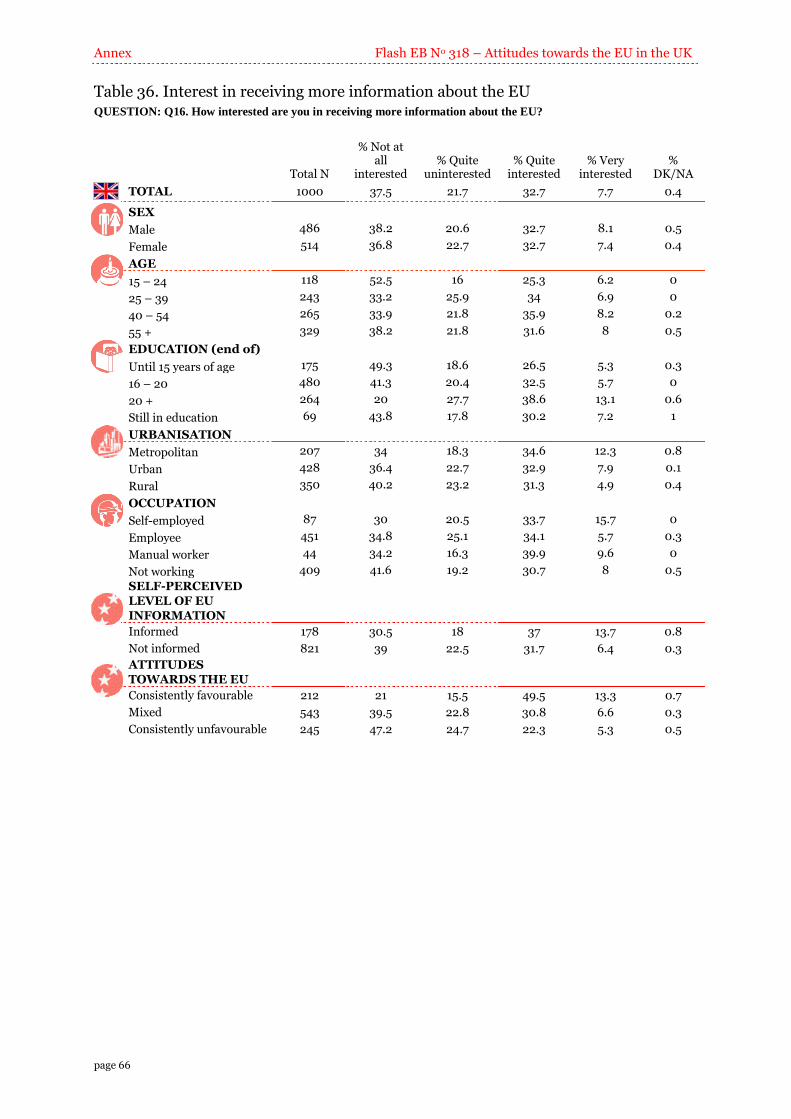
Annex Flash EB No 318 – Attitudes towards the EU in the UK
page 66
Table 36. Interest in receiving more information about the EU QUESTION: Q16. How interested are you in receiving more information about the EU?
Total N
% Not at all
interested % Quite
uninterested % Quite
interested % Very
interested %
DK/NA
TOTAL 1000 37.5 21.7 32.7 7.7 0.4
SEX
Male 486 38.2 20.6 32.7 8.1 0.5
Female 514 36.8 22.7 32.7 7.4 0.4
AGE
15 – 24 118 52.5 16 25.3 6.2 0
25 – 39 243 33.2 25.9 34 6.9 0
40 – 54 265 33.9 21.8 35.9 8.2 0.2
55 + 329 38.2 21.8 31.6 8 0.5
EDUCATION (end of)
Until 15 years of age 175 49.3 18.6 26.5 5.3 0.3
16 – 20 480 41.3 20.4 32.5 5.7 0
20 + 264 20 27.7 38.6 13.1 0.6
Still in education 69 43.8 17.8 30.2 7.2 1
URBANISATION
Metropolitan 207 34 18.3 34.6 12.3 0.8
Urban 428 36.4 22.7 32.9 7.9 0.1
Rural 350 40.2 23.2 31.3 4.9 0.4
OCCUPATION
Self-employed 87 30 20.5 33.7 15.7 0
Employee 451 34.8 25.1 34.1 5.7 0.3
Manual worker 44 34.2 16.3 39.9 9.6 0
Not working 409 41.6 19.2 30.7 8 0.5
SELF-PERCEIVED
LEVEL OF EU
INFORMATION
Informed 178 30.5 18 37 13.7 0.8
Not informed 821 39 22.5 31.7 6.4 0.3
ATTITUDES
TOWARDS THE EU
Consistently favourable 212 21 15.5 49.5 13.3 0.7
Mixed 543 39.5 22.8 30.8 6.6 0.3
Consistently unfavourable 245 47.2 24.7 22.3 5.3 0.5
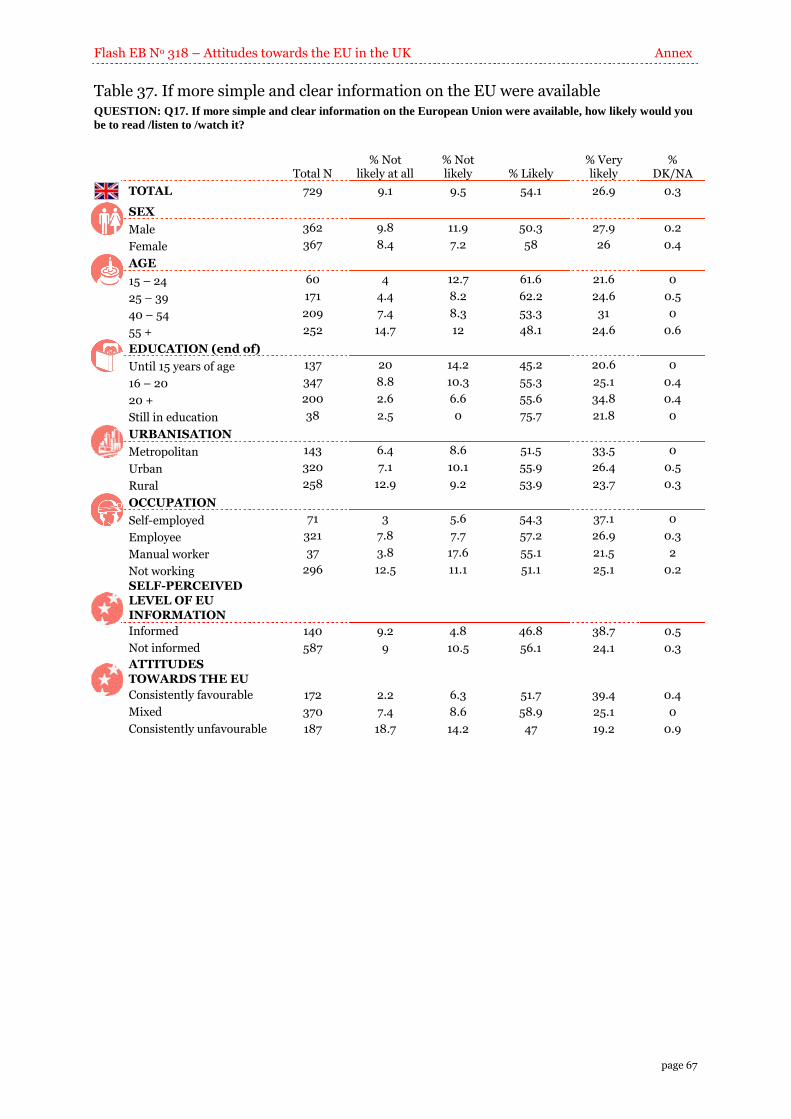
Flash EB No 318 – Attitudes towards the EU in the UK Annex
page 67
Table 37. If more simple and clear information on the EU were available QUESTION: Q17. If more simple and clear information on the European Union were available, how likely would you
be to read /listen to /watch it?
Total N
% Not likely at all
% Not likely % Likely
% Very likely
% DK/NA
TOTAL 729 9.1 9.5 54.1 26.9 0.3
SEX
Male 362 9.8 11.9 50.3 27.9 0.2
Female 367 8.4 7.2 58 26 0.4
AGE
15 – 24 60 4 12.7 61.6 21.6 0
25 – 39 171 4.4 8.2 62.2 24.6 0.5
40 – 54 209 7.4 8.3 53.3 31 0
55 + 252 14.7 12 48.1 24.6 0.6
EDUCATION (end of)
Until 15 years of age 137 20 14.2 45.2 20.6 0
16 – 20 347 8.8 10.3 55.3 25.1 0.4
20 + 200 2.6 6.6 55.6 34.8 0.4
Still in education 38 2.5 0 75.7 21.8 0
URBANISATION
Metropolitan 143 6.4 8.6 51.5 33.5 0
Urban 320 7.1 10.1 55.9 26.4 0.5
Rural 258 12.9 9.2 53.9 23.7 0.3
OCCUPATION
Self-employed 71 3 5.6 54.3 37.1 0
Employee 321 7.8 7.7 57.2 26.9 0.3
Manual worker 37 3.8 17.6 55.1 21.5 2
Not working 296 12.5 11.1 51.1 25.1 0.2
SELF-PERCEIVED LEVEL OF EU
INFORMATION
Informed 140 9.2 4.8 46.8 38.7 0.5
Not informed 587 9 10.5 56.1 24.1 0.3
ATTITUDES
TOWARDS THE EU
Consistently favourable 172 2.2 6.3 51.7 39.4 0.4
Mixed 370 7.4 8.6 58.9 25.1 0
Consistently unfavourable 187 18.7 14.2 47 19.2 0.9

Annex Flash EB No 318 – Attitudes towards the EU in the UK
page 68
Table 38. Responsibility for keeping citizens informed about the EU and its decisions QUESTION: Q18. Who do you think should be responsible for keeping you informed about the EU and its decisions?
Please choose ONE from the list that I am going to read to you.
To
tal
N
% T
he
EU
in
stit
uti
on
s
% T
he
Bri
tish
g
ov
ern
men
t
% T
he
loca
l g
ov
ern
men
t
% P
oli
tica
l p
art
ies
% N
ewsp
ap
ers/
te
lev
isio
n
% E
U i
nfo
rma
tio
n
cen
tres
in
th
e U
K
% D
K/N
A
TOTAL 1000 6.2 48.2 12.1 3.5 17 10.9 2
SEX
Male 486 6 52.6 9.8 3.4 16.2 10.2 1.7
Female 514 6.5 44.1 14.3 3.6 17.7 11.5 2.3
AGE
15 – 24 118 4 38 16.4 2.3 27.1 10 2.2
25 – 39 243 4.3 47.6 15.8 5.4 17.8 7.6 1.7
40 – 54 265 10.8 48.8 10.5 2.4 14.3 11.6 1.6
55 + 329 4.8 52.8 10.4 3.6 14.2 11.8 2.4
EDUCATION (end of)
Until 15 years of age 175 4.8 52.1 15.3 2.6 12.7 9.7 2.8
16 – 20 480 5.3 50.5 13.9 3.8 16.2 8.2 2.1
20 + 264 9.4 47 7.1 3.6 16.5 15.6 0.8
Still in education 69 3.9 34.9 10.7 3.4 32.8 10.5 3.7
URBANISATION
Metropolitan 207 6.6 49.8 10.5 2.2 15.8 12.7 2.4
Urban 428 7.4 48.7 12.9 4.8 15.3 10.2 0.6
Rural 350 4.6 48.2 12.3 2.8 19.1 9.9 3.1
OCCUPATION
Self-employed 87 13.7 48.4 11.3 0 13.2 13.4 0
Employee 451 7.7 50.7 10.9 3.6 15.4 9.9 1.9
Manual worker 44 5.8 42.1 27.6 1.5 17.7 5.3 0
Not working 409 3 47.2 12 4.3 19.3 11.5 2.7
SELF-PERCEIVED
LEVEL OF EU
INFORMATION
Informed 178 5.5 55.5 4.4 3.1 15.2 13.7 2.6
Not informed 821 6.3 46.8 13.8 3.6 17.4 10.2 1.8
ATTITUDES TOWARDS
THE EU
Consistently favourable 212 4.6 49.9 7.5 4.1 14.1 19.1 0.7
Mixed 543 6.5 42.9 16.3 3.6 19.2 9.8 1.7
Consistently unfavourable 245 7.1 58.6 6.9 2.9 14.7 6 3.8
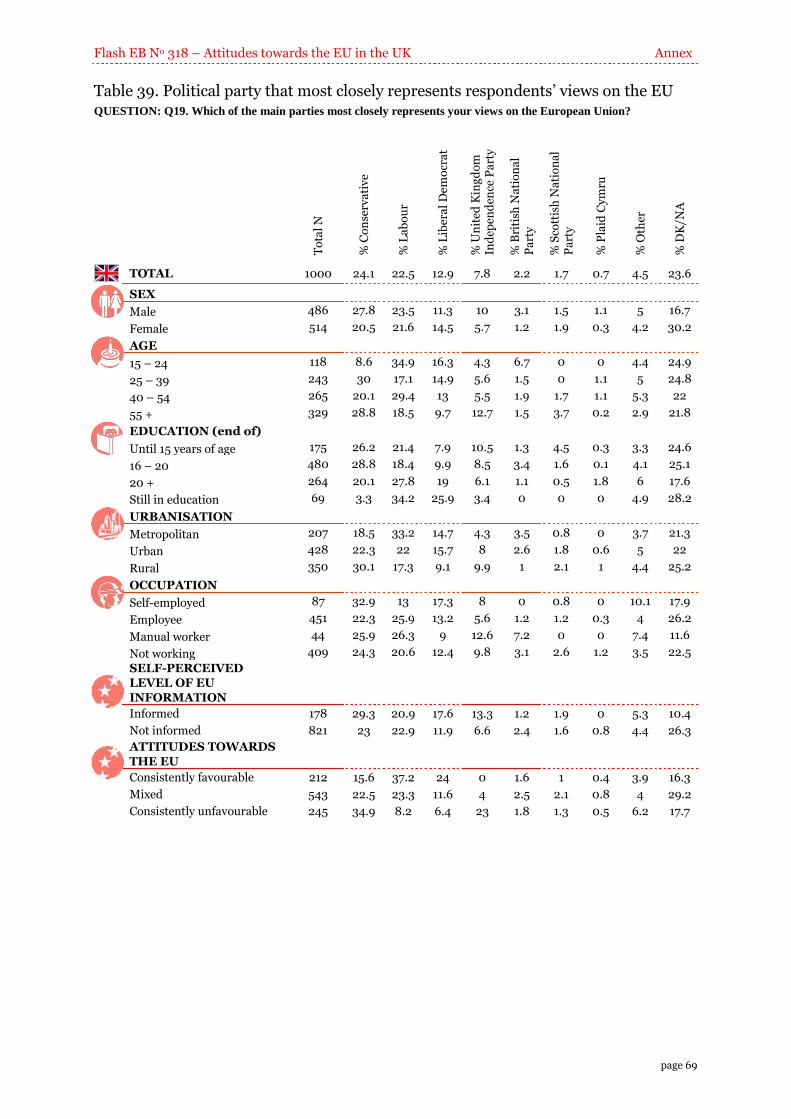
Flash EB No 318 – Attitudes towards the EU in the UK Annex
page 69
Table 39. Political party that most closely represents respondents’ views on the EU QUESTION: Q19. Which of the main parties most closely represents your views on the European Union?
To
tal
N
% C
on
serv
ati
ve
% L
ab
ou
r
% L
iber
al
Dem
ocr
at
% U
nit
ed K
ing
do
m
Ind
epen
den
ce P
art
y
% B
riti
sh N
ati
on
al
Pa
rty
% S
cott
ish
Na
tio
na
l P
art
y
% P
laid
Cy
mru
% O
ther
% D
K/N
A
TOTAL 1000 24.1 22.5 12.9 7.8 2.2 1.7 0.7 4.5 23.6
SEX
Male 486 27.8 23.5 11.3 10 3.1 1.5 1.1 5 16.7
Female 514 20.5 21.6 14.5 5.7 1.2 1.9 0.3 4.2 30.2
AGE
15 – 24 118 8.6 34.9 16.3 4.3 6.7 0 0 4.4 24.9
25 – 39 243 30 17.1 14.9 5.6 1.5 0 1.1 5 24.8
40 – 54 265 20.1 29.4 13 5.5 1.9 1.7 1.1 5.3 22
55 + 329 28.8 18.5 9.7 12.7 1.5 3.7 0.2 2.9 21.8
EDUCATION (end of)
Until 15 years of age 175 26.2 21.4 7.9 10.5 1.3 4.5 0.3 3.3 24.6
16 – 20 480 28.8 18.4 9.9 8.5 3.4 1.6 0.1 4.1 25.1
20 + 264 20.1 27.8 19 6.1 1.1 0.5 1.8 6 17.6
Still in education 69 3.3 34.2 25.9 3.4 0 0 0 4.9 28.2
URBANISATION
Metropolitan 207 18.5 33.2 14.7 4.3 3.5 0.8 0 3.7 21.3
Urban 428 22.3 22 15.7 8 2.6 1.8 0.6 5 22
Rural 350 30.1 17.3 9.1 9.9 1 2.1 1 4.4 25.2
OCCUPATION
Self-employed 87 32.9 13 17.3 8 0 0.8 0 10.1 17.9
Employee 451 22.3 25.9 13.2 5.6 1.2 1.2 0.3 4 26.2
Manual worker 44 25.9 26.3 9 12.6 7.2 0 0 7.4 11.6
Not working 409 24.3 20.6 12.4 9.8 3.1 2.6 1.2 3.5 22.5
SELF-PERCEIVED
LEVEL OF EU
INFORMATION
Informed 178 29.3 20.9 17.6 13.3 1.2 1.9 0 5.3 10.4
Not informed 821 23 22.9 11.9 6.6 2.4 1.6 0.8 4.4 26.3
ATTITUDES TOWARDS
THE EU
Consistently favourable 212 15.6 37.2 24 0 1.6 1 0.4 3.9 16.3
Mixed 543 22.5 23.3 11.6 4 2.5 2.1 0.8 4 29.2
Consistently unfavourable 245 34.9 8.2 6.4 23 1.8 1.3 0.5 6.2 17.7
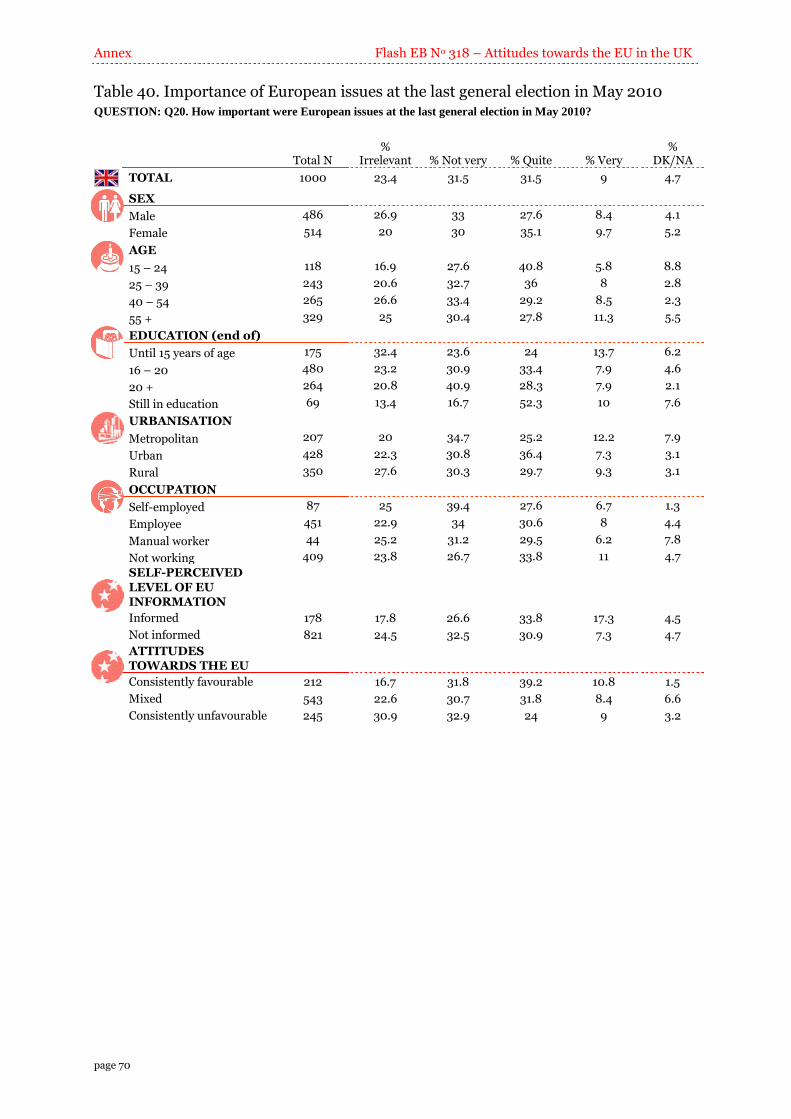
Annex Flash EB No 318 – Attitudes towards the EU in the UK
page 70
Table 40. Importance of European issues at the last general election in May 2010 QUESTION: Q20. How important were European issues at the last general election in May 2010?
Total N
% Irrelevant % Not very % Quite % Very
% DK/NA
TOTAL 1000 23.4 31.5 31.5 9 4.7
SEX
Male 486 26.9 33 27.6 8.4 4.1
Female 514 20 30 35.1 9.7 5.2
AGE
15 – 24 118 16.9 27.6 40.8 5.8 8.8
25 – 39 243 20.6 32.7 36 8 2.8
40 – 54 265 26.6 33.4 29.2 8.5 2.3
55 + 329 25 30.4 27.8 11.3 5.5
EDUCATION (end of)
Until 15 years of age 175 32.4 23.6 24 13.7 6.2
16 – 20 480 23.2 30.9 33.4 7.9 4.6
20 + 264 20.8 40.9 28.3 7.9 2.1
Still in education 69 13.4 16.7 52.3 10 7.6
URBANISATION
Metropolitan 207 20 34.7 25.2 12.2 7.9
Urban 428 22.3 30.8 36.4 7.3 3.1
Rural 350 27.6 30.3 29.7 9.3 3.1
OCCUPATION
Self-employed 87 25 39.4 27.6 6.7 1.3
Employee 451 22.9 34 30.6 8 4.4
Manual worker 44 25.2 31.2 29.5 6.2 7.8
Not working 409 23.8 26.7 33.8 11 4.7
SELF-PERCEIVED
LEVEL OF EU INFORMATION
Informed 178 17.8 26.6 33.8 17.3 4.5
Not informed 821 24.5 32.5 30.9 7.3 4.7
ATTITUDES TOWARDS THE EU
Consistently favourable 212 16.7 31.8 39.2 10.8 1.5
Mixed 543 22.6 30.7 31.8 8.4 6.6
Consistently unfavourable 245 30.9 32.9 24 9 3.2

Flash EB No 318 – Attitudes towards the EU in the UK Annex
page 71
II. Survey details
This Flash Eurobarometer 318 “Attitudes towards the EU in the United Kingdom” was conducted on
behalf of the European Commission Representation in the United Kingdom by Gallup Hungary.
Telephone interviews were conducted between the 22nd
and the 26th of November 2010, by Gallup UK.
Representativeness of the results
The sample is representative of the population aged 15 years and above.
Sizes of the sample
The sample size was 1000 respondents in the UK.
A weighting factor was applied to the national results in order to compute a marginal total for the
country in proportion to its population.
Questionnaires
The questionnaire prepared for this survey is reproduced at the end of this section (see hereafter).
Table of results
VOLUME C: RESPONDENTS’ DEMOGRAPHICS
The VOLUME C presents the country results broken down by the following socio-demographic
variables:
Sex (male, female)
Age (15-24, 25-39, 40-54, 55 +)
Education (15&-, 16-20, 21&+, still in full time education)
Subjective urbanisation (metropolitan zone; other town/urban centre; rural zone)
Occupation (self-employed, employee, manual worker, without a professional activity)
Self-perceived level of EU information (informed, not informed)
Attitudes towards the EU (consistently favourable, mixed, consistently unfavourable)
Sampling error
Surveys are designed and conducted to provide an estimate of a true value of characteristics of a
population at a given time. An estimate of a survey is unlikely to exactly equal the true population
quantity of interest for a variety of reasons. One of these reasons is that data in a survey are collected
from only some – a sample of – members of the population, this to make data collection cheaper and
faster. The “margin of error” is a common summary of sampling error, which quantifies uncertainty
about (or confidence in) a survey result.
Usually, one calculates a 95 percent confidence interval of the format: survey estimate +/- margin of
error. This interval of values will contain the true population value at least 95% of time.

Annex Flash EB No 318 – Attitudes towards the EU in the UK
page 72
For example, if it was estimated that 45% of EU citizens are in favour of a single European currency
and this estimate is based on a sample of 100 EU citizens, the associated margin of error is about 10
percentage points. The 95 percent confidence interval for support for a European single currency
would be (45%-10%) to (45%+10%), suggesting that in the EU the support for a European single
currency could range from 35% to 55%. Because of the small sample size of 100 EU citizens, there is
considerable uncertainty about whether or not the citizens of the EU support a single currency.
As a general rule, the more interviews conducted (sample size), the smaller the margin of error. Larger
samples are more likely to give results closer to the true population quantity and thus have smaller
margins of error. For example, a sample of 500 will produce a margin of error of no more than about
4.5 percentage points, and a sample of 1,000 will produce a margin of error of no more than about 3
percentage points.
Margin of error (95% confidence interval)
Survey
estimate
Sample size (n)
10 50 100 150 200 400 800 1000 2000 4000
5% 13.5% 6.0% 4.3% 3.5% 3.0% 2.1% 1.5% 1.4% 1.0% 0.7%
10% 18.6% 8.3% 5.9% 4.8% 4.2% 2.9% 2.1% 1.9% 1.3% 0.9%
25% 26.8% 12.0% 8.5% 6.9% 6.0% 4.2% 3.0% 2.7% 1.9% 1.3%
50% 31.0% 13.9% 9.8% 8.0% 6.9% 4.9% 3.5% 3.1% 2.2% 1.5%
75% 26.8% 12.0% 8.5% 6.9% 6.0% 4.2% 3.0% 2.7% 1.9% 1.3%
90% 18.6% 8.3% 5.9% 4.8% 4.2% 2.9% 2.1% 1.9% 1.3% 0.9%
95% 13.5% 6.0% 4.3% 3.5% 3.0% 2.1% 1.5% 1.4% 1.0% 0.7%
(The values in the table are the margin of error – at 95% confidence level – for a given
survey estimate and sample size)
The examples show that the size of a sample is a crucial factor affecting the margin of error.
Nevertheless, once past a certain point – a sample size of 800 or 1,000 – the improvement is small. For
example, to reduce the margin of error to 1.5% would require a sample size of 4,000.

Flash EB No 318 – Attitudes towards the EU in the UK Annex
page 73
III. Questionnaire
Q1. In general, do you have a more positive or negative image of the European Union?
- Very positive....................................................................................... 4
- Quite positive ...................................................................................... 3
- Quite negative .................................................................................... 2
- Very negative ...................................................................................... 1
- [Neither positive, nor negative] .......................................................... 8
- [DK/NA] ............................................................................................. 9
Q2. Have you heard of any of the following?
- Yes ........................................................................................... 1
- No ............................................................................................ 2
- [DK/NA] ................................................................................. 9
[READ OUT, ROTATE, ONE ANSWER PER LINE ONLY]
a) The European Health Insurance Card ............................................................. 1 2 9
b) The Bathing Water Report ............................................................................. 1 2 9
c) The Blue Flag Guide ...................................................................................... 1 2 9
d) The European Arrest Warrant ......................................................................... 1 2 9
e) The Air Passenger Rights Regulation ............................................................. 1 2 9
f) The pet passport ............................................................................................... 1 2 9
g) The hedge fund proposal ................................................................................. 1 2 9
h) Guidelines for pay in financial institutions ..................................................... 1 2 9
i) The citizens’ initiative for launching EU-level legislation .............................. 1 2 9
Q3. How important are the benefits of these initiatives for you: very important, important, not
important or not important at all?
[READ OUT– ROTATE - ONE ANSWER PER LINE ONLY]
- Very important ........................................................................ 4
- Important ................................................................................. 3
- Not important .......................................................................... 2
- Not important at all ................................................................. 1
- [DK/NA] .................................................................................. 9
a) The European Health Insurance Card, that allows citizens to receive
medical treatment in any other EU country ................................................ 1 2 3 4 9
b) The Bathing Water Report and Blue Flag Guide, which inform people
about the safety and cleanliness standards of Europe’s beaches ................ 1 2 3 4 9
c) The Blue Flag Guide, which indicates how clean our beaches and seas
are ................................................................................................................ 1 2 3 4 9
d) The European Arrest Warrant ...................................................................... 1 2 3 4 9
e) The Air Passenger Rights Regulation that details what an airline owes
you in case of cancellation, denied boarding or severe delay ..................... 1 2 3 4 9
f) The pet passport, which allows pets to travel more easily between
member countries without undergoing quarantine ..................................... 1 2 3 4 9
g) The hedge fund proposal providing harmonized standards and greater
transparency on alternative investment fund management ......................... 1 2 3 4 9
h) Guidelines for pay in financial institutions .................................................. 1 2 3 4 9
Annex Flash EB No 318 – Attitudes towards the EU in the UK
page 74
i) The citizens’ initiative which enables a million signatories from a
number of EU countries to oblige the EU to make a legislative
proposal in areas it is responsible for .......................................................... 1 2 3 4 9
Q4. Does the fact that these initiatives have been initiated and developed by the European Union
make you feel...
- More positive about the European Union or ................................................. 3
- Less positive about the European Union? .................................................... 2
- [The same way about the European Union] ................................................. 1
- [DK/NA] ....................................................................................................... 9
Q5. I will now list a series of statements. For each one, please tell me if you think they are true or
false?
- True ....................................................................................... 1
- False. ..................................................................................... 2
- [DK/NA] ................................................................................ 9
[READ OUT– ROTATE - ONE ANSWER PER LINE]
a) All EU citizens have the right to travel to, or study in, another EU country .....1 2 9
b) Mobile phone charges (roaming charges, prices, etc.) have decreased for
anyone travelling within the EU .......................................................................1 2 9
c) The EU has very strict food-safety standards .................................................... 1 2 9
d) The EU has a standing army. .............................................................................1 2 9
e) There is an EU tax. .............................................................................................1 2 9
f) The EU budget is larger than the UK’s. .............................................................1 2 9
Q6. What percentage of the UK’s gross national income do you think goes towards the EU
budget? ………….
- [DK/NA] ............................................................................................. 9
Q7. In your opinion, do the economic costs of being in the EU exceed the benefits or do the
benefits exceed the cost?
- The economic costs exceed the benefits ............................................. 1
- The benefits exceed the economic costs ............................................. 2
- They are in balance ............................................................................ 3
- [DK/NA] ............................................................................................. 9
Q8. According to you, how much say has the UK government in the way that EU laws are made
...?
- A lot .................................................................................................... 4
- A fair amount ...................................................................................... 3
- Little or ............................................................................................... 2
- Very little ........................................................................................... 1
- [DK/NA] ............................................................................................. 9
Flash EB No 318 – Attitudes towards the EU in the UK Annex
page 75
Q9. If you knew the UK government always had a say in the way EU laws were made, that
would make you feel:
- More positive about UK membership of the EU ................................ 3
- Less positive about UK membership of the EU ................................. 2
- [Would not change, feel the same way] .............................................. 1
- [DK/NA] ............................................................................................. 9
Q10. Do you agree or disagree with the following statements? Being part of the EU means that ...
- Strongly agree .......................................................................... 4
- Agree ....................................................................................... 3
- Disagree ................................................................................... 2
- Strongly disagree ................................................................... 1
- [DK/NA] .................................................................................. 9
[READ OUT – ROTATE – ONE ANSWER PER LINE ONLY]
a) UK consumers benefit from the free movement of goods resulting from
the European Single Market ..................................................................... 1 2 3 4 9
b) There are improved working conditions in the UK .................................. 1 2 3 4 9
c) There is a cleaner environment ................................................................. 1 2 3 4 9
d) The UK has more say in global trade negotiations .................................. 1 2 3 4 9
e) Criminals can no longer escape prosecution by moving to another EU
member state ............................................................................................ 1 2 3 4 9
f) We can regulate financial markets more effectively ................................. 1 2 3 4 9
Q11. If we were not in the EU and were unable to secure a free-trade agreement with it, which of
the following best describes your opinion?
- I wouldn’t care if we lost any of these benefits .................................. 1
- I would care a bit if we lost one or more of these benefits ................. 2
- I would care greatly if we lost one or more of these benefits ............. 3
- [DK/NA] ............................................................................................. 9
Q12. Which of the following issues do you feel the EU has a role in?
- The EU has a role ................................................................... 1
- The EU does not have a role ................................................... 2
- [DK/NA] ................................................................................. 9
a) Economic governance ..................................................................................... 1 2 9
b) Regulating financial markets .......................................................................... 1 2 9
c) Protecting human rights .................................................................................. 1 2 9
d) Global poverty. ............................................................................................... 1 2 9
e) The security of energy supplies ....................................................................... 1 2 9
f) Tackling climate change .................................................................................. 1 2 9
g) Global terrorism .............................................................................................. 1 2 9
h) Tackling cross-border crime ........................................................................... 1 2 9

Annex Flash EB No 318 – Attitudes towards the EU in the UK
page 76
Q13. Do you think that British ...[READ A-C] presents the European Union too positively, too
negatively or objectively?
- Too positively .......................................................................... 1
- Too negatively ......................................................................... 2
- Objectively ............................................................................. 3
- [DK/NA] .................................................................................. 9
a) Television ..................................................................................................... 1 2 3 9
b) Radio ............................................................................................................ 1 2 3 9
d) Press ............................................................................................................. 1 2 3 9
Q14. How much do you feel you know about the European Union, its policies, its institutions?
Would you say you know ...?
[READ OUT – ONE ANSWER ONLY]
- A great deal ........................................................................................ 1
- Quite a lot .......................................................................................... 2
- A little ................................................................................................ 3
- Nothing at all .................................................................................... 4
- [DK/NA] ............................................................................................. 9
Q15. Would you agree that the current information available on the European Union is simple
and clear enough?
- Strongly agree ....................................................................... 4
- Agree ....................................................................................... 3
- Disagree ................................................................................... 2
- Strongly disagree ................................................................... 1
- [DK/NA] .................................................................................. 9
Q16. How interested are you in receiving more information about the EU?
- Very interested ........................................................................ 4
- Quite interested ........................................................................ 3
- Quite uninterested ................................................................... 2
- Not at all interested? ................................................................ 1
- [DK/NA] ................................................................................. 9
ASK ONLY IF Q15 = DISAGREE/STRONGLY DISAGREE OR Q16= VERY/QUITE
INTERESTED
Q17. If more simple and clear information on the European Union were available, how likely
would you be to read /listen to /watch it?
[READ OUT – ONE ANSWER ONLY]
- Very likely ............................................................................... 4
- Likely....................................................................................... 3
- Not likely ................................................................................. 2
- Not likely at all? ...................................................................... 1
- [DK/NA] .................................................................................. 9

Flash EB No 318 – Attitudes towards the EU in the UK Annex
page 77
Q18. Who do you think should be responsible for keeping you informed about the EU and its
decisions? Please choose ONE from the list that I am going to read to you.
[READ OUT- ROTATE - ONE ANSWER ONLY]
- The EU institutions ............................................................................. 1
- The British government ...................................................................... 2
- The local government ......................................................................... 3
- Political parties ................................................................................... 4
- Newspapers/television ........................................................................ 5
- EU information centres in the UK ..................................................... .6
- [DK/NA] ............................................................................................ 9
Q19. Which of the main parties most closely represents your views on the European Union?
- Conservative ....................................................................................... 1
- Labour ................................................................................................. 2
- Liberal Democrat ................................................................................ 3
- United Kingdom Independence Party ................................................. 4
- British National Party ......................................................................... 5
- Scottish National Party ....................................................................... 6
- Plaid Cymru ........................................................................................ 7
- Other ................................................................................................... 8
- [DK/NA] ............................................................................................ 9
Q20. How important were European issues at the last general election in May 2010?
- Very .................................................................................................... 4
- Quite ................................................................................................... 3
- Not very .............................................................................................. 2
- Irrelevant ............................................................................................. 1
- [DK/NA] ............................................................................................ 9
D1. Gender
[DO NOT ASK- MARK APPROPRIATE]
- [1] Male
- [2] Female
D2. How old are you?
- [_][_]years old
- [00] [REFUSAL/NO ANSWER]
D3. How old were you when you stopped full-time education?
[WRITE IN THE AGE WHEN EDUCATION WAS TERMINATED]
- [_][_] years old
- [ 0 0 ] [STILL IN FULL TIME EDUCATION]
- [ 0 1 ] [NEVER BEEN IN FULL TIME EDUCATION]
- [ 9 9 ] [REFUSAL/NO ANSWER]
Annex Flash EB No 318 – Attitudes towards the EU in the UK
page 78
D4. As far as your current occupation is concerned, would you say you are self-employed, an
employee, a manual worker or would you say that you are without a professional
activity? Does it mean that you are a(n)...
[IF A RESPONSE TO THE MAIN CATEGORY IS GIVEN, READ OUT THE RESPECTIVE SUB-
CATEGORIES]
- Self-employed
i.e. : - farmer, forester, fisherman .................................................................... 11
- owner of a shop, craftsman.................................................................... 12
- professional (lawyer, medical practitioner, accountant, architect,...) ... 13
- manager of a company .......................................................................... 14
- other ....................................................................................................... 15
- Employee
i.e. : - professional (employed doctor, lawyer, accountant, architect) ............ 21
- general management, director or top management ............................... 22
- middle management............................................................................... 23
- Civil servant ........................................................................................... 24
- office clerk ............................................................................................. 25
- other employee (salesman, nurse, etc...) ............................................... 26
- other ....................................................................................................... 27
- Manual worker
i.e. : - supervisor / foreman (team manager, etc...)......................................... 31
- Manual worker ....................................................................................... 32
- unskilled manual worker ....................................................................... 33
- other ....................................................................................................... 34
- Without a professional activity
i.e. : - looking after the home ........................................................................... 41
- student (full time) .................................................................................. 42
- retired .................................................................................................... 43
- seeking a job .......................................................................................... 44
- other ....................................................................................................... 45
- [Refusal] ................................................................................................................ 99
D6. Would you say you live in a ...?
- metropolitan zone ............................................................................... 1
- other town/urban centre ..................................................................... 2
- rural zone ........................................................................................... 3
- [Refusal] ............................................................................................. 9