Attitudes of Europeans Towards Tourism...
168
Flash Eurobarometer 334 Attitudes of Europeans Towards Tourism REPORT Fieldwork: January 2012 Publication: March 2012 This survey has been requested by the Directorate-General Enterprise and co-ordinated by Directorate- General for Communication (DG COMM “Research and Speechwriting” Unit). This document does not represent the point of view of the European Commission. The interpretations and opinions contained in it are solely those of the authors. Flash Eurobarometer 334 - TNS Political & Social
Transcript of Attitudes of Europeans Towards Tourism...

Flash Eurobarometer 334
Attitudes of Europeans Towards Tourism
REPORT
Fieldwork: January 2012
Publication: March 2012
This survey has been requested by the Directorate-General Enterprise and co-ordinated by Directorate-
General for Communication (DG COMM “Research and Speechwriting” Unit).
This document does not represent the point of view of the European Commission.
The interpretations and opinions contained in it are solely those of the authors.
Flash Eurobarometer 334 - TNS Political & Social

FLASH EUROBAROMETER 334 “Attitudes of Europeans Towards Tourism”
1
Flash Eurobarometer 334
Attitudes of Europeans Towards Tourism
Conducted by TNS Political & Social at the request of Directorate-General Enterprise
Survey co-ordinated by Directorate-General for Communication
FLASH EUROBAROMETER 334 “Attitudes of Europeans Towards Tourism”
2
TABLE OF CONTENTS
INTRODUCTION .............................................................................................. 4
MAIN FINDINGS ............................................................................................. 6
1. RESEARCHING AND PLANNING A HOLIDAY ............................................ 8
1.1 Reasons for going on holidays in 2011 ................................................. 8
1.2 Respondents’ motivation to choose the same place for holidays ........ 12
1.3 Sources of information most used when planning the holidays .......... 17
1.4 How respondents organized their holidays in 2011 ............................ 22
2. THE HOLIDAY EXPERIENCE .................................................................. 26
2.1 Destinations for the main holidays taken in 2011 ............................... 26
2.2 Types of holidays taken in 2011 ......................................................... 35
2.3 Means of transport used for going on holidays in 2011 ...................... 41
2.4 Satisfaction with the main holidays taken in 2011 .............................. 47
3. TRAVELLERS’ PROFILE IN 2011 ............................................................ 54
3.1 Proportion of respondents who travelled in 2011 ............................... 54
3.2 Holidays of less than four nights taken in 2011 .................................. 59
3.3 Personal holidays of minimum 4 nights taken in 2011 ....................... 65

FLASH EUROBAROMETER 334 “Attitudes of Europeans Towards Tourism”
3
4. HOLIDAY DISABLING FACTORS IN 2011 AND 2012 .............................. 70
4.1 Reasons for not going on holidays in 2011 ......................................... 70
4.2 Impact of the current economic situation on the holidays planned for 2012 76
5. HOLIDAYS PLANNED FOR 2012 ............................................................ 80
5.1 Duration of holidays planned in 2012 ................................................. 80
5.2 Destinations chosen for 2012 ............................................................. 84
CONCLUSIONS .............................................................................................. 93
ANNEXES
Technical specifications
Questionnaire
Tables

FLASH EUROBAROMETER 334 “Attitudes of Europeans Towards Tourism”
4
INTRODUCTION
This Flash Eurobarometer, “Attitudes of Europeans Towards Tourism” (No 334), was
conducted at the request of the Directorate-General for Enterprise and Industry in the
27 EU Member States and in seven additional countries: Croatia, Turkey, the Former
Yugoslav Republic of Macedonia, Norway, Iceland, the Republic of Serbia and Israel.
Serbia and Israel were not included in previous waves of this survey.
The objectives of the survey were to study: respondents’ motivation for going on
holiday in 2011, the types of research and modes of organisation that people use
before taking a holiday, attitudes towards tourism ( e.g. preferred holiday destinations,
and the types of holiday that respondents favour), respondents’ travel profiles in 2011,
the reasons why respondents did not go on holiday in 2011, including the potential
impact of the current economic crisis and respondents’ holiday plans for 2012.
The interviews were carried out by telephone (fixed-line and mobile phone) between
10 and 14 January 2012 with nationally representative samples of citizens in the 27 EU
Member States, Croatia, Turkey, the Former Yugoslav Republic of Macedonia, Norway,
Iceland, the Republic of Serbia and Israel. The sample size varied between countries,
ranging from about 500 in the smallest countries to about 1.500 in the largest (see
section “Technical Specifications” in the Annexes where the actual sample sizes for the
34 countries are indicated).
To correct for sampling disparities, a post-stratification weighting of the results was
implemented, based on the main socio-demographic variables.
**************
The Eurobarometer web site can be consulted at the following address:
http://ec.europa.eu/public_opinion/index_en.htm
We would like to take the opportunity to thank all the respondents across the continent
who have given of their time to take part in this survey.
Without their active participation, this study would simply not have been possible.
FLASH EUROBAROMETER 334 “Attitudes of Europeans Towards Tourism”
5
Note ABBREVIATIONS
EU27 European Union – 27 Member States
NMS 12 12 new Member States
DK/NA Don’t know / No answer
BE Belgium
BG Bulgaria
CZ Czech Republic
DK Denmark
DE Germany
EE Estonia
EL Greece
ES Spain
FR France
IE Ireland
IT Italy
CY Republic of Cyprus
LT Lithuania
LV Latvia
LU Luxembourg
HU Hungary
MT Malta
NL The Netherlands
AT Austria
PL Poland
PT Portugal
RO Romania
SI Slovenia
SK Slovakia
FI Finland
SE Sweden
UK The United Kingdom
HR Croatia
TR Turkey
MK Former Yugoslav Republic of Macedonia
IS Iceland
NO Norway
RS Republic of Serbia
IL Israel

FLASH EUROBAROMETER 334 “Attitudes of Europeans Towards Tourism”
6
MAIN FINDINGS
Researching and planning a holiday
Almost half (48%) of the people who went on holiday for at least four nights in
2011 did so for rest/recreation, while just under a third (32%) took a holiday in
order to spend time with their family.
When deciding whether to return to the same place for another holiday, 50% of
respondents said the most important factor was the location’s natural features,
such as the weather, while 32% cited the quality of accommodation.
A majority (52%) of respondents said that the recommendations of friends,
colleagues or relatives were key factors when making decisions about travel
plans.
In terms of organising their 2011 holiday, a majority (53%) of respondents said
that they made their arrangements via the internet.
The holiday experience
A majority (56%) of EU respondents who went on holiday in 2011 holidayed in
their own country; over four out of 10 (44%) went to another EU country.
Spain was the most visited EU country, followed by Italy and France.
Half (49%) of the people who took a holiday organised the elements of their
trip, such as transportation and the accommodation, separately – far more than
those who chose to go on package holidays or all-inclusive trips.
Over three quarters (78%) of respondents used a car or motorbike to reach
their holiday destination; just under half (46%) went by airplane.
Over 90% of respondents expressed satisfaction with the natural features and
the quality of accommodation at their holiday location; but satisfaction was
lower on the issues of the welcome shown to tourists, the general level of
prices, and the activities on offer.

FLASH EUROBAROMETER 334 “Attitudes of Europeans Towards Tourism”
7
Travellers’ profiles in 2011
72% of EU citizens spent at least one night travelling away from home either
for business or private purposes in 2011, confirming the results in 2010 (72%),
when a smaller sample was polled.
A majority (54%) of people who went away on at least one overnight trip in
2011 stayed in paid accommodation, more than the 47% who stayed with
friends or relatives.
60% of the people who stayed in paid accommodation did so for at least four
nights.
Reasons for not going on holiday in 2011-2012
45% of EU respondents who did not go on holiday in 2011 did not do so for
financial reasons – up slightly from the 43% of people who said this in the
previous wave of the survey.
Nearly three quarters (73%) of people in the EU are planning to go on holiday
in 2012. Of these, 33% have changed their plans owing to the economic
situation, while 40% say their original plans remain unchanged.
The highest proportions of people planning to go away on holiday in 2012 were
in Denmark (89%) and Finland (89%). The highest proportions of respondents
saying they would not go away on holiday were in Turkey (45%), Portugal
(40%) and Greece (35%).
Holidays planned for 2012
41% of respondents said that they planned to take a holiday of between four
and 13 nights – more than the number of people planning longer or shorter
trips.
A majority (52%) of respondents plan to spend their holidays in their own
country in 2012, while 37% intend to go on holiday in another EU country.
69% of people who said they holidayed in their own country in 2011 plan to do
the same in 2012. 61% of those who holidayed in another EU country plan to
do that again this year. And 54% of people who holidayed in a country outside
the EU intend to do the same again in 2012.

FLASH EUROBAROMETER 334 “Attitudes of Europeans Towards Tourism”
8
1. RESEARCHING AND PLANNING A HOLIDAY
Respondents were asked a series of questions about the way in which they research
and plan their holidays: first of all they were asked to give their main reasons for
deciding to take a holiday, then to list the factors which they considered important in
deciding to go back to a place where they had holidayed previously. Thirdly,
respondents were asked to describe the sources of information they rely on when
making decisions about their travel plans. And finally, they were asked to describe the
methods they used to organize their holidays.
1.1 Reasons for going on holidays in 2011
- Half of the respondents who went on holiday for at least four nights say
that rest/recreation was one of their main reasons for going -
Almost half (48%) of respondents say they went on holiday for rest/recreation
(including wellness/health treatment), while just under a third (32%) took a holiday in
order to spend time with their family. Over a quarter (28%) of respondents say they
went on holiday for the sun or the beach, with the same proportion (28%) saying that
they went to visit relatives or friends. For 18% of respondents, nature was a main
reason for their holiday, a slightly higher proportion than went away for city trips
(16%). Over one respondent in 10 (14%) took their holiday for cultural or religious
reasons, with 10% going for sports-related purposes, such as scuba-diving or cycling.
Base: 60% from the total number of respondents (15 848 respondents)
(Those who went on holiday for at least four nights in 2011)

FLASH EUROBAROMETER 334 “Attitudes of Europeans Towards Tourism”
9
Rest/recreation was the reason for going on holiday cited by most respondents in
all but seven of the 34 countries included in this survey. In 12 countries a majority
of respondents say that rest/recreation was one of their main reasons for taking a
holiday, with the highest proportions of people saying this occurring in Cyprus
(70%), Greece (65%) and Hungary (61%). However, rest/recreation was a
relatively uncommon reason for taking a holiday in Finland (12%), Turkey (22%)
and Denmark (28%).
In Denmark and Finland, by contrast, spending time with family was the most
popular reason for going on holiday (47% and 39% respectively). Relatively high
numbers of people also cite this reason in Israel (42%), Norway (40%) and
Portugal (39%). In other 10 countries, at least a third of respondents give
‘spending time with family’ as one of their three main reasons for going on holiday.
This was least popular as a reason for taking a holiday in Cyprus, Italy and Latvia
(all 21%).
For people in Norway (41%), the sun or the beach was the most common reason
for going on holiday. Even more respondents in Portugal (47%) say that they went
on holiday for this reason. Relatively few people took a holiday for this purpose in
Malta (3%), Cyprus (8%) and Israel (11%).
Visiting family or friends was the main reason for holidaying in five countries:
Estonia (49%), Latvia (46%, equal with rest/recreation), Turkey (41%), Sweden
(39%) and Croatia (38%). This reason was least popular in Malta (16%), Slovenia
(18%) and Macedonia (20%).
Going on holiday to see and enjoy nature was most common among respondents
in the Czech Republic (32%), followed by those in Israel and the Netherlands (both
27%). But in Ireland and Cyprus only 6% and 7% of respondents respectively say
that nature inspired them to go on holiday.
City trips were a relatively popular reason for going on holiday in Finland (26%),
Lithuania (25%), Austria (23%), Latvia (21%) and Poland (21%), the only five
countries where at least 20% of respondents give this reason. In comparison, it
least 20% of respondents say that they went on holiday for religion or culture in
four countries: Austria (26%), Belgium (22%), the Netherlands (22%) and
Germany (21%). Sports-related holidays were most popular among respondents
in Austria (18%), the Czech Republic (18%), and Finland (16%).
While detailed trend analysis is not possible here given that the terms of this
question have changed significantly compared with previous waves, it is still
possible to provide a general comparison.

FLASH EUROBAROMETER 334 “Attitudes of Europeans Towards Tourism”
10
In the 2011 survey, when respondents were only allowed to give one answer to
this question (as opposed to multiple answers now), rest/recreation (36%) was
again the most popular motivation for going on holiday. This was followed by
sun/beach (18%), visiting friends/relatives (17%), city trips (8%), culture/religion
(8%), nature (7%), sports-related (3%), and wellness/health treatment (3%).
Rest/recreation (including
Wellness/health treatment)
Spending time with
your familySun/beach
Visiting friends / relatives
Nature (mountain, lake,
landscape etc…)
City tripsCulture / religion
Sports-related (e.g. scuba-diving,
cycling etc…)
EU27 48% 32% 28% 28% 18% 16% 14% 10%
BE 44% 32% 23% 24% 22% 16% 22% 13%
BG 35% 29% 27% 31% 18% 4% 5% 4%
CZ 55% 36% 25% 24% 32% 10% 15% 18%
DK 28% 47% 28% 25% 24% 17% 18% 14%
DE 52% 26% 26% 25% 23% 18% 21% 15%
EE 32% 33% 23% 49% 22% 7% 18% 7%
IE 47% 34% 32% 30% 6% 12% 8% 10%
EL 65% 30% 30% 30% 13% 9% 5% 5%
ES 43% 30% 27% 31% 17% 16% 17% 5%
FR 45% 38% 29% 36% 18% 19% 11% 10%
IT 51% 21% 30% 22% 13% 19% 16% 4%
CY 70% 21% 8% 27% 7% 4% 6% 5%
LV 46% 21% 13% 46% 19% 21% 13% 8%
LT 39% 25% 19% 31% 18% 25% 10% 7%
LU 42% 35% 33% 26% 16% 16% 16% 10%
HU 61% 32% 22% 26% 15% 18% 9% 7%
MT 59% 25% 3% 16% 19% 12% 16% 7%
NL 45% 36% 30% 26% 27% 16% 22% 14%
AT 44% 26% 23% 26% 21% 23% 26% 18%
PL 52% 37% 20% 28% 22% 21% 8% 8%
PT 56% 39% 47% 31% 18% 9% 15% 9%
RO 53% 32% 20% 32% 12% 9% 6% 5%
SI 49% 36% 37% 18% 14% 19% 5% 10%
SK 49% 28% 25% 26% 19% 11% 10% 8%
FI 12% 39% 25% 35% 18% 26% 18% 16%
SE 34% 38% 32% 39% 13% 13% 13% 13%
UK 45% 38% 33% 28% 12% 11% 7% 8%
HR 37% 30% 25% 38% 13% 10% 11% 10%
TR 22% 25% 22% 41% 12% 11% 10% 4%
MK 56% 25% 39% 20% 13% 2% 6% 6%
IS 49% 27% 13% 33% 12% 18% 10% 8%
NO 35% 40% 41% 29% 15% 19% 10% 8%
RS 59% 24% 32% 26% 22% 4% 11% 2%
IL 44% 42% 11% 21% 27% 12% 12% 8%
Q6 What were your main reasons for going on holidays in 2011?
Highest percentage per countryHighest percentage per item
Lowest percentage per countryLowest percentage per item
Base: 60% from the total number of respondents (15 848 respondents)
(Those who went on holiday for at least four nights in 2011)

FLASH EUROBAROMETER 334 “Attitudes of Europeans Towards Tourism”
11
The socio-demographic data show that:
Men and women generally cite very similar reasons for going on holiday,
although women are slightly more inclined than men to take a holiday in
order to spend time with their family (34% vs. 30%) and to visit friends and
relatives (30% vs. 27%).
Rest/recreation and spending time with the family are most popular among
people aged 25-54 (49%-51%). Sun/ the beach (32%), visiting
friends/relatives (36%), city trips (20%) and sport activities (12%) are
common among the youngest respondents, from the 15-24 category. While
nature (22%) and culture/religion (18%) are reasons for going on holiday
for respondents aged 55+.
Respondents who spent more time in education are the most likely to say
they went on holiday in order to spend time with their family (33%) and for
cultural/religious reasons (17%).
People who live in large towns are more likely to say that they went on
holiday to visit family or friends (31%) and for city trips (19%) than those
who live in rural villages (26% and 14% respectively).
Looking at the occupation scale, people who are not working are the most
likely to say they go on holiday to visit friends or relatives and for
cultural/religious reasons. Employees and self-employed choose spending
time with the family, visiting friends/relatives and recreation as reasons for
taking holidays.

FLASH EUROBAROMETER 334 “Attitudes of Europeans Towards Tourism”
12
Rest/recreation (including Wellness/health treatment)
Spending time with
your family Sun/beach
Visiting friends / relatives
Nature (mountain,
lake, landscape
etc…)
City tripsCulture / religion
Sports-related (e.g.
scuba-diving, cycling etc…)
EU27 48% 32% 28% 28% 18% 16% 14% 10%
Male 47% 30% 27% 27% 18% 15% 13% 12%
Female 48% 34% 29% 30% 18% 17% 15% 7%
15-24 43% 27% 32% 36% 14% 20% 13% 12%
25-39 49% 39% 31% 31% 15% 14% 11% 10%
40-54 51% 39% 29% 24% 18% 15% 12% 11%
55 + 46% 24% 22% 27% 22% 17% 18% 7%
15- 50% 28% 28% 24% 15% 12% 10% 5%
16-19 47% 32% 28% 26% 17% 13% 10% 9%
20+ 49% 33% 27% 29% 20% 18% 17% 11%
Still studying 42% 30% 31% 38% 13% 21% 17% 12%
Rural village 49% 33% 28% 26% 19% 14% 14% 11%
Small/ Mid-size town 47% 32% 28% 29% 18% 16% 14% 9%
Large town 47% 32% 27% 31% 17% 19% 14% 9%
Self-employed 48% 35% 27% 24% 17% 15% 12% 11%
Employee 51% 36% 30% 27% 19% 16% 13% 12%
Manual workers 49% 36% 31% 25% 14% 11% 8% 9%
Not working 44% 27% 25% 32% 18% 18% 16% 8%
Respondent occupation scale
Q6 What were your main reasons for going on holidays in 2011? (MAX. 3 ANSWERS)
Sex
Age
Education (End of)
Subjective urbanisation
Base: 60% from the total number of respondents (15 848 respondents)
(Those who went on holiday for at least four nights in 2011)
1.2 Respondents’ motivation to choose the same place for
holidays
- A location’s natural features are the qualities most likely to persuade
holiday-makers to go back there again -
Half (50%) of respondents say they would go back to a place for its natural features,
such as the weather or the landscape, while a third (32%) say that the quality of the
accommodation would persuade them to return. Around a quarter (27%) of
respondents say that the general level of prices would be a reason for them to go back
to the same place, while 24% say that an important factor for them is the way in
which tourists are welcomed, in terms of child friendliness, customer care, and so on.
Fewer than one in five (17%) say that the activities offered would make them go back
to the same place for their holiday.

FLASH EUROBAROMETER 334 “Attitudes of Europeans Towards Tourism”
13
This question was not asked in earlier waves of the survey. Previously, respondents
were asked what influenced their choice of destination, and in 2011 the main
attractions were given as the environment (32%), cultural heritage (27%), and
entertainment (14%).
Base: Total number of respondents
Respondents in all 34 countries, with the sole exception of Israel, say that a place’s
natural features, such as the weather or the landscape, are the qualities most
likely to make them return for another holiday. In 10 countries a majority of
respondents cite a place’s natural features, with the highest proportions of people
giving this answer coming in the Czech Republic (65%), the Netherlands (58%),
France (54%) and Portugal (54%). However, natural features are considered
relatively unimportant in Macedonia (24%), Israel (33%), and Estonia (34%).
The quality of the accommodation is the joint top answer among UK
respondents (48%, alongside natural features), followed by people in Ireland
(43%), the Netherlands (41%) and Portugal (40%). At least a third of respondents
in another 11 countries say that the quality of the accommodation is important in
determining whether they would return to a particular holiday destination. But only
12% of respondents in Estonia say that this would make them want to go back to a
particular place, as do 17% in Malta.
Among respondents in Israel (39%), the general level of prices matters most
when deciding whether to return to a holiday destination. The same proportion of
respondents (39%) think that prices might make them go back to a particular place
in both Greece and Ireland. However, prices are seen as a less important factor in
Macedonia (14%), Estonia (19%) and Slovakia (19%).

FLASH EUROBAROMETER 334 “Attitudes of Europeans Towards Tourism”
14
At least a quarter of respondents in 13 countries think that the way in which
tourists are welcomed would influence their decision to return to the same place
for another holiday. In Demark, 30% of respondents give this answer, as do 29%
of those in Portugal. However, just 7% of people in Serbia and 12% of those in
Estonia say that the way in which tourists are welcomed would influence their
decision to return to the same place.
The range of activities offered is a particularly important factor for people in
Iceland (39%), as well as for people in Finland (32%). In 13 countries, at least one
respondent in five says that the activities would make them go back to the same
place for another holiday. However, activities are relatively unimportant to
respondents in Macedonia (7%), Hungary (8%) and Bulgaria (9%).

FLASH EUROBAROMETER 334 “Attitudes of Europeans Towards Tourism”
15
The natural features (weather
conditions, landscape, etc.)
The quality of the
accommodation
The general level of prices
How tourists are welcomed ( e.g.
child friendliness, customer care,
"pets-welcomed" policy, etc...)
The activities offered (variety and comprehensivenes
s of the tourist offer)
EU27 50% 32% 27% 24% 17%
BE 48% 34% 25% 25% 14%
BG 50% 26% 30% 18% 9%
CZ 65% 36% 22% 26% 22%
DK 44% 33% 31% 30% 23%
DE 52% 36% 25% 23% 20%
EE 34% 12% 19% 12% 13%
IE 45% 43% 39% 28% 25%
EL 49% 31% 39% 17% 12%
ES 50% 35% 27% 20% 15%
FR 54% 23% 23% 27% 16%
IT 49% 20% 21% 22% 10%
CY 40% 25% 29% 15% 12%
LV 36% 24% 23% 23% 20%
LT 49% 24% 30% 17% 12%
LU 45% 36% 24% 25% 13%
HU 46% 28% 25% 21% 8%
MT 53% 17% 25% 23% 22%
NL 58% 41% 22% 19% 17%
AT 48% 36% 24% 28% 23%
PL 53% 29% 32% 27% 22%
PT 54% 40% 32% 29% 15%
RO 42% 32% 25% 21% 12%
SI 44% 33% 24% 28% 20%
SK 50% 33% 19% 19% 15%
FI 36% 31% 32% 23% 32%
SE 44% 33% 25% 25% 28%
UK 48% 48% 33% 28% 19%
HR 42% 29% 29% 19% 22%
TR 40% 30% 37% 19% 13%
MK 24% 20% 14% 19% 7%
IS 43% 20% 28% 25% 39%
NO 44% 37% 30% 21% 23%
RS 42% 31% 33% 7% 10%
IL 33% 31% 39% 23% 17%
Q10 Which of the following would make you go back to the same place for a holiday?
Highest percentage per countryHighest percentage per item
Lowest percentage per countryLowest percentage per item
Base: Total number of respondents

FLASH EUROBAROMETER 334 “Attitudes of Europeans Towards Tourism”
16
The socio-demographic data show that:
The quality of the accommodation matters most to respondents in the 40-54
(36%) and 25-39 (35%) age brackets and least to those aged 55 and over
(29%). The general level of prices also matters least to people aged 55 and
over (20%).
Respondents who spent more time in education are more likely to say that a
place’s natural features (55%) and the quality of accommodation (35%)
might make them want to go back there for another holiday.
Employees are the most likely to regard a place’s natural features as a
reason to go back there (55%). They are also the most likely to say that the
quality of accommodation (38%) and the general level of prices (30%) are
important factors.
The natural features (weather
conditions, landscape, etc.)
The quality of the accommodation
The general level of prices
EU27 50% 32% 27%
Male 49% 33% 26%
Female 51% 32% 27%
15-24 49% 31% 31%
25-39 51% 35% 31%
40-54 51% 36% 28%
55 + 49% 29% 20%
15- 43% 27% 20%
16-19 49% 33% 27%
20+ 55% 35% 28%
Still studying 49% 31% 31%
Rural village 50% 33% 26%
Small/ Mid-size town 50% 32% 26%
Large town 51% 33% 28%
Self-employed 50% 36% 27%
Employee 55% 38% 30%
Manual workers 48% 29% 29%
Not working 48% 29% 24%
Respondent occupation scale
Q10 Which of the following would make you go back to the same place for a holiday? (MAX. 3 ANSWERS)
Sex
Age
Education (End of)
Subjective urbanisation
Base: Total number of respondents

FLASH EUROBAROMETER 334 “Attitudes of Europeans Towards Tourism”
17
1.3 Sources of information most used when planning the
holidays
- A majority of respondents consider the recommendations of friends,
colleagues or relatives when making decisions about travel -
A majority (52%) of respondents say that the recommendations of friends,
colleagues or relatives are important to them when making travel decisions, while
four people in 10 (40%) say that internet websites are important in the decision-
making process. Personal experience is cited as an important factor by a third
(32%) of respondents.
Over one person in 10 says that travel/tourist agencies (16%) and free catalogues
and brochures are important (11%). Less than one respondent in 10 says that the
other factors like: newspapers, radio and TV (7%), paid-for guidebooks and
magazines (7%) and social media sites (5%) are important when it comes to
making decisions about travel plans.
It is not possible to make a direct comparison between these results and those of
previous waves of the survey because the question has developed over time.
However, in 2011, when respondents were asked to name the first and second
most important information sources, the recommendations of friends and
colleagues (58%) was again the most common answer, followed by the internet
(45%), personal experience (29%), and travel/tourist agencies (21%).
Base: Total number of respondents

FLASH EUROBAROMETER 334 “Attitudes of Europeans Towards Tourism”
18
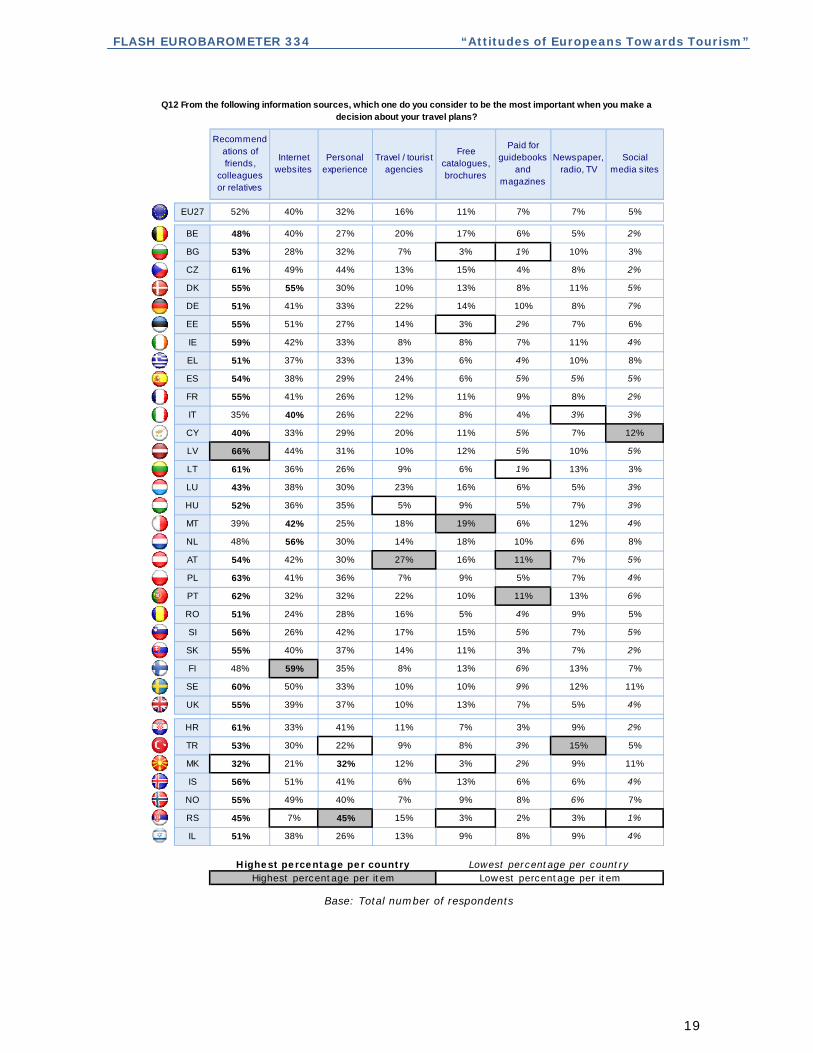
Respondents in all but four of the 34 countries included in the survey think that the
recommendations of friends, colleagues or relatives are the most important
consideration when making travel plans. In 25 countries a majority of people say that
this is an important consideration, with 66% of respondents in Latvia, 63% in Poland
and 62% in Portugal expressing this opinion. However, only 32% of people in
Macedonia say they consider the recommendations of friends, colleagues or relatives
when making travel plans, followed by 35% in Italy and 39% in Malta.
In five countries, more people say they consult internet websites when making travel
plans than say they consider other sources of information. They are: Finland (59%),
the Netherlands (56%), Denmark (55%, equal with recommendations of friends,
colleagues or relatives), Malta (42%) and Italy (40%). At least half of all respondents
also give this answer in Estonia (51%), Iceland (51%) and Sweden (50%), though
relatively few people do so in Serbia (7%), Macedonia (21%) and Romania (24%).
By contrast, in Serbia and Macedonia personal experience is the most popular
source of information1, with 45% and 32% of respondents respectively saying that
they take personal experience into account when making decisions about their travel
plans. In 23 countries at least three people in 10 say that personal experience is a
factor in the decision-making process, though it plays a less of a role in terms of
informing travel-related decisions among respondents in Turkey (22%) and Malta
(25%).
A relatively large proportion of respondents say they take travel/tourist agencies
into consideration when making their travel plans in Austria (27%), Spain (24%) and
Luxembourg (23%). At least 20% of respondents mention travel/tourist agencies eight
countries, though relatively few people do so in Hungary (5%) and Iceland (6%).
In 17 countries at least 10% of respondents say that they take free catalogues or
brochures into account when it comes to making their travel plans, with the largest
proportion of people doing so in Malta (19%) and the Netherlands (18%).
A noteworthy number of respondents consider paid-for guidebooks and magazines
in Austria (11%), Portugal (11%), Germany (10%) and the Netherlands, while
newspapers, TV and radio attract a similar level of consideration in Turkey (15%),
Finland (13%), Lithuania (13%) and Portugal (13%).
While very few people generally use social media to inform their travel decisions, at
least 10% of respondents do so in Cyprus (12%), Macedonia (11%) and Sweden
(11%).
1 Equal in both cases to the number of people who say they consider the recommendations of friends, colleagues or relatives.
FLASH EUROBAROMETER 334 “Attitudes of Europeans Towards Tourism”
19
Recommendations of friends,
colleagues or relatives
Internet websites
Personal experience
Travel / tourist agencies
Free catalogues, brochures
Paid for guidebooks
and magazines
Newspaper, radio, TV
Social media sites
EU27 52% 40% 32% 16% 11% 7% 7% 5%
BE 48% 40% 27% 20% 17% 6% 5% 2%
BG 53% 28% 32% 7% 3% 1% 10% 3%
CZ 61% 49% 44% 13% 15% 4% 8% 2%
DK 55% 55% 30% 10% 13% 8% 11% 5%
DE 51% 41% 33% 22% 14% 10% 8% 7%
EE 55% 51% 27% 14% 3% 2% 7% 6%
IE 59% 42% 33% 8% 8% 7% 11% 4%
EL 51% 37% 33% 13% 6% 4% 10% 8%
ES 54% 38% 29% 24% 6% 5% 5% 5%
FR 55% 41% 26% 12% 11% 9% 8% 2%
IT 35% 40% 26% 22% 8% 4% 3% 3%
CY 40% 33% 29% 20% 11% 5% 7% 12%
LV 66% 44% 31% 10% 12% 5% 10% 5%
LT 61% 36% 26% 9% 6% 1% 13% 3%
LU 43% 38% 30% 23% 16% 6% 5% 3%
HU 52% 36% 35% 5% 9% 5% 7% 3%
MT 39% 42% 25% 18% 19% 6% 12% 4%
NL 48% 56% 30% 14% 18% 10% 6% 8%
AT 54% 42% 30% 27% 16% 11% 7% 5%
PL 63% 41% 36% 7% 9% 5% 7% 4%
PT 62% 32% 32% 22% 10% 11% 13% 6%
RO 51% 24% 28% 16% 5% 4% 9% 5%
SI 56% 26% 42% 17% 15% 5% 7% 5%
SK 55% 40% 37% 14% 11% 3% 7% 2%
FI 48% 59% 35% 8% 13% 6% 13% 7%
SE 60% 50% 33% 10% 10% 9% 12% 11%
UK 55% 39% 37% 10% 13% 7% 5% 4%
HR 61% 33% 41% 11% 7% 3% 9% 2%
TR 53% 30% 22% 9% 8% 3% 15% 5%
MK 32% 21% 32% 12% 3% 2% 9% 11%
IS 56% 51% 41% 6% 13% 6% 6% 4%
NO 55% 49% 40% 7% 9% 8% 6% 7%
RS 45% 7% 45% 15% 3% 2% 3% 1%
IL 51% 38% 26% 13% 9% 8% 9% 4%
Q12 From the following information sources, which one do you consider to be the most important when you make a decision about your travel plans?
Highest percentage per countryHighest percentage per item
Lowest percentage per countryLowest percentage per item
Base: Total number of respondents

FLASH EUROBAROMETER 334 “Attitudes of Europeans Towards Tourism”
20
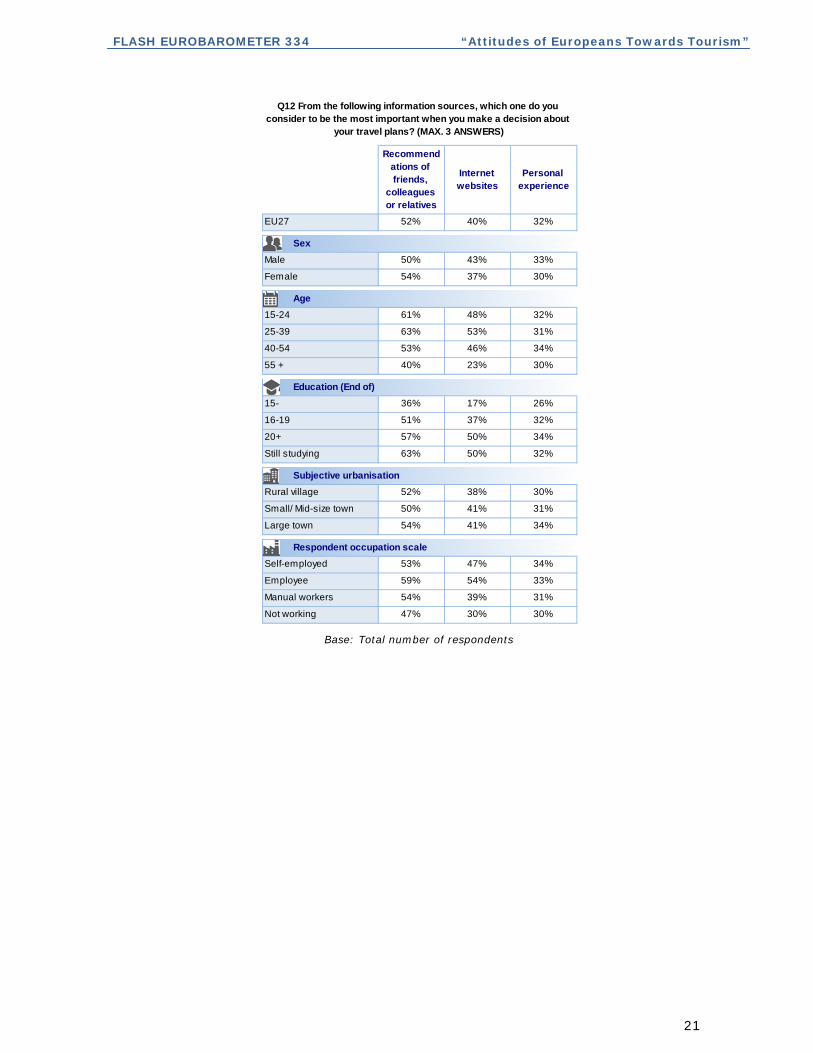
According to the socio-demographic data:
Men are more likely than women to rely on websites (43% vs. 37%) and on
personal experience (33% vs. 30%) for their information, while women a
more likely to consider the recommendations of friends, colleagues or
relatives, by a margin of 54% to 50%.
Respondents aged 15-39 (61-63%) are more likely than those aged 40-54
(53%) or 55 and over (40%) to consider the recommendations of friends,
colleagues or relatives. People in the 25-39 group (53%) are the most likely
to rely on websites, while those aged 55 and over (23%) are the least likely
to do this.
Respondents who left education aged 20 or over are more likely than those
who left at a younger age to consider the recommendations of friends,
colleagues or relatives, websites, and personal experience when making
travel decisions.
People who live in large towns are more likely to take into account the
recommendations of friends, colleagues or relatives, websites, and personal
experience when making their travel plans.
Employees are more likely than respondents in other occupations, or those
not working, to consider the recommendations of friends, colleagues or
relatives, and also websites, when making their travel decisions.
FLASH EUROBAROMETER 334 “Attitudes of Europeans Towards Tourism”
21
Recommendations of friends,
colleagues or relatives
Internet websites
Personal experience
EU27 52% 40% 32%
Male 50% 43% 33%
Female 54% 37% 30%
15-24 61% 48% 32%
25-39 63% 53% 31%
40-54 53% 46% 34%
55 + 40% 23% 30%
15- 36% 17% 26%
16-19 51% 37% 32%
20+ 57% 50% 34%
Still studying 63% 50% 32%
Rural village 52% 38% 30%
Small/ Mid-size town 50% 41% 31%
Large town 54% 41% 34%
Self-employed 53% 47% 34%
Employee 59% 54% 33%
Manual workers 54% 39% 31%
Not working 47% 30% 30%
Respondent occupation scale
Q12 From the following information sources, which one do you consider to be the most important when you make a decision about
your travel plans? (MAX. 3 ANSWERS)
Sex
Age
Education (End of)
Subjective urbanisation
Base: Total number of respondents

FLASH EUROBAROMETER 334 “Attitudes of Europeans Towards Tourism”
22
1.4 How respondents organized their holidays in 2011
- A majority of respondents organized their holiday via the internet, which
was by far the most popular method -
A majority (53%) of those who took a holiday lasting at least four nights say that they
used the internet to make their arrangements – considerably more than those who
used the other methods under discussion. Just under a quarter (23%) of respondents
say that they made their plans through a travel agency, with a similar number (22%)
saying that they arranged their holiday through someone they know. Under one person
in five (18%) made their arrangements over the phone, while less than a tenth of
respondents made their arrangements on-site (9%) or over the counter of a transport
company (4%).
Base: 60% from the total number of respondents
(Those who went on holiday for at least four nights in 2011)
In 28 of the 34 countries involved in this survey more people used the internet to
make their holiday arrangements than those who used the other methods under
consideration. In 16 countries a majority of people say they used the internet to
organise their holiday, and at least seven out of 10 people did so in Norway (78%),
Ireland (77%), the Netherlands (72%), Denmark (71%) and Finland (70%). However,
far fewer people than average used the internet to make their arrangements in
Macedonia (13%), Serbia (17%), Turkey (22%), and Lithuania (24%).

FLASH EUROBAROMETER 334 “Attitudes of Europeans Towards Tourism”
23
At least three out of 10 people say that they made their arrangements through a
travel agency in six countries, with the most people giving this answer in
Luxembourg (39%), Israel (37%) and Cyprus (36%). At least one person in 10 made
their arrangements through a travel agency in all 34 countries, the lowest percentages
being recorded in in Turkey (10%), Bulgaria (11%), Croatia (11%) and Iceland (11%).
In five countries more people made their arrangements through someone they
know than used other methods: Serbia (35%), Slovakia (35%), Lithuania (31%),
Croatia (28%) and Turkey (26%). In Latvia, four people in 10 (40%) made their
holiday arrangements in this way. In all 34 countries at least one person in 10 made
their arrangements through someone they know, with fewest people in the
Netherlands (12%), Cyprus (13%), and Spain (14%).
More than 20% of respondents made their holiday arrangements over the phone in
eight countries, with the highest numbers of people using this method occurring in
Finland (30%), the UK (29%) and Poland (24%). But only 3% of respondents in Malta
made their arrangements over the phone, as did 9% of those in Estonia.
Making holiday arrangements on-site is the most popular approach among
respondents in Macedonia, with 27% of people there saying that they organised their
holiday in this way. Relatively high numbers of respondents also made their
arrangements on-site in Lithuania (21%) and Portugal (19%). While generally very few
people made their arrangements over the counter of transportation company,
over one person in 10 did so in Croatia (15%) and Finland (10%).

FLASH EUROBAROMETER 334 “Attitudes of Europeans Towards Tourism”
24
The InternetThrough a
travel agency
Through someone you
knowOver the phone
On-site (place of holidays)
Over the counter of a transportation company (airline company, railway company etc…)
EU27 53% 23% 22% 18% 9% 4%
BE 57% 32% 19% 11% 12% 5%
BG 30% 11% 23% 16% 12% 4%
CZ 40% 29% 33% 17% 15% 5%
DK 71% 22% 15% 14% 6% 5%
DE 54% 28% 19% 20% 10% 4%
EE 34% 25% 30% 9% 17% 8%
IE 77% 22% 18% 18% 6% 4%
EL 41% 12% 20% 16% 15% 4%
ES 52% 25% 14% 11% 5% 2%
FR 50% 17% 27% 14% 11% 5%
IT 48% 21% 18% 10% 7% 2%
CY 45% 36% 13% 12% 3% 0%
LV 52% 18% 40% 16% 16% 5%
LT 24% 14% 31% 18% 21% 3%
LU 54% 39% 15% 12% 6% 8%
HU 36% 12% 23% 11% 3% 3%
MT 61% 27% 16% 3% 2% 5%
NL 72% 22% 12% 12% 14% 2%
AT 51% 34% 22% 17% 9% 2%
PL 41% 14% 29% 24% 10% 4%
PT 43% 24% 34% 22% 19% 5%
RO 26% 20% 25% 16% 13% 1%
SI 35% 33% 25% 14% 12% 2%
SK 32% 23% 35% 12% 10% 3%
FI 70% 20% 23% 30% 9% 10%
SE 64% 21% 25% 20% 9% 5%
UK 68% 28% 21% 29% 8% 9%
HR 26% 11% 28% 22% 7% 15%
TR 22% 10% 26% 21% 12% 4%
MK 13% 23% 23% 19% 27% 3%
IS 58% 11% 20% 11% 10% 5%
NO 78% 14% 24% 17% 5% 4%
RS 17% 29% 35% 11% 15% 0%
IL 42% 37% 22% 21% 9% 6%
Q9 Did you arrange your holidays in 2011 using any of the following methods?
Highest percentage per countryHighest percentage per item
Lowest percentage per countryLowest percentage per item
Base: 60% from the total number of respondents (15 848 respondents)
(Those who went on holiday for at least four nights in 2011)

FLASH EUROBAROMETER 334 “Attitudes of Europeans Towards Tourism”
25
The socio-demographic data show that:
Respondents in the 25-39 age group are the most likely to make holiday
arrangements online: 65% do so, compared with 59% of 40-54 year-olds, 56%
of 15-24 year-olds, and just 36% of people aged 55 and over. Respondents in
the 15-24 age group are the most likely to make arrangements through
someone they know (31% vs. 19-22% for the three other age bands).
The higher the respondent’s level of education, the greater the likelihood that
he or she made holiday arrangements via the internet: 60% of people who left
education aged 20 or over did this, compared with 50% who left aged 16-19,
and just 27% who left aged 15 or under. Those who left school aged 15c or
under are the most likely to use a travel agency (29% vs. 23% for the other
two groups).
Employees (64%) and self-employed respondents (63%) are more likely to
organise their holidays online than manual workers (51%) or people who are
not working (40%). Manual workers and people who are not working are more
likely to make their arrangement through someone they know.
The InternetThrough a travel
agency
Through someone you
know
EU27 53% 23% 22%
Male 54% 22% 21%
Female 51% 24% 22%
15-24 56% 19% 31%
25-39 65% 19% 22%
40-54 59% 23% 19%
55 + 36% 29% 19%
15- 27% 29% 20%
16-19 50% 23% 21%
20+ 60% 23% 20%
Still studying 54% 20% 34%
Rural village 52% 24% 21%
Small/ Mid-size town 52% 23% 22%
Large town 54% 22% 22%
Self-employed 63% 24% 17%
Employee 64% 22% 20%
Manual workers 51% 20% 23%
Not working 40% 24% 24%
Respondent occupation scale
Q9 Did you arrange your holidays in 2011 using any of the following methods? (MULTIPLE ANSWER POSSIBLE)
Sex
Age
Education (End of)
Subjective urbanisation
Base: 60% from the total number of respondents (15 848 respondents)
(Those who went on holiday for at least four nights in 2011)

FLASH EUROBAROMETER 334 “Attitudes of Europeans Towards Tourism”
26
2. THE HOLIDAY EXPERIENCE
Respondents who went on a holiday that last at least four nights during 2011 were
asked four questions about their experience: where they went, what kind of holiday it
was (whether it was a package holiday, for example), the modes of transport which
they used to reach their holiday destination and the level of satisfaction with certain
aspects of their holiday.
2.1 Destinations for the main holidays taken in 2011
- A majority of respondents who went on holiday in 2011 stayed in their
own country –
A majority (56%) of respondents say that they holidayed in their own country, while
over four out of 10 (44%) say that they went to another EU country. Just under a
quarter (22%) of respondents say they holidayed in another country outside the EU.
It is interesting to note the variation between EU15 and NMS12 responses on this
question. While 62% of NMS12 respondents say that they spent their holiday in their
own country, only 55% of EU15 respondents say the same thing.
Base: 60% from the total number of respondents (15 848 respondents)
(Those who went on holiday for at least four nights in 2011)
When asking the question (OUR COUNTRY) is replaced by the name of the country the interview is
conducted
Interpreting these results slightly differently by combining the ‘in our country’
responses with the ‘in the EU’ responses, we find that 89% of EU respondents who
went on holiday for at least four nights went somewhere within the EU, whether in
their own country or in another Member State.

FLASH EUROBAROMETER 334 “Attitudes of Europeans Towards Tourism”
27
Some respondents, in answer to this question, named the specific countries that they
visited (as opposed to, or as well as, giving a more general answer like ‘in my country’
or ‘in the EU’). Over a tenth of EU respondents (11%) who went on holiday said they
visited Spain. This is followed by Italy (9%), France (8%), Germany (5%), Austria
(5%), and Greece (4%).
Base: 60% from the total number of respondents (15 848 respondents)
(Those who went on holiday for at least four nights in 2011)
However, when ‘in our country’ responses are discounted, the results look somewhat
different. Now, the most visited countries are Spain (17%), Italy (17%), France
(16%), Germany (13%) and the UK (10%).
At individual country level, a majority of respondents say that they went on holiday in
their own country in 18 of the 34 countries being covered by this survey. Holidaying
domestically was most popular in Turkey, where 91% of people stayed in their own
country for their holiday, followed by Greece (80%), Bulgaria (77%), Italy (74%) and
Croatia (73%). Domestic holidays were least common in Luxembourg (2%) and Malta
(5%).

FLASH EUROBAROMETER 334 “Attitudes of Europeans Towards Tourism”
28
Base: 60% from the total number of respondents (15 848 respondents)
(Those who went on holiday for at least four nights in 2011)
‘In the EU’ was the most popular answer in 14 countries, while a majority of
respondents in 16 countries say that they holidayed for at least four nights in the EU.
Holidays in the EU were most popular in Luxembourg (93%), Malta (91%), Belgium
(76%), and Cyprus (73%). But relatively few respondents went for a holiday in the EU
in Turkey (6%), Bulgaria (23%), Greece (27%) and Italy (27%).

FLASH EUROBAROMETER 334 “Attitudes of Europeans Towards Tourism”
29
Base: 60% from the total number of respondents (15 848 respondents)
(Those who went on holiday for at least four nights in 2011)
Holidaying in another country outside the EU was the most popular option in
two countries: Slovenia, where 69% of people who went away for at least four
nights did this, and in Serbia, where 44% did so. Travelling to a non-EU country
was also relatively popular in Austria, Denmark and Macedonia (all 35%). However,
relatively few individuals took holidays outside the EU in Greece (7%), Romania
(8%), Bulgaria (9%) and Turkey (9%).

FLASH EUROBAROMETER 334 “Attitudes of Europeans Towards Tourism”
30
Base: 60% from the total number of respondents (15 848 respondents)
(Those who went on holiday for at least four nights in 2011)
Focusing on the specific places that people from individual countries chose to visit,
we find that in 14 countries at least 10% of respondents say that they went to
Spain for their holiday. Spain was the most popular as a holiday destination among
people in Ireland (31%), Norway (21%), Portugal (20%) and the UK (20%).
In 11 countries, at least 10% of people went to Italy for their holiday and it was
most visited by respondents from Malta (37%), Austria (26%), Germany (18%)
and Luxembourg (18%).

FLASH EUROBAROMETER 334 “Attitudes of Europeans Towards Tourism”
31
At least one in 10 respondents went to France for their holiday in nine countries.
France was the most-visited destination by respondents in Belgium (40%),
Luxembourg (27%) and the Netherlands (22%).
Germany (14%) is the only country where more than 10% of respondents say that
they visited Austria for their holiday, though 9% of people in Luxembourg and 8%
of those in the Netherlands also did so. But as a destination, Germany was visited
by at least 10% of people in eight countries, mostly by tourists from Luxembourg
(20%), Latvia (17%) and the Netherlands (17%).
At least one in 10 respondents went to Greece for their holiday in four countries:
Cyprus (50%), Macedonia (20%), Serbia (16%), and Bulgaria (10%).

FLASH EUROBAROMETER 334 “Attitudes of Europeans Towards Tourism”
32
Destinations for the main holidays taken in 2011

FLASH EUROBAROMETER 334 “Attitudes of Europeans Towards Tourism”
33
Spain Italy France Austria Germany Greece
EU27 11% 9% 8% 5% 5% 4%
BE 16% 13% 40% 5% 8% 5%
BG 2% 1% 3% 1% 3% 10%
CZ 3% 12% 5% 6% 8% 7%
DK 16% 14% 10% 6% 16% 5%
DE 14% 18% 8% 14% 0% 4%
EE 7% 3% 6% 4% 7% 3%
IE 31% 9% 13% 2% 3% 3%
EL 3% 3% 3% 2% 6% 0%
ES 0% 7% 8% 1% 3% 2%
FR 12% 8% 0% 1% 3% 2%
IT 9% 0% 7% 2% 3% 3%
CY 3% 5% 4% 2% 5% 50%
LV 5% 9% 4% 2% 17% 1%
LT 5% 6% 6% 1% 9% 3%
LU 12% 18% 27% 9% 20% 4%
HU 2% 6% 1% 7% 8% 4%
MT 12% 37% 11% 3% 12% 3%
NL 15% 14% 22% 8% 17% 4%
AT 9% 26% 7% 0% 16% 6%
PL 3% 5% 3% 3% 11% 3%
PT 20% 4% 11% 0% 3% 0%
RO 5% 10% 3% 5% 9% 5%
SI 4% 11% 5% 7% 6% 5%
SK 4% 9% 3% 7% 4% 4%
FI 13% 7% 4% 3% 8% 6%
SE 15% 10% 8% 3% 8% 7%
UK 20% 5% 12% 1% 4% 5%
HR 3% 9% 3% 7% 5% 0%
TR 0% 1% 2% 1% 2% 1%
MK 0% 4% 2% 3% 6% 20%
IS 18% 3% 3% 1% 7% 2%
NO 21% 6% 6% 2% 5% 9%
RS 2% 3% 2% 3% 7% 16%
IL 9% 9% 10% 2% 12% 7%
Q5 In which country(ies) did you go for a minimum of 4 nights in 2011? - Top 6 destinations
Highest percentage per countryHighest percentage per item
Lowest percentage per countryLowest percentage per item
Base: 60% from the total number of respondents (15 848 respondents)
(Those who went on holiday for at least four nights in 2011)

FLASH EUROBAROMETER 334 “Attitudes of Europeans Towards Tourism”
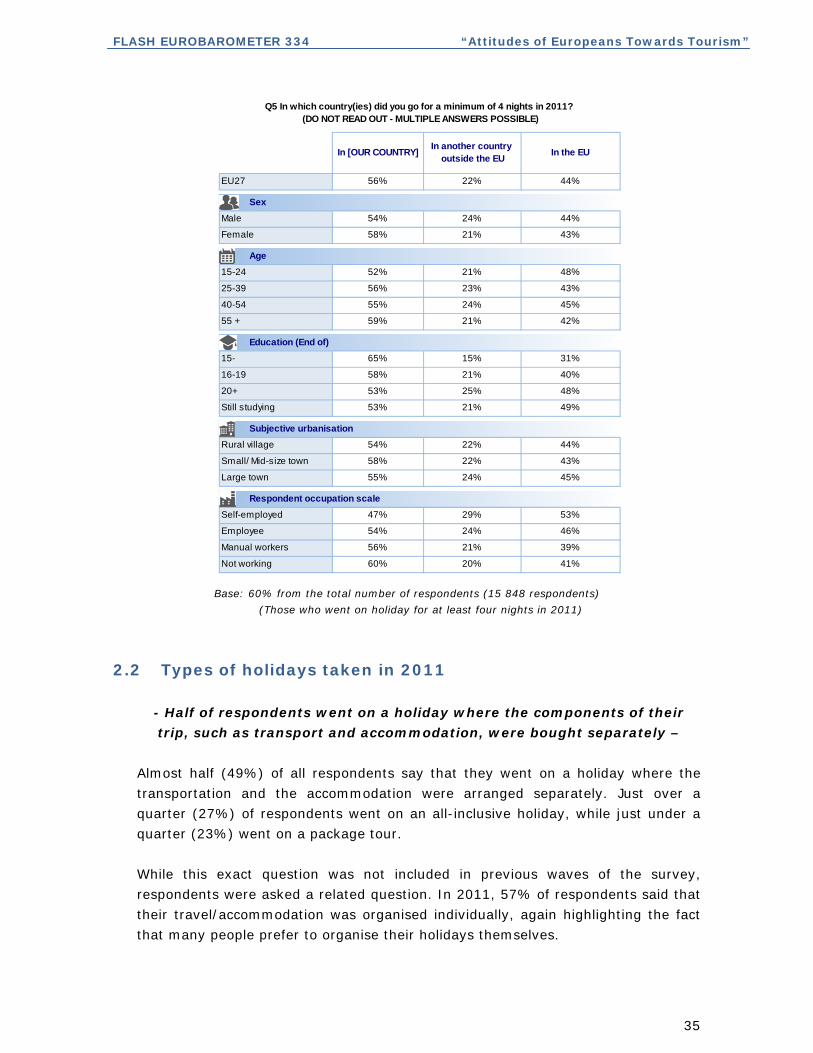
34
The socio-demographic data show that:
Older respondents are the most likely to say that they holidayed in their
own country: 59% of over-55s say this, as opposed to 52% of people in the
15-24 age band. Respondents in the latter group are the most likely to have
taken a holiday in the EU: 48% did so, compared with 42% of people aged
55 or more.
Individuals with a lower level of education are the most likely to have gone
on holiday in their own country: while 65% of people who left school aged
15 or under did this, only 58% of those who left aged 16-19, and 53% who
left at 20 or over did the same. By contrast, respondents with a higher level
of education are the most likely to have taken a holiday in the EU and/or in
a country outside the EU.
While 60% of people who are not working holidayed in their own country,
only 47% of self-employed respondents did this. By contrast, a majority
(53%) of self-employed people holidayed in the EU, compared with just
39% of manual workers and 41% of people who are not working.
FLASH EUROBAROMETER 334 “Attitudes of Europeans Towards Tourism”
35
In [OUR COUNTRY]In another country
outside the EUIn the EU
EU27 56% 22% 44%
Male 54% 24% 44%
Female 58% 21% 43%
15-24 52% 21% 48%
25-39 56% 23% 43%
40-54 55% 24% 45%
55 + 59% 21% 42%
15- 65% 15% 31%
16-19 58% 21% 40%
20+ 53% 25% 48%
Still studying 53% 21% 49%
Rural village 54% 22% 44%
Small/ Mid-size town 58% 22% 43%
Large town 55% 24% 45%
Self-employed 47% 29% 53%
Employee 54% 24% 46%
Manual workers 56% 21% 39%
Not working 60% 20% 41%
Respondent occupation scale
Q5 In which country(ies) did you go for a minimum of 4 nights in 2011? (DO NOT READ OUT - MULTIPLE ANSWERS POSSIBLE)
Sex
Age
Education (End of)
Subjective urbanisation
Base: 60% from the total number of respondents (15 848 respondents)
(Those who went on holiday for at least four nights in 2011)
2.2 Types of holidays taken in 2011
- Half of respondents went on a holiday where the components of their
trip, such as transport and accommodation, were bought separately –
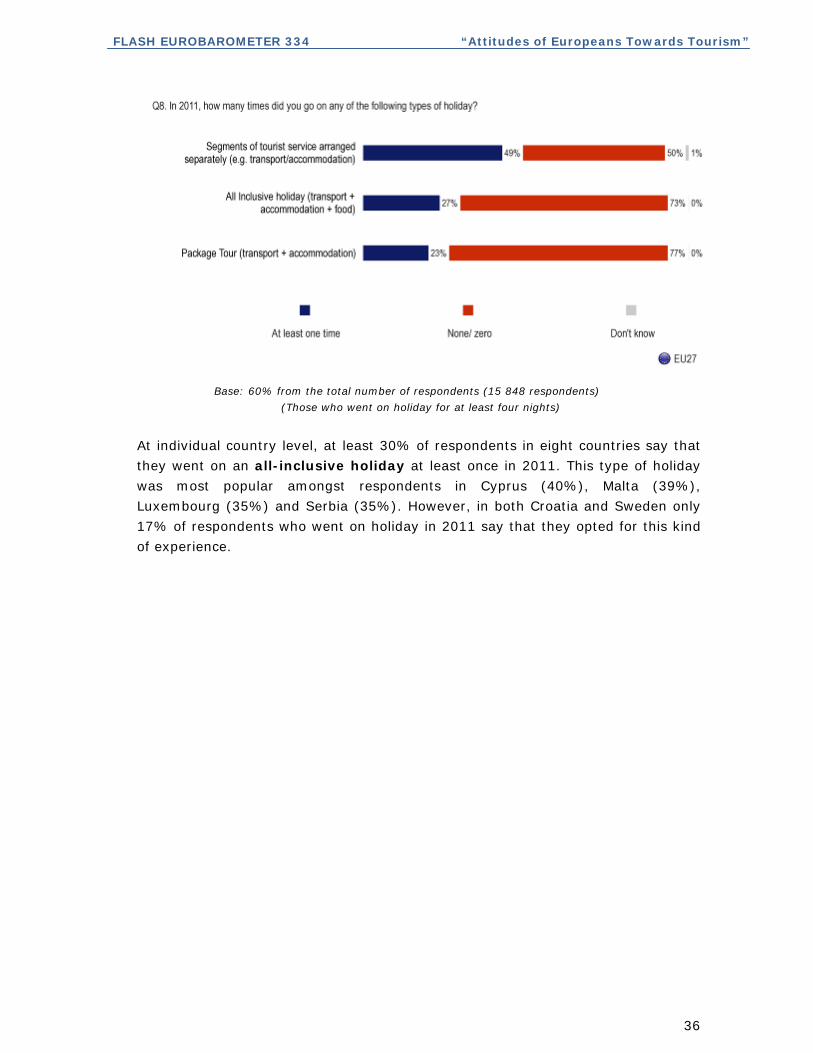
Almost half (49%) of all respondents say that they went on a holiday where the
transportation and the accommodation were arranged separately. Just over a
quarter (27%) of respondents went on an all-inclusive holiday, while just under a
quarter (23%) went on a package tour.
While this exact question was not included in previous waves of the survey,
respondents were asked a related question. In 2011, 57% of respondents said that
their travel/accommodation was organised individually, again highlighting the fact
that many people prefer to organise their holidays themselves.
FLASH EUROBAROMETER 334 “Attitudes of Europeans Towards Tourism”
36
Base: 60% from the total number of respondents (15 848 respondents)
(Those who went on holiday for at least four nights)
At individual country level, at least 30% of respondents in eight countries say that
they went on an all-inclusive holiday at least once in 2011. This type of holiday
was most popular amongst respondents in Cyprus (40%), Malta (39%),
Luxembourg (35%) and Serbia (35%). However, in both Croatia and Sweden only
17% of respondents who went on holiday in 2011 say that they opted for this kind
of experience.

FLASH EUROBAROMETER 334 “Attitudes of Europeans Towards Tourism”
37
Base: 60% from the total number of respondents
(Those who went on holiday for at least four nights in 2011)
When it comes to package holiday, at least 30% of respondents in just six
countries say that they went on this kind of holiday at least once in 2011. Package
holiday was most popular amongst respondents in Austria (36%), Israel (36%),
and Luxembourg (36%). But relatively few people in Turkey (10%), Greece (11%),
Macedonia (11%) and Portugal (11%) chose to go on a package tour.

FLASH EUROBAROMETER 334 “Attitudes of Europeans Towards Tourism”
38
Base: 60% from the total number of respondents
(Those who went on holiday for at least four nights in 2011)
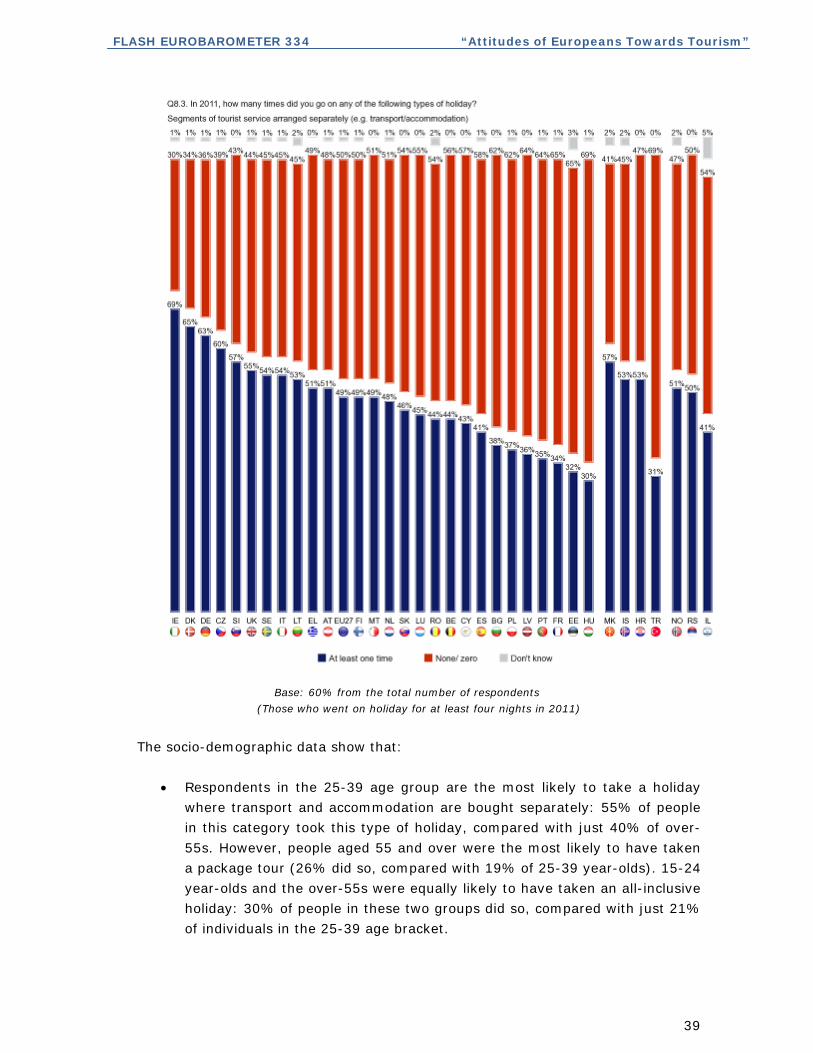
A majority of people in 15 of the 34 countries covered by the survey say that they
took a holiday in 2011 where transportation and accommodation were
booked separately. This approach was particularly commonplace among
holidaymakers in Ireland (69%), Denmark (65%), Germany (63%), and the Czech
Republic (60%). This kind of holiday was least popular in Hungary (30%), Turkey
(31%) and Estonia (32%).
FLASH EUROBAROMETER 334 “Attitudes of Europeans Towards Tourism”
39
Base: 60% from the total number of respondents
(Those who went on holiday for at least four nights in 2011)
The socio-demographic data show that:
Respondents in the 25-39 age group are the most likely to take a holiday
where transport and accommodation are bought separately: 55% of people
in this category took this type of holiday, compared with just 40% of over-
55s. However, people aged 55 and over were the most likely to have taken
a package tour (26% did so, compared with 19% of 25-39 year-olds). 15-24
year-olds and the over-55s were equally likely to have taken an all-inclusive
holiday: 30% of people in these two groups did so, compared with just 21%
of individuals in the 25-39 age bracket.
FLASH EUROBAROMETER 334 “Attitudes of Europeans Towards Tourism”
40
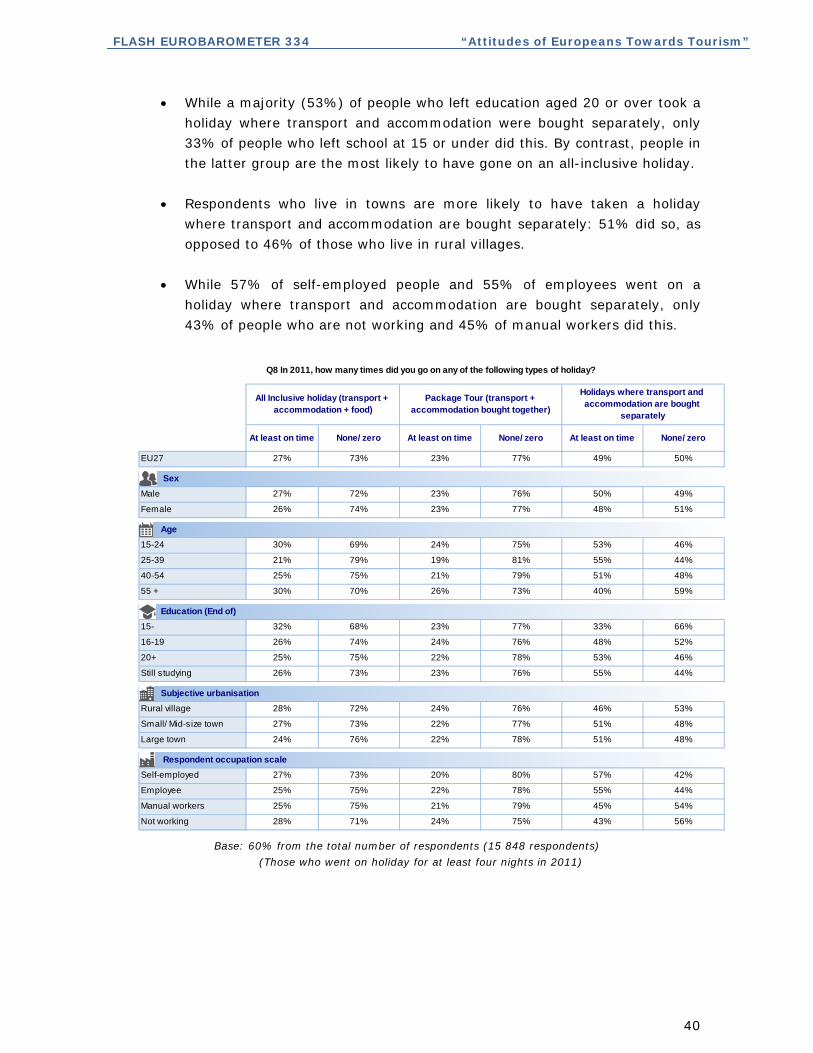
While a majority (53%) of people who left education aged 20 or over took a
holiday where transport and accommodation were bought separately, only
33% of people who left school at 15 or under did this. By contrast, people in
the latter group are the most likely to have gone on an all-inclusive holiday.
Respondents who live in towns are more likely to have taken a holiday
where transport and accommodation are bought separately: 51% did so, as
opposed to 46% of those who live in rural villages.
While 57% of self-employed people and 55% of employees went on a
holiday where transport and accommodation are bought separately, only
43% of people who are not working and 45% of manual workers did this.
At least on time None/ zero At least on time None/ zero At least on time None/ zero
EU27 27% 73% 23% 77% 49% 50%
Male 27% 72% 23% 76% 50% 49%
Female 26% 74% 23% 77% 48% 51%
15-24 30% 69% 24% 75% 53% 46%
25-39 21% 79% 19% 81% 55% 44%
40-54 25% 75% 21% 79% 51% 48%
55 + 30% 70% 26% 73% 40% 59%
15- 32% 68% 23% 77% 33% 66%
16-19 26% 74% 24% 76% 48% 52%
20+ 25% 75% 22% 78% 53% 46%
Still studying 26% 73% 23% 76% 55% 44%
Rural village 28% 72% 24% 76% 46% 53%
Small/ Mid-size town 27% 73% 22% 77% 51% 48%
Large town 24% 76% 22% 78% 51% 48%
Self-employed 27% 73% 20% 80% 57% 42%
Employee 25% 75% 22% 78% 55% 44%
Manual workers 25% 75% 21% 79% 45% 54%
Not working 28% 71% 24% 75% 43% 56%
Sex
Age
Education (End of)
Subjective urbanisation
Respondent occupation scale
Holidays where transport and accommodation are bought
separately
Package Tour (transport + accommodation bought together)
All Inclusive holiday (transport + accommodation + food)
Q8 In 2011, how many times did you go on any of the following types of holiday?
Base: 60% from the total number of respondents (15 848 respondents)
(Those who went on holiday for at least four nights in 2011)

FLASH EUROBAROMETER 334 “Attitudes of Europeans Towards Tourism”
41
2.3 Means of transport used for going on holidays in 2011
- Over three quarters of respondents who took a holiday in 2011 used a car or
motorbike at least once to reach their destination –
Over three quarters (78%) of respondents say that they travelled at least once by car
or motorbike when journeying to their holiday destination, while just under half (46%)
say that they went by airplane. Nearly three out of 10 (29%) people say that their
journey included at least one train trip, with two out of 10 (20%) respondents having
taken at least one bus journey on the way to their holiday destination. A further 14%
of respondents say that they rode on at least one boat in order to reach their holiday
destination.
The wording of this question has been slightly rephrased compared to last years'
questionnaire; however it is possible to compare the results. In 2011, when only one
answer was permitted, 44% of respondents said they travelled by car/motorbike, 39%
travelled by airplane, 7% by train, 6% by bus, and 3% by boat.
Base: 60% from the total number of respondents (15 848 respondents)
(Those who went on holiday for at least four nights in 2011)
It is interesting to note the difference between EU15 and NMS12 responses on the
question of whether people travelled by airplane in order to reach their destination.
While 50% of EU15 respondents took at least one plane journey, only 24% of
NMS12 (respondents did so.
FLASH EUROBAROMETER 334 “Attitudes of Europeans Towards Tourism”
42
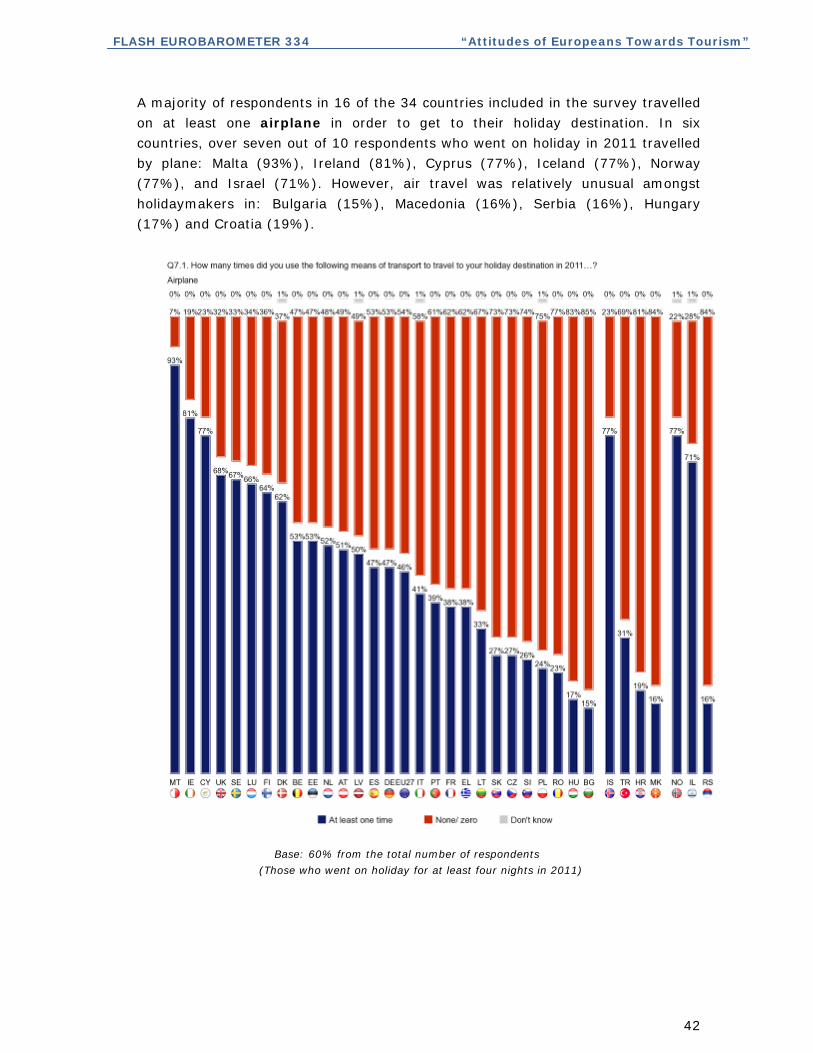
A majority of respondents in 16 of the 34 countries included in the survey travelled
on at least one airplane in order to get to their holiday destination. In six
countries, over seven out of 10 respondents who went on holiday in 2011 travelled
by plane: Malta (93%), Ireland (81%), Cyprus (77%), Iceland (77%), Norway
(77%), and Israel (71%). However, air travel was relatively unusual amongst
holidaymakers in: Bulgaria (15%), Macedonia (16%), Serbia (16%), Hungary
(17%) and Croatia (19%).
Base: 60% from the total number of respondents
(Those who went on holiday for at least four nights in 2011)
FLASH EUROBAROMETER 334 “Attitudes of Europeans Towards Tourism”
43
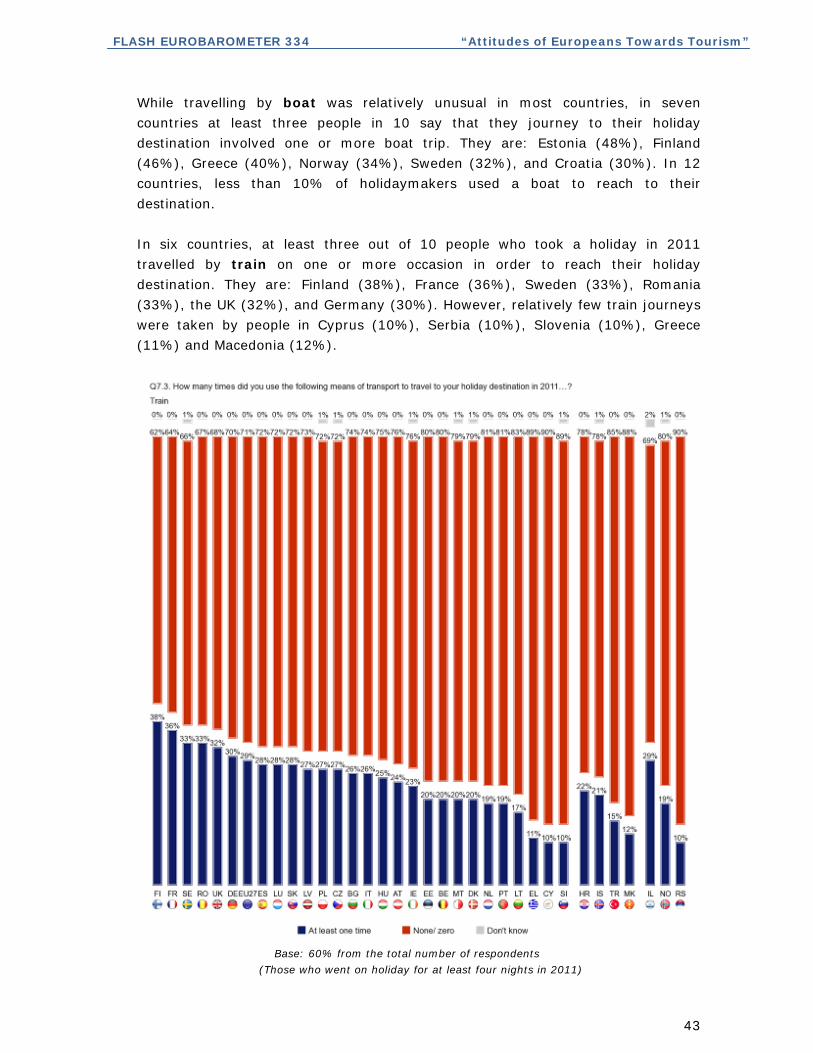
While travelling by boat was relatively unusual in most countries, in seven
countries at least three people in 10 say that they journey to their holiday
destination involved one or more boat trip. They are: Estonia (48%), Finland
(46%), Greece (40%), Norway (34%), Sweden (32%), and Croatia (30%). In 12
countries, less than 10% of holidaymakers used a boat to reach to their
destination.
In six countries, at least three out of 10 people who took a holiday in 2011
travelled by train on one or more occasion in order to reach their holiday
destination. They are: Finland (38%), France (36%), Sweden (33%), Romania
(33%), the UK (32%), and Germany (30%). However, relatively few train journeys
were taken by people in Cyprus (10%), Serbia (10%), Slovenia (10%), Greece
(11%) and Macedonia (12%).
Base: 60% from the total number of respondents
(Those who went on holiday for at least four nights in 2011)

FLASH EUROBAROMETER 334 “Attitudes of Europeans Towards Tourism”
44
In six countries, at least four out of 10 people who went on holiday in 2011
travelled by bus in order to reach their destination. They are: Turkey (64%),
Macedonia (50%), Latvia (48%), Serbia (45%), Estonia (43%) and Bulgaria
(42%). Bus travel was least important to holidaymakers in the Netherlands (9%),
France (11%), Belgium (12%) and Italy (12%).
A majority of people who went on holiday in all but two countries – Cyprus and
Malta – say that they travelled by car or motorbike at least once in order to reach
their destination. In 12 countries at least eight out of 10 holidaymakers journeyed
by car or motorbike, which were especially popular means of transport in Slovenia
(92%), Croatia (87%), France (86%), Lithuania (86%), Iceland (85%) and
Portugal (85%). These means of reaching a holiday destination were employed
least in Malta (30%) and Cyprus (46%), followed by Turkey (62%), Israel (63%)
and Serbia (63%).
Base: 60% from the total number of respondents (15 848 respondents)
(Those who went on holiday for at least four nights in 2011)

FLASH EUROBAROMETER 334 “Attitudes of Europeans Towards Tourism”
45
The socio-demographic data show that:
People aged 25-54 (83-84%), individuals who finished their education aged
20 or over (81%) or aged 16-19 (79%), those who left education at 15 or
under (68%) and respondents who live in rural villages (82%) are more
likely to have travelled by car or motorbike when reaching their holiday
destination. Employees (84%) and self-employed respondents (82%) are
also more likely to have taken a car or motorbike than manual workers
(76%) and people who are not working (73%).
Looking at air travel, respondents who left education aged 20 or over
(51%) are more likely to have taken a plane than those who left at 19 or
under (37-41%). The same pattern can be seen at people who live in large
towns (51%), at self-employed (58%) respondents and employees (50%).
Turning to train travel, respondents in the 15-24 age bracket (45%) are
more likely to have travelled by train at least once than people in the three
older age groups (26-30%). People who left education aged 20 or over
(34%) are more likely to have taken a train than those who left school at 15
or under (21%). Those who live in large towns (34%) are more likely to
have taken a train than respondents who live in rural villages (21%).
Respondents in the 15-24 age group (35%) and in the 55+ bracket are
more likely to have travelled by bus at least once than people aged 25-54
(13-14%). And people who are not working (28%) and manual workers
(21%) were more likely to have gone by bus than employees or self-
employed workers (12-13%).

FLASH EUROBAROMETER 334 “Attitudes of Europeans Towards Tourism”
46
Car/ Motorbikes
Airplane Train Bus Boat
EU27 78% 46% 29% 20% 14%
Male 80% 46% 28% 19% 14%
Female 76% 45% 30% 22% 13%
15-24 74% 48% 45% 35% 15%
25-39 83% 48% 26% 14% 13%
40-54 84% 46% 22% 13% 13%
55 + 73% 43% 28% 24% 14%
15- 68% 37% 22% 26% 12%
16-19 79% 41% 24% 19% 13%
20+ 81% 51% 30% 16% 15%
Still studying 74% 47% 46% 37% 14%
Rural village 82% 42% 21% 19% 13%
Small/ Mid-size town 78% 45% 30% 20% 13%
Large town 75% 51% 34% 22% 15%
Self-employed 82% 58% 26% 13% 16%
Employee 84% 50% 25% 12% 14%
Manual workers 76% 40% 25% 21% 12%
Not working 73% 41% 33% 28% 12%
Sex
Age
Education (End of)
Subjective urbanisation
Q7 How many times did you use the following means of transport to travel to your holiday destination in 2011…? % 'At least one time'
Respondent occupation scale
Base: 60% from the total number of respondents (15 848 respondents)
(Those who went on holiday for at least four nights in 2011)

FLASH EUROBAROMETER 334 “Attitudes of Europeans Towards Tourism”
47
2.4 Satisfaction with the main holidays taken in 2011
- Over 90% of respondents express satisfaction with the natural features and
the quality of accommodation at their holiday destination –
Over nine out of 10 (94%) respondents say that they were satisfied with the natural
features of the place they went to on holiday, with 65% saying they were very
satisfied and 29% fairly satisfied.
A similarly large majority (93%) of respondents say that they were satisfied with the
quality of accommodation in the place they stayed, with 54% saying they were very
satisfied and 37% fairly satisfied.
Over eight people in 10 (85%) were satisfied by the way in which tourists were
welcomed, with 47% saying they were very satisfied and 38% fairly satisfied. Just
5% say they were not satisfied with the welcome shown to tourists.
Over eight respondents in 10 (82%) were also satisfied by the general level of
prices. However, only 28% say they were very satisfied, whereas 54% that they were
only fairly satisfied. Over one in 10 (13%) say they were not satisfied with the general
level of prices, with 11% not very satisfied and 2% not at all satisfied.
Just under eight out of 10 people (79%) say they were satisfied by the activities on
offer, with 36% saying they were very satisfied and 43% saying that they were fairly
satisfied.
Base: 60% from the total number of respondents (15 848 respondents)
(Those who went on holiday for at least four nights in 2011)

FLASH EUROBAROMETER 334 “Attitudes of Europeans Towards Tourism”
48
In all but eight of the 34 countries included in the survey over 90% of respondents say
that they were satisfied with the quality of accommodation that they experienced
on their holiday. Satisfaction was highest among respondents in Macedonia (98%),
Belgium (97%), Austria (96%), Germany (96%) and Slovenia (96%). At the bottom of
the list 71% of respondents in Turkey expressed satisfaction with their
accommodation. Satisfaction also relatively low was in Bulgaria and Greece (both
79%).
Base: 60% from the total number of respondents (15 848 respondents)
(Those who went on holiday for at least four nights in 2011)
When considering the natural features of their holiday destination, over 90% of
respondents in all but five countries say that they were satisfied with their experience.

FLASH EUROBAROMETER 334 “Attitudes of Europeans Towards Tourism”
49
Satisfaction was again highest among respondents in Macedonia (99%), followed by
Austria, Cyprus Germany, Ireland, Portugal, Lithuania and Slovenia (all 96%). The
level of satisfaction was again lowest among respondents in Turkey (77%), followed by
those in Israel (87%), Bulgaria (89%), Poland (89%) and Romania (89%).
Base: 60% from the total number of respondents (15 848 respondents)
(Those who went on holiday for at least four nights in 2011)
In five countries at least 90% of respondents express satisfaction with the general
level of prices that they encountered on their holiday. They are: Belgium (92%),
Austria (91%), the UK (91%), Germany (90%), and Norway (90%). However, in six
countries fewer than seven people in 10 say that they were satisfied with the general
level of prices at their holiday destination. In Turkey, under half (49%) express
satisfaction, with a relatively low proportion also doing so in Greece (61%), Croatia
(66%), Bulgaria (67%), Romania (67%), Lithuania (69%).

FLASH EUROBAROMETER 334 “Attitudes of Europeans Towards Tourism”
50
Base: 60% from the total number of respondents (15 848 respondents)
(Those who went on holiday for at least four nights in 2011)
The activities on offer appeared satisfactory to over 90% of respondents in only two
countries, Serbia and Iceland, where 91% and 90% of respondents respectively say
that the activities were satisfactory. Relatively high numbers of people also say this in
Finland (88%), Macedonia (87%), Slovenia (86%) and Austria (86%). However,
satisfaction with the activities on offer was relatively low among holidaymakers in
Turkey (58%), Greece (65%), Hungary (67%) and Bulgaria (68%). On this question
respondents quite commonly say they don’t know whether the activities on offer had
were satisfactory, especially those in Hungary (28%) and Estonia (26%).

FLASH EUROBAROMETER 334 “Attitudes of Europeans Towards Tourism”
51
Base: 60% from the total number of respondents
(Those who went on holiday for at least four nights in 2011)
When asked whether the way in which tourists were welcomed struck them as
being satisfactory, at least 90% of respondents in nine countries say that they were
satisfied by this on their holiday. Satisfaction with the level of hospitality was highest
in Ireland (94%), Serbia (94%), Austria (93%) and Belgium (93%). The lowest levels
of satisfaction on this criteria were registered in Turkey (59%), Estonia (68%) and
Bulgaria (72%). However, a relatively high number of people also say that they don’t
know whether the welcome shown to tourists was satisfactory in these countries
(Estonia – 29%; Turkey – 23%; Bulgaria – 17%).

FLASH EUROBAROMETER 334 “Attitudes of Europeans Towards Tourism”
52
Base: 60% from the total number of respondents
(Those who went on holiday for at least four nights in 2011)
The socio-demographic variations are generally only minor on this question. However,
there are some notable findings:
Women are more likely than men to say that they are very satisfied with their
experience, especially with reference to their destination’s natural features
(68% vs. 63%) and the quality of accommodation (58% vs. 53%). However,
overall levels of satisfaction are very similar for men and women (92-93%).

FLASH EUROBAROMETER 334 “Attitudes of Europeans Towards Tourism”
53
Older respondents are more likely to say that they are very satisfied, especially
when it comes to the quality of accommodation. While 62% of people aged
55 and over say they are very satisfied, this falls to 46% among 15-24 year-
olds. Overall levels of satisfaction are very similar across the different age
groups, however (92-94%).
People who left school at a younger age are more likely to say that they are
very satisfied with their experience on certain criteria. For example, people who
left school aged 15 or under are more likely to be very satisfied with the
general level of prices (34% vs. 26% of people who left aged 20 or over),
and also with the quality of accommodation (63% vs. 56% of people who left
aged 20 or over). However, respondents who left education aged 15 or under
are the least likely to express satisfaction (i.e. either very satisfied or fairly
satisfied) over the quality of accommodation and the general level of prices.
The quality of the accommodation
The natural features (weather conditions,
landscape, etc;)
The general level of prices
EU27 93% 94% 82%
Male 93% 94% 83%
Female 92% 94% 83%
15-24 94% 93% 81%
25-39 93% 94% 82%
40-54 93% 94% 84%
55 + 92% 94% 82%
15- 90% 92% 79%
16-19 93% 94% 84%
20+ 94% 94% 83%
Still studying 93% 93% 81%
Q11 Now thinking about your main holidays in 2011, how satisfied were you with…? % Total 'Satisfied'
Sex
Age
Education (End of)
Base: 60% from the total number of respondents (15 848 respondents)
(Those who went on holiday for at least four nights in 2011)

FLASH EUROBAROMETER 334 “Attitudes of Europeans Towards Tourism”
54
3. TRAVELLERS’ PROFILE IN 2011
This chapter addresses the travel patterns of respondents in 2011. All respondents
were first asked whether they had spent at least one night travelling away from home
either for business or private purposes. Those who answered positively to this question
were then asked whether they had spent less than four nights and secondly more than
four nights, in certain types of accommodation, including paid accommodation such as
hotels, and at the homes of friends or relatives.
3.1 Proportion of respondents who travelled in 2011
- Over seven out of 10 respondents travelled either for business or private
purposes in 2011 –
Over seven out of 10 (72%) respondents said they travelled at least once in 2011 –
similar to the proportion registered in 2010, when the results were obtained from a
smaller sample.
The results show a fairly even distribution in terms of the number of times people
travelled for business or private purposes for at least one night during 2011. 15% of
respondents said that they travelled once in 2011 (-1 point compared with 2010); 12%
travelled twice (-2 points); 10% went away from home three times (-1 point); 13%
travelled four or five times (no change on the previous year); 11% went away from
home between six and 10 times (+1 point); and 11% travelled more than 10 times
(+3 points). Just over a quarter (26%) of respondents did not travel at all (-1 point).

FLASH EUROBAROMETER 334 “Attitudes of Europeans Towards Tourism”
55
Base: Total number of respondents
On this question, it is interesting to compare the results of the EU15 and NMS12
countries. While almost three quarters (74%) of EU15 respondents said that they had
taken at least one overnight trip in 2011, only 65% of their NMS12 counterparts said
the same thing.
In all but two of the 34 countries under consideration here – namely Serbia (42%) and
Turkey (44%) – a majority of respondents said that they had made an overnight trip
for either private or business purposes at least once in 2011. In nine countries over
80% of respondents did so, with the highest proportions of people who made at least
one overnight trip being reported in Norway (90%), Iceland (88%), Denmark (87%),
Ireland (86%) and Sweden (86%). Among EU countries, the lowest rate of travel
among citizens occurred in Malta (50%) and Portugal (54%).

FLASH EUROBAROMETER 334 “Attitudes of Europeans Towards Tourism”
56
Base: Total number of respondents
Comparing these results with those of the February 2011 survey2, it is clear that
although there was no change when looking at the aggregate results, some individual
countries experienced large variations in the proportions of people who travelled for at
least one night. For example, sizeable increases were seen in Slovakia (72%, +13
points), Estonia (73%, +10 points) and Hungary (55%, +10 points). By contrast, large
falls in the number of people who made an overnight trip were observed in Macedonia
(51%, -15 points), Greece (63%, -14 points) and Malta (50%, -13 points).
The socio-demographic data show that:

FLASH EUROBAROMETER 334 “Attitudes of Europeans Towards Tourism”
57
Men (74%) were slightly more likely than women (70%) to have travelled
overnight in 2011.
Younger respondents were more likely to have travelled. While 79% of 15-
24 year-olds said that they had spent at least one night away, this falls to
76% among 25-39 year-olds, 74% among 40-54 year-olds, and to 65%
among the 55+ group.
Individuals who spent longer in education were the most likely to have
travelled during 2011. While 81% of people who left education aged 20 or
over said that they had spent at least one night away, only 69% of people
who left school aged 16-19 and 50% of those who left aged 15 or under
said the same thing.
Three quarters (75%) of respondents who live in large towns travelled in
2011, compared with 68% of people who live in rural villages.
Over eight out of 10 (83%) employees and 77% of self-employed
respondents made an overnight trip in 2011, compared with only 67% of
manual workers and 65% of people who are not working.
2 Israel and Serbia were not included in previous waves of this survey, and so are not subject to trend analysis.

FLASH EUROBAROMETER 334 “Attitudes of Europeans Towards Tourism”
58
Have travelled in 2011
Have not travelled at all in 2011
Don't know
EU27 72% 26% 2%
Male 74% 23% 3%
Female 70% 28% 2%
15-24 79% 18% 3%
25-39 76% 22% 2%
40-54 74% 24% 2%
55 + 65% 33% 2%
15- 50% 48% 2%
16-19 69% 29% 2%
20+ 81% 17% 2%
Still studying 84% 13% 3%
Rural village 68% 30% 2%
Small/ Mid-size town 73% 25% 2%
Large town 75% 22% 3%
Self-employed 77% 20% 3%
Employee 83% 15% 2%
Manual workers 67% 30% 3%
Not working 65% 33% 2%
Respondent occupation scale
Q1 During 2011, how many times have you travelled for business or privatepurposes, where you were away from home for a minimum of one night?
Sex
Age
Education (End of)
Subjective urbanisation
Base: Total number of respondents

FLASH EUROBAROMETER 334 “Attitudes of Europeans Towards Tourism”
59
3.2 Holidays of less than four nights taken in 2011
- A majority of respondents who went on holiday for less than four nights
stayed in paid accommodation –
A majority (54%) respondents who went on holiday for less than four nights at least
once in 2011 said they stayed at least once in paid accommodation, such as a hotel or
rented apartment, while just under half (47%) said that they stayed with friends or
relatives. Just under a fifth (18%) of respondents said they stayed in their own
property or second home, while over one in 10 said they stayed in another type of
location (14%) or on a camping site (12%).
On the subject of whether people stayed in paid accommodation, 22% said they did so
once in 2011, 14% did so twice, 7% did so three times, 4% did so four times, and 7%
did so five times or more.
Among the 47% of respondents who said they stayed with friends or relatives, 13%
did so once, 10% did so twice, 6% did so three times, 4% did so four times, and 14%
did so five times or more. ‘Five times or more’ was therefore the most popular answer
amongst respondents who said they stayed with friends or relatives.
Among the 18% of respondents who said they stayed in their own property or second
home, 5% did this once, 3% did so twice, 2% did so three times, 1% did so four
times, and 7% did so five times or more. ‘Five times or more’ was therefore the most
common answer amongst respondents who said they stayed in their own property or
second home.
By contrast, people who stayed in another type of location or on a camping were more
likely to do so only once.
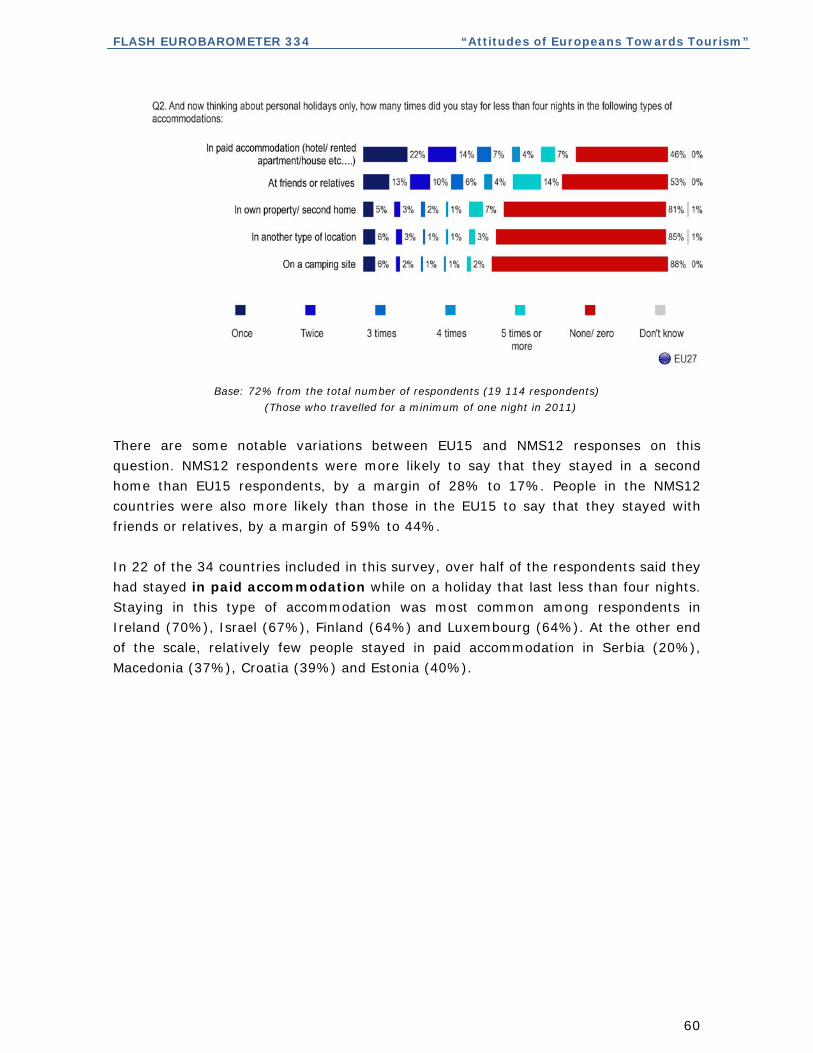
FLASH EUROBAROMETER 334 “Attitudes of Europeans Towards Tourism”
60
Base: 72% from the total number of respondents (19 114 respondents)
(Those who travelled for a minimum of one night in 2011)
There are some notable variations between EU15 and NMS12 responses on this
question. NMS12 respondents were more likely to say that they stayed in a second
home than EU15 respondents, by a margin of 28% to 17%. People in the NMS12
countries were also more likely than those in the EU15 to say that they stayed with
friends or relatives, by a margin of 59% to 44%.
In 22 of the 34 countries included in this survey, over half of the respondents said they
had stayed in paid accommodation while on a holiday that last less than four nights.
Staying in this type of accommodation was most common among respondents in
Ireland (70%), Israel (67%), Finland (64%) and Luxembourg (64%). At the other end
of the scale, relatively few people stayed in paid accommodation in Serbia (20%),
Macedonia (37%), Croatia (39%) and Estonia (40%).
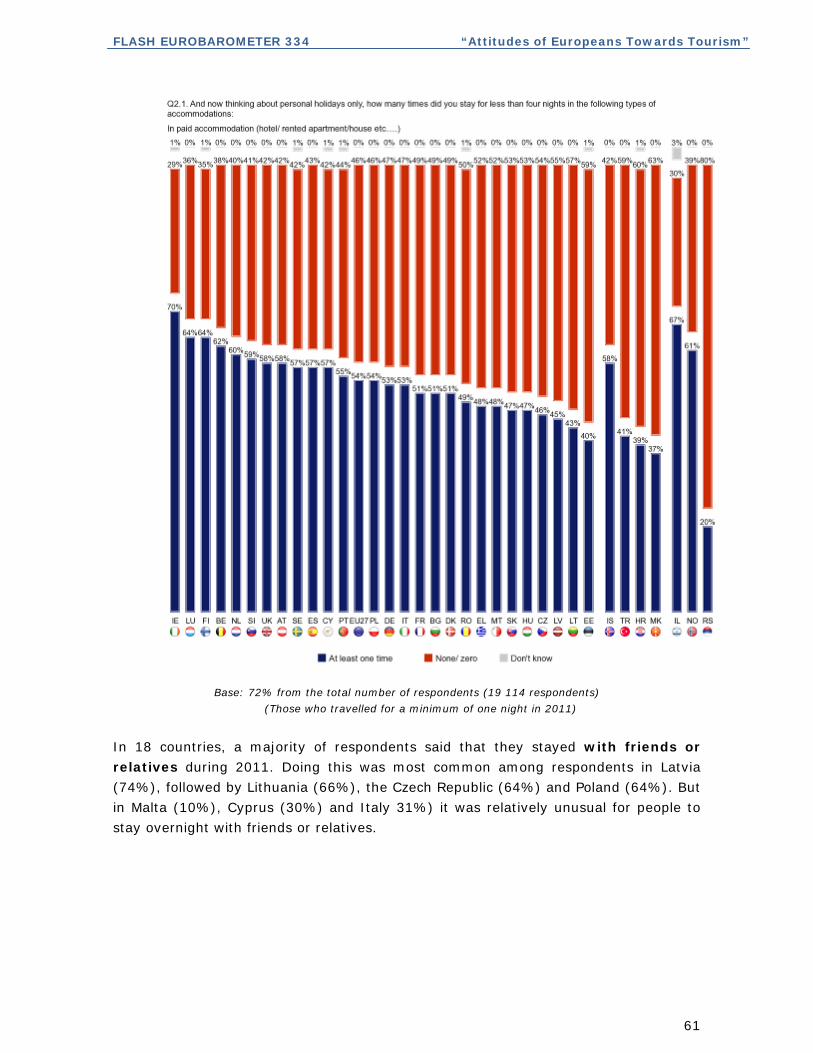
FLASH EUROBAROMETER 334 “Attitudes of Europeans Towards Tourism”
61
Base: 72% from the total number of respondents (19 114 respondents)
(Those who travelled for a minimum of one night in 2011)
In 18 countries, a majority of respondents said that they stayed with friends or
relatives during 2011. Doing this was most common among respondents in Latvia
(74%), followed by Lithuania (66%), the Czech Republic (64%) and Poland (64%). But
in Malta (10%), Cyprus (30%) and Italy 31%) it was relatively unusual for people to
stay overnight with friends or relatives.

FLASH EUROBAROMETER 334 “Attitudes of Europeans Towards Tourism”
62
Base: 72% from the total number of respondents (19 114 respondents)
(Those who travelled for a minimum of one night in 2011)
Staying in one’s own property or second home was far more common in some
countries than in others. In four countries at least four people out of 10 said that they
did this during 2011: Norway (49%), Slovakia (44%), the Czech Republic (43%) and
Bulgaria (40%). However, less than a tenth of respondents stayed in a second home in
Malta (4%), the Netherlands (7%) and Israel (9%).
FLASH EUROBAROMETER 334 “Attitudes of Europeans Towards Tourism”
63
While staying in another type of location was not particularly common in most
countries, in five countries at least 20% of respondents said that they had done this
when on a holiday lasting no more than four nights. They are: Israel (29%), Norway
(25%), Slovakia (22%), Latvia (21%) and Poland (20%). Camping was also not
especially common in most countries. However, in Iceland a third (33%) of
respondents said they had gone camping in 2011, with relatively high numbers of
people also giving this answer in the Czech Republic, Romania and the UK (all 19%).
According to the socio-demographic data:
Respondents in the 25-39 age group (59%) are the most likely to have
stayed in paid accommodation, while 15-24 year-olds are the most likely to
have stayed with friends or relatives. Respondents aged 55 and over are the
least likely to have stayed in paid accommodation and also with friends or
relatives.
People who left education aged 20 or over are the most likely to have
stayed in paid accommodation (58%) and also to have stayed with friends
or relatives (50%). Those who left school aged 15 or under are the least
likely to have stayed in paid accommodation (41%) and also to have stayed
with friends or relatives (34%).
Self-employed respondents (62%) and employees (60%) are more likely to
have stayed in paid accommodation than manual workers (51%) and those
who are not working (48%).
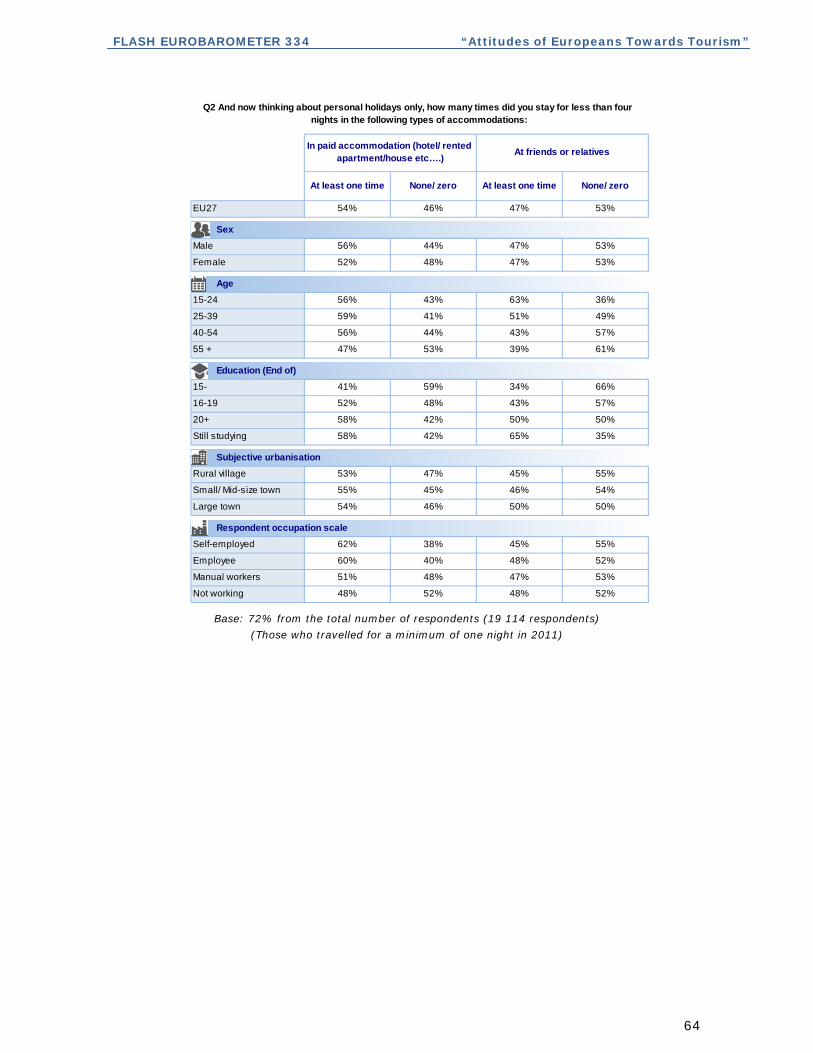
FLASH EUROBAROMETER 334 “Attitudes of Europeans Towards Tourism”
64
At least one time None/ zero At least one time None/ zero
EU27 54% 46% 47% 53%
Male 56% 44% 47% 53%
Female 52% 48% 47% 53%
15-24 56% 43% 63% 36%
25-39 59% 41% 51% 49%
40-54 56% 44% 43% 57%
55 + 47% 53% 39% 61%
15- 41% 59% 34% 66%
16-19 52% 48% 43% 57%
20+ 58% 42% 50% 50%
Still studying 58% 42% 65% 35%
Rural village 53% 47% 45% 55%
Small/ Mid-size town 55% 45% 46% 54%
Large town 54% 46% 50% 50%
Self-employed 62% 38% 45% 55%
Employee 60% 40% 48% 52%
Manual workers 51% 48% 47% 53%
Not working 48% 52% 48% 52%
Respondent occupation scale
In paid accommodation (hotel/ rented apartment/house etc….)
At friends or relatives
Sex
Age
Education (End of)
Subjective urbanisation
Q2 And now thinking about personal holidays only, how many times did you stay for less than four nights in the following types of accommodations:
Base: 72% from the total number of respondents (19 114 respondents)
(Those who travelled for a minimum of one night in 2011)

FLASH EUROBAROMETER 334 “Attitudes of Europeans Towards Tourism”
65
3.3 Personal holidays of minimum 4 nights taken in 2011
- A majority of respondents who spent at least one night away in 2011 stayed
in paid accommodation for at least four nights –
A majority (60%) of respondents said that they had spent at least four nights in paid
accommodation, such as a hotel or rented apartment, while just over one third (34%)
said that they stayed with friends or relatives for four nights or more. Just under a fifth
(19%) of respondents said they stayed in their own property or second home for a
minimum of four nights, while just over one in 10 said they stayed in another type of
location (11%) or on a camping site (11%).
On the question of how many times people stayed in paid accommodation, 29% said
they did so once in 2011, 14% did so twice, 7% did so three times, 4% did so four
times, and 6% did so five times or more.
Among the 34% of respondents who said they stayed with friends or relatives for four
or more nights, 13% did so once, 7% did so twice, 4% did so three times, 2% did so
four times, and 8% did so five times or more.
Among the 19% of respondents who said they stayed in their own property or second
home, 6% did this once, 4% did so twice, 2% did so three times, 1% did so four
times, and 6% did so five times or more.
Out of the 11% who stayed in another location, 5% said they did this only once, while
7% of the 11% who stayed on a camping site did this just once.
Base: 72% from the total number of respondents (19 114 respondents)
(Those who travelled for a minimum of one night in 2011)

FLASH EUROBAROMETER 334 “Attitudes of Europeans Towards Tourism”
66
When comparing the responses of people living in the EU15 countries and the NMS12
countries, we find that EU15 respondents who spent at least one night away during
2011 are more likely to have spent four or more nights in paid accommodation than
those in the NMS12, by a margin of 62% to 49%.
In 22 of the 34 countries included in this wave of the survey a majority of respondents
who spent at least one night away on holiday in 2011 spent a minimum of four nights
in paid accommodation. In three countries at least seven out of 10 people did so:
the Netherlands (73%), Slovenia (71%) and Denmark (70%). It is interesting to note
that these are not the countries in which staying in paid accommodation for less than
four nights was particularly common. Staying in paid accommodation for four or more
nights was least common in Estonia (36%), Lithuania (37%) and Serbia (39%).
Base: 72% from the total number of respondents (19 114 respondents)
(Those who travelled for a minimum of one night in 2011)

FLASH EUROBAROMETER 334 “Attitudes of Europeans Towards Tourism”
67
France (55%) is the only country in which a majority of respondents who spent at least
one night away in 2011 spent four or more nights staying with friends or relatives,
although a relatively high proportion of people also did so in Poland (47%), Croatia
(46%) and Turkey (46%). France was not, however, one of the countries where
staying with friends or relatives for less than four nights was especially common. In
another 16 countries at least a third of respondents gave this answer, although
relatively few people stayed with friends or relatives for a minimum of four nights in
Malta (19%), Austria (21%), Denmark (22%) and Israel (22%).
Base: 72% from the total number of respondents (19 114 respondents)
(Those who travelled for a minimum of one night in 2011)

FLASH EUROBAROMETER 334 “Attitudes of Europeans Towards Tourism”
68
In eight countries at least three out of 10 respondents who spent at least one night
away in 2011 said that they had stayed in their own property or second home for
four more nights. This was most popular amongst people in Norway (46%), followed
by those in Greece (38%) and Slovakia (38%). However, relatively few respondents
stayed in a second home for at least four nights in Malta (6%), Hungary (8%) and
Israel (8%).
Relatively few people in most countries spent four or more nights on holiday in
another type of accommodation, though at least 10% did so in 17 countries. Other
types of accommodation were most commonly used in Norway (16%), the Czech
Republic (15%), and Slovakia (15%). Similarly, at least a tenth of respondents who
spent at least one night away in 2011 said that they spent a minimum of our nights on
a campsite in 11 countries. In the Netherlands, a relatively high 28% of respondents
said that they had done this, as did 16% in both France and Slovenia 16%.
The socio-demographic data show that:
Men are again slightly more likely than women to have stayed in paid
accommodation, by a margin of 61% to 58%.
Respondents aged 40-54 (62%) are the most likely to have stayed in paid
accommodation for at least four nights (whereas 25-39 year-olds were the most
likely to have stayed in paid accommodation for less than four nights). People in
the 15-24 age group (47%) are the most likely to have spent four or more
night with friends or relatives.
Respondents who spent more time in education are again more likely to have
spent at least four nights in paid accommodation and also with friends and
relatives.
Employees (65%) and self-employed respondents (62%) are more likely to
have stayed in paid accommodation than manual workers (52%) and people
who are not working (56%). However, people who are not working (39%) are
the most likely to have stayed with friends or relatives for at least four nights.
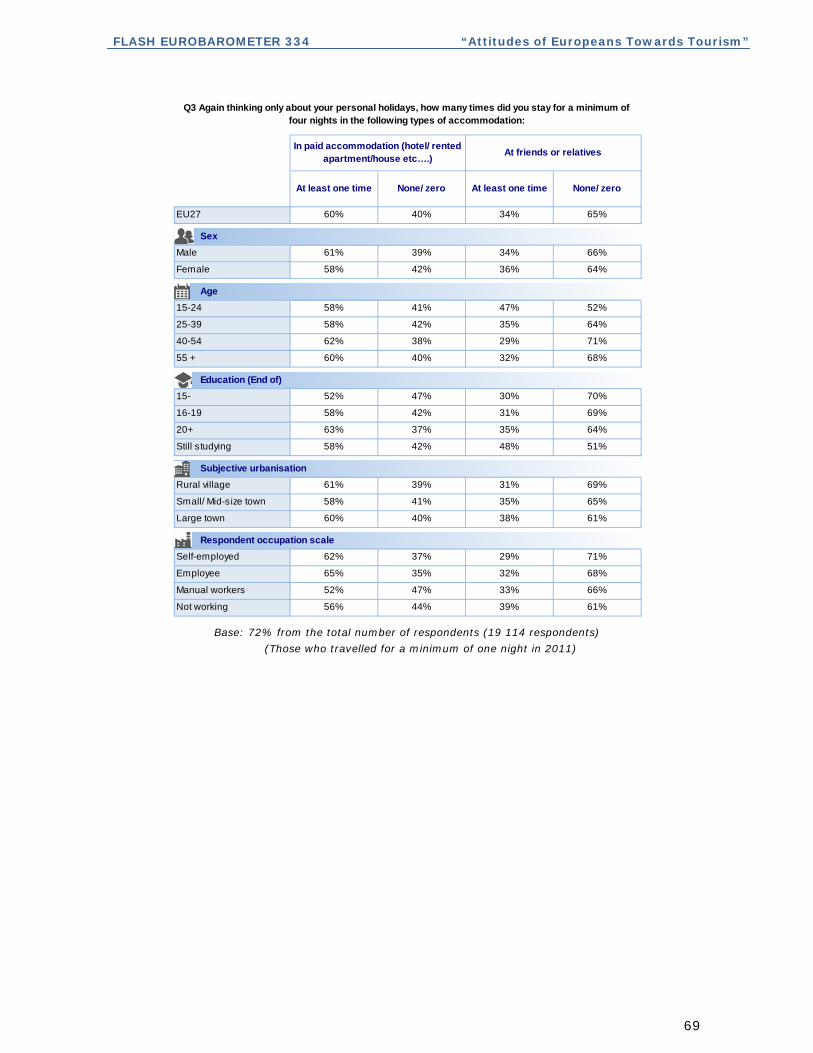
FLASH EUROBAROMETER 334 “Attitudes of Europeans Towards Tourism”
69
At least one time None/ zero At least one time None/ zero
EU27 60% 40% 34% 65%
Male 61% 39% 34% 66%
Female 58% 42% 36% 64%
15-24 58% 41% 47% 52%
25-39 58% 42% 35% 64%
40-54 62% 38% 29% 71%
55 + 60% 40% 32% 68%
15- 52% 47% 30% 70%
16-19 58% 42% 31% 69%
20+ 63% 37% 35% 64%
Still studying 58% 42% 48% 51%
Rural village 61% 39% 31% 69%
Small/ Mid-size town 58% 41% 35% 65%
Large town 60% 40% 38% 61%
Self-employed 62% 37% 29% 71%
Employee 65% 35% 32% 68%
Manual workers 52% 47% 33% 66%
Not working 56% 44% 39% 61%
Subjective urbanisation
Respondent occupation scale
In paid accommodation (hotel/ rented apartment/house etc….)
At friends or relatives
Q3 Again thinking only about your personal holidays, how many times did you stay for a minimum of four nights in the following types of accommodation:
Sex
Age
Education (End of)
Base: 72% from the total number of respondents (19 114 respondents)
(Those who travelled for a minimum of one night in 2011)

FLASH EUROBAROMETER 334 “Attitudes of Europeans Towards Tourism”
70
4. HOLIDAY DISABLING FACTORS IN 2011 AND 2012
This chapter explores the reasons why some people chose not to go on holiday in 2011
and why some are not planning to do so in 2012. Respondents who said previously
that they had not travelled in 2011 were asked to give their main reason for not taking
a trip, such as for financial reasons. All respondents were then asked whether the
current economic situation had had an impact on their holiday plans for 2012.
4.1 Reasons for not going on holidays in 2011
- Nearly half of the people who did not go on holiday in 2011 chose not to
do so for financial reasons –
Over four out of 10 (45%) respondents said that they did not go on holiday for
financial reasons, which is slightly more than the 43% who said this in the February
2011 survey. Just under a quarter (23%) of respondents said that they chose not to go
away for personal or private reasons, down slightly on the 25% of people who said this
in the previous wave. Roughly one respondent in 10 (11%) said that they preferred to
stay at home with family or friends (+1 point compared with the previous survey) and
that they did not go due to lack of time (9%, no change since last year).
Just 1% of respondents said they did not go on holiday because of problems of
accessibility of transport or accommodations (+1 point), while virtually no respondents
said they stayed at home on account of safety concerns (-1 point). A small minority
(4%) also said spontaneously that they did not want to go on holiday in 2011 (+1
point), with 6% citing some other reason (-3 points). So while there have been some
small changes in the number of people giving certain responses since the last survey,
the ranking of responses has remained the same, with financial reasons and then
personal/private reasons most commonly cited in both this wave and in the previous
wave.

FLASH EUROBAROMETER 334 “Attitudes of Europeans Towards Tourism”
71
Base: 28% from the total number of respondents (7 342 respondents)
(Those who didn’t travelled in 2011)
In 12 countries a majority of respondents who did not go on holiday in 2011 said
that they did not do so for financial reasons. People most commonly offered this
explanation in Bulgaria (71%), Greece (70%), Hungary (66%), Ireland (62%) and
Romania (62%). Relatively few people did not go on holiday for financial reasons in
Austria (15%), Denmark (17%) and Finland (20%).
While the proportion of respondents citing financial reasons rose slightly at EU level
(+2 points), it rose considerably in some individual countries, notably Ireland
(62%, +18 points), Greece (70%, +14 points), Belgium (30%, +14 points) and
Italy (46%, +10 points). However, the proportion of people not travelling for
financial reasons also fell in some countries, with the biggest falls occurring in
Austria (15%, -10 points), Denmark (17%, -10 points), Estonia (36%, -8 points)
and Finland (20%, -8 points).

FLASH EUROBAROMETER 334 “Attitudes of Europeans Towards Tourism”
72
Base: 28% from the total number of respondents (7 342 respondents)
(Those who didn’t travelled in 2011)
In seven countries at least three out of 10 people who did not take a holiday in
2011 said they stayed at home for personal or private reasons. This explanation
was most commonly given by respondents in Serbia (40%), followed by those in
Austria (37%) and Germany (37%). But elsewhere, as in Portugal (10%) and
Iceland (11%), relatively few respondents cited personal or private reasons.

FLASH EUROBAROMETER 334 “Attitudes of Europeans Towards Tourism”
73
At EU level the proportion of respondents who said that personal or private issues
prevented them from travelling fell slightly (-2 points). However, it rose
substantially in some individual countries, most obviously in Norway (25%, +18
points), Slovenia (34%, +11 points) and Lithuania (25%, +10 points). The
proportion of people offering this explanation for their failure to travel in 2011 fell
the most in Luxembourg (25%, -20 points), Iceland (11%, -10 points) and Italy
(29%, -9 points).
Base: 28% from the total number of respondents (7 342 respondents)
(Those who didn’t travelled in 2011)

FLASH EUROBAROMETER 334 “Attitudes of Europeans Towards Tourism”
74
While the proportion of respondents who said that they did not go on holiday
because they preferred to stay at home with friends or family was generally
quite low, at least 10% of respondents gave this answer in 20 countries. This
reason for not travelling was most common in Finland (24%) Belgium (20%), and
Norway (20%). The proportion of people giving this response also increased the
most in Finland (+10 points) and Norway (+10 points).
In 14 countries at least a tenth of respondents said that they did not go on holiday
in 2011 owing to a lack of time.
This explanation was most common in Turkey (19%), the Czech Republic (17%)
and Germany (17%). The proportion of respondents blaming a lack of time also
rose the most in the Czech Republic (+9 points) and Germany (+8 points).
Relatively high numbers of people said spontaneously that they did not want to
go on holiday in 2011 in Malta (12%), Sweden (12%), Finland (11%) and the
Netherlands (10%). Other explanations were given most frequently in Iceland
(16%) and Lithuania (15%).
According to the socio-demographic data:
Respondents in the 25-39 and 40-54 age groups (52% and 55%
respectively) were more likely to say they did not go away for financial
reasons than people in the 15-24 or 55+ age groups (39% and 37%
respectively. People in the 55+ group were the most likely to say that they
chose not to go for personal or private reasons (30%).
While 48% of people who left school aged 19 or under cited financial
reasons, only 39% of respondents who left education aged 20 or over gave
this reason for not going away.
A majority (56%) of manual workers said they did not take a holiday for
financial reasons, compared with 44% of employees and people who are not
working, and 36% of self-employed people. Respondents who are not
working (26%) were the most likely to say that they did not go away for
personal or private reasons.

FLASH EUROBAROMETER 334 “Attitudes of Europeans Towards Tourism”
75
Financial reasons
Personal/private reasons
EU27 45% 23%
Male 42% 21%
Female 47% 25%
15-24 39% 17%
25-39 52% 16%
40-54 55% 20%
55 + 37% 30%
15- 48% 24%
16-19 48% 21%
20+ 39% 26%
Still studying 30% 15%
Rural village 44% 22%
Small/ Mid-size town 46% 22%
Large town 45% 26%
Self-employed 36% 18%
Employee 44% 22%
Manual workers 56% 12%
Not working 44% 26%
Respondent occupation scale
Q4 What was the main reason why you did not go on holiday in 2011?
Sex
Age
Education (End of)
Subjective urbanisation
Base: 28% from the total number of respondents (7 342 respondents)
(Those who didn’t travelled in 2011)
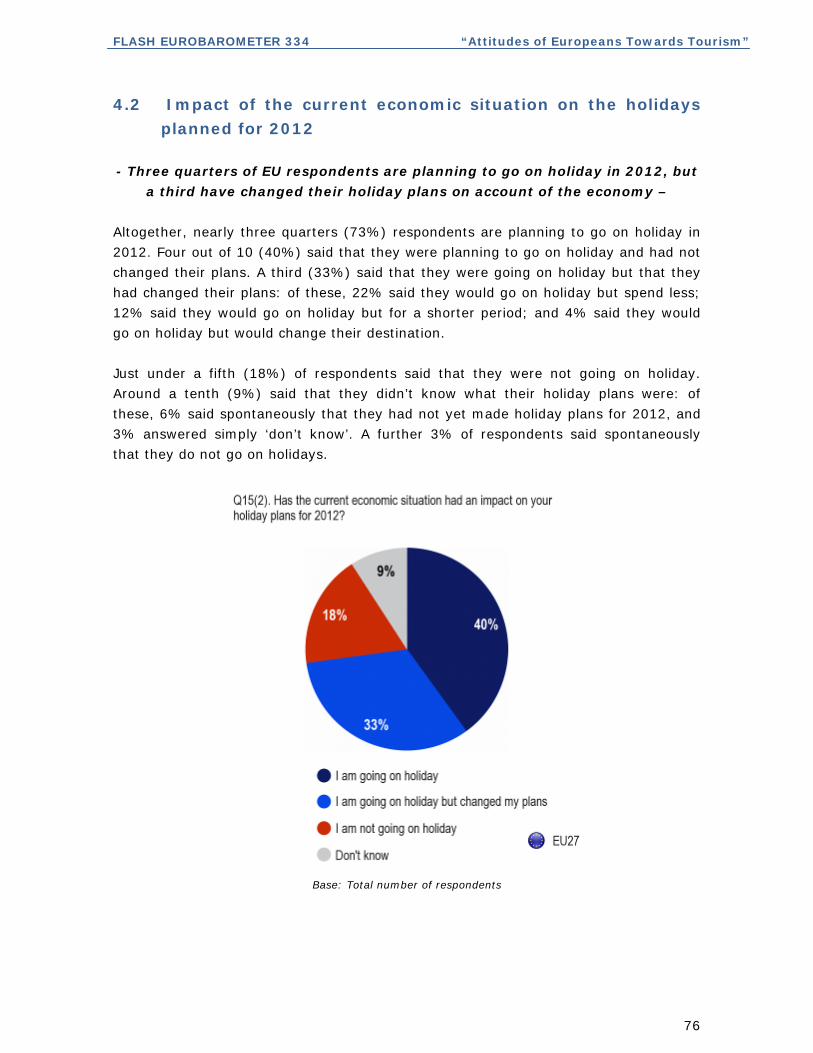
FLASH EUROBAROMETER 334 “Attitudes of Europeans Towards Tourism”
76
4.2 Impact of the current economic situation on the holidays
planned for 2012
- Three quarters of EU respondents are planning to go on holiday in 2012, but
a third have changed their holiday plans on account of the economy –
Altogether, nearly three quarters (73%) respondents are planning to go on holiday in
2012. Four out of 10 (40%) said that they were planning to go on holiday and had not
changed their plans. A third (33%) said that they were going on holiday but that they
had changed their plans: of these, 22% said they would go on holiday but spend less;
12% said they would go on holiday but for a shorter period; and 4% said they would
go on holiday but would change their destination.
Just under a fifth (18%) of respondents said that they were not going on holiday.
Around a tenth (9%) said that they didn’t know what their holiday plans were: of
these, 6% said spontaneously that they had not yet made holiday plans for 2012, and
3% answered simply ‘don’t know’. A further 3% of respondents said spontaneously
that they do not go on holidays.
Base: Total number of respondents

FLASH EUROBAROMETER 334 “Attitudes of Europeans Towards Tourism”
77
There is a notable difference between the responses of EU15 citizens and their NMS12
counterparts on this question. While 42% of EU15 respondents said that they were
going on holiday in 2012 and had not changed their plans, only 32% of people in the
NMS12 gave this response. ( do not use acronyms, please)
In almost all surveyed countries a majority of respondents said that they were
planning to go on holiday in 2012. In 10 countries at least 80% of respondents plan to
go on holiday, with the highest proportions of people saying this occurring in Denmark
(89%), Finland (89%), Germany (87%), Norway (87%) and Austria (86%). The three
countries where less than half of respondents said they were planning a holiday are
Turkey (43%), Malta (45%) and Serbia (45%).
In five countries, at least three out of 10 people said that they were not planning to go
on holiday in 2012: Turkey (45%), Portugal (40%), Greece (35%), Serbia (34%) and
Bulgaria (30%). Relatively high numbers of people said they did not know about their
2012 holiday plans in Malta (28%), Israel (24%), Estonia (23%), Serbia (21%) and
Macedonia (20%).
In 24 countries at least 30% of respondents say that they intend to go on holiday but
that they have changed their plans in light of the economic situation. In Ireland, a
majority (56%) of respondents give this answer (vs. 28% whose holiday plans are
unchanged), followed by 49% in Croatia (where 23% say they holiday plans are
unchanged), and 48% in Greece (where only 6% say their holiday plans remain
unchanged).
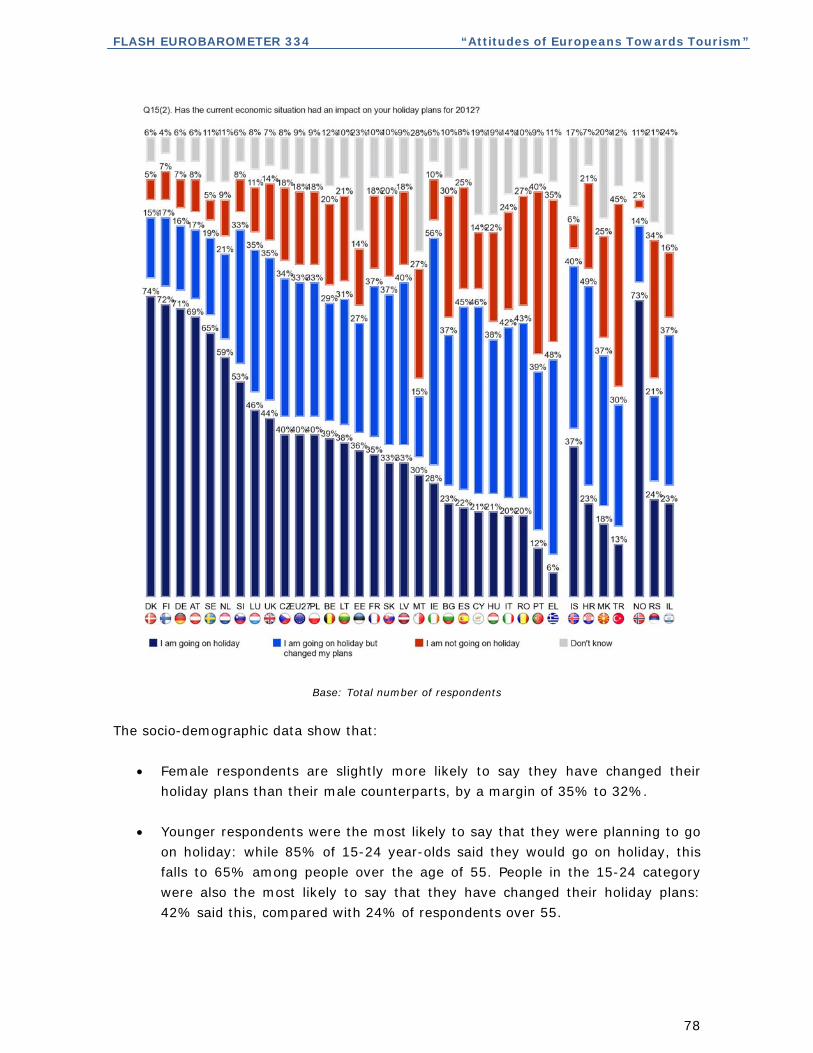
FLASH EUROBAROMETER 334 “Attitudes of Europeans Towards Tourism”
78
Base: Total number of respondents
The socio-demographic data show that:
Female respondents are slightly more likely to say they have changed their
holiday plans than their male counterparts, by a margin of 35% to 32%.
Younger respondents were the most likely to say that they were planning to go
on holiday: while 85% of 15-24 year-olds said they would go on holiday, this
falls to 65% among people over the age of 55. People in the 15-24 category
were also the most likely to say that they have changed their holiday plans:
42% said this, compared with 24% of respondents over 55.
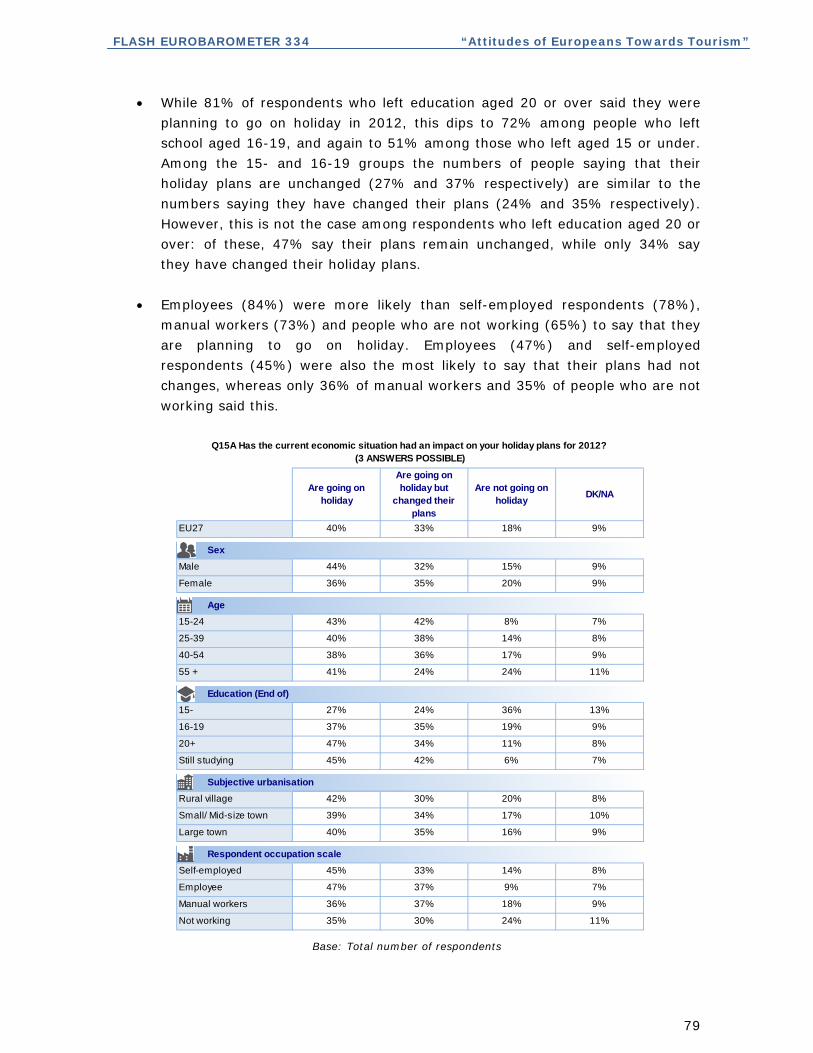
FLASH EUROBAROMETER 334 “Attitudes of Europeans Towards Tourism”
79
While 81% of respondents who left education aged 20 or over said they were
planning to go on holiday in 2012, this dips to 72% among people who left
school aged 16-19, and again to 51% among those who left aged 15 or under.
Among the 15- and 16-19 groups the numbers of people saying that their
holiday plans are unchanged (27% and 37% respectively) are similar to the
numbers saying they have changed their plans (24% and 35% respectively).
However, this is not the case among respondents who left education aged 20 or
over: of these, 47% say their plans remain unchanged, while only 34% say
they have changed their holiday plans.
Employees (84%) were more likely than self-employed respondents (78%),
manual workers (73%) and people who are not working (65%) to say that they
are planning to go on holiday. Employees (47%) and self-employed
respondents (45%) were also the most likely to say that their plans had not
changes, whereas only 36% of manual workers and 35% of people who are not
working said this.
Are going on holiday
Are going on holiday but
changed their plans
Are not going on holiday
DK/NA
EU27 40% 33% 18% 9%
Male 44% 32% 15% 9%
Female 36% 35% 20% 9%
15-24 43% 42% 8% 7%
25-39 40% 38% 14% 8%
40-54 38% 36% 17% 9%
55 + 41% 24% 24% 11%
15- 27% 24% 36% 13%
16-19 37% 35% 19% 9%
20+ 47% 34% 11% 8%
Still studying 45% 42% 6% 7%
Rural village 42% 30% 20% 8%
Small/ Mid-size town 39% 34% 17% 10%
Large town 40% 35% 16% 9%
Self-employed 45% 33% 14% 8%
Employee 47% 37% 9% 7%
Manual workers 36% 37% 18% 9%
Not working 35% 30% 24% 11%
Respondent occupation scale
Q15A Has the current economic situation had an impact on your holiday plans for 2012? (3 ANSWERS POSSIBLE)
Sex
Age
Education (End of)
Subjective urbanisation
Base: Total number of respondents

FLASH EUROBAROMETER 334 “Attitudes of Europeans Towards Tourism”
80
5. HOLIDAYS PLANNED FOR 2012
The final chapter of the report analyses the holiday plans that respondents have made
for 2012. First, respondents were asked how long they were planning to go away on
holiday for this year, if indeed they were planning to go away at all. And secondly,
respondents were asked where they were intending to travel to for their upcoming
holiday.
5.1 Duration of holidays planned in 2012
- Four out of 10 respondents expect to take a holiday lasting between four
and 13 consecutive nights in 2012 –
Four out of 10 (41%) respondents said that they planned to take a holiday lasting
between four and 13 consecutive nights, while just over a quarter (27%) said that they
intended to make a short-stay trip of up to three nights. Around a fifth (19%) said that
they planned to take a holiday lasting more than 13 consecutive nights. In addition,
15% of respondents said spontaneously that they were not planning to take any trips,
with 12% saying spontaneously that they had not yet made any decisions.
Base: Total number of respondents

FLASH EUROBAROMETER 334 “Attitudes of Europeans Towards Tourism”
81
In all but six of the 34 countries included in the survey the most popular answer to this
question was ‘a holiday of between four and 13 consecutive nights’. In six countries a
majority of respondents gave this answer: Norway (55%), Slovenia (55%), the UK
(55%), Denmark (53%), Ireland (52%) and the Czech Republic (50%). Relatively few
people said they were planning a holiday of this duration in Greece (23%), Turkey
(23%), Hungary (24%), Latvia (24%) and Serbia (24%).
In the six countries where ‘a holiday of between four and 13 consecutive nights’ was
not the most popular response, ‘a short-stay trip of up to three nights’ was the answer
most commonly given. They are: Latvia (42%), Turkey (36%), Lithuania (35%), Israel
(29%), Greece (28%) and Portugal (28%). However, an even higher proportion of
people said they were planning a short-stay trip in Finland (44%) and the UK (43%).
Relatively few respondents said they were planning to take this kind of holiday in
Serbia (5%), Malta (11%) and Macedonia (15%).
Over a quarter of respondents said they were planning to take a holiday lasting more
than 13 consecutive nights in five countries: the Netherlands (39%), Norway (35%),
Luxembourg (29%), France (26%) and the UK (26%). But relatively few respondents
said they expected to take this kind of holiday in Hungary (4%), Bulgaria (5%) and
Malta (7%).

FLASH EUROBAROMETER 334 “Attitudes of Europeans Towards Tourism”
82
Holidays between 4 and 13 consecutive nights
Short-stay trip (up to 3 nights)
Holidays with more than 13 consecutive nights
EU27 41% 27% 19%
BE 43% 26% 18%
BG 34% 31% 5%
CZ 50% 26% 12%
DK 53% 22% 20%
DE 46% 25% 23%
EE 29% 24% 11%
IE 52% 33% 23%
EL 23% 28% 10%
ES 32% 28% 15%
FR 38% 17% 26%
IT 34% 16% 13%
CY 39% 16% 11%
LV 24% 42% 10%
LT 32% 35% 9%
LU 40% 16% 29%
HU 24% 33% 4%
MT 32% 11% 7%
NL 48% 30% 39%
AT 45% 28% 19%
PL 40% 32% 14%
PT 27% 28% 11%
RO 33% 31% 9%
SI 55% 22% 17%
SK 45% 21% 10%
FI 48% 44% 18%
SE 49% 30% 24%
UK 55% 43% 26%
HR 39% 29% 15%
TR 23% 36% 11%
MK 37% 15% 13%
IS 36% 19% 15%
NO 55% 31% 35%
RS 24% 5% 8%
IL 29% 29% 14%
Q13 In 2012, which of the following type of holidays do you plan to take?
Highest percentage per countryHighest percentage per item
Lowest percentage per countryLowest percentage per item
Base: Total number of respondents

FLASH EUROBAROMETER 334 “Attitudes of Europeans Towards Tourism”
83
According to the socio-demographic data:
Respondents aged 15-39 (46%) are more likely than those aged 55 or over
(33%) to be planning a trip lasting between four and 13 nights. Those aged 15-
39 (33-34%) are also more likely to be planning a short –stay trip than those
aged 55 or over (20%).
Individuals who finished their education aged 20 or over are more likely than
those who left school at a younger age to be planning short-stay trips (47%),
holidays of between four and 13 nights (20%) and holidays lasting more than
13 nights (22%).
Employees (50%) are more likely than self-employed respondents (44%),
manual workers (40%) and people who are not working (34%) to be planning a
trip lasting between four and 13 nights.
Holidays between 4 and 13 consecutive
nights
Short-stay trip (up to 3 nights)
Holidays with more than 13 consecutive nights
EU27 41% 27% 19%
Male 42% 28% 20%
Female 39% 27% 18%
15-24 46% 33% 19%
25-39 46% 34% 16%
40-54 43% 28% 20%
55 + 33% 20% 20%
15- 26% 16% 13%
16-19 39% 28% 18%
20+ 47% 30% 22%
Still studying 50% 31% 20%
Rural village 40% 27% 16%
Small/ Mid-size town 40% 27% 19%
Large town 43% 29% 21%
Self-employed 44% 32% 21%
Employee 50% 31% 21%
Manual workers 40% 30% 15%
Not working 34% 24% 17%
Respondent occupation scale
Q13 In 2012, which of the following type of holidays do you plan to take? (MULTIPLE ANSWER POSSIBLE)
Sex
Age
Education (End of)
Subjective urbanisation
Base: Total number of respondents

FLASH EUROBAROMETER 334 “Attitudes of Europeans Towards Tourism”
84
5.2 Destinations chosen for 2012
- Over half of respondents who were planning to take a holiday in 2012
intended to go somewhere in their own country –
A majority (52%) of respondents said that they planned to spend their holidays in their
own country, while 37% said that they intended to go on holiday in the EU. Just under
a quarter (23%) of respondents said that they planned to go on holiday in another
country outside the EU, while 7% said they didn’t know where they were going to
spend their holiday. (Compare to last year or previous years….)
Base: 71% from the total number of respondents (18 800 respondents)
(Those who want to take holidays in 2012)
When asking the question (OUR COUNTRY) is replaced by the name of the country the interview is
conducted
In terms of the specific countries in which respondents said they were planning to
spend their holidays, the most popular intended destinations were Spain (10%), Italy
(7%), France (6%), Greece (4%), Austria (3%), Germany (3%) and the UK (3%).
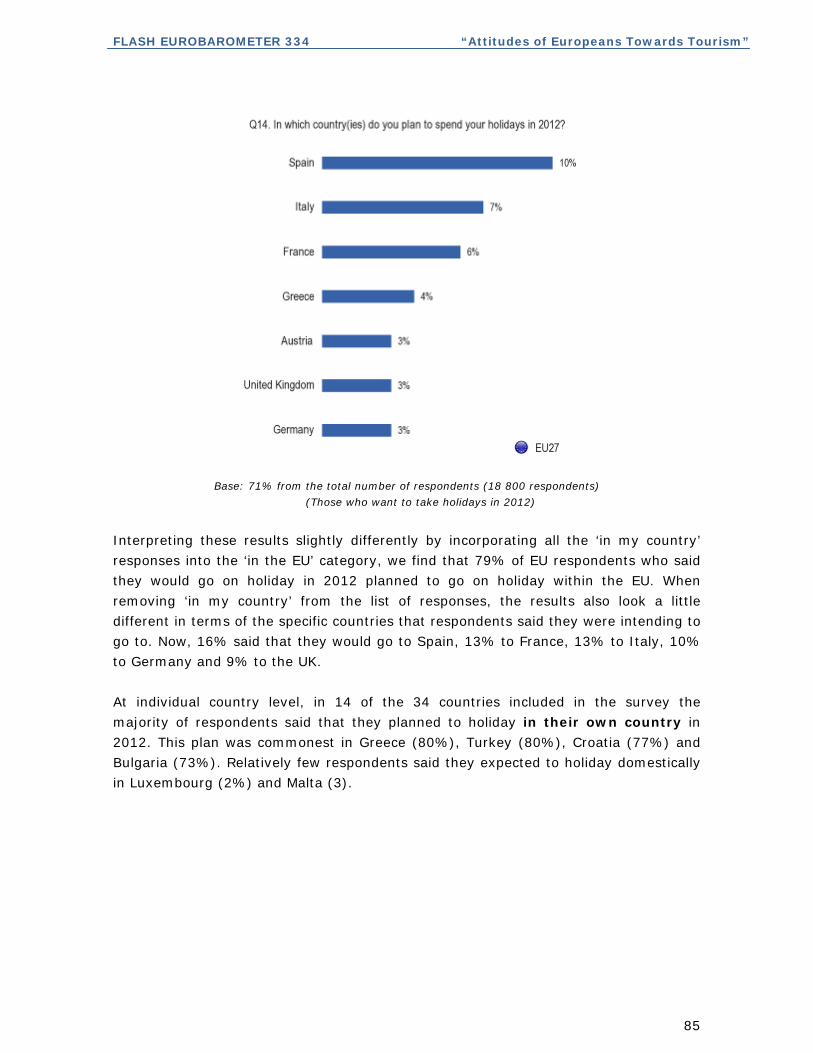
FLASH EUROBAROMETER 334 “Attitudes of Europeans Towards Tourism”
85
Base: 71% from the total number of respondents (18 800 respondents)
(Those who want to take holidays in 2012)
Interpreting these results slightly differently by incorporating all the ‘in my country’
responses into the ‘in the EU’ category, we find that 79% of EU respondents who said
they would go on holiday in 2012 planned to go on holiday within the EU. When
removing ‘in my country’ from the list of responses, the results also look a little
different in terms of the specific countries that respondents said they were intending to
go to. Now, 16% said that they would go to Spain, 13% to France, 13% to Italy, 10%
to Germany and 9% to the UK.
At individual country level, in 14 of the 34 countries included in the survey the
majority of respondents said that they planned to holiday in their own country in
2012. This plan was commonest in Greece (80%), Turkey (80%), Croatia (77%) and
Bulgaria (73%). Relatively few respondents said they expected to holiday domestically
in Luxembourg (2%) and Malta (3).
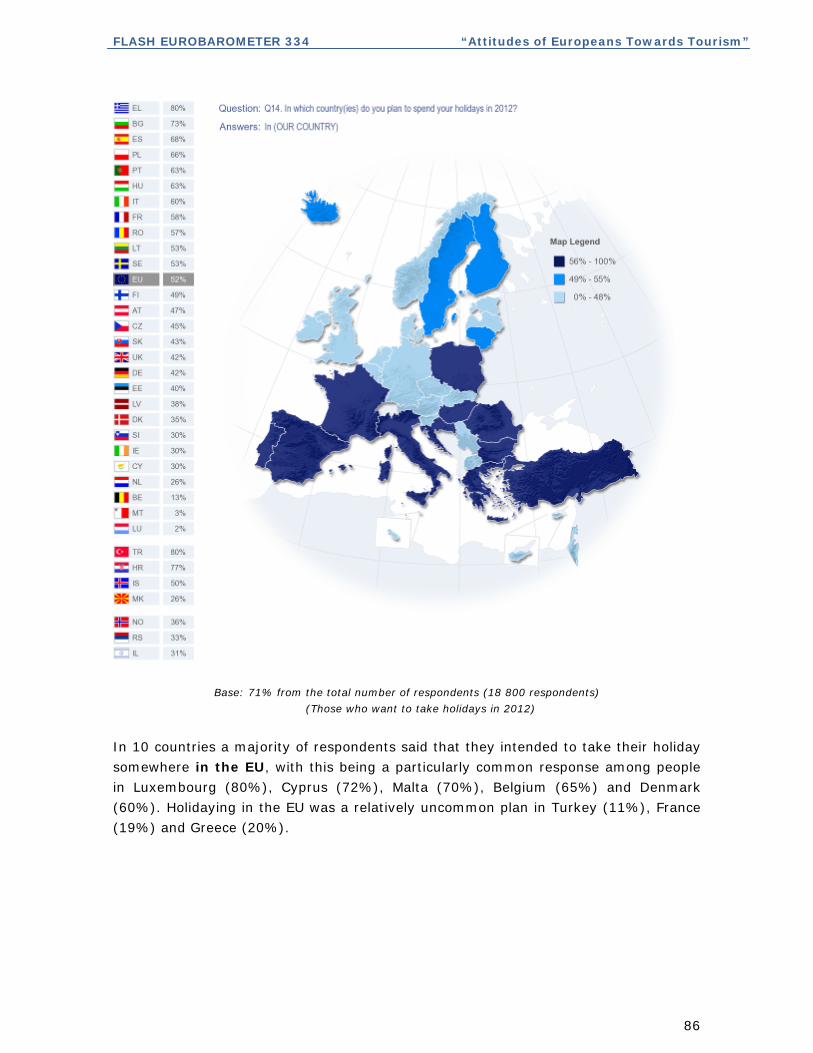
FLASH EUROBAROMETER 334 “Attitudes of Europeans Towards Tourism”
86
Base: 71% from the total number of respondents (18 800 respondents)
(Those who want to take holidays in 2012)
In 10 countries a majority of respondents said that they intended to take their holiday
somewhere in the EU, with this being a particularly common response among people
in Luxembourg (80%), Cyprus (72%), Malta (70%), Belgium (65%) and Denmark
(60%). Holidaying in the EU was a relatively uncommon plan in Turkey (11%), France
(19%) and Greece (20%).
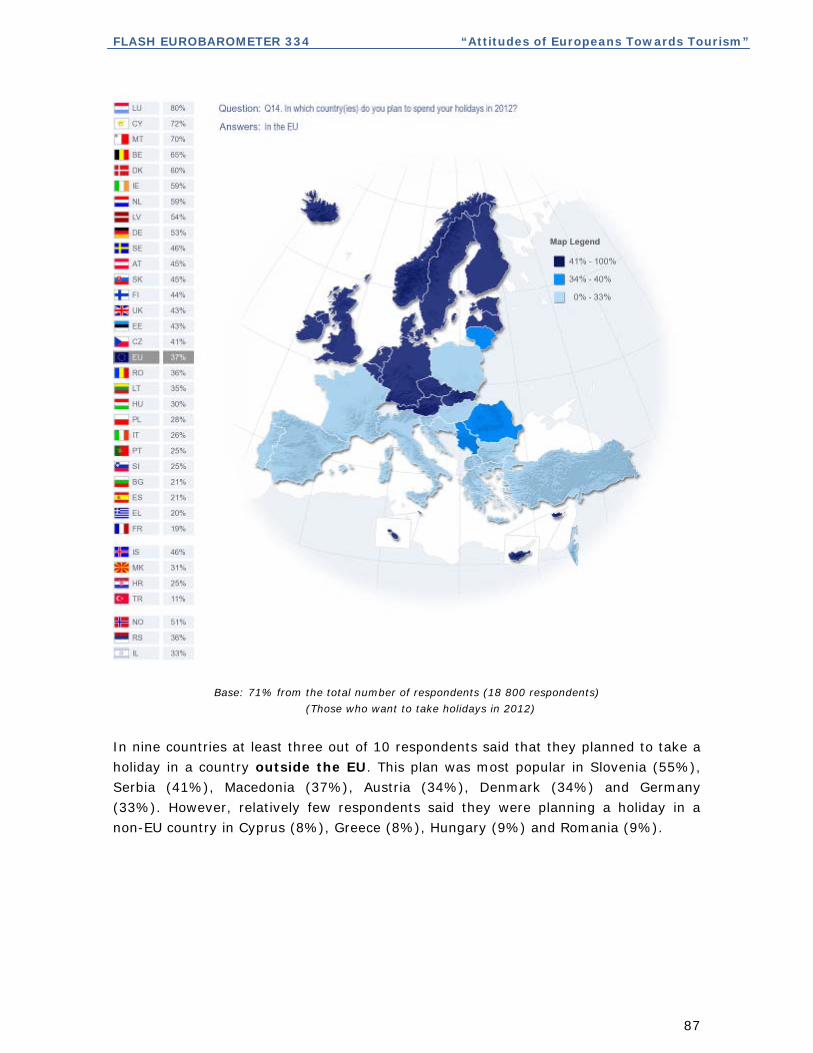
FLASH EUROBAROMETER 334 “Attitudes of Europeans Towards Tourism”
87
Base: 71% from the total number of respondents (18 800 respondents)
(Those who want to take holidays in 2012)
In nine countries at least three out of 10 respondents said that they planned to take a
holiday in a country outside the EU. This plan was most popular in Slovenia (55%),
Serbia (41%), Macedonia (37%), Austria (34%), Denmark (34%) and Germany
(33%). However, relatively few respondents said they were planning a holiday in a
non-EU country in Cyprus (8%), Greece (8%), Hungary (9%) and Romania (9%).

FLASH EUROBAROMETER 334 “Attitudes of Europeans Towards Tourism”
88
Base: 71% from the total number of respondents (18 800 respondents)
(Those who want to take holidays in 2012)

FLASH EUROBAROMETER 334 “Attitudes of Europeans Towards Tourism”
89
Destinations chosen for 2012
FLASH EUROBAROMETER 334 “Attitudes of Europeans Towards Tourism”
90
In terms of the specific countries that people said they were intending to travel to,
Spain was the most popular planned destination for the respondents in Ireland (26%),
Norway (18%) and the UK (18%).
Italy was most chosen by the respondents in Malta (30%) and Austria (21%), while
France by respondents in Belgium (35%), Luxembourg (22%) and the Netherlands
(18%).
Greece was planned as destination for the 2012 holidays mostly by respondents in
Cyprus (36%) and Republic of Serbia (19%).
Austria was the most popular destination among respondents in Hungary (6%) and
Croatia (5%), although a higher proportion of people in Germany (10%) and the
Netherlands (8%) said that they were planning a holiday there.
Relatively high number of respondents in the Netherlands (12%) and Luxembourg
(10%) said they were planning to holiday in Germany, while the UK was a
particularly popular option among respondents in Malta (27%), Ireland (14%), Cyprus
(12%) and Latvia (10%).
Considering the individual country results when the ‘in my country’ responses are
folded into the ‘in the EU’ category, we find that a majority of respondents in all 27 EU
countries, and also Norway, said that they would holiday in the EU. This response was
most prevalent in Greece (95%), Bulgaria (89%) and Cyprus (89%). Unsurprisingly,
holidaying in the EU was a less popular option among non-EU countries, and in
particular in Turkey (11%), Croatia (25%) and Macedonia (31%).
Cross-referencing the results of this question with the earlier question which asked
respondents who went away for at least four nights in 2011 where they went on
holiday, we find that 69% of people who said they holidayed in their own country in
2011 planned to do the same in 2012. However, 30% of people who holidayed in their
own country last year planned to go to an EU country for their holiday in 2012, while
17% of people in this group intended to go to another country outside the EU.
Among respondents who said they spent at least four nights on holiday in another EU
country in 2011, 61% said they planned to do the same again in 2012. Just 30% said
they would holiday in their own country, with the same number saying they would
travel to a country outside the EU for their holiday this year.
A majority (54%) of respondents who said they holidayed in a country outside the EU
in 2011 said they would do the same thing again in 2012. However, over four out of 10
(42%) of the people in this group said that they would go on holiday in the EU, while a
quarter (26%) said that they would holiday in their own county.

FLASH EUROBAROMETER 334 “Attitudes of Europeans Towards Tourism”
91
When the ‘in my country’ responses are folded into the ‘in the EU’ category, we find
that 82% of respondents who said they holiday in the EU in 2011 intended to do the
same thing again in 2012.
Spain Italy France Greece Austria GermanyUnited
Kingdom
EU27 10% 7% 6% 4% 3% 3% 3%
BE 17% 9% 35% 4% 2% 6% 2%
BG 2% 3% 3% 11% 1% 1% 1%
CZ 5% 11% 4% 6% 4% 4% 3%
DK 17% 13% 10% 5% 6% 10% 7%
DE 15% 14% 6% 3% 10% 0% 2%
EE 5% 4% 3% 1% 1% 4% 2%
IE 26% 7% 11% 2% 2% 3% 14%
EL 2% 4% 3% 0% 2% 3% 2%
ES 0% 5% 5% 1% 1% 3% 4%
FR 7% 3% 0% 1% 1% 2% 2%
IT 8% 0% 6% 5% 1% 3% 2%
CY 8% 8% 7% 36% 2% 3% 12%
LV 6% 6% 5% 1% 2% 5% 10%
LT 7% 4% 2% 1% 2% 6% 6%
LU 15% 16% 22% 1% 8% 10% 3%
HU 2% 6% 2% 6% 6% 4% 2%
MT 3% 30% 8% 2% 2% 4% 27%
NL 12% 13% 18% 4% 8% 12% 4%
AT 8% 21% 4% 4% 0% 8% 2%
PL 5% 5% 2% 3% 2% 3% 4%
PT 14% 4% 7% 0% 1% 1% 1%
RO 6% 10% 4% 6% 3% 5% 2%
SI 3% 8% 4% 3% 5% 2% 1%
SK 5% 10% 3% 7% 4% 2% 1%
FI 10% 4% 5% 4% 1% 6% 2%
SE 12% 8% 7% 5% 2% 6% 4%
UK 18% 4% 10% 6% 1% 2% 0%
HR 3% 5% 2% 1% 5% 3% 2%
TR 2% 2% 3% 1% 1% 3% 1%
MK 3% 3% 1% 13% 3% 3% 0%
IS 15% 6% 4% 2% 1% 7% 9%
NO 18% 7% 7% 5% 1% 2% 6%
RS 2% 3% 1% 19% 3% 5% 0%
IL 5% 7% 7% 2% 3% 5% 3%
Q14 In which country(ies) do you plan to spend your holidays in 2012?
Highest percentage per countryHighest percentage per item
Lowest percentage per countryLowest percentage per item
Base: 71% from the total number of respondents (18 800 respondents)
(Those who want to take holidays in 2012)
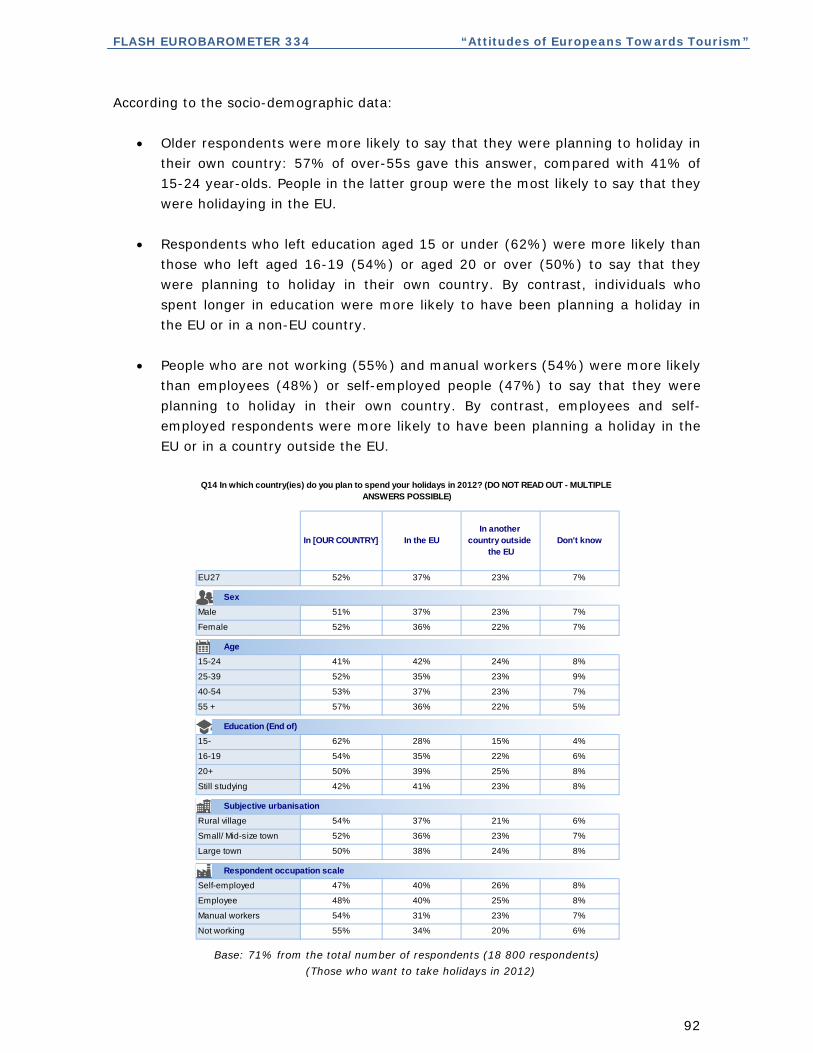
FLASH EUROBAROMETER 334 “Attitudes of Europeans Towards Tourism”
92
According to the socio-demographic data:
Older respondents were more likely to say that they were planning to holiday in
their own country: 57% of over-55s gave this answer, compared with 41% of
15-24 year-olds. People in the latter group were the most likely to say that they
were holidaying in the EU.
Respondents who left education aged 15 or under (62%) were more likely than
those who left aged 16-19 (54%) or aged 20 or over (50%) to say that they
were planning to holiday in their own country. By contrast, individuals who
spent longer in education were more likely to have been planning a holiday in
the EU or in a non-EU country.
People who are not working (55%) and manual workers (54%) were more likely
than employees (48%) or self-employed people (47%) to say that they were
planning to holiday in their own country. By contrast, employees and self-
employed respondents were more likely to have been planning a holiday in the
EU or in a country outside the EU.
In [OUR COUNTRY] In the EUIn another
country outside the EU
Don't know
EU27 52% 37% 23% 7%
Male 51% 37% 23% 7%
Female 52% 36% 22% 7%
15-24 41% 42% 24% 8%
25-39 52% 35% 23% 9%
40-54 53% 37% 23% 7%
55 + 57% 36% 22% 5%
15- 62% 28% 15% 4%
16-19 54% 35% 22% 6%
20+ 50% 39% 25% 8%
Still studying 42% 41% 23% 8%
Rural village 54% 37% 21% 6%
Small/ Mid-size town 52% 36% 23% 7%
Large town 50% 38% 24% 8%
Self-employed 47% 40% 26% 8%
Employee 48% 40% 25% 8%
Manual workers 54% 31% 23% 7%
Not working 55% 34% 20% 6%
Respondent occupation scale
Q14 In which country(ies) do you plan to spend your holidays in 2012? (DO NOT READ OUT - MULTIPLE ANSWERS POSSIBLE)
Sex
Age
Education (End of)
Subjective urbanisation
Base: 71% from the total number of respondents (18 800 respondents)
(Those who want to take holidays in 2012)
FLASH EUROBAROMETER 334 “Attitudes of Europeans Towards Tourism”
93
CONCLUSIONS
Holidays might be viewed as a luxury by some respondents; or, for respondents
experiencing pressure on their level of income or simply concerned by the future state
or the economy, a holiday could well be looked upon as something that might be
sacrificed for the time being.
With the latest wave of this Flash Eurobarometer on attitudes to tourism having been
conducted in the context of adverse economic conditions in Europe, it was therefore
important to assess the extent to which Europeans might have curtailed their travel in
2011, or might be planning to alter their plans for 2012, on account of the economic
context
It was encouraging to find that the proportion of EU citizens who went away in 2011
(72%) remained unchanged from last year’s survey, which was conducted on a smaller
sample. Moreover, confidence appears not to have been dented regarding the year
ahead, with 73% of EU respondents voicing their intention to go on holiday in 2012.
Although EU citizens are feeling the impact of the economic crisis, many people have
decided to alter their holiday plans for 2012 rather than abandon their holidays
altogether: 33% of EU respondents said that they would still go on holiday in 2012 but
they had changed their plans in order to take the economic conditions into account.
This sentiment is arguably reflected in the details of respondents’ 2012 holiday plans.
Many people are naturally inclined to repeat, to a great or lesser extent, a prior holiday
experience. However, this year’s survey suggests that more respondents who
holidayed domestically in 2011 plan to do so again in 2012 than respondents who
holidayed in another EU country; and they, in turn, appear more likely to repeat their
experience than respondents who holidayed in a country outside the EU. If holidays
outside the EU can be assumed to be the most expensive for EU citizens, and domestic
holidays can on the whole be assumed to be the cheapest, then it is reasonable to
conclude that the negative economic outlook is persuading more people to repeat
relatively cheap holidays than relatively expensive ones.
It is also unsurprising to find that the impact of the EU’s current economic problems is
not uniform across the EU. For example, in Portugal and Greece, two of the Member
States worst hit by the economic downturn, relatively high numbers of respondents –
40% and 35% respectively – said that they would not go on holiday at all in 2012.
Similarly, in some EU countries – notably Bulgaria (71%), Greece (70%) and Hungary
(66%) – a majority of people who did not go on holiday last year said that the reasons
for this were financial (compared with an EU average of 45%), whereas in other
countries money tended not to be the reason for staying at home.
FLASH EUROBAROMETER 334 “Attitudes of Europeans Towards Tourism”
94
It is clear that the appeal of holidaying in the EU remains strong. Almost nine out of 10
(89%) EU citizens who went on holiday for at least four nights in 2011 went on holiday
within the EU (including in their own country). If indeed more EU citizens favour
domestic holidays and holidays close to home as a result of the economic downturn,
the proportion of EU respondents holidaying within the EU can be expected to hold firm
in the short to medium term, if not increase. This conclusion is reinforced by the high
level of satisfaction registered by people who went on holiday in 2011, with 94%
satisfied with the natural features of their holiday destination, and 93% satisfied with
the quality of accommodation. If approximately 90% people spend their holidays in the
EU and around 90% of holidaymakers are expressing satisfaction, then it automatically
follows that the proportion of Europeans who choose to holiday within the EU will
remain high.
Another important trend highlighted by this year’s survey is the growing importance of
the internet to travel planning. In 2011, a majority (53%) of people used the internet
to arrange their holidays – far more than used travel agents, for example – while
websites were second only to personal recommendations in terms of researching
holidays and making decisions about what to book and where to go. Probably as a
direct consequence of this online shift and the way in which it is empowering individual
consumers, we also now find that half (49%) of those who went on holiday in 2011
organised the various elements of their trip separately, rather than booking them
altogether in one package.
The shift online may also be related to fact that most Europeans continue to go on
holiday in spite of the economic conditions. The ability to research and find good deals
online no doubt gives individuals more confidence that if they do decide to go on
holiday, they will be able to find the right transport and accommodation options to fit
their budget.

ANNEXES

TECHNICAL SPECIFICATIONS
FLASH EUROBAROMETER 334 “Attitudes of Europeans Towards Tourism”
FLASH EUROBAROMETER 334
“Attitudes towards tourism” TECHNICAL SPECIFICATIONS
Between the 10th and 14th of January 2012, TNS Political & Social, a consortium created between TNS political & social, TNS UK and TNS opinion, carried out the survey FLASH EUROBAROMETER 334 about ‘Attitudes toward tourism’. This survey has been requested by the EUROPEAN COMMISSION, Directorate-General for Enterprise and Industry. It is a general public survey co-ordinated by the Directorate-General for Communication ("Research and Speechwriting" Unit). The FLASH EUROBAROMETER 334 covers the population of the respective nationalities of the European Union Member States, resident in each of the 27 Member States and aged 15 years and over. It was also conducted in Croatia, Turkey, FYROM, Iceland, Norway, Republic of Serbia and Israel. The survey covers the national population of citizens (in these countries) as well as the population of citizens of all the European Union Member States that are residents in these countries and have a sufficient command of the national languages to answer the questionnaire. All interviews were carried using the TNS e-Call center (our centralized CATI system). In every country respondents were called both on fixed lines and mobile phones. The basic sample design applied in all states is multi-stage random (probability). In each household, the respondent was drawn at random following the "last birthday rule".
TNS have developed their own RDD sample generation capabilities based on using contact telephone numbers from responders to random probability or random location face to face surveys, such as Eurobarometer, as seed numbers. The approach works because the seed number identifies a working block of telephone numbers and reduces the volume of numbers generated that will be ineffective. The seed numbers are stratified by NUTS2 region and urbanisation to approximate a geographically representative sample. From each seed number the required sample of numbers are generated by randomly replacing the last two digits. The sample is then screened against business databases in order to exclude as many of these numbers as possible before going into field. This approach is consistent across all countries.
1

FLASH EUROBAROMETER 334 “Attitudes of Europeans Towards Tourism”
For each country a comparison between the sample and the universe was carried out. The Universe description was derived from Eurostat population data or from national statistics offices. For all countries surveyed, a national weighting procedure, using marginal and intercellular weighting, was carried out based on this Universe description. In all countries, gender, age, region and size of locality were introduced in the iteration procedure. For international weighting (i.e. EU averages), TNS Political & Social applies the official population figures as provided by EUROSTAT or national statistic offices. The total population figures for input in this post-weighting procedure are listed above. Readers are reminded that survey results are estimations, the accuracy of which, everything being equal, rests upon the sample size and upon the observed percentage. With samples of about 1,000 interviews, the real percentages vary within the following confidence limits:
Observed percentages 10% or 90% 20% or 80% 30% or 70% 40% or 60% 50%
Confidence limits ± 1.9 points ± 2.5 points ± 2.7 points ± 3.0 points ± 3.1 points
ABBR. COUNTRIES INSTITUTES N° INTERVIEWS
FIELDWORK DATES
POPULATION 15+
BE Belgium TNS Dimarso 1.002 10/01/2012 14/01/2012 8.939.546 BG Bulgaria TNS BBSS 1.000 10/01/2012 14/01/2012 6.537.510 CZ Czech Rep. TNS Aisa s.r.o 1.000 10/01/2012 14/01/2012 9.012.443 DK Denmark TNS Gallup A/S 1.000 10/01/2012 14/01/2012 4.561.264 DE Germany TNS Infratest 1.500 10/01/2012 14/01/2012 64.409.146 EE Estonia TNS Emor 500 10/01/2012 14/01/2012 945.733 EL Greece TNS ICAP 1.002 10/01/2012 14/01/2012 8.693.566 ES Spain TNS Demoscopia S.A 1.501 10/01/2012 14/01/2012 39.035.867 FR France TNS Sofres 1.502 10/01/2012 14/01/2012 47.756.439 IE Ireland IMS Millward Brown 1.000 10/01/2012 14/01/2012 3.522.000 IT Italy TNS Infratest 1.501 10/01/2012 14/01/2012 51.862.391 CY Rep. of Cyprus CYMAR 500 10/01/2012 14/01/2012 660.400 LV Latvia TNS Latvia 503 10/01/2012 14/01/2012 1.447.866 LT Lithuania TNS Lithuania 503 10/01/2012 14/01/2012 2.829.740 LU Luxembourg TNS Dimarso 502 10/01/2012 14/01/2012 404.907 HU Hungary TNS Hoffmann Kft 1.000 10/01/2012 14/01/2012 8.320.614
MT Malta MISCO International Ltd 501 10/01/2012 14/01/2012 335.476
NL Netherlands TNS NIPO 1.000 10/01/2012 14/01/2012 13.371.980 AT Austria TNS Austria 1.000 10/01/2012 14/01/2012 7.009.827 PL Poland TNS OBOP 1.501 10/01/2012 14/01/2012 32.413.735 PT Portugal TNS EUROTESTE 1.001 10/01/2012 14/01/2012 8.080.915 RO Romania TNS CSOP 1.003 10/01/2012 14/01/2012 18.246.731 SI Slovenia RM PLUS 500 10/01/2012 14/01/2012 1.759.701 SK Slovakia TNS AISA Slovakia 1.001 10/01/2012 14/01/2012 4.549.955 FI Finland TNS Gallup Oy 1.002 10/01/2012 14/01/2012 4.440.004 SE Sweden TNS SIFO 1.000 10/01/2012 14/01/2012 7.791.240 UK United Kingdom TNS UK 1.498 10/01/2012 14/01/2012 51.848.010
TOTAL EU27
26.523 10/01/2012 14/01/2012 408.787.006
HR Croatia Puls 503 10/01/2012 14/01/2012 3.749.400 TR Turkey TNS PIAR 1.000 10/01/2012 14/01/2012 54.844.406
MK Former Yugoslav Rep. of Macedonia TNS Brima 501 10/01/2012 14/01/2012 1.678.404
IS Iceland Capacent ehf 501 10/01/2012 14/01/2012 252.277 NW Norway TNS Gallup AS 500 10/01/2012 14/01/2012 3.886.395 IL Israel TNS Teleseker 563 10/01/2012 14/01/2012 4.257.500 RS Republic of Serbia TNS Medium Gallup 503 10/01/2012 14/01/2012 6.409.693
TOTAL 30.594 10/01/2012 14/01/2012 473.833.379
2

QUESTIONNAIRE

FLASH EUROBAROMETER 334 “Attitudes of Europeans Towards Tourism”
FL334 - European’s attitudes towards tourism
Q1
Q2
1 2 3 4
5 times or mor
e
None/
zero
DK/NA
1 1 2 3 4 5 6 7
2 1 2 3 4 5 6 7
3 1 2 3 4 5 6 7
4 1 2 3 4 5 6 75 1 2 3 4 5 6 7
(READ OUT)
In paid accommodation (hotel/ rented apartment/house etc….)
In another type of location
NEW
In own property/ second home
At friends or relatives
On a camping site
INT.: IF "NO TRAVEL", CODE 000 - IF "DON'T KNOW", CODE 999
FL 328 Q1 MODIFIED
And now thinking about personal holidays only, how many times did you stay for less than four nights in the following types of accommodations:
(ONE ANSWER ONLY)
ASK ALL
ASK Q2 AND Q3 IF RESPONDENTS SAY THAT THEY HAVE TRAVELLED MINIMUM ONE NIGHT, Q1>0 AND Q1< 999, OTHERS GO TO FILTER BEFORE Q4
During 2011, how many times have you travelled for business or private purposes, where you were away from home for a minimum of one night? (M)
1

FLASH EUROBAROMETER 334 “Attitudes of Europeans Towards Tourism”
Q3
1 2 3 4
5 times or mor
e
None/
zero
DK/NA
1 1 2 3 4 5 6 7
2 1 2 3 4 5 6 7
3 1 2 3 4 5 6 7
4 1 2 3 4 5 6 75 1 2 3 4 5 6 7
Q4
12345
6
789
PROG Q4: ROTATE CODES 1 TO 6
FL 328 Q4 MODIFIED
Problems of accessibility of transport or accommodation (N)
You did not want to go on holiday in 2011 (DO NOT READ OUT)Other (DO NOT READ OUT)
Lack of timeConcerns about safety Preferred to stay at home or with family / friends
What was the main reason why you did not go on holiday in 2011?
Personal/private reasonsFinancial reasons
(READ OUT – ONE ANSWER ONLY)
ASK Q4 ONLY IF THE RESPONDENT SAYS THAT HE OR SHE DID NOT STAY AWAY IN 2011, ((Q2.1=6 and Q2.2=6 and Q2.3=6 and Q2.4=6 and Q2.5=6 and Q3.1=6 and Q3.2=6 and Q3.3=6 and Q3.4=6 and Q3.5=6) OR Q1=0), OTHERS GO TO FILTER BEFORE Q5
In own property/ second home
At friends or relatives
On a camping site
DK/NA
In paid accommodation (hotel/ rented apartment/house etc….)
Again thinking only about your personal holidays, how many times did you stay for a minimumof four nights in the following types of accommodation:
(ONE ANSWER ONLY)
(READ OUT)
In another type of location
NEW
2

FLASH EUROBAROMETER 334 “Attitudes of Europeans Towards Tourism”
Q5
1,
2,3,4,5,6,7,8,9,10,11,12,13,14,15,16,17,18,19,20,21,22,23,24,25,26,27,28,
29,
30,
ASK Q5 TO Q9 ONLY IF THE RESPONDENT SAYS THAT HE OR SHE STAYED AWAY FOR MINIMUM FOUR NIGHTS, Q3.1-5=1-5 FOR AT LEAST ONE ITEM, OTHERS GO TO Q10
OUTSIDE YOUR COUNTRY IN THE EUROPEAN UNION
In which country(ies) did you go for a minimum of 4 nights in 2011?
IN YOUR COUNTRYIn [OUR COUNTRY]
AustriaBelgiumBulgariaCyprusCzech RepublicDenmarkEstoniaFinlandFranceGermanyGreeceHungaryIrelandItalyLatviaLithuaniaLuxembourgMalta
IN ANOTHER COUNTRY OUTSIDE THE EUROPEAN UNIONIn another country outside the EU
NetherlandsPolandPortugalRomaniaSlovakiaSlovenia
DK/NA
NEW
SpainSwedenUnited Kingdom
(DO NOT READ OUT - MULTIPLE ANSWERS POSSIBLE)
3

FLASH EUROBAROMETER 334 “Attitudes of Europeans Towards Tourism”
Q6
1,2,3,4,5,6,7,8,9,
10,
Q7
1 2 3 4
5 times or mor
e
None/
zero
DK/NA
1 1 2 3 4 5 6 72 1 2 3 4 5 6 73 1 2 3 4 5 6 74 1 2 3 4 5 6 75 1 2 3 4 5 6 7
PROG Q6: ROTATE CODES 1 TO 8
How many times did you use the following means of transport to travel to your holiday destination in 2011…?
(INT. : One back and forth should be counted as ONE TIME - ONE ANSWER ONLY)
Airplane Boat
Sports-related (e.g. scuba-diving, cycling etc…) (M)Nature (mountain, lake, landscape etc…) (M)
Visiting friends / relativesOther (DO NOT READ OUT)
Car/ Motorbikes
NEW BASED ON FL 328 Q6
TrainBus
Sun/beachRest/recreation (including Wellness/health treatment) (M)Spending time with your family (N)City trips
DK/NA
(READ OUT)
Culture / religion
FL 328 Q5 MODIFIED
What were your main reasons for going on holidays in 2011?
(READ OUT – MAX. 3 ANSWERS)
4
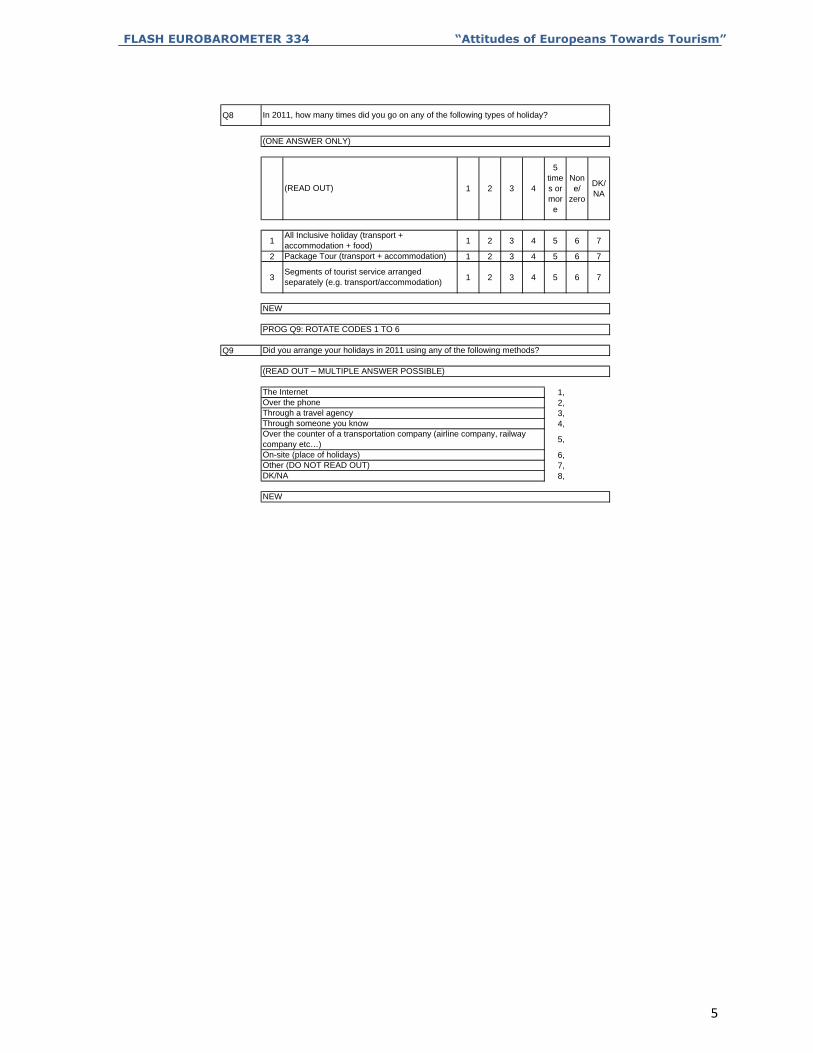
FLASH EUROBAROMETER 334 “Attitudes of Europeans Towards Tourism”
Q8
1 2 3 4
5 times or mor
e
None/
zero
DK/NA
1 1 2 3 4 5 6 7
2 1 2 3 4 5 6 7
3 1 2 3 4 5 6 7
Q9
1,2,3,4,
5,
6,7,8,
PROG Q9: ROTATE CODES 1 TO 6
NEW
Through someone you know
NEW
Did you arrange your holidays in 2011 using any of the following methods?
(READ OUT – MULTIPLE ANSWER POSSIBLE)
The InternetOver the phoneThrough a travel agency
Other (DO NOT READ OUT)DK/NA
Over the counter of a transportation company (airline company, railway company etc…)On-site (place of holidays)
In 2011, how many times did you go on any of the following types of holiday?
(ONE ANSWER ONLY)
Package Tour (transport + accommodation)
Segments of tourist service arranged separately (e.g. transport/accommodation)
(READ OUT)
All Inclusive holiday (transport + accommodation + food)
5
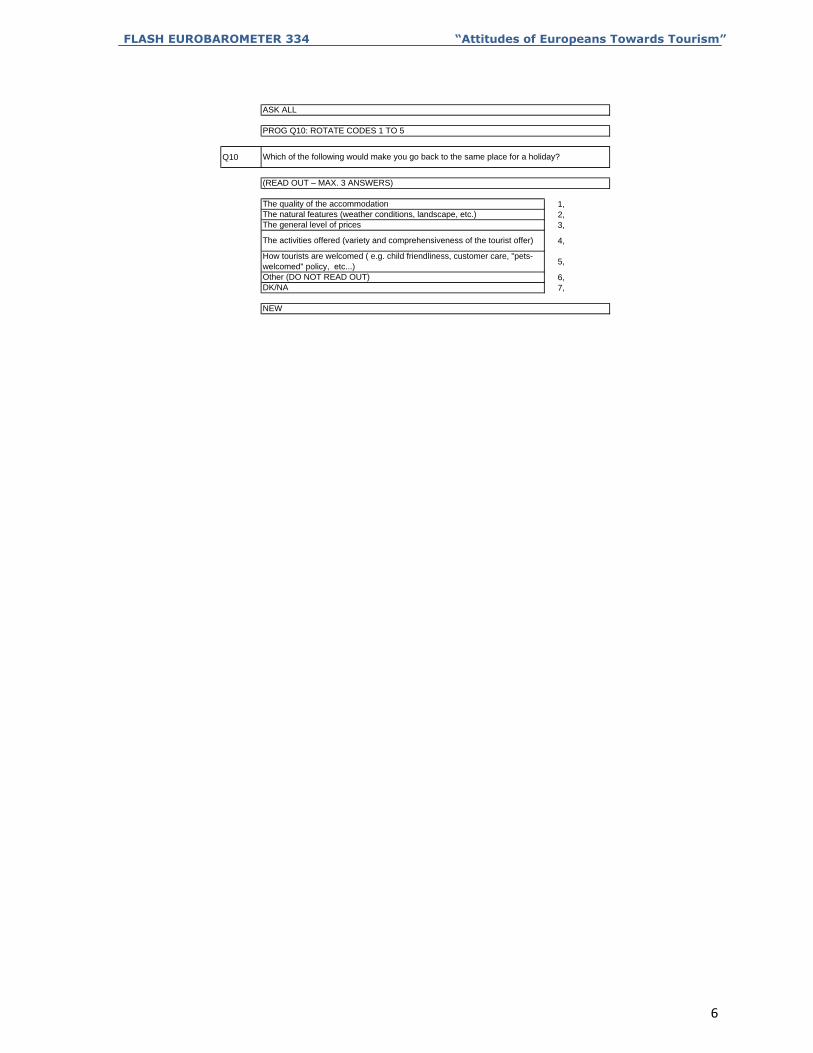
FLASH EUROBAROMETER 334 “Attitudes of Europeans Towards Tourism”
Q10
1,2,3,
4,
5,
6,7,
PROG Q10: ROTATE CODES 1 TO 5
How tourists are welcomed ( e.g. child friendliness, customer care, "pets-welcomed" policy, etc...) Other (DO NOT READ OUT)DK/NA
NEW
The activities offered (variety and comprehensiveness of the tourist offer)
Which of the following would make you go back to the same place for a holiday?
(READ OUT – MAX. 3 ANSWERS)
The quality of the accommodationThe natural features (weather conditions, landscape, etc.)The general level of prices
ASK ALL
6
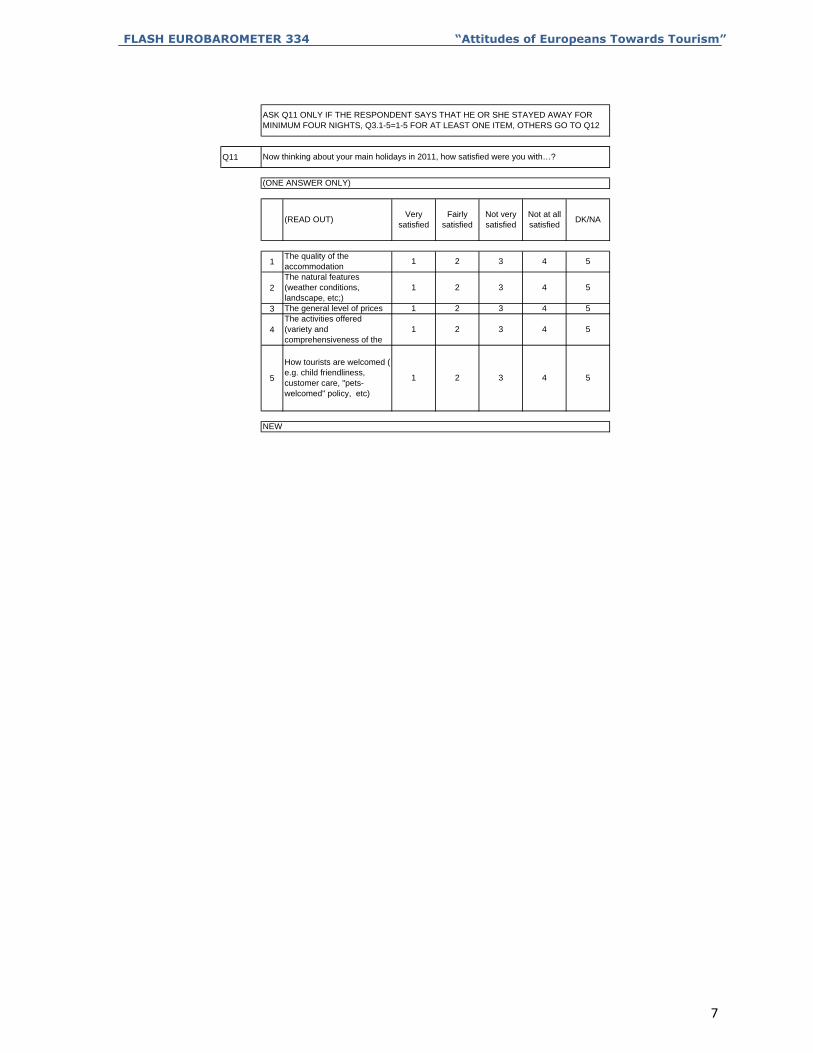
FLASH EUROBAROMETER 334 “Attitudes of Europeans Towards Tourism”
Q11
1
2
3
4
5 2 3 4
NEW
The activities offered (variety and comprehensiveness of the
1 2 3 4 5
How tourists are welcomed ( e.g. child friendliness, customer care, "pets-welcomed" policy, etc)
51
The general level of prices 1 2 3 4 5
The natural features (weather conditions, landscape, etc;)
1 2 3 4 5
The quality of the accommodation
1 2 3 4 5
Now thinking about your main holidays in 2011, how satisfied were you with…?
(ONE ANSWER ONLY)
(READ OUT)Very
satisfiedFairly
satisfiedNot very satisfied
Not at all satisfied
DK/NA
ASK Q11 ONLY IF THE RESPONDENT SAYS THAT HE OR SHE STAYED AWAY FOR MINIMUM FOUR NIGHTS, Q3.1-5=1-5 FOR AT LEAST ONE ITEM, OTHERS GO TO Q12
7

FLASH EUROBAROMETER 334 “Attitudes of Europeans Towards Tourism”
Q12
1,
2,
3,4,5,6,7,8,9,
10,
Q13
1,2,3,4,5,6,
PROG Q12: ROTATE CODES 1 TO 8
PROG Q13: ROTATE CODES 1 TO 3
Other (DO NOT READ OUT)
DK/NA
NEW
(READ OUT – MULTIPLE ANSWER POSSIBLE)
Holidays with more than 13 consecutive nights Holidays between 4 and 13 consecutive nights
In 2012, which of the following type of holidays do you plan to take?
From the following information sources, which one do you consider to be the most important when you make a decision about your travel plans?
(READ OUT – MAX. 3 ANSWERS)
DK/NA
FL 328 Q11a MODIFIED
Travel / tourist agencies Newspaper, radio, TV (M)
Internet websites (M)Social media sites (N)
Personal experience
Recommendations of friends, colleagues or relatives (M)
Paid for guidebooks and magazines (M)Free catalogues, brochures (M)
No trip at all (DO NOT READ OUT)
ASK ALL
Short-stay trip (up to 3 nights) No decisions yet (DO NOT READ OUT)
8

FLASH EUROBAROMETER 334 “Attitudes of Europeans Towards Tourism”
Q14
1,
2,3,4,5,6,7,8,9,10,11,12,13,14,15,16,17,18,19,20,21,22,23,24,25,26,27,28,
29,
30,
ASK Q14 ONLY IF RESPONDENT ANSWERS THAT HE OR SHE ENVISAGES TO TAKE HOLIDAYS AWAY IN 2012, Q13=1-3, OTHERS GO TO Q15
In which country(ies) do you plan to spend your holidays in 2012?
IN YOUR COUNTRYIn [OUR COUNTRY]OUTSIDE YOUR COUNTRY IN THE EUROPEAN UNION
(DO NOT READ OUT - MULTIPLE ANSWERS POSSIBLE)
AustriaBelgiumBulgariaCyprusCzech RepublicDenmarkEstoniaFinlandFranceGermanyGreeceHungaryIrelandItalyLatviaLithuaniaLuxembourgMaltaNetherlandsPolandPortugalRomaniaSlovakiaSloveniaSpainSwedenUnited KingdomIN ANOTHER COUNTRY OUTSIDE THE EUROPEAN UNIONIn another country outside the EU
DK/NA
NEW
9
FLASH EUROBAROMETER 334 “Attitudes of Europeans Towards Tourism”
Q15
1,2,3,4,5,6,7,8,
NEW
I will not go on holidaysI do not go on holidays (DO NOT READ OUT)I didn’t plan my holyday for 2012 (DO NOT READ OUT)DK/NA
Has the current economic situation had an impact on your holiday plans for 2012?
It has not changed my planned holidayI will go on holiday but I changed my destinations
(READ OUT – 3 ANSWERS POSSIBLE)
I will go on holiday but for a shorter periodI will go on holiday but I will spend less
ASK ALL
PROG: 3 ANSWERS POSSIBLE FOR CODES 2,3,4, ONE ANSWER ONLY FOR CODES 1,5, 6,7
10

TABLES

FLASH EUROBAROMETER 334 “Attitudes of Europeans Towards Tourism”
%Flash EB
334
Diff.Flash EB
328
Flash EB334
Diff.Flash EB
328
Flash EB334
Diff.Flash EB
328EU 27 72 0 26 -1 2 1
BE 66 -8 33 7 1 1
BG 61 -5 32 0 7 5
CZ 70 6 27 -6 3 0
DK 87 0 12 -1 1 1
DE 80 1 18 -2 2 1
EE 73 10 22 -15 5 5
IE 86 3 14 -2 0 -1
EL 63 -14 37 14 0 0
ES 66 -3 33 2 1 1
FR 74 -5 21 0 5 5
IT 69 5 30 -6 1 1
CY 73 6 27 -6 0 0
LV 62 -3 37 2 1 1
LT 62 -7 30 0 8 7
LU 80 -5 20 6 0 -1
HU 55 10 44 -10 1 0
MT 50 -13 50 14 0 -1
NL 78 -9 21 9 1 0
AT 81 3 18 -2 1 -1
PL 69 2 27 -6 4 4
PT 54 -5 40 0 6 5
RO 58 0 39 -2 3 2
SI 83 7 16 -6 1 -1
SK 72 13 24 -13 4 0
FI 84 -5 14 5 2 0
SE 86 -1 12 1 2 0
UK 77 -1 21 0 2 1
HR 69 -1 28 -1 3 2
TR 44 7 48 -15 8 8
MK 51 -15 49 17 0 -2
IS 88 5 10 -5 2 0
NO 90 7 7 -1 3 -6
RS 42 58 0
IL 69 30 1
Q1 Au cours de l'année 2011, combien de fois avez-vous voyagé et passé au moins une nuit en dehors de votre domicile pour des raisons privées ou professionnelles?
Q1 During 2011, how many times have you travelled for business or private purposes, where you were away from home for a minimum of one night?
Q1 Wie oft sind Sie im Jahr 2011 aus geschäftlichen oder privaten Gründen gereist, wobei Sie mindestens eine Nacht weg von zu Hause waren?
Ne sait pas
Don't know
Weiß nicht
Ont voyagé en 2011
Have travelled in 2011
Ont voyagé en 2011
N'ont pas voyagé en 2011
Have not travelled at all in 2011
N'ont pas voyagé en 2011
1

FLASH EUROBAROMETER 334 “Attitudes of Europeans Towards Tourism”
%Flash EB334
Diff.Flash EB328
Flash EB334
Diff.Flash EB328
Flash EB334
Diff.Flash EB328
Flash EB334
Diff.Flash EB328
Flash EB334
Diff.Flash EB328
Flash EB334
Diff.Flash EB328
Flash EB334
Diff.Flash EB328
Flash EB334
Diff.Flash EB328
EU 27 26 -1 15 -1 12 -2 10 -1 13 0 11 1 11 3 2 1
BE 33 7 18 -6 14 -4 12 -2 10 -1 7 2 5 3 1 1
BG 32 0 10 2 7 -1 8 1 8 -4 13 0 15 -3 7 5
CZ 27 -6 11 -5 10 -3 6 -1 11 0 12 3 21 13 2 -1
DK 12 -1 15 -1 15 0 14 1 17 -3 16 2 10 1 1 1
DE 18 -2 16 -1 16 -1 13 -1 16 2 11 1 8 1 2 1
EE 22 -15 11 -8 10 -5 10 0 10 1 12 6 20 16 5 5
IE 14 -2 15 -2 18 2 15 -3 16 0 13 3 9 3 0 -1
EL 37 14 15 2 11 -1 8 -4 10 -4 10 -5 9 -2 0 0
ES 33 2 13 -4 14 1 9 0 11 -1 9 1 10 0 1 1
FR 21 0 14 -2 10 -4 9 -2 11 -5 14 2 16 6 5 5
IT 30 -6 21 3 14 1 10 -2 11 2 8 -1 5 2 1 1
CY 27 -6 22 -3 16 1 12 3 12 3 6 1 5 1 0 0
LV 37 2 14 -5 11 0 9 2 10 1 8 2 10 -3 1 1
LT 30 0 11 -2 7 -5 8 -2 10 -3 11 1 15 4 8 7
LU 20 6 18 4 15 -9 12 -6 14 -2 11 2 10 6 0 -1
HU 44 -11 13 -1 10 3 9 4 8 1 7 0 9 5 0 -1
MT 50 14 27 -2 13 -1 4 -3 4 -3 2 -2 0 -2 0 -1
NL 21 9 17 1 14 -4 11 -4 18 -2 10 0 8 0 1 0
AT 18 -2 15 0 15 -1 14 -2 15 2 12 1 10 3 1 -1
PL 27 -6 13 -3 9 -3 8 -1 12 3 13 3 14 3 4 4
PT 40 0 13 -3 10 1 7 -1 8 0 8 -1 8 -1 6 5
RO 39 -2 12 0 8 0 8 -1 10 0 11 0 9 1 3 2
SI 16 -7 17 2 12 -4 12 3 17 2 12 2 13 3 1 -1
SK 24 -13 11 -2 7 -3 5 0 10 -3 17 9 22 12 4 0
FI 14 5 9 0 10 0 10 1 15 -1 18 -1 22 -4 2 0
SE 12 1 11 0 9 -3 11 -1 16 -3 20 1 19 5 2 0
UK 21 0 13 -3 14 0 12 2 16 1 12 -2 10 1 2 1
HR 28 -1 12 -1 10 -2 9 0 15 3 12 -1 11 0 3 2
TR 48 -15 12 -4 9 3 7 1 6 3 4 0 6 4 8 8
MK 49 17 16 -1 8 -3 7 -2 7 -4 7 -3 6 -2 0 -2
IS 10 -5 14 -3 17 3 15 4 18 0 16 1 8 0 2 0
NO 7 -1 6 -1 15 7 11 2 17 2 23 -1 18 -2 3 -6
RS 58 13 8 6 7 3 5 0
IL 30 19 13 11 11 8 7 1
Q1T Au cours de l'année 2011, combien de fois avez-vous voyagé et passé au moins une nuit en dehors de votre domicile pour des raisons privées ou professionnelles?
Q1T During 2011, how many times have you travelled for business or private purposes, where you were away from home for a minimum of one night?
Q1T Wie oft sind Sie im Jahr 2011 aus geschäftlichen oder privaten Gründen gereist, wobei Sie mindestens eine Nacht weg von zu Hause waren?
Aucune
None
Keine
1
1
1
2
2
2
3
3
3
4 ou 5 fois
4 or 5 times
4 ou 5 fois
6 à 10 fois
6 to 10 times
6 bis 10 mal
Plus que 10 fois
More than 10 times
Plus que 10 fois
Ne sait pas
Don't know
Weiß nicht
2

FLASH EUROBAROMETER 334 “Attitudes of Europeans Towards Tourism”
%
EU 27
BE
BG
CZ
DK
DE
EE
IE
EL
ES
FR
IT
CY
LV
LT
LU
HU
MT
NL
AT
PL
PT
RO
SI
SK
FI
SE
UK
HR
TR
MK
IS
NO
RS
IL
Q2.1 Et en ce qui concerne uniquement vos vacances personnelles, combien de fois avez-vous séjourné moins de quatre nuits dans l'un des types de logements suivants? Dans un logement payant (hôtel, maison ou appartement de location, etc...)
Q2.1 And now thinking about personal holidays only, how many times did you stay for less than four nights in the following types of accommodations: In paid accommodation (hotel/ rented apartment/house etc….)
Q2.1 Denken Sie jetzt bitte ausschließlich an private Urlaubsreisen: Wie häufig haben Sie weniger als vier Nächte in folgenden Unterkünften verbracht? In einer bezahlten Unterkunft (Hotel/Pension/Ferienhaus etc.)
1 3 5 fois ou plus Ne sait pas
1
1
Flash EB334
2
2
2
Flash EB334
Aucune/ zéro
None/ zero
Nie / Null
Flash EB334
3
3
Flash EB334
4
4
4
4 7 46 0
5 times or more
5-mal oder mehr
Flash EB334
Flash EB334
27 16 8 5
Don't know
Weiß nicht
Flash EB334
22 14 7
6 38 0
18 15 7 3 8 49 0
0
25 12 8 3 3 49 0
17 10
22 14 6 3
11 545 3
8 47 0
15 8 4 2 11 59 1
1
23 12 4 2 7 52 0
25 21
20 16 9 4
8 2911 5
8 43 0
20 12 8 3 8 49 0
0
23 15 9 3 7 42 1
27 14
16 15 4 2
4 476 2
8 55 0
20 9 5 2 7 57 0
0
18 13 5 4 7 53 0
29 13
29 10 4 3
9 369 4
2 52 0
27 16 9 4 4 40 0
0
16 14 8 5 11 46 0
21 14
24 13 6 2
8 4210 5
10 44 1
18 14 6 3 8 50 1
0
17 12 6 2 10 53 0
25 17
20 15 9 4
7 416 4
16 35 1
20 14 8 6 9 42 1
0
14 13 4 2 6 60 1
24 15
13 10 8 2
6 427 6
8 59 0
15 11 4 2 5 63 0
0
18 19 8 7 9 39 0
25 15
10 3 1 3
8 426 4
3 80 0
26 22 7 4 8 30 3
3

FLASH EUROBAROMETER 334 “Attitudes of Europeans Towards Tourism”
%
EU 27
BE
BG
CZ
DK
DE
EE
IE
EL
ES
FR
IT
CY
LV
LT
LU
HU
MT
NL
AT
PL
PT
RO
SI
SK
FI
SE
UK
HR
TR
MK
IS
NO
RS
IL
Q2.2 Et en ce qui concerne uniquement vos vacances personnelles, combien de fois avez-vous séjourné moins de quatre nuits dans l'un des types de logements suivants? Dans votre résidence secondaire/un logement qui vous appartient
Q2.2 And now thinking about personal holidays only, how many times did you stay for less than four nights in the following types of accommodations: In own property/ second home
Q2.2 Denken Sie jetzt bitte ausschließlich an private Urlaubsreisen: Wie häufig haben Sie weniger als vier Nächte in folgenden Unterkünften verbracht? Im eigenen Ferienhaus/der eigenen Ferienwohnung
1 3 5 fois ou plus Ne sait pas
1
1
Flash EB334
2
2
2
Flash EB334
Aucune/ zéro
None/ zero
Nie / Null
Flash EB334
3
3
Flash EB334
4
4
4
1 7 81 1
5 times or more
5-mal oder mehr
Flash EB334
Flash EB334
3 3 2 0
Don't know
Weiß nicht
Flash EB334
5 3 2
4 88 0
4 5 4 4 23 59 1
1
5 3 3 1 6 81 1
5 6
5 2 1 1
26 564 2
2 89 0
1 1 3 2 19 72 2
1
9 6 3 1 16 65 0
5 2
4 3 2 2
3 862 1
13 76 0
3 3 2 2 6 84 0
0
8 3 2 0 9 78 0
7 3
6 7 4 1
5 841 0
16 65 1
8 6 2 4 13 66 1
0
4 2 1 1 7 85 0
9 3
1 1 1 0
4 821 1
1 96 0
2 1 0 1 3 92 1
0
4 5 3 3 12 72 1
5 2
13 5 4 2
3 891 0
13 62 1
5 2 3 2 9 78 1
0
9 9 4 3 19 54 2
5 3
5 4 3 1
9 802 1
19 67 1
6 5 3 2 14 68 2
1
5 6 3 2 17 66 1
4 4
7 5 5 2
4 842 1
7 73 1
2 4 3 0 6 85 0
1
9 7 4 6 23 48 3
5 5
3 3 3 4
8 763 2
6 81 0
3 2 1 0 3 81 10
4

FLASH EUROBAROMETER 334 “Attitudes of Europeans Towards Tourism”
%
EU 27
BE
BG
CZ
DK
DE
EE
IE
EL
ES
FR
IT
CY
LV
LT
LU
HU
MT
NL
AT
PL
PT
RO
SI
SK
FI
SE
UK
HR
TR
MK
IS
NO
RS
IL
Q2.3 Et en ce qui concerne uniquement vos vacances personnelles, combien de fois avez-vous séjourné moins de quatre nuits dans l'un des types de logements suivants? Chez des amis ou des membres de votre famille
Q2.3 And now thinking about personal holidays only, how many times did you stay for less than four nights in the following types of accommodations: At friends or relatives
Q2.3 Denken Sie jetzt bitte ausschließlich an private Urlaubsreisen: Wie häufig haben Sie weniger als vier Nächte in folgenden Unterkünften verbracht? Bei Freunden oder Verwandten
1 3 5 fois ou plus Ne sait pas
1
1
Flash EB334
2
2
2
Flash EB334
Aucune/ zéro
None/ zero
Nie / Null
Flash EB334
3
3
Flash EB334
4
4
4
4 14 53 0
5 times or more
5-mal oder mehr
Flash EB334
Flash EB334
11 6 4 3
Don't know
Weiß nicht
Flash EB334
13 10 6
11 65 0
12 12 8 5 22 41 0
0
12 10 5 3 13 56 1
8 13
12 9 6 3
29 368 6
6 64 0
10 14 7 4 28 36 1
0
12 8 5 3 10 62 0
13 9
12 9 7 4
12 567 3
12 55 1
13 13 8 5 23 38 0
0
14 6 3 2 5 70 0
15 8
12 16 8 4
4 693 1
34 25 1
18 13 7 6 22 33 1
0
12 10 8 4 16 50 0
15 5
7 1 2 0
8 627 3
0 90 0
10 7 6 3 12 61 1
0
12 11 9 6 26 36 0
12 8
13 12 7 4
6 674 3
12 51 1
9 14 8 5 16 47 1
0
11 10 7 5 26 39 2
11 9
11 14 10 6
8 674 1
21 37 1
13 14 9 6 17 40 1
0
12 12 7 4 18 47 0
15 12
16 16 10 4
14 487 4
12 37 5
12 10 5 1 7 65 0
1
14 14 9 6 19 37 1
18 13
14 12 7 5
12 4011 5
16 45 1
10 8 6 2 15 53 6
5

FLASH EUROBAROMETER 334 “Attitudes of Europeans Towards Tourism”
%
EU 27
BE
BG
CZ
DK
DE
EE
IE
EL
ES
FR
IT
CY
LV
LT
LU
HU
MT
NL
AT
PL
PT
RO
SI
SK
FI
SE
UK
HR
TR
MK
IS
NO
RS
IL
Q2.4 Et en ce qui concerne uniquement vos vacances personnelles, combien de fois avez-vous séjourné moins de quatre nuits dans l'un des types de logements suivants? Dans un camping
Q2.4 And now thinking about personal holidays only, how many times did you stay for less than four nights in the following types of accommodations: On a camping site
Q2.4 Denken Sie jetzt bitte ausschließlich an private Urlaubsreisen: Wie häufig haben Sie weniger als vier Nächte in folgenden Unterkünften verbracht? Auf einem Campingplatz
1 3 5 fois ou plus Ne sait pas
1
1
Flash EB334
2
2
2
Flash EB334
Aucune/ zéro
None/ zero
Nie / Null
Flash EB334
3
3
Flash EB334
4
4
4
1 2 88 0
5 times or more
5-mal oder mehr
Flash EB334
Flash EB334
5 2 0 1
Don't know
Weiß nicht
Flash EB334
6 2 1
2 89 1
5 3 2 1 2 87 0
0
5 1 1 0 2 90 1
11 4
5 2 1 0
3 811 0
1 91 0
8 5 3 1 1 82 0
0
4 1 0 0 1 94 0
6 2
5 1 1 0
2 891 0
1 92 0
8 1 1 1 2 87 0
0
3 2 0 1 0 94 0
4 1
10 3 1 1
0 941 0
1 83 1
8 3 2 1 1 84 1
0
3 2 1 0 1 93 0
4 1
2 1 0 0
0 950 0
1 96 0
9 2 1 0 4 84 0
0
5 2 1 0 2 90 0
4 2
9 2 2 0
1 930 0
3 84 0
7 5 3 1 3 81 0
0
6 2 0 1 1 90 0
7 3
7 2 1 1
3 860 1
1 88 0
6 3 0 0 2 88 1
0
2 0 0 1 1 96 0
10 4
4 2 2 1
3 812 0
1 89 1
4 2 2 0 0 92 0
0
7 3 1 1 4 84 0
13 8
2 0 0 1
6 672 4
1 95 1
7 3 1 1 2 80 6
6
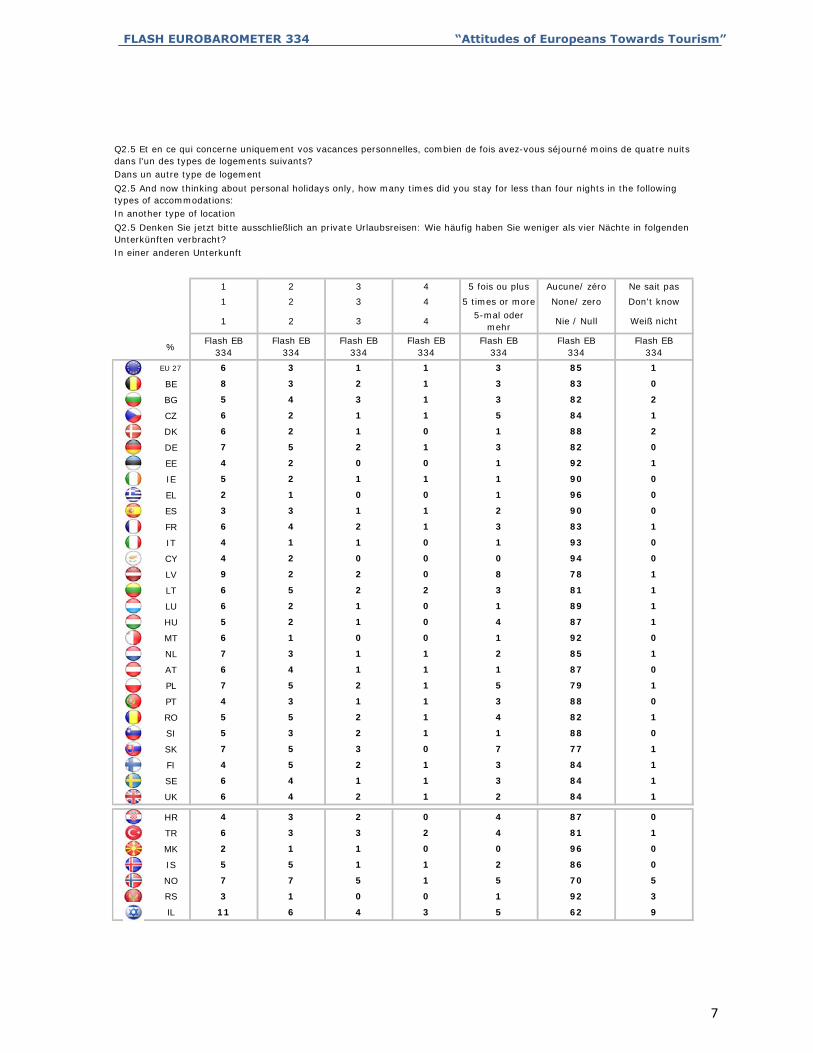
FLASH EUROBAROMETER 334 “Attitudes of Europeans Towards Tourism”
%
EU 27
BE
BG
CZ
DK
DE
EE
IE
EL
ES
FR
IT
CY
LV
LT
LU
HU
MT
NL
AT
PL
PT
RO
SI
SK
FI
SE
UK
HR
TR
MK
IS
NO
RS
IL
Q2.5 Et en ce qui concerne uniquement vos vacances personnelles, combien de fois avez-vous séjourné moins de quatre nuits dans l'un des types de logements suivants? Dans un autre type de logement
Q2.5 And now thinking about personal holidays only, how many times did you stay for less than four nights in the following types of accommodations: In another type of location
Q2.5 Denken Sie jetzt bitte ausschließlich an private Urlaubsreisen: Wie häufig haben Sie weniger als vier Nächte in folgenden Unterkünften verbracht? In einer anderen Unterkunft
1 3 5 fois ou plus Ne sait pas
1
1
Flash EB334
2
2
2
Flash EB334
Aucune/ zéro
None/ zero
Nie / Null
Flash EB334
3
3
Flash EB334
4
4
4
1 3 85 1
5 times or more5-mal oder
mehrFlash EB
334Flash EB
334
8 3 2 1
Don't know
Weiß nicht
Flash EB334
6 3 1
3 83 0
5 4 3 1 3 82 2
1
6 2 1 0 1 88 2
6 2
7 5 2 1
5 841 1
3 82 0
4 2 0 0 1 92 1
0
2 1 0 0 1 96 0
5 2
3 3 1 1
1 901 1
2 90 0
6 4 2 1 3 83 1
0
4 2 0 0 0 94 0
4 1
9 2 2 0
1 931 0
8 78 1
6 5 2 2 3 81 1
1
5 2 1 0 4 87 1
6 2
6 1 0 0
1 891 0
1 92 0
7 3 1 1 2 85 1
0
7 5 2 1 5 79 1
6 4
4 3 1 1
1 871 1
3 88 0
5 5 2 1 4 82 1
0
7 5 3 0 7 77 1
5 3
4 5 2 1
1 882 1
3 84 1
6 4 1 1 3 84 1
1
4 3 2 0 4 87 0
6 4
6 3 3 2
2 842 1
4 81 1
2 1 1 0 0 96 0
0
7 7 5 1 5 70 5
5 5
3 1 0 0
2 861 1
1 92 3
11 6 4 3 5 62 9
7

FLASH EUROBAROMETER 334 “Attitudes of Europeans Towards Tourism”
%
EU 27
BE
BG
CZ
DK
DE
EE
IE
EL
ES
FR
IT
CY
LV
LT
LU
HU
MT
NL
AT
PL
PT
RO
SI
SK
FI
SE
UK
HR
TR
MK
IS
NO
RS
IL
Q3.1 Toujours en ce qui concerne uniquement vos vacances personnelles, combien de fois avez-vous séjourné quatre nuits ou plus dans l'un des types de logements suivants? Dans un logement payant (hôtel, maison ou appartement de location, etc...)
Q3.1 Again thinking only about your personal holidays, how many times did you stay for a minimum of four nights in the following types of accommodation: In paid accommodation (hotel/ rented apartment/house etc….)
Q3.1 Und wie häufig haben Sie auf privaten Urlaubsreisen mindestens vier Nächte in einer der folgenden Unterkünfte verbracht? In einer bezahlten Unterkunft (Hotel/Pension/Ferienhaus etc.)
1 3 5 fois ou plus Ne sait pas
1
1
Flash EB334
2
2
2
Flash EB334
Aucune/ zéro
None/ zero
Nie/Null
Flash EB334
3
3
Flash EB334
4
4
4
4 6 40 0
5 times or more
5-mal oder mehr
Flash EB334
Flash EB334
33 15 10 4
Don't know
Weiß nicht
Flash EB334
29 14 7
6 32 0
22 9 6 4 4 55 0
0
34 18 8 4 4 32 0
28 13
29 20 10 4
8 445 2
7 30 0
17 8 4 2 5 63 1
0
24 9 4 2 5 56 0
32 17
28 13 7 3
6 338 4
8 41 0
27 14 5 3 6 44 1
1
28 13 4 3 7 45 0
30 10
17 7 5 3
3 495 2
8 60 0
19 8 4 2 4 62 1
4
23 8 4 1 7 57 0
26 19
37 16 3 2
7 339 2
5 37 0
36 18 11 5 3 27 0
0
23 12 4 4 7 49 1
28 19
30 8 4 4
7 328 6
9 44 1
26 10 5 2 5 52 0
0
26 12 5 2 9 45 1
35 18
25 13 5 1
6 298 4
5 50 1
27 14 7 4 6 41 1
0
22 7 3 3 5 60 0
34 16
14 8 6 4
6 318 5
9 59 0
32 14 3 2 5 43 1
0
25 20 11 5 5 34 0
26 11
23 5 3 1
3 545 1
7 60 1
22 12 4 5 5 45 7
8

FLASH EUROBAROMETER 334 “Attitudes of Europeans Towards Tourism”
%
EU 27
BE
BG
CZ
DK
DE
EE
IE
EL
ES
FR
IT
CY
LV
LT
LU
HU
MT
NL
AT
PL
PT
RO
SI
SK
FI
SE
UK
HR
TR
MK
IS
NO
RS
IL
Q3.2 Toujours en ce qui concerne uniquement vos vacances personnelles, combien de fois avez-vous séjourné quatre nuits ou plus dans l'un des types de logements suivants? Dans votre résidence secondaire/un logement qui vous appartient
Q3.2 Again thinking only about your personal holidays, how many times did you stay for a minimum of four nights in the following types of accommodation: In own property/ second home
Q3.2 Und wie häufig haben Sie auf privaten Urlaubsreisen mindestens vier Nächte in einer der folgenden Unterkünfte verbracht? Im eigenen Ferienhaus/der eigenen Ferienwohnung
1 3 5 fois ou plus Ne sait pas
1
1
Flash EB334
2
2
2
Flash EB334
Aucune/ zéro
None/ zero
Nie/Null
Flash EB334
3
3
Flash EB334
4
4
4
1 6 80 1
5 times or more
5-mal oder mehr
Flash EB334
Flash EB334
4 2 1 1
Don't know
Weiß nicht
Flash EB334
6 4 2
4 88 0
4 4 3 1 19 68 1
0
11 3 1 1 4 78 2
6 6
8 2 1 1
18 653 2
2 86 0
3 5 1 1 14 74 2
1
15 7 2 2 12 62 0
4 3
8 5 3 2
2 881 1
13 69 0
4 4 2 1 7 81 1
0
7 4 2 1 6 80 0
8 3
3 5 2 1
4 831 1
19 70 0
5 2 2 2 6 81 2
4
2 1 1 0 4 91 1
8 6
2 2 0 0
3 762 1
2 93 1
4 1 1 1 4 88 1
0
4 3 2 2 9 79 1
6 2
8 5 3 3
3 871 1
10 69 2
4 3 2 2 8 80 1
0
11 6 3 2 16 60 2
7 3
7 4 2 2
8 811 0
12 71 2
9 4 4 3 13 66 1
1
10 3 4 3 14 66 0
6 4
7 5 4 2
2 841 2
12 69 1
7 1 1 1 6 83 1
1
12 7 6 6 15 53 1
6 3
3 1 2 1
5 822 1
5 88 0
2 2 1 0 3 83 9
9

FLASH EUROBAROMETER 334 “Attitudes of Europeans Towards Tourism”
%
EU 27
BE
BG
CZ
DK
DE
EE
IE
EL
ES
FR
IT
CY
LV
LT
LU
HU
MT
NL
AT
PL
PT
RO
SI
SK
FI
SE
UK
HR
TR
MK
IS
NO
RS
IL
Q3.3 Toujours en ce qui concerne uniquement vos vacances personnelles, combien de fois avez-vous séjourné quatre nuits ou plus dans l'un des types de logements suivants? Chez des amis ou des membres de votre famille
Q3.3 Again thinking only about your personal holidays, how many times did you stay for a minimum of four nights in the following types of accommodation: At friends or relatives
Q3.3 Und wie häufig haben Sie auf privaten Urlaubsreisen mindestens vier Nächte in einer der folgenden Unterkünfte verbracht? Bei Freunden oder Verwandten
1 3 5 fois ou plus Ne sait pas
1
1
Flash EB334
2
2
2
Flash EB334
Aucune/ zéro
None/ zero
Nie/Null
Flash EB334
3
3
Flash EB334
4
4
4
2 8 65 1
5 times or more
5-mal oder mehr
Flash EB334
Flash EB334
11 4 3 1
Don't know
Weiß nicht
Flash EB334
13 7 4
6 74 1
8 7 5 5 11 63 1
0
10 4 2 2 4 77 1
10 7
10 6 3 2
15 614 3
4 75 0
6 6 3 1 11 72 1
0
13 6 3 2 6 70 0
15 6
14 9 4 3
3 722 2
8 62 0
17 11 6 4 17 44 1
0
11 4 2 1 5 77 0
13 5
10 7 5 4
3 762 1
14 60 0
10 9 3 3 10 63 2
4
10 7 3 3 8 69 0
12 10
14 2 2 0
3 664 1
1 81 0
13 4 2 1 6 74 0
0
13 8 7 4 15 53 0
10 4
14 8 4 3
3 793 1
9 62 0
10 8 6 4 12 60 0
0
9 8 5 4 18 55 1
13 2
11 5 4 2
6 744 1
6 71 1
16 9 6 3 8 57 1
1
17 10 4 4 11 54 0
13 9
12 9 6 3
6 653 3
16 52 2
12 5 4 2 4 73 0
1
14 9 5 4 7 59 2
18 10
10 5 1 2
7 585 1
7 75 0
8 7 1 1 5 71 7
10
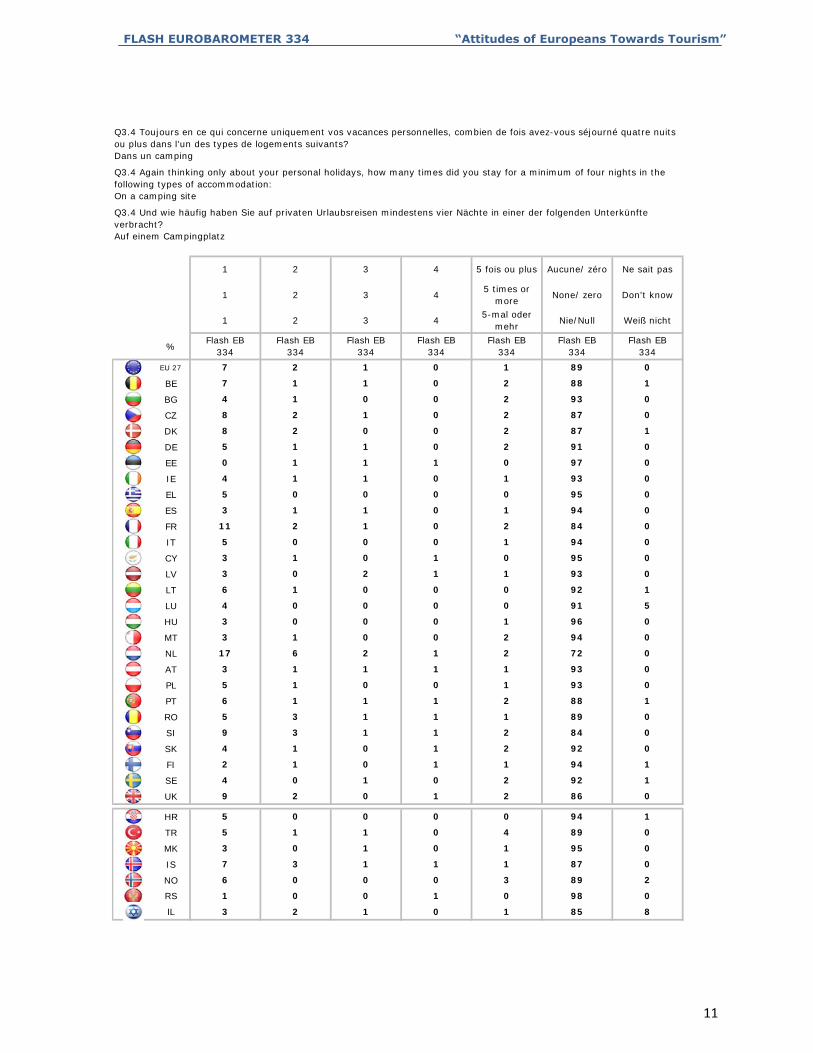
FLASH EUROBAROMETER 334 “Attitudes of Europeans Towards Tourism”
%
EU 27
BE
BG
CZ
DK
DE
EE
IE
EL
ES
FR
IT
CY
LV
LT
LU
HU
MT
NL
AT
PL
PT
RO
SI
SK
FI
SE
UK
HR
TR
MK
IS
NO
RS
IL
Q3.4 Toujours en ce qui concerne uniquement vos vacances personnelles, combien de fois avez-vous séjourné quatre nuits ou plus dans l'un des types de logements suivants? Dans un camping
Q3.4 Again thinking only about your personal holidays, how many times did you stay for a minimum of four nights in the following types of accommodation: On a camping site
Q3.4 Und wie häufig haben Sie auf privaten Urlaubsreisen mindestens vier Nächte in einer der folgenden Unterkünfte verbracht? Auf einem Campingplatz
1 3 5 fois ou plus Ne sait pas
1
1
Flash EB334
2
2
2
Flash EB334
Aucune/ zéro
None/ zero
Nie/Null
Flash EB334
3
3
Flash EB334
4
4
4
0 1 89 0
5 times or more
5-mal oder mehr
Flash EB334
Flash EB334
7 1 1 0
Don't know
Weiß nicht
Flash EB334
7 2 1
2 88 1
4 1 0 0 2 93 0
0
8 2 0 0 2 87 1
8 2
5 1 1 0
2 871 0
2 91 0
0 1 1 1 0 97 0
0
5 0 0 0 0 95 0
4 1
3 1 1 0
1 931 0
1 94 0
11 2 1 0 2 84 0
0
3 1 0 1 0 95 0
5 0
3 0 2 1
1 940 0
1 93 0
6 1 0 0 0 92 1
5
3 0 0 0 1 96 0
4 0
3 1 0 0
0 910 0
2 94 0
17 6 2 1 2 72 0
0
5 1 0 0 1 93 0
3 1
6 1 1 1
1 931 1
2 88 1
5 3 1 1 1 89 0
0
4 1 0 1 2 92 0
9 3
2 1 0 1
2 841 1
1 94 1
4 0 1 0 2 92 1
0
5 0 0 0 0 94 1
9 2
5 1 1 0
2 860 1
4 89 0
3 0 1 0 1 95 0
0
6 0 0 0 3 89 2
7 3
1 0 0 1
1 871 1
0 98 0
3 2 1 0 1 85 8
11

FLASH EUROBAROMETER 334 “Attitudes of Europeans Towards Tourism”
%
EU 27
BE
BG
CZ
DK
DE
EE
IE
EL
ES
FR
IT
CY
LV
LT
LU
HU
MT
NL
AT
PL
PT
RO
SI
SK
FI
SE
UK
HR
TR
MK
IS
NO
RS
IL
Q3.5 Toujours en ce qui concerne uniquement vos vacances personnelles, combien de fois avez-vous séjourné quatre nuits ou plus dans l'un des types de logements suivants? Dans un autre type de logement
Q3.5 Again thinking only about your personal holidays, how many times did you stay for a minimum of four nights in the following types of accommodation: In another type of location
Q3.5 Und wie häufig haben Sie auf privaten Urlaubsreisen mindestens vier Nächte in einer der folgenden Unterkünfte verbracht? In einer anderen Unterkunft
1 3 5 fois ou plus Ne sait pas
1
1
Flash EB334
2
2
2
Flash EB334
Aucune/ zéro
None/ zero
Nie/Null
Flash EB334
3
3
Flash EB334
4
4
4
1 2 89 0
5 times or more
5-mal oder mehr
Flash EB334
Flash EB334
6 2 2 1
Don't know
Weiß nicht
Flash EB334
5 2 1
2 86 1
5 2 1 1 3 87 1
0
5 1 1 0 1 91 1
7 3
7 3 1 1
4 851 0
2 85 1
2 1 1 0 1 93 2
0
2 1 0 0 0 97 0
5 1
3 2 1 0
1 930 0
1 93 0
5 3 1 1 2 87 1
0
2 1 0 0 0 97 0
4 1
4 1 0 0
1 940 0
5 90 0
7 1 0 0 1 89 2
4
3 1 1 1 1 93 0
5 1
7 1 0 1
1 872 0
1 90 0
7 2 1 1 1 88 0
0
6 2 1 1 3 86 1
5 2
3 2 1 1
1 901 1
2 90 1
5 2 1 0 3 89 0
0
6 3 1 1 4 84 1
4 2
5 2 0 0
2 911 0
1 90 2
4 2 1 1 2 89 1
0
3 2 1 0 2 91 1
6 3
5 3 3 0
1 881 1
2 87 0
2 1 0 0 1 96 0
1
9 3 1 1 2 82 2
2 1
3 0 0 0
1 932 0
1 93 3
6 3 1 0 4 77 9
12

FLASH EUROBAROMETER 334 “Attitudes of Europeans Towards Tourism”
%Flash EB
334
Diff.Flash EB
328
Flash EB334
Diff.Flash EB
Flash EB334
Diff.Flash EB
328
Flash EB334
Diff.Flash EB
328
Flash EB334
Diff.Flash EB
328EU 27 23 -2 45 2 9 0 0 -1 11 1
BE 26 -5 30 14 6 -7 1 -1 20 -1
BG 12 -1 71 4 5 -4 0 0 5 0
CZ 23 -6 42 9 17 9 1 -2 12 1
DK 36 8 17 -10 12 0 0 0 18 7
DE 37 5 24 -6 17 8 0 -1 10 -1
EE 25 5 36 -8 13 4 0 -4 8 -5
IE 12 -7 62 18 6 0 0 0 7 -6
EL 12 -8 70 14 7 -2 0 -1 5 -2
ES 20 -4 53 5 8 0 0 0 10 0
FR 22 -3 38 -2 9 -1 1 1 13 3
IT 29 -9 46 10 7 -6 0 -1 9 -1
CY 26 8 52 7 4 -3 3 1 5 1
LV 13 1 46 -6 12 0 2 1 17 11
LT 25 10 37 -7 8 -2 0 -4 15 6
LU 25 -20 30 6 13 7 2 0 11 0
HU 12 2 66 -4 8 3 1 1 7 1
MT 16 -1 46 -4 6 1 1 -1 10 1
NL 31 2 32 8 7 1 0 0 12 5
AT 37 6 15 -10 14 2 0 -2 17 2
PL 17 -1 51 2 12 1 1 0 9 -2
PT 10 -6 60 2 6 -2 0 0 11 6
RO 15 3 62 -2 10 3 1 1 7 2
SI 34 11 37 -2 13 11 0 0 6 -4
SK 24 4 51 3 8 1 1 0 8 -4
FI 23 2 20 -8 14 4 1 0 24 10
SE 31 8 24 8 7 0 1 0 15 6
UK 19 -3 39 -2 7 1 1 0 14 2
HR 21 -9 55 2 8 0 0 0 8 5
TR 17 -8 41 -6 19 2 0 -1 14 10
MK 21 -4 59 6 8 -5 0 -1 6 3
IS 11 -10 31 -5 13 3 0 -1 16 8
NO 25 18 29 8 12 7 3 3 20 10
RS 40 47 5 0 3
IL 28 32 9 1 12
Q4 Quelle est la principale raison pour laquelle vous n'êtes pas parti(e) en vacances en 2011?
Q4 What was the main reason why you did not go on holiday in 2011?
Q4 Welches war der Hauptgrund dafür, dass Sie 2011 nicht in Urlaub gefahren sind?
Raisons personnelles/privées
Personal/private reasons
Persönliche/private Gründe
Raisons financières
Financial reasons
Finanzielle Gründe
Manque de temps
Lack of time
Zeitmangel
Craintes pour la sécurité
Concerns about safety
Bedenken wegen der Sicherheit
Préférence pour rester à la maison ou avec la famille/les amis
Preferred to stay at home or with family / friends
Ich habe es vorgezogen, zu Hause zu bleiben oder bei der Familie/bei Freunden
13

FLASH EUROBAROMETER 334 “Attitudes of Europeans Towards Tourism”
%Flash EB
334
Diff.Flash EB
328
Flash EB334
Diff.Flash EB
328
Flash EB334
Diff.Flash EB
328
Flash EB334
Diff.Flash EB
328EU 27 1 1 4 1 6 -3 1 1
BE 2 2 7 1 7 -2 1 -1
BG 0 0 2 0 5 1 0 0
CZ 1 1 1 -6 3 -6 0 0
DK 0 0 6 1 9 -8 2 2
DE 0 0 5 -1 6 -4 1 0
EE 0 0 6 2 12 7 0 -1
IE 2 2 2 -4 9 -1 0 -2
EL 1 1 1 -1 4 -1 0 0
ES 1 1 1 -1 7 -1 0 0
FR 1 1 7 4 8 -4 1 1
IT 0 0 5 4 3 2 1 1
CY 0 0 3 -1 6 -14 1 1
LV 1 1 4 0 5 -8 0 0
LT 0 0 0 -4 15 3 0 -2
LU 2 2 4 0 10 2 3 3
HU 1 1 2 0 3 -4 0 0
MT 0 0 12 5 8 -1 1 0
NL 2 2 10 4 5 -21 1 -1
AT 0 0 6 2 9 0 2 0
PL 0 0 2 2 8 -2 0 0
PT 0 0 3 0 10 0 0 0
RO 0 0 1 -1 3 -7 1 1
SI 0 0 4 -1 5 -16 1 1
SK 0 0 1 -6 4 -1 3 3
FI 0 0 11 0 3 -12 4 4
SE 1 1 12 9 7 -27 2 -5
UK 4 4 4 0 11 -1 1 -1
HR 0 0 1 -1 5 2 2 1
TR 1 1 2 1 6 1 0 0
MK 0 0 3 2 2 -1 1 0
IS 2 2 6 0 16 0 5 3
NO 0 0 1 -1 8 -39 2 -6
RS 0 1 2 2
IL 1 6 7 4
Sie wollten 2011 nicht in den Urlaub fahren (NICHT
VORLESEN)
Spontan: Andere (NICHT
VORLESEN)Weiß nicht
Probleme bezüglich der Verfügbarkeit von
Verkehrsmitteln oder einer Unterkunft
Ne sait pas
Problems of accessibility of transport or
accommodation
You did not want to go on holiday in 2011 (DO NOT
READ OUT)
Other (DO NOT READ OUT)
Don't know
Problèmes d'accessibilité des moyens de transport
ou d'un logement
Vous n'aviez pas envie de partir en vacances en 2011
(NE PAS LIRE)
Autre (NE PAS LIRE)
Q4 Quelle est la principale raison pour laquelle vous n'êtes pas parti(e) en vacances en 2011?
Q4 What was the main reason why you did not go on holiday in 2011?
Q4 Welches war der Hauptgrund dafür, dass Sie 2011 nicht in Urlaub gefahren sind?
14
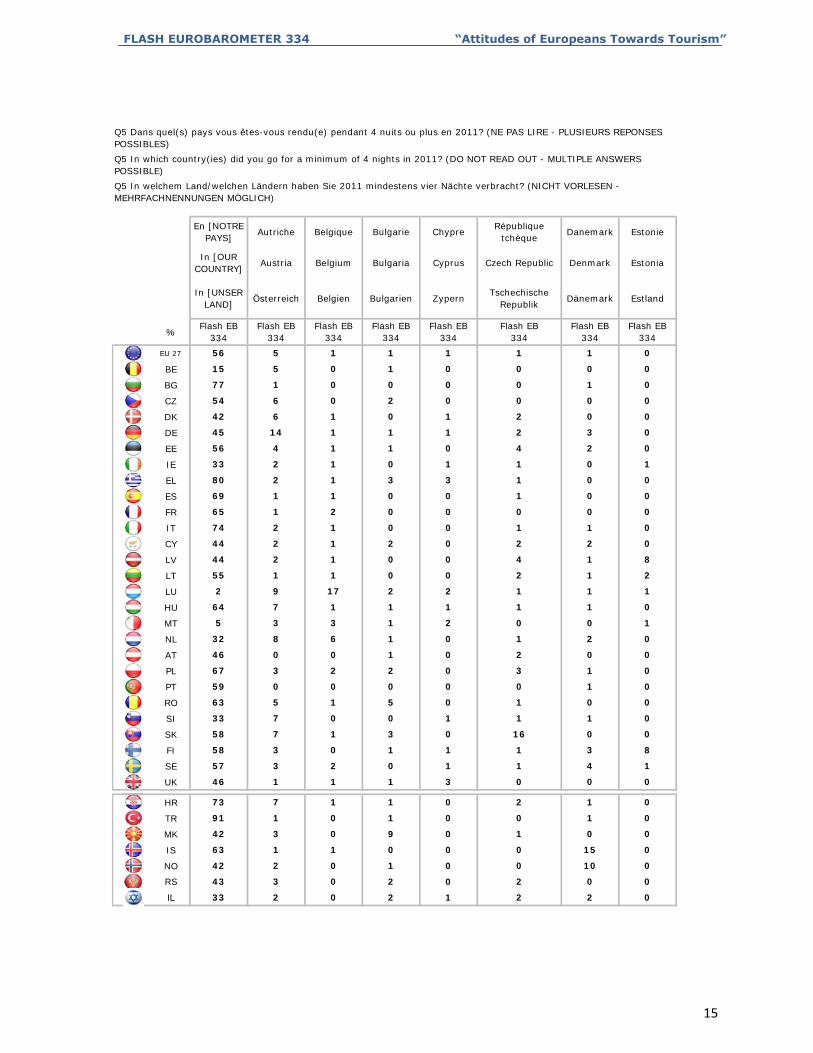
FLASH EUROBAROMETER 334 “Attitudes of Europeans Towards Tourism”
%
EU 27
BE
BG
CZ
DK
DE
EE
IE
EL
ES
FR
IT
CY
LV
LT
LU
HU
MT
NL
AT
PL
PT
RO
SI
SK
FI
SE
UK
HR
TR
MK
IS
NO
RS
IL
Q5 Dans quel(s) pays vous êtes-vous rendu(e) pendant 4 nuits ou plus en 2011? (NE PAS LIRE - PLUSIEURS REPONSES POSSIBLES)
Q5 In which country(ies) did you go for a minimum of 4 nights in 2011? (DO NOT READ OUT - MULTIPLE ANSWERS POSSIBLE)
Q5 In welchem Land/welchen Ländern haben Sie 2011 mindestens vier Nächte verbracht? (NICHT VORLESEN - MEHRFACHNENNUNGEN MÖGLICH)
Autriche
Austria
Österreich
Flash EB334
En [NOTRE PAYS]
In [OUR COUNTRY]
In [UNSER LAND]
Flash EB334
Bulgarie
Bulgaria
Bulgarien
Flash EB334
Belgique
Belgium
Belgien
Flash EB334
République tchèque
Czech Republic
Tschechische Republik
Flash EB334
Chypre
Cyprus
Zypern
Flash EB334
Estonie
Estonia
Estland
Flash EB334
Danemark
Denmark
Dänemark
Flash EB334
56 5 1 1 1 1 1 0
15 5 0 1 0 0 0 0
0 0 1 077 1 0 0
54 6 0 2 0 0 0 0
42 6 1 0 1 2 0 0
45 14 1 1 1 2 3 0
0 4 2 056 4 1 1
33 2 1 0 1 1 0 1
80 2 1 3 3 1 0 0
69 1 1 0 0 1 0 0
0 0 0 065 1 2 0
74 2 1 0 0 1 1 0
44 2 1 2 0 2 2 0
44 2 1 0 0 4 1 8
0 2 1 255 1 1 0
2 9 17 2 2 1 1 1
64 7 1 1 1 1 1 0
5 3 3 1 2 0 0 1
0 1 2 032 8 6 1
46 0 0 1 0 2 0 0
67 3 2 2 0 3 1 0
59 0 0 0 0 0 1 0
0 1 0 063 5 1 5
33 7 0 0 1 1 1 0
58 7 1 3 0 16 0 0
58 3 0 1 1 1 3 8
1 1 4 157 3 2 0
46 1 1 1 3 0 0 0
73 7 1 1 0 2 1 0
91 1 0 1 0 0 1 0
0 1 0 042 3 0 9
63 1 1 0 0 0 15 0
42 2 0 1 0 0 10 0
43 3 0 2 0 2 0 0
1 2 2 033 2 0 2
15

FLASH EUROBAROMETER 334 “Attitudes of Europeans Towards Tourism”
%
EU 27
BE
BG
CZ
DK
DE
EE
IE
EL
ES
FR
IT
CY
LV
LT
LU
HU
MT
NL
AT
PL
PT
RO
SI
SK
FI
SE
UK
HR
TR
MK
IS
NO
RS
IL 9 00 10 12 7 2 1
16 4 0 3 00 2 7
6 01 6 5 9 2 1
2 1 1 3 02 3 7
4 00 2 6 20 0 0
1 0 0 1 00 2 2
9 00 3 5 0 2 0
5 0 2 5 00 12 4
10 03 8 8 7 1 0
6 2 0 7 20 4 8
9 00 3 4 4 7 1
5 1 1 11 11 5 6
10 00 3 9 5 7 0
0 0 0 4 00 11 3
5 00 3 11 3 1 0
6 4 1 26 01 7 16
14 00 22 17 4 1 1
3 0 2 37 00 11 12
6 00 1 8 4 0 1
4 0 1 18 01 27 20
6 120 6 9 3 1 2
1 0 1 9 03 4 17
5 00 4 5 50 2 0
3 0 1 0 00 7 3
8 00 0 3 2 1 1
2 1 1 7 01 8 3
3 00 3 6 0 1 0
3 0 0 9 00 13 3
3 721 6 7 3 1 1
4 2 1 18 00 8 0
14 00 10 16 5 1 1
7 3 1 12 00 5 8
1 00 3 3 10 0 0
5 2 1 13 00 40 8
9 00 8 5 4 1 1
Flash EB334
Flash EB334
Flash EB334
Flash EB334
Flash EB334
Flash EB334
Flash EB334
Flash EB334
Italien LettlandFinnland Frankreich Deutschland Griechenland Ungarn Irland
Greece Hungary Ireland Italy LatviaFinland France Germany
Italie LettonieFinlande France Allemagne Grèce Hongrie Irlande
Q5 Dans quel(s) pays vous êtes-vous rendu(e) pendant 4 nuits ou plus en 2011? (NE PAS LIRE - PLUSIEURS REPONSES POSSIBLES)
Q5 In which country(ies) did you go for a minimum of 4 nights in 2011? (DO NOT READ OUT - MULTIPLE ANSWERS POSSIBLE)
Q5 In welchem Land/welchen Ländern haben Sie 2011 mindestens vier Nächte verbracht? (NICHT VORLESEN - MEHRFACHNENNUNGEN MÖGLICH)
16
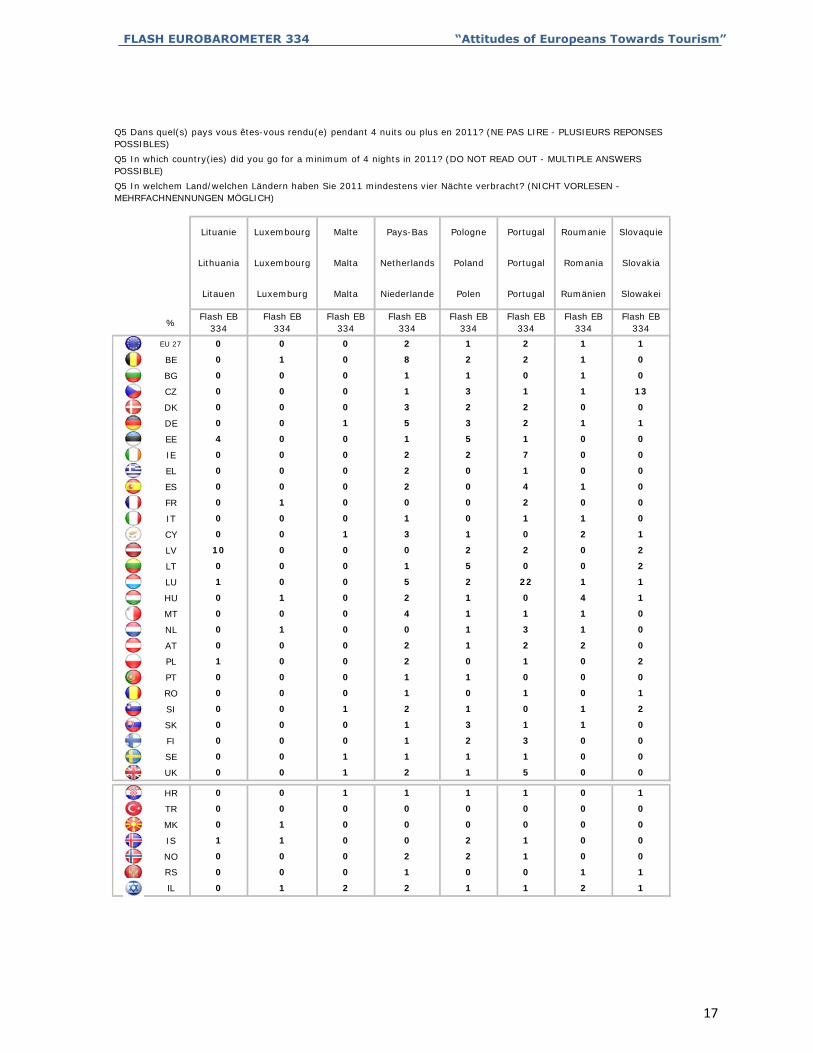
FLASH EUROBAROMETER 334 “Attitudes of Europeans Towards Tourism”
%
EU 27
BE
BG
CZ
DK
DE
EE
IE
EL
ES
FR
IT
CY
LV
LT
LU
HU
MT
NL
AT
PL
PT
RO
SI
SK
FI
SE
UK
HR
TR
MK
IS
NO
RS
IL 1 1 2 10 1 2 2
10 0 1 0 0 10
2 1 0 00 0 0 2
01 0 0 2 1 01
0 0 0 00 1 0 0
00 0 0 0 0 00
1 1 0 10 0 1 1
00 1 2 1 5 00
1 1 0 00 0 1 1
00 0 1 2 3 00
3 1 1 00 0 0 1
20 1 2 1 0 10
0 1 0 10 0 0 1
00 0 1 1 0 00
0 1 0 21 0 0 2
00 0 2 1 2 20
1 3 1 00 1 0 0
00 0 4 1 1 10
1 0 4 10 1 0 2
10 0 5 2 22 11
5 0 0 20 0 0 1
20 0 0 2 2 010
1 0 2 10 0 1 3
00 0 1 0 1 10
0 2 0 00 1 0 0
00 0 2 0 4 10
0 1 0 00 0 0 2
00 0 2 2 7 00
5 1 0 04 0 0 1
10 1 5 3 2 10
2 2 0 00 0 0 3
130 0 1 3 1 10
1 0 1 00 0 0 1
01 0 8 2 2 10
1 2 1 10 0 0 2
Flash EB334
Flash EB334
Flash EB334
Flash EB334
Flash EB334
Flash EB334
Flash EB334
Flash EB334
Polen Portugal Rumänien SlowakeiLitauen Luxemburg Malta Niederlande
SlovakiaLuxembourg Malta Netherlands Poland Portugal RomaniaLithuania
Pologne Portugal Roumanie SlovaquieLituanie Luxembourg Malte Pays-Bas
Q5 Dans quel(s) pays vous êtes-vous rendu(e) pendant 4 nuits ou plus en 2011? (NE PAS LIRE - PLUSIEURS REPONSES POSSIBLES)
Q5 In which country(ies) did you go for a minimum of 4 nights in 2011? (DO NOT READ OUT - MULTIPLE ANSWERS POSSIBLE)
Q5 In welchem Land/welchen Ländern haben Sie 2011 mindestens vier Nächte verbracht? (NICHT VORLESEN - MEHRFACHNENNUNGEN MÖGLICH)
17
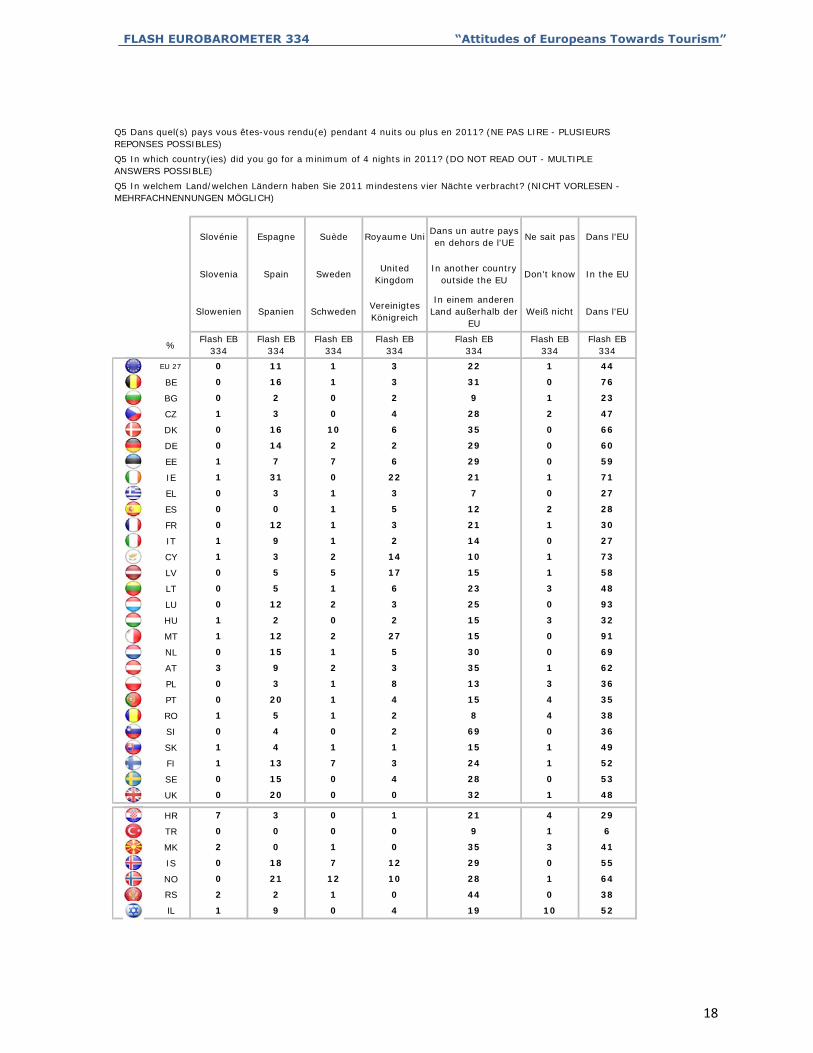
FLASH EUROBAROMETER 334 “Attitudes of Europeans Towards Tourism”
%
EU 27
BE
BG
CZ
DK
DE
EE
IE
EL
ES
FR
IT
CY
LV
LT
LU
HU
MT
NL
AT
PL
PT
RO
SI
SK
FI
SE
UK
HR
TR
MK
IS
NO
RS
IL 0 4 19 10 521 9
0 382 2 1 0 44
12 10 28 1 640 21
0 550 18 7 12 29
1 0 35 3 412 0
1 60 0 0 0 9
0 1 21 4 297 3
1 480 20 0 0 32
0 4 28 0 530 15
1 521 13 7 3 24
1 1 15 1 491 4
0 360 4 0 2 69
1 2 8 4 381 5
4 350 20 1 4 15
1 8 13 3 360 3
1 623 9 2 3 35
1 5 30 0 690 15
0 911 12 2 27 15
0 2 15 3 321 2
0 930 12 2 3 25
1 6 23 3 480 5
1 580 5 5 17 15
2 14 10 1 731 3
0 271 9 1 2 14
1 3 21 1 300 12
2 280 0 1 5 12
1 3 7 0 270 3
1 711 31 0 22 21
7 6 29 0 591 7
0 600 14 2 2 29
10 6 35 0 660 16
2 471 3 0 4 28
0 2 9 1 230 2
0 760 16 1 3 31
1 3 22 1 440 11
Flash EB334
Flash EB334
Flash EB334
Flash EB334
Flash EB334
Flash EB334
Flash EB334
SchwedenVereinigtes Königreich
In einem anderen Land außerhalb der
EUWeiß nicht Dans l'EUSlowenien Spanien
Don't know In the EUSlovenia Spain SwedenUnited
KingdomIn another country
outside the EU
Suède Royaume UniDans un autre pays en dehors de l'UE
Ne sait pas Dans l'EUSlovénie Espagne
Q5 Dans quel(s) pays vous êtes-vous rendu(e) pendant 4 nuits ou plus en 2011? (NE PAS LIRE - PLUSIEURS REPONSES POSSIBLES)
Q5 In which country(ies) did you go for a minimum of 4 nights in 2011? (DO NOT READ OUT - MULTIPLE ANSWERS POSSIBLE)
Q5 In welchem Land/welchen Ländern haben Sie 2011 mindestens vier Nächte verbracht? (NICHT VORLESEN - MEHRFACHNENNUNGEN MÖGLICH)
18

FLASH EUROBAROMETER 334 “Attitudes of Europeans Towards Tourism”
%
EU 27
BE
BG
CZ
DK
DE
EE
IE
EL
ES
FR
IT
CY
LV
LT
LU
HU
MT
NL
AT
PL
PT
RO
SI
SK
FI
SE
UK
HR
TR
MK
IS
NO
RS
IL
Q5A Dans quel(s) pays vous êtes-vous rendu(e) pendant 4 nuits ou plus en 2011? (NE PAS LIRE - PLUSIEURS REPONSES POSSIBLES)
Q5A In which country(ies) did you go for a minimum of 4 nights in 2011? (DO NOT READ OUT - MULTIPLE ANSWERS POSSIBLE)
Q5A In welchem Land/welchen Ländern haben Sie 2011 mindestens vier Nächte verbracht? (NICHT VORLESEN - MEHRFACHNENNUNGEN MÖGLICH)
Belgique
Belgium
Belgien
Flash EB334
Autriche
Austria
Österreich
Flash EB334
Chypre
Cyprus
Zypern
Flash EB334
Bulgarie
Bulgaria
Bulgarien
Flash EB334
Danemark
Denmark
Dänemark
Flash EB334
République tchèque
Czech Republic
Tschechische Republik
Flash EB334
Finlande
Finland
Finnland
Flash EB334
Estonie
Estonia
Estland
Flash EB334
2 2 0 15 2 2 1
0 05 15 1 0 0 0
1 0 77 0 0 1 0 0
0 06 0 2 0 54 0
6 1 0 1 2 42 0 0
0 014 1 1 1 2 3
4 1 1 0 4 2 56 21
1 02 1 0 1 1 0
2 1 3 3 1 0 0 0
0 11 1 0 0 1 0
1 2 0 0 0 0 0 0
0 02 1 0 0 1 1
2 1 2 44 2 2 0 0
8 32 1 0 0 4 1
1 1 0 0 2 1 2 0
1 19 17 2 2 1 1
7 1 1 1 1 1 0 0
1 03 3 1 2 0 0
8 6 1 0 1 2 0 0
0 146 0 1 0 2 0
3 2 2 0 3 1 0 0
0 00 0 0 0 0 1
5 1 5 0 1 0 0 0
0 17 0 0 1 1 1
7 1 3 0 16 0 0 0
8 583 0 1 1 1 3
3 2 0 1 1 4 1 3
0 01 1 1 3 0 0
7 1 1 0 2 1 0 0
0 01 0 1 0 0 1
3 0 9 0 1 0 0 0
0 21 1 0 0 0 15
2 0 1 0 0 10 0 1
0 03 0 2 0 2 0
2 0 2 1 2 2 0 0
19

FLASH EUROBAROMETER 334 “Attitudes of Europeans Towards Tourism”
%
EU 27
BE
BG
CZ
DK
DE
EE
IE
EL
ES
FR
IT
CY
LV
LT
LU
HU
MT
NL
AT
PL
PT
RO
SI
SK
FI
SE
UK
HR
TR
MK
IS
NO
RS
IL 1 9 0 010 12 7 2
0 3 0 02 7 16 4
1 6 0 06 5 9 2
1 3 0 13 7 2 1
0 4 0 02 6 20 0
0 1 0 02 2 1 0
0 9 0 03 5 0 2
2 5 0 012 4 5 0
0 10 0 08 8 7 1
0 7 2 04 8 6 2
1 9 0 03 4 4 7
1 11 1 05 6 5 1
0 10 0 03 9 5 7
0 4 0 011 3 0 0
0 5 0 13 11 3 1
1 26 0 07 16 6 4
1 14 0 022 17 4 1
2 37 0 011 12 3 0
1 6 0 01 8 4 64
1 18 0 127 20 4 0
2 6 12 556 9 3 1
1 9 44 104 17 1 0
0 5 0 04 5 50 2
1 74 0 07 3 3 0
1 8 0 065 3 2 1
1 7 0 08 3 2 1
0 3 0 03 6 80 1
33 9 0 013 3 3 0
1 3 7 46 7 3 1
1 18 0 08 45 4 2
1 14 0 010 16 5 1
1 12 0 05 8 7 3
0 1 0 03 3 10 0
1 13 0 040 8 5 2
1 17 0 016 13 5 2
Flash EB334
Flash EB334
Flash EB334
Flash EB334
Flash EB334
Flash EB334
Flash EB334
Flash EB334
Irland Italien Lettland LitauenFrankreich Deutschland Griechenland Ungarn
Ireland Italy Latvia LithuaniaFrance Germany Greece Hungary
Lettonie LituanieFrance Allemagne Grèce Hongrie Irlande Italie
Q5A Dans quel(s) pays vous êtes-vous rendu(e) pendant 4 nuits ou plus en 2011? (NE PAS LIRE - PLUSIEURS REPONSES POSSIBLES)
Q5A In which country(ies) did you go for a minimum of 4 nights in 2011? (DO NOT READ OUT - MULTIPLE ANSWERS POSSIBLE)
Q5A In welchem Land/welchen Ländern haben Sie 2011 mindestens vier Nächte verbracht? (NICHT VORLESEN - MEHRFACHNENNUNGEN MÖGLICH)
20
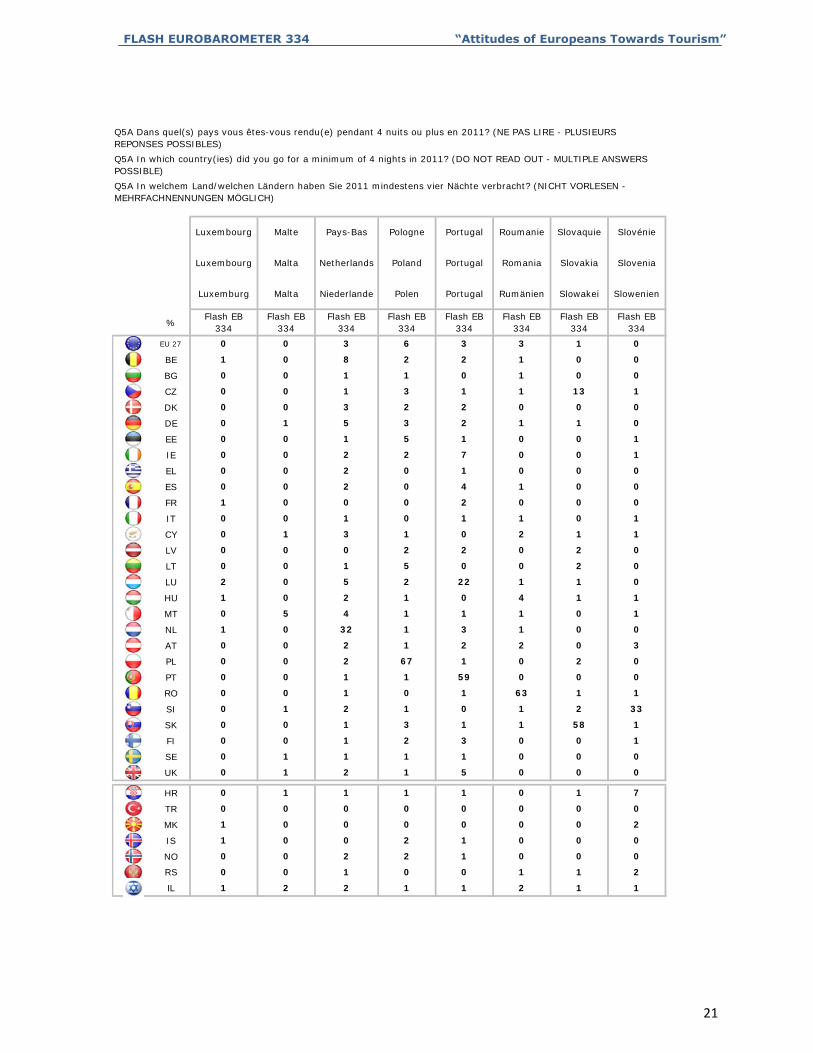
FLASH EUROBAROMETER 334 “Attitudes of Europeans Towards Tourism”
%
EU 27
BE
BG
CZ
DK
DE
EE
IE
EL
ES
FR
IT
CY
LV
LT
LU
HU
MT
NL
AT
PL
PT
RO
SI
SK
FI
SE
UK
HR
TR
MK
IS
NO
RS
IL 2 1 1 2 1 11 2
1 0 0 1 1 20 0
2 2 1 0 0 00 0
0 2 1 0 0 01 0
0 0 0 0 0 21 0
0 0 0 0 0 00 0
1 1 1 0 1 70 1
2 1 5 0 0 00 1
1 1 1 0 0 00 1
1 2 3 0 0 10 0
1 3 1 1 58 10 0
2 1 0 1 2 330 1
1 0 1 63 1 10 0
1 1 59 0 0 00 0
2 67 1 0 2 00 0
2 1 2 2 0 30 0
32 1 3 1 0 01 0
4 1 1 1 0 10 5
2 1 0 4 1 11 0
5 2 22 1 1 02 0
1 5 0 0 2 00 0
0 2 2 0 2 00 0
3 1 0 2 1 10 1
1 0 1 1 0 10 0
0 0 2 0 0 01 0
2 0 4 1 0 00 0
2 0 1 0 0 00 0
2 2 7 0 0 10 0
1 5 1 0 0 10 0
5 3 2 1 1 00 1
3 2 2 0 0 00 0
1 3 1 1 13 10 0
1 1 0 1 0 00 0
8 2 2 1 0 01 0
3 6 3 3 1 00 0
Flash EB334
Flash EB334
Flash EB334
Flash EB334
Flash EB334
Flash EB334
Flash EB334
Flash EB334
Niederlande Polen Portugal Rumänien Slowakei SlowenienLuxemburg Malta
Netherlands Poland Portugal Romania Slovakia SloveniaLuxembourg Malta
Portugal Roumanie Slovaquie SlovénieLuxembourg Malte Pays-Bas Pologne
Q5A Dans quel(s) pays vous êtes-vous rendu(e) pendant 4 nuits ou plus en 2011? (NE PAS LIRE - PLUSIEURS REPONSES POSSIBLES)
Q5A In which country(ies) did you go for a minimum of 4 nights in 2011? (DO NOT READ OUT - MULTIPLE ANSWERS POSSIBLE)
Q5A In welchem Land/welchen Ländern haben Sie 2011 mindestens vier Nächte verbracht? (NICHT VORLESEN - MEHRFACHNENNUNGEN MÖGLICH)
21

FLASH EUROBAROMETER 334 “Attitudes of Europeans Towards Tourism”
%
EU 27
BE
BG
CZ
DK
DE
EE
IE
EL
ES
FR
IT
CY
LV
LT
LU
HU
MT
NL
AT
PL
PT
RO
SI
SK
FI
SE
UK
HR
TR
MK
IS
NO
RS
IL 9 0 4 49 10 52
2 1 0 78 0 38
21 12 10 64 1 64
18 7 12 79 0 55
0 1 0 72 3 41
0 0 0 96 1 6
3 0 1 84 4 29
20 0 46 32 1 83
15 57 4 28 0 88
13 7 3 24 1 91
4 1 1 15 1 90
4 0 2 69 0 61
5 1 2 8 4 93
20 1 4 15 4 87
3 1 8 13 3 92
9 2 3 35 1 87
15 1 5 30 0 88
12 2 27 15 0 95
2 0 2 15 3 89
12 2 3 25 0 94
5 1 6 23 3 89
5 5 17 15 1 90
3 2 14 10 1 96
9 1 2 14 0 92
12 1 3 21 1 88
69 1 5 12 2 91
3 1 3 7 0 97
31 0 22 21 1 91
7 7 6 29 0 91
14 2 2 29 0 89
16 10 6 35 0 87
3 0 4 28 2 86
2 0 2 9 1 94
16 1 3 31 0 85
17 3 10 22 1 89
Flash EB334
Flash EB334
Flash EB334
Flash EB334
Flash EB334
Flash EB334
Spanien SchwedenVereinigtes Königreich
In einem anderen Land außerhalb der
EUWeiß nicht Dans l'EU
Spain SwedenUnited
KingdomIn another country
outside the EUDon't know In the EU
Royaume UniDans un autre pays en dehors de l'UE
Ne sait pas Dans l'EUEspagne Suède
Q5A Dans quel(s) pays vous êtes-vous rendu(e) pendant 4 nuits ou plus en 2011? (NE PAS LIRE - PLUSIEURS REPONSES POSSIBLES)
Q5A In which country(ies) did you go for a minimum of 4 nights in 2011? (DO NOT READ OUT - MULTIPLE ANSWERS POSSIBLE)
Q5A In welchem Land/welchen Ländern haben Sie 2011 mindestens vier Nächte verbracht? (NICHT VORLESEN - MEHRFACHNENNUNGEN MÖGLICH)
22
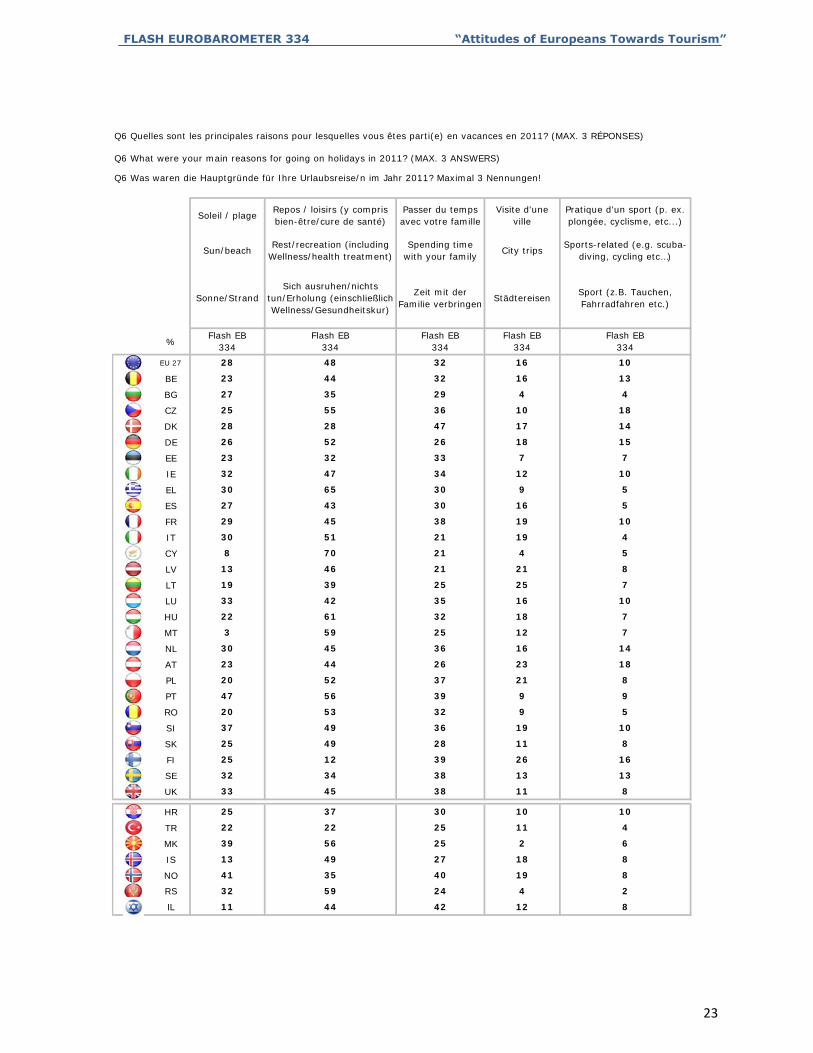
FLASH EUROBAROMETER 334 “Attitudes of Europeans Towards Tourism”
%
EU 27
BE
BG
CZ
DK
DE
EE
IE
EL
ES
FR
IT
CY
LV
LT
LU
HU
MT
NL
AT
PL
PT
RO
SI
SK
FI
SE
UK
HR
TR
MK
IS
NO
RS
IL
Q6 Quelles sont les principales raisons pour lesquelles vous êtes parti(e) en vacances en 2011? (MAX. 3 RÉPONSES)
Q6 What were your main reasons for going on holidays in 2011? (MAX. 3 ANSWERS)
Q6 Was waren die Hauptgründe für Ihre Urlaubsreise/n im Jahr 2011? Maximal 3 Nennungen!
Soleil / plage
Sun/beach
Sonne/Strand
Flash EB334
Passer du temps avec votre famille
Spending time with your family
Zeit mit der Familie verbringen
Flash EB334
Repos / loisirs (y compris bien-être/cure de santé)
Rest/recreation (including Wellness/health treatment)
Sich ausruhen/nichts tun/Erholung (einschließlich Wellness/Gesundheitskur)
Flash EB334
Pratique d'un sport (p. ex. plongée, cyclisme, etc...)
Sports-related (e.g. scuba-diving, cycling etc…)
Sport (z.B. Tauchen, Fahrradfahren etc.)
Flash EB334
Visite d'une ville
City trips
Städtereisen
Flash EB334
28 48 32 16 10
23 44 32 16 13
27 35 29 4 4
25 55 36 10 18
28 28 47 17 14
26 52 26 18 15
23 32 33 7 7
32 47 34 12 10
30 65 30 9 5
27 43 30 16 5
29 45 38 19 10
30 51 21 19 4
8 70 21 4 5
13 46 21 21 8
19 39 25 25 7
33 42 35 16 10
22 61 32 18 7
3 59 25 12 7
30 45 36 16 14
23 44 26 23 18
20 52 37 21 8
47 56 39 9 9
20 53 32 9 5
37 49 36 19 10
25 49 28 11 8
25 12 39 26 16
32 34 38 13 13
33 45 38 11 8
25 37 30 10 10
22 22 25 11 4
39 56 25 2 6
13 49 27 18 8
41 35 40 19 8
32 59 24 4 2
11 44 42 12 8
23

FLASH EUROBAROMETER 334 “Attitudes of Europeans Towards Tourism”
%
EU 27
BE
BG
CZ
DK
DE
EE
IE
EL
ES
FR
IT
CY
LV
LT
LU
HU
MT
NL
AT
PL
PT
RO
SI
SK
FI
SE
UK
HR
TR
MK
IS
NO
RS
IL 5 2
6 0
27 12 21
3 1
22 11 26
2 1
15 10 29
3 0
12 10 33
14 0
13 6 20
5 1
12 10 41
4 0
13 11 38
3 1
12 7 28
2 1
13 13 39
1 2
18 18 35
1 1
19 10 26
5 1
14 5 18
1 1
12 6 32
3 2
18 15 31
4 0
22 8 28
1 0
21 26 26
12 1
27 22 26
5 0
19 16 16
1 0
15 9 26
4 0
16 16 26
4 0
18 10 31
10 0
19 13 46
3 0
7 6 27
1 1
13 16 22
2 0
18 11 36
5 0
17 17 31
3 0
13 5 30
6 1
6 8 30
2 0
22 18 49
3 0
23 21 25
2 0
24 18 25
4 2
32 15 24
1 1
18 5 31
3 1
22 22 24
Flash EB334
Flash EB334
18 14 28
Andere (NICHT VORLESEN)
Weiß nicht
Flash EB334
Flash EB334
Flash EB334
Other (DO NOT READ OUT)
Don't know
Natur (Berge, Seen, Landschaft etc.)
Kultur/ReligionFreunde/Verwand
te besuchen
Autre (NE PAS LIRE)
Ne sait pas
Nature (mountain, lake, landscape etc…)
Culture / religionVisiting friends /
relatives
Nature (montagne, lac, paysage, etc...)
Culture / religionVisite d'amis / de membres de la
famille
Q6 Quelles sont les principales raisons pour lesquelles vous êtes parti(e) en vacances en 2011? (MAX. 3 RÉPONSES)
Q6 What were your main reasons for going on holidays in 2011? (MAX. 3 ANSWERS)
Q6 Was waren die Hauptgründe für Ihre Urlaubsreise/n im Jahr 2011? Maximal 3 Nennungen!
24

FLASH EUROBAROMETER 334 “Attitudes of Europeans Towards Tourism”
%
EU 27
BE
BG
CZ
DK
DE
EE
IE
EL
ES
FR
IT
CY
LV
LT
LU
HU
MT
NL
AT
PL
PT
RO
SI
SK
FI
SE
UK
HR
TR
MK
IS
NO
RS
IL
Q7.1 Combien de fois avez-vous utilisé les moyens de transport suivants pour vous rendre à votre destination de vacances en 2011? (ENQ. : Un aller et retour doit être comptabilisé comme UNE FOIS)Avion
Q7.1 How many times did you use the following means of transport to travel to your holiday destination in 2011…? (INT. : One back and forth should be counted as ONE TIME)Airplane
Q7.1 Wie häufig haben Sie 2011 die folgenden Transportmittel genutzt, um zu Ihrem Urlaubsziel zu reisen? INT.: Eine einfache Hin- und Rückreise gilt als EINMALIGE Nutzung)Flugzeug
1 3 5 fois ou plus Ne sait pas
1
1
Flash EB334
2
2
2
Flash EB334
Aucune/ zéro
None/ zero
Nie/Null
Flash EB334
3
3
Flash EB334
4
4
4
3 4 54 0
5 times or more
5-mal oder häufiger
Flash EB334
Flash EB334
33 11 5 1
Don't know
Weiß nicht
Flash EB334
24 11 4
3 47 0
7 5 1 1 1 85 0
0
30 17 7 3 5 37 1
18 5
26 11 4 2
2 731 1
4 53 0
32 11 3 1 6 47 0
0
19 8 3 3 5 62 0
33 22
24 11 4 2
10 1911 5
6 53 0
20 10 3 2 3 62 0
1
33 19 13 5 7 23 0
19 11
24 12 6 4
3 585 3
4 49 1
14 11 2 3 3 67 0
0
11 4 1 0 1 83 0
31 17
53 27 5 5
7 347 4
3 7 0
28 13 6 3 2 48 0
0
15 4 2 1 2 75 1
28 11
21 10 4 1
4 495 3
3 61 0
10 6 2 2 3 77 0
0
16 7 2 1 1 73 0
13 6
27 16 9 5
3 743 1
7 36 0
32 14 9 6 6 33 0
0
8 4 3 2 2 81 0
32 16
11 7 3 5
7 327 6
5 69 0
7 7 1 1 0 84 0
0
24 20 11 7 15 22 1
32 22
13 3 0 0
11 239 3
0 84 0
33 21 5 4 8 28 1
25

FLASH EUROBAROMETER 334 “Attitudes of Europeans Towards Tourism”
%
EU 27
BE
BG
CZ
DK
DE
EE
IE
EL
ES
FR
IT
CY
LV
LT
LU
HU
MT
NL
AT
PL
PT
RO
SI
SK
FI
SE
UK
HR
TR
MK
IS
NO
RS
IL
Q7.2 Combien de fois avez-vous utilisé les moyens de transport suivants pour vous rendre à votre destination de vacances en 2011? (ENQ. : Un aller et retour doit être comptabilisé comme UNE FOIS)Bateau
Q7.2 How many times did you use the following means of transport to travel to your holiday destination in 2011…? (INT. : One back and forth should be counted as ONE TIME)Boat
Q7.2 Wie häufig haben Sie 2011 die folgenden Transportmittel genutzt, um zu Ihrem Urlaubsziel zu reisen? INT.: Eine einfache Hin- und Rückreise gilt als EINMALIGE Nutzung)Schiff
1 3 5 fois ou plus Ne sait pas
1
1
Flash EB334
2
2
2
Flash EB334
Aucune/ zéro
None/ zero
Nie/Null
Flash EB334
3
3
Flash EB334
4
4
4
1 1 86 0
5 times or more
5-mal oder häufiger
Flash EB334
Flash EB334
6 1 1 0
Don't know
Weiß nicht
Flash EB334
10 2 0
1 90 1
2 2 0 0 1 95 0
0
14 4 2 1 3 75 1
7 1
9 3 0 1
1 910 0
0 87 0
20 14 4 3 7 52 0
0
26 7 2 2 3 60 0
13 5
8 1 0 1
0 811 0
1 89 0
8 1 0 0 1 90 0
1
8 2 0 0 1 89 0
10 2
10 8 1 0
1 860 0
1 80 0
5 1 0 0 1 93 0
0
5 2 0 0 0 93 0
9 3
21 2 0 1
0 871 0
1 73 2
11 1 0 0 1 86 1
0
3 1 1 0 0 94 1
7 1
3 2 0 0
1 910 0
2 93 0
3 3 0 0 2 92 0
1
5 1 0 0 0 94 0
7 1
25 12 3 3
1 900 0
3 54 0
20 6 2 1 3 67 1
0
15 5 3 3 4 70 0
15 3
8 4 1 1
0 810 1
3 82 1
10 0 0 0 0 90 0
0
18 8 2 2 4 66 0
12 1
2 0 0 0
2 831 1
1 97 0
6 2 0 0 2 88 2
26

FLASH EUROBAROMETER 334 “Attitudes of Europeans Towards Tourism”
%
EU 27
BE
BG
CZ
DK
DE
EE
IE
EL
ES
FR
IT
CY
LV
LT
LU
HU
MT
NL
AT
PL
PT
RO
SI
SK
FI
SE
UK
HR
TR
MK
IS
NO
RS
IL
Q7.3 Combien de fois avez-vous utilisé les moyens de transport suivants pour vous rendre à votre destination de vacances en 2011? (ENQ. : Un aller et retour doit être comptabilisé comme UNE FOIS)Train
Q7.3 How many times did you use the following means of transport to travel to your holiday destination in 2011…? (INT. : One back and forth should be counted as ONE TIME)Train
Q7.3 Wie häufig haben Sie 2011 die folgenden Transportmittel genutzt, um zu Ihrem Urlaubsziel zu reisen? INT.: Eine einfache Hin- und Rückreise gilt als EINMALIGE Nutzung)Zug
1 3 5 fois ou plus Ne sait pas
1
1
Flash EB334
2
2
2
Flash EB334
Aucune/ zéro
None/ zero
Nie/Null
Flash EB334
3
3
Flash EB334
4
4
4
2 5 71 0
5 times or more
5-mal oder häufigerFlash EB
334Flash EB
334
9 4 3 1
Don't know
Weiß nicht
Flash EB334
12 7 3
3 80 0
7 6 4 1 8 74 0
1
10 3 2 1 4 79 1
8 5
14 6 3 3
9 723 2
4 70 0
8 2 5 0 5 80 0
1
5 2 1 0 3 89 0
11 6
12 8 3 2
3 762 1
3 72 0
13 10 3 2 8 64 0
0
3 3 0 0 4 90 0
15 4
6 8 5 2
4 742 1
6 73 0
9 3 0 2 3 83 0
0
7 5 3 2 8 75 0
17 5
13 3 1 0
4 722 0
3 79 1
11 3 2 1 2 81 0
0
8 7 4 1 7 72 1
10 7
9 3 2 1
3 763 1
4 81 0
11 6 5 2 9 67 0
1
8 4 4 1 11 72 0
5 2
14 10 4 2
1 892 0
8 62 0
14 7 3 2 7 66 1
0
8 6 2 1 5 78 0
14 8
5 4 1 1
5 683 2
4 85 0
5 4 1 0 2 88 0
1
8 4 2 2 3 80 1
10 6
8 1 0 0
2 781 2
1 90 0
6 8 4 1 10 69 2
27

FLASH EUROBAROMETER 334 “Attitudes of Europeans Towards Tourism”
%
EU 27
BE
BG
CZ
DK
DE
EE
IE
EL
ES
FR
IT
CY
LV
LT
LU
HU
MT
NL
AT
PL
PT
RO
SI
SK
FI
SE
UK
HR
TR
MK
IS
NO
RS
IL
Q7.4 Combien de fois avez-vous utilisé les moyens de transport suivants pour vous rendre à votre destination de vacances en 2011? (ENQ. : Un aller et retour doit être comptabilisé comme UNE FOIS)Autocar
Q7.4 How many times did you use the following means of transport to travel to your holiday destination in 2011…? (INT. : One back and forth should be counted as ONE TIME)Bus
Q7.4 Wie häufig haben Sie 2011 die folgenden Transportmittel genutzt, um zu Ihrem Urlaubsziel zu reisen? INT.: Eine einfache Hin- und Rückreise gilt als EINMALIGE Nutzung)Bus
1 3 5 fois ou plus Ne sait pas
1
1
Flash EB334
2
2
2
Flash EB334
Aucune/ zéro
None/ zero
Nie/Null
Flash EB334
3
3
Flash EB334
4
4
4
1 4 80 0
5 times or more
5-mal oder häufigerFlash EB
334Flash EB
334
8 2 1 0
Don't know
Weiß nicht
Flash EB334
9 4 2
1 87 1
13 7 5 3 14 58 0
0
9 3 1 0 2 84 1
17 5
11 4 1 1
11 642 1
1 82 0
13 8 4 1 17 57 0
0
10 5 4 2 6 73 0
9 5
9 4 3 2
4 792 1
4 78 0
6 2 0 1 2 89 0
0
8 1 2 0 6 83 0
8 2
11 11 7 5
1 881 0
14 52 0
11 5 3 2 14 65 0
0
11 5 3 3 10 68 0
16 2
23 5 0 1
1 801 0
3 67 1
6 2 0 0 1 91 0
0
13 6 3 2 9 66 1
9 4
10 4 1 1
2 822 1
5 79 0
10 6 5 2 8 69 0
1
12 6 2 2 11 67 0
12 3
12 7 2 2
2 811 0
7 70 0
11 7 1 1 4 75 1
0
17 8 3 2 9 61 0
10 5
18 14 5 4
4 781 2
23 34 2
16 12 4 6 12 49 1
1
12 6 2 1 3 76 0
9 6
31 5 3 2
4 790 1
4 55 0
10 4 0 1 19 62 4
28

FLASH EUROBAROMETER 334 “Attitudes of Europeans Towards Tourism”
%
EU 27
BE
BG
CZ
DK
DE
EE
IE
EL
ES
FR
IT
CY
LV
LT
LU
HU
MT
NL
AT
PL
PT
RO
SI
SK
FI
SE
UK
HR
TR
MK
IS
NO
RS
IL
Q7.5 Combien de fois avez-vous utilisé les moyens de transport suivants pour vous rendre à votre destination de vacances en 2011? (ENQ. : Un aller et retour doit être comptabilisé comme UNE FOIS)Voiture/moto
Q7.5 How many times did you use the following means of transport to travel to your holiday destination in 2011…? (INT. : One back and forth should be counted as ONE TIME)Car/ Motorbikes
Q7.5 Wie häufig haben Sie 2011 die folgenden Transportmittel genutzt, um zu Ihrem Urlaubsziel zu reisen? INT.: Eine einfache Hin- und Rückreise gilt als EINMALIGE Nutzung)Auto/Motorrad
1 3 5 fois ou plus Ne sait pas
1
1
Flash EB334
2
2
2
Flash EB334
Aucune/ zéro
None/ zero
Nie/Null
Flash EB334
3
3
Flash EB334
4
4
4
6 25 21 1
5 times or more
5-mal oder häufiger
Flash EB334
Flash EB334
26 17 10 6
Don't know
Weiß nicht
Flash EB334
25 14 8
16 24 1
13 9 7 5 48 17 1
1
26 13 7 4 21 29 0
25 14
28 17 9 8
29 208 3
17 21 0
10 7 7 1 45 30 0
0
21 10 10 4 30 25 0
22 11
20 15 8 8
18 359 5
33 15 1
22 13 9 7 35 14 0
0
13 6 6 4 17 54 0
35 15
12 8 7 3
15 237 5
43 27 0
19 14 4 5 44 14 0
0
24 11 7 6 26 26 0
29 21
21 4 1 2
14 2310 3
2 69 1
26 20 11 9 14 20 0
0
21 13 7 5 36 16 2
31 16
21 12 10 6
22 169 6
36 15 0
15 11 8 6 38 21 1
0
21 10 7 2 39 20 1
27 13
11 12 6 4
33 813 6
47 19 1
18 11 8 5 32 25 1
0
24 11 7 6 39 12 1
24 14
14 7 6 5
17 317 7
30 37 1
20 18 8 4 24 25 1
2
17 13 8 6 32 22 2
17 10
37 9 4 2
41 1310 7
11 37 0
21 10 4 4 24 33 4
29

FLASH EUROBAROMETER 334 “Attitudes of Europeans Towards Tourism”
%
EU 27
BE
BG
CZ
DK
DE
EE
IE
EL
ES
FR
IT
CY
LV
LT
LU
HU
MT
NL
AT
PL
PT
RO
SI
SK
FI
SE
UK
HR
TR
MK
IS
NO
RS
IL
Q8.1 Au cours de l'année 2011, combien de fois êtes-vous parti(e) en vacances avec les formules suivantes? Vacances "tout compris" (transport + logement + nourriture)
Q8.1 In 2011, how many times did you go on any of the following types of holiday? All Inclusive holiday (transport + accommodation + food)
Q8.1 Wie häufig haben Sie 2011 auf folgende Arten Urlaub gemacht? All-inclusive-Urlaub (An-und Abreise + Unterkunft + Verpflegung)
1 3 5 fois ou plus Ne sait pas
1
1
Flash EB334
2
2
2
Flash EB334
Aucune/ zéro
None/ zero
Nie/Null
Flash EB334
3
3
Flash EB334
4
4
4
1 1 73 0
5 times or more
5-mal oder häufiger
Flash EB334
Flash EB334
23 7 3 0
Don't know
Weiß nicht
Flash EB334
19 5 1
1 65 1
14 4 3 0 0 78 1
0
20 3 1 0 1 74 1
18 4
21 6 1 0
2 760 0
1 71 0
17 4 1 0 2 75 1
0
18 4 1 1 4 72 0
15 4
19 5 2 1
1 781 1
3 70 0
16 4 1 1 1 76 1
1
22 11 3 2 2 60 0
18 5
15 4 2 2
1 731 1
6 71 0
15 6 0 0 3 73 3
0
15 4 2 1 2 75 1
22 8
32 3 1 1
1 653 1
2 61 0
17 3 1 0 0 79 0
0
15 4 1 0 1 78 1
20 4
16 5 2 0
2 702 2
2 74 1
18 4 1 0 1 76 0
0
15 3 1 0 1 79 1
15 4
14 5 1 1
1 790 1
1 78 0
14 1 1 0 1 82 1
1
9 5 1 0 2 83 0
21 5
15 7 3 1
0 702 1
3 71 0
17 4 5 0 2 72 0
0
17 3 1 2 2 74 1
13 7
27 6 0 1
1 780 1
1 65 0
22 8 2 0 2 62 4
30

FLASH EUROBAROMETER 334 “Attitudes of Europeans Towards Tourism”
%
EU 27
BE
BG
CZ
DK
DE
EE
IE
EL
ES
FR
IT
CY
LV
LT
LU
HU
MT
NL
AT
PL
PT
RO
SI
SK
FI
SE
UK
HR
TR
MK
IS
NO
RS
IL
Q8.2 Au cours de l'année 2011, combien de fois êtes-vous parti(e) en vacances avec les formules suivantes? Séjour comprenant le transport et le logement
Q8.2 In 2011, how many times did you go on any of the following types of holiday? Package Tour (transport + accommodation bought together)
Q8.2 Wie häufig haben Sie 2011 auf folgende Arten Urlaub gemacht? Pauschalreise (An- und Abreise + Unterkunft zusammen gebucht)
1 3 5 fois ou plus Ne sait pas
1
1
Flash EB334
2
2
2
Flash EB334
Aucune/ zéro
None/ zero
Nie/Null
Flash EB334
3
3
Flash EB334
4
4
4
1 1 77 0
5 times or more
5-mal oder häufiger
Flash EB334
Flash EB334
18 5 2 0
Don't know
Weiß nicht
Flash EB334
15 5 1
1 74 0
10 4 0 1 1 84 0
0
19 6 2 1 0 71 1
15 4
19 8 2 1
2 771 1
1 69 0
7 3 1 0 1 86 2
1
8 3 0 0 0 89 0
16 3
13 4 1 1
0 781 1
1 80 0
12 3 1 1 1 82 0
1
18 3 2 1 1 74 1
9 2
15 5 2 1
1 860 1
2 75 0
9 5 2 0 1 82 1
0
13 3 1 0 2 80 1
19 9
13 3 0 1
2 644 2
3 80 0
18 4 2 1 1 74 0
0
15 3 1 1 1 79 0
24 6
6 3 1 0
1 643 2
1 88 1
10 2 2 0 0 85 1
0
20 5 1 0 1 73 0
16 6
21 7 2 1
1 733 1
1 68 0
20 6 1 1 1 70 1
1
10 1 1 0 3 85 0
18 5
8 1 0 0
0 741 1
1 89 1
6 2 2 0 1 88 1
1
24 7 2 1 0 66 0
18 4
10 1 0 0
0 761 0
1 87 1
22 10 1 1 2 59 5
31
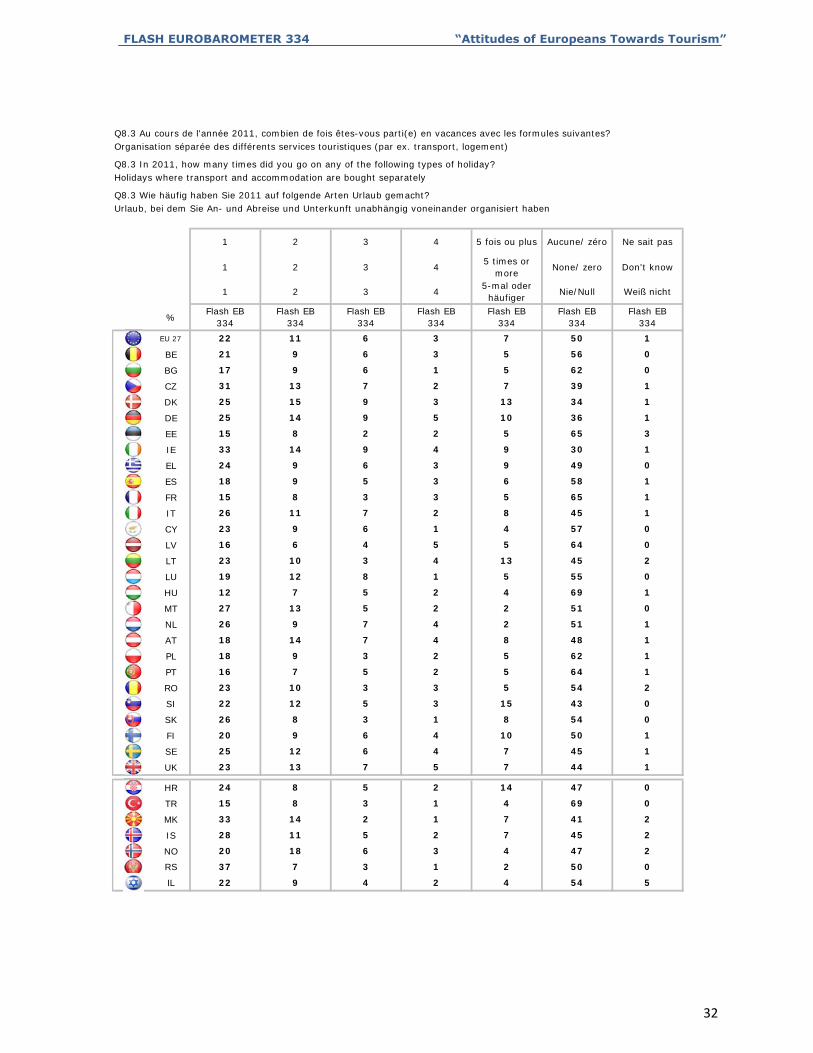
FLASH EUROBAROMETER 334 “Attitudes of Europeans Towards Tourism”
%
EU 27
BE
BG
CZ
DK
DE
EE
IE
EL
ES
FR
IT
CY
LV
LT
LU
HU
MT
NL
AT
PL
PT
RO
SI
SK
FI
SE
UK
HR
TR
MK
IS
NO
RS
IL
Q8.3 Au cours de l'année 2011, combien de fois êtes-vous parti(e) en vacances avec les formules suivantes? Organisation séparée des différents services touristiques (par ex. transport, logement)
Q8.3 In 2011, how many times did you go on any of the following types of holiday? Holidays where transport and accommodation are bought separately
Q8.3 Wie häufig haben Sie 2011 auf folgende Arten Urlaub gemacht? Urlaub, bei dem Sie An- und Abreise und Unterkunft unabhängig voneinander organisiert haben
1 3 5 fois ou plus Ne sait pas
1
1
Flash EB334
2
2
2
Flash EB334
Aucune/ zéro
None/ zero
Nie/Null
Flash EB334
3
3
Flash EB334
4
4
4
3 7 50 1
5 times or more
5-mal oder häufigerFlash EB
334Flash EB
334
21 9 6 3
Don't know
Weiß nicht
Flash EB334
22 11 6
5 56 0
17 9 6 1 5 62 0
1
25 15 9 3 13 34 1
31 13
25 14 9 5
7 397 2
10 36 1
15 8 2 2 5 65 3
1
24 9 6 3 9 49 0
33 14
18 9 5 3
9 309 4
6 58 1
15 8 3 3 5 65 1
1
23 9 6 1 4 57 0
26 11
16 6 4 5
8 457 2
5 64 0
23 10 3 4 13 45 2
0
12 7 5 2 4 69 1
19 12
27 13 5 2
5 558 1
2 51 0
26 9 7 4 2 51 1
1
18 9 3 2 5 62 1
18 14
16 7 5 2
8 487 4
5 64 1
23 10 3 3 5 54 2
0
26 8 3 1 8 54 0
22 12
20 9 6 4
15 435 3
10 50 1
25 12 6 4 7 45 1
1
24 8 5 2 14 47 0
23 13
15 8 3 1
7 447 5
4 69 0
33 14 2 1 7 41 2
2
20 18 6 3 4 47 2
28 11
37 7 3 1
7 455 2
2 50 0
22 9 4 2 4 54 5
32

FLASH EUROBAROMETER 334 “Attitudes of Europeans Towards Tourism”
%
EU 27
BE
BG
CZ
DK
DE
EE
IE
EL
ES
FR
IT
CY
LV
LT
LU
HU
MT
NL
AT
PL
PT
RO
SI
SK
FI
SE
UK
HR
TR
MK
IS
NO
RS
IL
Q9 Avez-vous organisé vos vacances en 2011 à l'aide d'un des moyens suivants? (PLUSIEURS RÉPONSES POSSIBLES)
Q9 Did you arrange your holidays in 2011 using any of the following methods? (MULTIPLE ANSWER POSSIBLE)
Q9 Wie haben Sie 2011 Ihren Urlaub organisiert? (MEHRFACHNENNUNGEN MÖGLICH)
Par téléphone
Over the phone
Über das Telefon
Flash EB334
Sur Internet
The Internet
Über das Internet
Flash EB334
Par le biais d'une personne que vous
connaissez
Through someone you know
Über jemanden, den Sie kennen
Flash EB334
Par le biais d'une agence de voyages
Through a travel agency
Über ein Reisebüro
Flash EB334
53 18 23 22
57 11 32 19
30 16 11 23
40 17 29 33
71 14 22 15
54 20 28 19
34 9 25 30
77 18 22 18
41 16 12 20
52 11 25 14
50 14 17 27
48 10 21 18
45 12 36 13
52 16 18 40
24 18 14 31
54 12 39 15
36 11 12 23
61 3 27 16
72 12 22 12
51 17 34 22
41 24 14 29
43 22 24 34
26 16 20 25
35 14 33 25
32 12 23 35
70 30 20 23
64 20 21 25
68 29 28 21
26 22 11 28
22 21 10 26
13 19 23 23
58 11 11 20
78 17 14 24
17 11 29 35
42 21 37 22
33

FLASH EUROBAROMETER 334 “Attitudes of Europeans Towards Tourism”
%
EU 27
BE
BG
CZ
DK
DE
EE
IE
EL
ES
FR
IT
CY
LV
LT
LU
HU
MT
NL
AT
PL
PT
RO
SI
SK
FI
SE
UK
HR
TR
MK
IS
NO
RS
IL
12 2
6 9 9 7
0 15
8 8
4 5 3 2
5 10
16 16
3 27 10 3
4 12
2 2
15 7 15 6
9 8
2 7
5 9 5 4
10 9
8 1
3 10 10 10
2 12
13 4
1 13 11 7
5 19
7 1
4 10 9 10
2 9
2 1
2 14 5 2
5 2
5 2
3 3 22 10
8 6
8 4
3 21 13 5
5 16
8 5
0 3 8 3
2 7
12 3
5 11 13 5
2 5
1 0
4 15 16 3
4 6
5 1
8 17 21 5
4 10
9 5
5 6 7 2
5 15
3 3
4 12 18 12
5 12
Flash EB334
Flash EB334
4 9 8 4
Flash EB334
Flash EB334
Other (DO NOT READ OUT)
Don't know
Am Schalter eines Beförderungs-/Verkehrsunternehmens (Fluggesellschaft,
Eisenbahnunternehmen etc.)
Vor Ort (am Urlaubsort)
Andere (NICHT VORLESEN)
Weiß nicht
Over the counter of a transportation company (airline company, railway
company etc…)
On-site (place of holidays)
Au guichet d'une compagnie de transport (compagnie aérienne, société de chemin de
fer, etc...)
Sur place (sur votre lieu de vacances)
Autre (NE PAS LIRE)
Ne sait pas
Q9 Avez-vous organisé vos vacances en 2011 à l'aide d'un des moyens suivants? (PLUSIEURS RÉPONSES POSSIBLES)
Q9 Did you arrange your holidays in 2011 using any of the following methods? (MULTIPLE ANSWER POSSIBLE)
Q9 Wie haben Sie 2011 Ihren Urlaub organisiert? (MEHRFACHNENNUNGEN MÖGLICH)
34

FLASH EUROBAROMETER 334 “Attitudes of Europeans Towards Tourism”
%
EU 27
BE
BG
CZ
DK
DE
EE
IE
EL
ES
FR
IT
CY
LV
LT
LU
HU
MT
NL
AT
PL
PT
RO
SI
SK
FI
SE
UK
HR
TR
MK
IS
NO
RS
IL
Q10 Parmi les éléments suivants, lesquels vous inciteraient à retourner en vacances au même endroit? (MAX. 3 RÉPONSES)
Q10 Which of the following would make you go back to the same place for a holiday? (MAX. 3 ANSWERS)
Q10 Was würde Sie dazu veranlassen, am gleichen Ort erneut Urlaub zu machen? Maximal 3 Nennungen!
Les caractéristiques naturelles (climat,
paysage, etc.)
The natural features (weather conditions,
landscape, etc.)
Die Natur (Wetter, Landschaft etc.)
Flash EB334
La qualité du logement
The quality of the accommodation
Die Qualität der Unterkunft
Flash EB334
Les activités proposées (diversité et richesse de l'offre touristique)
The activities offered (variety and comprehensiveness of the tourist
offer)
Das Angebot an Aktivitäten (Vielfalt und Umfang touristischer Angebote)
Flash EB334
Le niveau général des prix
The general level of prices
Das allgemeine Preisniveau
Flash EB334
32 50 27 17
34 48 25 14
36 65 22 22
26 50
33 44 31 23
30 9
36 52 25 20
43 45 39 25
12 34
31 49 39 12
19 13
35 50 27 15
20 49 21 10
23 54
25 40 29 12
23 16
24 36 23 20
36 45 24 13
24 49
28 46 25 8
30 12
17 53 25 22
36 48 24 23
41 58
29 53 32 22
22 17
40 54 32 15
33 44 24 20
32 42
33 50 19 15
25 12
31 36 32 32
48 48 33 19
33 44
29 42 29 22
25 28
30 40 37 13
20 43 28 39
20 24
37 44 30 23
14 7
31 42 33 10
31 33 39 17
35

FLASH EUROBAROMETER 334 “Attitudes of Europeans Towards Tourism”
%
EU 27
BE
BG
CZ
DK
DE
EE
IE
EL
ES
FR
IT
CY
LV
LT
LU
HU
MT
NL
AT
PL
PT
RO
SI
SK
FI
SE
UK
HR
TR
MK
IS
NO
RS
IL
17
23 9 19
7 15
11
21 10 9
25 5
13
19 5 40
19 7
5
19 12 8
28 5
11
25 10 10
23 4
6
19 6 12
28 8
15
21 6 18
29 10
10
27 3 10
28 9
9
19 8 10
23 12
10
21 13 15
25 9
18
17 9 13
23 10
15
15 21 6
22 8
7
27 9 8
20 9
5
17 11 6
28 3
10
12 27 21
23 9
9
30 7 9
26 4
12
18 8 10
25 7
Flash EB334
24 8 10
Flash EB334
Flash EB334
Don't know
Die Touristenfreundlichkeit (z.B. Kinderfreundlichkeit, Urlauberbetreuung, ob Haustiere mitgebracht werden dürfen
etc.)
Andere (NICHT VORLESEN)
Weiß nicht
How tourists are welcomed ( e.g. child friendliness, customer care, "pets-welcomed" policy, etc...)
Other (DO NOT READ OUT)
L'accueil des touristes (p. ex. convivialité pour les enfants, attention accordée aux clients, acceptation des animaux de
compagnie, etc...)Autre (NE PAS LIRE) Ne sait pas
Q10 Parmi les éléments suivants, lesquels vous inciteraient à retourner en vacances au même endroit? (MAX. 3 RÉPONSES)
Q10 Which of the following would make you go back to the same place for a holiday? (MAX. 3 ANSWERS)
Q10 Was würde Sie dazu veranlassen, am gleichen Ort erneut Urlaub zu machen? Maximal 3 Nennungen!
36

FLASH EUROBAROMETER 334 “Attitudes of Europeans Towards Tourism”
%
EU 27
BE
BG
CZ
DK
DE
EE
IE
EL
ES
FR
IT
CY
LV
LT
LU
HU
MT
NL
AT
PL
PT
RO
SI
SK
FI
SE
UK
HR
TR
MK
IS
NO
RS
IL
Q11.1 En ce qui concerne vos principales vacances en 2011, dans quelle mesure avez-vous été satisfait(e) de...? La qualité du logement
Q11.1 Now thinking about your main holidays in 2011, how satisfied were you with…? The quality of the accommodation
Q11.1 Wie zufrieden waren Sie in Ihrem Haupturlaub 2011 mit …? Der Qualität der Unterkunft
Très satisfait(e)
Plutôt pas satisfait(e)
Ne sait pasTotal 'Pas
satisfait(e)'
Very satisfied
Sehr zufrieden
Flash EB334
Plutôt satisfait(e)
Fairly satisfied
Ziemlich zufrieden
Flash EB334
Total 'Satisfait'e)'
Total 'Satisfied'
Total 'Zufrieden'
Flash EB334
Not very satisfied
Nicht sehr zufrieden
Flash EB334
Pas du tout satisfait(e)
Not at all satisfied
Überhaupt nicht
zufrieden
1 4 93 3
Don't know
Weiß nicht
Flash EB334
Flash EB334
64 33 1 1
Total 'Not satisfied''
Total 'Nicht zufrieden'
Flash EB334
56 37 2
1 97 2
38 41 6 1 14 79 7
3
72 22 2 1 3 94 3
54 38
62 34 2 1
5 923 0
1 96 3
54 31 2 1 12 85 3
3
32 47 8 2 11 79 10
62 32
52 40 3 2
3 942 1
3 92 5
50 43 2 1 4 93 3
5
59 30 3 1 7 89 4
48 43
44 51 3 0
4 914 1
2 95 3
41 50 4 1 4 91 5
3
55 36 1 1 7 91 2
62 33
69 25 4 0
2 952 1
2 94 4
58 34 3 1 4 92 4
3
51 41 1 1 6 92 2
68 28
45 49 2 0
1 962 1
4 94 2
43 45 6 0 6 88 6
3
53 36 3 0 8 89 3
64 32
45 50 2 1
1 963 0
2 95 3
60 33 2 0 5 93 2
3
59 32 5 1 3 91 6
67 27
26 45 8 5
3 942 1
16 71 13
69 29 1 1 0 98 2
4
53 40 3 1 3 93 4
71 23
76 19 2 1
2 944 0
2 95 3
48 38 4 2 8 86 6
37
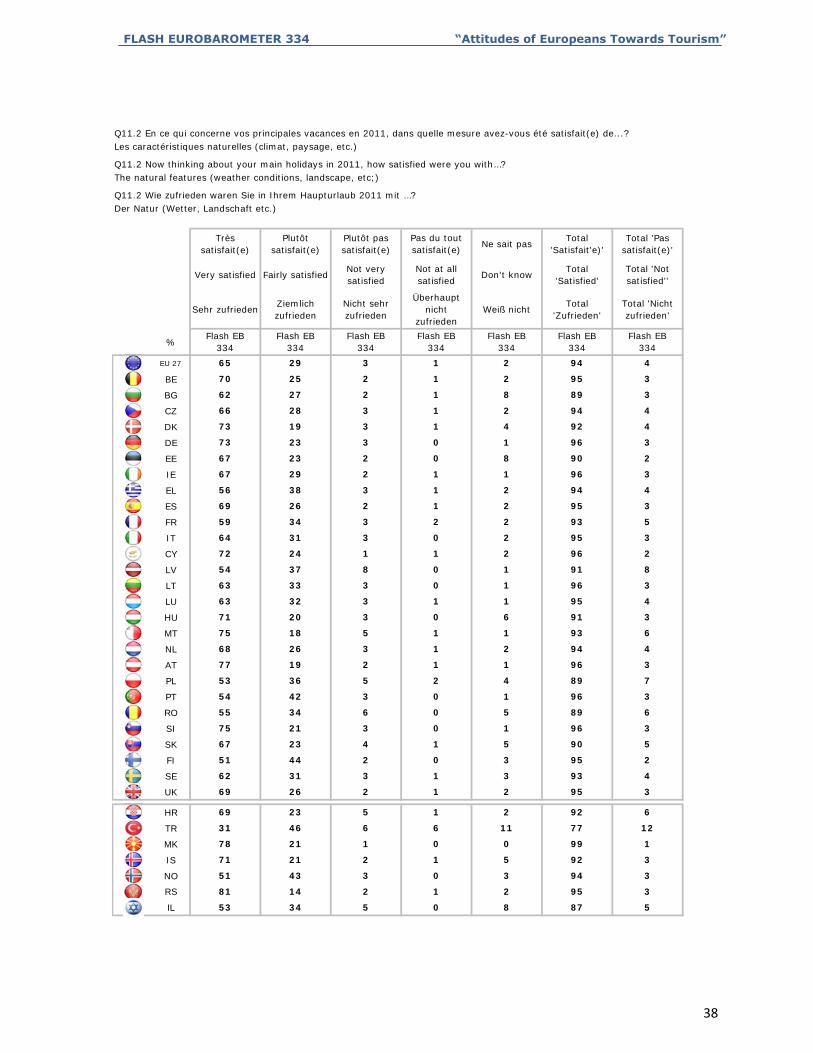
FLASH EUROBAROMETER 334 “Attitudes of Europeans Towards Tourism”
%
EU 27
BE
BG
CZ
DK
DE
EE
IE
EL
ES
FR
IT
CY
LV
LT
LU
HU
MT
NL
AT
PL
PT
RO
SI
SK
FI
SE
UK
HR
TR
MK
IS
NO
RS
IL
Q11.2 En ce qui concerne vos principales vacances en 2011, dans quelle mesure avez-vous été satisfait(e) de...? Les caractéristiques naturelles (climat, paysage, etc.)
Q11.2 Now thinking about your main holidays in 2011, how satisfied were you with…? The natural features (weather conditions, landscape, etc;)
Q11.2 Wie zufrieden waren Sie in Ihrem Haupturlaub 2011 mit …? Der Natur (Wetter, Landschaft etc.)
Très satisfait(e)
Plutôt pas satisfait(e)
Ne sait pasTotal 'Pas
satisfait(e)'
Very satisfied
Sehr zufrieden
Flash EB334
Plutôt satisfait(e)
Fairly satisfied
Ziemlich zufrieden
Flash EB334
Total 'Satisfait'e)'
Total 'Satisfied'
Total 'Zufrieden'
Flash EB334
Not very satisfied
Nicht sehr zufrieden
Flash EB334
Pas du tout satisfait(e)
Not at all satisfied
Überhaupt nicht
zufrieden
1 2 94 4
Don't know
Weiß nicht
Flash EB334
Flash EB334
70 25 2 1
Total 'Not satisfied''
Total 'Nicht zufrieden'
Flash EB334
65 29 3
2 95 3
62 27 2 1 8 89 3
4
73 19 3 1 4 92 4
66 28
73 23 3 0
2 943 1
1 96 3
67 23 2 0 8 90 2
3
56 38 3 1 2 94 4
67 29
69 26 2 1
1 962 1
2 95 3
59 34 3 2 2 93 5
3
72 24 1 1 2 96 2
64 31
54 37 8 0
2 953 0
1 91 8
63 33 3 0 1 96 3
4
71 20 3 0 6 91 3
63 32
75 18 5 1
1 953 1
1 93 6
68 26 3 1 2 94 4
3
53 36 5 2 4 89 7
77 19
54 42 3 0
1 962 1
1 96 3
55 34 6 0 5 89 6
3
67 23 4 1 5 90 5
75 21
51 44 2 0
1 963 0
3 95 2
62 31 3 1 3 93 4
3
69 23 5 1 2 92 6
69 26
31 46 6 6
2 952 1
11 77 12
78 21 1 0 0 99 1
3
51 43 3 0 3 94 3
71 21
81 14 2 1
5 922 1
2 95 3
53 34 5 0 8 87 5
38

FLASH EUROBAROMETER 334 “Attitudes of Europeans Towards Tourism”
%
EU 27
BE
BG
CZ
DK
DE
EE
IE
EL
ES
FR
IT
CY
LV
LT
LU
HU
MT
NL
AT
PL
PT
RO
SI
SK
FI
SE
UK
HR
TR
MK
IS
NO
RS
IL
Q11.3 En ce qui concerne vos principales vacances en 2011, dans quelle mesure avez-vous été satisfait(e) de...? Le niveau général des prix
Q11.3 Now thinking about your main holidays in 2011, how satisfied were you with…? The general level of prices
Q11.3 Wie zufrieden waren Sie in Ihrem Haupturlaub 2011 mit …? Dem allgemeinen Preisniveau
Très satisfait(e)
Plutôt pas satisfait(e)
Ne sait pasTotal 'Pas
satisfait(e)'
Very satisfied
Sehr zufrieden
Flash EB334
Plutôt satisfait(e)
Fairly satisfied
Ziemlich zufrieden
Flash EB334
Total 'Satisfait'e)'
Total 'Satisfied'
Total 'Zufrieden'
Flash EB334
Not very satisfied
Nicht sehr zufrieden
Flash EB334
Pas du tout satisfait(e)
Not at all satisfied
Überhaupt nicht
zufrieden
2 5 82 13
Don't know
Weiß nicht
Flash EB334
Flash EB334
42 50 5 1
Total 'Not satisfied''
Total 'Nicht zufrieden'
Flash EB334
28 54 11
2 92 6
18 49 18 4 11 67 22
14
45 43 5 1 6 88 6
22 58
35 55 6 1
6 8013 1
3 90 7
25 47 8 2 18 72 10
8
15 46 27 7 5 61 34
35 54
28 50 15 2
3 897 1
5 78 17
20 57 13 4 6 77 17
17
35 52 7 2 4 87 9
18 61
18 58 19 3
4 7915 2
2 76 22
18 51 22 4 5 69 26
10
32 45 13 1 9 77 14
30 57
34 49 13 2
3 8710 0
2 83 15
39 49 5 1 6 88 6
7
19 59 13 2 7 78 15
43 48
12 67 16 2
2 916 1
3 79 18
15 52 21 5 7 67 26
16
28 49 14 2 7 77 16
26 57
23 62 9 2
1 8315 1
4 85 11
28 57 6 0 9 85 6
6
24 42 26 5 3 66 31
39 52
15 34 26 9
3 915 1
16 49 35
39 50 9 1 1 89 10
24
26 64 5 0 5 90 5
23 48
52 34 9 0
5 7117 7
5 86 9
26 49 11 4 10 75 15
39

FLASH EUROBAROMETER 334 “Attitudes of Europeans Towards Tourism”
%
EU 27
BE
BG
CZ
DK
DE
EE
IE
EL
ES
FR
IT
CY
LV
LT
LU
HU
MT
NL
AT
PL
PT
RO
SI
SK
FI
SE
UK
HR
TR
MK
IS
NO
RS
IL
Q11.4 En ce qui concerne vos principales vacances en 2011, dans quelle mesure avez-vous été satisfait(e) de...? Les activités proposées (diversité et richesse de l'offre touristique)
Q11.4 Now thinking about your main holidays in 2011, how satisfied were you with…? The activities offered (variety and comprehensiveness of the tourist offer)
Q11.4 Wie zufrieden waren Sie in Ihrem Haupturlaub 2011 mit …? Dem Angebot an Aktivitäten (Vielfalt und Umfang touristischer Angebote)
Très satisfait(e)
Plutôt pas satisfait(e)
Ne sait pasTotal 'Pas
satisfait(e)'
Very satisfied
Sehr zufrieden
Flash EB334
Plutôt satisfait(e)
Fairly satisfied
Ziemlich zufrieden
Flash EB334
Total 'Satisfait'e)'
Total 'Satisfied'
Total 'Zufrieden'
Flash EB334
Not very satisfied
Nicht sehr zufrieden
Flash EB334
Pas du tout satisfait(e)
Not at all satisfied
Überhaupt nicht
zufrieden
2 14 79 7
Don't know
Weiß nicht
Flash EB334
Flash EB334
44 41 3 4
Total 'Not satisfied''
Total 'Nicht zufrieden'
Flash EB334
36 43 5
8 85 7
25 43 12 3 17 68 15
6
53 28 4 1 14 81 5
42 40
44 40 4 0
12 825 1
12 84 4
41 29 4 0 26 70 4
5
17 48 14 5 16 65 19
44 40
36 38 6 4
11 844 1
16 74 10
29 50 6 3 12 79 9
10
40 41 8 2 9 81 10
22 49
30 46 11 3
19 718 2
10 76 14
29 46 10 1 14 75 11
7
34 33 5 0 28 67 5
37 47
54 24 8 1
9 845 2
13 78 9
40 36 5 1 18 76 6
4
34 51 4 1 10 85 5
56 30
22 57 9 3
10 864 0
9 79 12
27 52 10 3 8 79 13
9
38 38 9 2 13 76 11
46 40
38 50 4 0
5 869 0
8 88 4
48 34 2 1 15 82 3
4
42 30 16 5 7 72 21
44 38
23 35 15 8
14 823 1
19 58 23
47 40 4 3 6 87 7
4
33 45 5 0 17 78 5
61 29
72 19 2 0
6 904 0
7 91 2
30 41 8 3 18 71 11
40
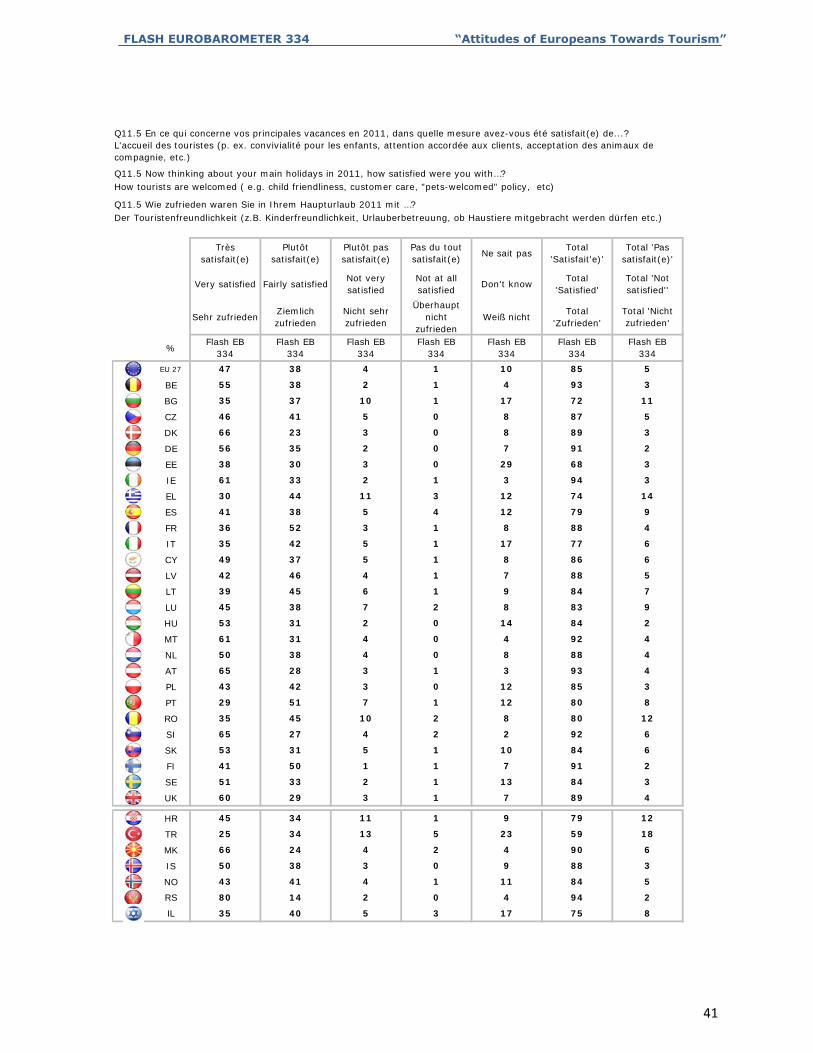
FLASH EUROBAROMETER 334 “Attitudes of Europeans Towards Tourism”
%
EU 27
BE
BG
CZ
DK
DE
EE
IE
EL
ES
FR
IT
CY
LV
LT
LU
HU
MT
NL
AT
PL
PT
RO
SI
SK
FI
SE
UK
HR
TR
MK
IS
NO
RS
IL
Q11.5 En ce qui concerne vos principales vacances en 2011, dans quelle mesure avez-vous été satisfait(e) de...? L'accueil des touristes (p. ex. convivialité pour les enfants, attention accordée aux clients, acceptation des animaux de compagnie, etc.)
Q11.5 Now thinking about your main holidays in 2011, how satisfied were you with…? How tourists are welcomed ( e.g. child friendliness, customer care, "pets-welcomed" policy, etc)
Q11.5 Wie zufrieden waren Sie in Ihrem Haupturlaub 2011 mit …? Der Touristenfreundlichkeit (z.B. Kinderfreundlichkeit, Urlauberbetreuung, ob Haustiere mitgebracht werden dürfen etc.)
Très satisfait(e)
Plutôt pas satisfait(e)
Ne sait pasTotal 'Pas
satisfait(e)'
Very satisfied
Sehr zufrieden
Flash EB334
Plutôt satisfait(e)
Fairly satisfied
Ziemlich zufrieden
Flash EB334
Total 'Satisfait'e)'
Total 'Satisfied'
Total 'Zufrieden'
Flash EB334
Not very satisfied
Nicht sehr zufrieden
Flash EB334
Pas du tout satisfait(e)
Not at all satisfied
Überhaupt nicht
zufrieden
1 10 85 5
Don't know
Weiß nicht
Flash EB334
Flash EB334
55 38 2 1
Total 'Not satisfied''
Total 'Nicht zufrieden'
Flash EB334
47 38 4
4 93 3
35 37 10 1 17 72 11
5
66 23 3 0 8 89 3
46 41
56 35 2 0
8 875 0
7 91 2
38 30 3 0 29 68 3
3
30 44 11 3 12 74 14
61 33
41 38 5 4
3 942 1
12 79 9
36 52 3 1 8 88 4
6
49 37 5 1 8 86 6
35 42
42 46 4 1
17 775 1
7 88 5
39 45 6 1 9 84 7
9
53 31 2 0 14 84 2
45 38
61 31 4 0
8 837 2
4 92 4
50 38 4 0 8 88 4
4
43 42 3 0 12 85 3
65 28
29 51 7 1
3 933 1
12 80 8
35 45 10 2 8 80 12
6
53 31 5 1 10 84 6
65 27
41 50 1 1
2 924 2
7 91 2
51 33 2 1 13 84 3
4
45 34 11 1 9 79 12
60 29
25 34 13 5
7 893 1
23 59 18
66 24 4 2 4 90 6
3
43 41 4 1 11 84 5
50 38
80 14 2 0
9 883 0
4 94 2
35 40 5 3 17 75 8
41

FLASH EUROBAROMETER 334 “Attitudes of Europeans Towards Tourism”
%
EU 27
BE
BG
CZ
DK
DE
EE
IE
EL
ES
FR
IT
CY
LV
LT
LU
HU
MT
NL
AT
PL
PT
RO
SI
SK
FI
SE
UK
HR
TR
MK
IS
NO
RS
IL
Q12 Parmi les sources d'information suivantes, lesquelles sont les plus importantes à vos yeux lorsque vous prenez une décision sur vos projets de vacances? (MAX. 3 RÉPONSES)
Q12 From the following information sources, which one do you consider to be the most important when you make a decision about your travel plans? (MAX. 3 ANSWERS)
Q12 Welche der folgenden Informationsquellen halten Sie für am wichtigsten, wenn Sie eine Entscheidung über Ihre Reisepläne treffen? Maximal 3 Nennungen!
Votre expérience personnelle
Personal experience
Persönliche Erfahrung
Flash EB334
Les guides et les magazines payants
Paid for guidebooks and magazines
Käuflich erworbene Reiseführer und Zeitschriften
Flash EB334
Les recommandations d'amis, de collègues ou de membres de
votre famille
Recommendations of friends, colleagues or relatives
Empfehlungen von Freunden, Kollegen oder Verwandten
Flash EB334
32 52 7
27 48 6
32 53 1
44 61 4
30 55 8
33 51 10
27 55 2
33 59 7
33 51 4
29 54 5
26 55 9
26 35 4
29 40 5
31 66 5
26 61 1
30 43 6
35 52 5
25 39 6
30 48 10
30 54 11
36 63 5
32 62 11
28 51 4
42 56 5
37 55 3
35 48 6
33 60 9
37 55 7
41 61 3
22 53 3
32 32 2
41 56 6
40 55 8
45 45 2
26 51 8
42
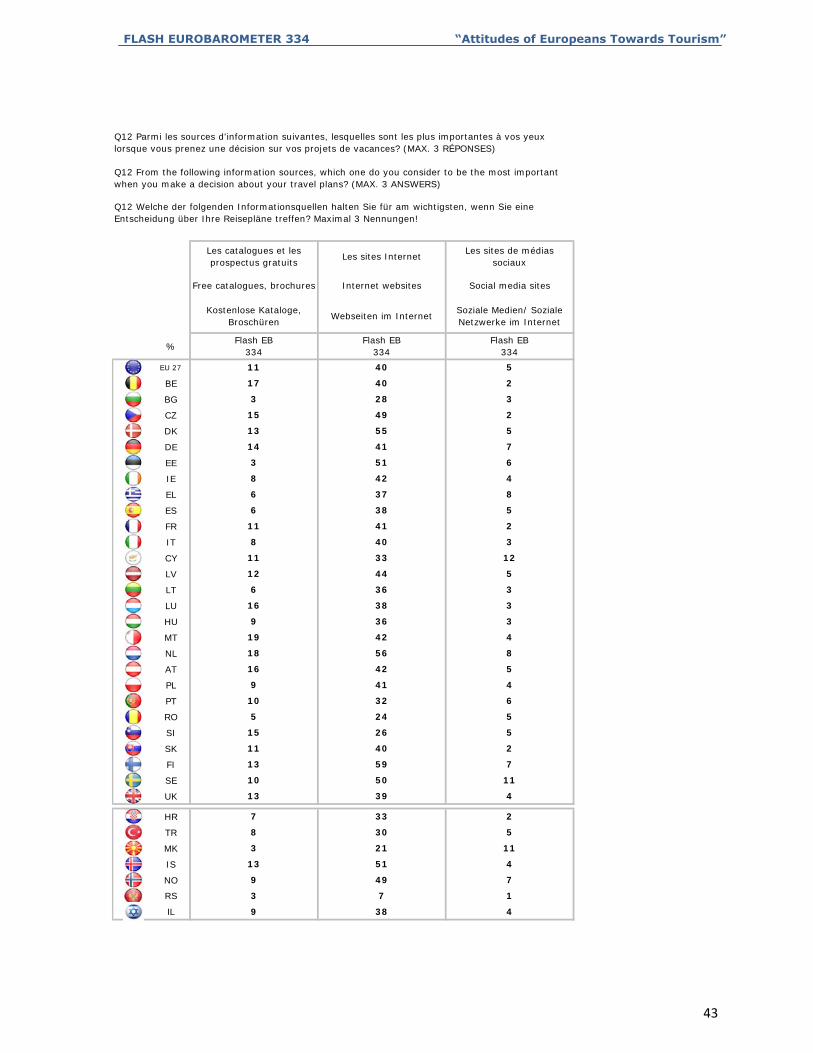
FLASH EUROBAROMETER 334 “Attitudes of Europeans Towards Tourism”
%
EU 27
BE
BG
CZ
DK
DE
EE
IE
EL
ES
FR
IT
CY
LV
LT
LU
HU
MT
NL
AT
PL
PT
RO
SI
SK
FI
SE
UK
HR
TR
MK
IS
NO
RS
IL 9 38 4
3 7 1
9 49 7
13 51 4
3 21 11
8 30 5
7 33 2
13 39 4
10 50 11
13 59 7
11 40 2
15 26 5
5 24 5
10 32 6
9 41 4
16 42 5
18 56 8
19 42 4
9 36 3
16 38 3
6 36 3
12 44 5
11 33 12
8 40 3
11 41 2
6 38 5
6 37 8
8 42 4
3 51 6
14 41 7
13 55 5
15 49 2
3 28 3
17 40 2
11 40 5
Flash EB334
Flash EB334
Flash EB334
Kostenlose Kataloge, Broschüren
Webseiten im InternetSoziale Medien/ Soziale Netzwerke im Internet
Free catalogues, brochures Internet websites Social media sites
Les catalogues et les prospectus gratuits
Les sites Internet Les sites de médias
sociaux
Q12 Parmi les sources d'information suivantes, lesquelles sont les plus importantes à vos yeux lorsque vous prenez une décision sur vos projets de vacances? (MAX. 3 RÉPONSES)
Q12 From the following information sources, which one do you consider to be the most important when you make a decision about your travel plans? (MAX. 3 ANSWERS)
Q12 Welche der folgenden Informationsquellen halten Sie für am wichtigsten, wenn Sie eine Entscheidung über Ihre Reisepläne treffen? Maximal 3 Nennungen!
43

FLASH EUROBAROMETER 334 “Attitudes of Europeans Towards Tourism”
%
EU 27
BE
BG
CZ
DK
DE
EE
IE
EL
ES
FR
IT
CY
LV
LT
LU
HU
MT
NL
AT
PL
PT
RO
SI
SK
FI
SE
UK
HR
TR
MK
IS
NO
RS
IL 2 14
4 15
13 9
2 2
15 3
1 3
7 6
1 17
6 6
2 8
12 9
2 5
9 15
1 3
11 9
2 4
10 5
1 3
10 12
2 4
8 13
2 2
14 7
2 7
17 7
3 8
16 9
1 4
22 13
2 3
7 7
2 3
27 7
2 4
14 6
4 8
18 12
4 3
5 7
1 6
23 5
1 4
9 13
3 2
10 10
2 5
20 7
4 5
22 3
2 2
12 8
3 5
24 5
0 1
13 10
4 12
8 11
1 3
14 7
2 4
22 8
1 3
10 11
2 5
13 8
2 7
7 10
2 4
20 5
Flash EB334
Flash EB334
16 7
Andere (NICHT VORLESEN)
Weiß nicht
Flash EB334
Flash EB334
Other (DO NOT READ OUT)
Don't know
Reisebüros/Tourismusagenturen
Die Medien (Zeitung, Radio, TV)
Autre (NE PAS LIRE) Ne sait pas
Travel / tourist agencies Newspaper, radio, TV
Les agences de voyage / touristiques
Les journaux, la radio et la télévision
Q12 Parmi les sources d'information suivantes, lesquelles sont les plus importantes à vos yeux lorsque vous prenez une décision sur vos projets de vacances? (MAX. 3 RÉPONSES)
Q12 From the following information sources, which one do you consider to be the most important when you make a decision about your travel plans? (MAX. 3 ANSWERS)
Q12 Welche der folgenden Informationsquellen halten Sie für am wichtigsten, wenn Sie eine Entscheidung über Ihre Reisepläne treffen? Maximal 3 Nennungen!
44
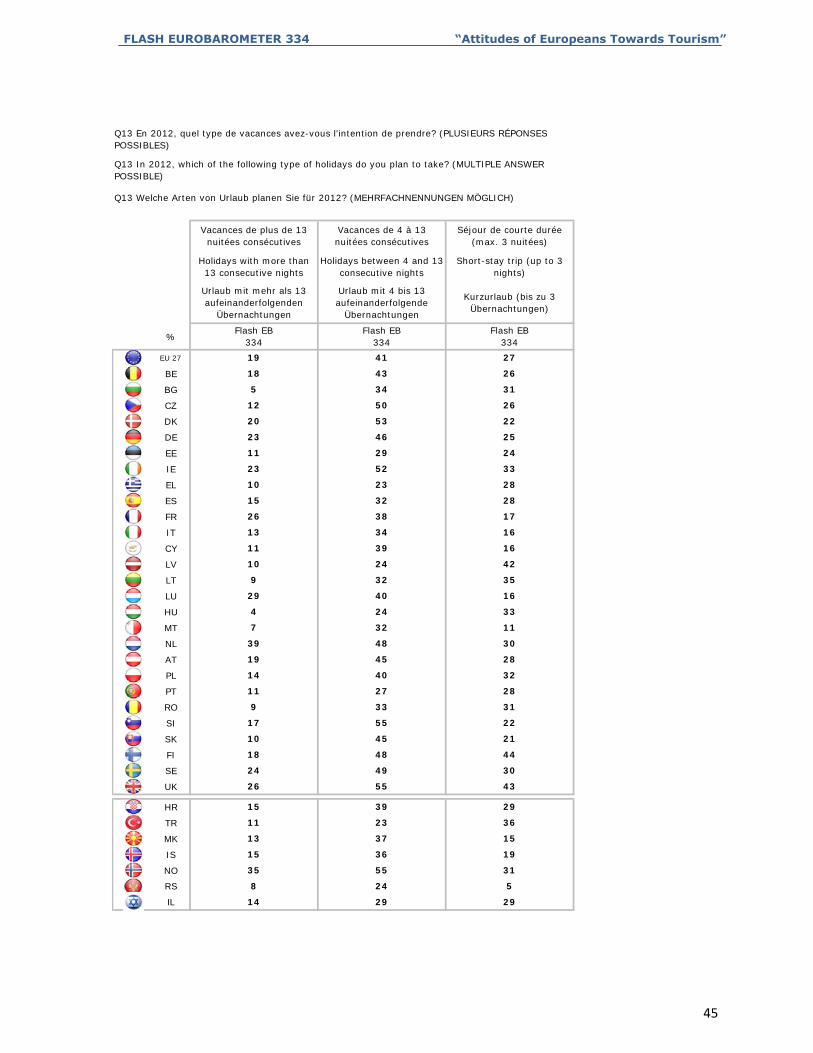
FLASH EUROBAROMETER 334 “Attitudes of Europeans Towards Tourism”
%
EU 27
BE
BG
CZ
DK
DE
EE
IE
EL
ES
FR
IT
CY
LV
LT
LU
HU
MT
NL
AT
PL
PT
RO
SI
SK
FI
SE
UK
HR
TR
MK
IS
NO
RS
IL
Q13 En 2012, quel type de vacances avez-vous l'intention de prendre? (PLUSIEURS RÉPONSES POSSIBLES)
Q13 In 2012, which of the following type of holidays do you plan to take? (MULTIPLE ANSWER POSSIBLE)
Q13 Welche Arten von Urlaub planen Sie für 2012? (MEHRFACHNENNUNGEN MÖGLICH)
Vacances de plus de 13 nuitées consécutives
Holidays with more than 13 consecutive nights
Urlaub mit mehr als 13 aufeinanderfolgenden
Übernachtungen
Flash EB334
Séjour de courte durée (max. 3 nuitées)
Short-stay trip (up to 3 nights)
Kurzurlaub (bis zu 3 Übernachtungen)
Flash EB334
Vacances de 4 à 13 nuitées consécutives
Holidays between 4 and 13 consecutive nights
Urlaub mit 4 bis 13 aufeinanderfolgende
Übernachtungen
Flash EB334
19 41 27
31
18 43 26
12 50 26
5 34
20 53 22
11 29 24
23 46 25
28
23 52 33
15 32 28
10 23
26 38 17
11 39 16
13 34 16
35
10 24 42
29 40 16
9 32
4 24 33
39 48 30
7 32 11
32
19 45 28
11 27 28
14 40
9 33 31
10 45 21
17 55 22
30
18 48 44
26 55 43
24 49
15 39 29
13 37 15
11 23 36
31
15 36 19
8 24 5
35 55
14 29 29
45

FLASH EUROBAROMETER 334 “Attitudes of Europeans Towards Tourism”
%
EU 27
BE
BG
CZ
DK
DE
EE
IE
EL
ES
FR
IT
CY
LV
LT
LU
HU
MT
NL
AT
PL
PT
RO
SI
SK
FI
SE
UK
HR
TR
MK
IS
NO
RS
IL 12 9 16
17 45 2
8 2 1
32 4 2
18 22 1
10 18 4
8 16 1
9 10 1
13 7 1
6 8 0
10 16 2
8 13 1
12 17 1
15 27 4
8 13 2
8 13 1
8 9 1
23 26 2
14 29 1
17 7 2
13 15 2
13 17 1
23 13 2
20 20 2
16 12 2
11 18 4
18 25 1
9 7 0
25 19 2
10 15 1
20 8 1
6 15 3
11 18 4
10 17 4
12 15 2
Flash EB334
Flash EB334
Flash EB334
Noch keine Entscheidung getroffen (NICHT VORLESEN)
Überhaupt kein Urlaub geplant (NICHT VORLESEN)
Weiß nicht
No decisions yet (DO NOT READ OUT)
No trip at all (DO NOT READ OUT)
Don't know
Vous n'avez pas encore décidé (NE PAS LIRE)
Pas de vacances (NE PAS LIRE) Ne sait pas
Q13 En 2012, quel type de vacances avez-vous l'intention de prendre? (PLUSIEURS RÉPONSES POSSIBLES)
Q13 In 2012, which of the following type of holidays do you plan to take? (MULTIPLE ANSWER POSSIBLE)
Q13 Welche Arten von Urlaub planen Sie für 2012? (MEHRFACHNENNUNGEN MÖGLICH)
46

FLASH EUROBAROMETER 334 “Attitudes of Europeans Towards Tourism”
%
EU 27
BE
BG
CZ
DK
DE
EE
IE
EL
ES
FR
IT
CY
LV
LT
LU
HU
MT
NL
AT
PL
PT
RO
SI
SK
FI
SE
UK
HR
TR
MK
IS
NO
RS
IL
Q14 Dans quel(s) pays avez-vous l'intention de passer vos vacances en 2012? (NE PAS LIRE - PLUSIEURS REPONSES POSSIBLES)
Q14 In which country(ies) do you plan to spend your holidays in 2012? (DO NOT READ OUT - MULTIPLE ANSWERS POSSIBLE)
Q14 In welchem Land/welchen Ländern planen Sie, 2012 Ihren Urlaub zu verbringen? (NICHT VORLESEN - MEHRFACHNENNUNGEN MÖGLICH)
Autriche
Austria
Österreich
Flash EB334
En [NOTRE PAYS]
In [OUR COUNTRY]
In [UNSER LAND]
Flash EB334
Bulgarie
Bulgaria
Bulgarien
Flash EB334
Belgique
Belgium
Belgien
Flash EB334
République tchèque
Czech Republic
Tschechische Republik
Flash EB334
Chypre
Cyprus
Zypern
Flash EB334
Estonie
Estonia
Estland
Flash EB334
Danemark
Denmark
Dänemark
Flash EB334
52 3 1 1 0 1 1 0
13 2 0 1 0 0 0 0
0 0 0 073 1 0 0
45 4 0 1 0 0 0 0
35 6 1 1 0 1 0 0
42 10 1 1 0 1 3 0
0 1 2 040 1 0 1
30 2 1 1 1 1 1 1
80 2 0 1 2 0 0 0
68 1 1 0 0 0 0 0
0 0 0 058 1 1 0
60 1 1 0 0 1 0 0
30 2 0 0 0 2 0 0
38 2 1 0 0 0 0 7
0 0 1 253 2 0 0
2 8 6 0 0 1 1 1
63 6 0 2 0 0 0 0
3 2 2 0 1 1 0 0
0 0 1 026 8 5 1
47 0 0 0 1 0 1 0
66 2 0 1 0 2 0 0
63 1 0 0 0 1 0 0
0 0 0 057 3 0 4
30 5 0 1 0 1 0 0
43 4 0 8 1 7 0 0
49 1 0 1 0 1 2 11
1 0 4 153 2 1 0
42 1 1 1 2 1 0 0
77 5 1 1 0 2 0 0
80 1 0 1 0 0 0 0
0 0 0 026 3 0 5
50 1 1 0 0 1 12 0
36 1 0 1 0 1 10 0
33 3 0 2 0 2 0 0
0 1 0 031 3 1 0
47

FLASH EUROBAROMETER 334 “Attitudes of Europeans Towards Tourism”
%
EU 27
BE
BG
CZ
DK
DE
EE
IE
EL
ES
FR
IT
CY
LV
LT
LU
HU
MT
NL
AT
PL
PT
RO
SI
SK
FI
SE
UK
HR
TR
MK
IS
NO
RS
IL 7 00 7 5 2 2 1
19 1 0 3 00 1 5
7 00 7 2 5 1 0
2 2 0 6 00 4 7
3 00 1 3 13 0 0
1 0 0 2 00 3 3
5 00 2 3 1 1 1
6 0 2 4 00 10 2
8 13 7 6 5 1 1
4 1 0 4 00 5 6
10 01 3 2 7 3 1
3 1 0 8 01 4 2
10 00 4 5 6 2 0
0 0 0 4 00 7 1
5 00 2 3 3 1 1
4 2 1 21 00 4 8
13 01 18 12 4 1 1
2 0 0 30 01 8 4
6 00 2 4 6 0 1
1 0 2 16 02 22 10
4 41 2 6 1 0 2
1 0 2 6 03 5 5
8 01 7 3 36 1 0
5 0 0 0 01 6 3
3 00 0 2 1 0 1
1 0 0 5 00 5 3
4 00 3 3 0 1 0
2 0 0 7 01 11 3
4 514 3 4 1 1 2
3 1 1 14 00 6 0
13 01 10 10 5 1 1
6 1 0 11 00 4 4
3 00 3 1 11 0 0
4 0 0 9 00 35 6
7 00 6 3 4 1 1
Flash EB334
Flash EB334
Flash EB334
Flash EB334
Flash EB334
Flash EB334
Flash EB334
Flash EB334
Italien LettlandFinnland Frankreich Deutschland Griechenland Ungarn Irland
Greece Hungary Ireland Italy LatviaFinland France Germany
Italie LettonieFinlande France Allemagne Grèce Hongrie Irlande
Q14 Dans quel(s) pays avez-vous l'intention de passer vos vacances en 2012? (NE PAS LIRE - PLUSIEURS REPONSES POSSIBLES)
Q14 In which country(ies) do you plan to spend your holidays in 2012? (DO NOT READ OUT - MULTIPLE ANSWERS POSSIBLE)
Q14 In welchem Land/welchen Ländern planen Sie, 2012 Ihren Urlaub zu verbringen? (NICHT VORLESEN - MEHRFACHNENNUNGEN MÖGLICH)
48

FLASH EUROBAROMETER 334 “Attitudes of Europeans Towards Tourism”
%
EU 27
BE
BG
CZ
DK
DE
EE
IE
EL
ES
FR
IT
CY
LV
LT
LU
HU
MT
NL
AT
PL
PT
RO
SI
SK
FI
SE
UK
HR
TR
MK
IS
NO
RS
IL 0 0 0 00 0 0 3
00 0 1 0 0 00
1 1 0 00 0 0 1
00 0 2 1 1 00
0 0 0 00 0 0 0
00 0 0 0 0 00
1 1 0 00 0 0 1
00 1 2 1 2 00
1 1 0 01 0 0 1
00 0 2 1 1 00
0 1 1 00 0 0 1
00 0 1 0 1 00
0 0 0 00 0 0 1
01 0 1 0 0 00
0 1 0 20 0 0 1
00 0 0 1 1 00
0 3 0 00 1 0 0
00 0 3 1 0 00
0 0 5 00 0 0 0
10 0 3 1 20 00
2 0 0 00 0 0 1
10 0 1 3 3 08
0 0 1 00 0 0 4
00 0 1 0 1 10
0 2 0 00 0 1 0
00 0 1 0 2 00
0 0 1 00 0 0 2
00 1 1 3 7 00
1 0 0 02 0 1 1
00 0 3 2 1 00
1 1 0 00 0 1 1
100 0 1 1 0 00
0 0 0 00 0 0 0
00 0 5 1 2 00
1 1 0 10 0 0 1
Flash EB334
Flash EB334
Flash EB334
Flash EB334
Flash EB334
Flash EB334
Flash EB334
Flash EB334
Polen Portugal Rumänien SlowakeiLitauen Luxemburg Malta Niederlande
SlovakiaLuxembourg Malta Netherlands Poland Portugal RomaniaLithuania
Pologne Portugal Roumanie SlovaquieLituanie Luxembourg Malte Pays-Bas
Q14 Dans quel(s) pays avez-vous l'intention de passer vos vacances en 2012? (NE PAS LIRE - PLUSIEURS REPONSES POSSIBLES)
Q14 In which country(ies) do you plan to spend your holidays in 2012? (DO NOT READ OUT - MULTIPLE ANSWERS POSSIBLE)
Q14 In welchem Land/welchen Ländern planen Sie, 2012 Ihren Urlaub zu verbringen? (NICHT VORLESEN - MEHRFACHNENNUNGEN MÖGLICH)
49
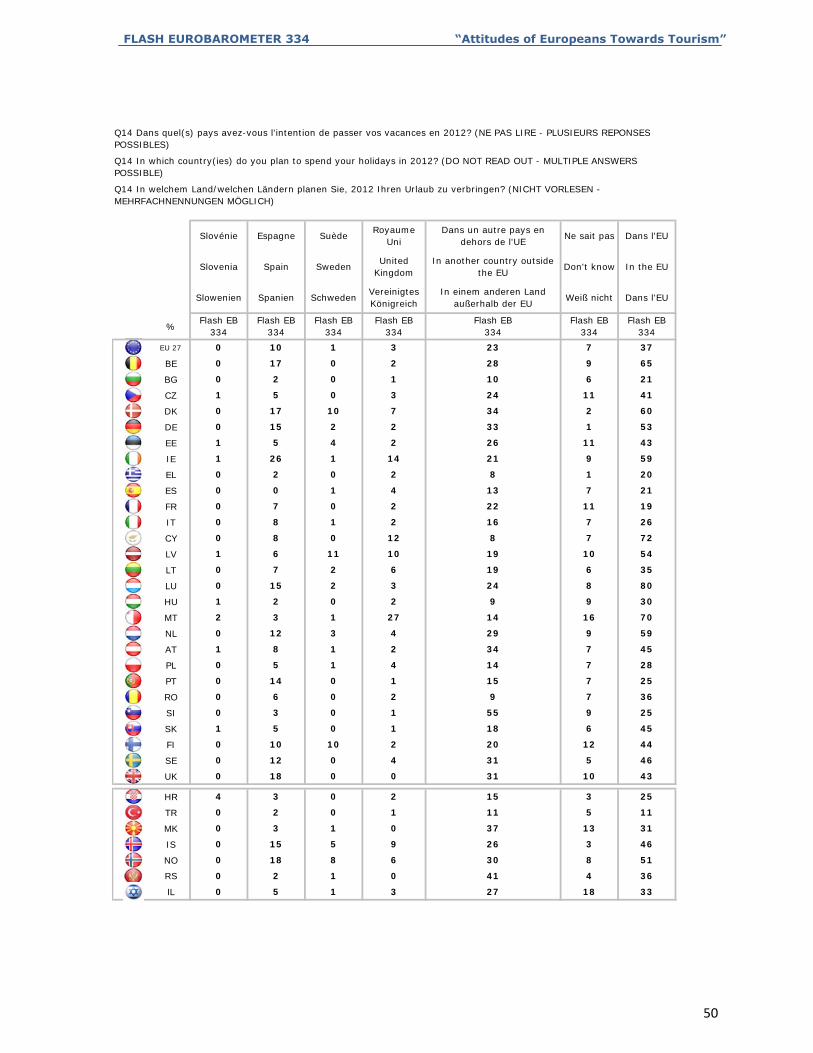
FLASH EUROBAROMETER 334 “Attitudes of Europeans Towards Tourism”
%
EU 27
BE
BG
CZ
DK
DE
EE
IE
EL
ES
FR
IT
CY
LV
LT
LU
HU
MT
NL
AT
PL
PT
RO
SI
SK
FI
SE
UK
HR
TR
MK
IS
NO
RS
IL 1 3 27 18 330 5
4 360 2 1 0 41
8 6 30 8 510 18
3 460 15 5 9 26
1 0 37 13 310 3
5 110 2 0 1 11
0 2 15 3 254 3
10 430 18 0 0 31
0 4 31 5 460 12
12 440 10 10 2 20
0 1 18 6 451 5
9 250 3 0 1 55
0 2 9 7 360 6
7 250 14 0 1 15
1 4 14 7 280 5
7 451 8 1 2 34
3 4 29 9 590 12
16 702 3 1 27 14
0 2 9 9 301 2
8 800 15 2 3 24
2 6 19 6 350 7
10 541 6 11 10 19
0 12 8 7 720 8
7 260 8 1 2 16
0 2 22 11 190 7
7 210 0 1 4 13
0 2 8 1 200 2
9 591 26 1 14 21
4 2 26 11 431 5
1 530 15 2 2 33
10 7 34 2 600 17
11 411 5 0 3 24
0 1 10 6 210 2
9 650 17 0 2 28
1 3 23 7 370 10
Flash EB334
Flash EB334
Flash EB334
Flash EB334
Flash EB334
Flash EB334
Flash EB334
SchwedenVereinigtes Königreich
In einem anderen Land außerhalb der EU
Weiß nicht Dans l'EUSlowenien Spanien
Don't know In the EUSlovenia Spain SwedenUnited
KingdomIn another country outside
the EU
SuèdeRoyaume
UniDans un autre pays en
dehors de l'UENe sait pas Dans l'EUSlovénie Espagne
Q14 Dans quel(s) pays avez-vous l'intention de passer vos vacances en 2012? (NE PAS LIRE - PLUSIEURS REPONSES POSSIBLES)
Q14 In which country(ies) do you plan to spend your holidays in 2012? (DO NOT READ OUT - MULTIPLE ANSWERS POSSIBLE)
Q14 In welchem Land/welchen Ländern planen Sie, 2012 Ihren Urlaub zu verbringen? (NICHT VORLESEN - MEHRFACHNENNUNGEN MÖGLICH)
50
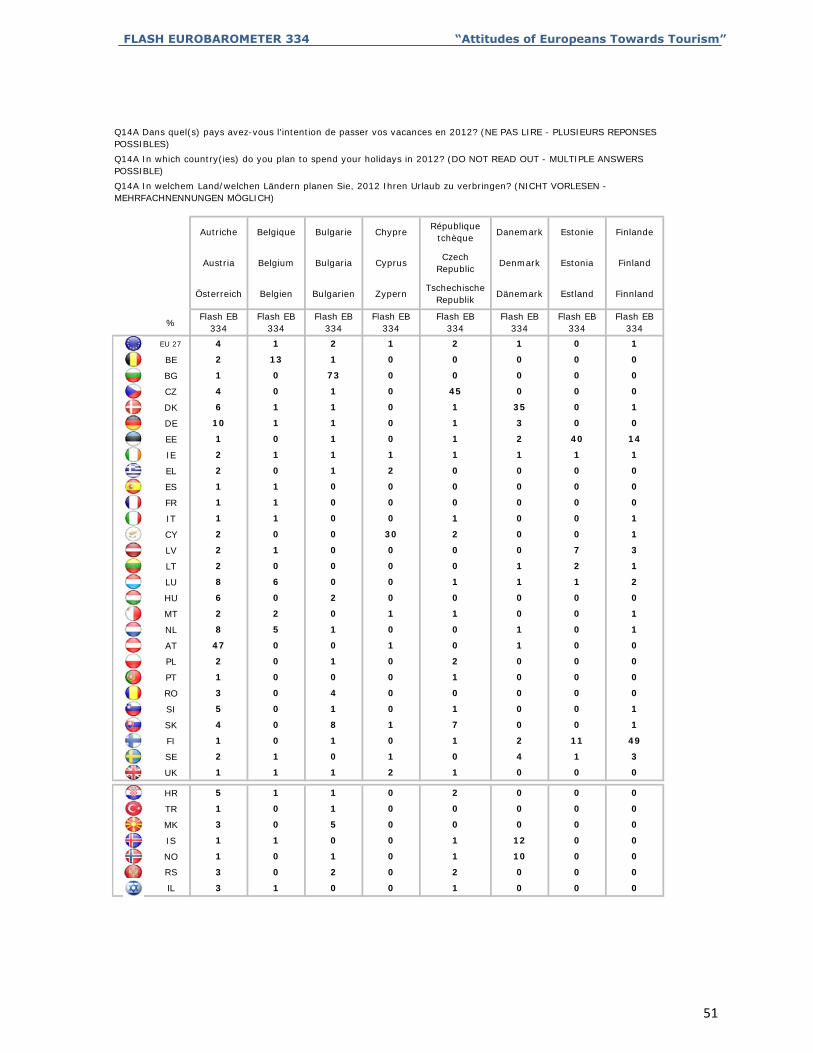
FLASH EUROBAROMETER 334 “Attitudes of Europeans Towards Tourism”
%
EU 27
BE
BG
CZ
DK
DE
EE
IE
EL
ES
FR
IT
CY
LV
LT
LU
HU
MT
NL
AT
PL
PT
RO
SI
SK
FI
SE
UK
HR
TR
MK
IS
NO
RS
IL
Q14A Dans quel(s) pays avez-vous l'intention de passer vos vacances en 2012? (NE PAS LIRE - PLUSIEURS REPONSES POSSIBLES)
Q14A In which country(ies) do you plan to spend your holidays in 2012? (DO NOT READ OUT - MULTIPLE ANSWERS POSSIBLE)
Q14A In welchem Land/welchen Ländern planen Sie, 2012 Ihren Urlaub zu verbringen? (NICHT VORLESEN - MEHRFACHNENNUNGEN MÖGLICH)
Belgique
Belgium
Belgien
Flash EB334
Autriche
Austria
Österreich
Flash EB334
Chypre
Cyprus
Zypern
Flash EB334
Bulgarie
Bulgaria
Bulgarien
Flash EB334
Danemark
Denmark
Dänemark
Flash EB334
République tchèque
Czech Republic
Tschechische Republik
Flash EB334
Finlande
Finland
Finnland
Flash EB334
Estonie
Estonia
Estland
Flash EB334
2 1 0 14 1 2 1
0 02 13 1 0 0 0
1 0 73 0 0 0 0 0
0 04 0 1 0 45 0
6 1 1 0 1 35 0 1
0 010 1 1 0 1 3
1 0 1 0 1 2 40 14
1 12 1 1 1 1 1
2 0 1 2 0 0 0 0
0 01 1 0 0 0 0
1 1 0 0 0 0 0 0
0 11 1 0 0 1 0
2 0 0 30 2 0 0 1
7 32 1 0 0 0 0
2 0 0 0 0 1 2 1
1 28 6 0 0 1 1
6 0 2 0 0 0 0 0
0 12 2 0 1 1 0
8 5 1 0 0 1 0 1
0 047 0 0 1 0 1
2 0 1 0 2 0 0 0
0 01 0 0 0 1 0
3 0 4 0 0 0 0 0
0 15 0 1 0 1 0
4 0 8 1 7 0 0 1
11 491 0 1 0 1 2
2 1 0 1 0 4 1 3
0 01 1 1 2 1 0
5 1 1 0 2 0 0 0
0 01 0 1 0 0 0
3 0 5 0 0 0 0 0
0 01 1 0 0 1 12
1 0 1 0 1 10 0 0
0 03 0 2 0 2 0
3 1 0 0 1 0 0 0
51

FLASH EUROBAROMETER 334 “Attitudes of Europeans Towards Tourism”
%
EU 27
BE
BG
CZ
DK
DE
EE
IE
EL
ES
FR
IT
CY
LV
LT
LU
HU
MT
NL
AT
PL
PT
RO
SI
SK
FI
SE
UK
HR
TR
MK
IS
NO
RS
IL 1 7 0 07 5 2 2
0 3 0 01 5 19 1
0 7 0 07 2 5 1
0 6 0 04 7 2 2
0 3 0 01 3 13 0
0 2 0 03 3 1 0
1 5 0 02 3 1 1
2 4 0 010 2 6 0
1 8 1 17 6 5 1
0 4 0 05 6 4 1
1 10 0 03 2 7 3
0 8 0 04 2 3 1
0 10 0 04 5 6 2
0 4 0 07 1 0 0
1 5 0 02 3 3 1
1 21 0 04 8 4 2
1 13 0 018 12 4 1
0 30 0 08 4 2 0
1 6 0 02 4 6 63
2 16 0 022 10 1 0
2 4 4 532 6 1 0
2 6 38 85 5 1 0
0 8 0 07 3 36 1
0 60 0 06 3 5 0
1 3 0 058 2 1 0
0 5 0 05 3 1 0
0 4 0 03 3 80 1
30 7 0 011 3 2 0
2 4 5 23 4 1 1
1 14 0 06 42 3 1
1 13 0 010 10 5 1
0 11 0 04 4 6 1
0 3 0 03 1 11 0
0 9 0 035 6 4 0
1 13 0 113 10 5 2
Flash EB334
Flash EB334
Flash EB334
Flash EB334
Flash EB334
Flash EB334
Flash EB334
Flash EB334
Irland Italien Lettland LitauenFrankreich Deutschland Griechenland Ungarn
Ireland Italy Latvia LithuaniaFrance Germany Greece Hungary
Lettonie LituanieFrance Allemagne Grèce Hongrie Irlande Italie
Q14A Dans quel(s) pays avez-vous l'intention de passer vos vacances en 2012? (NE PAS LIRE - PLUSIEURS REPONSES POSSIBLES)
Q14A In which country(ies) do you plan to spend your holidays in 2012? (DO NOT READ OUT - MULTIPLE ANSWERS POSSIBLE)
Q14A In welchem Land/welchen Ländern planen Sie, 2012 Ihren Urlaub zu verbringen? (NICHT VORLESEN - MEHRFACHNENNUNGEN MÖGLICH)
52

FLASH EUROBAROMETER 334 “Attitudes of Europeans Towards Tourism”
%
EU 27
BE
BG
CZ
DK
DE
EE
IE
EL
ES
FR
IT
CY
LV
LT
LU
HU
MT
NL
AT
PL
PT
RO
SI
SK
FI
SE
UK
HR
TR
MK
IS
NO
RS
IL 3 0 0 0 0 00 0
1 0 0 0 0 00 0
1 1 1 0 0 00 0
2 1 1 0 0 00 0
0 0 0 0 0 00 0
0 0 0 0 0 00 0
1 1 1 0 0 40 0
2 1 2 0 0 00 1
1 1 1 0 0 00 0
2 1 1 0 0 00 0
1 0 1 1 43 10 0
1 0 1 0 0 300 0
1 0 0 57 0 00 0
1 0 63 0 0 01 0
1 66 1 0 2 00 0
0 1 1 0 0 10 0
26 0 3 0 0 01 0
3 1 0 0 0 20 3
0 0 0 5 0 10 0
3 1 20 0 1 02 0
1 2 0 0 0 00 0
1 3 3 0 1 10 0
4 0 0 1 0 00 0
1 0 1 1 0 00 0
0 0 2 0 0 00 1
1 0 2 0 0 00 0
2 0 0 1 0 00 0
1 3 7 0 0 10 1
1 1 0 0 0 10 1
3 2 1 0 0 00 0
1 1 1 0 0 00 1
1 1 0 0 10 10 0
0 0 0 0 0 00 0
5 1 2 0 0 00 0
2 6 2 3 1 00 0
Flash EB334
Flash EB334
Flash EB334
Flash EB334
Flash EB334
Flash EB334
Flash EB334
Flash EB334
Niederlande Polen Portugal Rumänien Slowakei SlowenienLuxemburg Malta
Netherlands Poland Portugal Romania Slovakia SloveniaLuxembourg Malta
Portugal Roumanie Slovaquie SlovénieLuxembourg Malte Pays-Bas Pologne
Q14A Dans quel(s) pays avez-vous l'intention de passer vos vacances en 2012? (NE PAS LIRE - PLUSIEURS REPONSES POSSIBLES)
Q14A In which country(ies) do you plan to spend your holidays in 2012? (DO NOT READ OUT - MULTIPLE ANSWERS POSSIBLE)
Q14A In welchem Land/welchen Ländern planen Sie, 2012 Ihren Urlaub zu verbringen? (NICHT VORLESEN - MEHRFACHNENNUNGEN MÖGLICH)
53

FLASH EUROBAROMETER 334 “Attitudes of Europeans Towards Tourism”
%
EU 27
BE
BG
CZ
DK
DE
EE
IE
EL
ES
FR
IT
CY
LV
LT
LU
HU
MT
NL
AT
PL
PT
RO
SI
SK
FI
SE
UK
HR
TR
MK
IS
NO
RS
IL 5 1 3 57 18 33
2 1 0 70 4 36
18 8 6 62 8 51
15 5 9 72 3 46
3 1 0 61 13 31
2 0 1 88 5 11
3 0 2 84 3 25
18 0 42 31 10 72
12 53 4 31 5 83
10 10 2 20 12 79
5 0 1 18 6 80
3 0 1 55 9 52
6 0 2 9 7 87
14 0 1 15 7 83
5 1 4 14 7 84
8 1 2 34 7 77
12 3 4 29 9 77
3 1 27 14 16 73
2 0 2 9 9 86
15 2 3 24 8 81
7 2 6 19 6 81
6 11 10 19 10 81
8 0 12 8 7 89
8 1 2 16 7 81
7 0 2 22 11 73
68 1 4 13 7 83
2 0 2 8 1 95
26 1 14 21 9 80
5 4 2 26 11 74
15 2 2 33 1 81
17 10 7 34 2 80
5 0 3 24 11 77
2 0 1 10 6 89
17 0 2 28 9 73
16 2 9 23 7 79
Flash EB334
Flash EB334
Flash EB334
Flash EB334
Flash EB334
Flash EB334
Spanien SchwedenVereinigtes Königreich
In einem anderen Land außerhalb der EU
Weiß nicht Dans l'EU
Spain SwedenUnited
KingdomIn another country
outside the EUDon't know In the EU
Royaume UniDans un autre pays en
dehors de l'UENe sait pas Dans l'EUEspagne Suède
Q14A Dans quel(s) pays avez-vous l'intention de passer vos vacances en 2012? (NE PAS LIRE - PLUSIEURS REPONSES POSSIBLES)
Q14A In which country(ies) do you plan to spend your holidays in 2012? (DO NOT READ OUT - MULTIPLE ANSWERS POSSIBLE)
Q14A In welchem Land/welchen Ländern planen Sie, 2012 Ihren Urlaub zu verbringen? (NICHT VORLESEN - MEHRFACHNENNUNGEN MÖGLICH)
54

FLASH EUROBAROMETER 334 “Attitudes of Europeans Towards Tourism”
%
EU 27
BE
BG
CZ
DK
DE
EE
IE
EL
ES
FR
IT
CY
LV
LT
LU
HU
MT
NL
AT
PL
PT
RO
SI
SK
FI
SE
UK
HR
TR
MK
IS
NO
RS
IL
Q15 La situation économique actuelle a-t-elle eu une influence sur vos projets de vacances pour 2012? (3 RÉPONSES POSSIBLES)
Q15 Has the current economic situation had an impact on your holiday plans for 2012? (3 ANSWERS POSSIBLE)
Q15 Hat die derzeitige Wirtschaftslage Auswirkungen auf Ihre Urlaubsplanung für 2012 gehabt? (3 NENNUNGEN MÖGLICH)
Je partirai en vacances mais j'ai changé de destination
I will go on holiday but I changed my destinations
Ich werde in den Urlaub fahren, habe aber die Reiseziele geändert
Flash EB334
Cela n'a pas modifié mes projets de vacances
It has not changed my planned holiday
Die Wirtschaftslage hat nicht zu einer Änderung meiner Urlaubspläne geführt
Flash EB334
Je partirai en vacances mais moins longtemps
I will go on holiday but for a shorter period
Ich werde in den Urlaub fahren, allerdings für einen kürzeren
Zeitraum
Flash EB334
40 4 12
39 3 11
22 3 19
40 6 13
74 3 4
71 3 5
36 4 11
28 10 21
7 3 27
22 4 17
35 3 13
21 2 16
21 7 19
33 3 14
38 5 12
46 8 10
21 6 18
30 2 7
59 3 6
69 2 5
40 3 12
13 7 12
20 3 19
52 4 16
33 7 13
72 1 3
65 5 7
45 7 8
23 4 19
14 3 10
18 13 19
37 6 9
73 3 2
24 3 7
23 11 17
55
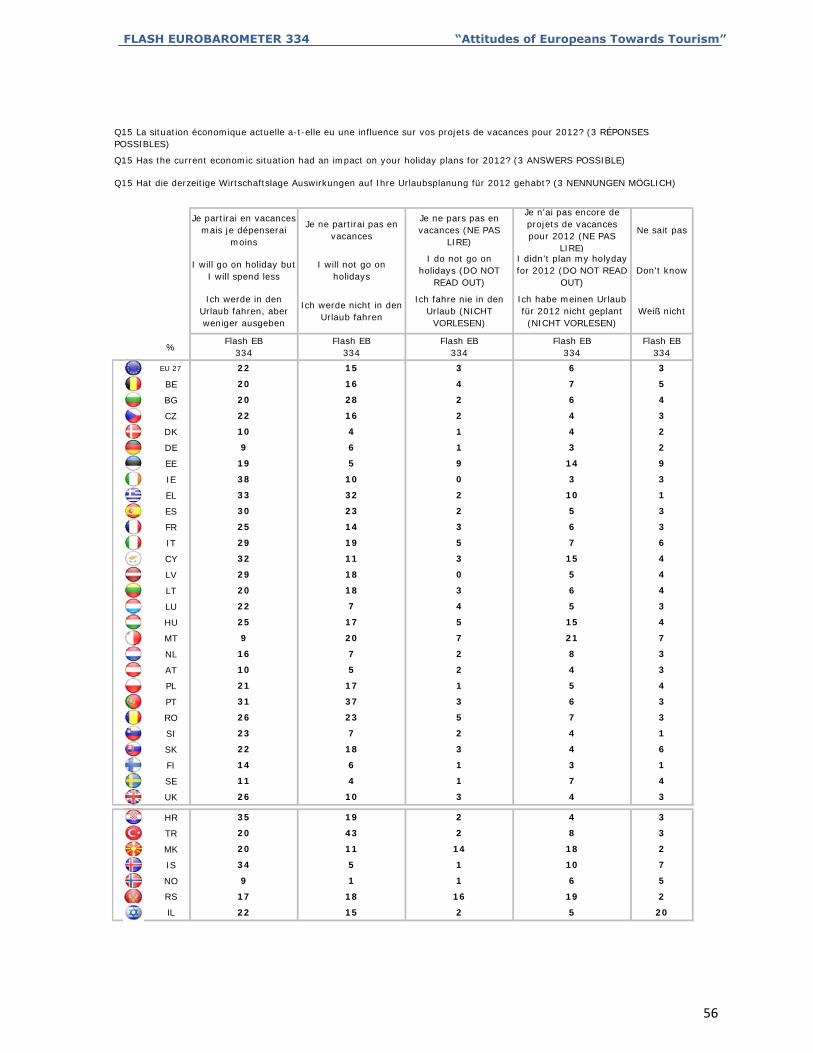
FLASH EUROBAROMETER 334 “Attitudes of Europeans Towards Tourism”
%
EU 27
BE
BG
CZ
DK
DE
EE
IE
EL
ES
FR
IT
CY
LV
LT
LU
HU
MT
NL
AT
PL
PT
RO
SI
SK
FI
SE
UK
HR
TR
MK
IS
NO
RS
IL
19 2
22 15 2 5 20
17 18 16
10 7
9 1 1 6 5
34 5 1
8 3
20 11 14 18 2
20 43 2
4 3
35 19 2 4 3
26 10 3
3 1
11 4 1 7 4
14 6 1
4 1
22 18 3 4 6
23 7 2
6 3
26 23 5 7 3
31 37 3
4 3
21 17 1 5 4
10 5 2
21 7
16 7 2 8 3
9 20 7
5 3
25 17 5 15 4
22 7 4
5 4
20 18 3 6 4
29 18 0
7 6
32 11 3 15 4
29 19 5
5 3
25 14 3 6 3
30 23 2
3 3
33 32 2 10 1
38 10 0
3 2
19 5 9 14 9
9 6 1
4 3
10 4 1 4 2
22 16 2
7 5
20 28 2 6 4
20 16 4
Flash EB334
Flash EB334
22 15 3 6 3
Flash EB334
Flash EB334
Flash EB334
I didn’t plan my holyday for 2012 (DO NOT READ
OUT)Don't know
Ich werde in den Urlaub fahren, aber weniger ausgeben
Ich werde nicht in den Urlaub fahren
Ich fahre nie in den Urlaub (NICHT
VORLESEN)
Ich habe meinen Urlaub für 2012 nicht geplant (NICHT VORLESEN)
Weiß nicht
I will go on holiday but I will spend less
I will not go on holidays
I do not go on holidays (DO NOT
READ OUT)
Je partirai en vacances mais je dépenserai
moins
Je ne partirai pas en vacances
Je ne pars pas en vacances (NE PAS
LIRE)
Je n'ai pas encore de projets de vacances pour 2012 (NE PAS
LIRE)
Ne sait pas
Q15 La situation économique actuelle a-t-elle eu une influence sur vos projets de vacances pour 2012? (3 RÉPONSES POSSIBLES)
Q15 Has the current economic situation had an impact on your holiday plans for 2012? (3 ANSWERS POSSIBLE)
Q15 Hat die derzeitige Wirtschaftslage Auswirkungen auf Ihre Urlaubsplanung für 2012 gehabt? (3 NENNUNGEN MÖGLICH)
56

FLASH EUROBAROMETER 334 “Attitudes of Europeans Towards Tourism”
%
EU 27
BE
BG
CZ
DK
DE
EE
IE
EL
ES
FR
IT
CY
LV
LT
LU
HU
MT
NL
AT
PL
PT
RO
SI
SK
FI
SE
UK
HR
TR
MK
IS
NO
RS
IL
Q15A La situation économique actuelle a-t-elle eu une influence sur vos projets de vacances pour 2012? (3 RÉPONSES POSSIBLES)
Q15A Has the current economic situation had an impact on your holiday plans for 2012? (3 ANSWERS POSSIBLE)
Q15A Hat die derzeitige Wirtschaftslage Auswirkungen auf Ihre Urlaubsplanung für 2012 gehabt? (3 NENNUNGEN MÖGLICH)
Partirons en vacances
Are going on holiday
Partirons en vacances
Flash EB334
Ne partirons pas en vacances
Flash EB334
Partirons en vacances mais ont changé leurs
projets
Are going on holiday but changed their plans
Partirons en vacances mais ont changé leurs
projets
Flash EB334
40 33 18 9
NSP/SR
DK/NA
NSP/SR
Flash EB334
Ne partirons pas en vacances
Are not going on holiday
23 37 30 10
39 29 20 12
74 15 5 6
40 34 18 8
36 27 14 23
71 16 7 6
6 48 35 11
28 56 10 6
35 37 18 10
22 45 25 8
21 46 14 19
20 42 24 14
38 31 21 10
33 40 18 9
21 38 22 19
46 35 11 8
59 21 9 11
30 15 27 28
40 33 18 9
69 17 8 6
20 43 27 10
12 39 40 9
33 37 20 10
53 33 8 6
65 19 5 11
72 17 7 4
23 49 21 7
44 35 14 7
18 37 25 20
13 30 45 12
73 14 2 11
37 40 6 17
23 37 16 24
24 21 34 21
57