Attend To Count: Crowd Counting with Adaptive Capacity ...
10
Attend To Count: Crowd Counting with Adaptive Capacity Multi-scale CNNs Zhikang Zou a , Yu Cheng b , Xiaoye Qu a , Shouling Ji c , Xiaoxiao Guo d , Pan Zhou a,* a School of Electronic Information and Communication, Huazhong University of Science and Technology b Microsoft Research & AI c College of Computer Science and Technology, Zhejiang University d IBM & AI Foundations Learning Abstract Crowd counting is a challenging task due to the large variations in crowd distributions. Previous methods tend to tackle the whole image with a single fixed structure, which is unable to handle diverse complicated scenes with different crowd densities. Hence, we propose the Adaptive Capacity Multi-scale convolutional neural networks (ACM-CNN), a novel crowd counting approach which can assign different capacities to different portions of the input. The intuition is that the model should focus on important regions of the input image and optimize its capacity allocation conditioning on the crowd intensive degree. ACM-CNN consists of three types of modules: a coarse network, a fine network, and a smooth network. The coarse network is used to explore the areas that need to be focused via count attention mechanism, and generate a rough feature map. Then the fine network processes the areas of interest into a fine feature map. To alleviate the sense of division caused by fusion, the smooth network is designed to combine two feature maps organically to produce high-quality density maps. Extensive experiments are conducted on five mainstream datasets. The results demonstrate the effectiveness of the proposed model for both density estimation and crowd counting tasks. Keywords: Crowd Counting, Attention Mechanism, Multi-scale CNNs, Adaptive Capacity 1. Introduction The goal of crowd counting is to count the number of crowds in a surveillance scene, which lays on an impor- tant component in many computer vision applications. As the first and the most important part of crowd manage- ment, automatic crowd counting can monitor the crowd density of surveillance areas and alert the manager for safety control if the density exceeds specified thresholds. However, precise crowd estimation remains challenging as it demands the extractor to be able to capture pedestrians in various scenes with diverse population distribution (see Figure 1). Previous methods [1, 2] adopt a detection-style frame- work, where a sliding window detector is used to estimate the number of people. The limitation of such detection- based methods is that severe occlusion among people in a clustered environment always results in poor perfor- mance. To deal with images of dense crowds, some focus on regression-based methods [3, 4], which directly learn a mapping from the features of image patches to the count in the region. Despite the progress in addressing the issues of occlusion, these methods are not efficient since extracting hand-craft features consumes many resources. In the past decades, the approaches built on Convolu- tional Neural Networks (CNN) have shown strong gener- alization ability to handle complicated scenarios by virtue * Corresponding author of automatic feature extraction process. However, the per- formance of different models varies largely across different crowd densities. MCNN [5], utilizing three simple columns with different receptive fields to tackle the scale variations, performs well in sparsely populated scenes such as UCSD dataset but loses its superiority in dense crowd scenes like Shanghai dataset. Whereas SaCNN [6] that incorporates a deep backbone with small fixed kernels turns out to be the opposite. This indicates that a single model is not suffi- cient enough to effectively cope with all datasets with mul- tiple density levels. Even for images in the same dataset, the distribution of crowds is not uniform, which means processing the whole image with one fixed model usually results in under-estimating or over-estimating count in the crowd image. The work Switch-CNN [7] divides the crowd scenes into non-overlapping patches and sends each patch to a particular column depending on the classification net- work. Although this strategy improves the adaptability of the model to some extent, there are two main drawbacks in this work. One is that the representation ability is sim- ilar for each column with the same capacity, the other is that artificially dividing images is not proper. One obvious solution to address these problems is to assign adaptive capacities to different portions across the scene based on their density levels. The aforementioned examples illustrate that a deep network is able to han- dle the regions with high density while a shallow network achieves better performance in sparse regions. Therefore, Preprint submitted to Journal of L A T E X Templates August 27, 2019 arXiv:1908.02797v2 [cs.CV] 26 Aug 2019
Transcript of Attend To Count: Crowd Counting with Adaptive Capacity ...

Attend To Count: Crowd Counting with Adaptive Capacity Multi-scale CNNs
Zhikang Zoua, Yu Chengb, Xiaoye Qua, Shouling Jic, Xiaoxiao Guod, Pan Zhoua,∗
aSchool of Electronic Information and Communication, Huazhong University of Science and TechnologybMicrosoft Research & AI
cCollege of Computer Science and Technology, Zhejiang UniversitydIBM & AI Foundations Learning
Abstract
Crowd counting is a challenging task due to the large variations in crowd distributions. Previous methods tend totackle the whole image with a single fixed structure, which is unable to handle diverse complicated scenes with differentcrowd densities. Hence, we propose the Adaptive Capacity Multi-scale convolutional neural networks (ACM-CNN), anovel crowd counting approach which can assign different capacities to different portions of the input. The intuition isthat the model should focus on important regions of the input image and optimize its capacity allocation conditioningon the crowd intensive degree. ACM-CNN consists of three types of modules: a coarse network, a fine network, and asmooth network. The coarse network is used to explore the areas that need to be focused via count attention mechanism,and generate a rough feature map. Then the fine network processes the areas of interest into a fine feature map. Toalleviate the sense of division caused by fusion, the smooth network is designed to combine two feature maps organicallyto produce high-quality density maps. Extensive experiments are conducted on five mainstream datasets. The resultsdemonstrate the effectiveness of the proposed model for both density estimation and crowd counting tasks.
Keywords: Crowd Counting, Attention Mechanism, Multi-scale CNNs, Adaptive Capacity
1. Introduction
The goal of crowd counting is to count the number ofcrowds in a surveillance scene, which lays on an impor-tant component in many computer vision applications. Asthe first and the most important part of crowd manage-ment, automatic crowd counting can monitor the crowddensity of surveillance areas and alert the manager forsafety control if the density exceeds specified thresholds.However, precise crowd estimation remains challenging asit demands the extractor to be able to capture pedestriansin various scenes with diverse population distribution (seeFigure 1).
Previous methods [1, 2] adopt a detection-style frame-work, where a sliding window detector is used to estimatethe number of people. The limitation of such detection-based methods is that severe occlusion among people ina clustered environment always results in poor perfor-mance. To deal with images of dense crowds, some focuson regression-based methods [3, 4], which directly learn amapping from the features of image patches to the count inthe region. Despite the progress in addressing the issues ofocclusion, these methods are not efficient since extractinghand-craft features consumes many resources.
In the past decades, the approaches built on Convolu-tional Neural Networks (CNN) have shown strong gener-alization ability to handle complicated scenarios by virtue
∗Corresponding author
of automatic feature extraction process. However, the per-formance of different models varies largely across differentcrowd densities. MCNN [5], utilizing three simple columnswith different receptive fields to tackle the scale variations,performs well in sparsely populated scenes such as UCSDdataset but loses its superiority in dense crowd scenes likeShanghai dataset. Whereas SaCNN [6] that incorporates adeep backbone with small fixed kernels turns out to be theopposite. This indicates that a single model is not suffi-cient enough to effectively cope with all datasets with mul-tiple density levels. Even for images in the same dataset,the distribution of crowds is not uniform, which meansprocessing the whole image with one fixed model usuallyresults in under-estimating or over-estimating count in thecrowd image. The work Switch-CNN [7] divides the crowdscenes into non-overlapping patches and sends each patchto a particular column depending on the classification net-work. Although this strategy improves the adaptability ofthe model to some extent, there are two main drawbacksin this work. One is that the representation ability is sim-ilar for each column with the same capacity, the other isthat artificially dividing images is not proper.
One obvious solution to address these problems is toassign adaptive capacities to different portions across thescene based on their density levels. The aforementionedexamples illustrate that a deep network is able to han-dle the regions with high density while a shallow networkachieves better performance in sparse regions. Therefore,
Preprint submitted to Journal of LATEX Templates August 27, 2019
arX
iv:1
908.
0279
7v2
[cs
.CV
] 2
6 A
ug 2
019

Dense scenes Sparse scenes
Figure 1: Top row indicates typical static crowd scenes from themost commonly used datasets (Shanghaitech, WorldExpo’10, Mall,UCSD in order) and the bottom row represents their correspondingattention map from our network.
the goal is divided into two aspects: (1) a model is builtto automatically distinguish areas of different density lev-els in the scene, as is shown in Figure 1; (2) networks ofdifferent capacities are specialized for specific areas andintegrated to obtain the final result.
To achieve this, we propose the Adaptive CapacityMulti-scale CNNs (ACM-CNN), which could focus on im-portant regions via count attention mechanism withoutprior knowledge and assign its capacity depending on thedensity level. This is achieved by exploiting three subnet-works: a coarse network, fine network and smooth net-work. The coarse network is a multi-column architecturewith shallow layers, which is used to locate dense regionsand generate a rough feature map. While the fine network,a deep architecture based on VGGNets [8], processes thedense regions into a fine feature map. Since adding uptwo feature maps directly will lead to the sense of divisionin the result images, we incorporate the smooth networkto fuse two features organically and thereby generate thehigh-quality density map. ACM-CNN is a fully convolu-tional design which can be optimized via an end-to-endtraining scheme.
In summary, the main contributions of this paper are:
• As far as we know, our work is the first attempt to in-troduce the adaptive capacity model for crowd count-ing problem. The primary aim is to take advantageof the different complex networks, which have uniquerepresentation abilities to deal with the regions withdifferent density levels.
• We propose a novel attention mechanism termed ascount attention, which could automatically locatedense regions of the input without prior knowledge.
• We propose a general crowd counting system that canchoose the proper network of the right capacity for aspecific scene of crowd distribution.
2. Related work
2.1. Crowd counting
Crowd counting has attracted lots of researchers to cre-ate various methods in pursuit of a more accurate result
[9, 10, 11, 12, 13]. The earlier traditional methods [2] whichadopt a detection-style framework have trouble with solv-ing severe occlusions and high clutter. To overcome this is-sue, regression-based methods [3, 4] have been introduced.The main idea of these methods is to learn a mappingbetween features extracted from the local images to theircounts. Nevertheless, the representation ability of the low-level features are limited, which cannot be widely applied.Recently, most researchers focus on Convolutional NeuralNetwork (CNN) based approaches inspired by the greatsuccess in visual classification and recognition [14, 15, 16].In order to cope with the scale variation of people in crowdcounting, the MCNN [5] use receptive fields of differentsizes in each column to capture a specific range of headsizes. With similar idea, Sam et al. [7] train a switch clas-sifier to choose the best column for image patches whileSindagi et al. [17] encode local and global context into thedensity estimation process to boost the performance. Fur-ther, Sam et al. [18] extend their previous work by train-ing a growing CNN which can progressively increase itscapacity. Later, scale aggregation modules are proposedby Cao et al. [19] to improve the representation ability andscale diversity of features. Instead of using multi-columnarchitectures, Li et al. [20] modify the VGG nets withdilated convolutional filters to aggregate the multi-scalecontextual information. Liu et al. [21] adaptively adoptdetection and regression count estimations based on thedensity conditions. Differently, some works pay more at-tention to context information. Ranjan et al. [22] proposean iterative crowd counting framework, which first pro-duces the low-resolution density map and then uses it tofurther generate the high-resolution density map. Further,multi-scale contextual information is incorporated into anend-to-end trainable pipeline CAN [23], so the proposednetwork is capable of exploiting the right context at eachimage location.
2.2. Attention mechanism
Recent years have witnessed the boom of deep convolu-tional nerual network in many challenging tasks, rangingfrom image classification to object detection [24, 25, 26,27, 28]. However, it is computationally expensive becausethe amount of the computation scales increases linearlywith the number of image pixels. In parallel, the conceptof attention has gained popularity recently in training neu-ral networks, allowing models to learn alignments betweendifferent modalities [29, 30]. In [31], researchers attemptto use hard attention mechanism learning to selectivelyfocus on task-relevant input regions, thus improving theaccuracy of recognizing multiple objects and the efficiencyof computation. Almahairi et al. [32] propose dynamiccapacity network based on hard attention mechanism thatefficiently identifies input regions to which the DCNs out-put is most sensitive and we should devote more capacity.Recently, some researchers attempt to use the attentionmechanism in crowd counting. MA Hossain et al. [33]
2
9x9,16
MP,2x2
7x7,32
MP,2x2
7x7,16
7x7,8
1x1,8
7x7,20
MP,2x2
5x5,40
MP,2x2
5x5,20
5x5,10
1x1,10
5x5,24
MP,2x2
3x3,48
MP,2x2
3x3,24
7x7,12
1x1,12
1x1,1
C0
Count
Attention
F
S0 SN+1
C0
S0
posi
Si
Si+1
Top i
Ci
CSMi-S
CSMi-C Ci+1
...
Coarse network Fine network
CN+1
Block1,64
MP,2x2
Block2,128
MP,2x2
Block3,256
MP,2x2
Block4,512
Block5,512
Smooth
network
MP,2x2
1x1,1 1x1,1
1x1,1 1x1,1
1x1,1 1x1,1
1x1,11x1,1
W3
W4
W5
Conv layer
DeCon layer
Max Pooling
Mb
Ma
W2
Figure 2: Architecture of the proposed Adaptive Capacity Multi-scale convolutional neural networks. The coarse network takes the inputimage S0 to generate initial feature map C0. The count attention module iteratively processes C0 to locate specific high-density SN+1. Thefine network takes SN+1 to produce detailed map F then merged with CN+1. Finally, the fusion feature map Mb is relayed to a smoothnetwork to generate prediction density map Ma.
propose a novel scale-aware attention network by combin-ing both global and local scale attentions. In addition,a novel dual path multi-scale fusion network architecturewith attention mechanism named SFANet [34] is proposed,which can perform accurate count estimation for highlycongested crowd scenes. Inspired by these works above, weprove that it is effective to introduce the attention mech-anism in crowd counting because networks with differentcomplexity have their unique characterization capabilitiesfor different population density regions. Therefore, we pro-pose a new attention strategy named count attention thatassigns different capacities to different portions of the in-put.
3. Methodology
3.1. Count Attention
As discussed in Introduction, different types of networkshave their specific learning ability in areas with differentcrowd density, hence our primary task is to differentiateregions of various density levels. In order to introduce theattention strategy, we must first describe how to conductthe data processing, which is converting an image withlabeled people heads to a density map.
Suppose the head at pixel xi, it can be represented as adelta function δ(x− xi). Therefore, we can formulate theimage I(x) with N labeled head positions as:
I(x) =
N∑i=1
δ(x− xi) (1)
Due to the fact that the cameras are generally not in abird-view, the pixels associated with different locationscorrespond to different scales. Therefore, we should takethe perspective distortion into consideration. Followingthe method introduced in the MCNN [5], the geometry-adaptive kernels are applied to generate the density maps.Specifically, the ground truth D(x) is computed by blur-ring each head annotation with a Gaussian kernel Gσ nor-malized to one, which is:
D(x) =
N∑i=1
δ(x− xi) ∗Gσi(x), with σi = βdi (2)
where di is denoted as the average distance between thehead xi and its k nearest neighbors, β and k are hyper-parameters. In this paper, we set β = 0.3 and k = 3.Thus, the variance of Gaussian kernel σi is in proportionto di. When the crowd density is larger, di will be smaller.Accordingly, σi will be smaller. For one head, the inte-gration of density values equals to one, so the smaller σimeans larger center value. In conclusion, the highest val-ues in the map indicate the most densely populated area
3

to which the network should pay great attention. Thecount attention mechanism is to traverse all the pixels inthe density map to select a set of positions with highestpixel values and crop a series of blocks centering on thesepoints as the attention regions (dense crowd regions).
3.2. Adaptive Capacity Multi-scale CNN
Our model is composed of a coarse network, fine net-work, and smooth network as shown in Figure 2. Givenan input image S0, the coarse network first extracts itsabstract features to generate a rough density map C0. Tofurther boost the quality of the density map C0, countattention is applied to iteratively generate specific high-density level regions SN+1. In detail, through this strat-egy, the geometric locations of ith (i ∈ (1, 2, ..., N)) highestpixel in C0 are picked as a mapping center at each time,denoted as posi. Similarly, the corresponding spatial map-ping region centering on posi is represented as CSMi. Wegenerate a blank image S1 with the same size as S0 anduse Si (i ∈ (1, 2, ..., N + 1)) to represent a high-densityarea map generated by each iteration. Apparently, when iequals 1, Si indicate the initialized blank map S1. In eachiteration, the CSMi of input image S0 (CSMi−S) fills inSi, which is formulated as:
Si+1 = Si + CSMi ⊗ S0 (3)
Here ⊗ means cropping the region of S0 according to thecorresponding spatial mapping region centering on posi.Then this process keeps loop until i equals N . The wholeprocedure can be represented as:
SN+1 = S1 +
N∑i=1
CSMi ⊗ S0 (4)
In this way, the high-density regions SN+1 are selectedand then relayed to a fine network to capture high-levelabstraction F. To incorporate initial map C0 with F, thelow-density regions of C0 are required to be preserved whilethe remaining area needs to be discarded. This step canalso be synchronized with the aforementioned count atten-tion. We use Ci (i ∈ (1, 2, ..., N + 1)) to represent the leftdensity map after each iteration. When i equals 1, we de-fine C1 is identical with C0. In each iteration, the CSMi
of feature map C0 (CSMi − C) is gradually stripped outfrom a feature map Ci, which is formulated as:
Ci+1 = Ci − CSMi ⊗ C0 (5)
Then this process keeps loop until i equals N . The wholeprocedure can also be represented as:
CN+1 = C1 −N∑i=1
CSMi ⊗ C0 (6)
After obtaining low-density feature CN+1, it can add upwith F to obtain a more accurate feature map Mb. How-ever, this fusion map still exposes a sense of stiff merging.
3*3
3*3
Mb Ma
Conv
Relu
Figure 3: An overview of our proposed smooth network.
To solve this issue, this fusion result Mb is relayed to asmooth network containing several convolutional layers toproduce the final density map Ma.
The detailed design of coarse network, fine network, andsmooth network will be introduced in the following section.
3.3. Model Configuration
Coarse network A three-column CNN which is similarto MCNN [5] for identical kernel size and filter numberconstitutes the coarse network. However, prominent dif-ference resides in the deconvolution layer following eachcolumn of the network, which up-samples to generate thefeature map with the same size as the input image, as isshown in Figure 2 pink rectangle. Compared to the down-sampling resultant map of MCNN [5], the deconvolutionlayer can ensure more accurate positions of highest pixelvalues which are then picked out as the centers of the se-lected high-density regions via count attention mechanism.The coarse network is adopted for the reason of its sim-plicity and effectiveness on sparse scenes.Fine network The fine network is based on VGG-16 withall the fully connected layers and the last pooling layer re-moved. Four 1*1 convolution layers followed by 1*1 decon-volution layers are connected to the last four blocks (Blockj
(j ∈ (2, 3, 4, 5))) respectively to deliver the different levelsof semantic information. Suppose Fj (j ∈ (2, 3, 4, 5)) rep-resents the output of each deconvolution layer. In order toeffectively integrate these context, four learnable weightsWj (j ∈ (2, 3, 4, 5)) are assigned to Fj (j ∈ (2, 3, 4, 5))respectively for dynamically adjusting the importance ofeach component, which can be formulated as:
F =
5∑j=2
Wj ∗ Fj (7)
Where F represents the fine feature map. This strategyhelps to achieve more fine granularity crowd description.Similarly, the choice of this fine network relies largely onits superiority dealing with dense scenes.Smooth network The smooth network is made up ofCR(12,3) and CR(1,3), where C means convolution layer,R refers to ReLU layer, the first number in every braceindicates filter number, and the second number denotesfilter size. An overview of the mooth network is shown inFigure 3. The use of this smooth network contributes tosmoother prediction map generation.
3.4. Networks Optimization
The whole model is trained on the entire dataset byback-propagating l2 loss via an end-to-end strategy. The
4

design of our model ensures that all the desired resultshave the same resolutions as the input images. Supposethere are N training images and the parameters before thesmooth network are Θm. Then Mb(Xi; Θm) represents themerged feature map before the smooth network for the i-th input image Xi. We first conduct a supervision of thisintermediate result to ensure priority learning of the coarsenetwork and the fine network. That is:
Lb =1
2N
N∑i=1
||Mb(Xi; Θm)−D(Xi)||22 (8)
where D(Xi) indicates the corresponding ground truth forXi. Besides, the differences between the final density mapMa(Xi; Θm; Θs) and the ground truth are minimized by:
La =1
2N
N∑i=1
||Ma(Xi; Θm; Θs)−D(Xi)||22 (9)
where Θs indicates the parameters of the smooth network.A weighted combination is computed on the above two lossfunctions to get the final objective:
Loverall = La + λLb (10)
where λ is the hyper-parameter balancing the learning ofthe first two networks and the smooth network. In our ex-periments, the value λ is set to 1. We train the proposedmodel using the Adam solver with the following parame-ters: learning rate 10−5 and batch size 1.
4. Experiments
4.1. Evaluation Metrics
The proposed model ACM-CNN is evaluated on fourmajor crowd counting datasets. Following the existingworks, we adopt two standard metrics, Mean Absolute Er-ror (MAE) and Mean Squared Error (MSE), to benchmarkthe model. For a test sequence with N images, MAE andMSE are defined as follows:
MAE =1
N
N∑i=1
‖ci − c̃i‖ (11)
MSE=
√√√√ 1
N
N∑i=1
‖ci − c̃i‖2 (12)
where c̃i indicates the actual count and ci represents theestimated number of pedestrians in the i-th image. MAEreflects the accuracy of the predicted count and MSE is anindicator of the robustness.
Table 1: Comparisons of ACM-CNN with other state-of-the-artmethods on ShanghaiTech dataset [5].
Part A Part BMethod MAE MSE MAE MSE
Zhang et al. (2015) 181.8 277.7 32.0 49.8MCNN (2016) 110.2 173.2 26.4 41.3
TDF-CNN 97.5 145.1 20.7 32.8Switching-CNN 90.4 135.0 21.6 33.4
CP-CNN 73.6 106.4 20.1 30.1SaCNN 86.8 139.2 16.2 25.8
ACM-CNN (ours) 72.2 103.5 17.5 22.7
Image Ground truth(381) Prediction(379.2)
Image Ground truth(584) Prediction(577.2)
Image Ground truth(1266) Prediction(1271.1)
Figure 4: Visualization of the crowd density maps by various meth-ods.
4.2. Shanghaitech dataset
The Shanghaitech crowd counting dataset [5] consistsof 1198 annotated images with a total of 330,165 people,which is said to be the largest one in terms of the num-ber of annotated people. It has two parts: one of theparts named Part A contains 482 images which are ran-domly crawled from the Internet, the other named Part Bincludes 716 images which are taken from the busy streetsof metropolitan area in Shanghai. Each of the two partsis divided into training and testing sets: in Part A, 300images are used for training and the remaining are usedfor testing while 400 images of Part B are used for trainingand 316 for testing. To augment the training set, we crop100 patches from each image at random locations and eachpatch is 1/4 size of the original image for both Part A andPart B. We compare performance between our approachwith other state-of-the-art methods in Table 1, includingZhang et al. [35], MCNN [5], TDF-CNN [36], Switch-CNN[7], CP-CNN [17], SaCNN [6]. The results indicate thatACM-CNN is able to calculate the number of crowds moreaccurately. We also report some samples of the test casesin Figure 4.
5
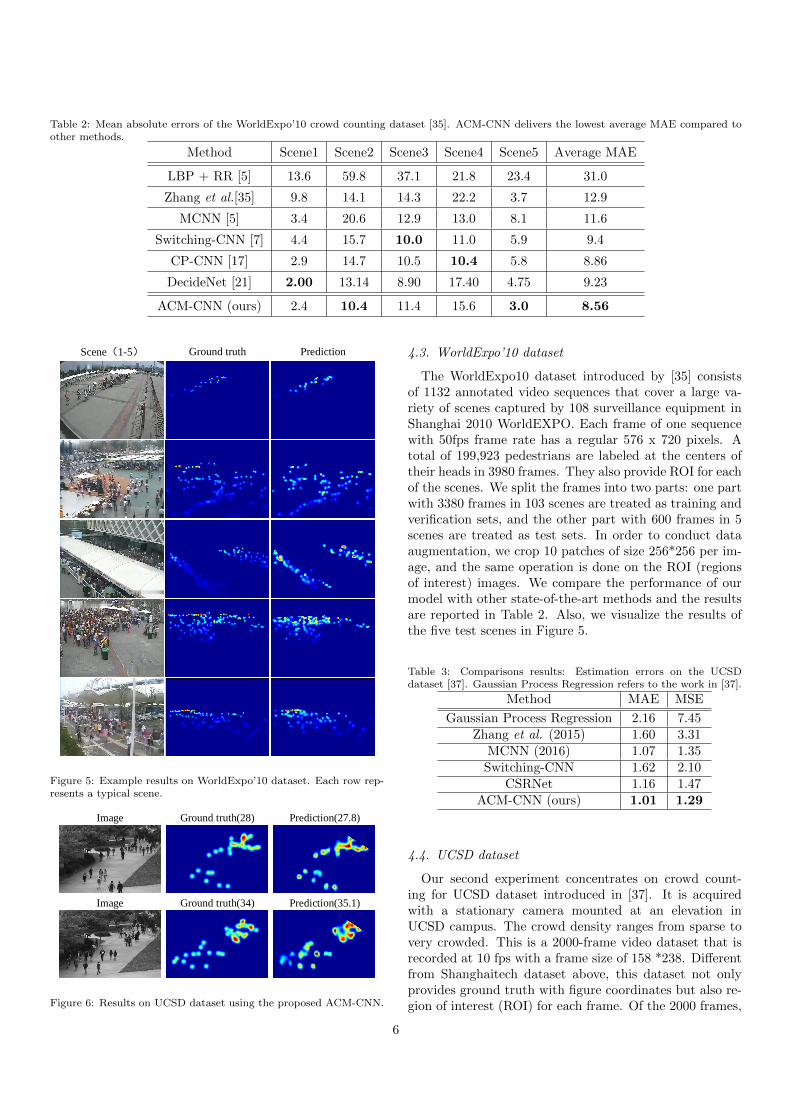
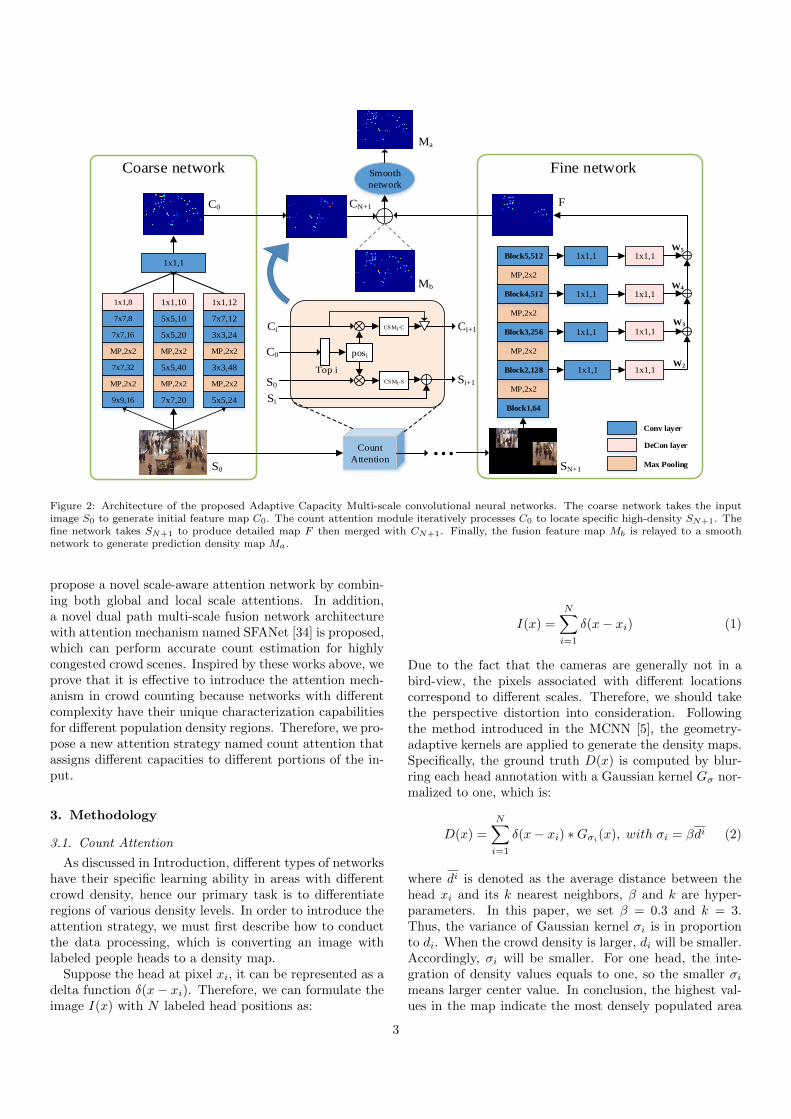
Table 2: Mean absolute errors of the WorldExpo’10 crowd counting dataset [35]. ACM-CNN delivers the lowest average MAE compared toother methods.
Method Scene1 Scene2 Scene3 Scene4 Scene5 Average MAE
LBP + RR [5] 13.6 59.8 37.1 21.8 23.4 31.0
Zhang et al.[35] 9.8 14.1 14.3 22.2 3.7 12.9
MCNN [5] 3.4 20.6 12.9 13.0 8.1 11.6
Switching-CNN [7] 4.4 15.7 10.0 11.0 5.9 9.4
CP-CNN [17] 2.9 14.7 10.5 10.4 5.8 8.86
DecideNet [21] 2.00 13.14 8.90 17.40 4.75 9.23
ACM-CNN (ours) 2.4 10.4 11.4 15.6 3.0 8.56
Scene(1-5) Ground truth Prediction
Figure 5: Example results on WorldExpo’10 dataset. Each row rep-resents a typical scene.
Image Ground truth(28) Prediction(27.8)
Image Ground truth(34) Prediction(35.1)
Figure 6: Results on UCSD dataset using the proposed ACM-CNN.
4.3. WorldExpo’10 dataset
The WorldExpo10 dataset introduced by [35] consistsof 1132 annotated video sequences that cover a large va-riety of scenes captured by 108 surveillance equipment inShanghai 2010 WorldEXPO. Each frame of one sequencewith 50fps frame rate has a regular 576 x 720 pixels. Atotal of 199,923 pedestrians are labeled at the centers oftheir heads in 3980 frames. They also provide ROI for eachof the scenes. We split the frames into two parts: one partwith 3380 frames in 103 scenes are treated as training andverification sets, and the other part with 600 frames in 5scenes are treated as test sets. In order to conduct dataaugmentation, we crop 10 patches of size 256*256 per im-age, and the same operation is done on the ROI (regionsof interest) images. We compare the performance of ourmodel with other state-of-the-art methods and the resultsare reported in Table 2. Also, we visualize the results ofthe five test scenes in Figure 5.
Table 3: Comparisons results: Estimation errors on the UCSDdataset [37]. Gaussian Process Regression refers to the work in [37].
Method MAE MSE
Gaussian Process Regression 2.16 7.45Zhang et al. (2015) 1.60 3.31
MCNN (2016) 1.07 1.35Switching-CNN 1.62 2.10
CSRNet 1.16 1.47ACM-CNN (ours) 1.01 1.29
4.4. UCSD dataset
Our second experiment concentrates on crowd count-ing for UCSD dataset introduced in [37]. It is acquiredwith a stationary camera mounted at an elevation inUCSD campus. The crowd density ranges from sparse tovery crowded. This is a 2000-frame video dataset that isrecorded at 10 fps with a frame size of 158 *238. Differentfrom Shanghaitech dataset above, this dataset not onlyprovides ground truth with figure coordinates but also re-gion of interest (ROI) for each frame. Of the 2000 frames,
6

Ground truth(31)Image Prediction(31.2)
Image Ground truth(35) Prediction(36.2)
Figure 7: Example results on Mall dataset using our ACM-CNN.
we send frames 601 through 1400 into the model for train-ing while the remaining frames are used for testing. Thereis no process of augmentation due to the similarity of pic-tures. During training, we separately prune the groundtruth, merged map, and the final map with ROI. As a re-sult, the error is back-propagated for areas inside the ROI.Table 3 lists the results of all methods and our approachis able to offer better MAE and MSE in all scenes, whichmeans our model can generate a more accurate densitymap whether in dense or sparse scenes. Two examples areshown in Figure 6.
Table 4: Performance evaluation of various methods on Mall dataset[4].
Method MAE MSE
Gaussian process regression 3.72 20.1Ridge regression 3.59 19.0
MoCNN 2.75 13.4Count forest 2.5 10.0
ACM-CNN (ours) 2.3 3.1
4.5. Mall dataset
The Mall dataset [4] is captured in a shopping mall us-ing a publicly accessible surveillance camera, which suffersfrom more challenging lighting conditions and glass surfacereflections. It consists of scenes with more diverse crowddensities from sparse to crowd, as well as different activ-ity patterns under different illumination conditions duringthe day. The video sequence in the dataset is made upof 2000 frames of resolution 320*240 with 6000 instancesof labeled pedestrians. Following the existing methods,we use the first 800 frames for training and the remaining1200 frames for evaluation. During testing, MAE is onlycomputed for regions inside ROI. We perform comparisonagainst Gaussian process regression [37], Ridge regression[4], MoCNN [38], Count forest [39], and achieves state-of-the-art performance shown in Table 4. Examples arepresented in Figure 7.
Image Ground truth(469) Prediction(477.6)
Image Ground truth(1046) Prediction(1022.0)
Figure 8: Performance of different methods on UCF CC 50 dataset.
4.6. UCF CC 50 dataset
The UCF CC 50 dataset [40] includes 50 images with awide range of densities and diverse scenes. This datasetis very challenging for the small size and the large varia-tion in crowd count. As there is no separate test set, a5-fold cross-validation method is defined for training andtesting to verify the performance of the model. We com-pare the proposed model with Multi-source multi-scale[40], MCNN [5], Switch-CNN [7], CP-CNN [17], SaCNN[6] and our model achieves the best MAE over existingmethods, shown in Table 5. Figure 8 shows the generateddensity maps by our ACM-CNN.
Table 5: Performance evaluation of various methods on UCF CC 50dataset [40].
Method MAE MSE
Multi-source multi-scale 468.0 590.3MCNN 377.6 509.1
Switch-CNN 318.1 439.2CP-CNN 295.8 320.9SaCNN 314.9 424.8
ACM-CNN (ours) 291.6 337
5. Analysis
5.1. Parameter Settings
We first empirically study the configuration of the num-ber of attention pixels N and the size of the correspondingpatch S, as is shown in Figure 9. Due to the huge di-versity in density levels, there are no set of parametersto meet the requirements of balancing the performanceof all datasets. Thus, we divide the situation into twotypes: dense datasets in which all areas of each imageare densely populated and sparse datasets where only asmall portion of each image are occupied by crowds. As isshown in Table 6, we set a threshold T = 40. When theaverage crowd count of one dataset exceeds T, it will beclassified as a dense dataset, otherwise a sparse dataset.Comparative experiments are respectively performed on
7

0.85 0.88 0.90 0.93 0.9570
71
72
73
74
75
76
77
78
79
80
SIZE
MA
E
N=1
N=2
N=3
(a) Shanghaitech Part A
50 60 70 80 900.9
0.95
1
1.05
1.1
1.15
1.2
1.25
1.3
SIZE
MA
E
N=4N=5N=6
(b) UCSD
Figure 9: Histograms of two datasets on parameter selection. The entire chart is built according to the changes in the two parameters: thenumber of attention pixels N and the size of the corresponding patch S. The left is the Shanghaitech Part A dataset while the right is theUCSD dataset.
two types of representative datasets: Shanghaitech Part Adataset (dense) and UCSD dataset (sparse). In Figure9(a), the size represents the ratio of the patch size tothe original image’s height and width, whereas in Fig-ure 9(b), the size indicates the true pixel value. Thisis because images in UCSD dataset share the same sizebut Shanghaitech dataset doesn’t conform to the condi-tion. According to the final results, we set N=1 andS= [0.9*height,0.9*width] for Shanghai Part A dataset,N=5 and S = [70,70] ([0.4*height,0.3*width]) for UCSDdatasets. The parameters settings of five datasets used inthis paper are listed in Table 7.
Table 6: Summary of existing datasets. Max is the maximum crowdcount while Min is minimal crowd count. Ave indicates averagecrowd count.
Dataset Max Min Ave
ShanghaitechPart A 3139 33 501.4Part B 578 9 123.6
WorldExpo’10 253 1 50.2UCSD 46 11 24.9Mall 53 13 31.7
UCF CC 50 4543 94 1279.5
Table 7: The parameter settings of five datasets about the numberof attention pixels N and the size of corresponding patch S.
Type Datasets Configure
DenseShanghaitechWorldExpo’10UCF CC 50
N=1 S=[0.9*height,0.9*width]
SparseUCSDMall
N=5 S=[0.4*height,0.3*width]
5.2. Algorithmic Study
In this section, we study the effectiveness of modulesin the proposed ACM-CNN and count attention mecha-
Table 8: Effectiveness of different modules and count attention mech-anism on Part A of Shanghaitech and UCSD dataset. C, F, S corre-spond to coarse network, fine network and smooth network respec-tively.
MethodShanghaitech UCSDMAE MSE MAE MSE
C 106.2 168.4 1.60 2.30F 80.9 128.1 2.30 3.50
C+F 74.5 108.2 1.19 1.60C+F+S 72.2 103.5 1.01 1.29
nism on the final accuracy. All ablations are performed onPart A of Shanghaitech and UCSD dataset as they rep-resent two types of datasets: dense and sparse. First,the first two rows in Table 8 list the performance of onlycoarse network (denoted as C) or only fine network (de-noted as F) on two datasets, which further validate theprevious standpoint that a deep network is suitable fordense scenes while a shallow network performs better insparse scenes. In order to demonstrate the effect of countattention mechanism, we combine the coarse network andthe fine network via this strategy (denoted as C+F). Itis obvious that there is a significant improvement on twodatasets for such a combination compared to using any oneof the modules separately. When introducing the smoothnetwork (defined as C+F+S), the estimation error is fur-ther reduced. This means that the smooth network is notonly able to alleviate the sense of fragmentation in the re-sult, but also capable of improving the model accuracy.Figure 10 shows the density maps predicted by variousnetworks in Table 8 along with their corresponding groundtruths. We can see that the coarse network yields densitymaps with fine-grained distribution and the fine networksare more eager to achieve overall accuracy. Besides, thereis indeed a clear division in the results generated by theintegration of two networks, and the introduction of thesmooth network resolves the problem to some extent.
8
Input Image Ground truth(553) Coarse(392.6) Fine(450.7) C+F(588.0) C+F+S(559.1)
Input Image Ground truth(34) Coarse(39.8) Fine(40.4) C+F(37.3) C+F+S(35.4)
Figure 10: Predictions of various structures introduced in Table 8 on Shanghaitech Part A and UCSD dataset.
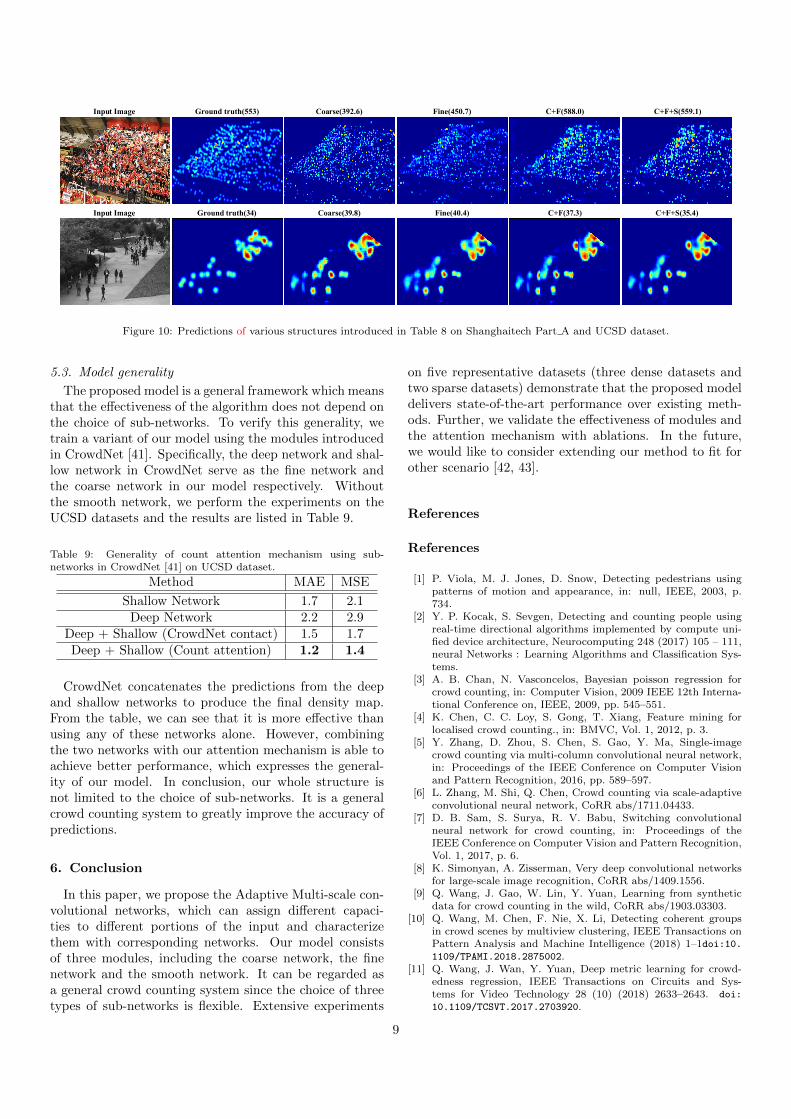
5.3. Model generality
The proposed model is a general framework which meansthat the effectiveness of the algorithm does not depend onthe choice of sub-networks. To verify this generality, wetrain a variant of our model using the modules introducedin CrowdNet [41]. Specifically, the deep network and shal-low network in CrowdNet serve as the fine network andthe coarse network in our model respectively. Withoutthe smooth network, we perform the experiments on theUCSD datasets and the results are listed in Table 9.
Table 9: Generality of count attention mechanism using sub-networks in CrowdNet [41] on UCSD dataset.
Method MAE MSE
Shallow Network 1.7 2.1Deep Network 2.2 2.9
Deep + Shallow (CrowdNet contact) 1.5 1.7Deep + Shallow (Count attention) 1.2 1.4
CrowdNet concatenates the predictions from the deepand shallow networks to produce the final density map.From the table, we can see that it is more effective thanusing any of these networks alone. However, combiningthe two networks with our attention mechanism is able toachieve better performance, which expresses the general-ity of our model. In conclusion, our whole structure isnot limited to the choice of sub-networks. It is a generalcrowd counting system to greatly improve the accuracy ofpredictions.
6. Conclusion
In this paper, we propose the Adaptive Multi-scale con-volutional networks, which can assign different capaci-ties to different portions of the input and characterizethem with corresponding networks. Our model consistsof three modules, including the coarse network, the finenetwork and the smooth network. It can be regarded asa general crowd counting system since the choice of threetypes of sub-networks is flexible. Extensive experiments
on five representative datasets (three dense datasets andtwo sparse datasets) demonstrate that the proposed modeldelivers state-of-the-art performance over existing meth-ods. Further, we validate the effectiveness of modules andthe attention mechanism with ablations. In the future,we would like to consider extending our method to fit forother scenario [42, 43].
References
References
[1] P. Viola, M. J. Jones, D. Snow, Detecting pedestrians usingpatterns of motion and appearance, in: null, IEEE, 2003, p.734.
[2] Y. P. Kocak, S. Sevgen, Detecting and counting people usingreal-time directional algorithms implemented by compute uni-fied device architecture, Neurocomputing 248 (2017) 105 – 111,neural Networks : Learning Algorithms and Classification Sys-tems.
[3] A. B. Chan, N. Vasconcelos, Bayesian poisson regression forcrowd counting, in: Computer Vision, 2009 IEEE 12th Interna-tional Conference on, IEEE, 2009, pp. 545–551.
[4] K. Chen, C. C. Loy, S. Gong, T. Xiang, Feature mining forlocalised crowd counting., in: BMVC, Vol. 1, 2012, p. 3.
[5] Y. Zhang, D. Zhou, S. Chen, S. Gao, Y. Ma, Single-imagecrowd counting via multi-column convolutional neural network,in: Proceedings of the IEEE Conference on Computer Visionand Pattern Recognition, 2016, pp. 589–597.
[6] L. Zhang, M. Shi, Q. Chen, Crowd counting via scale-adaptiveconvolutional neural network, CoRR abs/1711.04433.
[7] D. B. Sam, S. Surya, R. V. Babu, Switching convolutionalneural network for crowd counting, in: Proceedings of theIEEE Conference on Computer Vision and Pattern Recognition,Vol. 1, 2017, p. 6.
[8] K. Simonyan, A. Zisserman, Very deep convolutional networksfor large-scale image recognition, CoRR abs/1409.1556.
[9] Q. Wang, J. Gao, W. Lin, Y. Yuan, Learning from syntheticdata for crowd counting in the wild, CoRR abs/1903.03303.
[10] Q. Wang, M. Chen, F. Nie, X. Li, Detecting coherent groupsin crowd scenes by multiview clustering, IEEE Transactions onPattern Analysis and Machine Intelligence (2018) 1–1doi:10.1109/TPAMI.2018.2875002.
[11] Q. Wang, J. Wan, Y. Yuan, Deep metric learning for crowd-edness regression, IEEE Transactions on Circuits and Sys-tems for Video Technology 28 (10) (2018) 2633–2643. doi:
10.1109/TCSVT.2017.2703920.
9
[12] Y. Zhang, C. Zhou, F. Chang, A. C. Kot, Multi-resolution at-tention convolutional neural network for crowd counting, Neu-rocomputing 329 (2019) 144 – 152. doi:https://doi.org/10.
1016/j.neucom.2018.10.058.[13] V. A. Sindagi, V. M. Patel, A survey of recent advances in cnn-
based single image crowd counting and density estimation, Pat-tern Recognition Letters 107 (2018) 3 – 16, video Surveillance-oriented Biometrics. doi:https://doi.org/10.1016/j.patrec.2017.07.007.
[14] X. Jiang, Z. Xiao, B. Zhang, X. Zhen, X. Cao, D. S. Doer-mann, L. Shao, Crowd counting and density estimation by trel-lis encoder-decoder network, CoRR abs/1903.00853.
[15] N. Liu, Y. Long, C. Zou, Q. Niu, L. Pan, H. Wu, Adcrowd-net: An attention-injective deformable convolutional networkfor crowd understanding, CoRR abs/1811.11968.
[16] Y. Liu, M. Shi, Q. Zhao, X. Wang, Point in, box out: Beyondcounting persons in crowds, CoRR abs/1904.01333.
[17] V. A. Sindagi, V. M. Patel, Generating high-quality crowd den-sity maps using contextual pyramid cnns, in: The IEEE Inter-national Conference on Computer Vision (ICCV), 2017.
[18] D. Babu Sam, N. N. Sajjan, R. Venkatesh Babu, M. Srinivasan,Divide and grow: Capturing huge diversity in crowd imageswith incrementally growing cnn, in: The IEEE Conference onComputer Vision and Pattern Recognition (CVPR), 2018.
[19] X. Cao, Z. Wang, Y. Zhao, F. Su, Scale aggregation networkfor accurate and efficient crowd counting, in: The EuropeanConference on Computer Vision (ECCV), 2018.
[20] Y. Li, X. Zhang, D. Chen, Csrnet: Dilated convolutional neuralnetworks for understanding the highly congested scenes, in: TheIEEE Conference on Computer Vision and Pattern Recognition(CVPR), 2018.
[21] J. Liu, C. Gao, D. Meng, A. G. Hauptmann, Decidenet: Count-ing varying density crowds through attention guided detectionand density estimation, in: The IEEE Conference on ComputerVision and Pattern Recognition (CVPR), 2018.
[22] V. Ranjan, H. Le, M. Hoai, Iterative crowd counting, in: TheEuropean Conference on Computer Vision (ECCV), 2018.
[23] W. Liu, M. Salzmann, P. Fua, Context-aware crowd counting,CoRR abs/1811.10452.
[24] L.-C. Chen, G. Papandreou, I. Kokkinos, K. Murphy, A. L.Yuille, Deeplab: Semantic image segmentation with deep con-volutional nets, atrous convolution, and fully connected crfs,arXiv preprint arXiv:1606.00915.
[25] S. S. Kruthiventi, K. Ayush, R. V. Babu, Deepfix: A fully con-volutional neural network for predicting human eye fixations,IEEE Transactions on Image Processing.
[26] Y. Ji, H. Zhang, Q. J. Wu, Salient object detection via multi-scale attention cnn, Neurocomputing 322 (2018) 130 – 140.
[27] A. R. Gepperth, M. G. Ortiz, E. Sattarov, B. Heisele, Dynamicattention priors: a new and efficient concept for improving ob-ject detection, Neurocomputing 197 (2016) 14 – 28.
[28] K. G. Y. Y. S. C. Shuangjie Xu, Yu Cheng, P. Zhou, Jointlyattentive spatial-temporal pooling networks for video-based per-son re-identification, in: ICCV, 2017.
[29] V. Mnih, N. Heess, A. Graves, K. Kavukcuoglu, Recurrent mod-els of visual attention, CoRR abs/1406.6247.URL http://arxiv.org/abs/1406.6247
[30] Z. Gan, Y. Cheng, A. E. Kholy, L. Li, J. Liu, J. Gao, Multi-step reasoning via recurrent dual attention for visual dialog,in: Proceedings of the 57th Conference of the Association forComputational Linguistics, ACL 2019, Florence, Italy, July 28-August 2, 2019, Volume 1: Long Papers, 2019, pp. 6463–6474.
[31] J. Ba, V. Mnih, K. Kavukcuoglu, Multiple object recognitionwith visual attention, CoRR abs/1412.7755.URL http://arxiv.org/abs/1412.7755
[32] A. Almahairi, N. Ballas, T. Cooijmans, Y. Zheng, H. Larochelle,A. C. Courville, Dynamic capacity networks, CoRRabs/1511.07838.
[33] M. Hossain, M. Hosseinzadeh, O. Chanda, Y. Wang, Crowdcounting using scale-aware attention networks, in: 2019IEEE Winter Conference on Applications of Computer Vision
(WACV), 2019, pp. 1280–1288. doi:10.1109/WACV.2019.00141.[34] L. Zhu, Z. Zhao, C. Lu, Y. Lin, Y. Peng, T. Yao, Dual path
multi-scale fusion networks with attention for crowd counting,CoRR abs/1902.01115.
[35] C. Zhang, H. Li, X. Wang, X. Yang, Cross-scene crowd countingvia deep convolutional neural networks, in: Proceedings of theIEEE Conference on Computer Vision and Pattern Recognition,2015, pp. 833–841.
[36] D. B. Sam, R. V. Babu, Top-down feedback for crowd countingconvolutional neural network, CoRR abs/1807.08881.
[37] A. B. Chan, Z.-S. J. Liang, N. Vasconcelos, Privacy preservingcrowd monitoring: Counting people without people models ortracking, in: Computer Vision and Pattern Recognition, 2008.CVPR 2008. IEEE Conference on, IEEE, 2008, pp. 1–7.
[38] S. Kumagai, K. Hotta, T. Kurita, Mixture of counting cnns:Adaptive integration of cnns specialized to specific appearancefor crowd counting, CoRR abs/1703.09393.
[39] V. Q. Pham, T. Kozakaya, O. Yamaguchi, R. Okada, Count for-est: Co-voting uncertain number of targets using random forestfor crowd density estimation, in: IEEE International Conferenceon Computer Vision, 2015, pp. 3253–3261.
[40] H. Idrees, I. Saleemi, C. Seibert, M. Shah, Multi-source multi-scale counting in extremely dense crowd images, in: TheIEEE Conference on Computer Vision and Pattern Recognition(CVPR), 2013.
[41] L. Boominathan, S. S. S. Kruthiventi, R. V. Babu, Crowdnet: Adeep convolutional network for dense crowd counting, in: Pro-ceedings of the 2016 ACM on Multimedia Conference, MM ’16,ACM, New York, NY, USA, 2016, pp. 640–644.
[42] Y. Cheng, Q. Fan, S. Pankanti, A. Choudhary, Temporal se-quence modeling for video event detection, in: Proceedings ofthe 2014 IEEE Conference on Computer Vision and PatternRecognition, CVPR ’14, 2014, pp. 2235–2242.
[43] J. Wang, Y. Cheng, R. Schmidt Feris, Walk and learn: Fa-cial attribute representation learning from egocentric video andcontextual data, in: The IEEE Conference on Computer Visionand Pattern Recognition (CVPR), 2016.
10