Attempts at Integrating Quantitative Activities in “Rivers and Streams” Lab for Introductory...
12
Attempts at Integrating Quantitative Activities in “Rivers and Streams” Lab for Introductory Geology at CSU Chico Rachel Teasdale, CSU Chico
-
Upload
kerrie-snow -
Category
Documents
-
view
223 -
download
2
Transcript of Attempts at Integrating Quantitative Activities in “Rivers and Streams” Lab for Introductory...

Attempts at Integrating Quantitative Activities in “Rivers and Streams” Lab for Introductory
Geology at CSU ChicoRachel Teasdale, CSU Chico

Week
of:Lab Topic
1 Jan 23 Campus Walk
2 Jan 30 Minerals
3 Feb 6 Igneous Rocks
4 Feb 13Sedimentary Rocks
+ Sed Rocks Homework
5 Feb 20Metamorphic Rocks
+ Rock Review (Hwk)
6 Feb 27 Topo Maps
7 Mar 6 EXAM 1
Mar 13 Spring Break
8 Mar 20 Geologic Maps
9 Mar 27Fieldtrip 1
Homework Due week 10
10 Apr 3 Structural Geology
11 Apr 10 Earthquakes
12 Apr 17Fieldtrip 2
(note: Rivers Pre-work due week 13)
13 Apr 24 Rivers & Streams
14 May 1 Groundwater Lab
15 May 8 EXAM 2
The Syllabus- with Streams Activities

Week 1: Campus Walk
Activities:• “preview” a variety of future lab topics• graded, but general enough for students who add the course late• establishes a sense of course rigor/expectations• the first set of (simple!) quantitative experiences.
Lab 1 Activities: Stream measurementson campus Rock ID (TA’s ID)intro to contour lines/topo mapspiezometer water levelsintro to seismograph
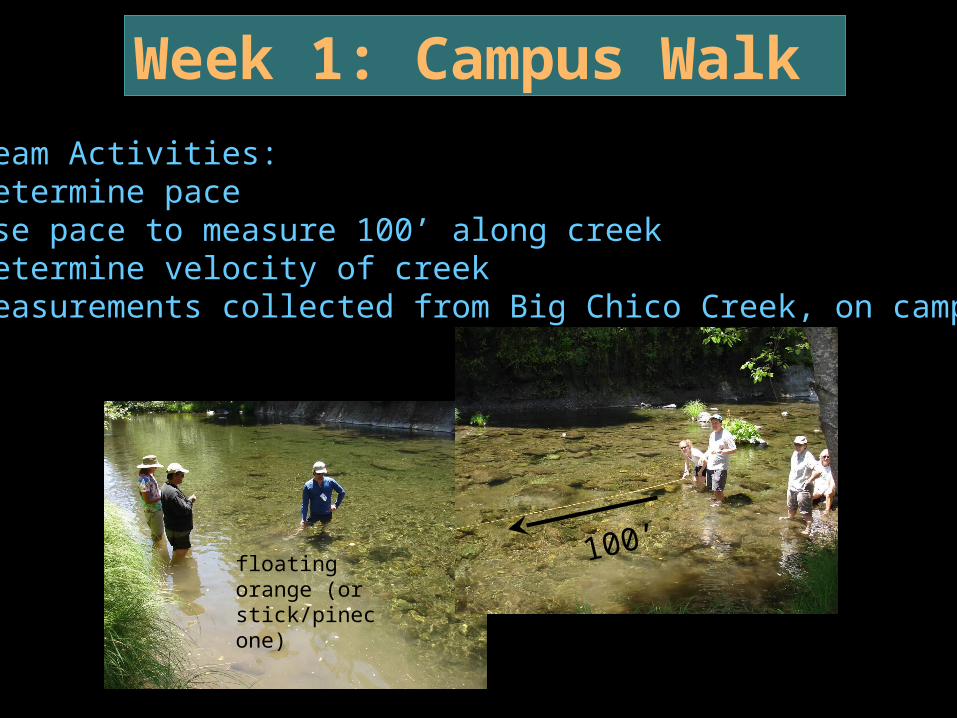
Week 1: Campus Walk
floating orange (or stick/pinecone)
100’
Stream Activities:• Determine pace• Use pace to measure 100’ along creek • Determine velocity of creek• Measurements collected from Big Chico Creek, on campus

Week 9: Fieldtrip
• rock ID• outcrop sketches/ interpretations• topo maps
Geology of Upper Bidwell Park
• stream velocity

Week
of:Lab Topic
1 Jan 23 Campus Walk
2 Jan 30 Minerals
3 Feb 6 Igneous Rocks
4 Feb 13Sedimentary Rocks
+ Sed Rocks Homework
5 Feb 20Metamorphic Rocks
+ Rock Review (Hwk)
6 Feb 27 Topo Maps
7 Mar 6 EXAM 1
Mar 13 Spring Break
8 Mar 20 Geologic Maps
9 Mar 27Fieldtrip 1
Homework Due week 10
10 Apr 3 Structural Geology
11 Apr 10 Earthquakes
12 Apr 17Fieldtrip 2
(note: Rivers Pre-work due week 13)
13 Apr 24 Rivers & Streams
14 May 1 Groundwater Lab
15 May 8 EXAM 2
The Syllabus- with Streams Activities

Week 12: Pre-work
Pre-work review of a) concepts (hopefully covered) in lectures and b) calculations used to describe stream flow. c) opportunity to seek help with calculations from TA’s before the Rivers &
Streams Lab.
Fig 9.3, Lutgens & Tarbuck , 8th Edition
Pre-work Calculations• stream velocity• stream discharge• stream volume (in 24 hours)• weight of water & unit conversions• questions using dissolved solids & unit conversions

Week 12: Pre-work
… and start entering data to be used in lab to compare Week 1 & Week 13 data
8. The water of Big Chico Creek usually contains about 100 parts per million of dissolved solids. In other words, every million tons of water contains 100 tons of dissolved rock and mineral material, including calcium, sodium, iron, and magnesium. If every million tons of water contains 100 tons of dissolved rock, how many tons of dissolved solids is carried by Big Chico Creek in a year? _______________________________ ton/yr of dissolved solids In lab, we will plot these values along with new calculations to compare the velocity of Big Chico Creek in different seasons as well as the energy of the creek based on the size of particles that are carried, eroded, and deposited by the creek over time. Complete the table below for all August values. We will complete the calculations for November in lab together.
Stream Properties Units January Values April Values (to be completed in class)
Width ft
Depth ft
Velocity ft/s
Velocity mi/hr
Velocity m/s
Discharge ft3/s
Discharge ft3/day
Largest eroded particle (in lab)
mm
Largest transported particle (in lab)
mm
1 foot = 12 in; 2.54 cm = 1 in; 0.6 km = 1 mi

Week 13: Rivers & Streams
Stream Activities: • Measure stream width, depth• Calculate discharge• Consider data quality/applicability up/down stream• Measure cobble sizes (& ID rock type)
• Use Chico Quad to determine stream gradient

Week 13: Rivers & Streams
STREAM EROSION AND DEPOSITION
From the homework, it is obvious that Big Chico Creek carries an incredible amount of dissolved solids from the mountains to the ocean. But it carries an even greater quantity of weathered rock particles including mud, sand, and gravel. Your next task is to analyze the sizes of particles than can be transported and eroded by Big Chico Creek today. We will do this using the Hjulstrom diagram shown below.
12. First, convert the velocity of Big Chico Creek that you determined today from ft/sec to cm/sec. (Hint, you will need to convert feet cm and you know that 2.54 cm = 1 in)
______________________________ cm/s 13. Using this velocity and the Hjulstrom diagram below, determine the transportation and erosion capabilities of Big
Chico Creek today. a. Largest size particle that could be eroded by Big Chico Creek today: _______________ mm b. Largest size particle that could be transported by Big Chico Creek today:
________________mm
0.1
1
10
100
1000
0.001 0.01 0.1 1 10 100
Deposition
Transportation
Erosion
Diameter of clasts (mm)
Avg
ve
loci
ty (
cm/s
)

Week 13: Rivers & Streams 8. The water of Big Chico Creek usually contains about 100 parts per million of dissolved solids. In other words, every million tons of water contains 100 tons of dissolved rock and mineral material, including calcium, sodium, iron, and magnesium. If every million tons of water contains 100 tons of dissolved rock, how many tons of dissolved solids is carried by Big Chico Creek in a year? _______________________________ ton/yr of dissolved solids In lab, we will plot these values along with new calculations to compare the velocity of Big Chico Creek in different seasons as well as the energy of the creek based on the size of particles that are carried, eroded, and deposited by the creek over time. Complete the table below for all August values. We will complete the calculations for November in lab together.
Stream Properties Units January Values April Values (to be completed in class)
Width ft
Depth ft
Velocity ft/s
Velocity mi/hr
Velocity m/s
Discharge ft3/s
Discharge ft3/day
Largest eroded particle (in lab)
mm
Largest transported particle (in lab)
mm
1 foot = 12 in; 2.54 cm = 1 in; 0.6 km = 1 mi
• From January to that collected in April• From previous semester (Fall data = Sept/Nov)
Comparison of data
NEW STUFF:• Compare one year’s worth of data to previous years• Compare our data with California Department of Water
Resources BIC station

Other ideas?
(AKA HELP!!!!)