Attainment, Expenditure and Market Reliance Among Wellington Group Countries Art Hauptman, USA...
34
Attainment, Expenditure and Market Reliance Among Wellington Group Countries Art Hauptman, USA Muiris O’Connor, Ireland Wellington Group Meeting Chicago 17 July 2007
-
Upload
spencer-fields -
Category
Documents
-
view
213 -
download
0
Transcript of Attainment, Expenditure and Market Reliance Among Wellington Group Countries Art Hauptman, USA...

Attainment, Expenditure and Market Reliance Among
Wellington Group Countries
Art Hauptman, USAMuiris O’Connor, Ireland
Wellington Group MeetingChicago
17 July 2007

Overview of Presentation
• Analysis of attainment data
• Overview of data on expenditure and investment
• ‘Market indicators’ for Wellington Group Countries

I. Attainment in Wellington Countries

Upper Secondary Attainment Among Wellington Group Countries
Upper secondary attainment by age group, 2004
86%
73%
64%
59%
49%
39%
53%
87%
91%
85%
70%
77%
79%
77%
84%78%
65% 67%63%64%
88%
0%
10%
20%
30%
40%
50%
60%
70%
80%
90%
100%
US CA NZ UK AUS IRL OECD
0%
10%
20%
30%
40%
50%
60%
70%
80%
90%
100%
55-64 25-34 25-64

Wellington Group Countries –Performance in PISA literacy assessments
Performance of Wellington countries in the PISA assessments compared to OECD averages
(OECD average = 0)
23
34
28 2927
2932
24 23
-17
32
16
25
13
-11
43 4
-20
-10
0
10
20
30
40
UK** CA AUS NZ IRL US
Reading (2000) Maths (2003) Science (2003)
Tertiary Attainment Among Wellington Group Countries, by Type of Degree
Tertiary attainment profile of the population aged 25-64, 2004
22%
30%
22%20%
18% 18%19%
22%
9% 9% 9%10%
8% 9%
45%
39%
31%29% 28%
25% 25%
0%
5%
10%
15%
20%
25%
30%
35%
40%
45%
50%
55%
60%
CA US AUS UK IRL NZ OECD*
0%
5%
10%
15%
20%
25%
30%
35%
40%
45%
50%
55%
60%
BA & above Sub-BA Total tertiary
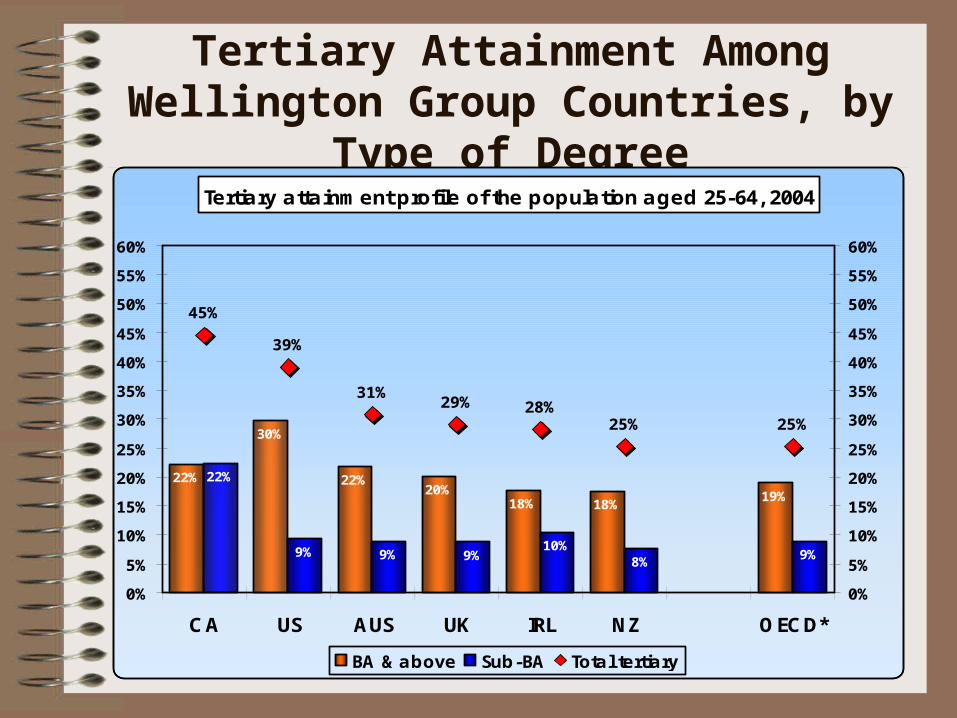
Ratio of Bachelor’s Degrees to Sub-Bachelor’s Degrees (for 25-64 year olds)
Ratio of BA to sub-BA degrees for the population aged 25-64, 2004
1.0
3.2
2.52.3
1.7
2.32.1
0.0
0.5
1.0
1.5
2.0
2.5
3.0
3.5
4.0
CA US AUS UK IRL NZ OECD
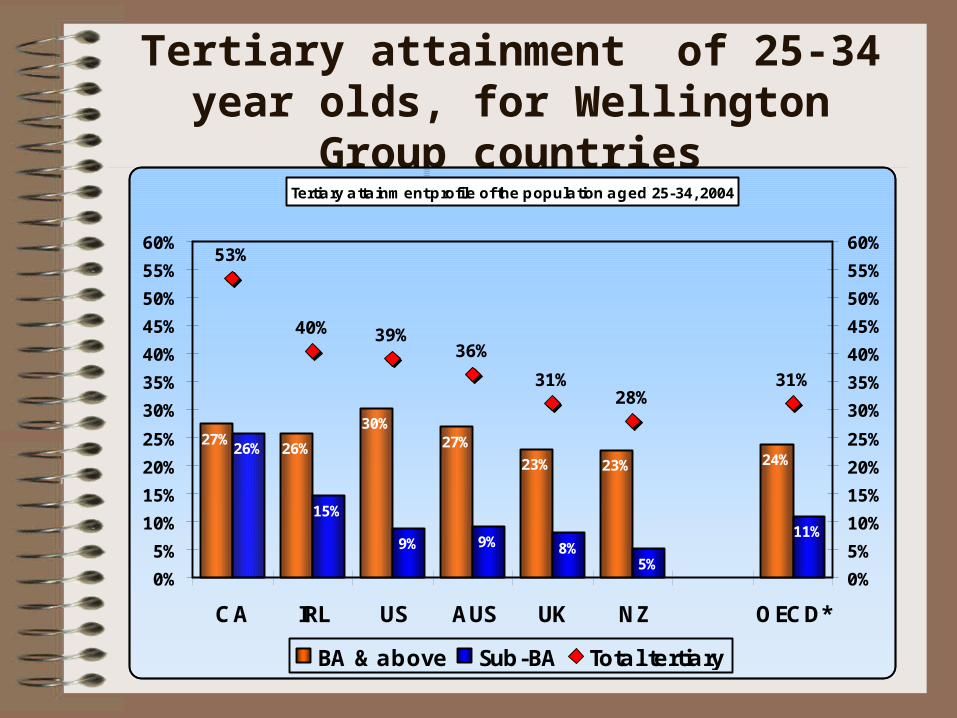
Tertiary attainment of 25-34 year olds, for Wellington Group countries
Tertiary attainment profile of the population aged 25-34, 2004
27%26%
30%27%
23% 23% 24%26%
15%
9% 9% 8%5%
11%
53%
40% 39%36%
31%28%
31%
0%
5%
10%
15%
20%
25%
30%
35%
40%
45%
50%
55%
60%
CA IRL US AUS UK NZ OECD*
0%
5%
10%
15%
20%
25%
30%
35%
40%
45%
50%
55%
60%
BA & above Sub-BA Total tertiary

Growth in Tertiary Attainment (% Point Difference between 25-34 Year Olds and 55-64 Year Olds)
Growth in tertiary attainment by type of degree (% point difference between 25-34 and 55-64 year olds)
9%
2%
12%
9%
16%
13%11%11%
1% 1% 1%
9%
-5%
5%
18%
3%
13%10%
24%
13%
8%
-20%
-15%
-10%
-5%
0%
5%
10%
15%
20%
25%
30%
CA US AUS UK IRL NZ OECD*
-20%
-15%
-10%
-5%
0%
5%
10%
15%
20%
25%
30%
BA & above Sub-BA Total tertiary
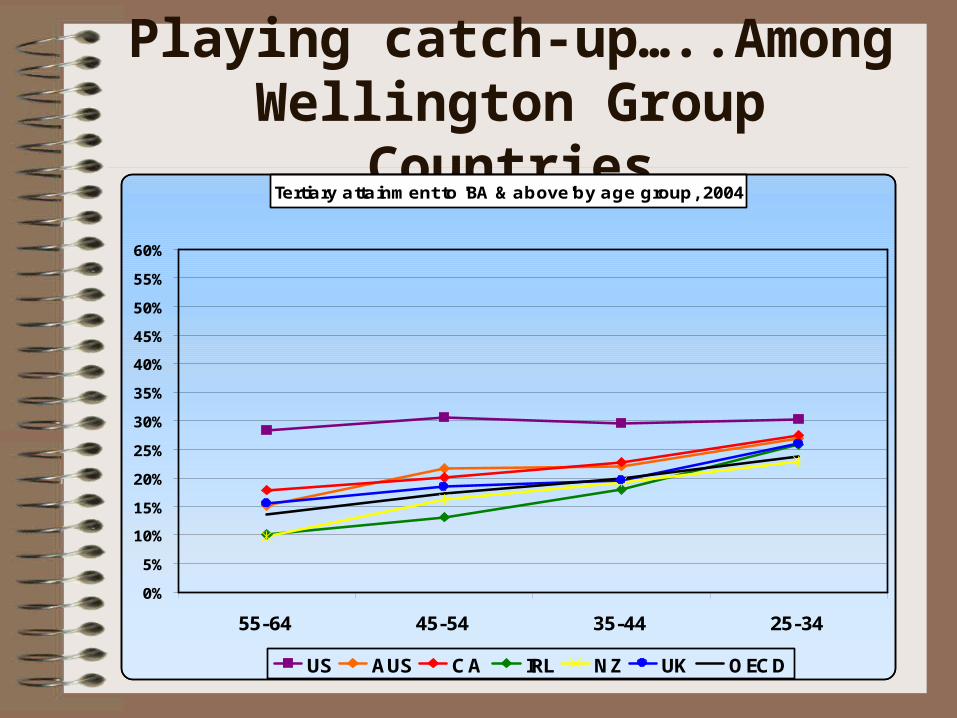
Playing catch-up…..Among Wellington Group Countries
Tertiary attainment to 'BA & above'by age group, 2004
0%
5%
10%
15%
20%
25%
30%
35%
40%
45%
50%
55%
60%
55-64 45-54 35-44 25-34
US AUS CA IRL NZ UK OECD
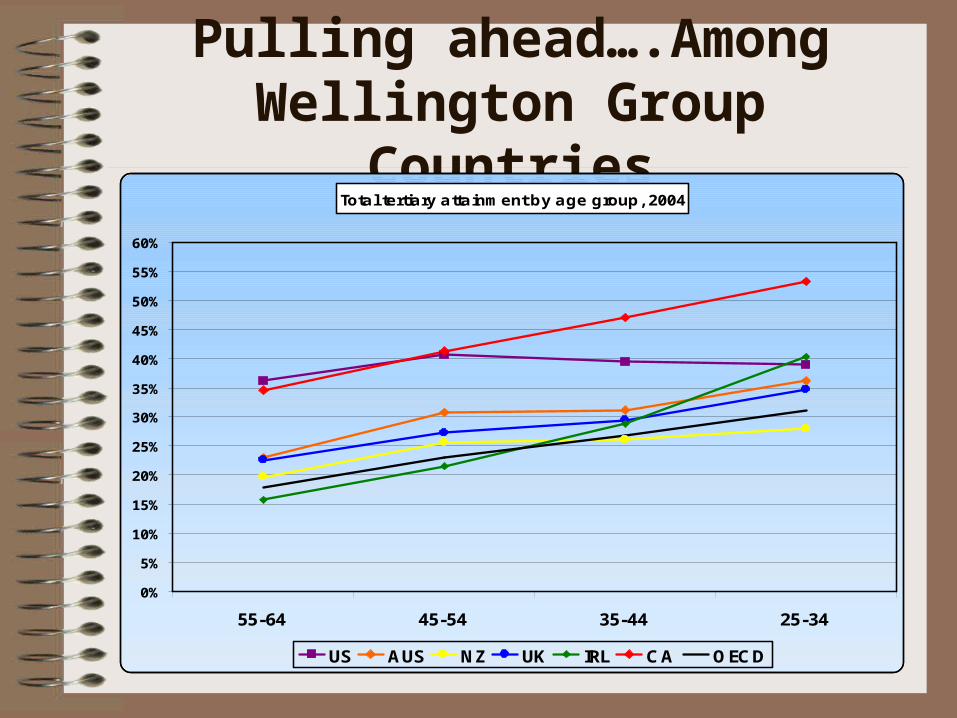
Pulling ahead….Among Wellington Group Countries
Total tertiary attainment by age group, 2004
0%
5%
10%
15%
20%
25%
30%
35%
40%
45%
50%
55%
60%
55-64 45-54 35-44 25-34
US AUS NZ UK IRL CA OECD

II. Expenditure and investment

Financial Commitment Among Wellington Group Countries: Percentage of GDP
Devoted to Tertiary EducationExpenditure on tertiary education as a % of GDP, 2003
1.2%1.3%
0.8%
0.9%1.0%
0.8%
1.1%
1.6%
1.0%
0.8%
0.6%
0.3% 0.4%
0.1%
2.9%
2.4%
1.5% 1.5%
1.2% 1.1%
1.4%
0.0%
0.5%
1.0%
1.5%
2.0%
2.5%
3.0%
US CA AUS NZ IRL UK OECD
0.0%
0.5%
1.0%
1.5%
2.0%
2.5%
3.0%
Public Private Total

Spending Per-Student for Wellington Group Countries, by type of expenditure
Per-student expenditure on tertiary education, 2003
21,5
66
16,9
37
8,6
45
9,1
30
7,2
23
8,2
10
2,5
08
3,0
54
3,7
61
2,7
35
3,2
54
2,1
18
19,992
12,40611,866
9,341 8,832
11,254
24,074
0
5,000
10,000
15,000
20,000
25,000
US CA* AUS UK IRL NZ OECD
0
5,000
10,000
15,000
20,000
25,000
Core & ancilliary services Research & development Total

Per-student Expenditure and GDP per capita for Wellington Group
CountriesExpenditure per student and GDP per capita
$39,7
00
$35,8
00
$31,5
00
$31,4
00
$30,2
00
$23,9
00
$27,7
00
$24,0
74
$9,3
41
$19,9
92
$11,8
66
$12,4
06
$8,8
32
$11,2
54
$0
$5,000
$10,000
$15,000
$20,000
$25,000
$30,000
$35,000
$40,000
$45,000
US IRL CA UK AUS NZ OECD
GDP per capita, 2004 Tertiary expenditure per pupil, 2003

Relationship between investment and attainment (1)
Tertiary educational attainment among 25-64 years olds (2004) plotted against Total investment in education as a % of GDP (2003)
0.0%
1.0%
2.0%
3.0%
4.0%
5.0%
6.0%
7.0%
8.0%
9.0%
0% 10% 20% 30% 40% 50%
Tertiary attainment of 25-64 year olds
Expenditu
re o
n a
ll educatio
n a
s a %
of G
DP

Relationship between investment and attainment (2)
Tertiary educational attainment at BA level and above among 25-34 years olds (2004) plotted against Total investment in tertiary education as a % of GDP (2003)
0.0%
0.5%
1.0%
1.5%
2.0%
2.5%
3.0%
0% 10% 20% 30% 40% 50% 60%
Tertiary attainment to 'BA and above' among 25-34 year olds
Expenditure
on tertia
ry e
ducation a
s a %
of G
DP
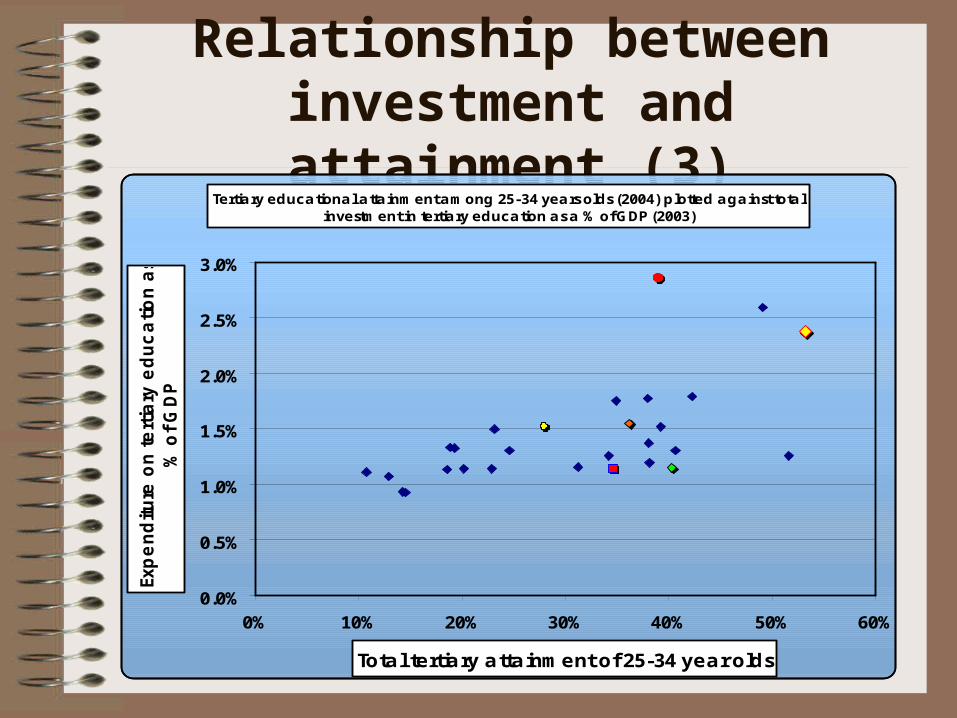
Relationship between investment and attainment (3)
Tertiary educational attainment among 25-34 years olds (2004) plotted against total investment in tertiary education as a % of GDP (2003)
0.0%
0.5%
1.0%
1.5%
2.0%
2.5%
3.0%
0% 10% 20% 30% 40% 50% 60%
Total tertiary attainment of 25-34 year olds
Expenditure
on tertia
ry e
ducation a
s a
% o
f G
DP
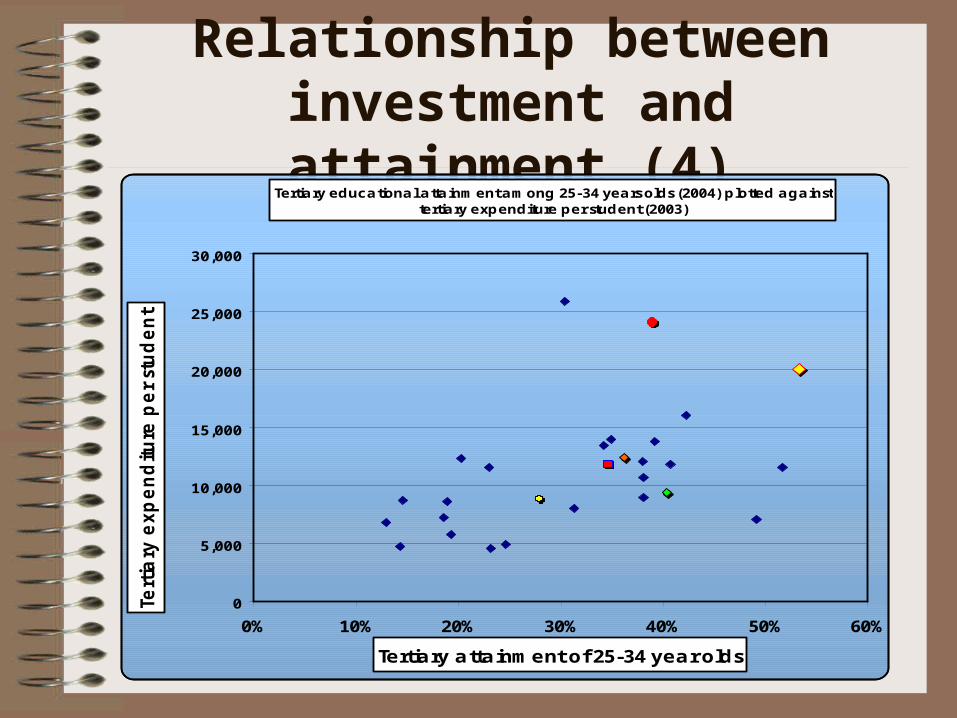
Relationship between investment and attainment (4)
Tertiary educational attainment among 25-34 years olds (2004) plotted against tertiary expenditure per student (2003)
0
5,000
10,000
15,000
20,000
25,000
30,000
0% 10% 20% 30% 40% 50% 60%
Tertiary attainment of 25-34 year olds
Tertia
ry e
xpenditure
per st
udent 2003
Diversity of sources of income for higher education
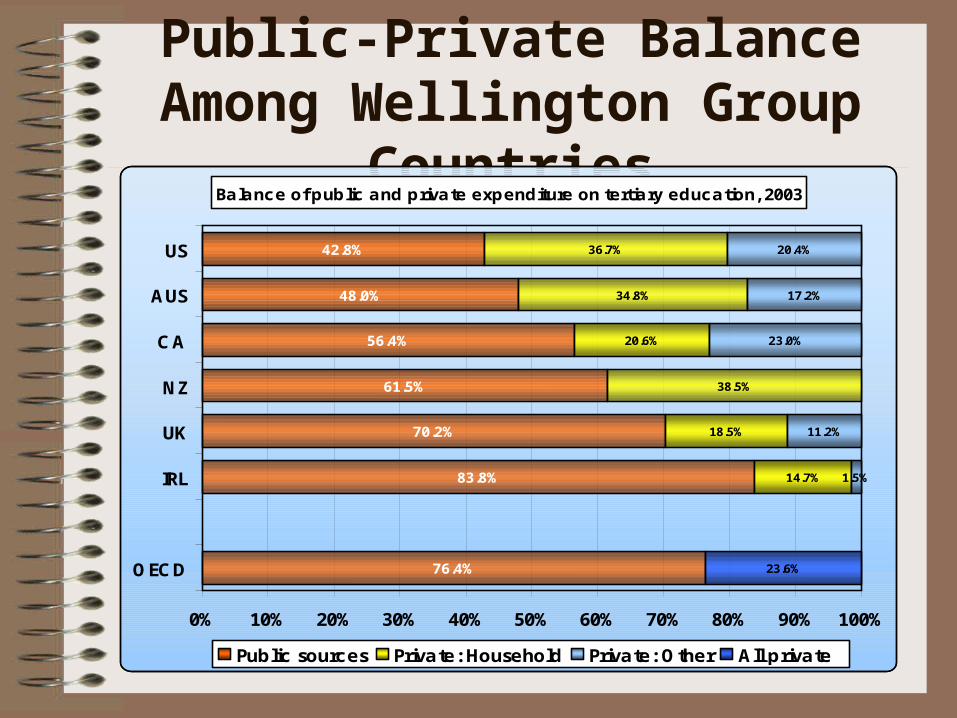
Public-Private Balance Among Wellington Group Countries
Balance of public and private expenditure on tertiary education, 2003
76.4%
83.8%
70.2%
61.5%
56.4%
48.0%
42.8%
14.7%
18.5%
38.5%
20.6%
34.8%
36.7%
1.5%
11.2%
23.0%
17.2%
20.4%
23.6%
0% 10% 20% 30% 40% 50% 60% 70% 80% 90% 100%
OECD
IRL
UK
NZ
CA
AUS
US
Public sources Private: Household Private: Other All private

Internationalisation Among Wellington Group Countries
Percentage of foreign students in tertiary education, 2004 (and index of change since 2000)
28.3% 16.6% 13.4% 8.8% 6.7% 6.5%3.4%
135%116%
171%
120%
161%158%
456%
0%
5%
10%
15%
20%
25%
30%
35%
40%
NZ AUS UK CA IRL US OECD
0%
50%
100%
150%
200%
250%
300%
350%
400%
450%
500%
Percentage of international students Index of change (2000=100%)

III. Market Indicators for Wellington Group Countries
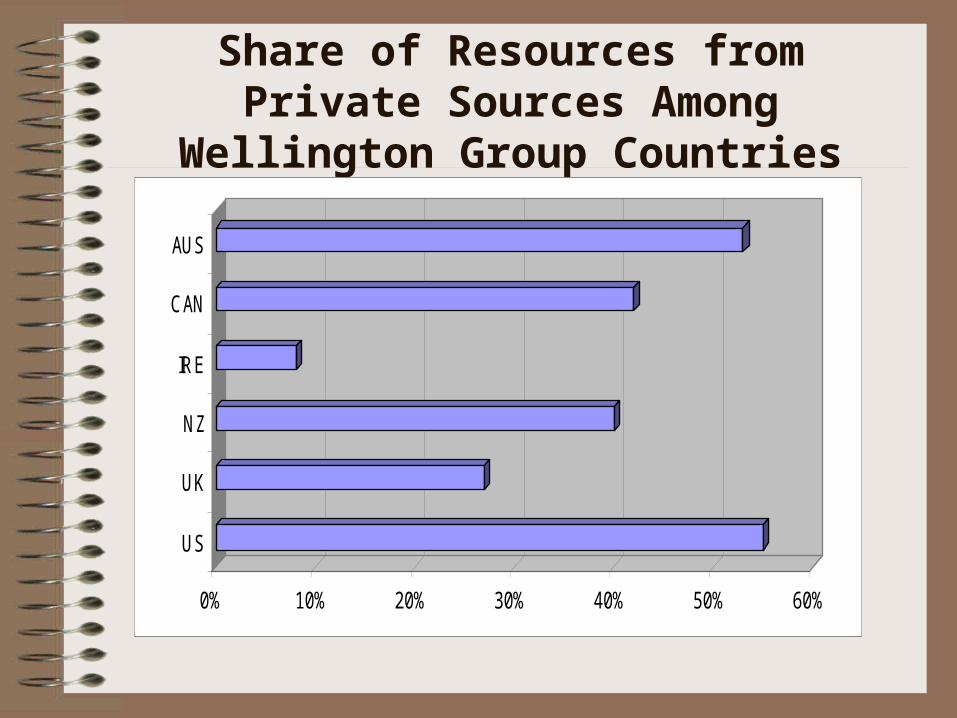
Share of Resources from Private Sources Among Wellington Group Countries
0% 10% 20% 30% 40% 50% 60%
US
UK
NZ
IRE
CAN
AUS

Percentage Of All Students in Seats Not Subsidized by Government, Among
Wellington Group Countries
0% 10% 20% 30% 40%
US
SCOT
NZ
IRE
ENG
CAN
AUS
Overseas
Domestic

Fees as % of Educational Costs Among Wellington Group Countries
0% 10% 20% 30% 40% 50%
US(Public)
SCOT
NZ
IRE
ENG
CAN
AUS
Domestic
Overseas

Percentage of Public Funds Spent on Student Aid Among Wellington Group
Countries
0% 10% 20% 30% 40% 50%
US
UK
NZ
IRE
CAN
AUS
Grants
Loan Subsidies

Private Funding of Research Among Wellington Group Countries
0% 10% 20% 30% 40% 50% 60% 70%
US
UK
NZ
IRE
CAN
AUS
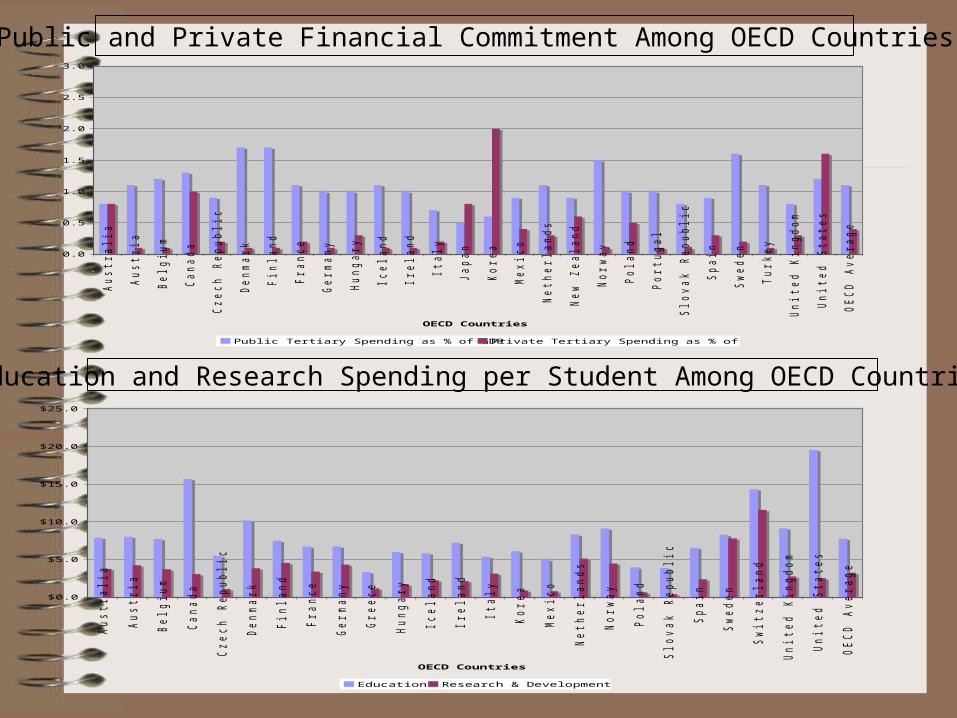
Tertiary Spending as a Percent of GDP
0.0
0.5
1.0
1.5
2.0
2.5
3.0
Au
stralia
Au
stria
Belg
ium
Can
ad
a
Czech
R
ep
ub
lic
Den
mark
Fin
lan
d
Fran
ce
Germ
an
y
Hu
ng
ary
Icela
nd
Irela
nd
Italy
Jap
an
Korea
Mexic
o
Neth
erla
nd
s
New
Z
eala
nd
Norw
ay
Pola
nd
Portu
gal
Slo
vak R
ep
ub
lic
Sp
ain
Sw
ed
en
Tu
rkey
Un
ited
K
ing
dom
Un
ited
S
tates
OEC
D Averag
e
OECD Countries
Percen
t of G
DP
Public Tertiary Spending as % of GDP Private Tertiary Spending as % of GDP
$0.0
$5.0
$10.0
$15.0
$20.0
$25.0
Au
stralia
Au
stria
Belg
ium
Can
ad
a
Czech
R
ep
ub
lic
Den
mark
Fin
lan
d
Fran
ce
Germ
an
y
Greece
Hu
ng
ary
Icela
nd
Irela
nd
Italy
Korea
Mexic
o
Neth
erla
nd
s
Norw
ay
Pola
nd
Slo
vak R
ep
ub
lic
Sp
ain
Sw
ed
en
Sw
itzerla
nd
Un
ited
K
ing
dom
Un
ited
S
tates
OEC
D Averag
e
OECD Countries
Am
ou
nt (In
Th
ou
san
ds)
Education Research & Development
Public and Private Financial Commitment Among OECD Countries
Education and Research Spending per Student Among OECD Countries

Bachelor's and Sub-Bachelor's Degree Attainment Rates
0%
5%
10%
15%
20%
25%
30%
35%
40%
45%
Au
stralia
Au
stria
Belg
ium
Can
ad
a
Den
mark
Fin
lan
d
Fran
ce
Germ
an
y
Greece
Icela
nd
Irela
nd
Jap
an
Korea
Lu
xem
bou
rg
Mexic
o
Neth
erla
nd
s
New
Z
eala
nd
Norw
ay
Slo
vak R
ep
ub
lic
Sp
ain
Sw
ed
en
Sw
itzerla
nd
Un
ited
K
ing
dom
Un
ited
S
tates
OEC
D Averag
e
OECD Countries
Attain
men
t R
ates
Bachelor's Degree Sub-Bachelor's Degree
Bachelor's and Sub-Bachelor's Degree Attainment Levels (For Age 25-34 Only)
0%
5%
10%
15%
20%
25%
30%
35%
40%
45%
50%
Au
stralia
Au
stria
Belg
ium
Can
ad
a
Den
mark
Fin
lan
d
Fran
ce
Germ
an
y
Greece
Icela
nd
Irela
nd
Jap
an
Korea
Lu
xem
bou
rg
Mexic
o
Neth
erla
nd
s
New
Z
eala
nd
Norw
ay
Slo
vak R
ep
ub
lic
Sp
ain
Sw
ed
en
Sw
itzerla
nd
Un
ited
K
ing
dom
Un
ited
S
tates
OEC
D Averag
e
OECD Countries
Attain
men
t R
ates
Bachelor's Degree Sub-Bachelor's Degree
BA and Sub-BA Degree Attainment of 25-64 Year Olds
BA and Sub-BA Degree Attainment Among 25-34 Year Olds
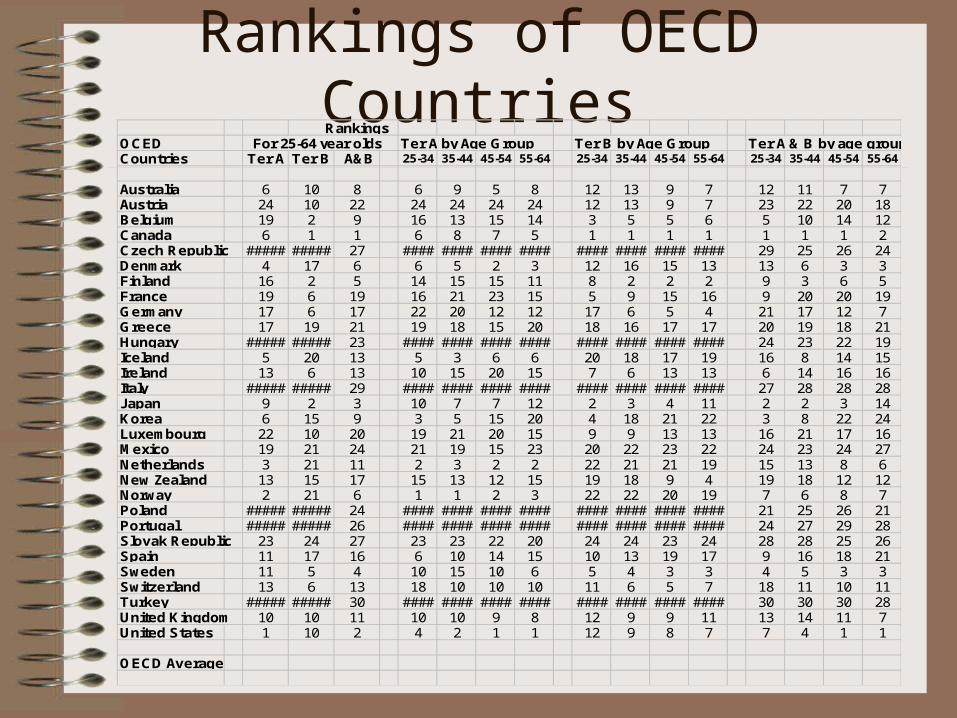
Rankings of OECD CountriesRankings
OCED For 25-64 year olds Ter A by Age Group Ter B by Age Group Ter A & B by age groupCountries Ter A Ter B A&B 25-34 35-44 45-54 55-64 25-34 35-44 45-54 55-64 25-34 35-44 45-54 55-64
Australia 6 10 8 6 9 5 8 12 13 9 7 12 11 7 7Austria 24 10 22 24 24 24 24 12 13 9 7 23 22 20 18Belgium 19 2 9 16 13 15 14 3 5 5 6 5 10 14 12Canada 6 1 1 6 8 7 5 1 1 1 1 1 1 1 2Czech Republic ##### ##### 27 #### #### #### #### #### #### #### #### 29 25 26 24Denmark 4 17 6 6 5 2 3 12 16 15 13 13 6 3 3Finland 16 2 5 14 15 15 11 8 2 2 2 9 3 6 5France 19 6 19 16 21 23 15 5 9 15 16 9 20 20 19Germany 17 6 17 22 20 12 12 17 6 5 4 21 17 12 7Greece 17 19 21 19 18 15 20 18 16 17 17 20 19 18 21Hungary ##### ##### 23 #### #### #### #### #### #### #### #### 24 23 22 19Iceland 5 20 13 5 3 6 6 20 18 17 19 16 8 14 15Ireland 13 6 13 10 15 20 15 7 6 13 13 6 14 16 16Italy ##### ##### 29 #### #### #### #### #### #### #### #### 27 28 28 28Japan 9 2 3 10 7 7 12 2 3 4 11 2 2 3 14Korea 6 15 9 3 5 15 20 4 18 21 22 3 8 22 24Luxembourg 22 10 20 19 21 20 15 9 9 13 13 16 21 17 16Mexico 19 21 24 21 19 15 23 20 22 23 22 24 23 24 27Netherlands 3 21 11 2 3 2 2 22 21 21 19 15 13 8 6New Zealand 13 15 17 15 13 12 15 19 18 9 4 19 18 12 12Norway 2 21 6 1 1 2 3 22 22 20 19 7 6 8 7Poland ##### ##### 24 #### #### #### #### #### #### #### #### 21 25 26 21Portugal ##### ##### 26 #### #### #### #### #### #### #### #### 24 27 29 28Slovak Republic 23 24 27 23 23 22 20 24 24 23 24 28 28 25 26Spain 11 17 16 6 10 14 15 10 13 19 17 9 16 18 21Sweden 11 5 4 10 15 10 6 5 4 3 3 4 5 3 3Switzerland 13 6 13 18 10 10 10 11 6 5 7 18 11 10 11Turkey ##### ##### 30 #### #### #### #### #### #### #### #### 30 30 30 28United Kingdom 10 10 11 10 10 9 8 12 9 9 11 13 14 11 7United States 1 10 2 4 2 1 1 12 9 8 7 7 4 1 1
OECD Average

OECD Rankings of Wellington Group Countries – Spending Per Student
Education Research Total
Australia 10th 9th 8th
Canada 6th 13th 3rd
Ireland 13th 18th 16th
New Zealand 13th xx 18th
United Kingdom 5th 14th 11th
United States 1st 15th 2nd

OECD Rankings of Wellington Group Countries – Commitment: % of GDP
Devoted to Tertiary EducationPublic Private Total
Australia 24th 4th 7th
Canada 6th 3rd 3rd
Ireland 15th 17th 18th
New Zealand 20th 6th 7th
United Kingdom 24th 9th 21st
United States 7th 2nd 1st
OECD Average 1.1% 0.4% 1.4%
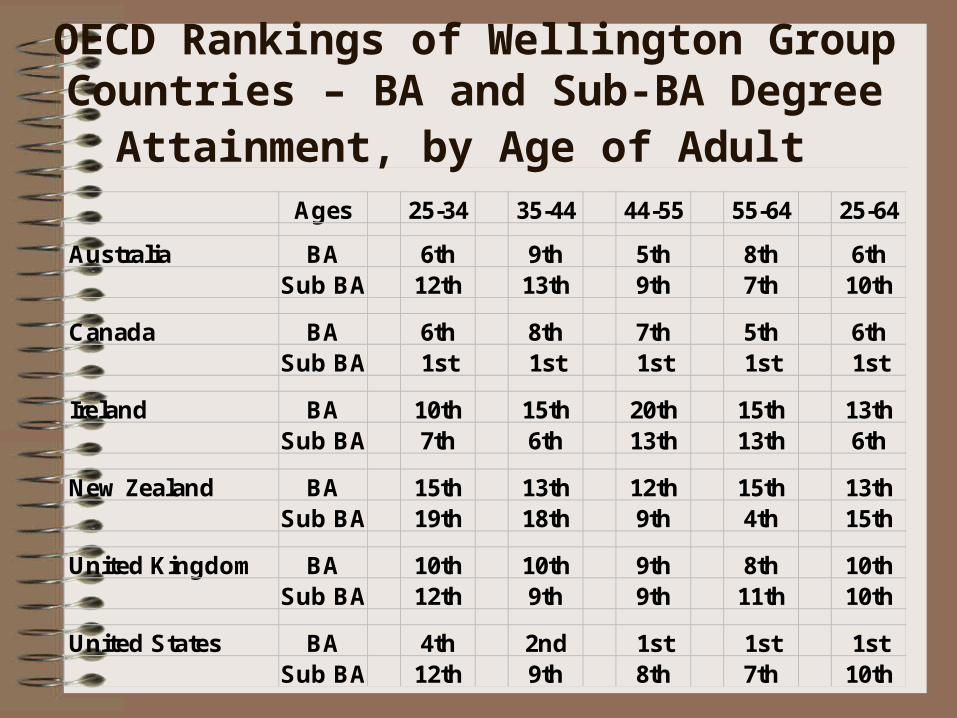
OECD Rankings of Wellington Group Countries – BA and Sub-BA Degree
Attainment, by Age of Adult Ages 25-34 35-44 44-55 55-64 25-64
Australia BA 6th 9th 5th 8th 6thSub BA 12th 13th 9th 7th 10th
Canada BA 6th 8th 7th 5th 6thSub BA 1st 1st 1st 1st 1st
Ireland BA 10th 15th 20th 15th 13thSub BA 7th 6th 13th 13th 6th
New Zealand BA 15th 13th 12th 15th 13thSub BA 19th 18th 9th 4th 15th
United Kingdom BA 10th 10th 9th 8th 10thSub BA 12th 9th 9th 11th 10th
United States BA 4th 2nd 1st 1st 1stSub BA 12th 9th 8th 7th 10th