ATTACHMENT I – HYDRAULICS ANALYSIS … I - Hydraulics... · base flood elevation is between 10...
21
04-SOL-12 PM 19.3/10-SAC-12 PM 5.8 ATTACHMENT I – HYDRAULICS ANALYSIS MEMORANDUM
Transcript of ATTACHMENT I – HYDRAULICS ANALYSIS … I - Hydraulics... · base flood elevation is between 10...
04-SOL-12 PM 19.3/10-SAC-12 PM 5.8
ATTACHMENT I – HYDRAULICS ANALYSIS MEMORANDUM

1243 Alpine Road, Suite 108 Walnut Creek, CA 94596
Phone: 925.941.0017 Fax: 925.941.0018 www.wreco.com
Civil Engineering Water Resources
Memorandum Date: October 23, 2009
To: Steve Mislinski – AECOM / LAN 11344 Coloma Road, Suite 590 Gold River, CA 95670
From: Han-Bin Liang / Wana Chiu – WRECO
Project: SR 12 Realignment / Rio Vista Bridge
Subject: Preliminary Hydraulics
Introduction Alignment alternatives for an improved State Route 12 (SR 12) crossing of the Sacramento River in the vicinity of the city of Rio Vista were evaluated for a previously approved 1994 Project Study Report (PSR). The existing SR 12 bridge crossing over the Sacramento River connects Solano and Sacramento counties, as shown in the map in Figure 1. It is located at a latitude of 38°09’30” North and a longitude of 121°40’54” West.
Project Need The existing SR 12 carries large volumes of traffic through the city of Rio Vista, Solano County, and the San Francisco Bay Area. The roadway is a two-lane road with narrow shoulders, and it lacks turning lanes at intersections. The existing Rio Vista Bridge on SR 12 over the Sacramento River has limited vertical clearance between the waterway and the bridge structure. The bridge is required to be operated to allow passage of nearly all water vessels. Photo 1 shows the bridge raised and Photo 2 shows the bridge lowered.
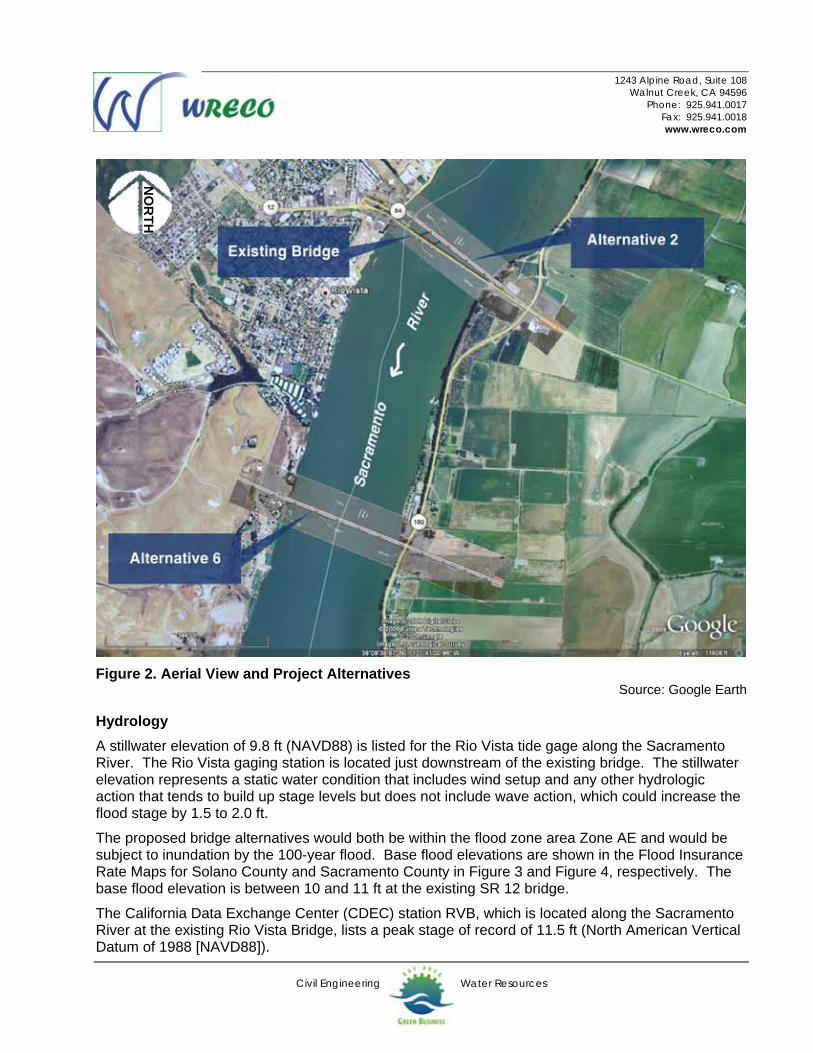
Proposed Alternatives Currently, there are two alternatives under consideration: Alternative 2 and Alternative 6, as shown in Figure 2. Alternative 2 follows the existing SR 12 alignment and is proposed as a rural expressway configuration outside the developed areas and an urban expressway within the city of Rio Vista. Alternative 6 was planned as a freeway and follows the existing SR 12 alignment west of the city of Rio Vista and deviates to the southeast approximately one mile west of Azevedo Road on a new alignment two miles to the south where it runs just north of and parallel to Emigh Road, through the Montezuma Hills and across the Sacramento River. The alignment then follows an easterly route to rejoin SR 12 east of Jackson Slough. The distance separating the two alternatives, measured along the Sacramento River, is roughly 1.2 mi.
This memorandum documents the preliminary hydrologic and hydraulic assessments for the two alternatives. These calculations should be updated as more information becomes available to provide more accurate assessments.

1243 Alpine Road, Suite 108 Walnut Creek, CA 94596
Phone: 925.941.0017 Fax: 925.941.0018 www.wreco.com
Civil Engineering Water Resources
Photo 1. Existing Rio Vista Bridge Raised Source: Caltrans District 4
Photo 2. Existing Rio Vista Bridge Lowered Source: Caltrans District 4

1243 Alpine Road, Suite 108 Walnut Creek, CA 94596
Phone: 925.941.0017 Fax: 925.941.0018 www.wreco.com
Civil Engineering Water Resources
Figure 1. Project Location Map
Source: United States Geological Survey
1243 Alpine Road, Suite 108 Walnut Creek, CA 94596
Phone: 925.941.0017 Fax: 925.941.0018 www.wreco.com
Civil Engineering Water Resources
Figure 2. Aerial View and Project Alternatives
Source: Google Earth Hydrology A stillwater elevation of 9.8 ft (NAVD88) is listed for the Rio Vista tide gage along the Sacramento River. The Rio Vista gaging station is located just downstream of the existing bridge. The stillwater elevation represents a static water condition that includes wind setup and any other hydrologic action that tends to build up stage levels but does not include wave action, which could increase the flood stage by 1.5 to 2.0 ft.
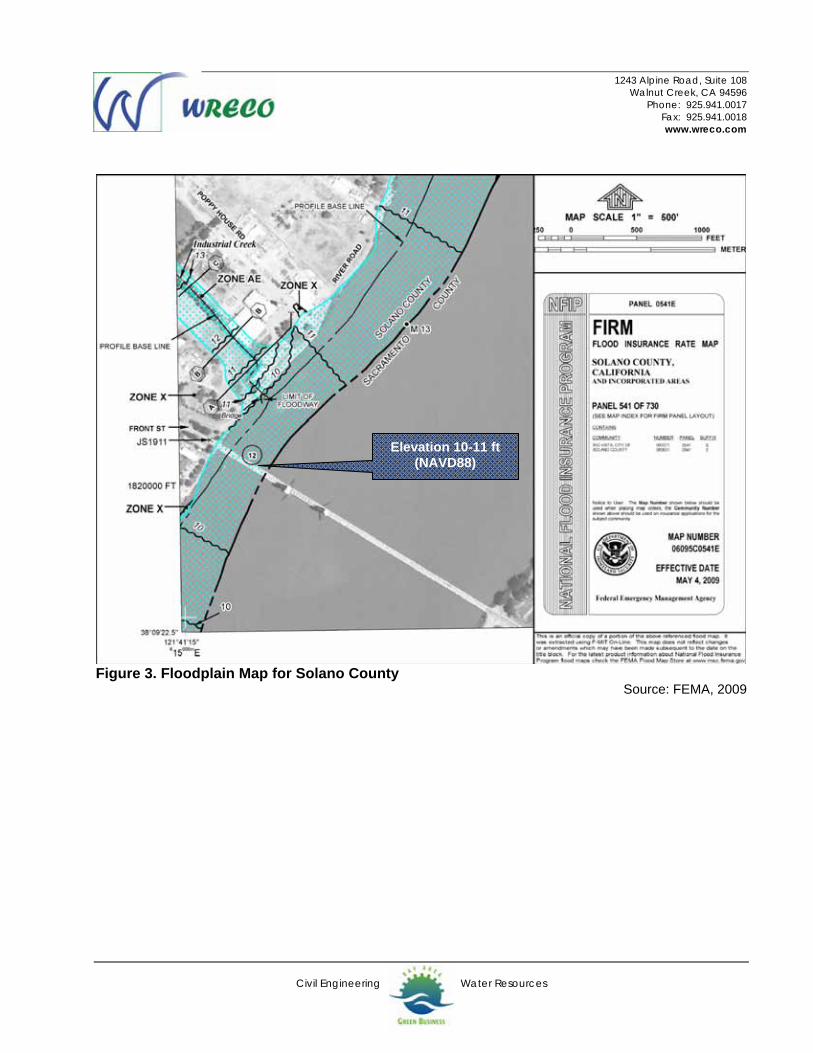
The proposed bridge alternatives would both be within the flood zone area Zone AE and would be subject to inundation by the 100-year flood. Base flood elevations are shown in the Flood Insurance Rate Maps for Solano County and Sacramento County in Figure 3 and Figure 4, respectively. The base flood elevation is between 10 and 11 ft at the existing SR 12 bridge.
The California Data Exchange Center (CDEC) station RVB, which is located along the Sacramento River at the existing Rio Vista Bridge, lists a peak stage of record of 11.5 ft (North American Vertical Datum of 1988 [NAVD88]).
NO
RTH
1243 Alpine Road, Suite 108 Walnut Creek, CA 94596
Phone: 925.941.0017 Fax: 925.941.0018 www.wreco.com
Civil Engineering Water Resources
Figure 3. Floodplain Map for Solano County
Source: FEMA, 2009
Elevation 10-11 ft (NAVD88)
1243 Alpine Road, Suite 108 Walnut Creek, CA 94596
Phone: 925.941.0017 Fax: 925.941.0018 www.wreco.com
Civil Engineering Water Resources
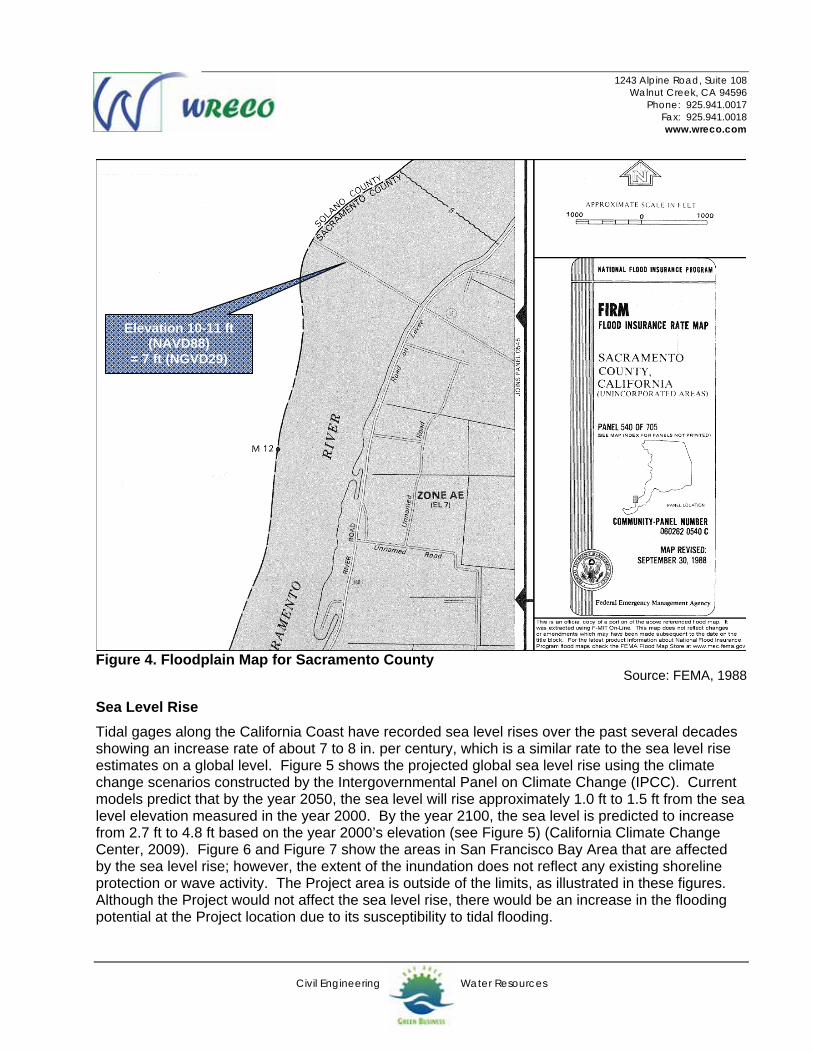
Figure 4. Floodplain Map for Sacramento County
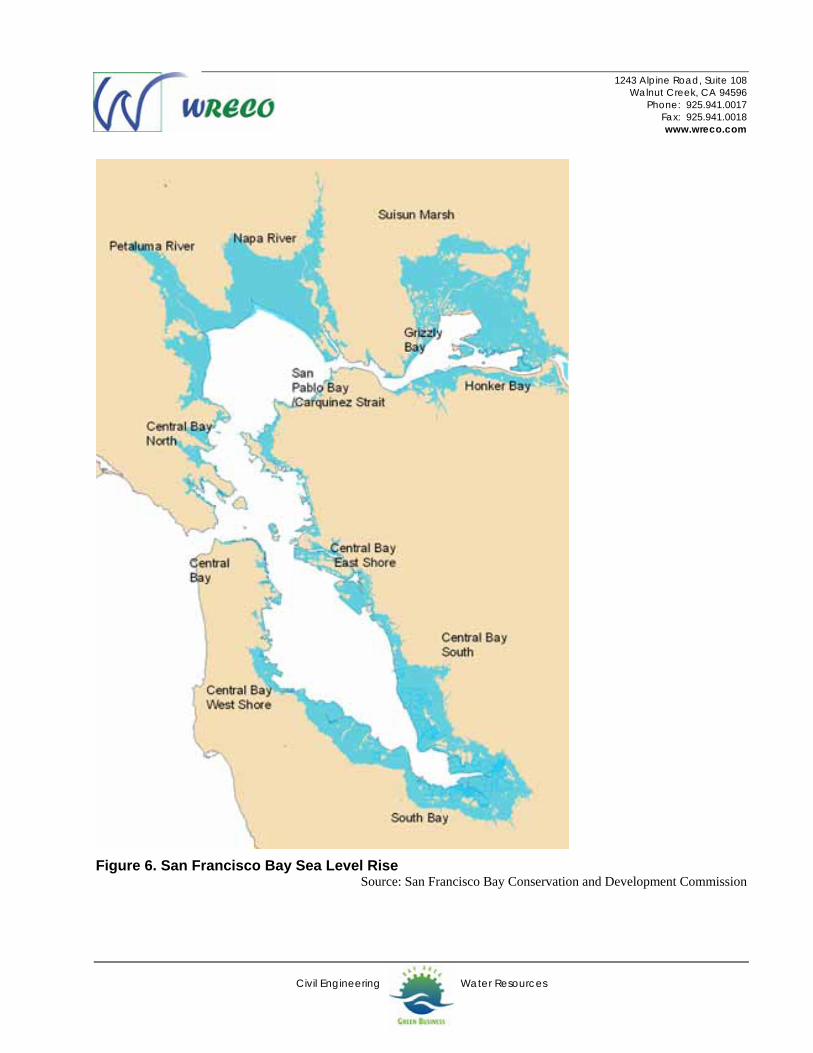
Source: FEMA, 1988 Sea Level Rise Tidal gages along the California Coast have recorded sea level rises over the past several decades showing an increase rate of about 7 to 8 in. per century, which is a similar rate to the sea level rise estimates on a global level. Figure 5 shows the projected global sea level rise using the climate change scenarios constructed by the Intergovernmental Panel on Climate Change (IPCC). Current models predict that by the year 2050, the sea level will rise approximately 1.0 ft to 1.5 ft from the sea level elevation measured in the year 2000. By the year 2100, the sea level is predicted to increase from 2.7 ft to 4.8 ft based on the year 2000’s elevation (see Figure 5) (California Climate Change Center, 2009). Figure 6 and Figure 7 show the areas in San Francisco Bay Area that are affected by the sea level rise; however, the extent of the inundation does not reflect any existing shoreline protection or wave activity. The Project area is outside of the limits, as illustrated in these figures. Although the Project would not affect the sea level rise, there would be an increase in the flooding potential at the Project location due to its susceptibility to tidal flooding.
Elevation 10-11 ft (NAVD88)
= 7 ft (NGVD29)

1243 Alpine Road, Suite 108 Walnut Creek, CA 94596
Phone: 925.941.0017 Fax: 925.941.0018 www.wreco.com
Civil Engineering Water Resources
Description of Scenarios by Intergovernmental Panel on Climate Change
• SRES A1fi: globalization, emphasis on human health, fossil intensive economics
• SRES A2: regionalization, emphasis on human health
• SRES B1: globalization, emphasis on sustainability and equity
Figure 5. Scenarios of Sea Level Rise to 2100 Source: California Climate Change Center, 2009
1243 Alpine Road, Suite 108 Walnut Creek, CA 94596
Phone: 925.941.0017 Fax: 925.941.0018 www.wreco.com
Civil Engineering Water Resources
Figure 6. San Francisco Bay Sea Level Rise
Source: San Francisco Bay Conservation and Development Commission

1243 Alpine Road, Suite 108 Walnut Creek, CA 94596
Phone: 925.941.0017 Fax: 925.941.0018 www.wreco.com
Civil Engineering Water Resources
Figure 7. Honker Bay Sea Level Rise (area shown is southwest of Project)
Source: San Francisco Bay Conservation and Development Commission
1243 Alpine Road, Suite 108 Walnut Creek, CA 94596
Phone: 925.941.0017 Fax: 925.941.0018 www.wreco.com
Civil Engineering Water Resources
Hydraulics The hydraulics for the Sacramento River, in the vicinity of the project, was analyzed using a standard step backwater calculation using the U.S. Army Corps of Engineers’ (USACE) Hydrologic Engineering Center River Analysis System (HEC-RAS), Version 4.0 computer program. The analyses were performed using preliminary bridge general plans provided by AECOM/LAN. Elevations in the model reference the NAVD88 datum.
Two cross sections were included in the model: one at River Station (RS) 0, to represent the cross section immediately upstream of Alternative 6, and one at RS 6370, to represent the cross section immediately upstream of Alternative 2. Cross sections in HEC-RAS are cut facing downstream. The cross sections at RS 0 and RS 6370 were duplicated 92 ft downstream of their respective cross sections, for modeling purposes, to provide two bounding cross sections for the proposed bridge alternatives.
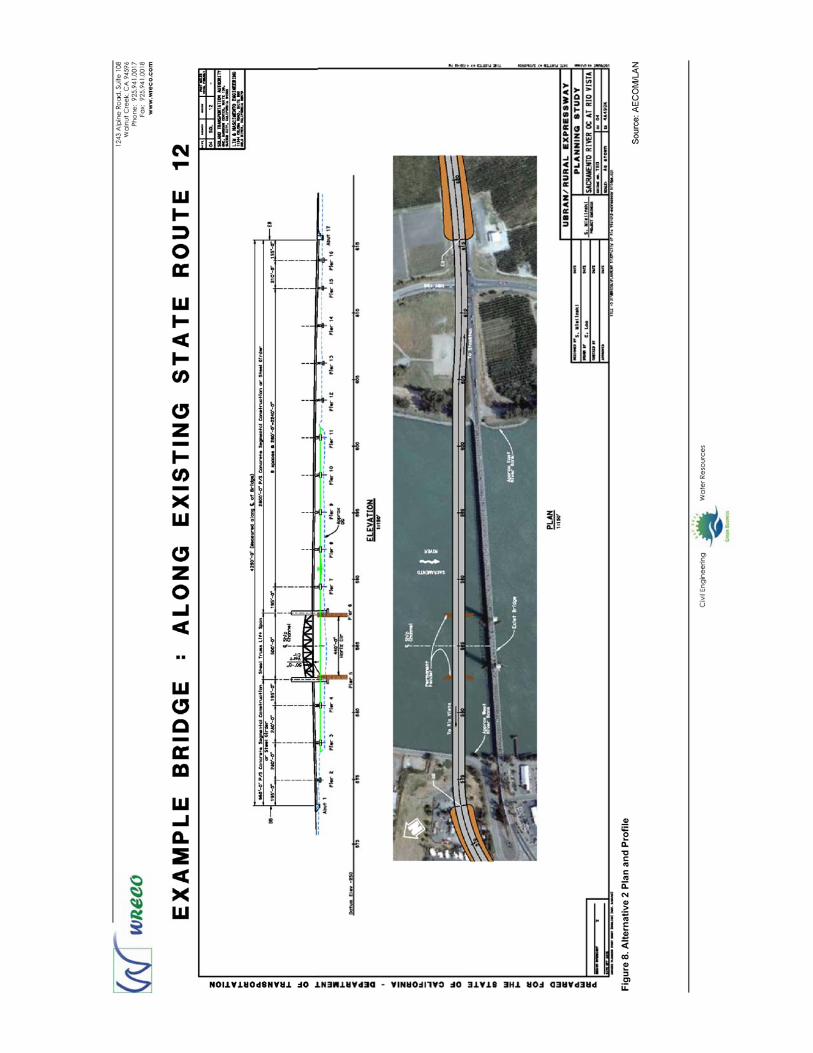
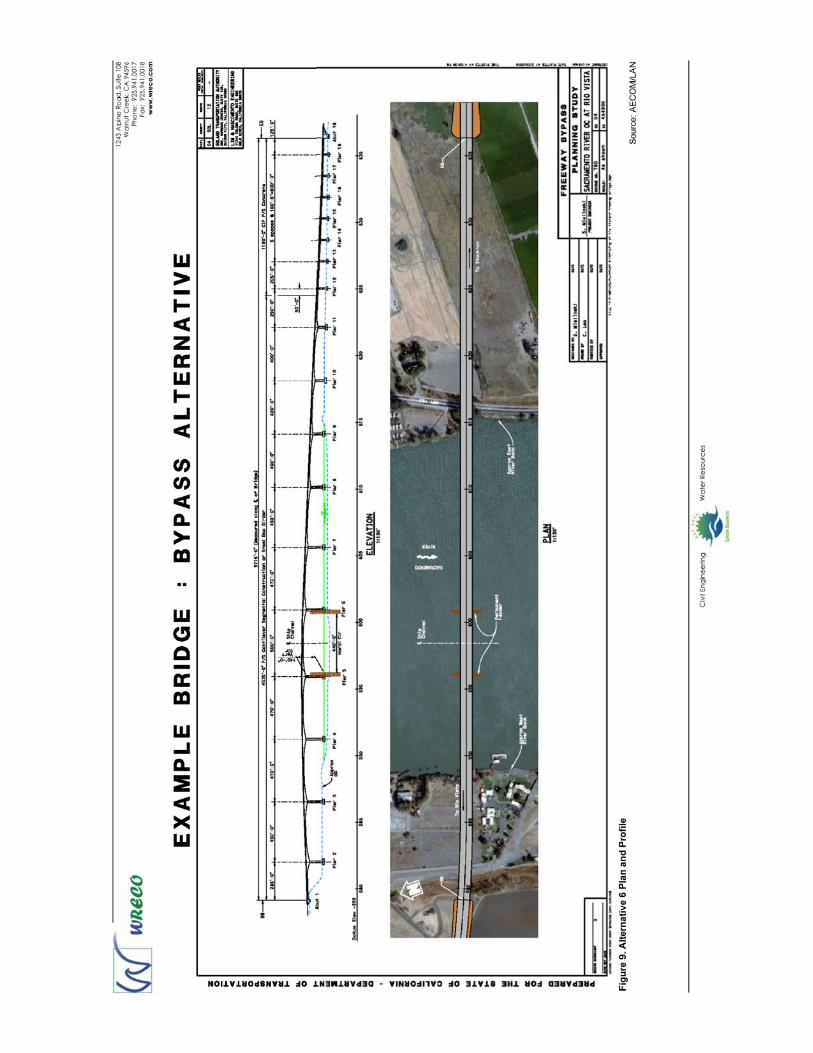
The two bridges were modeled using geometry based on the bridge general plans provided by AECOM/LAN (see Figure 8 and Figure 9).
The design discharge at the project site was estimated by calibrating the HEC-RAS model for Alternative 2. The downstream water surface elevation was set as 10 ft, and the design discharge was modified until the upstream water surface elevation reached 11.5 ft.
Manning’s roughness value, n, for the leveed section of the channel was set as 0.035 to represent short grass in floodplains, and the area outside of the levee was set as 0.05 to represent high grass in floodplains.
The estimated water surface elevations and mean velocities for the two alternatives are listed in and shown in Figure 10 and Figure 11. The table shows water surface elevations and velocities for the cross section immediately upstream of the respective bridge alignments.
Table 1. Estimated Water Surface Elevations and Velocities
Alternative Water Surface Elevation Velocity
(ft NAVD88) (ft/s)
2 11.50 5.85
6 10.05 6.10
The results from this hydraulic analysis were used to estimate scour depths at the piers.

1243 Alpine Road, Suite 108 Walnut Creek, CA 94596
Phone: 925.941.0017 Fax: 925.941.0018 www.wreco.com
Civil Engineering Water Resources
Figure 10. Alternative 2 Cross Section at Upstream Face of Bridge
11 10 9 8 7 6 5 4 3 Pier #
Water Surface Elevation = 11.50 ft (NAVD88)

1243 Alpine Road, Suite 108 Walnut Creek, CA 94596
Phone: 925.941.0017 Fax: 925.941.0018 www.wreco.com
Civil Engineering Water Resources
Figure 11. Alternative 6 Cross Section at Upstream Face of Bridge
Scour Analysis WRECO evaluated bridge scour per the criteria described in the Federal Highway Administration (FHWA) Hydraulic Engineering Circular 18 (HEC-18), Evaluating Scour at Bridges (Fourth Edition). The bridge scour was estimated based on the 100-year design storm. Based on the alignment of the bridge alternatives shown on the bridge general plans, the piers were modeled to have no skew from the 100-year design discharge. The piers were modeled to be 20 ft wide with the exception of Pier 5 and Pier 6, for Alternative 2, which were modeled to be 40 ft wide.
The Preliminary Geotechnical Memorandum, which was prepared for the project by Taber Consultants in February 2008, describes the soil in the river as “mud and loose sand.” Based on this description, a D50 of 0.25 mm, which represents fine sand, and a D95 of 7 mm, which represents fine gravel, were assumed for the scour calculations.
9 8 7 6 5 4Pier #
Water Surface Elevation = 10.05 ft (NAVD88)
1243 Alpine Road, Suite 108 Walnut Creek, CA 94596
Phone: 925.941.0017 Fax: 925.941.0018 www.wreco.com
Civil Engineering Water Resources
Long-Term Bed Elevation Change
Channel bed elevation, thalweg location, and cross-sectional geometry may fluctuate over time as a result of changes in local sediment transport capacity and availability. Channel aggradation occurs when more sediment is supplied by watershed erosion and upstream channel flow than can be transported locally. Channel degradation occurs when sediment transport capacity exceeds supply. Only channel degradation is considered for the purposes of analyzing scour. Based on a review of Bridge Inspection Reports for the existing Rio Vista Bridge, long-term bed elevation changes would not be due to degradation.
An underwater inspection conducted on September 28, 2005 indicated that the tops of footings for Piers 5-9 and Pier 13 were exposed. In addition, the bottoms of the footings and the piles for Pier 5 and Pier 6 were exposed. The depth to the bottom of the footing was between 11.5 m and 13.5 m (38 ft and 44 ft).
An underwater inspection conducted on November 17, 1993 indicated that the tops of footings for Piers 5-7, Pier 9, and Pier 11 were exposed. In addition, the bottoms of the footings and the piles for Pier 5 and Pier 6 were exposed. The depth to the bottom of the footing was between 13.7 m and 15 m (45 ft and 49 ft).
Based on these two underwater investigations, the depth at the piers decreased, which indicates that there may be aggradation in the channel.
According to soundings and the scour evaluation from July 1, 1991, “there appears to be very little change since 1980 and the current soundings support the data obtained by the divers in 1989.” Based on these findings, the depth of scour had not changed much. As stated in the office report dated October 22, 1991, Caltrans Headquarters Structure Hydraulics found that scour protection at the main piers would not be necessary.
With no indication of channel degradation in recent history, the possibility of tunneling near the existing bridge alignment may be feasible from the channel long-term bed change perspective.
Contraction Scour
Contraction scour occurs when the flow area of a stream is reduced either by: 1) the natural contraction of the stream channel; 2) by a bridge structure; or 3) the overbank flow forced back to the channel.
A modified version of Laursen’s 1960 equation for live-bed scour was used to predict the scour depth in the contracted section:
1
2
1
7/6
1
2
1
2
k
WW
yy
⎟⎟⎠
⎞⎜⎜⎝
⎛⎟⎟⎠
⎞⎜⎜⎝
⎛=
=−= os yyy 2 (average contraction scour depth)
where:
1243 Alpine Road, Suite 108 Walnut Creek, CA 94596
Phone: 925.941.0017 Fax: 925.941.0018 www.wreco.com
Civil Engineering Water Resources
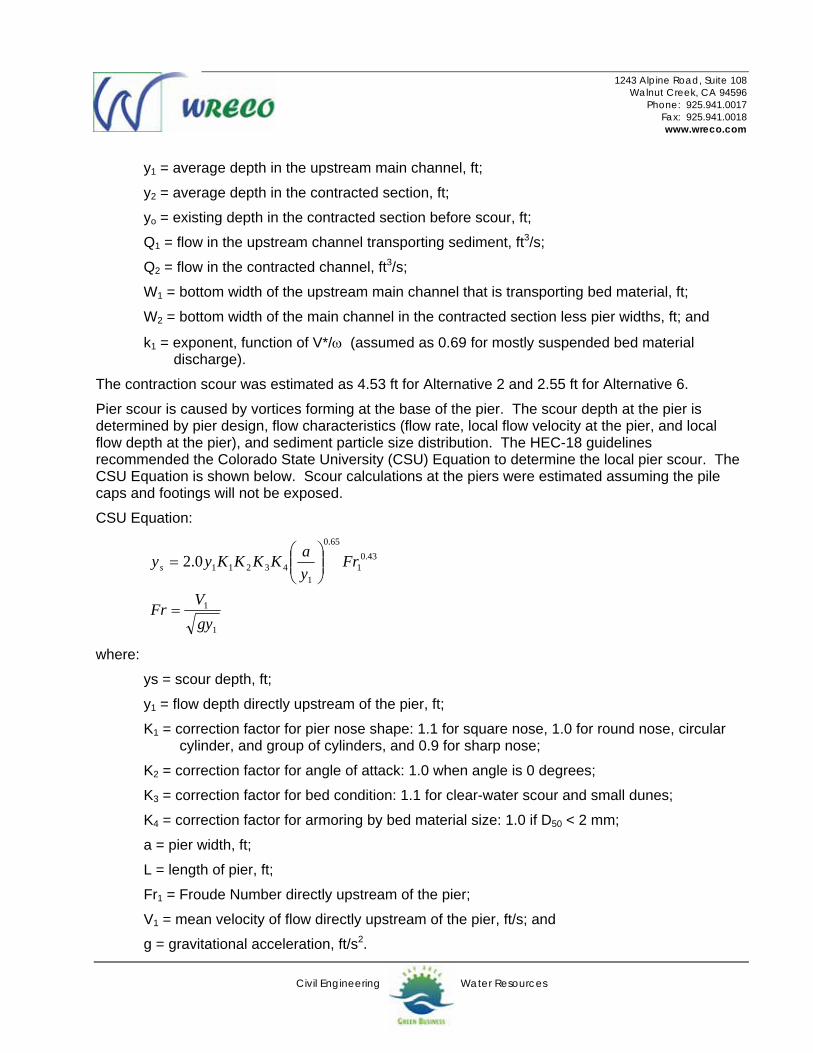
y1 = average depth in the upstream main channel, ft;
y2 = average depth in the contracted section, ft;
yo = existing depth in the contracted section before scour, ft;
Q1 = flow in the upstream channel transporting sediment, ft3/s;
Q2 = flow in the contracted channel, ft3/s;
W1 = bottom width of the upstream main channel that is transporting bed material, ft;
W2 = bottom width of the main channel in the contracted section less pier widths, ft; and
k1 = exponent, function of V*/ω (assumed as 0.69 for mostly suspended bed material discharge).
The contraction scour was estimated as 4.53 ft for Alternative 2 and 2.55 ft for Alternative 6.
Pier scour is caused by vortices forming at the base of the pier. The scour depth at the pier is determined by pier design, flow characteristics (flow rate, local flow velocity at the pier, and local flow depth at the pier), and sediment particle size distribution. The HEC-18 guidelines recommended the Colorado State University (CSU) Equation to determine the local pier scour. The CSU Equation is shown below. Scour calculations at the piers were estimated assuming the pile caps and footings will not be exposed.
CSU Equation:
1
1
43.01
65.0
1432110.2
gyVFr
FryaKKKKyys
=
⎟⎟⎠
⎞⎜⎜⎝
⎛=
where:
ys = scour depth, ft;
y1 = flow depth directly upstream of the pier, ft;
K1 = correction factor for pier nose shape: 1.1 for square nose, 1.0 for round nose, circular cylinder, and group of cylinders, and 0.9 for sharp nose;
K2 = correction factor for angle of attack: 1.0 when angle is 0 degrees;
K3 = correction factor for bed condition: 1.1 for clear-water scour and small dunes;
K4 = correction factor for armoring by bed material size: 1.0 if D50 < 2 mm;
a = pier width, ft;
L = length of pier, ft;
Fr1 = Froude Number directly upstream of the pier;
V1 = mean velocity of flow directly upstream of the pier, ft/s; and
g = gravitational acceleration, ft/s2.

1243 Alpine Road, Suite 108 Walnut Creek, CA 94596
Phone: 925.941.0017 Fax: 925.941.0018 www.wreco.com
Civil Engineering Water Resources
Local Pier Scour
The scour analysis for the piers was conducted using the average velocity for the channel cross section directly upstream of the pier. Based on the HEC-RAS hydraulic model for Alternative 2, 9 piers were found to be submerged under the 100-year design storm event: Piers 3-11. Based on the HEC-RAS hydraulic model for Alternative 6, 6 piers were found to be submerged under the 100-year design storm event: Piers 4-9. The pier scour analysis assumed square nose shaped piers with a width of 20 ft and a length of 90 ft. The local pier scour depths are summarized in Table 2.
Table 2. Local Pier Scour Summary Pier No. Local Pier Scour Depth, Ys (ft)
Alternative 2 Alternative 6
3 27.4 N/A
4 27.3 27.0
5 43.3 28.8
6 43.1 27.5
7 26.5 27.3
8 27.2 27.1
9 27.2 26.0
10 26.7 N/A
11 27.4 N/A

1243 Alpine Road, Suite 108 Walnut Creek, CA 94596
Phone: 925.941.0017 Fax: 925.941.0018 www.wreco.com
Civil Engineering Water Resources
Total Scour Depths
The total estimated scour depth will be the sum of the long-term bed elevation change, contraction scour, and local pier scour. The total scour depths for the piers are summarized in Table 3.
Table 3. Total Scour Depths Alternative 2
Long-Term Bed Elevation Change
Contraction Scour
Local Pier Scour
Total Scour Scour Elevation
Pier No.
(ft) (ft) (ft) (ft) (ft, NAVD)
3 --- 4.5 27.4 31.9 -51.9
4 --- 4.5 27.3 31.8 -51.0
5 --- 4.5 43.3 47.8 -69.9
6 --- 4.5 43.1 47.6 -68.3
7 --- 4.5 26.5 31.0 -44.1
8 --- 4.5 27.2 31.7 -50.2
9 --- 4.5 27.2 31.8 -50.7
10 --- 4.5 26.7 31.2 -45.7
11 --- 4.5 27.4 31.9 -51.8
Alternative 6
Long-Term Bed Elevation Change
Contraction Scour
Local Pier Scour
Total Scour Scour Elevation
Pier No.
(ft) (ft) (ft) (ft) (ft, NAVD)
3 --- N/A N/A N/A N/A
4 --- 2.1 27.0 29.0 -43.7
5 --- 2.1 28.8 30.8 -60.7
6 --- 2.1 27.5 29.5 -47.6
7 --- 2.1 27.3 29.3 -46.1
8 --- 2.1 27.1 29.2 -44.7
9 --- 2.1 26.0 28.1 -37.0
10 --- N/A N/A N/A N/A
11 --- N/A N/A N/A N/A
1243 Alpine Road, Suite 108 Walnut Creek, CA 94596
Phone: 925.941.0017 Fax: 925.941.0018 www.wreco.com
Civil Engineering Water Resources
Scour Protection Recommendations Foundations of the new bridge piers need to be deep enough to withstand the design scour depths. Additionally, according to the Preliminary Geotechnical Memorandum (Taber Consultants, February 2008), the channel consists of mud and loose sand up to approximately 55 ft below sea level. Below mud and loose sand are compact-very stiff sand and clay (to approximately 90 ft below sea level) and very dense sand and very hard clay (to maximum depth of Caltrans exploration, approximately 110 ft below sea level). The mud and loose sand at the bottom of Sacramento River at the Project location are not considered suitable or reliable to support any structure foundation structures. Underlying soils below mud and loose sand layer are expected to be capable to support bridge foundations. All bridge supporting structures should rest on underlying soils, even if scour elevation is above the underlying soil elevation.