
Attachment E – Literature Summary and Detailed Work...
41
E-1 Attachment E – Literature Summary and Detailed Work Plan Introduction Use of high-strength prestressed concrete girders and high-performance bridge decks has become accepted practice by many state highway agencies because of their technical and economic benefits. These girders and decks are generally manufactured with concrete made with natural normal weight aggregates. Use of manufactured lightweight coarse aggregates, such as expanded shale, slate, and clay to produce lightweight concrete offers the benefit of reducing the weight of the superstructure, leading to reductions in the size of girders, substructure, and foundations. These size and weight reductions facilitate shipping, handling, and construction or replacement of bridge elements, and result in economic benefits. Recent advances in high-performance/high-strength lightweight concrete have had limited application in bridge construction because of the lack of design and construction guidelines and concerns about material properties and their impact on performance. Research is needed to address the factors that significantly influence the design, constructability, and performance of high-strength prestressed concrete bridge girders and high-performance bridge decks and recommend changes to the AASHTO LRFD bridge specifications. These modified specifications will provide highway agencies with the information necessary for considering lightweight concrete mixtures that are expected to yield economic benefits. Objective The objectives of this research are to (1) develop guide specifications for the use of lightweight concrete in high-strength prestressed concrete girders and in high-performance bridge decks and (2) recommend changes to the AASHTO LRFD Bridge Design and Construction Specifications relevant to high-strength lightweight concrete girders and high- performance lightweight concrete decks. It will deal with mixtures made with normal weight fine aggregates and manufactured lightweight shale, clay, or slate coarse aggregates to produce concrete with equilibrium density, as determined according to ASTM C 567, of not more than 125 pcf.
Transcript of Attachment E – Literature Summary and Detailed Work...

E-1
Attachment E – Literature Summary and Detailed Work Plan
Introduction
Use of high-strength prestressed concrete girders and high-performance bridge decks has
become accepted practice by many state highway agencies because of their technical and
economic benefits. These girders and decks are generally manufactured with concrete made with
natural normal weight aggregates. Use of manufactured lightweight coarse aggregates, such as
expanded shale, slate, and clay to produce lightweight concrete offers the benefit of reducing the
weight of the superstructure, leading to reductions in the size of girders, substructure, and
foundations. These size and weight reductions facilitate shipping, handling, and construction or
replacement of bridge elements, and result in economic benefits.
Recent advances in high-performance/high-strength lightweight concrete have had
limited application in bridge construction because of the lack of design and construction
guidelines and concerns about material properties and their impact on performance. Research is
needed to address the factors that significantly influence the design, constructability, and
performance of high-strength prestressed concrete bridge girders and high-performance bridge
decks and recommend changes to the AASHTO LRFD bridge specifications. These modified
specifications will provide highway agencies with the information necessary for considering
lightweight concrete mixtures that are expected to yield economic benefits.
Objective
The objectives of this research are to (1) develop guide specifications for the use of
lightweight concrete in high-strength prestressed concrete girders and in high-performance
bridge decks and (2) recommend changes to the AASHTO LRFD Bridge Design and
Construction Specifications relevant to high-strength lightweight concrete girders and high-
performance lightweight concrete decks. It will deal with mixtures made with normal weight fine
aggregates and manufactured lightweight shale, clay, or slate coarse aggregates to produce
concrete with equilibrium density, as determined according to ASTM C 567, of not more than
125 pcf.

E-2
Tasks
The tasks as originally laid out in the proposal were as follows:
Phase I
Task 1 – Literature and Project Review
Task 2 – Review of AASHTO LRFD Bridge Design and Construction
Specifications
Task 3 – Identify Items for Further Investigation
Task 4 – Develop a Work Plan
Task 5 – Interim Report
Phase II
Task 6 - Execute the Research Plan experimental investigation
Task 7 – Comparative Deck and Girder Designs
Task 8 – Final Report
This attachment presents the results of the first four tasks of the research project.
Task 1- Background
Scope
Collect and review relevant literature, design and construction specifications, research
findings, and current practices for structural lightweight concrete. The review shall focus on the
use of lightweight concrete for high-strength and high-performance applications. Emphasis
should be placed on constructability and structural and durability properties relevant to use in
prestressed concrete girders and bridge decks. This information must be assembled from
published and unpublished reports, contacts with state transportation agencies, industry
organizations, and other domestic and foreign sources.
Literature Review
Material Properties of Lightweight Concrete. There are some unanswered questions regarding
the material characteristics of lightweight high-performance concrete (LWHPC). In particular,
equations in AASHTO may not adequately predict the tensile strength, modulus of elasticity,
coefficient of thermal expansion, shrinkage and creep behavior of LWHPC. All of these material

E-3
properties have a significant impact on the structural design of lightweight concrete bridge
girders and decks. Furthermore, there is not enough data available to fully assess the durability
of this material. Several material properties have been shown to be good measures of durability
(permeability, absorption, and freeze/thaw behavior)
The literature pertaining to the material properties of lightweight concrete is reviewed in
Appendix C. In addition, for each material property discussed, recent advances with regards to
high performance, lightweight concrete are discussed and specific research needs are presented.
Shear Behavior of Lightweight Concrete. Figure E-1 presents a summary of the test programs
found in the literature and discussed in detail in Appendix C. Some of the sources provided
enough information that the results can be reproduced and used in further evaluations of shear
strength conducted in this research effort. Others did not provide all required information. The
studies with and without adequate information are separated in the table. Analysis of this data
was performed to finalize the shear testing program, and this analysis is presented in the section
discussing and describing Sub-Task 6.4.
The previously performed research provides valuable information about the shear
behavior and shear strength of lightweight concrete. Important conclusions are as follows:
Compared to normal weight concrete of similar compressive strength-
Lightweight concrete has lower shear strength,
Shear cracks in lightweight concrete have a different angle of inclination,
Shear cracks in lightweight concrete exhibit greater slip,
Lightweight concrete behaves differently in bi-axial stress states.
In a recently completed study, Russell (2007) reported the need for evaluating the
applicability of the sectional design method to lightweight concrete beams. Therefore, he
recommends testing full sized prestressed concrete beams made with lightweight concrete to
evaluate this design method as well as minimum reinforcement and maximum spacing
requirements. The test program described in Sub-Task 6.4 is consistent with these
recommendations and endeavors to provide additional data to investigate and quantify the
differences in shear behavior and shear strength of lightweight prestressed concrete beams.

E-4
Table E-1. Summary of Past Research on Shear in Lightweight Concrete Beams
Author (Year) No. of beams
Reinf. Type
Unit Weight
(pcf)
Compr. Strength
(ksi)
Effective Depth (in.)
a/d
Cross-Sectional
Area (in2)
Shear Reinf. Index (psi)
Com- posite deck
(Yes/No)
Ahmad et al. (1994) 15 mild steel 115-129 4-13 7.8-8.5 1-4 50 0-317 No Funahashi et al. (2001) 5 mild steel 82-113 4.8-6.5 13.4-39.4 3-3.5 124-830 0 No Hanson (1958) 16 mild steel 91-113 3.1-8.6 10.5 2.48 72 0 No Hanson (1961) 30 mild steel 90-112 3-8.2 10.5 2.5-5.0 72 0 No Ivey and Buth (1967) 26 mild steel 94-126 2.8-4.7 7.4-15.6 2-5 38-160 0 No Kawaguchi et al. (2000) 9 mild steel 74-107 2.7-6.8 11.8 3.5 109 80.1 No Murayama and Iwabuchi (1986) 11 mild steel 119 6.3-7.4 9.8 2.5-4 93 0 No Nishibayashi et al. (1968) 16 mild steel 98-99 3.1-6.3 6.7 2.1-2.9 31 0 No Ramirez et al. (2004) 5 mild steel 106-127 6.2-10.5 12.0-12.1 2.1-2.2 196 174-261 No Salandra and Ahmad (1989) 16 mild steel 122.5 8-10.5 6.75 0.5-3.6 32 456 No Walraven and Al-Zubi (1995) 11 mild steel 108-131 2.9-7.0 28.9-30.1 2.2-2.3 279 360-1290 No Malone (1999) 5 mild steel 106-127 6.2-10.5 12.1 2.1-2.2 196 157-236 No Malone (1999) 4 prestressed 106-127 6.5-10.1 29.3 3 469 0-110 Yes Kahn et al. (2004) 6 prestressed 118-119 8.9-11.0 40 1.5-2.4 369 570 Yes Dymond (2007) 2 prestressed 118 10.5-10.7 58.5 1.3-3.1 1559 530-760 Yes
Evans and Dongre (1963) 20 mild steel 90-115 3.1-4.9 n/a n/a n/a n/a No Hamadi and Regan (1980) 5 mild steel n/a 4.0-4.6 13.8 3.6 14 90-470 No Hoff et al. (1984) 14 mild steel n/a n/a n/a n/a 46.5 n/a No Jindal (1966) 6 mild steel 93-106 2.9-3.4 13 n/a n/a 0 No Kirmair (1981) 5 mild steel 93.6 4.2 n/a n/a 174 91-1154 No Kobayahsi et al. (2000) 9 mild steel 75-105 4.3-8.9 8.7 2 84 61 No Swamy and Bandyopadhyay (1979) 16 mild steel n/a 5.2-5.8 5 1.5-6 41 0 No
Swamy and Lambert (1983) 27 mild steel n/a 3.4-7.0 7.1 1.5-6 62 0 No
Brettle (1962) 16 prestressed 105 4.8-6.4 n/a 1.5-9 12-36 0 No
Watanabe et al. (2004) 7 prestressed 106-119 8.7-9.6 21.7 3 194 66 No
Note: Research listed above will be discussed in description of Sub-Task 6.4

E- 5
Prestress Losses. Prestress losses in lightweight and high-performance lightweight concrete
beams have been investigated by several researchers in the past. Nassar (2002) measured
changes in strain at the centroid of the prestress force in two AASHTO Type IV girders
constructed with high-strength lightweight concrete. These were test girders for the
Chickahominy River Bridge constructed in Virginia. Measurements were taken for over nine
months, and compared to time-step and other methods for predicting prestress losses. The
measured elastic shortening loss was higher than predicted using ACI 209 (2000) or PCI (1975).
However, the time dependent loss was considerably smaller than predicted with either model.
Waldron (2004) tracked the changes in strain in three additional Chickahominy River
Bridge girders for over 900 days. This allowed the changes to be tracked through the
construction process including casting of the deck and barrier rails, and under service conditions.
Waldron compared the measured changes in strain to predicted changes using a wide variety of
methods. He calculated losses using the time-step method with 12 different creep and shrinkage
models, and he also calculated losses with nine other methods. He evaluated the effectiveness of
the models in predicting losses in high-strength, lightweight girders, and concluded that the
Shams and Kahn (2000) model provided the best predictions using time-step methods but noted
that the method for calculating prestress loss proposed in NCHRP 496 (Tadros, et al.
(2003))(essentially the method given in AASHTO) gives a conservative estimate of losses in
high performance, lightweight prestressed girders. However, he did recommend further
investigation of losses in lightweight concrete. All evaluated methods for direct calculation of
losses underestimated elastic shortening losses and overestimated long term losses.
Kahn and Lopez (2005) instrumented and monitored changes in strain at the level of the
prestress in four AASHTO Type II girders made with high-strength, lightweight concrete. They
compared measured losses to losses predicted with four prestress loss calculation methods.
Similar to Waldron (2004) and Nassar (2002), the measured elastic shortening losses were higher
than predicted and the long term losses were smaller than predicted.
Except for Waldron, the previously sighted works did not evaluate the current AASHTO
method for predicting prestress loss, because they were published before the adoption of the
current method into the specifications. The previously collected data should be compared
against the current method. Since the method itself is highly rational, the efficacy of the method
in predicting changes in strain is primarily dependent on the accuracy of the material models in

E- 6
predicting modulus of elasticity and creep and shrinkage coefficients. Finally, Russell (2007)
recommends investigation of prestress losses (and, concurrently, creep and shrinkage properties)
in full size girders and comparing measured with predicted results.
Transfer and Development Lengths of Prestressing Strand. The end region of a member over
which the effective prestressing stress, fse, is transmitted from the strands to the concrete is
referred to as the transfer length, Lt. A generally accepted model of the variation of prestress
forces in a concentrically prestressed member is shown in Figure E-1. Prestressing force is
transferred from the strand to the concrete near the end of a prestressed girder due to the swelling
of the strand (Poisson’s Effect). This swelling causes radial tension in the concrete around the
strand. One way to determine if complete transfer of the prestressing force to the concrete is
accomplished is by measuring the transfer length of the strand immediately after transfer. Also,
if adequate spacing and cover of the strand is not provided, cracking of the concrete near the end
of the member may result.
AASHTO defines development length as the “distance required to develop the specified
strength of a reinforcing bar or prestressing strand” (AASHTO, 2007). The first bond region is
the one characterized previously as the transfer length and the second bond region is termed the
flexural bond length. This flexural bond region is the additional length required beyond the
transfer length for the strands to develop their ultimate flexural stress, fps. Figure E-2 below,
illustrates a qualitative variation of strand stress along the development length.
Neither ACI nor AASHTO accounts for differences in bond and development length in
lightweight concrete. Research by Nasser (2002) on the transfer length in lightweight, high
strength AASHTO girders indicated that the current equations were conservative for the
prediction of transfer length. Transfer lengths were measure on each end of two Type IV girders.
The release strength for the girders was 4780 psi. The 95% average maximum strain method
was used to determine the transfer length for the four measured locations, and the average
transfer length was 16.8 in. This was considerably less than the 50 bar diameter length of
AASHTO and ACI, which for 0.5 in. diameter strands is 25 in.

E- 7
Figure E-1: Variation of stresses in a prestressed member
Figure E-2: Variation of steel stress with distance from free end of strand
Other researchers have investigated transfer length in lightweight concrete (Russell and
Burns 1996) and Peterman et al., (1999)). Russell and Burns indicated 50 bar diameters was
unconservative for lightweight concrete, while the research by Peterman et al. results indicated
that 50 bar diameters was conservative. Also, a systematic laboratory investigation of transfer
and development length of prestressing strand has been recommended by Russell (2007).
Transfer of prestress force has a significant impact on shear design of prestressed concrete
Development Length
fps
fs
fps-fse
Transfer Length
Flexural Bond Length
fse
Lt Lt
Member axis

E- 8
(especially web shear strength). Development length is an important design consideration in
states that use debonding of prestressing strands as opposed to draping of strands. This is an
area which could benefit from additional data collection.
Another question related to design of transfer zones in lightweight concrete is whether
0.6 in. diameter strands can be used on a 2 in. grid without causing cracking or distress in the
transfer region. The lower tensile strength of lightweight concrete could result in more cracking,
longer transfer lengths, longer developments lengths, or the requirement for greater quantities of
confinement reinforcing in the end zones of prestressed beams.
Development and Splice Lengths of Mild Reinforcement. With regards to mild steel
reinforcement development and splice length, AASHTO (AASHTO, 2007) gives equations and
factors in section 5.11.2 that account for the effect of the following on development length: bar
size, bar yield strength, concrete compressive strength, top bar effect, epoxy coating, spacing,
cover, and confinement. Factors are also included in AASHTO that account for the impact of the
use of lightweight aggregates on development and splice length in reinforced concrete members.
The factors given range from 1.0 (for lightweight concrete with sufficient splitting tensile
strength) to 1.3 (for all lightweight aggregate concrete where splitting tensile strength is not
specified). These factors are based on several research projects conducted between 1934 and
1993 (ACI, 2003) and primarily included testing of specimens with normal strength, lightweight
concrete. The results of these projects indicate that bond strengths between reinforcement and
lightweight concrete can range from approximately equal to that of normal weight concrete to
about 65% less. In addition, several researchers in the 1990s found that for higher strength
concrete (f’c ≥ 8,000 psi) the average bond strength at flexural failure decreases with an increase
in compressive strength (when normalized to c'f ). The term c'f is used in the denominator
of the AASHTO equations for development length to account for the effect of f’c on
development length. As stated in an American Concrete Institute report (ACI , 2003) there is a
“paucity” of experimental testing and results of the bond strength of reinforcement in concrete
containing lightweight aggregates. In addition, Russell (2007) recommends a systematic
laboratory investigation of development of mild steel in lightweight concrete. When considering
all this, it seems prudent to further investigate bond strength and development of reinforcement
in lightweight concrete.

E- 9
Bearing strength. Very little work has been done to evaluate the differences in bearing strength
between lightweight and normal weight concrete. At Virginia Tech, Roberts-Wollmann et al.
(2006) performed an experimental investigation into the bearing strength of lightweight concrete
cylinders. Cylinders of both lightweight and normal weight concrete with compressive strengths
of approximately 5000 psi and 8000 psi were tested. These cylinders were loaded with bearing
plates of varying sizes. The ultimate loads and failure modes were noted. It was found that the
equation for bearing strength presented in ACI 318, which is essentially the same as in Section
5.7.5 in AASHTO, can over predict strength for lightweight and high strength normal weight
concrete at ratios of supporting area to bearing area (A2/A1) less than approximately 7. Two
possible corrections were presented, one involves applying a lightweight concrete factor (λ) to
the existing equation, and the other is a new equation based on a Mohr failure criterion for the
concrete in the test prisms. Both provide safer predictions of the bearing strength of lightweight
concrete than does the current ACI/AASHTO Equation.
Post-Tensioned and Pre-Tensioned Anchorage Zones. One critical region of post-tensioned
structures, which has not been thoroughly investigated for lightweight concrete, is the local
tendon anchorage zone. The local anchorage zone is the region immediately surrounding a post-
tensioning anchorage device, which is subjected to very high local bearing stresses induced by
the introduction of the tendon force into the concrete. Within the local zone, the high bearing
stresses disperse and at the limits of the local zone the stresses must be spread sufficiently to be
safely introduced into the surrounding structure. In normal weight concrete, if the introduced
compressive stresses exceed bearing stresses which can be accommodated by unreinforced
concrete, the anchorage system incorporates a spiral or other confining reinforcement to enhance
the compressive strength of the concrete within the local zone.
The behavior and design of a local anchorage zone in lightweight concrete could be
significantly different from that of normal weight concrete. This is because lightweight concrete
is more susceptible to local crushing of the aggregates and has a lower splitting tensile strength
(Heilmann 1983). Roberts-Wollmann et al.(2006) presented data which indicated that the bearing
strength of unreinforced lightweight concrete was less than that of normal weight concrete with
identical compressive strength. In addition, tests have shown that the compressive strength of

E- 10
lightweight concrete is not increased as greatly as normal weight concrete by the presence of
surrounding concrete or confining reinforcement (Heilmann 1983, Martinez et al. 1984, Basset
and Uzemeri 1986, Shah et al. 1983).
Pre-tensioned anchorage zones in lightweight girders are more prone to cracking than
similar regions in normal weight girders. Case studies reported by Crispino and Davis (2006)
indicate longer and wider cracking in lightweight girder end zones. The simple methods
currently prescribed in AASHTO for the design of these regions are proving to be inadequate to
control end zone cracking in lightweight girders.
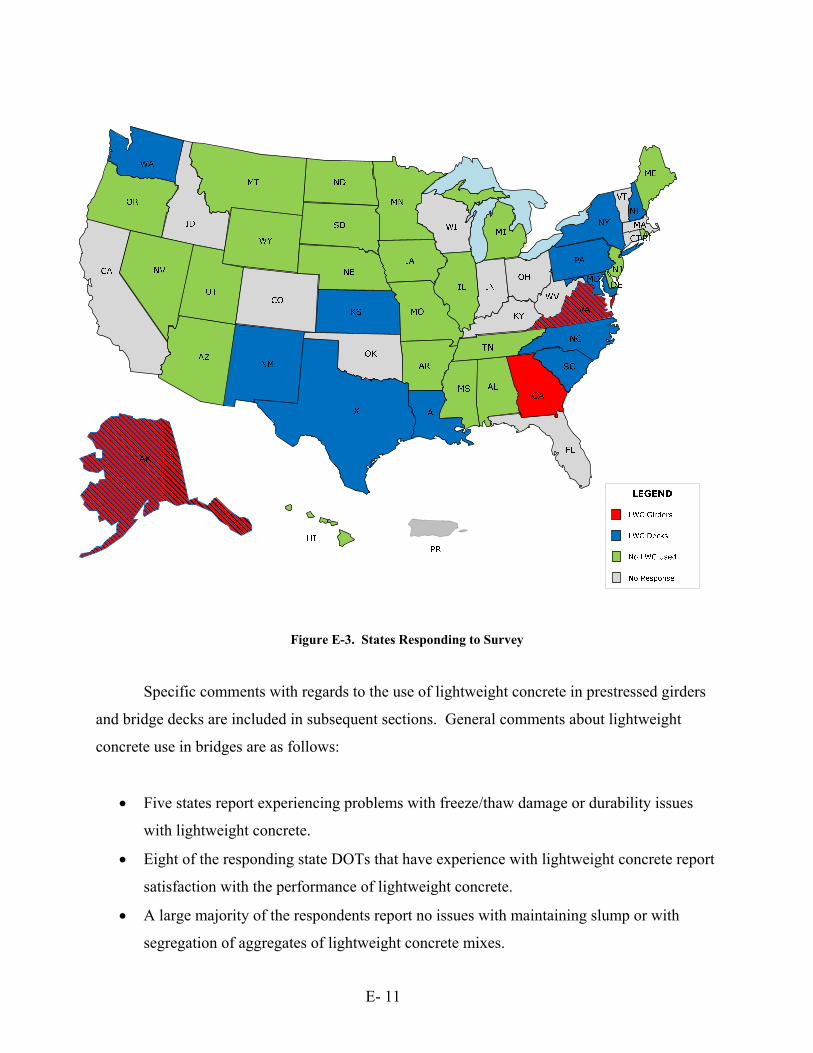
Results of State DOT Survey
A survey was sent to all 50 State Bridge Engineers and the bridge engineers in the
District of Columbia and Puerto Rico to determine if they have used lightweight aggregate
concrete in bridge structures. Questions regarding usage in girders, usage in decks, typical mix
designs, special design requirements, and numbers of projects were included in the survey. The
survey also requested information about the engineer’s satisfaction with lightweight concrete and
any problems experienced with or benefits perceived from the use of lightweight concrete. A list
of projects was compiled. Appendix D contains each question included in the survey with
results received. Responses were received from 38 states with two having used lightweight
concrete in prestressed girders (Virginia and Alaska) and 15 states having used lightweight
concrete in bridge decks. Of the 52 agencies contacted, fourteen did not respond. Figure E-3
shows a map of the United States with the states that responded labeled.
E- 11
Figure E-3. States Responding to Survey
Specific comments with regards to the use of lightweight concrete in prestressed girders
and bridge decks are included in subsequent sections. General comments about lightweight
concrete use in bridges are as follows:
Five states report experiencing problems with freeze/thaw damage or durability issues
with lightweight concrete.
Eight of the responding state DOTs that have experience with lightweight concrete report
satisfaction with the performance of lightweight concrete.
A large majority of the respondents report no issues with maintaining slump or with
segregation of aggregates of lightweight concrete mixes.

E- 12
About half of the fifteen states that have used lightweight concrete report have experience
with pumping lightweight concrete.
About half of the fifteen states that have used lightweight concrete report using shale
lightweight aggregates and one quarter slate.
A variety of methods for pre-wetting lightweight aggregates were reported.
Summary of responses regarding Lightweight Girders. Respondents to the survey reported 33
bridges built with lightweight concrete girders (13 in Alaska and 20 in Virginia). Personal
contact with Georgia DOT revealed the construction of a bridge utilizing lightweight concrete
bridge girders. That bridge is still in design so was not reported in the survey. Also, bridges in
California (Murugesh, 2007), Ohio (Spaans, 1997), and Indiana (Wanders, 1993) have been
constructed with lightweight concrete girders, but these three states did not respond to the
survey. Design strengths used in Alaska and Virginia are split evenly between less than or equal
to 6,000 psi and between 7,000 to 8,000 psi.
The survey results reveal that lightweight concrete is rarely used in bridge girders and
most recent uses have been in one state (Virginia). Typically in Virginia a mixture of
lightweight and normal weight aggregates is used at a ratio of 42 % to 58 % and at a water-to-
cementitious material ratio of between 0.30 and 0.34.
From a design perspective neither state utilizes special provisions for the design of
prestress girders containing lightweight concrete.
Summary of responses regarding Lightweight Decks. Of the 15 states that have used
lightweight concrete decks, New York and Pennsylvania had the most. The states responding
reported on a total of 228 bridges constructed with lightweight concrete decks.
About three quarters of the respondents reported using design compressive strengths of
between 3,000 and 5,000 psi. Approximately three quarters of the bridge decks constructed with
lightweight concrete were done with normal weight fine aggregate and with a water-to-
cementitious material ratio of between 0.40 and 0.44. The responding states are split evenly with
regards to the number of states that have or do not have special provisions for the design of
lightweight concrete bridge decks.
E- 13
Summary of Contacts with Lightweight Aggregate Manufacturers
To facilitate the selection of aggregate, lightweight aggregate manufacturers were
contacted and data and other information materials have been acquired for each of the production
facilities. It was determined that some facilities are no longer producing lightweight aggregate,
some plants have totally closed, and others do not produce structural-grade lightweight
aggregate. It should be noted that structural, in this context, refers to aggregate used in ready-
mix or precast, prestressed concrete applications. Aggregate used primarily in concrete masonry
units (CMUs) was not considered to be structural aggregate, for the purpose of this study.
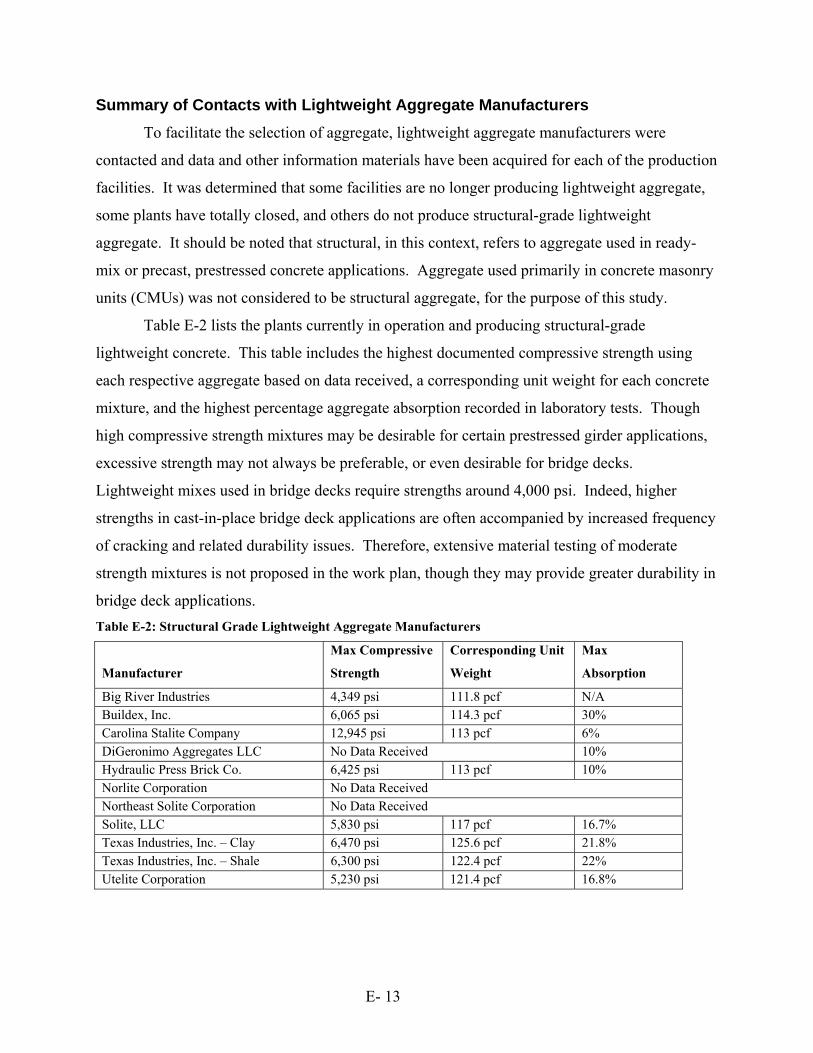
Table E-2 lists the plants currently in operation and producing structural-grade
lightweight concrete. This table includes the highest documented compressive strength using
each respective aggregate based on data received, a corresponding unit weight for each concrete
mixture, and the highest percentage aggregate absorption recorded in laboratory tests. Though
high compressive strength mixtures may be desirable for certain prestressed girder applications,
excessive strength may not always be preferable, or even desirable for bridge decks.
Lightweight mixes used in bridge decks require strengths around 4,000 psi. Indeed, higher
strengths in cast-in-place bridge deck applications are often accompanied by increased frequency
of cracking and related durability issues. Therefore, extensive material testing of moderate
strength mixtures is not proposed in the work plan, though they may provide greater durability in
bridge deck applications.
Table E-2: Structural Grade Lightweight Aggregate Manufacturers
Manufacturer
Max Compressive
Strength
Corresponding Unit
Weight
Max
Absorption
Big River Industries 4,349 psi 111.8 pcf N/A Buildex, Inc. 6,065 psi 114.3 pcf 30% Carolina Stalite Company 12,945 psi 113 pcf 6% DiGeronimo Aggregates LLC No Data Received 10% Hydraulic Press Brick Co. 6,425 psi 113 pcf 10% Norlite Corporation No Data Received Northeast Solite Corporation No Data Received Solite, LLC 5,830 psi 117 pcf 16.7% Texas Industries, Inc. – Clay 6,470 psi 125.6 pcf 21.8% Texas Industries, Inc. – Shale 6,300 psi 122.4 pcf 22% Utelite Corporation 5,230 psi 121.4 pcf 16.8%
E- 14
Based on the data obtained from the various lightweight aggregates manufacturers, the
research team concluded that the highest feasible design compressive strength for production
lightweight aggregate concrete is 10,000 psi. The target average compressive strengths to meet a
design strength of 10,000 psi would be between 11,000 psi, and 12,000 psi, depending upon
variability in production. Though there have been documented results showing that an expanded
lightweight aggregate is capable of strengths in the 12,000 psi range, a lightweight concrete
mixture yielding compressive strengths consistently above 12,000 psi does not seem attainable,
and would require cementitious content at proportions that would likely induce complications
due to shrinkage and creep. It is for this reason the research team will focus on developing
mixtures with design compressive strengths in the 8,000 and 10,000 psi range.
The research team recommends four aggregate sources to use in laboratory testing for
this project. The four sources are as follows: an expanded clay source from California; an
expanded shale source from Kansas; an expanded shale source from Indiana; and an expanded
slate source from North Carolina. The selection process took into account the data acquired from
the various manufacturers and the highest documented compressive strengths reported by those
suppliers. The particular sources were chosen in order to optimize the geographic distribution, to
assure at least one source from each of the three material types (clay, shale, slate), and to select
sources believed to be capable of achieving the strength goals proposed in the work plan.
Task 2- Review of AASHTO LRFD Bridge Design and Construction Specifications
Scope
Review AASHTO LRFD Bridge Design and Construction Specifications. Identify and
discuss the provisions that have limited the application of lightweight concrete in highway
bridges and could be improved based on new research. Prepare a prioritized list of specific
issues that are hindering the use of high-strength and high-performance lightweight concrete in
bridges. Also, identify material properties and other factors relevant to the design,
construction, and durability of bridge girders and decks (creep, shrinkage, permeability, heat of
hydration, etc.) and discuss their impact on the use of lightweight concrete in bridge decks and
girders.
E- 15
Introduction
The research team have reviewed both AASHTO (4th edition) and AASHTOC (1998) to
determine the articles that specifically address lightweight concrete. Articles that don’t currently
address lightweight concrete, but possibly should, have been identified as well. Some of these
areas have been identified in the background section of this report.
AASHTO LRFD Bridge Design Specifications
The following two tables present the references within AASHTO that mention
lightweight concrete or may need to. Table E-3 presents sections discussing material properties
and Table E-4 presents sections discussing structural design. Included in both tables is a
summary of findings regarding the specific code sections based on the literature review and a
review of AASHTO.
In general, sections of AASHTO that deal with material properties of concrete do not
mention lightweight concrete; and, if they do, need revision. Of special importance are
equations for predicting tensile strength and modulus of elasticity of lightweight concrete as well
as time dependent material properties (i.e., creep and shrinkage). All have a significant effect on
design of prestressed concrete girders
There several areas of prestressed girder and deck design with lightweight concrete that
need further investigation. For lightweight concrete decks, the modification factor for
development length of mild steel in lightweight concrete needs further evaluation. For
prestressed girders the following factors rate moderate or high and need further investigation:
resistance factors, flexural resistance, deflection and camber, shear design, allowable stress
limits, loss of prestress, strand spacing limits, and bond of strand to lightweight concrete.

E- 16
Table E-3. Material Properties
Section Title Is LWC
mentioned? Probability of Change
Summary
5.4.2.1 Compressive Strength Yes Low Is f’c = 10,000 achievable?
5.4.2.2 Coefficient of Thermal
Expansion Yes Low
This is an area where a synthesis of existing data will be sufficient to evaluate the current AASHTO
provisions.
5.4.2.3.2 Creep No Moderate
Previous research shows conflicting conclusions regarding creep of
lightweight concrete. Creep (as with shrinkage) has a major impact on the level of prestress loss in a prestressed
bridge girder.
5.4.2.3.3 Shrinkage No Moderate
Researchers have generally found that lightweight concrete experiences more drying shrinkage than normal weight
concrete. This appears to be especially true for high performance,
lightweight concrete.
5.4.2.4 Modulus of Elasticity No High
Lightweight aggregate has a significant impact on Ec.
The AASHTO equation for Ec may be unconservative for lightweight
concretes.
5.4.2.6 Modulus of Rupture Yes Moderate
Lightweight aggregate can have a significant impact on fr. Is AASHTO equation for fr appropriate for use with
lightweight concrete?
5.4.2.7 Tensile Strength No High Equation in Commentary does not
consider lightweight concrete.

E- 17
Table E-4. Structural Design
Section Title Is LWC
mentioned? Probability of Change
Comment
5.5.3 Fatigue Limit State No Low Usually does not control bridge design.
5.5.4.2 Resistance Factors Yes High Lightweight concrete has a reduced
factor for shear
5.7.2.2 Rectangular Stress
Distribution No Moderate
0.85 may or may not be justified for use w/lightweight concrete
5.7.3.2 Flexural Resistance No Moderate fps equation was not based on lightweight
concrete behavior 5.7.3.5 Moment Redistribution No Low
5.7.3.6.2 Deflection and Camber No High
Proper deflection and camber predictions are a function of reasonable equations
for Ec (5.4.2.4), fr (5.4.2.6), creep (5.4.2.3.2), and shrinkage (5.4.2.3.3)
5.7.5 Bearing No Low A lightweight reduction factor may be in
order
5.8.2.2 Modifications for
Lightweight Concrete (Shear and Torsion)
Yes High
The adjustment made for lightweight concrete in shear calculations are on one
term in Vcw equation and have little effect on overall shear strength of a
member.
5.8.2.5 Minimum Transverse
Reinforcement No High
Lightweight modifications result in greater amounts of reinforcement
5.8.3.3 Nominal Shear Resistance No High Applicability of equations to lightweight
concrete should be addressed
5.8.4 Interface Shear Transfer--
Shear Friction No Low
5.9.4 Stress Limits for Concrete
(Prestressing) No Moderate
Effect of potential lower tensile strength of lightweight concrete may lead lower
allowable tensile stresses
5.9.5 Loss of Prestress No Moderate Little prestress loss data available for
lightweight members
5.10.3.3 Minimum Spacing of
Prestressing Tendons and Ducts
No Moderate Minimum spacing of prestressing strands in pretensioned members set for normal
weight concrete
5.11.2.1 Deformed Bars and Deformed Wires in
Tension Yes High
modification factor for lightweight concrete should be evaluated
5.11.4.2 Bonded Strand
(Development of Prestressing Strand)
No High Transfer and development length
equations developed for normal weight concrete

E- 18
AASHTO LRFD Bridge Construction Specifications AASHTOC does not directly address the use of lightweight or high performance, lightweight
concrete in bridge girders or decks. However, there are several sections of this specification that
cover areas that are critical to the proper construction of bridges containing lightweight concrete.
Control of water content in lightweight concrete mixes is critical. This typically requires
saturated lightweight aggregate stock piles (AASHTOC 8.5.1) and trial batches when
changing the mix design or using a new mixing plant (AASHTOC 8.4.1.2)
When determining the percent air content of fresh lightweight concrete only a roll-a-
meter should be used (AASHTOC 8.5.6).
Pumping lightweight concrete for bridge decks can be problematic because the concrete
tends to loose slump if not proportioned properly (AASHTOC 8.7.3.2).
Intentional roughening (or raking) of the top flange of prestressed girders is not
recommended because of the natural tendency of the aggregate to rise to the top girder
surface. Also, raking may lead to segregation of the aggregate and paste (AASHTOC
8.13.3).
Extreme care should be taken when shipping and handling lightweight prestressed
girders. Lightweight concrete generally has a smaller Ec than normal weight concrete
girders which leads to potential lateral stability issues during handling and construction
(AASHTOC 8.13.5).
These and other issues in fabricating girders and constructing bridge decks with lightweight
concrete should be investigated further.

E- 19
Task 3 – Items for Further Investigation Scope
Based on the information gathered in Tasks 1 and 2, recommend for further
investigation in Phase II, those issues, properties, and factors relevant to the use of lightweight
concrete in prestressed concrete girders and decks that would support changes to the provisions
of the AASHTO LRFD Bridge Design and Construction Specifications identified in Task 2.
Findings
An evaluation of issues, properties, and factors that need investigation is presented in
Table 5. The issues listed as high or medium importance will be investigated as described in the
Work Plan described in Task 4.
The background information presented previously illustrates many of the areas in which
there is considerable uncertainty as to the correct treatment of lightweight concrete for
prestressed bridge girders and bridge decks. Based on the literature and project review,
discussions with bridge engineers, discussion with members of the lightweight concrete industry,
and the review of AASHTO, those aspects of AASHTO that could be improved to better reflect
the behavior of lightweight concrete have been identified. Table E-5 below provides the
research teams’ conclusions regarding what are the most important issues (see column labeled
Importance Factor) and the corresponding test specimens that will be used to address these
issues. Included in the table are the material properties that are important to a specific issue (for
instance accurately predicting Ec of the lightweight concrete is critical to properly estimating
girder cambers and deflections). Further details of the tests to be performed can be found in
subsequent sections of this report.

E- 20
Table E-5. Issues Identified for Further Investigation
Issue Importance
Factor
Tests Material Testing
Lab Cast Beams
Full size girders Beam ends
Durability High * Shear & Torsional
Strength High *(fct) * *
Allowable stresses Medium *( fct, f’c) * * Crack Control Medium *( fct)
Deflection & Camber High *(Ec) * *
Prestress Losses High *(Ec, Creep, Shrinkage)
* *
Transfer & Development of P/S
Medium *(fct) * *
Bond Strength of RC Medium * Punching Shear Low
Bearing Strength Low Horz. Shear Strength Low
Anchorage Zones Low
Task 4 – PHASE II Work Plan Scope
Prepare an updated, detailed work plan for Task 6 that includes an experimental
investigation of the properties and factors recommended in Task 3. It is expected that Task 6
will include design, construction, and testing of full-scale girder-deck assemblies and
associated analysis to validate laboratory test results and structural design criteria.
Detailed Work Plan
The following describes the work plan for Phase II of the project. Phase II is divided into
three tasks (Tasks 6, 7, and 8) with Task 6 having six subtasks.
The six subtasks for the Task 6 are:
Subtask 6.1 Material Properties Testing
Subtask 6.2 Material Property Verification Testing
Subtask 6.3 Lab Cast Beams
Subtask 6.4 Full Scale Beams
Subtask 6.5 Interface Shear Transfer

E- 21
Subtask 6.6 Recommend changes to AASHTO Bridge Specifications
Subtask 6.1 Material Properties Testing
During Task 1 of this project, a detailed literature review was conducted to assess the
depth of knowledge of the material properties of commonly available lightweight concrete.
There are sources of lightweight aggregate throughout the country, and the material properties of
aggregate from these different sources are already well documented. The research team
compiled a database of national, as well as, regional sources. This database includes the source
and any documented material properties for each individual source, such as elastic modulus, unit
weight, specific gravity, absorption rates and angularity of the aggregate. Most of the sources
have been properly characterized with regards to material properties. The research team used the
completed database to select six candidate aggregates for testing in this project:
Source A - expanded clay form California (TXI-Hydrolite)
Source B - expanded shale from Colorado (TXI-Realite)
Source C - expanded shale from Indiana (HBPC-Haydite)
Source D - expanded slate from North Carolina (CSC-Stalite)
Source E - expanded clay from Louisiana (BRI-Gravelite)
Source F - expanded shale from New York (NSC-Solite)
The properties in the database will aid in the mixture design and proportioning of the
lightweight concrete mixtures used for this project.
Based upon the findings of the literature search, detailed screening tests will be executed
on concrete mixtures from the six aggregate sources (designated A through F). The selected
sources are from the West, Midwest, South, East and Northeast regions of the country.
Testing will consider two nominal coarse aggregate sizes, ¾ in. and ½ in. However, mix
designs may vary depending upon availability of the aggregate sizes. Mixtures proportions will
consider water-to-cementitious (w/cm) ratios of 0.30, representing high-strength, low
permeability beam mixtures, and 0.40, representing moderate strength and permeability beam
mixtures as well as good quality concrete deck mixtures. Alternative mineral admixtures to
ordinary portland cement may include fly ash (FA), ground granulated blast furnace slag

E- 22
(GGBFS), and silica fume (SF), each dosed at a typical rate to produce high-performance
concrete mixtures. For deck concrete mix designs, Type 1/2 portland cement (Type 1/2 PC) will
be used and, for girder concrete mix designs, Type 2 modified portland cement (Type 2 Mod PC)
will be used. These materials will be representative of nationwide use and will be proportioned
accordingly to achieve several different desired strength levels. A full evaluation of all the
potential combinations of variables is not feasible. Therefore, Table E-6 presents the anticipated
number of batches of each mixture to be assessed. The decisions inherent therein are intended to
balance time, resources and predicted influence of each variable, while endeavoring to render
statistically valid results.
Table E-6. Proposed Materials Screening Test Matrix
Paste Coarse Aggregate Types
A B C D* E F w/cem Binder Number of Batches
0.3 Type 2 Mod PC 2 2 2 2 2 2 Type 2 Mod PC +
20%FA** 2 2 2 2 2 2
Type 2 Mod PC + 40% GGBFS
2 2 2 2 2 2
Type 2 Mod PC + 7.5%SF
2 2 2 2 2 2
0.4 Type 1/2 PC 2 2 2 2 2 2 Type 1/2 PC +
20%FA** 2 2 2 2 2 2
Type 1/2 PC + 40% GGBFS
2 2 2 2 2 2
Total = 84 * Source D represents aggregate source with highest strength potential ** Type and dosage of fly ash may vary based on standard practice at aggregate source
Each of the batches mixed during materials screening will undergo a battery of tests as
presented in Table E-7. These tests will characterize the relative mixture designs and enable the
research team to select final LWHPC mixtures to be used in structural testing.

E- 23
Table E-7. Tests for Material Screening
Test Method AASHTO (ASTM)
Reference
Age
7 days
28 days
56 days
90 days
Number of Samples Compressive Strength / Modulus of
Elasticity T 22 (C39/C469)
2 3 3 2
Modulus of Rupture T 97 (C78) - 3 - - Split Tensile Strength T 198 (C496) 2 3 3 2
Shrinkage T 160 (C157) 3 - - - Permeability / Absorption T 277 (C1202/C1585) - 2 2 -
Creep testing on each mix design from Table E-5 is not possible due to time and budget
constraints. However, a supplemental creep testing program will be conducted in order to
determine creep characteristics on a select number of lightweight concrete mix designs. The
creep testing will be conducted using three creep frames with a capacity to test nine cylinders per
cycle (hence three mix designs at a time). The testing for each cycle will be conducted for a
period of 90 to 180 days, until the creep response becomes stable. The priority for creep testing
will be on the high performance/high strength girder mixtures because these mix designs are
needed first for the lab cast specimens (SubTask 6.3). Creep testing of the moderate strength
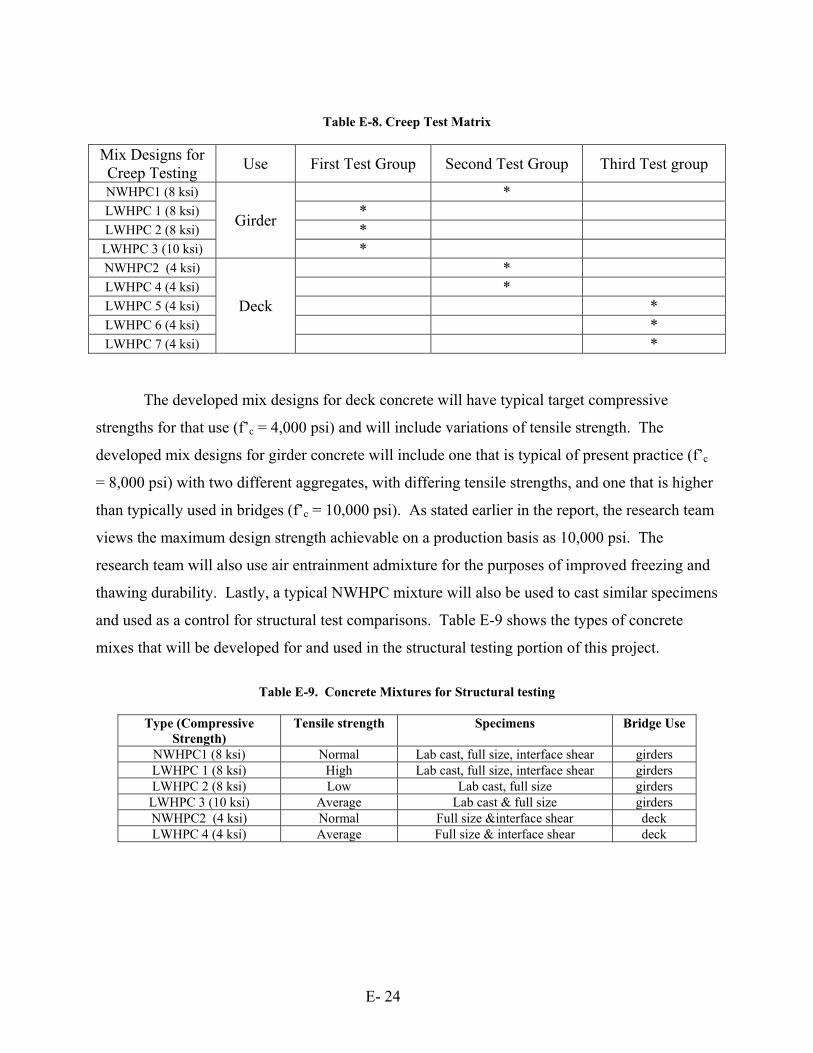
girder mixtures will follow, and then the deck mixtures later. Table E-8 presents the test matrix
for creep testing. Note that creep testing will be conducted on three lightweight concrete girder
concrete mix designs. It is anticipated that only two of the lightweight aggregate sources will
have aggregate properties adequate to produce lightweight concrete which can achieve these
strength levels. However, it is expected that several aggregate sources can be used to reach the
compressive strength needed for bridge decks (4 ksi). Assuming screening test results are
sufficient, four bridge deck mix designs will be used in the creep testing. Only one of the four
lightweight mix designs developed for use in decks will be utilized in the structural testing
portion of the Work Plan.
E- 24
Table E-8. Creep Test Matrix
Mix Designs for Creep Testing
Use First Test Group Second Test Group Third Test group
NWHPC1 (8 ksi)
Girder
* LWHPC 1 (8 ksi) * LWHPC 2 (8 ksi) * LWHPC 3 (10 ksi) * NWHPC2 (4 ksi)
Deck
* LWHPC 4 (4 ksi) * LWHPC 5 (4 ksi) * LWHPC 6 (4 ksi) * LWHPC 7 (4 ksi) *
The developed mix designs for deck concrete will have typical target compressive
strengths for that use (f’c = 4,000 psi) and will include variations of tensile strength. The
developed mix designs for girder concrete will include one that is typical of present practice (f’c
= 8,000 psi) with two different aggregates, with differing tensile strengths, and one that is higher
than typically used in bridges (f’c = 10,000 psi). As stated earlier in the report, the research team
views the maximum design strength achievable on a production basis as 10,000 psi. The
research team will also use air entrainment admixture for the purposes of improved freezing and
thawing durability. Lastly, a typical NWHPC mixture will also be used to cast similar specimens
and used as a control for structural test comparisons. Table E-9 shows the types of concrete
mixes that will be developed for and used in the structural testing portion of this project.
Table E-9. Concrete Mixtures for Structural testing
Type (Compressive
Strength) Tensile strength Specimens Bridge Use
NWHPC1 (8 ksi) Normal Lab cast, full size, interface shear girders LWHPC 1 (8 ksi) High Lab cast, full size, interface shear girders LWHPC 2 (8 ksi) Low Lab cast, full size girders LWHPC 3 (10 ksi) Average Lab cast & full size girders NWHPC2 (4 ksi) Normal Full size &interface shear deck LWHPC 4 (4 ksi) Average Full size & interface shear deck

E- 25
Subtask 6.2 Material Property Verification Testing
During casting of the structural specimens, the research team will obtain a number of
samples of the production concretes to complete a comprehensive battery of material tests. In
addition to the material properties assessed in the screening phase, tests will be performed to
characterize shrinkage performance of the mixtures, which may affect prestress losses, as well as
the bulk diffusion characteristics of the concrete, which influence durability. During fabrication
at the precast plant, specimens will be obtained that are the same mixture proportions as the
mixtures used in the laboratory. This will give an indication of the variability between the lab
and field mixtures. The test matrix is presented in Table E-10.
Table E-10. Battery of Material Tests for Full-scale Specimens (Number of Specimens)
Method AASHTO (ASTM) Reference
Age (days)
1 7 28 56 90
Compressive Strength / Modulus of Elasticity T 22 (C39/C469) - 2 3 3 2
Modulus of Rupture T 97 (C78) - 3
Split Tensile Strength T 198 (C496) - 2 3 3 2
Shrinkage T 160 (C157) 3 - - - -
Permeability / Absorption T 277 (C1202/C1585) - - 2 2 -
Bulk Diffusion None (C1556) - - 2 - -
Freeze-thaw T 161 (C666) - - 2 - -
Subtask 6.3 Lab Cast Beams
The test beams have been designed to optimize the data that can be collected from testing
these beams. Of particular interest will be data related to transfer length, development length,
flexural strength, prestress losses, allowable stresses, and initial and long term camber. In
addition, even though it is not within the scope of this portion of the project, some information
with regards to shear strength of LWHPC will be obtained. The cross sections for beams
containing ½ in. and 0.6 in. diameter strand are shown in Figure E-4. The beam cross section for
0.6 in. diameter strand is larger than the one for 0.5 in. diameter strand so that the state of stress
in the two cross sections due to prestressing will be similar. The mild steel reinforcement shown
in the cross section used with the 0.6 in. diameter is the same as what will be used in the
specimens containing 0.5 in. diameter strand.

E- 26
The capability exists within the Virginia Tech Structures and Materials Laboratory to cast
pretensioned, prestressed concrete beams. The prestressing buttresses can anchor up to nine 0.6-
in. diameter prestressing strands, and the buttresses can be set approximately 52 ft apart. With
two prestressing lines, this allows for the manufacture of four- 24 ft long beams at a time. The
lab cast beams will be made using this facility.
Since the lab cast beams are meant to be a smaller model of full size prestressed girders,
concrete mix designs for girder concrete will be used The mix design matrix is shown in Table 8
and the girder concrete mix designs are NWHPC1, LWHPC1, LWHPC2, and LWHPC3. These
mixes have either a 8,000 psi or 10,000 psi design compressive strength. Both 0.5 in. and 0.6 in.
diameter strands will be investigated. Due to the potentially lower tensile strength of lightweight
concrete the minimum spacing requirements for prestressing strand given in AASHTO may not
be applicable to lightweight concrete prestressed beams. On all of the lab cast beams the strands
will be placed at a 2 in. center-to-center spacing which is the typical spacing used in prestressed
girders.
Each beam will be instrumented with Demec gage points so that transfer length of the
strand can be measured. Transfer length will be determined by measuring concrete surface strain
in the end region of the members immediately after transfer. Also, every beam cast will be
equipped with vibrating wire gauges to measure changes in strain in the concrete over time.
Companion cylinders will be made and tested regularly to ensure that the concrete delivered
from the ready-mix plant is similar in quality and behavior to the test batches made during the
material properties characterization testing. Compressive strength, tensile strength, and modulus
of elasticity tests will be repeated. In addition, the NASP (National Association of Strand
Producers) test for documenting strand surface condition will be performed on samples of all
strand to insure that the strand is acceptable. Long term material properties (creep and
shrinkage) of the mixtures used in the structural testing will be investigated as well (as discussed
earlier). The lab cast beams will be allowed to sit undisturbed for at least three months. During
this time the internal strain gages will be monitored to collect data for the investigation of
prestress loss and camber growth.

E- 27
24"
19"
8"
3".25"2"
7"
2"
4.75"
8"
2"
4"
a) Cross Section for ½ in. Diameter Strand
30"
5"
24"
7 3/4"
2"
7"
2"
1 1/8"
5 longitudinal #4 bars equally spaced
#4 single leg stirrupsspaced 3 in. o.c. from 0 to 8 ft from end of beamspaced 6 in. o.c. in middle 8 ft of beam
8"
#3 bars spaced 16 in. o.c.
2" 2"
b) Cross Section for 0.6 in. Diameter Strand
Figure E-4. Lab Cast Beams
After the beams have been stored for a minimum of three months, flexural testing will
begin. The beams will be made long enough so that two tests per beam can be achieved. A
schematic of a typical test set-up is shown in Figure E-5. The primary test configuration will be
simply supported with a concentrated load applied at varying shear spans. The load point will be
adjusted to precipitate bond and flexural failures, and, therefore, iteratively determine
development length. The primary purpose for this testing is to determine development length of
the strand in lightweight concrete, however, these tests will also provide important information
about flexural strength and shear strength. The test matrix is shown in Table E-11.

E- 28
Figure E-5. Development Test Set-up
Table E-11. Proposed Test Matrix for Lab Cast Beams
Concrete Strength (ksi) and
Designation
Strand Size In.
Number of Beams
Measured Transfer Lengths
Flexural/Development Length Tests
8 – LWHPC 1 0.5 2 4 4 8 – LWHPC 2 0.5 2 4 4
10 – LWHPC 3 0.5 2 4 4 0.6 2 4 4
8 – NWHPC 1 0.5 2 4 4 0.6 2 4 4
Subtask 6.4 Full Scale Beams
A total of six full scale prestressed girders will be cast at a precasting plant in the region
and tested in the Virginia Teach Structures Laboratory. A steam cure will be used on these
girders during the first 24 hours of concrete maturity for increasing strength gain. Each will have
a composite reinforced concrete deck added before testing which will be cured using the
traditional moist curing regimen. Four of the girders will be 45 in. deep, 60 ft long. Three of
these beams will be fabricated with lightweight concrete (one with LWHPC1 and two with
LWHPC3, mix designs). One will be cast using normal weight concrete (f’c = 8 ksi) for
comparison purposes. Figure E-6 shows a cross section of the PCBT-45 girder. In addition, two
Applied Load
Strand Embedment Length

E- 29
AASHTO Type II girders will be fabricated with the LWHPC1 mix, and Figure 7 shows a cross
section of the AASHTO Type II. The strand pattern for the PCBT-45 and AASHTO Type II
beam is based on 44-ft wide bridge with girders spaced at 8 ft and spanning 100 ft. and 60 ft.,
respectively. In the precast yard these beams will be instrumented to measure transfer length and
internal strains and temperatures. Strain gages will be placed on selected shear stirrups. The
beams will be allowed to age for approximately three months while camber changes and strain
changes are monitored.
Then, the beams will be delivered to the Virginia Tech Structures and Materials Lab for
testing. At the lab, a cast-in-place/composite deck will be placed on each beam. In research
conducted at the University of Texas at Austin (Sylva, Breen, and Burns 2002) it was shown that
the combination of a normal weight concrete deck with a lightweight concrete girder is not as
structurally efficient as lightweight concrete used in both. Therefore, the deck will also be
lightweight concrete. Curing of the decks will be done following common industry practice.
The tests performed will investigate high shear and a combination of high moment and high
shear in the lightweight concrete girders. The girders will be long enough for two tests per beam
(one high shear and one high shear and moment).

E- 30
Figure E-6. Cross Section of PCBT-45 Girder
Figure E-7. AASHTO Type II girder with cast-in-place deck
6'-0"
PCBT-45
3'-9"
8"
AASHTO Type II
4'-6"
3'-0"
8"

E- 31
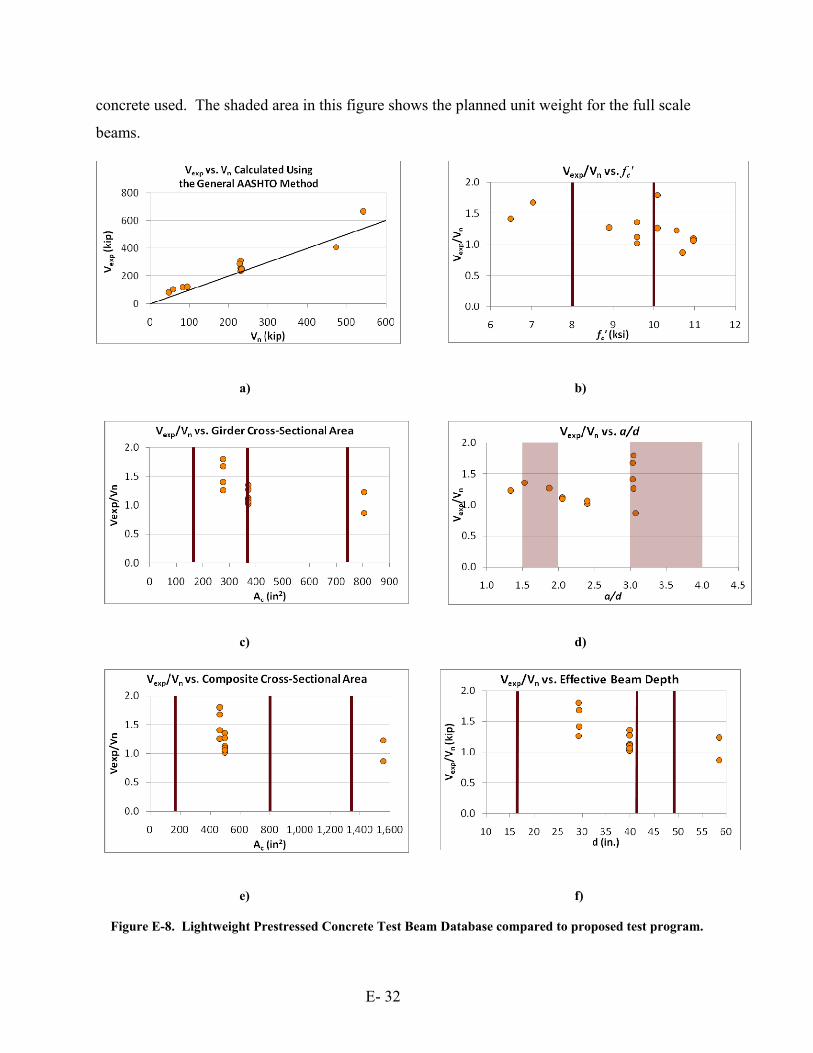
Background. Figures E-8 and E-9 show only the prestressed concrete beam test results. Figure 8
a) is a comparison of tested versus predicted strength for all of the results found. There were
twelve test results found for lightweight, prestressed members and only two of them were for
composite girders. It should be noted that most of the test results are far relatively small, non-
composite test specimens.
The analysis of the previously reported data indicates that the proposed testing program
should address several gaps in the data presented in Figures 5 and 6. Of most significance are
the three following parameters:
1. a/d ratio: Figure 5 d) shows a general lack of data at small a/d ratios and a concentration
of data at an a/d ration of 3.0. The girders to be tested will be loaded in such a fashion to
produce a/d ratios that fall within the two shaded areas in the figure. Specific loading
arrangements are shown later in Figure 7.
2. Cross-sectional area of composite girder: Figure 5 e) shows a concentration of test
results at a small composite girder area (about 450 in2) with two test results at a more
realistic area (about 1550 in2). The larger area is for a 53 inch deep prestressed girder
typical of the size used in 100 ft span bridges while the smaller area is below that
typically used in bridge design presently. It is proposed to test three different girder sizes
to fill out the gaps in this plot. The sizes are represented by the colored vertical lines in
the figure and are approximately 180 in2, 800 in2, and 1350 in2. These are the lab cast
girders, AASHTO Type II girder with added deck, and PCBT-45 with added deck.
3. Shear reinforcement ratio (ρv): Figure 6 b) shows a small amount of test results at small
amounts of shear reinforcement and a fair amount of data at typical amounts (0.5 ≤ ρv ≤
0.75. The plan for this testing program is to focus testing on the two areas in the figure
that are indicated (vertical bar near ρv of 0.1 and shaded area).
Figures 5 b), 5 c), and 5 d) also are provided to show where the planned tests fall in relation
to girder concrete compressive strength, girder cross sectional area, and effective girder depth,
respectively. The vertical bars on these three plots represent the planned test specimen.
In addition, Figure 6 a) shows the test results as a function of unit weight of the lightweight
E- 32
concrete used. The shaded area in this figure shows the planned unit weight for the full scale
beams.
a) b)
c) d)
e) f)
Figure E-8. Lightweight Prestressed Concrete Test Beam Database compared to proposed test program.

E- 33
a) b)
Figure E-9. Lightweight Prestressed Concrete Test Beam Database compared to proposed test program.
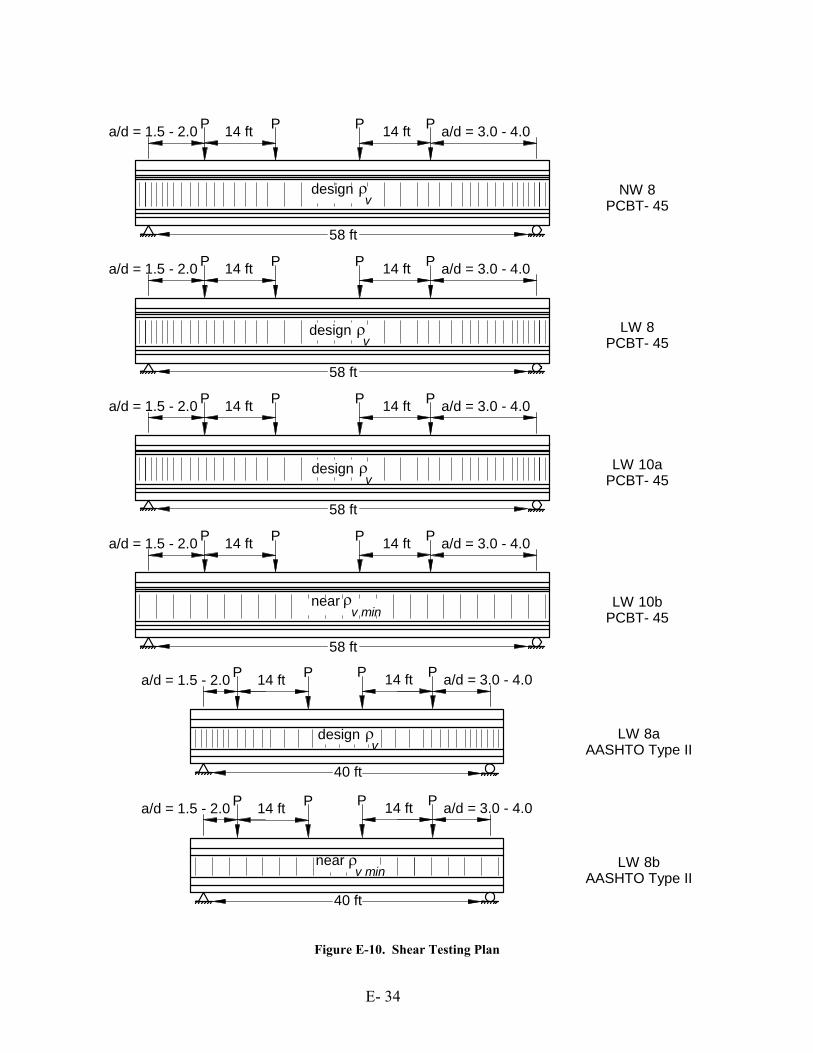
The final testing program is presented in Figure E-10. Beams NW8, LW8 and LW10a
will have identical prestressing layouts and shear reinforcing layouts. One end of the beam will
be tested with a short shear span and the other a longer shear span. A comparison of the results
of these tests will provide information on the differences in concrete contribution to shear
strength between lightweight and normal weight concrete.
Specimen LW10b will have the AASHTO specified minimum shear reinforcement.
Questions have been raised in the past about the safety of beams designed with this small amount
of reinforcement. Results from these tests will help determine if the specified minimum shear
reinforcement is appropriate for beams with lightweight concrete.
Specimens LW8a and LW8b are both AASHTO Type II beams with a composite
lightweight concrete deck. LW8a will have a typical amount of shear reinforcement and LW8b
will have the AASHTO minimum amount of shear reinforcement. These tests will provide
information similar to that gained with the PCBT-45 test beams, but the data will fill different
gaps in the current data base.
E- 34
a/d = 1.5 - 2.0 P P14 ft a/d = 3.0 - 4.0PP 14 ft
58 ft
a/d = 1.5 - 2.0 P P14 ft a/d = 3.0 - 4.0PP 14 ft
58 ft
a/d = 1.5 - 2.0 P P14 ft a/d = 3.0 - 4.0PP 14 ft
58 ft
a/d = 1.5 - 2.0 P P14 ft a/d = 3.0 - 4.0PP 14 ft
58 ft
NW 8PCBT- 45
LW 8PCBT- 45
LW 10aPCBT- 45
LW 10bPCBT- 45
LW 8aAASHTO Type II
v minnear
40 ft
a/d = 1.5 - 2.0 P P14 ft a/d = 3.0 - 4.0PP 14 ft
LW 8bAASHTO Type II
40 ft
a/d = 1.5 - 2.0 P P14 ft a/d = 3.0 - 4.0PP 14 ft
v minnear
vdesign
vdesign
vdesign
vdesign
Figure E-10. Shear Testing Plan

E- 35
In NCHRP Report 579, Kuchma and Hawkins presented a method to separate the
contributions of concrete and steel to shear strength. The method required that a large number of
strain gages be placed on the shear reinforcing. After completion of a test, the failure crack was
determined, and the strain gages in closest proximity were identified. Interpolation was used to
approximate the strains in stirrups which had not been gaged. Interpolation was also used when
the failure crack passed between gage locations on a stirrup. A free body diagram between the
end of the beam and the critical crack was drawn. At each load step, the applied shear was
known and the total force in the stirrups crossing the crack was estimated. The concrete
contribution to strength could then be calculated.
This method will be used with the results from the tests performed in this research
program. It is critical to determine if only the Vc component of strength is different between
normal weight and lightweight concrete, or if the Vs term is also different. If the angle of the
crack varies with unit weight, then both Vc and Vs will vary. The comparison of the results of
tests on specimens NW8, LW8 and LW10a will help to clarify these areas of uncertainty.
Preliminary designs of the tests beams have shown that the lightweight reduction factor
(λ) has only a small influence on the overall calculated strength of the beam. This was also
shown in analysis of Dymond’s test results (Dymond 2007), which indicated that using the
AASHTO Sectional Model with λ the predicted shear strength of the first test was 600 kips,
while the prediction without λ was 620 kips. The shear at failure was 660 kips. It is extremely
difficult to conclude if the λ factor is or is not appropriate because the difference in calculated
strength is so small compared to the total failure load. Using the method presented by Kuchma
and Hawkins should help somewhat to isolate Vc so better conclusions can be drawn about the λ
factor.
Subtask 6.5 Interface Shear Transfer
The AASHTO LRFD formulation to calculate nominal shear resistance of the interface plane
between a precast girder and a cast-in-place deck is as follows:
cyvfcvni PfAcAV (1)
E- 36
The term “c” represents the cohesion between the two concretes at the interface. The
cohesion term is 0.24 ksi for lightweight concrete placed monolithically, or non-monolithically,
against a clean concrete surface, free of laitance with surface intentionally roughened to an
amplitude of 0.25 in. The term “” represents the friction coefficient along the crack. This term
is 1.0 for the previously outlined conditions. In the commentary to this section in the LRFD
Specifications, it is stated that there is a paucity of data on non-monolithic lightweight concrete,
so the coefficients that were derived from monolithic tests are used. As with vertical shear, the
strength reduction factor for interface shear for lightweight concrete is smaller than for normal
weight concrete (φ = 0.7 for lightweight concrete and φ =0.9 for normal weight).
The specification also stipulates that the nominal shear resistance used in design shall not
be greater than the lesser of:
cvc1ni A'fKV or
cv2ni AKV
For lightweight concrete K1 = 0.25 and K2 = 1.5 ksi.
Also: Avf = area of reinforcement crossing interface,
Acv = area of interface,
fy = yield stress of reinforcement,
Pc = permanent net compressive force normal to the shear plane.
f’c = specified 28-day compressive strength of the weaker concrete on either side of the
interface
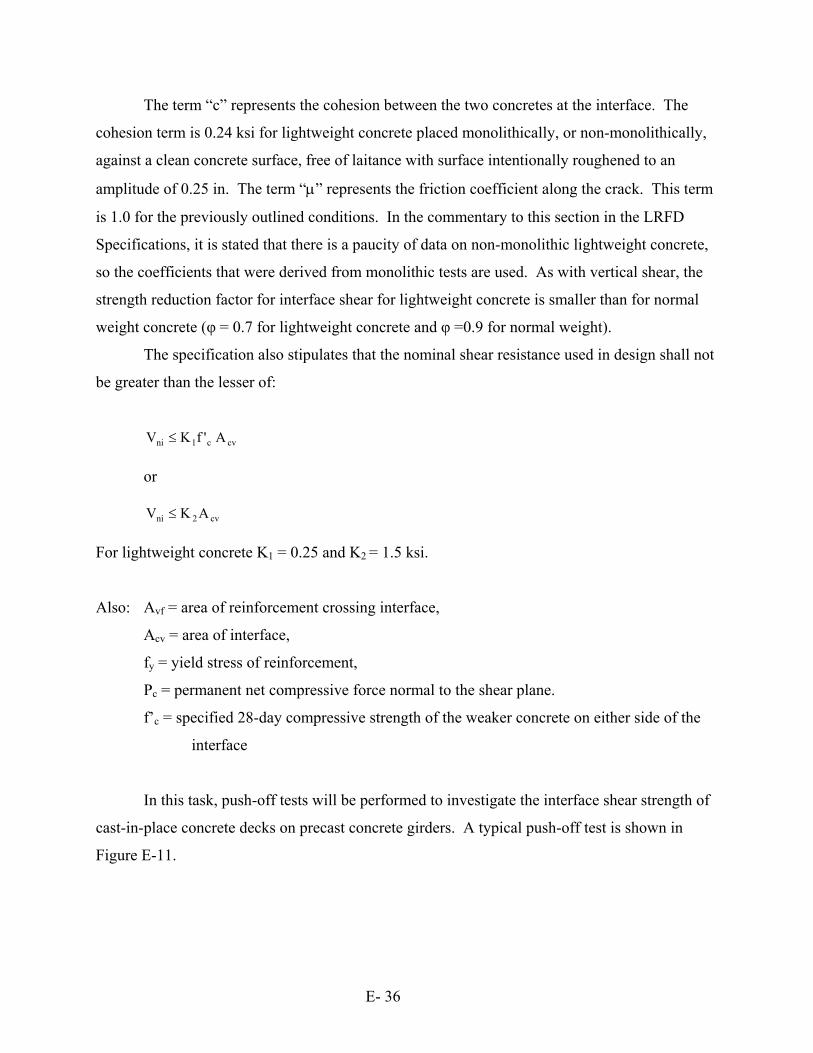
In this task, push-off tests will be performed to investigate the interface shear strength of
cast-in-place concrete decks on precast concrete girders. A typical push-off test is shown in
Figure E-11.

E- 37
Slab Side
Beam Side
Horizontal Shear Connectors
Figure E-11. Typical Push-off Test Specimen
Four different configurations of slab and girder concrete will be investigated. The four
combinations are as follows:
1. Normal weight beam with normal weight deck,
2. Normal weight beam with lightweight deck,
3. Lightweight beam with normal weight deck,
4. Lightweight beam with light weight deck.
For each combination of deck and girder concrete, four different levels of horizontal shear
reinforcement will be tested. The four levels will be:
1. No horizontal shear reinforcement,
2. Minimum horizontal shear reinforcement (approximately 1 ea. #4 stirrup (two legs across
interface) on a 16 in. by 24 in. interface),
3. Maximum horizontal shear reinforcement (approximately 5 ea. #6 stirrups (10 legs) on a
16 in. by 24 in. interface),
4. Somewhere between minimum and maximum shear reinforcement (approximately 3 ea.
#5 stirrups (six legs) on a 16 in. by 24 in. interface.)

E- 38
For each configuration, three repetitions will be performed. This will provide an indication of
the variability of the interface shear strength for normal weight and lightweight concretes. A test
matrix is presented in Table E-12.
Table E-12. Test Matrix for Interface Shear
Girder Concrete Deck Concrete ρiv = Avf/Acv Number of
Repetitions
Normal Weight 8000 psi
NWHPC1
Normal Weight 4000 psi
NWHPC2
0.0 3 0.001 3 0.005 3 0.012 3
Lightweight 4000 psi
LWHPC5
0.0 3 0.001 3 0.005 3 0.012 3
Lightweight 8000 psi
LWHPC1
Lightweight 4000 psi
LWHPC5
0.0 3 0.001 3 0.005 3 0.012 3
Total Tests 36 The top of the beam specimens will be roughened according to typical practice, with an
amplitude of 0.25 in.
Subtask 6.6 Recommend changes to AASHTO Bridge Specifications The research team will review both AASHTO (4th edition) and AASHTOC (1998) to determine
the articles that specifically address lightweight concrete. Articles that don’t currently address
lightweight concrete, but possibly should, will be identified as well. Recommendations for
modifications to both specifications will be made at the conclusion of this project.
Task 6 – Experimental Investigation and Analysis
Scope Execute the plan approved in Task 5. Based on the results of this work, recommend changes to
AASHTO LRFD Bridge Design and Construction Specifications to include provisions relevant
to the use of lightweight concrete in prestressed concrete girders and in bridge decks. The
recommended changes shall be prepared in a format suitable for consideration and adoption by

E- 39
AASHTO. Also, develop guide specifications for the use of lightweight concrete in bridge
girders and decks.
After review of the interim report by NCHRP, the details to be evaluated and the work
plan will be finalized, the testing will then commence. Work on Phase II (Tasks 6, 7 and 8) will
not commence until all the Tasks in Phase I have been completed and the work plan is approved.
TASK 7 – Comparative Deck and Girder Designs
Scope
Using the changes recommended in Task 6, develop comparative girder and deck
designs with normal and lightweight concrete for selected conditions (e.g., foundation, span).
Estimate relative costs. Identify the differences and the conditions that are likely to warrant use
of lightweight concrete.
The goal of the comparisons will be to identify the conditions that are likely to warrant
the use of lightweight concrete. This will be tied directly to the economic advantages that might
be gained by fewer strands, wider girder spacings or longer span lengths that can be achieved
with lightweight concrete.
Previous studies by Sylva, Breen and Burns (2002) and by Castrodale and Harmon
(2006) have evaluated the advantages of lightweight concrete in bridge girders and decks
through comparative designs. The results of these studies will be compared against the new
comparative designs as final conclusions are drawn.
Girder Types
Longer span bridges are more likely to benefit from the reduced dead loads afforded by
lightweight concrete than shorter span bridges. This is due to the higher percentage of dead load
compared to total load in long span concrete bridges. Therefore, the focus of the comparative
deck designs will be on medium to long span precast I-girder bridges. The comparative designs
will be performed on the following girder types:
Medium span – 90-110 ft, PCI-AASHTO BT-63
Long span – 120-140 ft, VDOT-PCBT-85

E- 40
All example problems will be performed for simple span configurations and for typical interior
girders.
Combinations of Deck and Girder Concrete
For each type of girder four combinations of concrete types in the girder and in the deck will be
investigated as follows:
Normal weight girder, normal weight deck
Normal weight girder, lightweight deck
Lightweight girder, normal weight deck
Lightweight girder, lightweight deck
Possible Comparative Studies
The benefits from the use of lightweight concrete may be realized in various ways, such as wider
girder spacings for a given beam size and span length or longer span lengths for a given beam
size and girder spacing. The economic impact will then be due to fewer required beams on a
project or fewer bents. There is an overall economic benefit if these cost savings are greater than
the premium paid for lightweight concrete. To investigate these possible benefits a variety of
comparative designs will be performed in which some parameters are held constant and other
parameters are maximized or minimized. Table E-13 presents the types of comparative studies
to be performed in this task.
Reporting of Results
The final report will include one full design example of a lightweight concrete deck on
lightweight prestressed I-girders. The example will highlight the differences between design
with lightweight and normal weight concrete. The example will also reflect any changes to the
LRFD Specifications recommended by the research team following the physical tests and
evaluation of the results.

E- 41
The results of the other comparative designs will be presented in a graphical or tabular format to
best illustrate the differences in the outcomes of the designs with the various combinations of
deck and girder concrete.
Table E-13. Comparative Deck and Girder Designs
Given Parameters Results to Compare
Span Length Girder Spacing Release Concrete Strength 28 day Concrete Strength
Number of Strands Required Shear Reinforcing Deflections
Span Length Girder Spacing
Lowest Feasible Release and 28 Day Concrete Strengths
Corresponding Number of Strands Required Shear Reinforcing Deflections
Span Length Release Concrete Strength 28 Day Concrete Strength
Maximum Feasible Girder Spacing Corresponding Number of Strands Required Shear Reinforcing Deflections
Girder Spacing Release Concrete Strength 28 Day Concrete Strength
Maximum Feasible Span Length Corresponding Number of Strands Required Shear Reinforcing Deflections
Task 8 –Final Report Scope
Submit a final report that documents the entire research effort. The report shall include
an implementation plan for moving the results of this research into practice.
Based on all work performed a final report will be written and submitted. The
specifications and example problems will be included as appendices to the report. A separate
appendix will include all recommended specification and commentary changes.


