ATTACHMENT 3. TEST PIT FIELD FORMS - doee.dc.gov · Site Investigation Report Kingman Island,...
143
Site Investigation Report Kingman Island, Washington, DC ATTACHMENT 3. TEST PIT FIELD FORMS
Transcript of ATTACHMENT 3. TEST PIT FIELD FORMS - doee.dc.gov · Site Investigation Report Kingman Island,...

Site Investigation Report Kingman Island, Washington, DC
ATTACHMENT 3. TEST PIT FIELD FORMS

Project Number: 103S3636.014.03
Tetra Tech Personnel : Ryan Murley
Pit Boundaries (Nothing, Easting)
Corner 1
Corner 3
Corner 2
Corner 4
Pit Dimensions:
Test Pit ID: TP-1Kingman Island Investigation
Date: November 10, 2015
Test Pit Composite ID: Soil Pile-1
X: 1322595.989
Y: 447339.42
X: 1322590.471
Y: 447308.6907
X: 1322600.941
Y: 447336.7007
Y: 447311.3677
X: 1322578.938
Length (ft): 18
Width (ft): 10
Depth (ft): 12

Excavation Descriptions
Same soil with plastic trash at 1 foot bgs brick and concrete noted at approximately 6 feet bgs. Same material as the west wall.
No clear interface between pile material and dredge material here but trash and concrete appear mostly above 7 feet in depth.
End of test pit at 12 feet in depth.Odor: —
PID: 0.0
Odor: None
Odor: None
Odor: None
Odor: None
PID: 0.0
PID: 0.0
PID: 0.0
PID: 0.0
Sample collected
Sample collected
Sample collected
Debris observed
Debris observed
Sample collected
Debris observed
Debris observed
Sample collected
Primarily medium brown silty sand with large well rounded gravel. Steel rebar noted on northern wall at 1 foot in depth. Additional rebar noted at 7 feet in depth.
Debris observed
Concrete and rebar noted at 5 feet bgs. Plywood material at 6 feet bgs. No odor or staining. Sheet metal observed at 2 to 3 feet bgs.

Photo 1: Overall view of Test Pit 1.
Photo 2: Metal debris within two feet of surface.
Photo 3: Northwestern wall.
Photo 4: Rebar noted at two feet and seven feet in depth.

Photo 5: Eastern wall.
Photo 6: Typical material encountered.

Project Number: 103S3636.014.03
Tetra Tech Personnel : Ryan Murley
Pit Boundaries (Nothing, Easting)
Corner 1
Corner 3
Corner 2
Corner 4
Pit Dimensions:
Test Pit ID: TP-2Kingman Island Investigation
Date: November 10, 2015
Test Pit Composite ID: Soil Pile-1
X: 1322545.202
Y: 447208.5722
X: 1322572.009
Y: 447224.8385
X: 1322544.877
Y: 447221.7863
Y: 447203.9844
X: 1322571.176
Length (ft): 20
Width (ft): 14
Depth (ft): 14

Excavation Descriptions
Similar material as above, with increasing wood and concrete debris beginning at 4 feet in depth. Corrugated metal debris noted at approximately 8 feet.
End of test pit at 14 feet in depth.
Odor: —
PID:
Odor: —
Odor: None
Odor: None
Odor: Petrochemical
PID: 3.7
PID: 0.1
PID: 0.0
PID: 0.0
Sample collected
Sample collected
Sample collected
Debris observed
Debris observed
Sample collected
Debris observed
Debris observed
Sample collected
East wall consists of medium brown silly clay with well rounded cobbles and some large boulders. Asphalt pieces at 3 to 5 feet. Concrete and rebar noted from 5 to 10 feet.
Debris observed
Bottom of the pit at approximately 14 feet showed signs of dark staining. Material consisted of light grey silty clay with slight petrochemical odor and slight PID reading.

Photo 1: Eastern wall.
Photo 2: Corrugated metal debris at 8 feet in depth.

Photo 3: Excavated material has wood, asphalt, and concrete.
Photo 4: Grey staining begins at 10 feet and down to 14 feet.

Photo 5: West wall showing asphalt and concrete beginning at 10 feet.
Photo 6: South wall of test pit.

Project Number: 103S3636.014.03
Tetra Tech Personnel : Ryan Murley
Pit Boundaries (Nothing, Easting)
Corner 1
Corner 3
Corner 2
Corner 4
Pit Dimensions:
Test Pit ID: TP-3Kingman Island Investigation
Date: November 10, 2015
Test Pit Composite ID: Soil Pile-1
X: 1322697.758
Y: 447191.6366
X: 1322708.319
Y: 447216.3958
X: 1322693.63
Y: 447203.7408
Y: 447205.3645
X: 1322716.924
Length (ft): 15
Width (ft): 10
Depth (ft): 14

Excavation Descriptions
Below 4 feet consists of medium grey clayey gravel quickly trending to a grey gravelly sand.
At approximately 7 to 8 feet in depth a petrochemical odor was noticed in the breathing zone nearby the pit. Work stopped while air monitoring took place but no source could be identified other than the pit itself. Test pitting resumed once odor cleared.
End of test pit at 14 feet in depth.Odor: —
PID: 0.0
Odor: Petrochemical
Odor: None
Odor: None
Odor: Petrochemical
PID: 0.0
PID: 0.0
PID: 0.0
PID: 0.0
Sample collected
Sample collected
Sample collected
Debris observed
Debris observed
Sample collected
Debris observed
Debris observed
Sample collected
Surface to 3 feet consists of medium brown silty clay with well rounded cobbles. Debris including concrete pieces, brick, wood, and asphalt noted beginning at 3 feet in depth.
Debris observed
Grey gravelly material contains approximately 10 percent concrete, asphalt, and smaller amounts (2 percent) of glass, metal, ceramic tile, and terra cotta pieces down to the bottom of the pit at 14 feet.

Photo 1: Debris noted beginning at about 5 feet.
Photo 2: Dark staining noted at about 5 feet in depth.
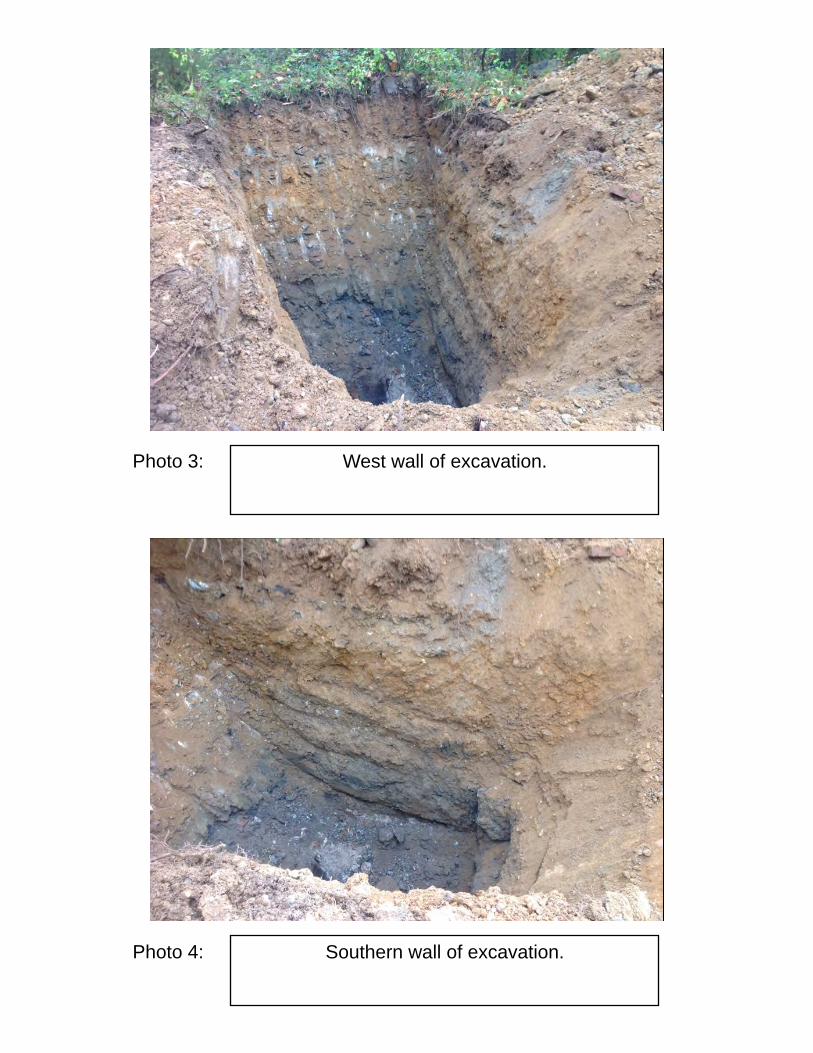
Photo 3: West wall of excavation.
Photo 4: Southern wall of excavation.

Photo 5: Western wall and bottom of pit.
Photo 6: Debris removed from pit.

Project Number: 103S3636.014.03
Tetra Tech Personnel : Ryan Murley
Pit Boundaries (Nothing, Easting)
Corner 1
Corner 3
Corner 2
Corner 4
Pit Dimensions:
Test Pit ID: TP-4Kingman Island Investigation
Date: November 10, 2015
Test Pit Composite ID: Soil Pile-1
X: 1322794.746
Y: 447125.7587
X: 1322818.983
Y: 447134.4377
X: 1322808.983
Y: 447119.2753
Y: 447139.9285
X: 1322795.644
Length (ft): 18
Width (ft): 10
Depth (ft): 13

Excavation Descriptions
The material from 2 to 4 feet consist of medium grey gravelly silt with little debris.
A significant glass layer at 10 feet. Mostly glass with metal debris including what appears to be a car battery at this depth.
Water flowing into excavation below 10 feet. Material removed below glass layer has petrochemical odor and slight staining. Consists of light to medium grey silty clay with well rounded cobbles and brick. End of test pit at 13 feet in depth.
Odor: Petrochemical
PID: 0.0
Odor: Petrochemical
Odor: None
Odor: None
Odor: Petrochemical
PID: 0.0
PID: 0.0
PID: 0.1
PID: 0.1
Sample collected
Sample collected
Sample collected
Debris observed
Debris observed
Sample collected
Debris observed
Debris observed
Sample collected
Top 2 feet consist of black to dark grey silty material with large amounts of brick, terra cotta, and concrete debris.
Debris observed
4 feet and deeper back into debris that includes asphalt, textiles, styrofoam, and plastic down to approximately 10 feet.

Photo 1: Concrete brick and asphalt throughout.
Photo 2: Southeastern wall of test pit at 10 feet.

Photo 3: Eastern wall of test pit.
Photo 4: Northeastern wall of test pit.

Photo 5: Water flowing into excavation below 10 feet.
Photo 6: West wall of test pit.
Project Number: 103S3636.014.03
Tetra Tech Personnel : Ryan Murley
Pit Boundaries (Nothing, Easting)
Corner 1
Corner 3
Corner 2
Corner 4
Pit Dimensions:
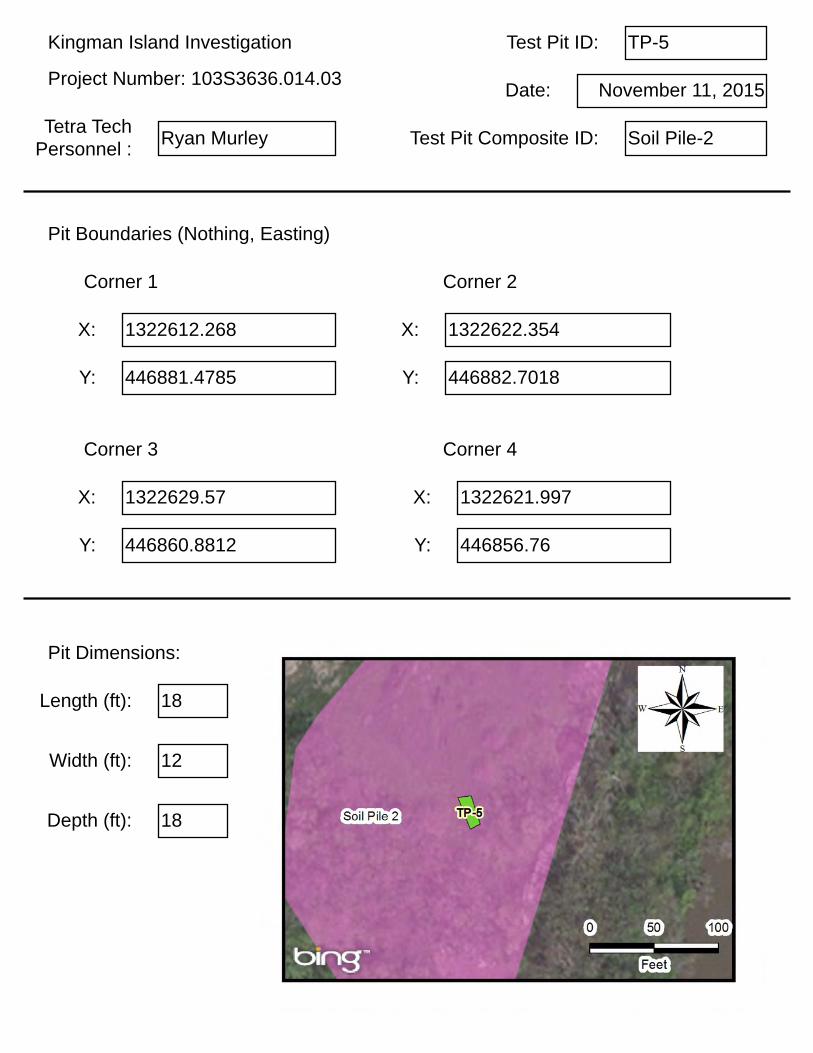
Test Pit ID: TP-5Kingman Island Investigation
Date: November 11, 2015
Test Pit Composite ID: Soil Pile-2
X: 1322612.268
Y: 446881.4785
X: 1322629.57
Y: 446860.8812
X: 1322622.354
Y: 446882.7018
Y: 446856.76
X: 1322621.997
Length (ft): 18
Width (ft): 12
Depth (ft): 18

Excavation Descriptions
Wet leafy layer from 6 to 8 feet back into dryer compost and trash below 8 feet.
Below 12 feet in depth is a light to medium brown silty clay with well rounded gravel. Contains less plastic trash but we did observed one large piece of concrete with rebar. Same down to 18 feet.
End of test pit at 18 feet in depth.Odor: —
PID: 0.0
Odor: Petrochemical
Odor: Biological
Odor: Biological
Odor: Petrochemical
PID: 0.9
PID: 0.0
PID: 0.3
PID: 0.3
Sample collected
Sample collected
Sample collected
Debris observed
Debris observed
Sample collected
Debris observed
Debris observed
Sample collected
Top 6 feet of material consists of compost type material with large amounts of household rubbish and plastic debris.
Debris observed
From 8 to 12 feet the material is similar to the top 6 feet with larger pieces of debris. Debris consists of tires, concrete, and wood. Slight petrochemical odor in this layer.

Photo 1: North wall.
Photo 2: West wall.

Photo 3: South wall.
Photo 4: East wall.
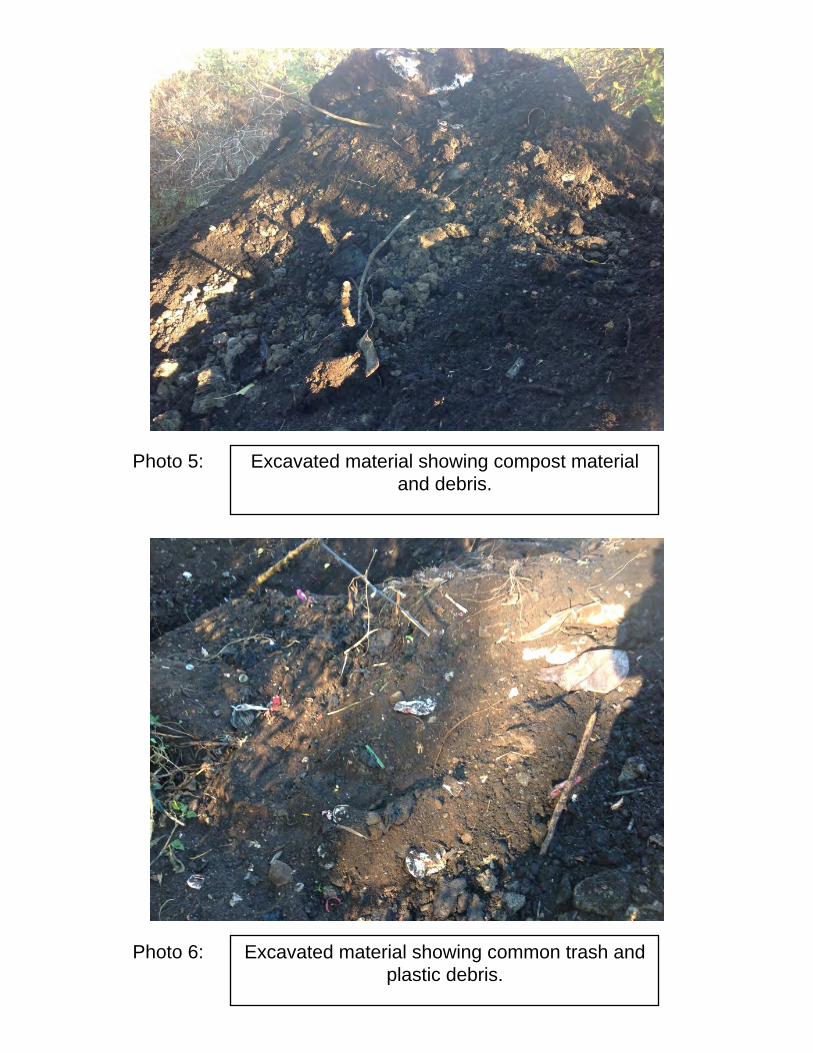
Photo 5: Excavated material showing compost material and debris.
Photo 6: Excavated material showing common trash and plastic debris.
Project Number: 103S3636.014.03
Tetra Tech Personnel : Ryan Murley
Pit Boundaries (Nothing, Easting)
Corner 1
Corner 3
Corner 2
Corner 4
Pit Dimensions:
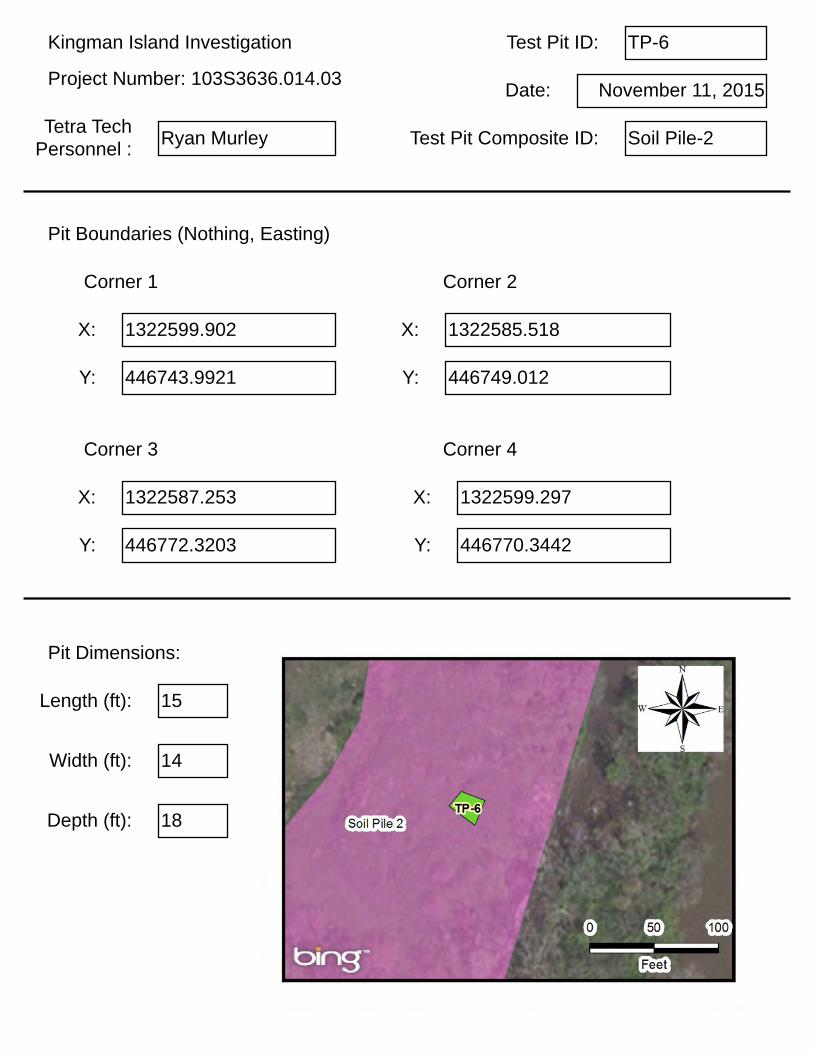
Test Pit ID: TP-6Kingman Island Investigation
Date: November 11, 2015
Test Pit Composite ID: Soil Pile-2
X: 1322599.902
Y: 446743.9921
X: 1322587.253
Y: 446772.3203
X: 1322585.518
Y: 446749.012
Y: 446770.3442
X: 1322599.297
Length (ft): 15
Width (ft): 14
Depth (ft): 18
Excavation Descriptions
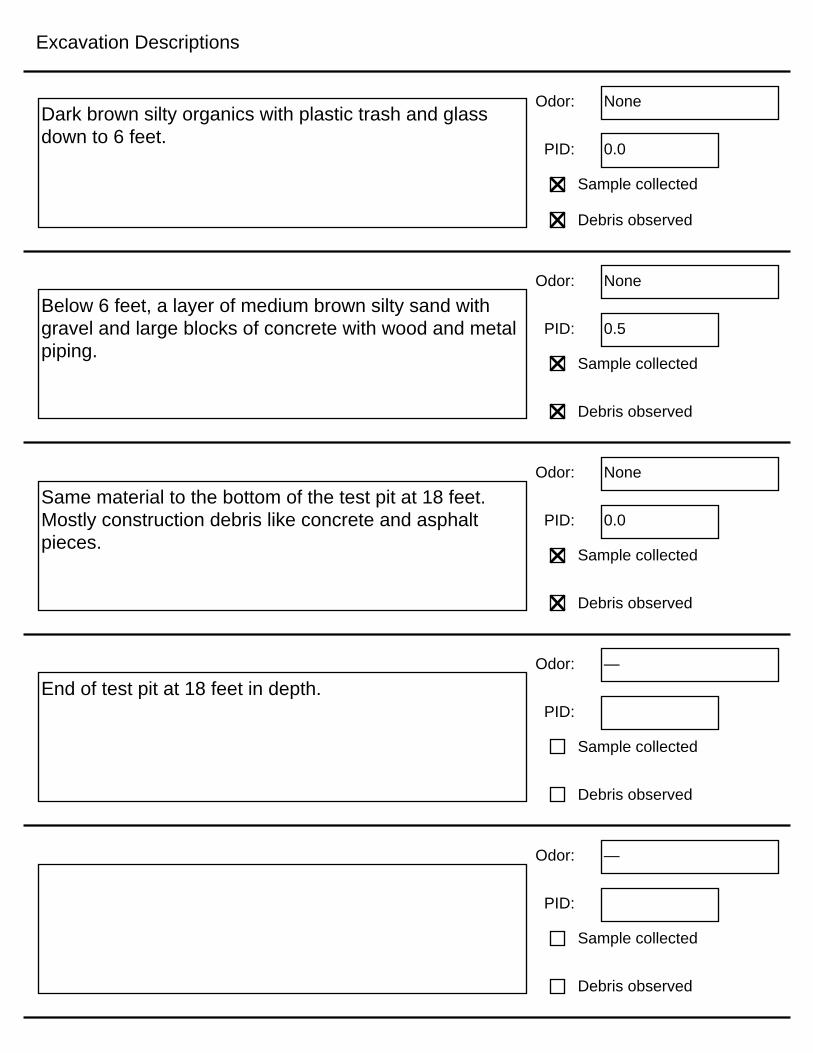
Below 6 feet, a layer of medium brown silty sand with gravel and large blocks of concrete with wood and metal piping.
End of test pit at 18 feet in depth.
Odor: —
PID:
Odor: —
Odor: None
Odor: None
Odor: None
PID: 0.0
PID: 0.5
PID:
PID: 0.0
Sample collected
Sample collected
Sample collected
Debris observed
Debris observed
Sample collected
Debris observed
Debris observed
Sample collected
Dark brown silty organics with plastic trash and glass down to 6 feet.
Debris observed
Same material to the bottom of the test pit at 18 feet. Mostly construction debris like concrete and asphalt pieces.

Photo 1: Test pit being excavated.
Photo 2: North wall showing organics interface with construction debris.

Photo 3: Bottom of excavation.
Photo 4: South wall.

Photo 5: Excavated material consists of construction debris mixed with organic soil.
Photo 6: North wall.

Project Number: 103S3636.014.03
Tetra Tech Personnel : Ryan Murley
Pit Boundaries (Nothing, Easting)
Corner 1
Corner 3
Corner 2
Corner 4
Pit Dimensions:
Test Pit ID: TP-7Kingman Island Investigation
Date: November 11, 2015
Test Pit Composite ID: Soil Pile-2
X: 1322645.089
Y: 446978.6831
X: 1322673.295
Y: 446982.7492
X: 1322654.867
Y: 446989.9269
Y: 446963.3775
X: 1322665.606
Length (ft): 16
Width (ft): 10
Depth (ft): 25
Excavation Descriptions
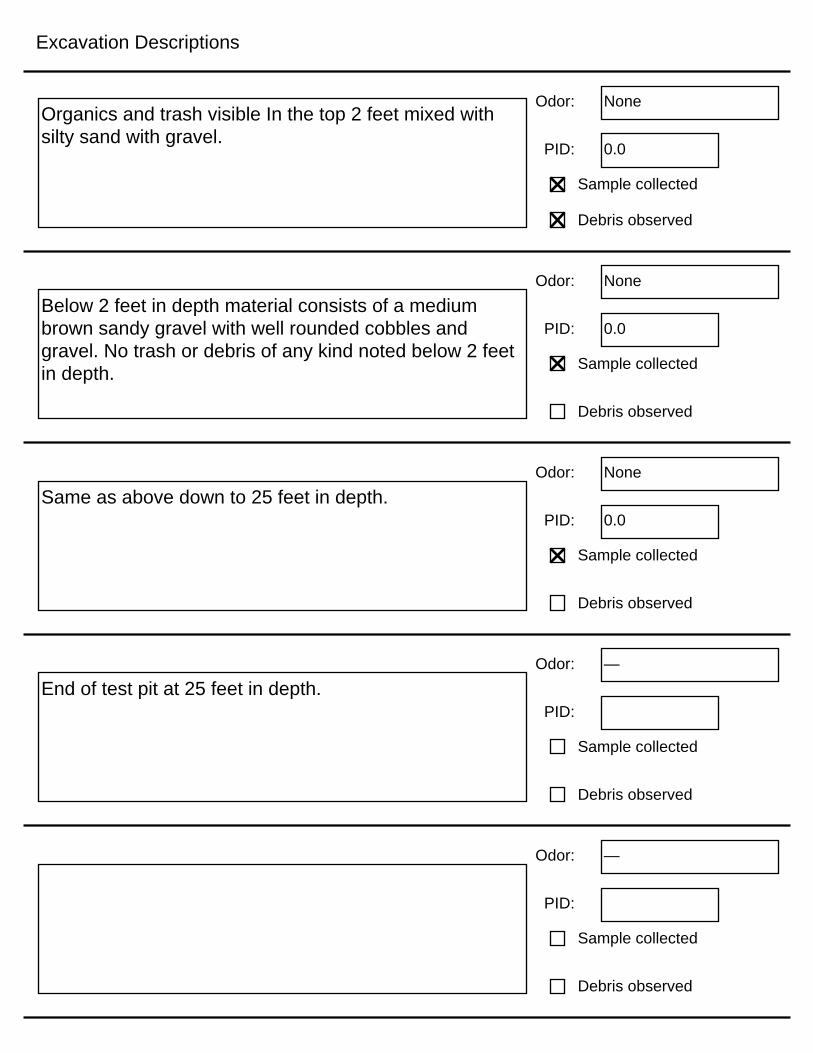
Below 2 feet in depth material consists of a medium brown sandy gravel with well rounded cobbles and gravel. No trash or debris of any kind noted below 2 feet in depth.
End of test pit at 25 feet in depth.
Odor: —
PID:
Odor: —
Odor: None
Odor: None
Odor: None
PID: 0.0
PID: 0.0
PID:
PID: 0.0
Sample collected
Sample collected
Sample collected
Debris observed
Debris observed
Sample collected
Debris observed
Debris observed
Sample collected
Organics and trash visible In the top 2 feet mixed with silty sand with gravel.
Debris observed
Same as above down to 25 feet in depth.

Photo 1: West wall.
Photo 2: North wall.
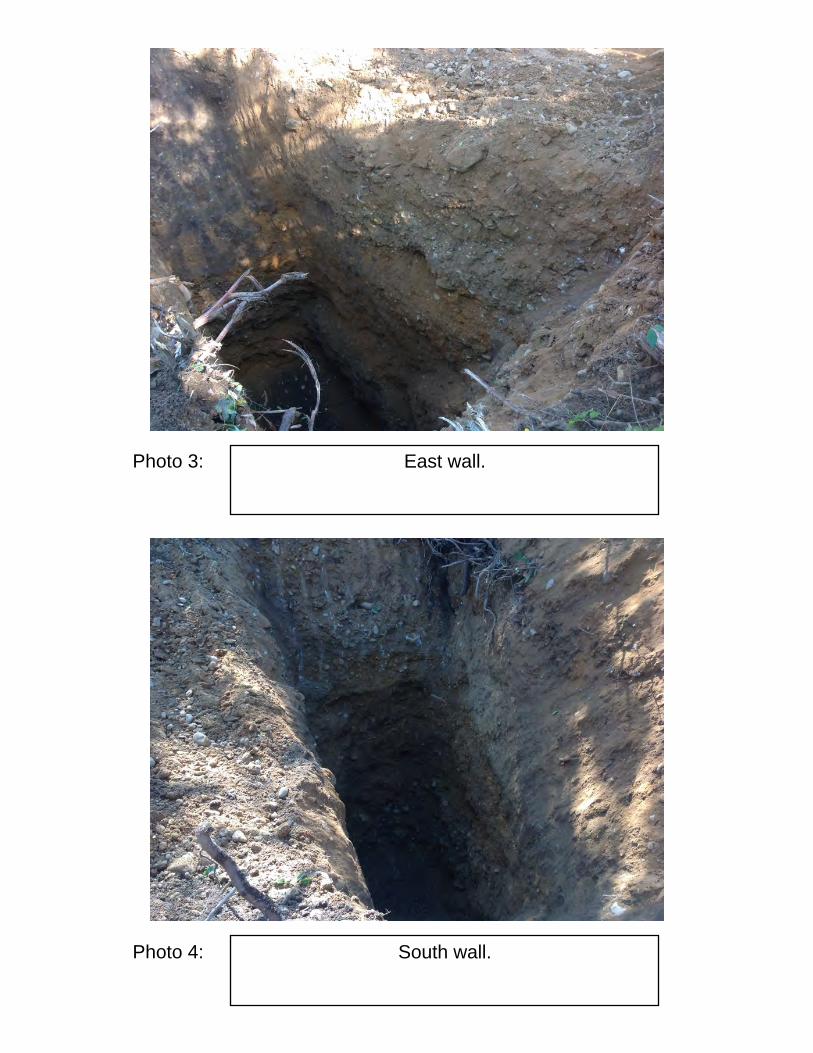
Photo 3: East wall.
Photo 4: South wall.
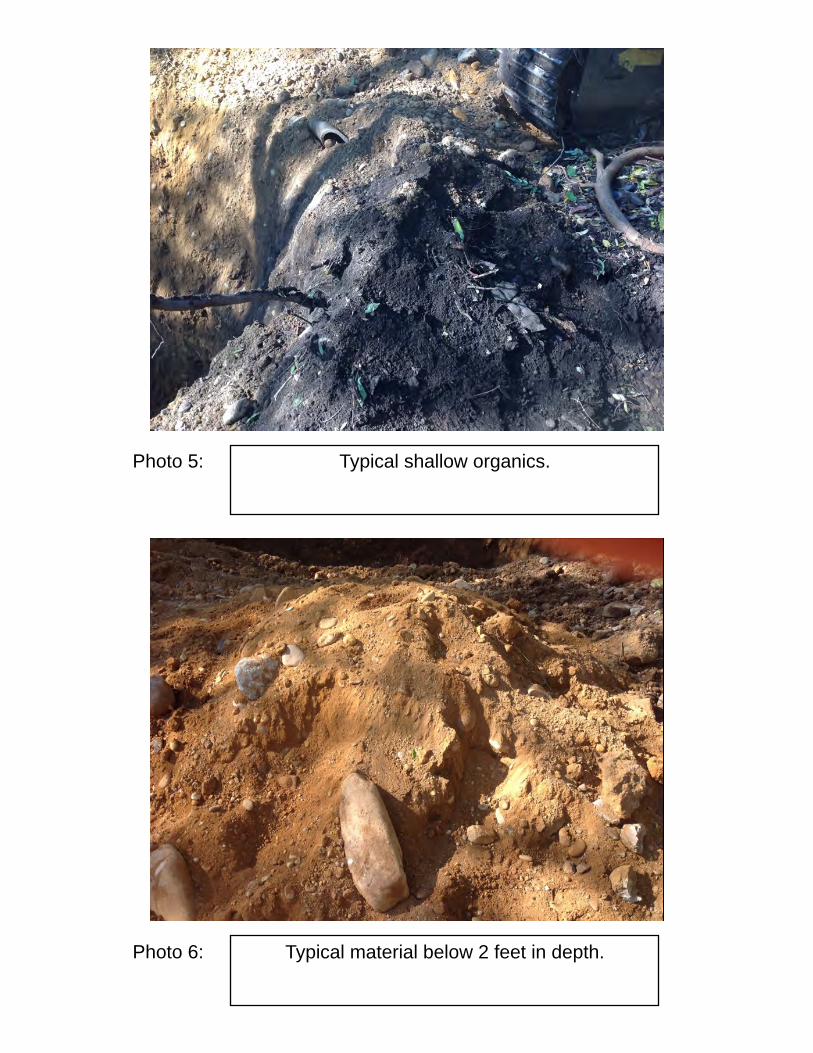
Photo 5: Typical shallow organics.
Photo 6: Typical material below 2 feet in depth.

Project Number: 103S3636.014.03
Tetra Tech Personnel : Ryan Murley
Pit Boundaries (Nothing, Easting)
Corner 1
Corner 3
Corner 2
Corner 4
Pit Dimensions:
Test Pit ID: TP-8Kingman Island Investigation
Date: November 11, 2015
Test Pit Composite ID: Soil Pile-2
X: 1322752.082
Y: 446917.1613
X: 1322778.098
Y: 446899.7328
X: 1322752.655
Y: 446903.5968
Y: 446916.418
X: 1322777.295
Length (ft): 20
Width (ft): 12
Depth (ft): 10

Excavation Descriptions
Below 2 feet the material consists of medium brown silty sand with well rounded gravel and cobbles. With less debris (10 percent) including asphalt, concrete, and a tire.
Odor: —
PID:
Odor: —
Odor: None
Odor: None
Odor: —
PID:
PID: 0.0
PID:
PID: 0.2
Sample collected
Sample collected
Sample collected
Debris observed
Debris observed
Sample collected
Debris observed
Debris observed
Sample collected
Top 2 feet of material contains a variety of debris including a 55 gallon drum, brick, and styrofoam. No odor or staining was noted adjacent to the 55 gallon drum when excavated
Debris observed
End of test pit at 10 feet in depth.
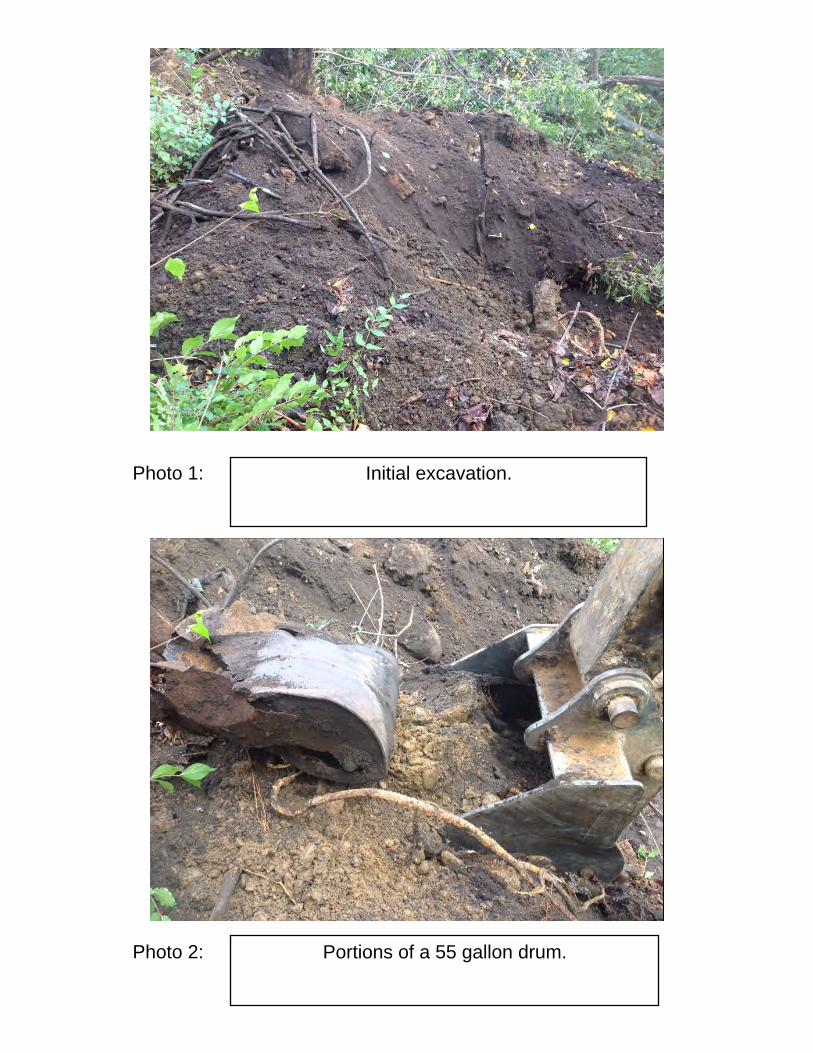
Photo 1: Initial excavation.
Photo 2: Portions of a 55 gallon drum.

Photo 3: North wall showing tire inter tube and asphalt.
Photo 4: West wall.
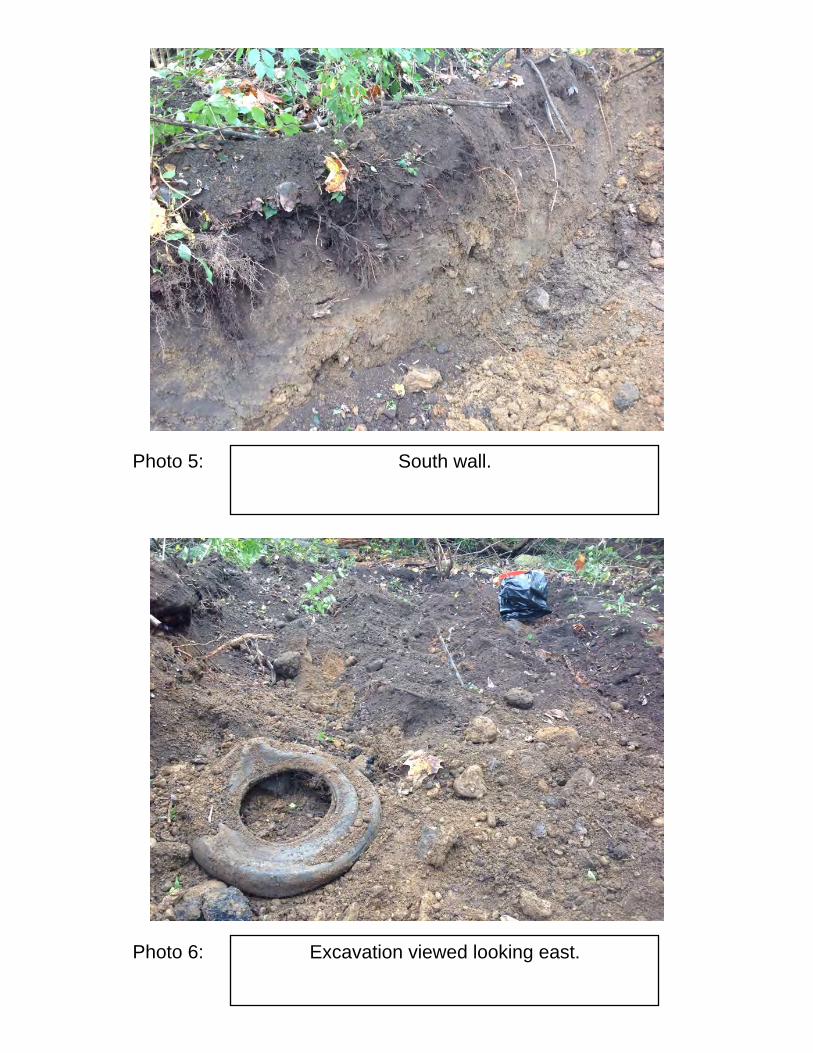
Photo 5: South wall.
Photo 6: Excavation viewed looking east.

Project Number: 103S3636.014.03
Tetra Tech Personnel : Ryan Murley
Pit Boundaries (Nothing, Easting)
Corner 1
Corner 3
Corner 2
Corner 4
Pit Dimensions:
Test Pit ID: TP-9Kingman Island Investigation
Date: November 11, 2015
Test Pit Composite ID: Soil Pile-3
X: 1322195.241
Y: 444964.3058
X: 1322179.823
Y: 444982.4114
X: 1322198.227
Y: 444978.4246
Y: 444964.4504
X: 1322175.391
Length (ft): 15
Width (ft): 10
Depth (ft): 12

Excavation Descriptions
4 to 10 feet consists of medium grey silty clay with larger percentage of trash including aluminum cans, and textiles.
End of test pit at 12 feet in depth.
Odor: —
PID:
Odor: —
Odor: None
Odor: None
Odor: Petrochemical
PID: 0.5
PID: 0.0
PID:
PID: 0.0
Sample collected
Sample collected
Sample collected
Debris observed
Debris observed
Sample collected
Debris observed
Debris observed
Sample collected
0 to 4 feet consists of dark brown silty clay with small amounts of asphalt and concrete.
Debris observed
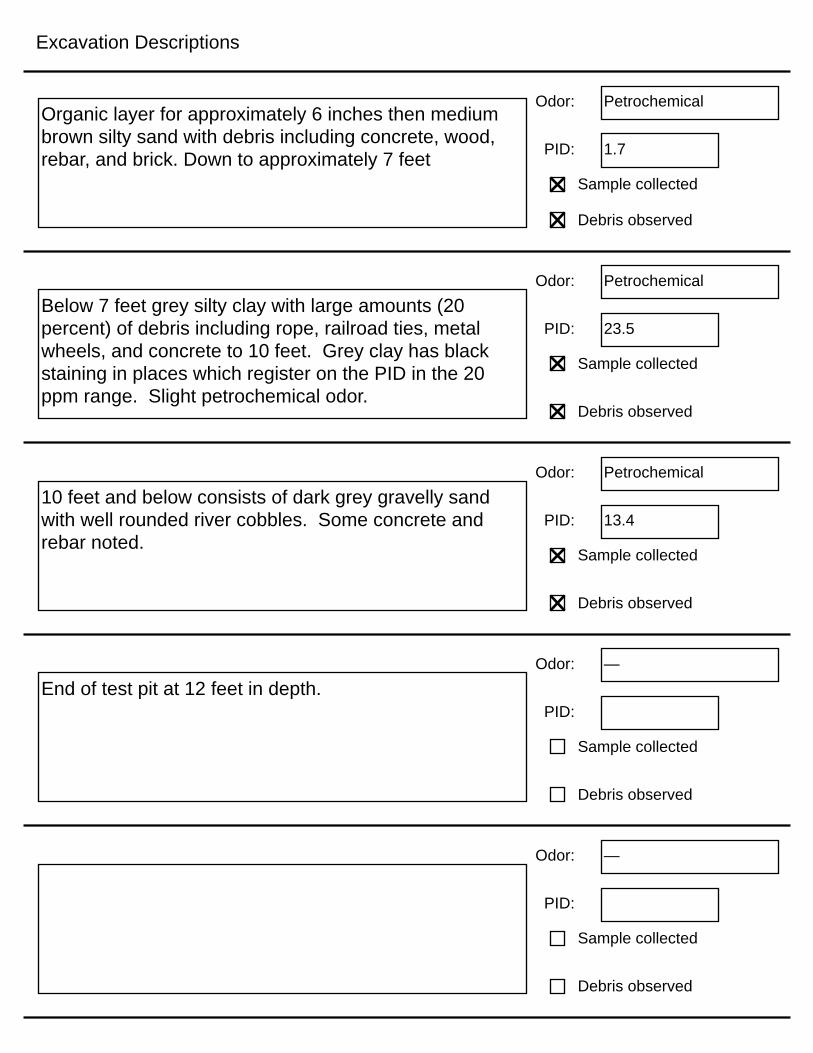
Below 10 feet, the material consists of a black layer with large amounts of trash including paint cans. Moist Layer with dark asphalt to bottom of pit at 12 feet.

Photo 1: West wall.
Photo 2: North Wall.

Photo 3: East wall.
Photo 4: South wall.
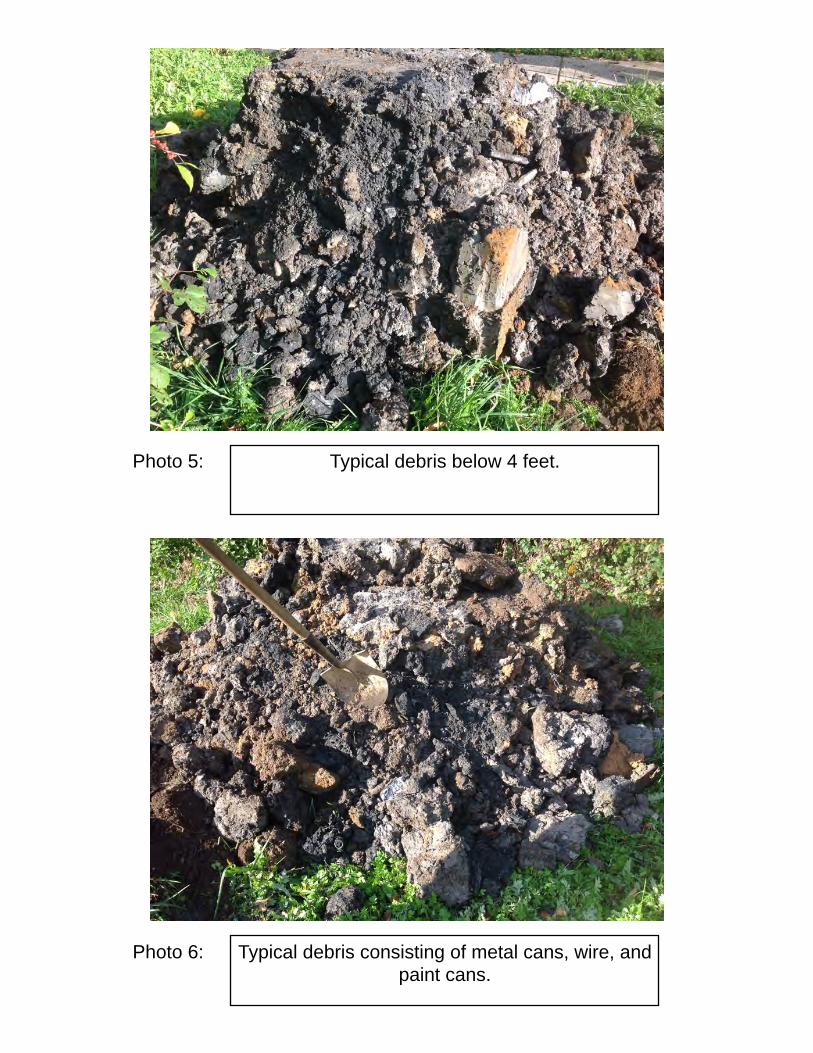
Photo 5: Typical debris below 4 feet.
Photo 6: Typical debris consisting of metal cans, wire, and paint cans.

Project Number: 103S3636.014.03
Tetra Tech Personnel : Ryan Murley
Pit Boundaries (Nothing, Easting)
Corner 1
Corner 3
Corner 2
Corner 4
Pit Dimensions:
Test Pit ID: TP-10Kingman Island Investigation
Date: November 11, 2015
Test Pit Composite ID: Soil Pile-3
X: 1322137.209
Y: 445092.7499
X: 1322140.276
Y: 445073.9944
X: 1322134.608
Y: 445071.0447
Y: 445094.549
X: 1322149.399
Length (ft): 18
Width (ft): 10
Depth (ft): 12
Excavation Descriptions
Below 7 feet grey silty clay with large amounts (20 percent) of debris including rope, railroad ties, metal wheels, and concrete to 10 feet. Grey clay has black staining in places which register on the PID in the 20 ppm range. Slight petrochemical odor.
End of test pit at 12 feet in depth.
Odor: —
PID:
Odor: —
Odor: Petrochemical
Odor: Petrochemical
Odor: Petrochemical
PID: 13.4
PID: 23.5
PID:
PID: 1.7
Sample collected
Sample collected
Sample collected
Debris observed
Debris observed
Sample collected
Debris observed
Debris observed
Sample collected
Organic layer for approximately 6 inches then medium brown silty sand with debris including concrete, wood, rebar, and brick. Down to approximately 7 feet
Debris observed
10 feet and below consists of dark grey gravelly sand with well rounded river cobbles. Some concrete and rebar noted.
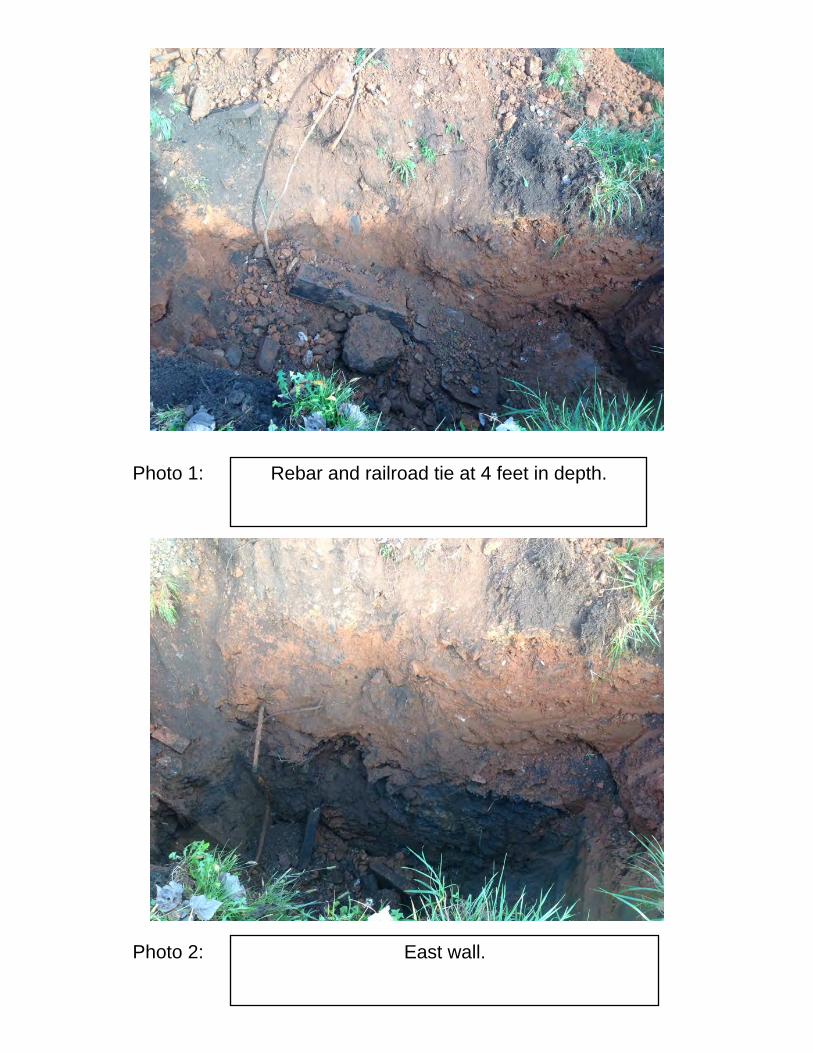
Photo 1: Rebar and railroad tie at 4 feet in depth.
Photo 2: East wall.

Photo 3: North wall showing wooden pole and railroad tie.
Photo 4: West wall.

Photo 5: South wall.
Photo 6: Common debris noted in test pit.

Project Number: 103S3636.014.03
Tetra Tech Personnel : Ryan Murley
Pit Boundaries (Nothing, Easting)
Corner 1
Corner 3
Corner 2
Corner 4
Pit Dimensions:
Test Pit ID: TP-11Kingman Island Investigation
Date: November 12, 2015
Test Pit Composite ID: Soil Pile-3
X: 1322121.593
Y: 444855.9941
X: 1322110.838
Y: 444844.22
X: 1322125.942
Y: 444840.995
Y: 444863.707
X: 1322106.576
Length (ft): 18
Width (ft): 12
Depth (ft): 15

Excavation Descriptions
Below 3 feet, large slabs of concrete, asphalt, and brick mixed in with medium brown coarse sand and large river cobbles.
Down to 15 feet material is consistently grey to medium brown silty clay with inclusions of construction debris like brick, glass, wood and concrete.
End of test pit at 15 feet in depth.Odor: —
PID:
Odor: Petrochemical
Odor: None
Odor: None
Odor: Petrochemical
PID: 22.6
PID: 0.2
PID: 17.2
PID: 0.1
Sample collected
Sample collected
Sample collected
Debris observed
Debris observed
Sample collected
Debris observed
Debris observed
Sample collected
Top soil horizon consists of organics and medium brown silty sand with moderately well rounded gravels and large boulders down to 3 feet.
Debris observed
At 8 feet the material transitions to a medium grey silty clay with river cobbles. Asphalt, brick, concrete, glass, ceramic tiles, and tarry asphalt like material. Petrochemical odor noted here and PID readings in the 10 to 20 ppm range.
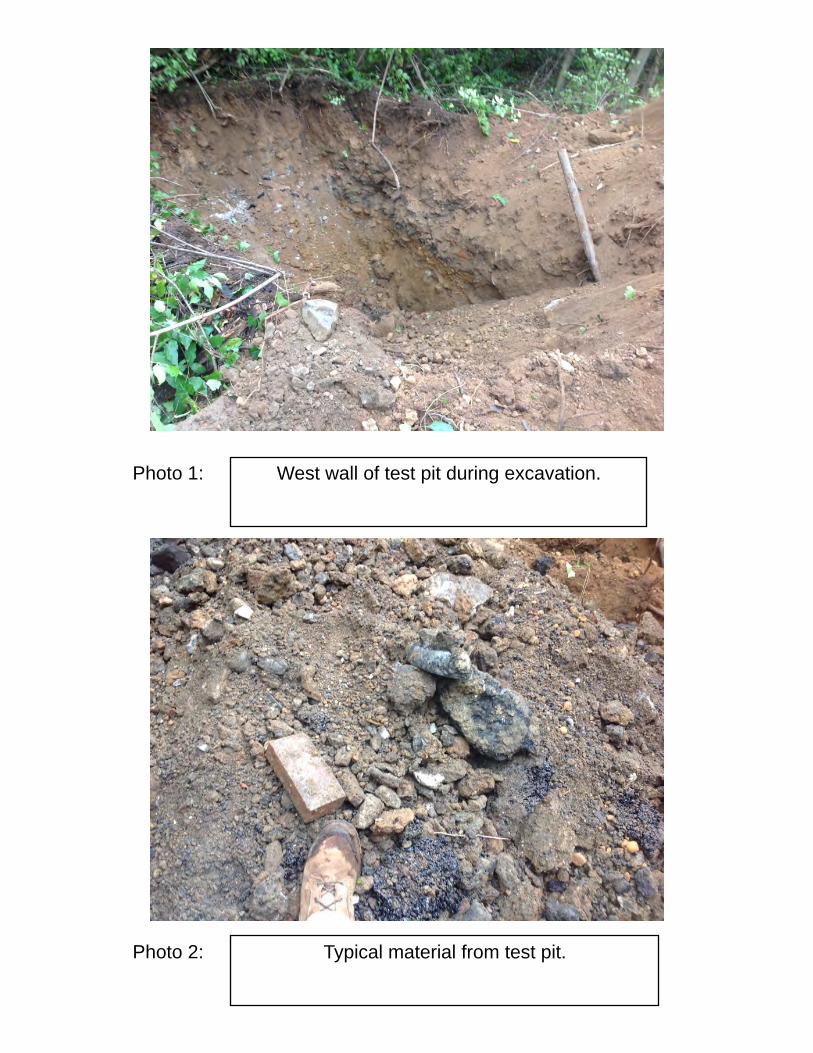
Photo 1: West wall of test pit during excavation.
Photo 2: Typical material from test pit.
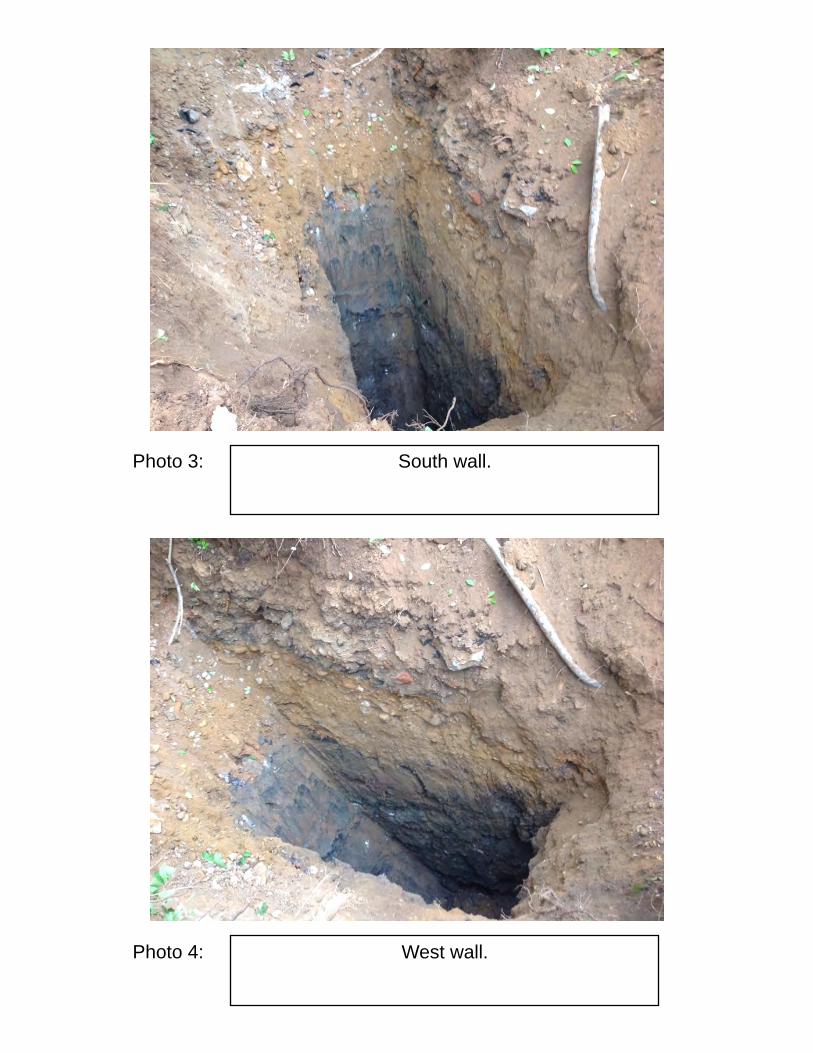
Photo 3: South wall.
Photo 4: West wall.

Photo 5: Northwest wall.
Photo 6: East wall.
Project Number: 103S3636.014.03
Tetra Tech Personnel : Ryan Murley
Pit Boundaries (Nothing, Easting)
Corner 1
Corner 3
Corner 2
Corner 4
Pit Dimensions:
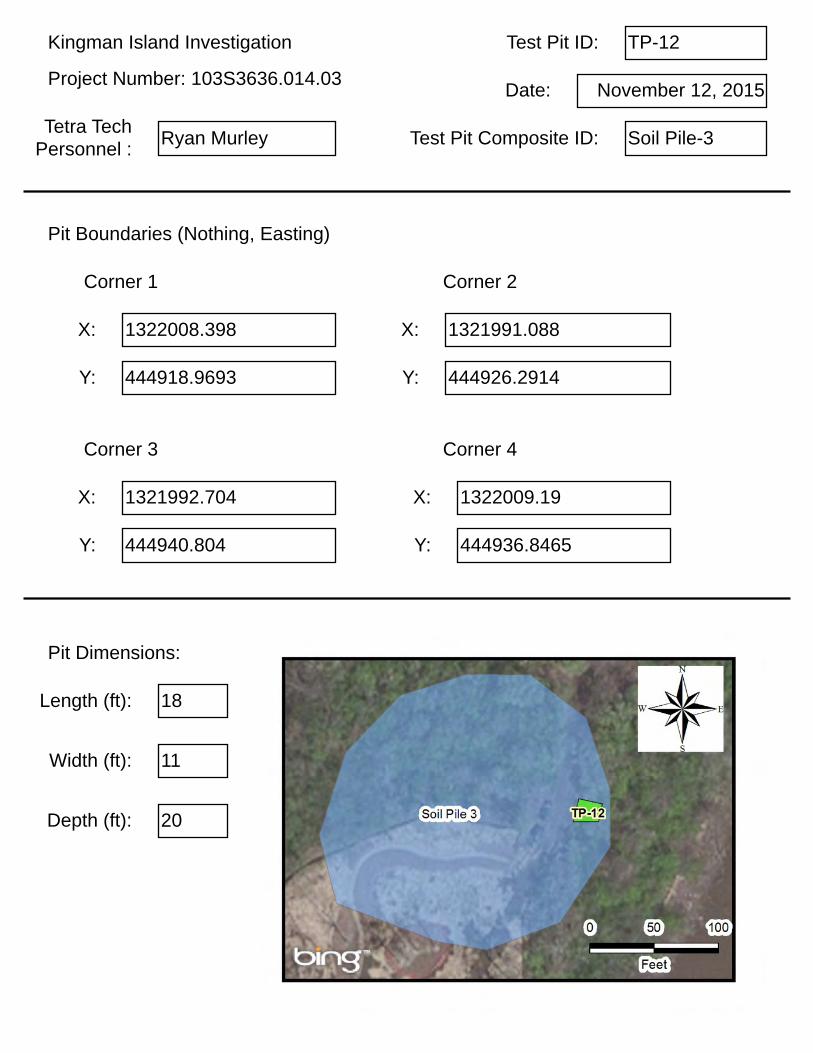
Test Pit ID: TP-12Kingman Island Investigation
Date: November 12, 2015
Test Pit Composite ID: Soil Pile-3
X: 1322008.398
Y: 444918.9693
X: 1321992.704
Y: 444940.804
X: 1321991.088
Y: 444926.2914
Y: 444936.8465
X: 1322009.19
Length (ft): 18
Width (ft): 11
Depth (ft): 20
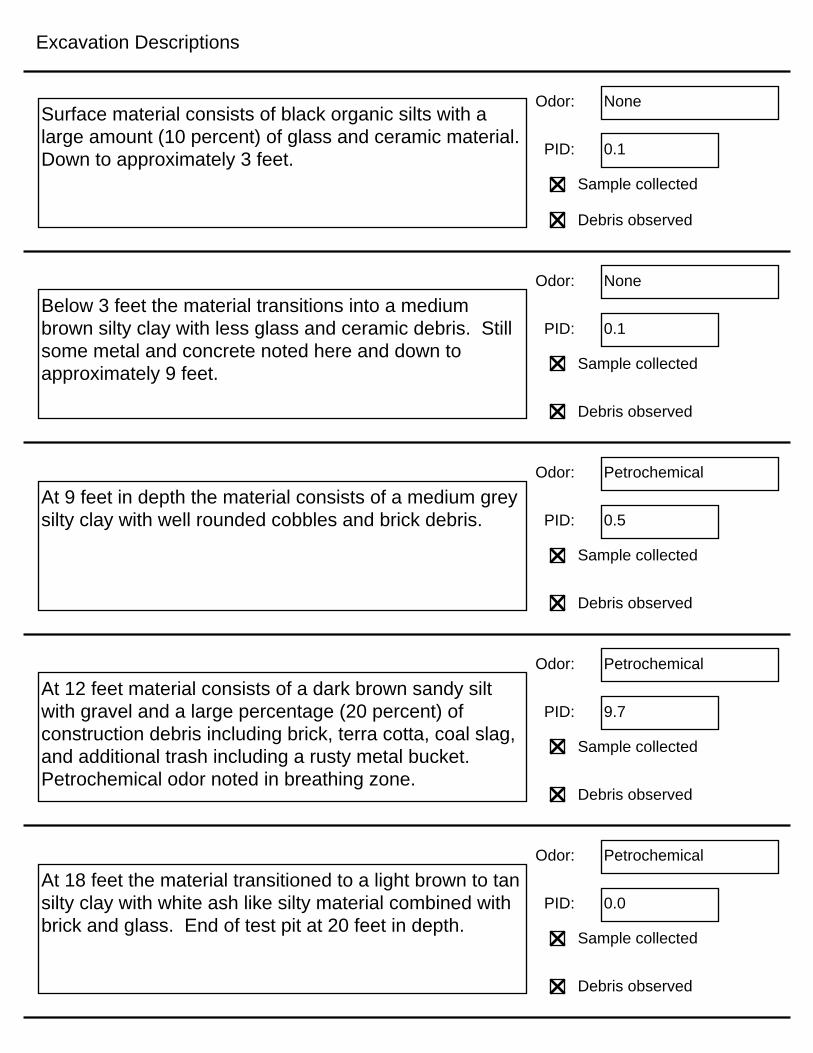
Excavation Descriptions
Below 3 feet the material transitions into a medium brown silty clay with less glass and ceramic debris. Still some metal and concrete noted here and down to approximately 9 feet.
At 12 feet material consists of a dark brown sandy silt with gravel and a large percentage (20 percent) of construction debris including brick, terra cotta, coal slag, and additional trash including a rusty metal bucket. Petrochemical odor noted in breathing zone.
At 18 feet the material transitioned to a light brown to tan silty clay with white ash like silty material combined with brick and glass. End of test pit at 20 feet in depth.
Odor: Petrochemical
PID: 0.0
Odor: Petrochemical
Odor: None
Odor: None
Odor: Petrochemical
PID: 0.5
PID: 0.1
PID: 9.7
PID: 0.1
Sample collected
Sample collected
Sample collected
Debris observed
Debris observed
Sample collected
Debris observed
Debris observed
Sample collected
Surface material consists of black organic silts with a large amount (10 percent) of glass and ceramic material. Down to approximately 3 feet.
Debris observed
At 9 feet in depth the material consists of a medium grey silty clay with well rounded cobbles and brick debris.

Photo 1: Typical excavated material.
Photo 2: East wall.

Photo 3: South wall.
Photo 4: Southwest wall.

Photo 5: North wall.
Photo 6: Material from the bottom of the pit.

Site Investigation Report Kingman Island, Washington, DC
ATTACHMENT 4. ANALYTICAL SUMMARY TABLES

Car
bon
disu
lfide
Tolu
ene
SB-1 SB-1-(1-3) 1-3 feet 11/10/2015 Northwest of Soil Pile 1 ND 1.4 J
SB-1 SB-1D-(1-3) 1-3 feet 11/10/2015 Northwest of Soil Pile 1 ND ND
SB-1 SB-1-(12-14) 12-14 feet 11/10/2015 Northwest of Soil Pile 1 ND ND
SB-2 SB-2-(1-3) 1-3 feet 11/10/2015 West of Soil Pile 1 ND ND
SB-2 SB-2-(8-10) 8-10 feet 11/10/2015 West of Soil Pile 1 ND ND
SB-3 SB-3-(1-3) 1-3 feet 11/10/2015 Southwest of Soil Pile 1 ND ND
SB-3 SB-3-(11-13) 11-13 feet 11/10/2015 Southwest of Soil Pile 1 ND ND
SB-4 SB-4-(1-3) 1-3 feet 11/10/2015 Southeast of Soil Pile 1 ND ND
SB-4 SB-4-(10-12) 10-12 feet 11/10/2015 Southeast of Soil Pile 1 ND ND
SB-5 SB-5-(1-3) 1-3 feet 11/10/2015 Southeast of Soil Pile 1 ND ND
SB-5 SB-5-(10-12) 10-12 feet 11/10/2015 Southeast of Soil Pile 1 ND ND
SB-6 SB-6-(1-3) 1-3 feet 11/10/2015 East of Soil Pile 1 ND ND
SB-6 SB-6-(10-12) 10-12 feet 11/10/2015 East of Soil Pile 1 ND ND
SB-6 SB-6D-(10-12) 10-12 feet 11/10/2015 East of Soil Pile 1 ND ND
SB-7 SB-7-(1-3) 1-3 feet 11/11/2015 Southwest of Soil Pile 2 ND ND
SB-7 SB-7-(8-10) 8-10 feet 11/11/2015 Southwest of Soil Pile 2 ND ND
SB-8 SB-8-(1-3) 1-3 feet 11/11/2015 Northwest of Soil Pile 2 ND ND
SB-8 SB-8-(11-13) 11-13 feet 11/11/2015 Northwest of Soil Pile 2 ND ND
SB-8 SB-8D-(11-13) 11-13 feet 11/11/2015 Northwest of Soil Pile 2 ND ND
SB-9 SB-9(1-3) 1-3 feet 11/11/2015 North-northeast of Soil Pile 2 ND ND
SB-9 SB-9-(12-14) 12-14 feet 11/11/2015 North-northeast of Soil Pile 2 ND ND
SB-10 SB-10- (1-3) 1-3 feet 11/11/2015 East of Soil Pile 2 ND ND
SB-10 SB-10-(8-10) 8-10 feet 11/11/2015 East of Soil Pile 2 ND ND
SB-11 SB-11-(1-3) 1-3 feet 11/11/2015 South-southeast of Soil Pile 2 ND ND
SB-11 SB-11-(8-10) 8-10 feet 11/11/2015 South-southeast of Soil Pile 2 ND ND
SB-12 SB-12-(1-3) 1-3 feet 11/11/2015 South of Soil Pile 2 ND ND
SB-12 SB-12-(8-10) 8-10 feet 11/11/2015 South of Soil Pile 2 ND ND
SB-13 SB-13-(1-3) 1-3 feet 11/11/2015 North of Soil Pile 3 ND ND
SB-13 SB-13-(13-15) 8-10 feet 11/11/2015 North of Soil Pile 3 ND ND
SB-14 SB-14-(1-3) 1-3 feet 11/12/2015 Northeast of Soil Pile 3 ND ND
SB-14 SB-14-(13-15) 13-15 feet 11/12/2015 Northeast of Soil Pile 3 ND ND
Date Collected
Sample ID
VOCs (mg/kg) by EPA Method 8260C
Boring LocationSample Depth
TABLE 1: SOIL SAMPLE ANALYTICAL RESULTS VOLATILE ORGANIC COMPOUNDS
KINGMAN ISLANDWASHINGTON, DC
Boring ID

Car
bon
disu
lfide
Tolu
ene
Date Collected
Sample ID
VOCs (mg/kg) by EPA Method 8260C
Boring LocationSample DepthBoring ID
SB-15 SB-15-(1-3) 1-3 feet 11/12/2015 Southwest of Soil Pile 3 ND ND
SB-15 SB-15-(12-14) 12-14 feet 11/12/2015 Southwest of Soil Pile 3 ND ND
SB-16 SB-16-(1-3) 1-3 feet 11/12/2015 Center of Soil Pile 3 ND ND
SB-16 SB-16-(7-9) 7-9 feet 11/12/2015 Center of Soil Pile 3 ND ND
SB-17 SB-17-(1-3) 1-3 feet 11/11/2015 Southeastern portion of Soil Pile 3 0.00084 J ND
SB-17 SB-17-(17-19) 17-19 feet 11/11/2015 Southeastern portion of Soil Pile 3 ND ND
SB-17 SB-17D-(17-19) 17-19 feet 11/11/2015 Southeastern portion of Soil Pile 3 ND ND
SB-18 SB-18-(1-3) 1-3 feet 11/11/2015 Eastern portion of Soil Pile 3 ND ND
SB-18 SB-18-(13-15) 13-15 feet 11/11/2015 Eastern portion of Soil Pile 3 ND 0.00066 J
77 490
350 4700
NS 6230
NS 58000
NS 81100
NS 321000
NS 321000
NS 449000
RSL - Regional Screening Level
mg/kg - Milligrams per kilogram
* Regulatory values obtained from the DOEE Toxic Substances Division Underground Storage Tank Branch, District of Columbia Risk-Based Corrective Action Technical Guidance (Risk-Based Decision Making) Tables 5-8, 5-9, and 5-10, RBSLs for a Residential Child, Adult, and Commercial Worker , dated June 2011 and the EPA Region 3 RSLs for Industrial Soil and Residential Soil (target hazard quotient of 0.1), dated November 2015.
EPA - United States Environmental Protection AgencyJ - Estimated Concentration
Bold results indicate the sample was above regulatory limits
DOEE Surficial Soil Ingestion, Inhalation, and Dermal Contact RBSLs for a Commercial Worker*
EPA Industrial Soil RSL*
Only detected analytes are presented
VOCs - Volatile Organic Compounds
DOEE - Washington DC Department of Energy & Environment
NS - No StandardND - Not Detected at or above the Laboratory Detection Limit
RBSL - Risk-Based Screening Level
Notes:
DOEE Subsurface Soil Outdoor Inhalation RBSLs for a Commercial Worker*
DOEE Subsurface Soil Outdoor Inhalation RBSLs for a Resident Child*
DOEE Subsurface Soil Outdoor Inhalation RBSLs for a Resident Adult*
EPA Residential Soil RSL*
DOEE Surficial Soil Ingestion, Inhalation, and Dermal Contact RBSLs for a Resident Adult*
DOEE Surficial Soil Ingestion, Inhalation, and Dermal Contact RBSLs for a Resident Child*

Ace
naph
then
e
Ace
naph
thyl
ene
Ant
hrac
ene
Ben
zo[a
]ant
hrac
ene
Ben
zo[a
]pyr
ene
Ben
zo[b
]fluo
rant
hene
Ben
zo[g
,h,i]
pery
lene
Ben
zo[k
]fluo
rant
hene
Chr
ysen
e
Dib
enz(
a,h)
anth
race
ne
Fluo
rant
hene
Fluo
rene
Inde
no[1
,2,3
-cd]
pyre
ne
Nap
htha
lene
Phe
nant
hren
e
Pyr
ene
SB-1 SB-1-(1-3) 1-3 feet 11/10/2015 Northwest of Soil Pile 1 ND ND 0.0027 0.0081 0.010 0.011 0.0081 0.0037 0.0083 ND 0.017 ND 0.0071 ND 0.0088 0.014
SB-1 SB-1D-(1-3) 1-3 feet 11/10/2015 Northwest of Soil Pile 1 ND ND 0.0014 0.004 J 0.0053 J 0.0056 J 0.0059 J 0.0033 J 0.0047 J ND 0.0076 ND 0.0036 J ND 0.0037 J 0.0069 J
SB-1 SB-1-(12-14) 12-14 feet 11/10/2015 Northwest of Soil Pile 1 0.100 0.070 0.290 0.780 0.710 0.850 0.550 0.300 0.780 0.150 1.4 0.110 0.480 0.054 0.910 1.2
SB-2 SB-2-(1-3) 1-3 feet 11/10/2015 West of Soil Pile 1 0.013 J ND 0.067 0.160 0.150 0.150 0.130 0.077 0.170 ND 0.350 0.027 J 0.099 ND 0.210 0.280
SB-2 SB-2-(8-10) 8-10 feet 11/10/2015 West of Soil Pile 1 0.049 0.021 0.098 0.110 0.120 0.130 0.120 0.049 0.130 ND 0.320 0.077 0.089 0.160 0.370 0.230
SB-3 SB-3-(1-3) 1-3 feet 11/10/2015 Southwest of Soil Pile 1 ND 0.0066 J 0.0063 J 0.031 0.032 0.040 0.031 0.014 0.029 0.0066 J 0.034 0.0020 J 0.026 ND 0.015 0.028
SB-3 SB-3-(11-13) 11-13 feet 11/10/2015 Southwest of Soil Pile 1 0.0032 J 0.0094 0.015 0.064 0.061 0.073 0.056 0.027 0.065 0.015 0.130 0.0046 J 0.049 0.0033 J 0.050 0.110
SB-4 SB-4-(1-3) 1-3 feet 11/10/2015 Southeast of Soil Pile 1 0.0052 J 0.0099 0.016 0.094 0.094 0.110 0.087 0.041 0.110 0.027 0.150 0.0059 J 0.073 0.014 0.063 0.120
SB-4 SB-4-(10-12) 10-12 feet 11/10/2015 Southeast of Soil Pile 1 0.0018 J 0.0012 J 0.0034 J 0.013 0.0097 0.0096 0.010 0.0028 J 0.016 ND 0.022 0.0026 J 0.0064 J ND 0.015 0.019
SB-5 SB-5-(1-3) 1-3 feet 11/10/2015 Southeast of Soil Pile 1 0.075 J 0.660 0.530 1.6 2.0 2.4 2.4 0.820 1.7 0.560 2.7 0.110 J 2.0 ND 0.780 2.0
SB-5 SB-5-(10-12) 10-12 feet 11/10/2015 Southeast of Soil Pile 1 0.0085 0.007 J 0.022 0.070 0.065 0.075 0.067 0.029 0.075 0.019 0.140 0.0096 0.055 0.0091 0.082 0.098
SB-6 SB-6-(1-3) 1-3 feet 11/10/2015 East of Soil Pile 1 ND ND 0.042 J 0.110 J 0.099 J 0.110 J 0.100 J 0.044 J 0.130 J ND 0.260 ND 0.100 J ND 0.120 J 0.190
SB-6 SB-6-(10-12) 10-12 feet 11/10/2015 East of Soil Pile 1 0.0019 J 0.0047 J 0.019 0.048 0.043 0.042 0.037 0.023 0.046 0.0092 0.100 0.0048 J 0.034 0.0028 J 0.041 0.070
SB-6 SB-6D-(10-12) 10-12 feet 11/10/2015 East of Soil Pile 1 0.0022 J 0.0038 J 0.0085 0.023 0.025 0.032 0.028 0.012 0.030 0.0063 J 0.056 0.0049 J 0.024 0.0036 J 0.029 0.040
SB-7 SB-7-(1-3) 1-3 feet 11/11/2015 Southwest of Soil Pile 2 0.016 0.031 0.095 0.34 0.29 0.36 0.21 0.12 0.36 0.064 0.69 0.017 0.20 0.0083 J 0.19 0.45
SB-7 SB-7-(8-10) 8-10 feet 11/11/2015 Southwest of Soil Pile 2 ND ND ND ND ND ND ND ND ND ND 0.0036 J ND ND ND ND 0.0032 J
SB-8 SB-8-(1-3) 1-3 feet 11/11/2015 Northwest of Soil Pile 2 0.037 0.024 0.48 3.9 2.7 3.0 1.8 0.91 4.6 0.51 6.8 0.085 1.3 ND 0.26 4.8
SB-8 SB-8-(11-13) 11-13 feet 11/11/2015 Northwest of Soil Pile 2 27 0.55 57 57 45 54 21 21 50 4.6 160 34 21 10 170 120
SB-8 SB-8D-(11-13) 11-13 feet 11/11/2015 Northwest of Soil Pile 2 3.1 0.24 J 8.8 14 13 14 10 4.6 12 2.6 35 3.5 9.5 0.96 24 22
SB-9 SB-9(1-3) 1-3 feet 11/11/2015 North-northeast of Soil Pile 2 0.37 0.58 1.7 4.9 4.5 5.5 4.6 2.1 5.4 1.1 11 0.44 3.8 0.24 5.7 7.4
Sample ID Sample Depth Boring Location
TABLE 2: SOIL SAMPLE ANALYTICAL RESULTS POLYCYCLIC AROMATIC HYDROCARBONS
KINGMAN ISLANDWASHINGTON, DC
PAHs (mg/kg) by EPA Method 8270D LL
Date Collected
Boring ID

Ace
naph
then
e
Ace
naph
thyl
ene
Ant
hrac
ene
Ben
zo[a
]ant
hrac
ene
Ben
zo[a
]pyr
ene
Ben
zo[b
]fluo
rant
hene
Ben
zo[g
,h,i]
pery
lene
Ben
zo[k
]fluo
rant
hene
Chr
ysen
e
Dib
enz(
a,h)
anth
race
ne
Fluo
rant
hene
Fluo
rene
Inde
no[1
,2,3
-cd]
pyre
ne
Nap
htha
lene
Phe
nant
hren
e
Pyr
ene
Sample ID Sample Depth Boring Location
PAHs (mg/kg) by EPA Method 8270D LL
Date Collected
Boring ID
SB-9 SB-9-(12-14) 12-14 feet 11/11/2015 North-northeast of Soil Pile 2 0.021 J 0.068 0.097 0.37 0.33 0.48 0.23 0.15 0.39 0.078 0.56 0.029 J 0.21 0.038 J 0.25 0.53
SB-10 SB-10- (1-3) 1-3 feet 11/11/2015 East of Soil Pile 2 1.3 ND 2.8 3.8 2.6 2.8 1.2 0.80 4.5 0.35 7.8 1.5 0.93 0.25 J 15 11
SB-10 SB-10-(8-10) 8-10 feet 11/11/2015 East of Soil Pile 2 0.17 0.023 0.29 0.42 0.33 0.43 0.18 0.14 0.40 0.05 0.93 0.19 0.16 0.12 1.1 0.79
SB-11 SB-11-(1-3) 1-3 feet 11/11/2015 South-southeast of Soil Pile 2 0.065 J ND 0.23 J 0.90 0.86 1.1 0.62 0.41 0.81 ND 1.7 0.060 J 0.49 ND 0.77 1.7
SB-11 SB-11-(8-10) 8-10 feet 11/11/2015 South-southeast of Soil Pile 2 0.28 0.098 1.5 6.3 5.9 7.4 3.7 2.7 6 0.88 11 0.37 3.4 0.23 5.1 9.8
SB-12 SB-12-(1-3) 1-3 feet 11/11/2015 South of Soil Pile 2 0.036 J 0.015 J 0.094 0.33 0.34 0.40 0.25 0.19 0.34 0.051 0.65 0.035 J 0.21 0.044 0.36 0.58
SB-12 SB-12-(8-10) 8-10 feet 11/11/2015 South of Soil Pile 2 ND ND 0.0082 J 0.030 J 0.042 0.027 J 0.059 0.0081 J 0.049 ND 0.024 J ND 0.017 J ND 0.029 J 0.077
SB-13 SB-13-(1-3) 1-3 feet 11/11/2015 North of Soil Pile 3 ND ND 0.036 J 0.18 J 0.16 J 0.18 J ND 0.14 J 0.17 J ND 0.31 J ND ND ND 0.13 J 0.29 J
SB-13 SB-13-(13-15) 8-10 feet 11/11/2015 North of Soil Pile 3 0.36 0.073 J 0.78 1.4 1.4 1.4 0.89 0.78 1.4 0.14 3.1 0.39 0.74 0.29 2.9 3.1
SB-14 SB-14-(1-3) 1-3 feet 11/12/2015 Northeast of Soil Pile 3 0.24 0.11 0.58 1.2 0.98 1.2 0.67 0.51 1.2 0.19 2.3 0.28 0.60 0.19 1.8 2.1
SB-14 SB-14-(13-15) 13-15 feet 11/12/2015 Northeast of Soil Pile 3 0.0067 J 0.0062 J 0.031 0.16 0.17 0.21 0.12 0.082 0.16 0.032 0.23 0.0071 J 0.11 0.0082 0.082 0.21
SB-15 SB-15-(1-3) 1-3 feet 11/12/2015 Southwest of Soil Pile 3 0.11 0.067 J 0.29 0.65 0.56 0.77 0.39 0.27 0.65 0.11 1.5 0.12 0.35 0.082 0.98 1.2
SB-15 SB-15-(12-14) 12-14 feet 11/12/2015 Southwest of Soil Pile 3 0.015 J 0.010 J 0.040 0.12 0.070 0.12 0.036 0.037 0.12 0.015 J 0.32 0.019 0.031 0.029 0.18 0.26
SB-16 SB-16-(1-3) 1-3 feet 11/12/2015 Center of Soil Pile 3 0.110 0.110 0.34 0.82 0.67 0.97 0.43 0.27 0.83 0.13 1.7 0.091 0.39 0.062 J 1.4 1.4
SB-16 SB-16-(7-9) 7-9 feet 11/12/2015 Center of Soil Pile 3 0.014 J 0.15 0.11 0.73 0.55 0.83 0.36 0.28 0.70 0.11 0.94 0.025 J 0.34 0.022 J 0.17 0.81
SB-17 SB-17-(1-3) 1-3 feet 11/11/2015 Southeastern portion of Soil Pile 3 0.041 J 0.049 J 0.099 0.30 0.31 0.32 0.21 0.27 0.31 0.057 J 0.63 0.043 J 0.19 0.073 J 0.34 0.61
SB-17 SB-17-(17-19) 17-19 feet 11/11/2015 Southeastern portion of Soil Pile 3 0.035 J ND 0.071 J 0.31 0.30 0.39 0.21 0.18 0.32 ND 0.61 0.032 J 0.19 ND 0.32 0.60
SB-17 SB-17D-(17-19) 17-19 feet 11/11/2015 Southeastern portion of Soil Pile 3 0.050 J 0.027 J 0.18 0.72 0.65 0.97 0.46 0.31 0.71 0.10 1.4 0.056 J 0.41 0.045 J 0.84 1.4
SB-18 SB-18-(1-3) 1-3 feet 11/11/2015 Eastern portion of Soil Pile 3 0.017 0.011 0.038 0.11 0.096 0.13 0.070 0.048 0.12 0.014 0.21 0.022 0.059 0.041 0.15 0.20
SB-18 SB-18-(13-15) 13-15 feet 11/11/2015 Eastern portion of Soil Pile 3 1.6 0.38 6.1 13 12 13 7.9 5.8 12 1.9 30 2.1 6.9 0.61 22 27

Ace
naph
then
e
Ace
naph
thyl
ene
Ant
hrac
ene
Ben
zo[a
]ant
hrac
ene
Ben
zo[a
]pyr
ene
Ben
zo[b
]fluo
rant
hene
Ben
zo[g
,h,i]
pery
lene
Ben
zo[k
]fluo
rant
hene
Chr
ysen
e
Dib
enz(
a,h)
anth
race
ne
Fluo
rant
hene
Fluo
rene
Inde
no[1
,2,3
-cd]
pyre
ne
Nap
htha
lene
Phe
nant
hren
e
Pyr
ene
Sample ID Sample Depth Boring Location
PAHs (mg/kg) by EPA Method 8270D LL
Date Collected
Boring ID
360 NS 1800 0.16 0.016 0.16 NS 1.6 16 0.016 240 240 0.16 3.8 NS 180
4500 NS 23000 2.9 0.29 2.9 NS 29 290 0.290 3000 3000 2.9 17 NS 230
3440 NS 17200 0.196 0.0192 0.196 1870 9.16 91.5 NS 2290 2290 NS 469 1870 1720
28800 NS 144000 1.92 0.192 1.92 15500 1.92 191 NS 19200 19200 NS 262 15500 14400
33000 NS 165000 2.11 0.211 2.11 17500 21.00 210 NS 220000 22000 NS 322 17500 16500
NS NS NS 894000 376000 6190000 NS 6070000 15600000 NS NS NS NS 2520 NS NS
NS NS NS 224000 93900 1550000 NS 1520000 3890000 NS NS NS NS 848 NS NS
NS NS NS 300000 126000 2080000 NS 2040000 5230000 NS NS NS NS 848 NS NS
mg/kg - Milligrams per kilogram
EPA Industrial Soil RSL*
DOEE Surficial Soil Ingestion, Inhalation, and Dermal Contact RBSLs for a Resident Child*
DOEE Surficial Soil Ingestion, Inhalation, and Dermal Contact RBSLs for a Resident Adult*
Bold results indicate the sample was above regulatory limits
RBSL - Risk-Based Screening LevelRSL - Regional Screening Level
Only detected analytes are presented
PAHs - Polycyclic Aromatic Hydrocarbons
J - - Estimated Concentration, bias low
EPA Residential Soil RSL*
* Regulatory values obtained from the DOEE Toxic Substances Division Underground Storage Tank Branch, District of Columbia Risk-Based Corrective Action Technical Guidance (Risk-Based Decision Making) Tables 5-8, 5-9, and 5-10, RBSLs for a Residential Child, Adult, and Commercial Worker, dated June 2011 and the EPA Region 3 RSLs for Industrial Soil and Residential Soil (target hazard quotient of 0.1), dated November 2015.
DOEE Surficial Soil Ingestion, Inhalation, and Dermal Contact RBSLs for a Commercial Worker*
DOEE Subsurface Soil Outdoor Inhalation RBSLs for a Commercial Worker*
DOEE Subsurface Soil Outdoor Inhalation RBSLs for a Resident Adult*
DOEE Subsurface Soil Outdoor Inhalation RBSLs for a Resident Child*
Notes:
ND - Not Detected at or above the Laboratory Detection Limit NS - No Standard
DOEE - Washington DC Department of Energy & Environment
EPA - United States Environmental Protection AgencyJ - Estimated Concentration
D - Initial results exceeded laboratory calibration range and were run at higher dillution.
J + - Estimated Concentration, bias high

Die
sel R
ange
O
rgan
ics
[C10
- C
28]
Gas
olin
e R
ange
O
rgan
ics
[C6
- C
10]
Oil
Ran
ge
Org
anic
s (C
28-
C40
)
SB-1 SB-1-(1-3) 1-3 feet 11/10/2015 Northwest of Soil Pile 1 26 ND 25
SB-1 SB-1D-(1-3) 1-3 feet 11/10/2015 Northwest of Soil Pile 1 24 ND 21
SB-1 SB-1-(12-14) 12-14 feet 11/10/2015 Northwest of Soil Pile 1 11 J ND 11 J
SB-2 SB-2-(1-3) 1-3 feet 11/10/2015 West of Soil Pile 1 350 0.057 J 870
SB-2 SB-2-(8-10) 8-10 feet 11/10/2015 West of Soil Pile 1 140 ND 400
SB-3 SB-3-(1-3) 1-3 feet 11/10/2015 Southwest of Soil Pile 1 560 ND 940
SB-3 SB-3-(11-13) 11-13 feet 11/10/2015 Southwest of Soil Pile 1 68 J ND 71
SB-4 SB-4-(1-3) 1-3 feet 11/10/2015 Southeast of Soil Pile 1 33 ND 37
SB-4 SB-4-(10-12) 10-12 feet 11/10/2015 Southeast of Soil Pile 1 30 0.27 92
SB-5 SB-5-(1-3) 1-3 feet 11/10/2015 Southeast of Soil Pile 1 46 ND 120
SB-5 SB-5-(10-12) 10-12 feet 11/10/2015 Southeast of Soil Pile 1 31 ND 72
SB-6 SB-6-(1-3) 1-3 feet 11/10/2015 East of Soil Pile 1 610 ND 830
SB-6 SB-6-(10-12) 10-12 feet 11/10/2015 East of Soil Pile 1 9.3 J ND 12 J
SB-6 SB-6D-(10-12) 10-12 feet 11/10/2015 East of Soil Pile 1 13 J ND 58
SB-7 SB-7-(1-3) 1-3 feet 11/11/2015 Southwest of Soil Pile 2 17 J 0.059 J 38
SB-7 SB-7-(8-10) 8-10 feet 11/11/2015 Southwest of Soil Pile 2 10 J ND 17 J
SB-8 SB-8-(1-3) 1-3 feet 11/11/2015 Northwest of Soil Pile 2 55 ND 180
SB-8 SB-8-(11-13) 11-13 feet 11/11/2015 Northwest of Soil Pile 2 310 ND 320
SB-8 SB-8D-(11-13) 11-13 feet 11/11/2015 Northwest of Soil Pile 2 160 ND 250
SB-9 SB-9(1-3) 1-3 feet 11/11/2015 North-northeast of Soil Pile 2 45 J+ ND 58
SB-9 SB-9-(12-14) 12-14 feet 11/11/2015 North-northeast of Soil Pile 2 11 J ND 8.5 J
SB-10 SB-10- (1-3) 1-3 feet 11/11/2015 East of Soil Pile 2 2100 ND 1900
SB-10 SB-10-(8-10) 8-10 feet 11/11/2015 East of Soil Pile 2 110 ND 90
SB-11 SB-11-(1-3) 1-3 feet 11/11/2015 South-southeast of Soil Pile 2 98 ND 170
SB-11 SB-11-(8-10) 8-10 feet 11/11/2015 South-southeast of Soil Pile 2 160 ND 110
SB-12 SB-12-(1-3) 1-3 feet 11/11/2015 South of Soil Pile 2 1500 ND 620
SB-12 SB-12-(8-10) 8-10 feet 11/11/2015 South of Soil Pile 2 92 ND 60
SB-13 SB-13-(1-3) 1-3 feet 11/11/2015 North of Soil Pile 3 28 ND 65
SB-13 SB-13-(13-15) 8-10 feet 11/11/2015 North of Soil Pile 3 280 ND 320
SB-14 SB-14-(1-3) 1-3 feet 11/12/2015 Northeast of Soil Pile 3 210 ND 320
SB-14 SB-14-(13-15) 13-15 feet 11/12/2015 Northeast of Soil Pile 3 44 ND 50
SB-15 SB-15-(1-3) 1-3 feet 11/12/2015 Southwest of Soil Pile 3 1300 ND 1100
SB-15 SB-15-(12-14) 12-14 feet 11/12/2015 Southwest of Soil Pile 3 57 ND 54
SB-16 SB-16-(1-3) 1-3 feet 11/12/2015 Center of Soil Pile 3 71 ND 55
TABLE 3: SOIL SAMPLE ANALYTICAL RESULTS TOTAL PETROLEUM HYDROCARBONS
KINGMAN ISLANDWASHINGTON, DC
Boring ID Sample ID Sample Depth
TPH (mg/kg) by EPA Method 8015D
Boring LocationDate
Collected

Die
sel R
ange
O
rgan
ics
[C10
- C
28]
Gas
olin
e R
ange
O
rgan
ics
[C6
- C
10]
Oil
Ran
ge
Org
anic
s (C
28-
C40
)
Boring ID Sample ID Sample Depth
TPH (mg/kg) by EPA Method 8015D
Boring LocationDate
Collected
SB-16 SB-16-(7-9) 7-9 feet 11/12/2015 Center of Soil Pile 3 85 ND 72
SB-17 SB-17-(1-3) 1-3 feet 11/11/2015 Southeastern portion of Soil Pile 3 600 0.063 J 550
SB-17 SB-17-(17-19) 17-19 feet 11/11/2015 Southeastern portion of Soil Pile 3 120 ND 190
SB-17 SB-17D-(17-19) 17-19 feet 11/11/2015 Southeastern portion of Soil Pile 3 76 ND 190
SB-18 SB-18-(1-3) 1-3 feet 11/11/2015 Eastern portion of Soil Pile 3 83 0.072 J 100
SB-18 SB-18-(13-15) 13-15 feet 11/11/2015 Eastern portion of Soil Pile 3 190 ND 130
11 8 250
60 42 3300
1870 3690 1870
NS 32800 NS
NS 45000 NS
15500 45000 15500
NS 45000 NS
NS 63000 NS
mg/kg - milligrams per kilogram
J - - Estimated Concentration, bias low
* Regulatory values obtained from the DOEE Toxic Substances Division Underground Storage Tank Branch, District of Columbia Risk-Based Corrective Action Technical Guidance (Risk-Based Decision Making) Tables 5-8, 5-9, and 5-10, RBSLs for a Residential Child, Adult, and Commercial Worker, dated June 2011 and the EPA Region 3 RSLs for Industrial Soil and Residential Soil (target hazard quotient of 0.1), dated November 2015.
EPA - United States Environmental Protection Agency
TPH - Total Petroleum Hydrocarbons
NS - No StandardRBSL - Risk-Based Screening Level
J + - Estimated Concentration, bias high
ND - Not Detected at or above the Laboratory Detection Limit
RSL - Regional Screening Level
J - Estimated Concentration
Bold results indicate the sample was above regulatory limits
DOEE Subsurface Soil Outdoor Inhalation RBSLs for a Commercial Worker*
DOEE - Washington DC Department of Energy & Environment
DOEE Surficial Soil Ingestion, Inhalation, and Dermal Contact RBSLs for a Resident Adult*
DOEE Subsurface Soil Outdoor Inhalation RBSLs for a Resident Adult*
Only detected analytes are presentedNotes:
EPA Residential Soil RSL*
EPA Industrial Soil RSL*
DOEE Surficial Soil Ingestion, Inhalation, and Dermal Contact RBSLs for a Resident Child*
DOEE Subsurface Soil Outdoor Inhalation RBSLs for a Resident Child*
DOEE Surficial Soil Ingestion, Inhalation, and Dermal Contact RBSLs for a Commercial Worker*

Alum
inum
Antim
ony
Arse
nic
Bariu
m
Bery
llium
Cad
miu
m
Cal
cium
Chr
omiu
m
Cob
alt
Cop
per
Iron
Lead
Mag
nesi
um
Man
gane
se
Mer
cury
Nic
kel
Pota
ssiu
m
Sele
nium
Silv
er
Sodi
um
Vana
dium
Zinc
SB-1 SB-1-(1-3) 1-3 feet 11/10/2015 Northwest of Soil Pile 1 6800 ND 3 85 0.42 ND 810 10 11 9.1 14000 J 12 800 360 0.021 9.2 830 ND ND 61 21 24
SB-1 SB-1D-(1-3) 1-3 feet 11/10/2015 Northwest of Soil Pile 1 7100 ND 5.3 83 0.74 ND 2000 13 16 12 26000 14 1100 1200 0.021 13 720 0.35 ND 65 24 37
SB-1 SB-1-(12-14) 12-14 feet 11/10/2015 Northwest of Soil Pile 1 7500 ND 5.9 90 0.6 0.2 J 6400 17 9 23 21000 110 1000 300 0.75 9.6 790 0.76 ND 160 36 110
SB-2 SB-2-(1-3) 1-3 feet 11/10/2015 West of Soil Pile 1 4700 ND 1.9 29 0.32 J 0.31 J 790 9.5 B 5.1 J 9 10000 6.4 890 97 0.14 7.8 520 J,B ND ND 88 J 17 22
SB-2 SB-2-(8-10) 8-10 feet 11/10/2015 West of Soil Pile 1 5600 ND 4.6 110 0.77 0.34 J 14000 18 9.6 23 24000 120 2300 310 ND 24 970 0.51 J ND 400 J 40 120
SB-3 SB-3-(1-3) 1-3 feet 11/10/2015 Southwest of Soil Pile 1 6200 ND 6.9 48 0.65 ND 9000 12 7.4 12 15000 16 1800 380 ND 11 1100 ND ND 76 J 18 39
SB-3 SB-3-(11-13) 11-13 feet 11/10/2015 Southwest of Soil Pile 1 6700 J ND 1.8 62 0.42 J ND 990 11 6.6 8.6 16000 11 1600 69 F1 0.031 J 12 860 0.4 J ND 69 J 14 39
SB-4 SB-4-(1-3) 1-3 feet 11/10/2015 Southeast of Soil Pile 1 7300 ND 7.1 110 0.59 0.13 J 2500 15 10 22 18000 260 1300 310 0.23 13 840 0.39 J ND 67 J 23 120
SB-4 SB-4-(10-12) 10-12 feet 11/10/2015 Southeast of Soil Pile 1 6900 0.34 J 3 73 0.71 0.13 J 700 11 17 7.3 9000 8.3 890 71 0.66 17 580 J 0.51 J ND 56 J 16 37
SB-5 SB-5-(1-3) 1-3 feet 11/10/2015 Southeast of Soil Pile 1 4300 ND 2.4 49 0.24 J 0.46 J 47000 37 9.6 31 12000 79 36000 200 ND 140 390 J 0.72 J 0.64 140 J 34 120
SB-5 SB-5-(10-12) 10-12 feet 11/10/2015 Southeast of Soil Pile 1 9800 ND 3.5 100 0.96 0.091 J 1300 18 13 16 15000 50 1200 320 0.17 15 770 0.4 J ND 47 J 25 55
SB-6 SB-6-(1-3) 1-3 feet 11/10/2015 East of Soil Pile 1 5300 ND 3.6 37 0.43 0.078 J 5900 20 13 9.6 16000 40 3600 160 0.023 J 38 660 ND ND 55 J 23 38
SB-6 SB-6-(10-12) 10-12 feet 11/10/2015 East of Soil Pile 1 6500 ND 2.6 54 0.94 0.12 J 740 13 9.2 10 11000 9.4 1100 190 0.046 14 660 0.6 J ND 39 J 17 43
SB-6 SB-6D-(10-12) 10-12 feet 11/10/2015 East of Soil Pile 1 7000 ND 2.7 76 0.89 0.098 J 950 15 8.8 11 17000 11 1300 780 0.059 14 850 ND ND 47 J 20 47
SB-7 SB-7-(1-3) 1-3 feet 11/11/2015 Southwest of Soil Pile 2 4100 0.57 J 2.7 42 0.35 J 0.3 J 3200 12 B 4.3 J 21 12000 37 1200 180 0.091 13 520 J ND 0.37 J 110 J 13 76
SB-7 SB-7-(8-10) 8-10 feet 11/11/2015 Southwest of Soil Pile 2 3800 ND 2.4 24 0.36 J ND 470 J 8.5 B 4.1 J 7.9 12000 4.4 880 130 ND 7.1 500 J ND ND 29 J 11 19
SB-8 SB-8-(1-3) 1-3 feet 11/11/2015 Northwest of Soil Pile 2 6800 0.34 J 3 66 0.65 0.12 J 1200 16 B 9.9 15 14000 12 2000 110 0.028 J 18 870 ND ND 79 J 18 47
SB-8 SB-8-(11-13) 11-13 feet 11/11/2015 Northwest of Soil Pile 2 8300 ND 2.3 120 0.32 J 0.045 J 27000 14 B 6.1 19 12000 29 4200 190 0.014 J 11 1800 ND ND 190 J 24 33
SB-8 SB-8D-(11-13) 11-13 feet 11/11/2015 Northwest of Soil Pile 2 8300 ND 2.7 93 B 0.32 J 0.044 J 24000 14 B 6 13 11000 25 3700 170 0.044 11 1900 0.45 J ND 180 J 22 32
SB-9 SB-9(1-3) 1-3 feet 11/11/2015 North-northeast of Soil Pile 2 6400 J ND UJ- 6.3 64 J+ 0.5 0.078 J 14000 J- 16 J+ 7.1 17 J+ 22000 J 45 J+ 2900 J- 790 B 0.071 23 710 0.52 J ND 150 J 24 50 J+
SB-9 SB-9-(12-14) 12-14 feet 11/11/2015 North-northeast of Soil Pile 2 8300 1.2 7.9 53 B 1.2 ND 8800 22 18 49 34000 B 76 1700 480 B 2.1 130 1500 0.62 J ND 74 J 40 53
SB-10 SB-10- (1-3) 1-3 feet 11/11/2015 East of Soil Pile 2 11000 ND 5.3 38 B 0.61 ND 2100 14 B 12 13 22000 B 21 1700 110 B 0.1 15 1500 0.51 J ND 50 J 24 52 B
SB-10 SB-10-(8-10) 8-10 feet 11/11/2015 East of Soil Pile 2 12000 ND 3.7 98 B 0.95 ND 7400 20 B 9.9 14 15000 B 22 1800 130 B 0.057 15 970 ND ND 75 J 32 36 B
SB-11 SB-11-(1-3) 1-3 feet 11/11/2015 South-southeast of Soil Pile 2 5000 ND 4.2 61 B 0.37 J 0.03 J 3800 48 B 13 13 15000 B 100 7900 120 B 0.12 170 570 0.51 J ND 54 J 24 60 B
TABLE 4: SOIL SAMPLE ANALYTICAL RESULTS METALS
KINGMAN ISLANDWASHINGTON, DC
Boring ID
Metals (mg/kg) by EPA Method 6010C and 7471B
Date Collected
Boring LocationSample ID Sample Depth

Alum
inum
Antim
ony
Arse
nic
Bariu
m
Bery
llium
Cad
miu
m
Cal
cium
Chr
omiu
m
Cob
alt
Cop
per
Iron
Lead
Mag
nesi
um
Man
gane
se
Mer
cury
Nic
kel
Pota
ssiu
m
Sele
nium
Silv
er
Sodi
um
Vana
dium
Zinc
Boring ID
Metals (mg/kg) by EPA Method 6010C and 7471B
Date Collected
Boring LocationSample ID Sample Depth
SB-11 SB-11-(8-10) 8-10 feet 11/11/2015 South-southeast of Soil Pile 2 3600 ND 8.1 3500 B 0.48 1.5 23000 24 B 5.3 J 210 10000 B 400 2500 100 B 1.3 13 390 J 0.57 J ND 180 J 14 2400B
SB-12 SB-12-(1-3) 1-3 feet 11/11/2015 South of Soil Pile 2 7600 ND 5.5 94 B 0.78 0.13 J 14000 21 B 14 22 19000 B 85 8400 270 B ND 63 720 0.67 J ND 140 J 25 130 B
SB-12 SB-12-(8-10) 8-10 feet 11/11/2015 South of Soil Pile 2 14000 0.43 J 8.9 46 B 0.5 ND 1000 19 B 6.3 16 27000 B 19 770 77 B 0.046 9.3 1000 0.42 J ND 69 J 35 33 B
SB-13 SB-13-(1-3) 1-3 feet 11/11/2015 North of Soil Pile 3 8300 0.61 J 5.3 67 B 0.59 0.42 J 2600 23 B 8.5 30 16000 B 82 2900 230 B 0.11 22 1400 ND 0.54 87 J 28 130 B
SB-13 SB-13-(13-15) 8-10 feet 11/11/2015 North of Soil Pile 3 6200 0.79 J 7.1 150 B 0.96 0.68 3100 26 B 9.9 51 43000 B 370 1000 130 B 0.29 23 600 0.95 J ND 260 J 72 270 B
SB-14 SB-14-(1-3) 1-3 feet 11/12/2015 Northeast of Soil Pile 3 9200 0.93 J 4.5 63 0.48 0.19 J 5900 49 11 72 25000 100 4000 200 0.065 35 1200 ND 3.4 87 J 36 81
SB-14 SB-14-(13-15) 13-15 feet 11/12/2015 Northeast of Soil Pile 3 7600 0.42 J 4 33 0.7 ND 24000 18 16 49 27000 68 2100 240 0.062 31 1400 0.58 J ND 100 J 35 110
SB-15 SB-15-(1-3) 1-3 feet 11/12/2015 Southwest of Soil Pile 3 4300 0.58 J- 2.3 59 0.86 0.28 J 6000 J- 12 12 26 J- 22000 51 J- 1400 470 0.031 J 16 690 ND 0.41 J- 270 J 27 140 J-
SB-15 SB-15-(12-14) 12-14 feet 11/12/2015 Southwest of Soil Pile 3 3700 0.65 J 1.4 140 0.82 0.46 J 3000 19 7.9 28 12000 110 1200 330 0.25 11 760 ND 0.5 J 720 11 120
SB-16 SB-16-(1-3) 1-3 feet 11/12/2015 Center of Soil Pile 3 4000 0.43 J 1.1 J 66 0.92 0.27 J 18000 11 13 24 27000 79 1600 610 0.043 16 930 0.47 J 0.47 J 300 J 21 94
SB-16 SB-16-(7-9) 7-9 feet 11/12/2015 Center of Soil Pile 3 5900 0.79 J 3.1 59 0.8 0.33 J 2400 23 13 22 20000 41 1700 280 0.084 20 840 ND 0.27 J 480 J 26 150
SB-17 SB-17-(1-3) 1-3 feet 11/11/2015 Southeastern portion of Soil Pile 3 9900 3.9 5.4 95 B 0.56 1.2 20000 29 B 10 48 25000 B 710 4100 300 B 0.34 51 860 0.68 J 2 370 J 26 220 B
SB-17 SB-17-(17-19) 17-19 feet 11/11/2015 Southeastern portion of Soil Pile 3 6700 ND 1.5 80 B 0.5 ND 720 9.7 B 9 9.5 10000 B 16 1000 35 B 0.019 J 13 890 ND ND 130 J 13 39 B
SB-17 SB-17D-(17-19) 17-19 feet 11/11/2015 Southeastern portion of Soil Pile 3 7400 ND 5.9 88 B 0.64 0.061 J 12000 20 B 8.1 23 22000 B 76 1400 120 B 0.062 12 1100 0.94 J ND 420 J 40 67 B
SB-18 SB-18-(1-3) 1-3 feet 11/11/2015 Eastern portion of Soil Pile 3 6000 0.8 J 3.1 43 B 0.71 0.61 2600 16 B 14 32 19000 B 65 1700 220 B 0.13 23 1000 ND 1.5 410 J 22 130 B
SB-18 SB-18-(13-15) 13-15 feet 11/11/2015 Eastern portion of Soil Pile 3 7500 ND 5.9 55 B 0.47 ND 5100 14 B 5.1 J 29 17000 B 64 1100 250 B 0.16 6.3 660 0.72 J ND 160 J 29 57 B
7700 3.1 0.68 1500 16 7.1 NS NS 2.3 310 5500 400 NS 180 1.2 NS NS 39 39 NS 39 2300
110000 47 3 22000 230 98 NS NS 35 4700 82000 800 NS 2600 4.6 NS NS 580 580 NS 580 35000
mg/kg - Milligrams per kilogram
UJ- Esimated Non-detected Concentration
J + - Estimated Concentration, bias high
EPA Residential Soil RSL*
RSL - Regional Screening LevelRBSL - Risk-Based Screening LevelNS - No Standard
EPA Industrial Soil RSL*
Notes:
* Regulatory values obtained from the EPA Region 3 RSLs for Industrial Soil and Residential Soil (target hazard quotient of 0.1), dated November 2015. No regulatory values for metals are available from the DOEE.
Bold results indicate the sample was above regulatory limitsDOEE - Washington DC Department of Energy & Environment
ND - Not Detected at or above the Laboratory Detection Limit
J - Estimated Concentration
Only detected analytes are presented
J - - Estimated Concentration, bias low
EPA - United States Environmental Protection Agency
PC
B-1
242
PC
B-1
260
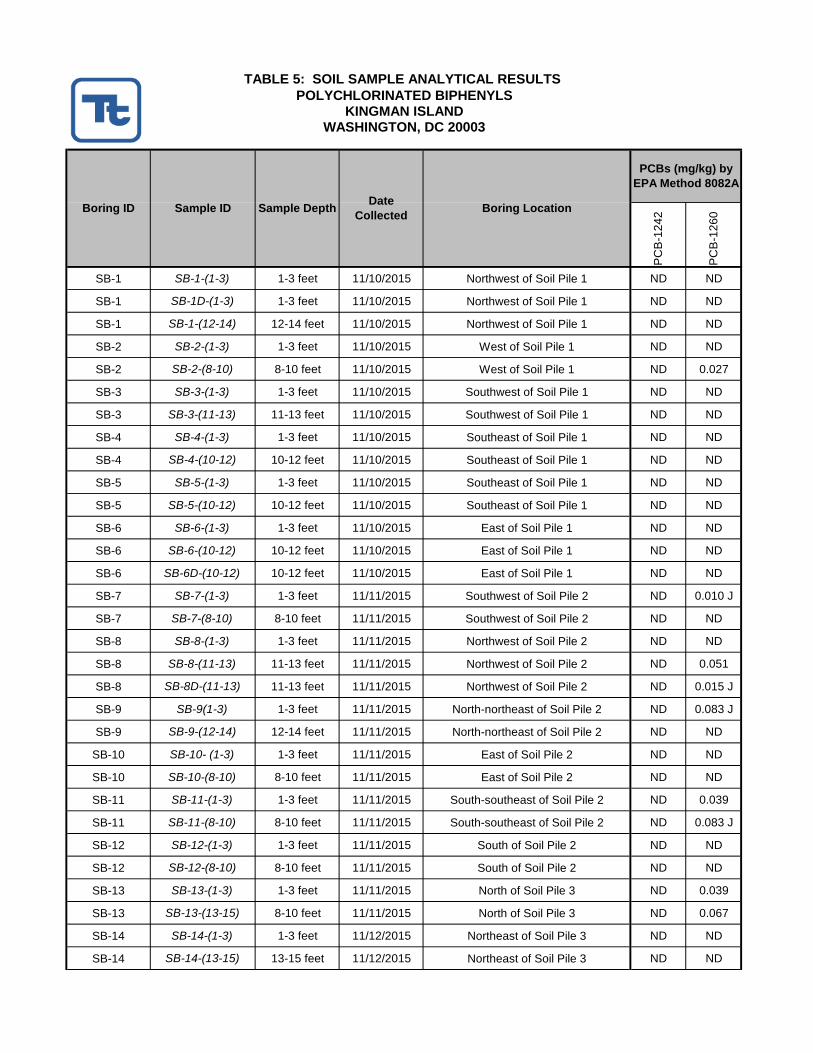
SB-1 SB-1-(1-3) 1-3 feet 11/10/2015 Northwest of Soil Pile 1 ND ND
SB-1 SB-1D-(1-3) 1-3 feet 11/10/2015 Northwest of Soil Pile 1 ND ND
SB-1 SB-1-(12-14) 12-14 feet 11/10/2015 Northwest of Soil Pile 1 ND ND
SB-2 SB-2-(1-3) 1-3 feet 11/10/2015 West of Soil Pile 1 ND ND
SB-2 SB-2-(8-10) 8-10 feet 11/10/2015 West of Soil Pile 1 ND 0.027
SB-3 SB-3-(1-3) 1-3 feet 11/10/2015 Southwest of Soil Pile 1 ND ND
SB-3 SB-3-(11-13) 11-13 feet 11/10/2015 Southwest of Soil Pile 1 ND ND
SB-4 SB-4-(1-3) 1-3 feet 11/10/2015 Southeast of Soil Pile 1 ND ND
SB-4 SB-4-(10-12) 10-12 feet 11/10/2015 Southeast of Soil Pile 1 ND ND
SB-5 SB-5-(1-3) 1-3 feet 11/10/2015 Southeast of Soil Pile 1 ND ND
SB-5 SB-5-(10-12) 10-12 feet 11/10/2015 Southeast of Soil Pile 1 ND ND
SB-6 SB-6-(1-3) 1-3 feet 11/10/2015 East of Soil Pile 1 ND ND
SB-6 SB-6-(10-12) 10-12 feet 11/10/2015 East of Soil Pile 1 ND ND
SB-6 SB-6D-(10-12) 10-12 feet 11/10/2015 East of Soil Pile 1 ND ND
SB-7 SB-7-(1-3) 1-3 feet 11/11/2015 Southwest of Soil Pile 2 ND 0.010 J
SB-7 SB-7-(8-10) 8-10 feet 11/11/2015 Southwest of Soil Pile 2 ND ND
SB-8 SB-8-(1-3) 1-3 feet 11/11/2015 Northwest of Soil Pile 2 ND ND
SB-8 SB-8-(11-13) 11-13 feet 11/11/2015 Northwest of Soil Pile 2 ND 0.051
SB-8 SB-8D-(11-13) 11-13 feet 11/11/2015 Northwest of Soil Pile 2 ND 0.015 J
SB-9 SB-9(1-3) 1-3 feet 11/11/2015 North-northeast of Soil Pile 2 ND 0.083 J
SB-9 SB-9-(12-14) 12-14 feet 11/11/2015 North-northeast of Soil Pile 2 ND ND
SB-10 SB-10- (1-3) 1-3 feet 11/11/2015 East of Soil Pile 2 ND ND
SB-10 SB-10-(8-10) 8-10 feet 11/11/2015 East of Soil Pile 2 ND ND
SB-11 SB-11-(1-3) 1-3 feet 11/11/2015 South-southeast of Soil Pile 2 ND 0.039
SB-11 SB-11-(8-10) 8-10 feet 11/11/2015 South-southeast of Soil Pile 2 ND 0.083 J
SB-12 SB-12-(1-3) 1-3 feet 11/11/2015 South of Soil Pile 2 ND ND
SB-12 SB-12-(8-10) 8-10 feet 11/11/2015 South of Soil Pile 2 ND ND
SB-13 SB-13-(1-3) 1-3 feet 11/11/2015 North of Soil Pile 3 ND 0.039
SB-13 SB-13-(13-15) 8-10 feet 11/11/2015 North of Soil Pile 3 ND 0.067
SB-14 SB-14-(1-3) 1-3 feet 11/12/2015 Northeast of Soil Pile 3 ND ND
SB-14 SB-14-(13-15) 13-15 feet 11/12/2015 Northeast of Soil Pile 3 ND ND
TABLE 5: SOIL SAMPLE ANALYTICAL RESULTS POLYCHLORINATED BIPHENYLS
KINGMAN ISLANDWASHINGTON, DC 20003
Boring ID Sample ID
PCBs (mg/kg) by EPA Method 8082A
Date Collected
Sample Depth Boring Location

PC
B-1
242
PC
B-1
260Boring ID Sample ID
PCBs (mg/kg) by EPA Method 8082A
Date Collected
Sample Depth Boring Location
SB-15 SB-15-(1-3) 1-3 feet 11/12/2015 Southwest of Soil Pile 3 0.094 0.076
SB-15 SB-15-(12-14) 12-14 feet 11/12/2015 Southwest of Soil Pile 3 ND ND
SB-16 SB-16-(1-3) 1-3 feet 11/12/2015 Center of Soil Pile 3 ND ND
SB-16 SB-16-(7-9) 7-9 feet 11/12/2015 Center of Soil Pile 3 ND ND
SB-17 SB-17-(1-3) 1-3 feet 11/11/2015 Southeastern portion of Soil Pile 3 ND 0.061
SB-17 SB-17-(17-19) 17-19 feet 11/11/2015 Southeastern portion of Soil Pile 3 ND ND
SB-17 SB-17D-(17-19) 17-19 feet 11/11/2015 Southeastern portion of Soil Pile 3 ND ND
SB-18 SB-18-(1-3) 1-3 feet 11/11/2015 Eastern portion of Soil Pile 3 ND 0.095 J
SB-18 SB-18-(13-15) 13-15 feet 11/11/2015 Eastern portion of Soil Pile 3 ND ND
0.23 0.24
0.95 0.99
Notes:
mg/kg - Milligrams per kilogramND - Not Detected at or above the Laboratory Detection Limit NS - No Standard
RBSL - Risk-Based Screening LevelRSL - Regional Screening Level
EPA Residential Soil RSL*
EPA Industrial Soil RSL*Only detected analytes are presented
J - - Estimated Concentration, bias lowJ + - Estimated Concentration, bias high
PCBs - Polychlorinated Biphenyls
* Regulatory values obtained from the EPA Region 3 RSLs for Industrial Soil and Residential Soil (target hazard quotient of 0.1), dated November 2015. No regulatory values for PCBs are available from the DOEE.
EPA - United States Environmental Protection AgencyJ - Estimated Concentration
Bold results indicate the sample was above regulatory limitsDOEE - Washington DC Department of Energy & Environment
2-B
utan
one
(ME
K)
2-H
exan
one
Ace
tone
Ben
zene
Car
bon
disu
lfide
cis-
1,2-
Dic
hlor
oeth
ene
Tolu
ene
Vin
yl c
hlor
ide
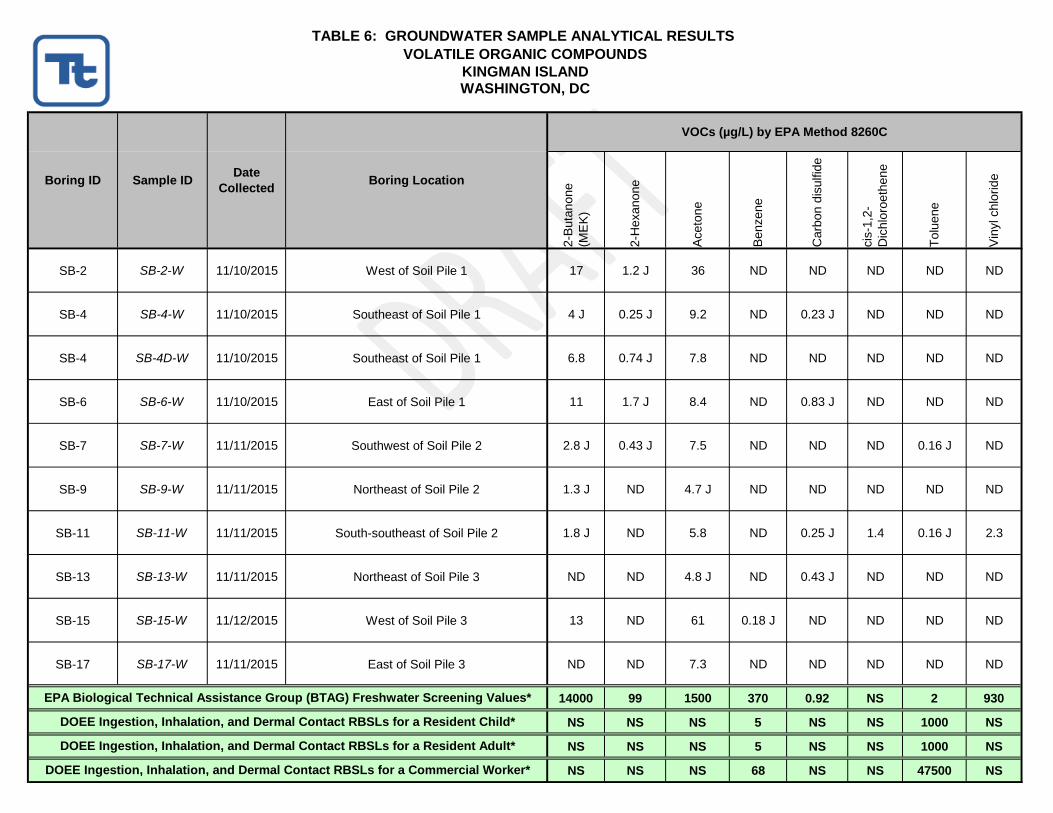
SB-2 SB-2-W 11/10/2015 West of Soil Pile 1 17 1.2 J 36 ND ND ND ND ND
SB-4 SB-4-W 11/10/2015 Southeast of Soil Pile 1 4 J 0.25 J 9.2 ND 0.23 J ND ND ND
SB-4 SB-4D-W 11/10/2015 Southeast of Soil Pile 1 6.8 0.74 J 7.8 ND ND ND ND ND
SB-6 SB-6-W 11/10/2015 East of Soil Pile 1 11 1.7 J 8.4 ND 0.83 J ND ND ND
SB-7 SB-7-W 11/11/2015 Southwest of Soil Pile 2 2.8 J 0.43 J 7.5 ND ND ND 0.16 J ND
SB-9 SB-9-W 11/11/2015 Northeast of Soil Pile 2 1.3 J ND 4.7 J ND ND ND ND ND
SB-11 SB-11-W 11/11/2015 South-southeast of Soil Pile 2 1.8 J ND 5.8 ND 0.25 J 1.4 0.16 J 2.3
SB-13 SB-13-W 11/11/2015 Northeast of Soil Pile 3 ND ND 4.8 J ND 0.43 J ND ND ND
SB-15 SB-15-W 11/12/2015 West of Soil Pile 3 13 ND 61 0.18 J ND ND ND ND
SB-17 SB-17-W 11/11/2015 East of Soil Pile 3 ND ND 7.3 ND ND ND ND ND
14000 99 1500 370 0.92 NS 2 930
NS NS NS 5 NS NS 1000 NS
NS NS NS 5 NS NS 1000 NS
NS NS NS 68 NS NS 47500 NS
Boring LocationSample IDBoring ID
TABLE 6: GROUNDWATER SAMPLE ANALYTICAL RESULTS
KINGMAN ISLANDWASHINGTON, DC
VOLATILE ORGANIC COMPOUNDS
VOCs (µg/L) by EPA Method 8260C
Date Collected
DOEE Ingestion, Inhalation, and Dermal Contact RBSLs for a Resident Child*
DOEE Ingestion, Inhalation, and Dermal Contact RBSLs for a Resident Adult*
EPA Biological Technical Assistance Group (BTAG) Freshwater Screening Values*
DOEE Ingestion, Inhalation, and Dermal Contact RBSLs for a Commercial Worker*
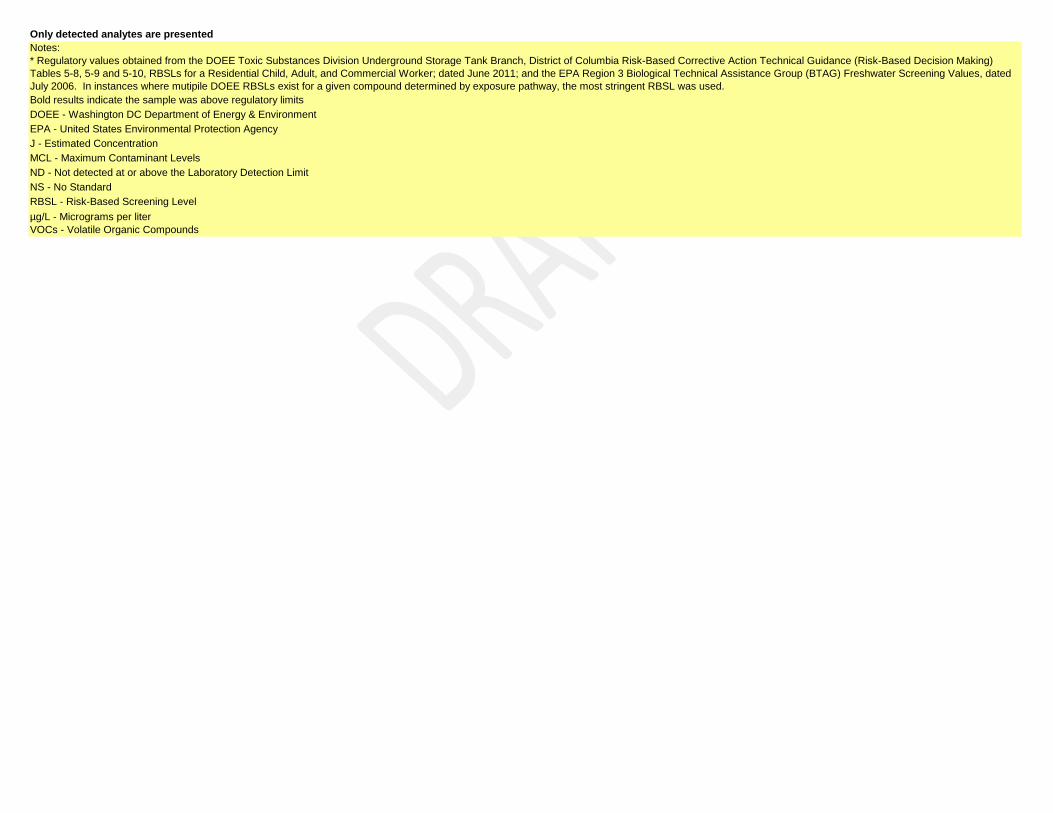
µg/L - Micrograms per liter
EPA - United States Environmental Protection AgencyJ - Estimated Concentration
ND - Not detected at or above the Laboratory Detection Limit NS - No Standard
VOCs - Volatile Organic Compounds
RBSL - Risk-Based Screening Level
MCL - Maximum Contaminant Levels
Only detected analytes are presentedNotes:
DOEE - Washington DC Department of Energy & Environment
* Regulatory values obtained from the DOEE Toxic Substances Division Underground Storage Tank Branch, District of Columbia Risk-Based Corrective Action Technical Guidance (Risk-Based Decision Making) Tables 5-8, 5-9 and 5-10, RBSLs for a Residential Child, Adult, and Commercial Worker; dated June 2011; and the EPA Region 3 Biological Technical Assistance Group (BTAG) Freshwater Screening Values, dated July 2006. In instances where mutipile DOEE RBSLs exist for a given compound determined by exposure pathway, the most stringent RBSL was used. Bold results indicate the sample was above regulatory limits

Acen
apht
hene
Acen
apht
hyle
ne
Anth
race
ne
Benz
o[a]
anth
race
ne
Benz
o[a]
pyre
ne
Benz
o[b]
fluor
anth
ene
Benz
o[g,
h,i]p
eryl
ene
Benz
o[k]
fluor
anth
ene
Chr
ysen
e
Dib
enz(
a,h)
anth
race
n
Fluo
rant
hene
Fluo
rene
Inde
no[1
,2,3
-cd
]pyr
ene
Nap
htha
lene
Phen
anth
rene
Pyre
ne
SB-2 SB-2-W 11/10/2015 West of Soil Pile 1 15 1.4 22 25 20 22 11 8.7 23 3.9 49 11 11 3.3 37 32
SB-4 SB-4-W 11/10/2015 Southeast of Soil Pile 1 0.13 J ND 0.16 J 0.45 0.48 0.42 0.43 0.19 0.57 0.11 J 0.87 0.1 J 0.31 0.16 J 0.46 UJ 0.59
SB-4 SB-4D-W 11/10/2015 Southeast of Soil Pile 1 0.11 J ND 0.14 J 0.33 0.35 0.43 0.29 0.11 J 0.4 0.11 J 0.66 0.1 J 0.28 0.17 J 0.42 0.49
SB-6 SB-6-W 11/10/2015 East of Soil Pile 1 2.4 2.2 4.2 5.2 5.4 9.2 5 3.1 8.8 1.2 30 2.5 4.4 2.4 29 15
SB-7 SB-7-W 11/11/2015 Southwest of Soil Pile 2 0.17 J ND 0.19 0.27 0.24 0.23 0.18 J 0.16 J 0.29 ND 0.76 0.13 J 0.18 J 0.19 0.63 0.51
SB-9 SB-9-W 11/11/2015 Northeast of Soil Pile 2 0.38 0.23 0.48 0.85 0.78 1.1 0.61 0.4 1 0.2 2.2 0.39 0.55 1.2 1.3 1.4
SB-11 SB-11-W 11/11/2015 South-southeast of Soil Pile 2 9.7 2.4 24 52 43 54 30 18 49 9.1 120 12 29 12 81 65
SB-13 SB-13-W 11/11/2015 Northeast of Soil Pile 3 ND ND 1.1 J ND ND ND ND ND ND ND 3.6 J ND ND ND 1.7 J 2.9 J
SB-15 SB-15-W 11/12/2015 West of Soil Pile 3 0.58 J 0.42 J 0.83 2.5 2.3 2.5 1.5 1.4 2.5 0.43 J 4.4 0.75 J 1.3 1.5 3.2 4.2
SB-17 SB-17-W 11/11/2015 East of Soil Pile 3 1.5 J 1.1 J 2.6 J 8.1 7.1 8.8 5.5 2.7 J 8.2 ND 18 1.4 J 5.9 2.9 8.8 12
5.8 NS 0.012 0.018 0.015 NS NS NS NS NS 0.04 3 NS 1.1 0.4 0.025
NS NS NS 0.143 0.00281 0.0276 40.8 0.293 2.93 NS 300 626 NS 1.07 409 255
NS NS NS 0.0274 0.00161 0.0158 93.6 0.0785 0.785 NS 687 1460 NS 0.268 938 585
NS NS NS 0.0636 0.00374 0.0368 226 0.526 6 NS 1,660 5,830 NS 5,690 2,270 1,420
POLYCYCLIC AROMATIC HYDROCARBONS
EPA Biological Technical Assistance Group (BTAG) Freshwater Screening Values*
DOEE Ingestion, Inhalation, and Dermal Contact RBSLs for a Resident Child*
Date Collected
Boring ID Sample ID Boring Location
PAH (µg/L) by EPA Method 8270D LL
DOEE Ingestion, Inhalation, and Dermal Contact RBSLs for a Commercial Worker*
TABLE 7: GROUNDWATER SAMPLE ANALYTICAL RESULTS
KINGMAN ISLANDWASHINGTON, DC
DOEE Ingestion, Inhalation, and Dermal Contact RBSLs for a Resident Adult*

MCL - Maximum Contaminant Levels
PAHs - Polycyclic Aromatic Hydrocarbons
µg/L - micrograms per liter
EPA - United States Environmental Protection Agency
Bold results indicate the sample was above regulatory limits
Only detected analytes are presentedNotes:
ND - Not Detected at or above the Laboratory Detection Limit
J - Estimated Concentration
NS - No Standard
RBSL - Risk-Based Screening Level
UJ - Esimated Non-detected concentration
* Regulatory values obtained from the DOEE Toxic Substances Division Underground Storage Tank Branch, District of Columbia Risk-Based Corrective Action Technical Guidance (Risk-Based Decision Making) Tables 5-8, 5-9 and 5-10, RBSLs for a Residential Child, Adult, and Commercial Worker; dated June 2011; and the EPA Region 3 Biological Technical Assistance Group (BTAG) Freshwater Screening Values, dated July 2006. In instances where mutipile DOEE RBSLs exist for a given compound determined by
DOEE - Washington DC Department of Energy & Environment
LL - Low Level

Die
sel R
ange
O
rgan
ics
[C10
- C
28]
Gas
olin
e R
ange
O
rgan
ics
[C6
- C
10]
Oil
Ran
ge
Org
anic
s (C
28-
C40
)
SB-2 SB-2-W 11/10/2015 West of Soil Pile 1 2600 40 UJ 550
SB-4 SB-4-W 11/10/2015 Southeast of Soil Pile 1 860 44 UJ ND
SB-4 SB-4D-W 11/10/2015 Southeast of Soil Pile 1 960 2.8 UJ ND
SB-6 SB-6-W 11/10/2015 East of Soil Pile 1 2500 42 UJ 460 J
SB-7 SB-7-W 11/11/2015 Southwest of Soil Pile 2 2000 47 UJ 750
SB-9 SB-9-W 11/11/2015 Northeast of Soil Pile 2 1100 62 UJ 280 J
SB-11 SB-11-W 11/11/2015 South-southeast of Soil Pile 2 2000 41 UJ 460 J
SB-13 SB-13-W 11/11/2015 Northeast of Soil Pile 3 1300 43 UJ ND
SB-15 SB-15-W 11/12/2015 West of Soil Pile 3 8900 54 J 2300
SB-17 SB-17-W 11/11/2015 East of Soil Pile 3 3000 38 UJ 700
NS NS NS
313 313 469
438 438 1,100
369000 1330000 NS
µg/L - micrograms per liter
NS - No StandardRBSL - Risk-Based Screening Level
UJ- Esimated Non-detected concentration
EPA - United States Environmental Protection AgencyJ - Estimated ConcentrationMCL - Maximum Contaminant LevelsND - Not Detected at or above the Laboratory Detection Limit
TPH - Total Petroleum Hydrocarbons
TABLE 8: GROUNDWATER SAMPLE ANALYTICAL RESULTS
KINGMAN ISLAND
EPA Biological Technical Assistance Group (BTAG) Freshwater Screening Values*
DOEE Ingestion, Inhalation, and Dermal Contact RBSLs for a Resident Child*
DOEE Ingestion, Inhalation, and Dermal Contact RBSLs for a Resident Adult*
Only detected analytes are presented
WASHINGTON, DC
TOTAL PETROLEUM HYDROCARBONS
DOEE - Washington DC Department of Energy & Environment
* Regulatory values obtained from the DOEE Toxic Substances Division Underground Storage Tank Branch, District of Columbia Risk-Based Corrective Action Technical Guidance (Risk-Based Decision Making) Tables 5-8, 5-9 and 5-10, RBSLs for a Residential Child, Adult, and Commercial Worker; dated June 2011; and the EPA Region 3 Biological Technical Assistance Group (BTAG) Freshwater Screening Values, dated July 2006. In instances where mutipile DOEE RBSLs exist for a given compound determined by exposure pathway, the most stringent RBSL was used.
Boring ID Sample ID Boring Location
TPH (µg/L) by EPA Method 8015D
Notes:
Date Collected
Bold results indicate the sample was above regulatory limits
DOEE Ingestion, Inhalation, and Dermal Contact RBSLs for a Commercial Worker*
Alu
min
um
Ant
imon
y
Ars
enic
Bar
ium
Ber
ylliu
m
Cad
miu
m
Cal
cium
Chr
omiu
m
Cob
alt
Cop
per
Iron
Lead
Mag
nesi
um
Man
gane
se
Mer
cury
Nic
kel
Pot
assi
um
Sel
eniu
m
Silv
er
Sod
ium
Thal
lium
Van
adiu
m
Zinc
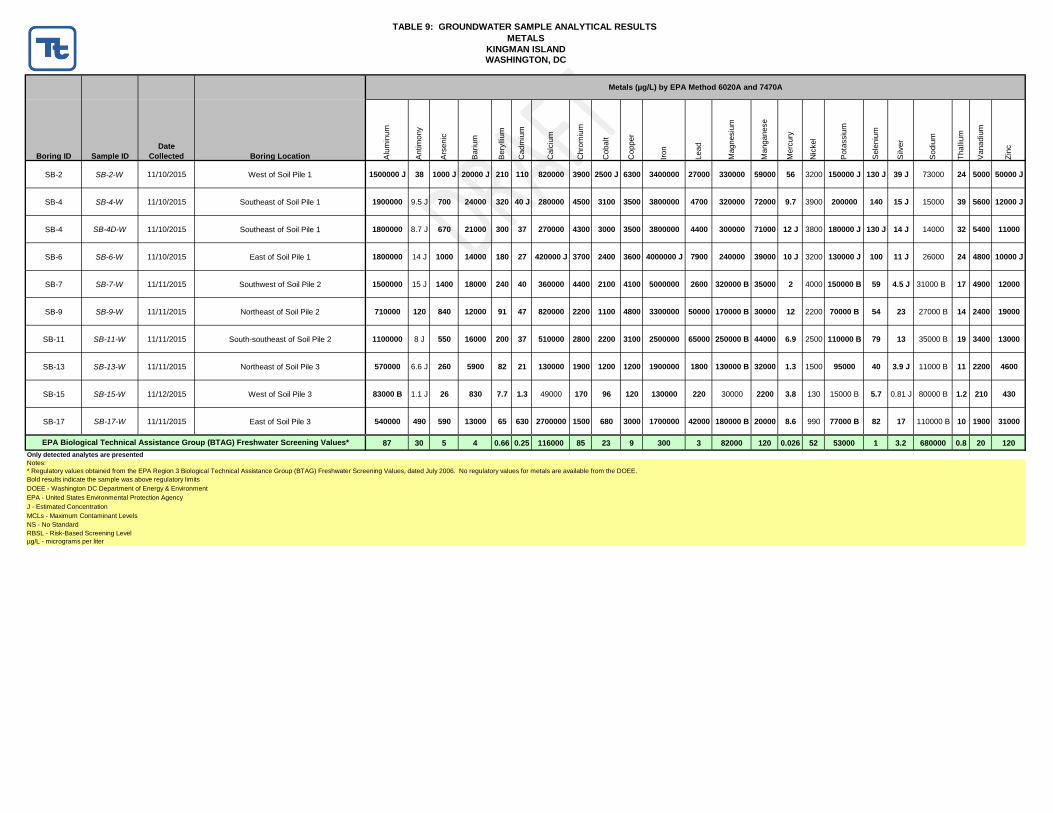
SB-2 SB-2-W 11/10/2015 West of Soil Pile 1 1500000 J 38 1000 J 20000 J 210 110 820000 3900 2500 J 6300 3400000 27000 330000 59000 56 3200 150000 J 130 J 39 J 73000 24 5000 50000 J
SB-4 SB-4-W 11/10/2015 Southeast of Soil Pile 1 1900000 9.5 J 700 24000 320 40 J 280000 4500 3100 3500 3800000 4700 320000 72000 9.7 3900 200000 140 15 J 15000 39 5600 12000 J
SB-4 SB-4D-W 11/10/2015 Southeast of Soil Pile 1 1800000 8.7 J 670 21000 300 37 270000 4300 3000 3500 3800000 4400 300000 71000 12 J 3800 180000 J 130 J 14 J 14000 32 5400 11000
SB-6 SB-6-W 11/10/2015 East of Soil Pile 1 1800000 14 J 1000 14000 180 27 420000 J 3700 2400 3600 4000000 J 7900 240000 39000 10 J 3200 130000 J 100 11 J 26000 24 4800 10000 J
SB-7 SB-7-W 11/11/2015 Southwest of Soil Pile 2 1500000 15 J 1400 18000 240 40 360000 4400 2100 4100 5000000 2600 320000 B 35000 2 4000 150000 B 59 4.5 J 31000 B 17 4900 12000
SB-9 SB-9-W 11/11/2015 Northeast of Soil Pile 2 710000 120 840 12000 91 47 820000 2200 1100 4800 3300000 50000 170000 B 30000 12 2200 70000 B 54 23 27000 B 14 2400 19000
SB-11 SB-11-W 11/11/2015 South-southeast of Soil Pile 2 1100000 8 J 550 16000 200 37 510000 2800 2200 3100 2500000 65000 250000 B 44000 6.9 2500 110000 B 79 13 35000 B 19 3400 13000
SB-13 SB-13-W 11/11/2015 Northeast of Soil Pile 3 570000 6.6 J 260 5900 82 21 130000 1900 1200 1200 1900000 1800 130000 B 32000 1.3 1500 95000 40 3.9 J 11000 B 11 2200 4600
SB-15 SB-15-W 11/12/2015 West of Soil Pile 3 83000 B 1.1 J 26 830 7.7 1.3 49000 170 96 120 130000 220 30000 2200 3.8 130 15000 B 5.7 0.81 J 80000 B 1.2 210 430
SB-17 SB-17-W 11/11/2015 East of Soil Pile 3 540000 490 590 13000 65 630 2700000 1500 680 3000 1700000 42000 180000 B 20000 8.6 990 77000 B 82 17 110000 B 10 1900 31000
87 30 5 4 0.66 0.25 116000 85 23 9 300 3 82000 120 0.026 52 53000 1 3.2 680000 0.8 20 120
DOEE - Washington DC Department of Energy & Environment
METALS
Boring ID
Metals (µg/L) by EPA Method 6020A and 7470A
Notes:
J - Estimated Concentration
EPA Biological Technical Assistance Group (BTAG) Freshwater Screening Values*
EPA - United States Environmental Protection Agency
RBSL - Risk-Based Screening LevelNS - No Standard
µg/L - micrograms per liter
MCLs - Maximum Contaminant Levels
TABLE 9: GROUNDWATER SAMPLE ANALYTICAL RESULTS
KINGMAN ISLANDWASHINGTON, DC
* Regulatory values obtained from the EPA Region 3 Biological Technical Assistance Group (BTAG) Freshwater Screening Values, dated July 2006. No regulatory values for metals are available from the DOEE.
Sample ID
Bold results indicate the sample was above regulatory limits
Date Collected
Only detected analytes are presented
Boring Location

PCBs (µg/L) by EPA Method 8082A
PCB-1260
SB-2 SB-2-W 11/10/2015 West of Soil Pile 1 ND
SB-4 SB-4-W 11/10/2015 Southeast of Soil Pile 1 ND
SB-4 SB-4D-W 11/10/2015 Southeast of Soil Pile 1 ND
SB-6 SB-6-W 11/10/2015 East of Soil Pile 1 ND
SB-7 SB-7-W 11/11/2015 Southwest of Soil Pile 2 2.5
SB-9 SB-9-W 11/11/2015 Northeast of Soil Pile 2 ND
SB-11 SB-11-W 11/11/2015 South-southeast of Soil Pile 2 ND
SB-13 SB-13-W 11/11/2015 Northeast of Soil Pile 3 ND
SB-15 SB-15-W 11/12/2015 West of Soil Pile 3 0.35 J+
SB-17 SB-17-W 11/11/2015 East of Soil Pile 3 0.47
0.000074
Notes:
ND - Not Detected at or above the Laboratory Detection Limit NS - No StandardPCBs - Polychlorinated Biphenyls
µg/L - micrograms per liter
TABLE 10: GROUNDWATER SAMPLE ANALYTICAL RESULTS POLYCHLORINATED BIPHENYLS
KINGMAN ISLANDWASHINGTON, DC
J + - Estimated Concentration with high bias
Boring Location
EPA Biological Technical Assistance Group (BTAG) Freshwater Screening Values*
* Regulatory values obtained from the EPA Region 3 Biological Technical Assistance Group (BTAG) Freshwater Screening Values, dated July 2006. No regulatory values for PCBs are available from the DOEE.
DOEE - Washington DC Department of Energy & Environment
MCLs - Maximum Contaminant Levels
EPA - United States Environmental Protection Agency
RBSL - Risk-Based Screening Level
Boring ID Sample ID
Bold results indicate the sample was above regulatory limits
Only detected analytes are presented
Date Collected

PCBs (mg/kg) by EPA Method 8082A
Die
sel R
ange
O
rgan
ics
[C10
- C
28]
Gas
olin
e R
ange
O
rgan
ics
[C6
- C10
]
Oil
Ran
ge O
rgan
ics
(C28
-C40
)
PC
B-1
260
I gni
tabi
lity
Ph
(Sta
ndar
d U
nits
)
Sul
fide
(mg/
kg)
Per
cent
Mos
iture
(%)
Per
cent
Sol
ids
(%)
Soil Pile 1 11/10/2015 SOIL COMP 1 24 0.060 J 59 ND No 7.35 15 J 13 87
Soil Pile 2 11/11/2015 SOIL COMP 2 97 ND 120 0.027 No 7.73 ND 12 88
Soil Pile 3 11/12/2015 SOIL COMP 3 29 ND 52 0.32 No 7.73 28 J 22 78
11 8 250 0.24 NS NS NS NS NS
60 42 3300 0.99 NS NS NS NS NS
1870 3690 1870 NS NS NS NS NS NS
NS 32800 NS NS NS NS NS NS NS
NS 45000 NS NS NS NS NS NS NS
15500 45000 15500 NS NS NS NS NS NS
NS 45000 NS NS NS NS NS NS NS
NS 63000 NS NS NS NS NS NS NS
mg/kg - Milligrams per kilogram
PCBs - Polychlorinated Biphenyls
TABLE 11: TEST PIT SAMPLE ANALYTICAL RESULTS DETECTION SUMMARY
KINGMAN ISLANDWASHINGTON, DC
EPA Industrial Soil RSL*
Notes:
General Chemistry by EPA Method 9045D, 9014 and 9034
TPH (mg/kg) by EPA Method 8015D
DOEE Surficial Soil Ingestion, Inhalation, and Dermal Contact RBSLs for a Resident Adult*
RBSL - Risk-Based Screening Level
Sample IDBoring ID
DOEE Surficial Soil Ingestion, Inhalation, and Dermal Contact RBSLs for a Resident Child*
DOEE - Washington DC Department of Energy & Environment
Only detected analytes are presented
EPA Residential Soil RSL*
J - Estimated Concentration
Date Collected
DOEE Subsurface Soil Outdoor Inhalation RBSLs for a Resident Adult*
* Regulatory values obtained from the DOEE Toxic Substances Division Underground Storage Tank Branch, District of Columbia Risk-Based Corrective Action Technical Guidance (Risk-Based Decision Making) Tables 5-8, 5-9, and 5-10, RBSLs for a Residential Child, Adult, and Commercial Worker, dated June 2011; and the EPA Region 3 RSLs for Industrial Soil and Residential Soil (target hazard quotient of 0.1), dated November 2015.
TPH - Total Petroleum Hydrocarbons
EPA - United States Environmental Protection Agency
ND - Not Detected at or above the Laboratory Detection Limit NS - No Standard
DOEE Surficial Soil Ingestion, Inhalation, and Dermal Contact RBSLs for a Commercial Worker*
DOEE Subsurface Soil Outdoor Inhalation RBSLs for a Commercial Worker*
Bold results indicate the sample was above regulatory limits
RSL - Regional Screening Level
DOEE Subsurface Soil Outdoor Inhalation RBSLs for a Resident Child*

Ars
enic
Bar
ium
Cad
miu
m
Chr
omiu
m
Lead
Sel
eniu
m
Soil Pile 1 11/10/2015 SOIL COMP 1 0.041 J 0.72 J 0.0037 J ND 0.11 J ND
Soil Pile 2 11/11/2015 SOIL COMP 2 0.041 J 0.67 J 0.0034 J 0.015 J 0.096 J 0.025 J
Soil Pile 3 11/12/2015 SOIL COMP 3 ND 1.0 J 0.0099 J ND 0.32 J ND
5 100 1 5 5 1
J - Estimated Concentration
Date Collected
* Regulatory values obtained from the Maximum Concentration of Contaminants for the Toxicity Characteristic as shown in 40 CFR 261.24, Table 1. No regulatory values for metals are available from the DOEE.
EPA Maximum Concentration of Contaminants for the Toxicity Characteristic
TABLE 12: TEST PIT SAMPLE ANALYTICAL RESULTS DETECTION SUMMARY TCLP METALS
KINGMAN ISLANDWASHINGTON, DC
Notes:
DOEE - Washington, DC Department of Energy & Environment
Boring ID
TCLP Metals (mg/L) by EPA Method 6010C
ND - Not Detected at or above the Laboratory Detection Limit
Only detected analytes are presented
TCLP - Toxicity Characteristic Leaching Procedure
Sample ID
Bold results indicate the sample was above regulatory limits
mg/L - Milligrams per kilogram
NS - No Standard

Site Investigation Report Kingman Island, Washington, DC
ATTACHMENT 5. LABORATORY ANALYTICAL RESULTS

Site Investigation Report Kingman Island, Washington, DC
ATTACHMENT 6. DATA VALIDATION REPORT
1
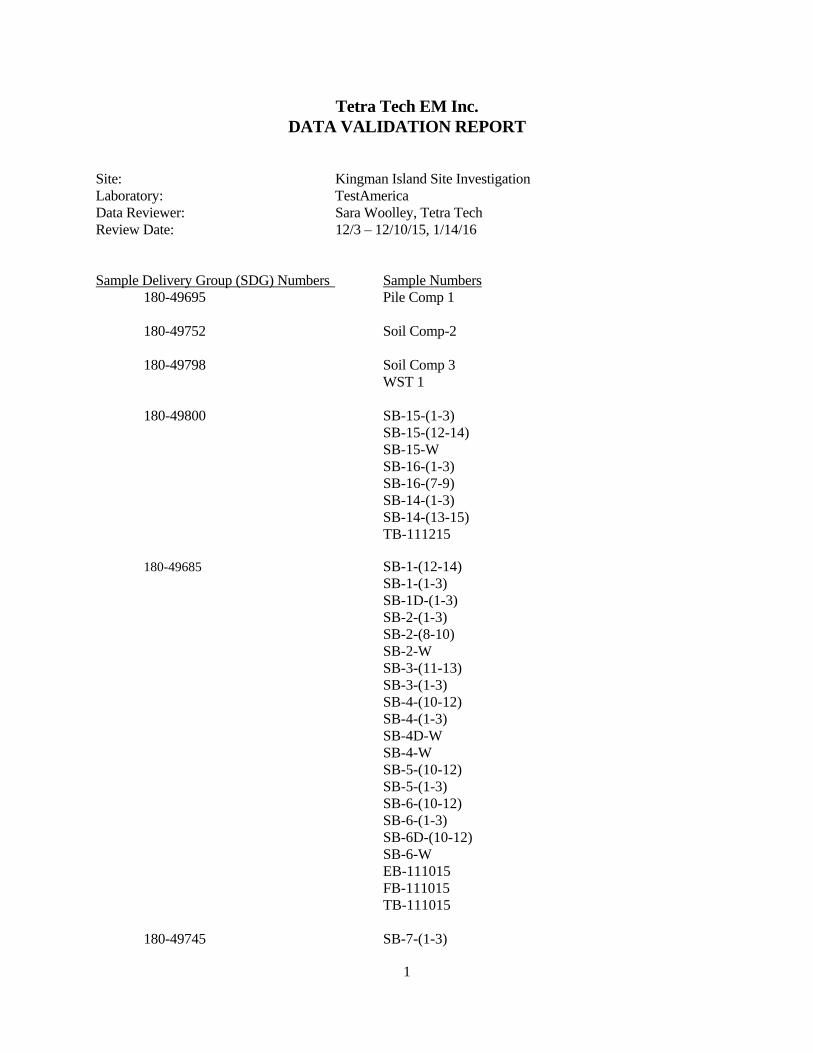
Tetra Tech EM Inc. DATA VALIDATION REPORT
Site: Kingman Island Site Investigation Laboratory: TestAmerica Data Reviewer: Sara Woolley, Tetra Tech Review Date: 12/3 – 12/10/15, 1/14/16 Sample Delivery Group (SDG) Numbers Sample Numbers 180-49695 Pile Comp 1 180-49752 Soil Comp-2 180-49798 Soil Comp 3 WST 1 180-49800 SB-15-(1-3) SB-15-(12-14) SB-15-W SB-16-(1-3) SB-16-(7-9) SB-14-(1-3) SB-14-(13-15) TB-111215 180-49685 SB-1-(12-14)
SB-1-(1-3) SB-1D-(1-3) SB-2-(1-3) SB-2-(8-10) SB-2-W SB-3-(11-13) SB-3-(1-3) SB-4-(10-12) SB-4-(1-3) SB-4D-W SB-4-W SB-5-(10-12) SB-5-(1-3) SB-6-(10-12) SB-6-(1-3) SB-6D-(10-12) SB-6-W EB-111015 FB-111015 TB-111015
180-49745 SB-7-(1-3)

2
SB-7-(8-10) SB-7-W SB-8-(11-13) SB-8-(1-3) SB-8D-(11-13) SB-9-(12-14) SB-9-(1-3) SB-9-W SB-10-(1-3) SB-10-(8-10) SB-11-(1-3) SB-11-(8-10) SB-11-W SB-12-(1-3) SB-12-(8-10) SB-13-(1-3) SB-13-(13-15) SB-13-W SB-17-(1-3) SB-17-(17-19) SB-17D-(17-19) SB-17-W SB-18-(1-3) SB-18-(13-15) TB-111115
Matrix: Solid and Water Collection Date(s): 11/10/15 – 11/12/15 The data were qualified according to the U.S. Environmental Protection Agency (EPA) documents "USEPA Contract Laboratory Program National Functional Guidelines for Superfund Organic Data Review" (June 2008), and "USEPA Contract Laboratory Program National Functional Guidelines for Inorganic Data Review" (October 2010). I certify that all data validation criteria outlined in the above referenced documents were assessed, and any qualifications made to the data were in accordance with those documents.
Certified by Sara Woolley, Senior Chemist

3
DATA VALIDATION REQUIREMENTS Parameters * Holding times * Blanks * Surrogate recovery * Internal standards (where applicable) * Matrix spike (MS)/matrix spike duplicate (where analyzed) * Laboratory control sample (LCS) or blank spike * LCS/LCS duplicate and MS/MSD relative percent difference * Compound identification (where applicable) * Field duplicates (not provided for this project) * Overall assessment of data for the SDG

4
DATA VALIDATION QUALIFIERS AND CODES
Data Validation Qualifiers UJ Estimated nondetected result J Estimated detected result J+ Estimated detected result/ High bias J- Estimated detected result/ Low bias R Rejected result NJ Tentatively Identified Compound (TIC) Data Validation Qualifier Codes a Surrogate recovery exceedance b Laboratory method blank and common blank contamination c Calibration exceedance d Duplicate precision exceedance e Matrix spike/laboratory control sample (LCS) recovery exceedance f Field blank contamination g Quantification below reporting limit h Holding time exceedance i Internal standard exceedance j Other qualifications
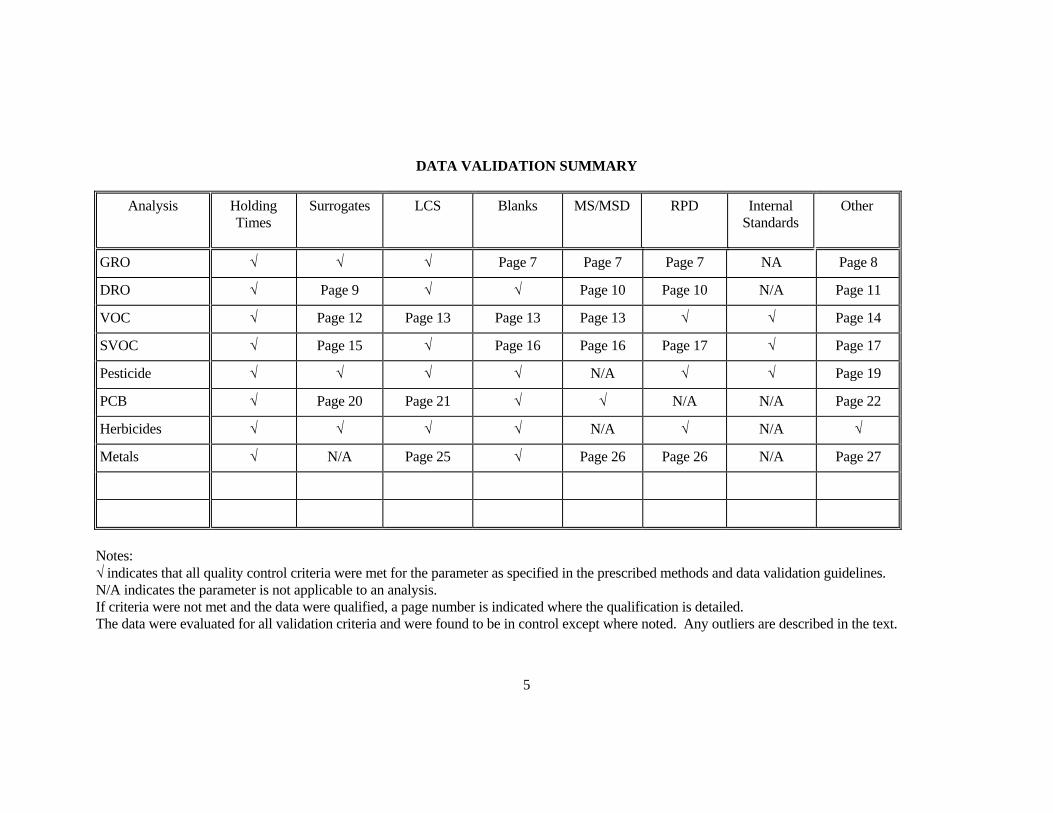
5
DATA VALIDATION SUMMARY
Analysis Holding Times
Surrogates LCS Blanks MS/MSD RPD
Internal Standards
Other
GRO √ √ √ Page 7 Page 7 Page 7 NA Page 8
DRO √ Page 9 √ √ Page 10 Page 10 N/A Page 11
VOC √ Page 12 Page 13 Page 13 Page 13 √ √ Page 14
SVOC √ Page 15 √ Page 16 Page 16 Page 17 √ Page 17
Pesticide √ √ √ √ N/A √ √ Page 19
PCB √ Page 20 Page 21 √ √ N/A N/A Page 22
Herbicides √ √ √ √ N/A √ N/A √
Metals √ N/A Page 25 √ Page 26 Page 26 N/A Page 27
Notes: √ indicates that all quality control criteria were met for the parameter as specified in the prescribed methods and data validation guidelines. N/A indicates the parameter is not applicable to an analysis. If criteria were not met and the data were qualified, a page number is indicated where the qualification is detailed. The data were evaluated for all validation criteria and were found to be in control except where noted. Any outliers are described in the text.
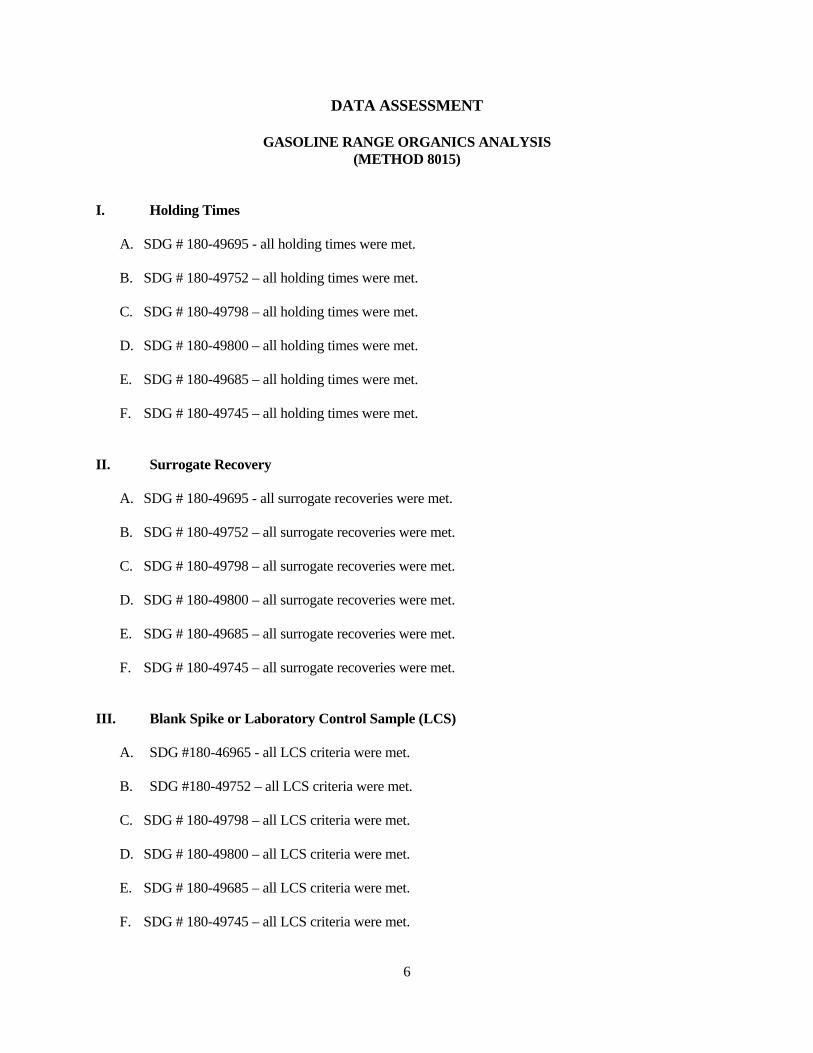
6
DATA ASSESSMENT
GASOLINE RANGE ORGANICS ANALYSIS (METHOD 8015)
I. Holding Times
A. SDG # 180-49695 - all holding times were met.
B. SDG # 180-49752 – all holding times were met.
C. SDG # 180-49798 – all holding times were met.
D. SDG # 180-49800 – all holding times were met.
E. SDG # 180-49685 – all holding times were met.
F. SDG # 180-49745 – all holding times were met.
II. Surrogate Recovery
A. SDG # 180-49695 - all surrogate recoveries were met.
B. SDG # 180-49752 – all surrogate recoveries were met.
C. SDG # 180-49798 – all surrogate recoveries were met.
D. SDG # 180-49800 – all surrogate recoveries were met.
E. SDG # 180-49685 – all surrogate recoveries were met.
F. SDG # 180-49745 – all surrogate recoveries were met. III. Blank Spike or Laboratory Control Sample (LCS)
A. SDG #180-46965 - all LCS criteria were met. B. SDG #180-49752 – all LCS criteria were met.
C. SDG # 180-49798 – all LCS criteria were met.
D. SDG # 180-49800 – all LCS criteria were met.
E. SDG # 180-49685 – all LCS criteria were met.
F. SDG # 180-49745 – all LCS criteria were met.
7
IV. Matrix Spike/Matrix Spike Duplicate
A. SDG # 180-49800 – all MS/MSD criteria were met. B. SDG #180-49685 - due to low MS recovery, the following results are qualified as estimated
(UJe/Je)
Gasoline in sample SB-3-(11-13) C. SDG # 180-49745 – all MS/MSD criteria were met.
V. Blank Contamination
A. SDG #180-46965 – all blanks were free of contamination.
B. SDG #180-49752 – all blanks were free of contamination.
C. SDG #180-49798 – all blanks were free of contamination.
D. SDG #180-49800 – all blanks were free of contamination.
E. SDG #188-49685 - Due to laboratory contamination in the water method blank, the following results are considered nondetected (UJb).
Gasoline in samples SB-4-W, SB-6-W, FB-111015, EB-111015, SB-4D-W, SB-2-W
Compound Blank ID Concentration Gasoline 240-207248/5 30.6 ug/L
F. SDG #188-49745 - Due to laboratory contamination in the water method blank, the following results are considered nondetected (UJb).
Gasoline in samples SB-11-W, SB-17-W, SB-13-W, SB-7-W, SB-9-W
Compound Blank ID Concentration Gasoline 240-207248/5 30.6 ug/L VI. MS/MSD Relative Percent Difference (RPD) A. SDG # 180-49800 – all MS/MSD RPD criteria were met.
B. SDG #180-49685 - due to RPDs above criteria, the following results are qualified as estimated
(UJd/Jd)
Gasoline in sample SB-3-(11-13) C. SDG # 180-49745 – all MS/MSD RPD criteria were met

8
VII. Other Qualifications A. SDG #180-46965 - The following results are qualified as estimated (Jg).
GRO in Pile Comp 1 Detected results reported below the QL are considered to be qualitatively acceptable, but
quantitatively unreliable due to the uncertainty in analytical precision near the limit of detection.
B. SDG #180-49752 – no further qualification were necessary.
C. SDG #180-49798 – no further qualification were necessary.
D. SDG #180-49800 – no further qualification were necessary.
E. SDG #180-46965 - The following results are qualified as estimated (Jg).
GRO in SB-2-(1-3)
F. SDG #180-46745 - The following results are qualified as estimated (Jg).
GRO in SB-7-(1-3), SB-17-(1-3), SB-18-(1-3), SB-13-(13-15)
Detected results reported below the QL are considered to be qualitatively acceptable, but quantitatively unreliable due to the uncertainty in analytical precision near the limit of detection.

9
DIESEL RANGE ORGANIC ANALYSIS (METHOD 8015)
I. Holding Times A. SDG # 180-49695 - all holding times were met.
B. SDG # 180-49752 – all holding times were met.
C. SDG # 180-49798 – all holding times were met.
D. SDG # 180-49800 – all holding times were met.
E. SDG # 180-49685 – all holding times were met.
F. SDG #180-49745 – all holding times were met.
II. Surrogate Recovery
A. SDG # 180-49695 - all surrogate recoveries were met.
B. SDG # 180-49752 – all surrogate recoveries were met.
C. SDG # 180-49798 – all surrogate recoveries were met.
D. SDG # 180-49800 – all surrogate recoveries were met.
E. SDG # 180-49685 – all surrogate recoveries were met.
F. SDG # 180-49745 – due to high surrogate recovery, the following sample result was qualified as estimated (J+a).
SB-12-(1-3)
III. Blank Spike or Laboratory Control Sample (LCS)
A. SDG #180-46965 - all LCS criteria were met. B. SDG #180-49752 – all LCS criteria were met.
C. SDG #180-49798 – all LCS criteria were met.
D. SDG # 180-49800 – all LCS criteria were met.
E. SDG # 180-49685 – all LCS criteria were met. F. SDG #180- 49745 – all LCS criteria were met.
10
IV. Blank Contamination
A. SDG #180-46965 – all blanks were free of contamination.
B. SDG #180-49752 – all blanks were free of contamination.
C. SDG #180-49798 – all blanks were free of contamination.
D. SDG #180-49800 – all blanks were free of contamination.
E. SDG # 180-49685 – all blanks were free of contamination.
F. SDG # 180-49745 – all blanks were free of contamination.
V. Matrix Spike/Matrix Spike Duplicate
A. SDG # 180-49800 – all MS/MSD criteria were met.
B. SDG # 180-49685 – due to MS/MSD recoveries above criteria, the following results have been qualified as estimated (J+e).
DRO in sample SB-3-(11-13)
C. SDG # 180-49745 – due to high MSD recovery, the following results have been qualified as estimated (J+e).
DRO in sample SB-9-(1-3)
VI. MS/MSD Relative Percent Difference (RPD)
A. SDG # 180-49800 – all MS/MSD RPD criteria were met.
B. SDG # 180-49685 – due to MS/MSD RPD above criteria, the following results have been qualified as estimated (Jd).
DRO in sample SB-3-(11-13)
C. SDG # 180-49745 – due to MS/MSD RPD above criteria, the following results have been qualified as estimated (Jd).
DRO in sample SB-9-(1-3)

11
VII. Other Qualifications
A. SDG #180-46965 - no further qualification were necessary.
B. SDG #180-49752 – no further qualification were necessary.
C. SDG #180-49798 – no further qualification were necessary.
D. SDG #180-49800 – no further qualification were necessary. Several samples were analyzed at a dilution due to the abundance of target analytes and/or matrix. The reporting limits have been adjusted accordingly.
E. SDG #180-46965 - The following results are qualified as estimated (Jg).
DRO in SB-6-(10-12), SB-6D-(10-12), SB-1-(12-14)
F. SDG #180-49800 – no further qualification were necessary. Several samples were analyzed at a
dilution due to the abundance of target analytes and/or matrix. The reporting limits have been adjusted accordingly. The following results are qualified as estimated (Jg).
DRO in SB-7-(1-3), SB-7-(8-10), SB-9-(12-14)
Detected results reported below the QL are considered to be qualitatively acceptable, but quantitatively unreliable due to the uncertainty in analytical precision near the limit of detection.
12
VOLATILE ORGANIC COMPOUNDS ANALYSIS (Method 8260)
I. Holding Times
A. SDG # 180-49695 - all holding times were met.
B. SDG # 180-49752 – all holding times were met.
C. SDG # 180-49798 – all holding times were met.
D. SDG # 180-49800 – all holding times were met.
E. SDG # 180-49685 – all holding times were met. F. SDG # 180-49745 – all holding times were met.
II. Surrogate Recovery
A. SDG # 180-49695 - all surrogate recoveries were met.
B. SDG # 180-49752 – all surrogate recoveries were met.
C. SDG # 180-49798 – all surrogate recoveries were met.
D. SDG # 180-49800 –Dibromofluoromethane recoveries were outside QC criteria in samples SB-15-(12-14), SB-16-(7-9). The other 3 surrogates were in control. In addition, pH was high in these 2 samples. High pH often results in low recovery of dibromofluoromethane. No qualification, therefore, was necessary.
E. SDG # 180-49685 – all surrogate recoveries were met. F. SDG # 180-49745 – all surrogate recoveries were met.
III. Internal Standards
A. SDG # 180-49695 – all internal standard criteria was met.
B. SDG # 180-49752 – all internal standard criteria was met.
C. SDG # 180-49798 – all internal standard criteria was met.
D. SDG # 180-49800 – all internal standard criteria was met.
E. SDG # 180-49685 – all internal standard criteria was met. F. SDG # 180-49745 – all internal standard criteria was met.

13
IV. Blank Spike or Laboratory Control Sample (LCS)/LCS Duplicate (LCSD) A. SDG # 180-49695 - all LCS/LCSD criteria were met. B. SDG # 180-49752 – all LCS/LCSD criteria were met.
C. SDG # 180-49798 – all LCS/LCSD criteria were met.
D. SDG # 180-49800 – Chloroethane failed the recovery criteria high for LCS/LCSD. This
compound was not detected in the associated samples. No qualification was necessary
E. SDG # 180-49685 – Chloroethane failed the recovery criteria high for LCS and the MS/MSD. This compound was not detected in the associated samples. No qualification was necessary
F. SDG # 180-49745 – Chloroethane failed the recovery criteria high for LCS and the MS/MSD.
This compound was not detected in the associated samples. No qualification was necessary V. Blank Contamination A. SDG # 180-49695 - all method blanks were free of contamination. B. SDG # 180-49752 – all method blanks were free of contamination. C. SDG # 180-49798 – all method blanks were free of contamination.
D. SDG # 180-49800 – Due to laboratory contamination in the method blank, the following results are
considered nondetected (UJb).
1,2,4-Trichlorobenzene in samples SB-14-(1-3), SB- 14-(13-15), SB-15-(12-14), SB-15-(1-3), SB-16-(1-3), SB-16-(7-9)
Compound Blank ID Concentration 1,2,4-Trichlorbenzene 160830 1.37 g/kg The trip blank was free of contamination. E. SDG # 180-49685 – methylene chloride was detected in the method blank, however, all sample
results were ND. Field QC blanks were all ND. F. SDG # 180-49745 – all method blanks were free of contamination. The trip blank results were all
ND.

14
VI. LCS/LCSD and MS/MSD Relative Percent Difference (RPD)
A. SDG # 180-49695 - all LCS/LCSD RPD criteria were met. B. SDG # 180-49752 – all LCS/LCSD RPD criteria were met. C. SDG # 180-49798 – all LCS/LCSD RPD criteria were met.
D. SDG # 180-49800 – all LCS/LCSD RPD criteria were met. All MS/MSD criteria were met.
E. SDG # 180-49685 – all LCS/LCSD RPD criteria were met. All MS/MSD criteria were met.
F. SDG # 180-49745 – all LCS/LCSD RPD criteria were met. All MS/MSD criteria were met.
VII. Other Qualifications Detected results reported below the QL are considered to be qualitatively acceptable, but quantitatively unreliable due to the uncertainty in analytical precision near the limit of detection. A. SDG # 180-49695 – all results were non-detect. B. SDG # 180-49752 – all results were non-detect. C. SDG # 180-49798 – all results were non-detect.
D. SDG # 180-49800 – The following results are qualified as estimated (Jg).
Benzene detected results reported below the QL in sample SB-15-W.
E. SDG # 180-49685 – The following results are qualified as estimated (Jg).
2-butanone, 2-hexanone, acetone, results reported below the QL in sample SB-4-W, SB-6-W, SB-4D-W, SB-2-W.
Carbon disulfide in SB-4-W, SB-6-W Toluene in sample SB-1-(1-3)
F. SDG # 180-49745 – The following results are qualified as estimated (Jg).
2-butanone, carbon disulfide, toluene results reported below the QL in sample SB-11-W. Acetone and carbon disulfide in SB-13-W Carbon disulfide in SB-17-(1-3) Toluene in sample SB-18-(13-15) 2-butanone, 2-hexanone, toluene in sample SB-7-W 2-butanone in sample SB-9-W
Methylene chloride, acetone, and 2-butanone are known laboratory contaminants. Detected results reported below the QL are considered to be qualitatively acceptable, but quantitatively unreliable due to the uncertainty in analytical precision near the limit of detection.

15
SEMIVOLATILE ORGANIC COMPOUNDS ANALYSIS (Method 8270)
I. Holding Times A. SDG # 180-49695 - all holding times were met.
B. SDG # 180-49752 – all holding times were met.
C. SDG # 180-49798 – all holding times were met.
D. SDG # 180-49800 – all holding times were met.
E. SDG # 180-49685 – all holding times were met. F. SDG # 180-49745 – all holding times were met.
II. Surrogate Recovery A. SDG # 180-49695 - all surrogate recoveries were met.
B. SDG # 180-49752 – all surrogate recoveries were met.
C. SDG # 180-49798 – Nitrobenzene-d5 failed above criteria indicating high bias. All results were
nondetect, therefore, no qualifications were necessary.
D. SDG # 180-49800 – all surrogate recoveries were met.
E. SDG # 180-49685 – all surrogate recoveries were met. F. SDG # 180-49745 – due to low surrogate recovery, the following results are qualified as estimated
(J-a).
SVOCs in sample SB-11-W III. Blank Spike or Laboratory Control Sample (LCS)/LCS Duplicate (LCSD) A. SDG # 180-49695 - all LCS/LCSD criteria were met. B. SDG # 180-49752 – all LCS/LCSD criteria were met. C. SDG # 180-49798 – all LCS/LCSD criteria were met.
D. SDG # 180-49800 – all LCS/LCSD criteria were met.
E. SDG # 180-49685 – all LCS/LCSD criteria were met.
F. SDG # 180-49745 – all LCS/LCSD criteria were met.

16
IV. MS/MSD Recovery
A. SDG # 180-49745 – due to low recovery in the MS/MSD, the following results are qualified as estimated (J-e).
Anthracene, benzo(k)fluoranthene, dibenz(a,h)anthracene in sample SB-9-(1-3)
V. Blank Contamination A. SDG # 180-49695 - all blanks were free of contamination. B. SDG # 180-49752 – all blanks were free of contamination. C. SDG # 180-49798 – all blanks were free of contamination.
D. SDG # 180-49800 – all blanks were free of contamination.
E. SDG # 180-49685 – Due to field blank contamination, the following results are considered
nondetected (UJf). Naphthalene and phenanthrene in samples SB-4-W, SB-4D-W Compound Blank ID Concentration, g/L Antthracene FB-111015 0.045 Fluoranthene 0.069 Fluorene 0.08 Naphthalene 0.13 Phenanthrene 0.24 The method blank was free of contamination. F. G # 180-49745 – all blanks were free of contamination.

17
VI. LCS/LCSD and MS/MSD Relative Percent Difference (RPD) A. SDG # 180-49695 - all LCS/LCSD RPD criteria were met. B SDG # 180-49752 – all LCS/LCSD RPD criteria were met.
C. SDG # 180-49798 – Due to RPD outside criteria, the following results are considered estimated
(UJd/Jd).
Pyridine in samples Soil Comp 1 and WST 1
D. SDG # 180-49800 – all LCS/LCSD RPD criteria were met. E. SDG # 180-49685 – all LCS/LCSD RPD criteria were met.
F. SDG # 180-49745 – Due to MS/MSD RPD outside criteria, the following results are considered
estimated (UJd/Jd).
Benzo(k)fluoranthene in sample SB-9-(1-3)
VII. Other Qualifications A. The following results are qualified as estimated (Jg).
All SVOC detected results reported below the QL. Detected results reported below the QL are considered to be qualitatively acceptable, but
quantitatively unreliable due to the uncertainty in analytical precision near the limit of detection. Several samples were analyzed at a dilution. Reporting limits were adjusted accordingly.

18
PESTICIDE ANALYSIS (METHOD 8081)
I. Holding Times A. SDG # 180-49695 - all holding times were met.
B. SDG # 180-49752 – all holding times were met.
C. SDG # 180-49798 – all holding times were met.
II. Surrogate Recovery A. SDG # 180-49695 - all surrogate recoveries were met.
B. SDG # 180-49752 – all surrogate recoveries were met.
C. SDG # 180-49798 – all surrogate recoveries were met.
III. Blank Spike or Laboratory Control Sample (LCS)/LCSD A. SDG # 180-49695 - all LCS/LCSD criteria were met.
B SDG # 180-49752 – al all LCS/LCSD criteria were met. C. SDG # 180-49798 – all LCS/LCSD criteria were met. IV. Blank Contamination A. SDG # 180-49695 - all blanks were free of contamination.
B. SDG # 180-49752 – all blanks were free of contamination. C. SDG # 180-49798 – all blanks were free of contamination. V. LCS/LCSD Relative Percent Difference (RPD) A. SDG # 180-49695 - all LCS/LCSD RPD criteria were met. B SDG # 180-49752 – all LCS/LCSD RPD criteria were met.
C. SDG # 180-49798 – all LCS/LCSD RPD criteria were met.
19
VI. Other Qualifications Detected results reported below the QL are considered to be qualitatively acceptable, but quantitatively unreliable due to the uncertainty in analytical precision near the limit of detection. A. SDG # 180-49695 – all results were non-detect. B. SDG # 180-49752 – all results were non-detect. C. SDG # 180-49798 – all results were non-detect.

20
POLYCHLORINATED BIPHENYLS CONGENER ANALYSIS (METHOD 8082)
I. Holding Times A. SDG # 180-49695 - all holding times were met.
B. SDG # 180-49752 – all holding times were met.
C. SDG # 180-49798 – all holding times were met.
D. SDG # 180-49800 – all holding times were met.
E. SDG # 180-49685 – all holding times were met.
F. SDG # 180-49745 – all holding times were met.
II. Surrogate Recovery A. SDG # 180-49695 - all surrogate recoveries were met.
B. SDG # 180-49752 – all surrogate recoveries were met.
C. SDG # 180-49798 – all surrogate recoveries were met.
D. SDG # 180-49800 – all surrogate recoveries were met.
E. SDG # 180-49685 – all surrogate recoveries were met
F. SDG # 180-49745 – due to surrogate recoveries above criteria, the following detected results are
qualified as estimated (J+a).
PCB-1260 in sample SB-13-(1-3)
Due to surrogate recoveries below criteria, the following results are qualified as estimated (UJ-a/J-a).
All aroclors in sample SB-13-(13-15)

21
III. Blank Spike or Laboratory Control Sample (LCS)/LCSD A. SDG # 180-49695 – LCS only analyzed, all recoveries were met. B. SDG # 180-49752 – LCS only analyzed, all recoveries were met.
C. SDG # 180-49798 – LCS only analyzed, all recoveries were met.
D. SDG # 180-49800 – Due to LCS/LCSD recoveries above criteria, the following detected sample
results have been qualified as estimated (J+e). Aroclor-1260 in SB-15-(1-3), SB-15-W
E. SDG # 180-49685 –all LCS/LCSD recoveries were met.
F. SDG # 180-49745 – LCS only analyzed, all recoveries were met. All MS/MSD recoveries were
met. IV. Blank Contamination A. SDG # 180-49695 - all blanks were free of contamination. B. SDG # 180-49752 – all blanks were free of contamination. C. SDG # 180-49798 – all blanks were free of contamination.
D. SDG # 180-49800 – all blanks were free of contamination.
E. SDG # 180-49685 – all blanks were free of contamination. F. SDG # 180-49745 – all blanks were free of contamination.
V. LCS/LCSD Relative Percent Difference (RPD) A. SDG # 180-49695 – LCS only analyzed.
B. SDG # 180-49752 – LCS only analyzed. . C. SDG # 180-49798 – LCS only analyzed.
D. SDG # 180-49800 – all LCS/LCSD RPD criteria were met.
E. SDG # 180-49685 – all LCS/LCSD RPD criteria were met. F. SDG # 180-49745 – LCS only analyzed, all MS/MSD RPD criteria were met.
22
VI. Compound Identification A. SDG # 180-49695 – All confirmation criteria were met. B. SDG # 180-49752 – All confirmation criteria were met. C. SDG # 180-49798 – Due to confirmation problems, the following sample results were qualified as
estimated (Jj/UJj).
All PCB results in samples SOIL COMP 3, WST 1
The results for samples SOIL COMP 3 and WST 1 were reported for aroclor 1260 from the back column since front column had high % recovery and results within 40% D.
D. SDG # 180-49800 – All confirmation criteria were met. E. SDG # 180-49685 – All results were ND. F. SDG # 180-49745 – All confirmation criteria were met. VII. Other Qualifications A. SDG #180-46965 - no further qualification were necessary. B. SDG #180-49752 – no further qualification were necessary. C. SDG #180-49798 – no further qualification were necessary. D. SDG #180-49800 – no further qualification were necessary. E. SDG #180-49685 – no further qualification were necessary. F. SDG #180-49745 – no further qualification were necessary.

23
HERBICIDE ANALYSIS (METHOD 8151)
I. Holding Times A. SDG # 180-49695 - all holding times were met.
B. SDG # 180-49752 – all holding times were met.
C. SDG # 180-49798 – all holding times were met.
II. Surrogate Recovery A. SDG # 180-49695 - all surrogate recoveries were met.
B. SDG # 180-49752 – all surrogate recoveries were met.
C. SDG # 180-49798 – all surrogate recoveries were met.
III. Blank Spike or Laboratory Control Sample (LCS)/LCSD A. SDG # 180-49695 - all LCS/LCSD criteria were met.
B SDG # 180-49752 – al all LCS/LCSD criteria were met.
C. SDG # 180-49798 – all LCS/LCSD criteria were met. IV. Blank Contamination A. SDG # 180-49695 - all blanks were free of contamination.
B. SDG # 180-49752 – all blanks were free of contamination. C. SDG # 180-49798 – all blanks were free of contamination. V. LCS/LCSD Relative Percent Difference (RPD) A. SDG # 180-49695 - all LCS/LCSD RPD criteria were met. B SDG # 180-49752 – all LCS/LCSD RPD criteria were met.
C. SDG # 180-49798 – all LCS/LCSD RPD criteria were met.

24
VI. Other Qualifications Detected results reported below the QL are considered to be qualitatively acceptable, but quantitatively unreliable due to the uncertainty in analytical precision near the limit of detection. A. SDG # 180-49695 – all results were non-detect. B. SDG # 180-49752 – all results were non-detect. C. SDG # 180-49798 – all results were non-detect.

25
METALS ANALYSIS
I. Holding Times
A. SDG # 180-49695 - all holding times were met.
B. SDG # 180-49752 – all holding times were met.
C. SDG # 180-49798 – all holding times were met.
D. SDG # 180-49800 – all holding times were met.
E. SDG # 180-49685 – all holding times were met.
F. SDG # 180-49745 – all holding times were met.
II. Blank Contamination A. SDG # 180-49695 - all blanks were free of contamination. B. SDG # 180-49752 – all blanks were free of contamination. C. SDG # 180-49798 – barium was detected in the TCLP method blanks at very low levels,
and detections in the samples were well above 5X the blank contamination, therefore, qualification was not necessary.
D. SDG # 180-49800 – iron, manganese, and zinc were detected in the soil method blanks, and aluminum, potassium, and sodium were detected in the water method blanks, at very low levels. Detections in the samples were well above 5X the blank contamination, therefore, qualification was not necessary.
E. SDG # 180-49685 – chromium and potassium were detected in the soil method blanks, and magnesium and sodium were detected in the water method blanks, at very low levels. Detections in the samples were well above 5X the blank contamination, therefore, qualification was not necessary. A few metals were detected in the field and equipment blanks, however, sample results were either ND or 5X greater than the blank contamination.
F. SDG # 180-49745 – chromium, barium, chromium, iron, and manganese were detected in the soil
method blanks, and magnesium, potassium, and sodim were detected in the water method blanks, at very low levels. Detections in the samples were well above 5X the blank contamination, therefore, qualification was not necessary.
26
III. Blank Spike or Laboratory Control Sample (LCS) A. SDG # 180-49695 - all LCS criteria were met. B. SDG # 180-49752 – all LCS criteria were met.
C. SDG # 180-49798 – all LCS criteria were met.
D. SDG # 180-49800 – all LCS criteria were met.
E. SDG # 180-49685 – all LCS criteria were met. F. SDG # 180-49745 – all LCS criteria were met. IV. Matrix Spike/Matrix Spike Duplicate (MS/MSD) A. SDG # 180-49800 – due to low recovery in the MS/MSD, the following results are qualified
estimated (UJ-e/J-e).
Antimony, calcium, copper, lead, silver, zinc in sample SB-15-(1-3)
B. SDG # 180-49685 – all MS/MSD criteria were met. C. SDG # 180-49745 – due to low recovery in the MS/MSD, the following results are qualified
estimated (UJ-e/J-e).
Antimony, calcium, magnesium in sample SB-9-(1-3) Due to high recovery in the MS/MSD, the following results are qualified estimated (J+e).
Barium, chromium, copper, lead, zinc in sample SB-9-(1-3)
V. MS/MSD RPD A. SDG #180-49800 – due to RPDs above criteria, the following results are qualified as estimated
(UJd/Jd)
Antimony, calcium, copper, lead, silver, zinc in sample SB-15-(1-3) B. SDG #180-49685 – due to RPDs above criteria, the following results are qualified as estimated
(UJd/Jd)
Mercury in sample SB-3-(11-13) C. SDG #180-49745 – due to RPDs above criteria, the following results are qualified as estimated
(UJd/Jd)
Aluminum, barium, calcium, chromium, copper, iron, lead zinc in sample SB-3-(11-13)

27
VI. Other Qualifications A. The following results are qualified as estimated (Jg).
All metals results reported below the QL. Results above the MDL but below the QL are considered qualitatively acceptable but quantitatively
unreliable due to uncertainties in the analytical precision near the limit of detection. Some samples required dilution, reporting limits were elevated accordingly.

28
OVERALL ASSESSMENT OF DATA I. Method Compliance and Additional Comments All analyses were conducted within all specifications of the requested methods. II. Usability The quality control criteria reviewed, other than those discussed above, were met and are
considered acceptable. Rejected sample results (R) are unusable for all purposes. Estimated sample results (J) are usable only for limited purposes. Based upon the data validation all results are considered valid and usable for all purposes. No data was rejected. In general, the absence of rejected data and the small number of qualifiers added to the data indicate high usability.

MEMO
J:\archive\2009\1396 - Kingman Island\Project Manual\Correspondence\Memos\090710-Memo.doc JBC Form xxx 11/03
JEFFREY L. BRUCE & COMPANY, LLC 1907 SWIFT STREET • SUITE 204 • NORTH KANSAS CITY, MISSOURI 64116
PHONE 816.842.8999 • FAX 816.842.8885 • www.jlbruce.com
TO: Adrienne McCray DATE: 10-Jul-2009
COMPANY: Lee + Papa and Associates, Inc. By: Mike McGrew
638 Eye St., NW PROJECT: Kingman Island
Washignton, DC 20001 JOB NO.: 1396
PHONE: 2024666666 FAX: 2024664232 CC: Chuck Dixon
RE: Craig Atkins
REMARKS: Site observations Site visit was performed on July 6, 2009. Collected information about site conditions and georeferenced the locations using GPS data, photographs, plant identification, and collection of soil samples at three different locations. Soil Boring locations The site was walked in the location of the proposed memorial grove-with particular attention to the large mounds of deposited material-and along the pathways of the proposed outdoor classrooms. The surface materials were inspected for changes of color, structure, texture, composition, and saturation. Waypoints were identified for potential soil boring locations and samples were taken for laboratory evaluation. From the visual surface inspection and the lab evaluation, a series of six soil boring locations have been recommended for further testing. In particular, we would prefer to see soil boring logs that record changes of color, soil classification, pollutants, their respective depths, and the relative depth of ground water. Recommended soil boring locations are as follows:
type ident lat long lat (dms) long (dms)
WAYPOINT 107 38.8942 -76.9637 N 38° 53' 39.12" W 76° 57' 49.32"
WAYPOINT 108 38.8939 -76.9640 N 38° 53' 38.04" W 76° 57' 50.40"
WAYPOINT 109 38.8937 -76.9637 N 38° 53' 37.32" W 76° 57' 49.32"
WAYPOINT 112 38.8920 -76.9641 N 38° 53' 31.20" W 76° 57' 50.76"
WAYPOINT 114 38.8951 -76.9644 N 38° 53' 42.36" W 76° 57' 51.84"
WAYPOINT 116 38.8941 -76.9635 N 38° 53' 38.76" W 76° 57' 49.00" From this, we can further determine the composition of the soil and provide information as to the re-use of soils on site to minimize the amount of imported materials. Please note that the recommended soil boring locations are available in digital format as a .csv file. Alternate digital formats (including .shp and .txt) are also available on request. If cost or time is an issue, JBC can prioritize the six soil boring locations by importance. Additional Request There was an old, possibly unused vault on the site along the east path, SE of the mounds, NNE of waypoint 112. We would like to know what this vault holds as any pollutants in the vault may be exposed
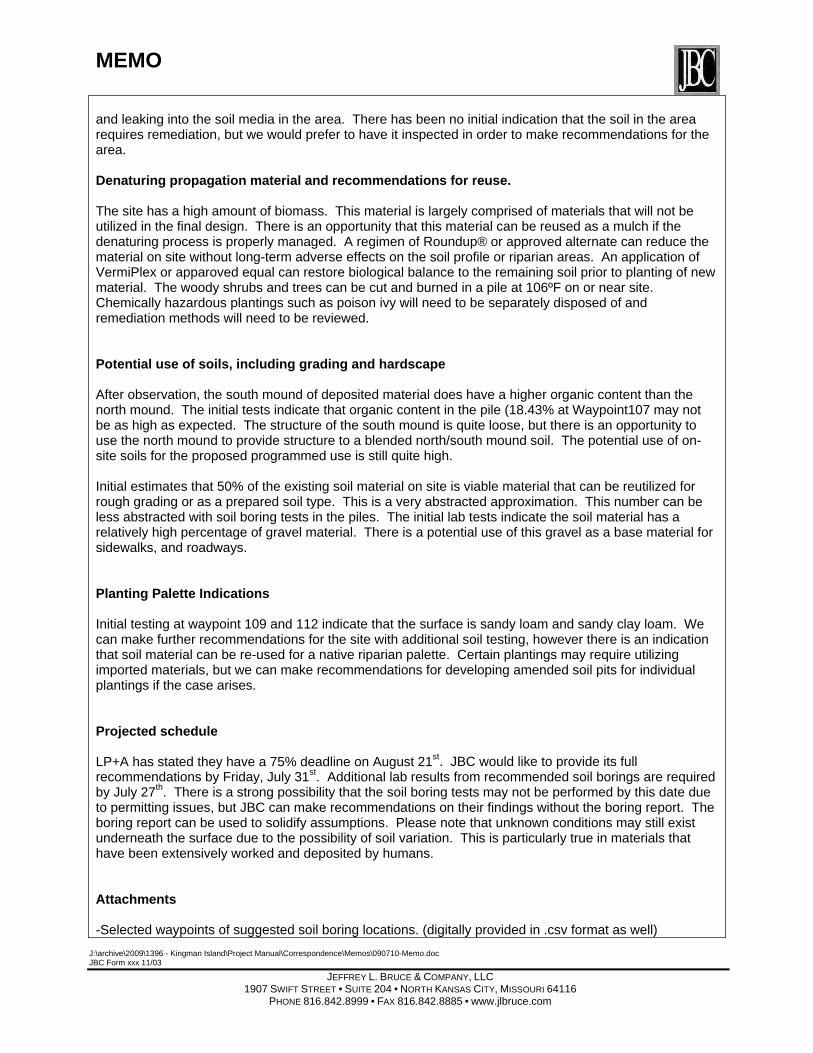
MEMO
J:\archive\2009\1396 - Kingman Island\Project Manual\Correspondence\Memos\090710-Memo.doc JBC Form xxx 11/03
JEFFREY L. BRUCE & COMPANY, LLC 1907 SWIFT STREET • SUITE 204 • NORTH KANSAS CITY, MISSOURI 64116
PHONE 816.842.8999 • FAX 816.842.8885 • www.jlbruce.com
and leaking into the soil media in the area. There has been no initial indication that the soil in the area requires remediation, but we would prefer to have it inspected in order to make recommendations for the area. Denaturing propagation material and recommendations for reuse. The site has a high amount of biomass. This material is largely comprised of materials that will not be utilized in the final design. There is an opportunity that this material can be reused as a mulch if the denaturing process is properly managed. A regimen of Roundup® or approved alternate can reduce the material on site without long-term adverse effects on the soil profile or riparian areas. An application of VermiPlex or apparoved equal can restore biological balance to the remaining soil prior to planting of new material. The woody shrubs and trees can be cut and burned in a pile at 106ºF on or near site. Chemically hazardous plantings such as poison ivy will need to be separately disposed of and remediation methods will need to be reviewed. Potential use of soils, including grading and hardscape After observation, the south mound of deposited material does have a higher organic content than the north mound. The initial tests indicate that organic content in the pile (18.43% at Waypoint107 may not be as high as expected. The structure of the south mound is quite loose, but there is an opportunity to use the north mound to provide structure to a blended north/south mound soil. The potential use of on-site soils for the proposed programmed use is still quite high. Initial estimates that 50% of the existing soil material on site is viable material that can be reutilized for rough grading or as a prepared soil type. This is a very abstracted approximation. This number can be less abstracted with soil boring tests in the piles. The initial lab tests indicate the soil material has a relatively high percentage of gravel material. There is a potential use of this gravel as a base material for sidewalks, and roadways. Planting Palette Indications Initial testing at waypoint 109 and 112 indicate that the surface is sandy loam and sandy clay loam. We can make further recommendations for the site with additional soil testing, however there is an indication that soil material can be re-used for a native riparian palette. Certain plantings may require utilizing imported materials, but we can make recommendations for developing amended soil pits for individual plantings if the case arises. Projected schedule LP+A has stated they have a 75% deadline on August 21
st. JBC would like to provide its full recommendations by Friday, July 31st. Additional lab results from recommended soil borings are required by July 27th. There is a strong possibility that the soil boring tests may not be performed by this date due to permitting issues, but JBC can make recommendations on their findings without the boring report. The boring report can be used to solidify assumptions. Please note that unknown conditions may still exist underneath the surface due to the possibility of soil variation. This is particularly true in materials that have been extensively worked and deposited by humans. Attachments -Selected waypoints of suggested soil boring locations. (digitally provided in .csv format as well)

MEMO
J:\archive\2009\1396 - Kingman Island\Project Manual\Correspondence\Memos\090710-Memo.doc JBC Form xxx 11/03
JEFFREY L. BRUCE & COMPANY, LLC 1907 SWIFT STREET • SUITE 204 • NORTH KANSAS CITY, MISSOURI 64116
PHONE 816.842.8999 • FAX 816.842.8885 • www.jlbruce.com
-Aerial photographs of suggested soil boring locations and photographs of approximate site locations. No photograph provided for WP116. Please contact our office if you have any further questions.
Signed: Mike McGrew
Jeffrey L. Bruce & Company

WAYPOINT DATA - KINGMAN ISLAND - 06 July 2009
type ident lat long y_proj x_proj comment display symbol unused1 dist prox_index color altitude depth wpt_class sub_class attrib link state country city address facility crossroad unused2 ete dtype model filename
WAYPOINT 107 38.8942 -76.9637 38.8942 -76.9637 06-JUL-09 1:30:03PM 0 8284 0 0 0 31 46 0 0 128 0 -1 1 GPSMap60CSX
WAYPOINT 108 38.8939 -76.9640 38.8939 -76.9640 06-JUL-09 1:36:52PM 0 8284 0 0 0 31 48 0 0 128 0 -1 1 GPSMap60CSX
WAYPOINT 109 38.8937 -76.9637 38.8937 -76.9637 06-JUL-09 1:47:15PM 0 8284 0 0 0 31 45 0 0 128 0 -1 1 GPSMap60CSX
WAYPOINT 112 38.8920 -76.9641 38.8920 -76.9641 06-JUL-09 2:05:28PM 0 8284 0 0 0 31 41 0 0 128 0 -1 1 GPSMap60CSX
WAYPOINT 114 38.8951 -76.9644 38.8951 -76.9644 06-JUL-09 2:40:55PM 0 8284 0 0 0 31 35 0 0 128 0 -1 1 GPSMap60CSX
WAYPOINT 116 38.8941 -76.9635 38.8941 -76.9635 0 8284 0 0 0 31 0 0 128 0 -1 1 GPSMap60CSX
Jeffrey L. Bruce & Company, LLC
1907 Swift Street • Suite 204 • North Kansas City, Missouri 64116
Phone 816.842.8999 • Fax 816.842.8885 • www.jlbruce.com

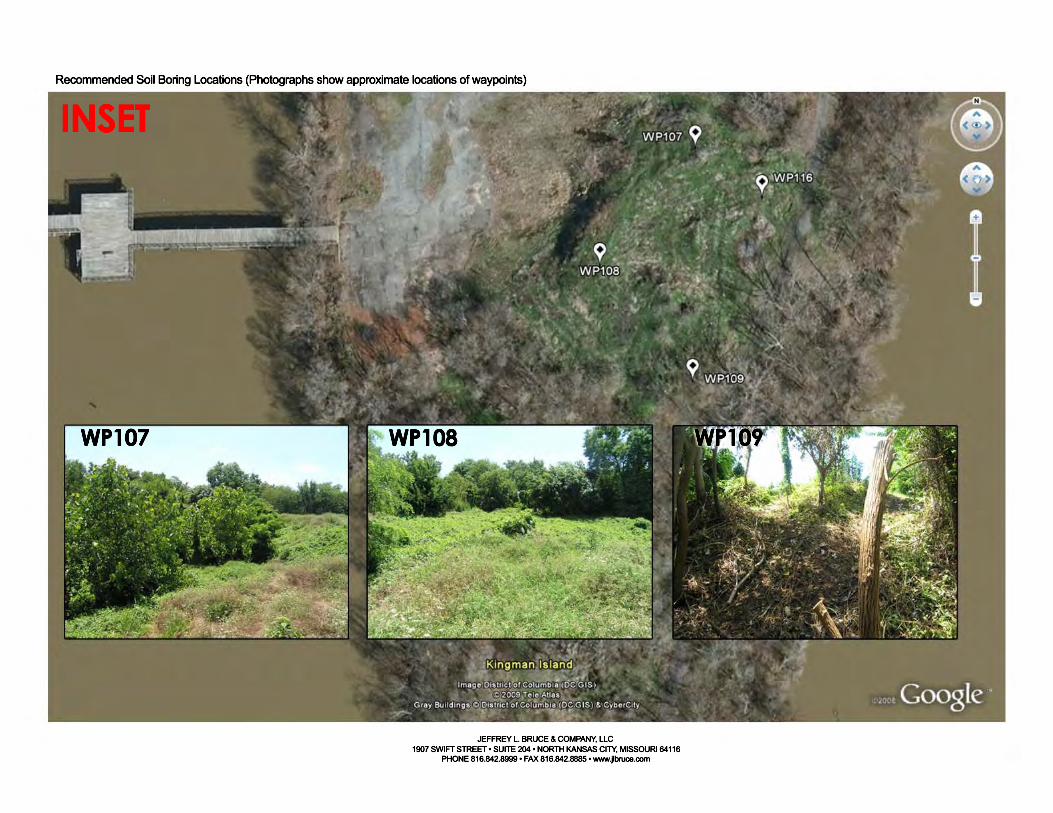

MEMO
J:\archive\2009\1396 - Kingman Island\Project Manual\Correspondence\Memos\090916-Memo.doc JBC Form xxx 11/03
JEFFREY L. BRUCE & COMPANY, LLC 1907 SWIFT STREET • SUITE 204 • NORTH KANSAS CITY, MISSOURI 64116
PHONE 816.842.8999 • FAX 816.842.8885 • www.jlbruce.com
TO: Adrienne McCray DATE: 16-Sep-2009
COMPANY: Lee + Papa and Associates, Inc. By: Mike McGrew
638 Eye St., NW PROJECT: Kingman Island
Washignton, DC 20001 JOB NO.: 1396
PHONE: 2024666666 FAX: 2024664232 CC: Chuck Dixon
RE: Craig Atkins
OBSERVATIONS AND RECOMMENDATIONS The following is an categorized list of observations and recommendations for the use of existing soils at Kingman Island. These observations are drawn from a site visit performed on July 6th, 2009, soil boring tests taken by ECS geotechnical, soils tests performed by Turf Diagnostics and Design laboratory, and review of soil boring samples delivered from the site to our office. The mound soils contain an upper layer of sandy loam soils with a higher organic content than other observed soils on site. These soils are approximately 15’-20’ deep at the top of the south mound. This upper layer of soil does have a large amount of urban debris that need to be removed prior to use. There are four potential options for this soil:
1) All materials that are larger than ¼” or ½’ in size should be screened from this soil and removed. This screened soil media can be utilized in grass/meadow areas, small shrubs, and other understory plants to a depth of 8”-10”. It is not recommended that this soil media be used for tree pits or large plantings as it may not have enough structural stability in high wind situations, even with staking.
2) As in option 1, all materials that are larger than ¼” or ½’ in size should be screened from
this soil and removed. This screen soil media would be used as a veneer soil approximately 2”-3” in depth across all landscape areas. A layer of import soil would be provided underneath this veneer soil approximately 6”-8” in depth for small plantings, and underneath tree pits at depths reflective of tree size (roughly 24” in depth).
3) As in option 1, all materials that are larger than ¼” or ½’ in size should be screened from
this soil and removed. This soil can then be blended with another soil to improve the organic matter content of the soil. The rate would be determined by the property of the other soil blended in (consider the use of silty loam to sandy loam import soil as a blending media). Organic content can also be improved by a well decomposed compost void of bio-solid waste and heavy metals from industrial wastes. Compost should have no more than 40% organic matter derived from wood products and have 60% passing a half inch screen. Compost shall be aged and have been processed through the Mesophilic and Thermophilic decomposition phases. Compost stability shall be determined with the SOLVITA analysis for decomposition status. SOLVITA classification shall not be less than 5. This blended soil media can be used in groves, tree pits, and other areas of larger biomass plantings.
4) The removal of the top layer of material. The soil is marginal in comparison to other
higher quality soil media, and a cost-benefit analysis should be performed to determine if

MEMO
J:\archive\2009\1396 - Kingman Island\Project Manual\Correspondence\Memos\090916-Memo.doc JBC Form xxx 11/03
JEFFREY L. BRUCE & COMPANY, LLC 1907 SWIFT STREET • SUITE 204 • NORTH KANSAS CITY, MISSOURI 64116
PHONE 816.842.8999 • FAX 816.842.8885 • www.jlbruce.com
on-site blending/screening, storage, and placement of the soil is more or less expensive than removal and import of new soil.
Under the upper layer of soils (approximately 15’-20’ deep) is a layer of soils with high gravel content and silty clay. This media would be best utilized for mass grading. These soils should be below tree pit level due to its poor drainage and lower organic content. If this soil layer is cut into with a tree well and backfilled with another soil, it will create a “bathtub” effect in the tree well unless there is a subdrainage solution. Consider the shaping of this lower layer of soils to allow for effective drainage away from any tree wells. The four options for the top layer provided are for the review of LP+A. Our recommended local source for materials and materials costing is below:
Stancills, Inc. 499 Mountain Hill Road Perryville, MD 21903
Terry Stancill: president
877-536-9572
JBC can provide soils design documents with details as needed for the site after direction from LP+A. Please contact our office if you have any further questions.
Signed: Mike McGrew
Jeffrey L. Bruce & Company