Atswa Economics
410
NOTE: This is a work in progress. All topics in the syllabus are covered but editing for necessary corrections is in progress. Thanks. i ATSWA ACCOUNTING TECHNICIANS SCHEME WEST AFRICA STUDY PACK PUBLICATION OF ASSOCIATION OF ACCOUNTANCY BODIES IN WEST AFRICA (ABWA) SECOND EDITION
-
Upload
legogie-moses-anoghena -
Category
Documents
-
view
251 -
download
23
Transcript of Atswa Economics

NOTE: This is a work in progress. All topics in the syllabus are covered but editing for necessary corrections is in progress.
Thanks.
i
ATSWA ACCOUNTING TECHNICIANS SCHEME WEST AFRICA
STUDY PACK
PUBLICATION OF ASSOCIATION OF ACCOUNTANCY BODIES IN WEST AFRICA (ABWA)
SECOND EDITION

NOTE: This is a work in progress. All topics in the syllabus are covered but editing for necessary corrections is in progress.
Thanks.
ii
ASSOCIATION OF ACCOUNTANCY BODIES IN WEST
AFIRCA (ABWA)
ACCOUNTING TECHNICIANS SCHEME
WEST AFRICA (ATSWA)
STUDY PACK FOR
ECONOMICS
SECOND EDITION

NOTE: This is a work in progress. All topics in the syllabus are covered but editing for necessary corrections is in progress.
Thanks.
iii
Copyright (c) 2009 by Association of Accountancy Bodies in West Africa (ABWA). All rights
reserved. No part of this publication may be reproduced or distributed in any form or by
any means, or stored in a database or retrieval system, without the prior written consent of
the copyright owner. Including, but not limited to, in any network or other electronic
storage or transmission, or broadcast for distance learning.
Published by ABWA PUBLISHERS
DISCLAIMER
This book is published by ABWA, however, the views are entirely that of the
writers.
PREFACE

NOTE: This is a work in progress. All topics in the syllabus are covered but editing for necessary corrections is in progress.
Thanks.
iv
INTRODUCTION
The Council of the Association of Accountancy Bodies in West Africa (ABWA) recognised the
difficulty of students when preparing for the Accounting Technicians Scheme West Africa
examinations. One of the major difficulties has been the non-availability of study materials
purposely written for the scheme. Consequently, students relied on text books written in
economic and socio-cultural environments quite different from the West African
environment.
AIM OF THE STUDY PACK
In view of the above, the quest for good study materials for the subjects of the examinations
and the commitment of the ABWA Council to bridge the gap in technical accounting training
in West Africa led to the production of this Study Pack.
The Study Pack assumes a minimum prior knowledge and every chapter reappraises basic
methods and ideas in line with the syllabus.
READERSHIP
The Study Pack is primarily intended to provide comprehensive study materials for students
preparing to write the ATSWA examinations.
Other beneficiaries of the Study Pack include candidates of other Professional Institutes,
students of Universities and Polytechnics pursuing first degree and post graduate studies in
Accounting, advanced degrees in Accounting as well as Professional Accountants who may
use the Study Pack as reference material.
APPROACH
The Study Pack has been designed for independent study by students and as such concepts
have been developed methodically or as a text to be used in conjunction with tuition at
schools and colleges. The Study Pack can be effectively used as a course text and for
revision. It is recommended that readers have their own copies.

NOTE: This is a work in progress. All topics in the syllabus are covered but editing for necessary corrections is in progress.
Thanks.
v
FORWARD
The ABWA Council, in order to actualize its desire and ensure the success of students at the
examinations of the Accounting Technicians Scheme West Africa (ATSWA), put in place a
Harmonisation Committee, to among other things, facilitate the production of Study Packs
for students. Hitherto, the major obstacle faced by students was the dearth of study texts
which they needed to prepare for the examinations.
The Committee took up the challenge and commenced the task in earnest. To start off the
process, the existing syllabus in use by some member Institutions were harmonized and
reviewed. Renowned professionals in private and public sectors, the academia, as well as
eminent scholars who had previously written books on the relevant subjects and
distinguished themselves in the profession, were commissioned to produce Study Packs for
the twelve subjects of the examination.
A minimum of two Writers and a Reviewer were tasked with the preparation of a Study Pack
for each subject. Their output was subjected to a comprehensive review by experienced
imprimaturs. The Study Packs cover the following subjects:
PART I
1 Basic Accounting Processes and Systems
2 Economics
3 Business Law
4 Communication Skills
PART II
1 Principles and Practice of Financial Accounting
2 Public Sector Accounting
3 Quantitative Analysis
4 Information Technology
PART III
1 Preparation and Audit of Financial Statements
2 Cost Accounting and Budgeting
3 Preparation Tax Computation and Returns
4 Management

NOTE: This is a work in progress. All topics in the syllabus are covered but editing for necessary corrections is in progress.
Thanks.
vi
Although, these Study Packs have been specially designed to assist candidates preparing for
the technicians examinations of ABWA, they should be used in conjunction with other
materials listed in the bibliography and recommended text.
PRESIDENT, ABWA

NOTE: This is a work in progress. All topics in the syllabus are covered but editing for necessary corrections is in progress.
Thanks.
vii
ACKNOWLEDGEMENT
We are grateful to the following copyright holders for permission to use their intellectual
properties:
● The Institute of Chartered Accountants of Nigeria (ICAN) for the use of the Institute’s
examination materials;
● International Federation of Accountants (IFAC) for the use of her various
publications;
● International Accounting Standards Board (IASB) for the use of International
Accounting Standards;
● Nigerian Accounting Standards Board (NASB) for the use of Statements of
Accounting Standards (SAS); and
● Owners of Trademarks and Trade names referred to or mentioned in this study pack.
We have made every effort to obtain permission for use of intellectual materials in this
study pack from the appropriate sources. If there are any errors or omissions, please contact
the publisher who will make suitable acknowledgement in the reprint.
We wish to acknowledge the immense contributions of the writers and reviewers of this
manual.
The contribution of various imprimaturs and workshop facilitators who spent precious hours
writing and reviewing the study packs can not be overlooked. Without their input, we would
not have had these study packs. We salute them.
Our sincere appreciation goes to the members of the following committees of the Institute
of Chartered Accountants of Nigeria who contributed their resources to make this project a
reality.
● Students’ Affairs Committee
● Examination Committee
● Technical Committee on Syllabus Review
● Syllabus Implementation Committee
Finally, we are indebted to the Council of the Institute of Chartered Accountants of Nigeria for the Financial and moral support which gave impetus to the production of
this study pack.
Mrs. E.O. Adegite Chairperson

NOTE: This is a work in progress. All topics in the syllabus are covered but editing for necessary corrections is in progress.
Thanks.
viii
ATSWA Harmonization Committee
STRUCTURE OF THE STUDY PACK
The layout of the chapters has been standardized so as to present information in a simple
form that is easy to assimilate.
The Study Pack is organised into chapters. Each chapter deals with a particular area of the
subject, starting with learning objective and a summary of sections contained therein.
The introduction also gives specific guidance to the reader based on the contents of the
current syllabus and the current trends in examinations. The main body of the chapter is
subdivided into sections to make for easy and coherent reading. However, in some
chapters, the emphasis is on the principles or applications while others emphasise method
and procedures.
At the end of each chapter is found the following:
Summary
Points to note (these are used for purposes of emphasis or clarification);
Examination type questions; and
Suggested answers.
HOW TO USE THE STUDY PACK
Students are advised to read the Study Pack attempt the questions before checking the
suggested answers

NOTE: This is a work in progress. All topics in the syllabus are covered but editing for necessary corrections is in progress.
Thanks.
ix
Table of Contents TITLE PAGE................................................................................................................................i
COPYRIGHT AND DISCLAIMERS.................................................................................................ii
PREFACE...................................................................................................................................iii
STRUCTURE OF THE STUDY PACK.............................................................................................iv
FORWARD..................................................................................................................................v
ACKNOWLEDGEMENT.............................................................................................................vi
TABLE OF CONTENTS...............................................................................................................vii
CHAPTER ONE THE ECONOMY 1.0 LEARNING OBJECTIVES.................................................................................................1
1.1 INTRODUCTION............................................................................................................1
1.2 BASIC ECONOMIC CONCEPTS........................................................................................2
1.3 MICROECONOMICS AND MACROECONOMICS.............................................................4
1.4 BASIC ECONOMIC PROBLEMS.......................................................................................5
1.5 ECONOMIC SYSTEMS..................................................................................................11
1.6 THE METHODOLOGY OF ECONOMICS.........................................................................17
1.7 SUMMARY AND CONCLUSION....................................................................................19
CHAPTER TWO THE PRICE SYSTEM 2.0 LEARNING OBJECTIVES...............................................................................................22
2.1 INTRODUCTION...........................................................................................................22
2.2 DEMAND.....................................................................................................................22
2.3 SUPPLY.........................................................................................................................36
2.4 MARKET DETERMINARION OF EQUILIBRIUM PRICE AND QUANTITY.........................45
2.5 SHIFTS IN DEMAND AND SUPPLY................................................................................47
2.6 APPLICATION OF DEMAND AND SUPPLY: PRICE CONTROL.......................................51
2.7 SUMMARY AND CONCLUSION...................................................................................56
2.8 REVISION QUESTIONS................................................................................................57

NOTE: This is a work in progress. All topics in the syllabus are covered but editing for necessary corrections is in progress.
Thanks.
x
CHAPTER THREE ELASTICITY OF DEMAND AND SUPPLY 3.0 LEARNING OBJECTIVES..........................................................................................70
3.1 INTRODUCTION......................................................................................................70
3.2 OWN PRICE ELASTICITY OF DEMAND....................................................................70
3.3 INCOME ELASTICITY OF DEMAND.........................................................................78
3.4 CROSS PRICE ELASTICITY OF DEMAND...................................................................80
3.5 PRICE ELASTICITY OF SUPPLY..................................................................................82
3.6 SUMMARY AND CONCLUSION...............................................................................86
3.7 REVISION QUESTIONS............................................................................................87
CHAPTER FOUR THE THEORY OF CONSUMER BEHAVIOUR 4.0 LEARNING OBJECTIVES...............................................................................................96
4.1 INTRODUCTION...........................................................................................................96
4.2 THE MARGINAL UTILITY THEORY.................................................................................96
4.3 THE INDIFFERENCE CURVE THEORY..........................................................................104
4.4 THE CONSUMER’S SURPLUS......................................................................................119
4.5 SUMMARY AND CONCLUSION..................................................................................120
4.6 REVISION QUESTIONS...............................................................................................120
CHAPTER FIVE THE PRODUCTION PROCESS 5.0 LEARNING OBJECTIVES..............................................................................................123
5.1 INTRODUCTION.........................................................................................................123
5.2 TYPES OF PRODUCTION............................................................................................123
5.3 FACTORS OF PRODUCTION........................................................................................124
5.4 THE PRODUCTION FUNCTION...................................................................................126
5.5 PRODUCTION ANALYSIS IN THE SHORT-RUN...........................................................128
5.6 PRODUCTION ANALYSIS IN THE LONG-RUN............................................................132
5.7 DIVISION OF LABOUR...............................................................................................134
5.8 LOCATION AND LOCALIZATION OF INDUSTRIES......................................................136
5.9 FORMS OF BUSINESS ORGANISATIONS....................................................................139
5.10 PRIVATISATION AND COMMERCIALISATON............................................................141

NOTE: This is a work in progress. All topics in the syllabus are covered but editing for necessary corrections is in progress.
Thanks.
xi
5.11 NATIONALISATION..............................................................................................144
5.12 DEREGULATION...................................................................................................146
5.13 SUMMARY AND CONLUSION..............................................................................148
5.14 REVISION QUESTIONS.........................................................................................151
CHAPTER SIX COSTS, REVENUE AND PROFIT MAXIMIZATION 6.0 LEARNING OBJECTIVES........................................................................................156
6.1 INTRODUCTION...................................................................................................156
6.2 SHORT-RUN COST ANALYSIS...........................................................................160
6.3 LONG-RUN COST ANALYSIS.............................................................................162
6.4 REVENUE CONCEPTS...........................................................................................169
6.5 PROFIT CONCEPTS...............................................................................................173
6.6 SUMMARY AND CONCLUSION..........................................................................176
6.7 REVISION QUESTION...........................................................................................176
CHAPTER SEVEN PERFECT COMPETITION 7.0 LEARNING OBJECTIVES............................................................................................184
7.1 INTRODUCTION.......................................................................................................184
7.2 CHARACTERISTICS OF PERFECT COMPETITION.......................................................186
7.3 SHORT-RUN QUILIBRIUM OF THE PERFECTLY COMPETITIVE FIRM.......................188
7.4 LONG-RUN EQUILIBRIUM OF THE PERFECTLY COMPETITIVE FIRM........................188
7.5 THE SHUT DOWN POINT FOR A PERFECTLY COMPETITIVE FIRM..........................189
7.6 ADVANTAGES AND DISADVANTAGES OF PERFECT COMPETITION.........................190
7.7 SUMMARY AND CONCLUSION.................................................................................192
7.8 REVISION QUESTIONS...............................................................................................193
CHAPTER EIGHT MONOPOLY 8.0 LEARNING OBJECTIVES...........................................................................................195
8.1 INTRODUCTION......................................................................................................195
8.2 CHARACTERISTICS OF MONOPOLY.........................................................................195
8.3 SOURCES OF MONOPOLY POWER..........................................................................196

NOTE: This is a work in progress. All topics in the syllabus are covered but editing for necessary corrections is in progress.
Thanks.
xii
8.4 THE SHORT-RUN EQUILIBRIUM OF A MONOPOLY..................................................196
8.5 THE LONG-RUN EQUILIBRUIM OF A MONOPOLY...................................................198
8.6 MONOPOLY PRICE DISCRIMINATION......................................................................199
8.7 ADVANTAGES AND DISADVANTAGES OF MONOPOLY............................................200
8.8 COMPARISON BETWEEN MONOPOLY AND PERFECT COMPETITION....................201
8.9 SUMMARY AND CONCLUSION...............................................................................202
8.10 REVISION QUESTIONS..............................................................................................202
CHAPTER NINE MONOPOLISTIC COMPETITION AND OLIGOPOLY 9.0 LEARNING OBJECTIVES............................................................................................205
9.1 INTRODUCTION........................................................................................................205
9.2 CHARACTERISTICS OF MONOPOLISTIC COMPETITION...........................................206
9.3 SHORT-RUN EQUILIBRIUM UNDER MONOPOLISTIC COMPETITION......................206
9.4 LONG-RUN EQUILIBRIUM UNDER MONOPOLISTIC COMPETITION........................207
9.5 CHARACTERISTICS OF OLIGOPOLY..........................................................................208
9.6 THE BEHAVIOUR OF FIRMS UNDER OLIGOPOLY.....................................................209
9.7 SUMMARY AND CONCLUSION.................................................................................211
9.8 REVISION QUESTIONS..............................................................................................211
CHAPTER TEN NATIONAL INCOME ACCOUNTING 10.0 LEARNING OBJECTIVES............................................................................................214
10.1 WHY NATIONAL ACCOUNTING................................................................................214
10.2 DEFINITION AND BASIC CONCEPTS.........................................................................214
10.3 BASIC CONCEPTS OF NATIONAL INCOME................................................................221
10.4 METHODS OF COMPUTING NATIONAL INCOME....................................................224
10.5 PROBLEM OF MEASURING NATIONAL INCOME......................................................224
10.6 USES OF NATIONAL INCOME ESTIMATES................................................................225
10.7 SUMMARY AND CONCLUSION................................................................................225
10.8 REVISIONS QUESTIONS............................................................................................225
CHAPTER ELEVEN NATIONAL INCOME DETERMINATION 11.0 LEARNING OBJECTIVES........................................................................................235

NOTE: This is a work in progress. All topics in the syllabus are covered but editing for necessary corrections is in progress.
Thanks.
xiii
11.1 INTRODUCTION....................................................................................................235
11.2 FACTORS DETERMINING THE SIZE OF NATIONAL INCOME.................................235
11.3 COMPONENTS OF AGGREGATE EXPENDITURE (REVISITED)...............................236
11.4 EQUILIBRIUM LEVEL OF NATIONAL INCOME AND MULTIPLIER........................238
11.5 THE ACCELERATOR PRINCIPLE OF INVESTMENT................................................243
11.6 SUMMARY AND CONCLUSION............................................................................244
11.7 REVISION QUESTIONS..........................................................................................246
CHAPTER TWELVE MONEY 12.0 LEARNING OBJECTIVES.......................................................................................252
12.1 INTRODUCTION.........................................................................................,.........252
12.2 THE FUNCTIONS OF MONEY...............................................................................253
12.3 THE CHARACTERISTICS OF MONEY....................................................................254
12.4 TYPES OF MONEY...............................................................................................260
12.5 THE NATURE OF MONEY.....................................................................................268
12.6 THE SUPPLY OF MONEY.......................................................................................268
12.7 THE DEMAND FOR MONEY.................................................................................273
12.8 THE QUANTITY THEORY OF MONEY..................................................................275
12.9 SUMMARY AND CONCLUTION...........................................................................278
12.10 REVISION QUESTIONS........................................................................................278
CHAPTER THIRTEEN FINANCIAL INSTITUTIONS 13.0 LEARNING OBJECTIVES........................................................................................282
13.1 INTRODUCTION...................................................................................................282
13.2 CENTRAL BANKING..............................................................................................283
13.3 COMMERCIAL AND MERCHANT BANKING.........................................................284
13.4 DEVELOPMENT BANKING....................................................................................285
13.5 OTHER FINANCIAL INSTITUTIONS.......................................................................286
13.6 MONEY AND CAPITAL MARKETS.........................................................................288
13.7 MONETARY POLICY...............................................................................................289
13.8 SUMMARY AND CONCLUSION............................................................................289
13.9 REVISION QUESTIONS............................................................................................289

NOTE: This is a work in progress. All topics in the syllabus are covered but editing for necessary corrections is in progress.
Thanks.
xiv
CHAPTER FOURTEEN FUNDAMENTALS OF PUBLIC FINANCE 14.0 LEARNING OBJECTIVES...........................................................................................292
14.1 INTRODUCTION......................................................................................................292
14.2 GOVERNMENT REVENUE.......................................................................................293
14.3 GOVERNMENT EXPENDITURE...............................................................................299
14.4 TAXATION...............................................................................................................302
14.5 GOVERNMENT BUDGET........................................................................................303
14.6 PUBLIC DEBT..........................................................................................................305
14.7 FISCAL POLICY........................................................................................................308
14.8 SUMMARY AND CONCLUSION..............................................................................308
14.9 REVISION QUESTIONS............................................................................................309
CHAPTER FIFTEEN INFLATION AND UNEMPLOYMENT 15.0 LEARNING OBJECTIVES...........................................................................................311
15.1 MEANING OF INFLATION........................................................................................311
15.2 THEORIES OF INFLATION.........................................................................................312
15.3 UNEMPLOYMENT....................................................................................................315
15.4 SUMMARY AND CONCLUSIONS..............................................................................318
15.5 REVISION QUESTIONS..............................................................................................322
CHAPTER SIXTEEN INTERNATIONAL TRADE AND FINANCE 16.0 LEARNING OBJECTIVES..........................................................................................324
16.1 MEANING OF INTERNATIONAL TRADE.................................................................326
16.2 BASIS OR REASONS FOR INTERNATONAL TRADE..................................................327
16.3 THE THEORIES OF INTERNATIONAL TRADE...........................................................330
16.4 ADVANTAGES AND DISADVANTAGES OF INTERNATIONAL TRADE......................330
16.5 TERMS OF TRADE, REASONS FOR PROTECTING TRADE AND TRADE BARRIERS........334
16.6 BALANCE OF PAYMENTS........................................................................................336
16.7 FOREIGN EXCHANGE POLICY.................................................................................336
16.8 SUMMARY AND CONCLUSION...............................................................................337
16.9 REVISION QUESTIONS.............................................................................................337

NOTE: This is a work in progress. All topics in the syllabus are covered but editing for necessary corrections is in progress.
Thanks.
xv
CHAPTER SEVENTEEN
INTERNATIONAL AND REGIONAL ORGANISATIONS
18.0 LEARNING OBJECTIVE............................................................................................................367
18.1 INTRODUCTION.....................................................................................................................367
18.2 THE WORLD BANK GROUP.....................................................................................................373
18.3 INTERNATIONAL MONETARY FUND (IMF).............................................................................375
18.4 THE AFRICAN DEVELOPMENT BANK (ADB) GROUP...............................................................375
18.5 THE EUROPEAN UNION (EU)..................................................................................................378
18.6 THE ECONOMIC COMMUNITY OF WEST AFRICAN STATES (ECOWAS)..................................380
18.7 THE GENERAL AGREEMENT ON TARIFFS AND TRADE (GATT)................................................382
18.8 WORLD TRADE ORGANISATION (WTO).................................................................................383
18.9 UNITED NATIONS CONFERENCE ON TRADE AND DEVELOPMENT (UNCTAD)..................................385
18.10 ORGANISATION OF PETROLEUM EXPORTING COUNTRIES (OPEC)........................................386
18.11 SUMMARY AND CONCLUSION...................................................................................... ......387
18.12 REVISION QUESTIONS...........................................................................................................387
CHAPTER EIGHTEEN
ECONOMIC GROWTH AND DEVELOPMENT
19.0 LEARNING OBJECTIVES.......................................................................................................390 19.1 INTRODUCTION..................................................................................................................390
19.2 ECONOMIC GROWTH AND ECONOMIC DEVELOPMENT....................................................390
19.3 SOURCES OF ECONOMIC GROWTH....................................................................................391
19.4 COMMON CHARACTERISTICS OF DEVELOPING COUNTRIES..............................................391
19.5 ECONOMIC PLANNING........................................................................................................393
19.6 POPULATION........................................................................................................................395
19.7 SUMMARY AND CONCLUSION...............................................................................................396
19.8 REVISION QUESTION.............................................................................................................397
APPENDIX I
SUGGESTIONED SOLUTIONS TO REVISION QUESTIONS.............................................................403
APPENDIX II
COMPREHENSIVE QUESTIONS AND SUGGESTED SOLUTIONS....................................................414

NOTE: This is a work in progress. All topics in the syllabus are covered but editing for necessary corrections is in progress.
Thanks.
xvi
PAPER 2: ECONOMICS
AIM
To examine candidates’ knowledge of basic principles and practice of Economics required of an
Accounting Technician to function efficiently and effectively as a member of an organization.
OBJECTIVES
On completion of this paper, candidates should be able to know and understand the:
(a) basic economic concepts and principles in the analysis of economic issues;
(b) features of the general economic environment in which individual, firm, government and
other economic units operate;
(c) basis for rational economic decisions;
(d) activities of regional and international economic organizations with reference to their
impact on the domestic economy; and
(e) economic implications of the increasing inter-connections among nations of the world.
STRUCTURE OF THE PAPER
The paper will be a three-hour paper divided into three Sections:
Section A (50 marks): This shall consist of 50 compulsory questions made up of 30 Multiple-choice
Questions (MCQs) and 20 Short Answer Questions (SAQs) covering the entire syllabus.
Section B Microeconomics (25 marks): This shall consist of three questions, out of which, candidates
are expected to attempt any two, each at 12½ marks.
Section C Macroeconomics (25 marks): This shall consist of three questions, out of which, candidates
are expected to attempt any two, each at 12½ marks.
CONTENTS MICROECONOMICS 40%
1. An introduction to Economics and Economy 5%
(a) Definition and scope of Economics
(b) Basic economic concepts: Scarcity, choice, scale of preference, opportunity cost and
production possibility curve (PPC)
(c) Main branches of Economics:
(i) Microeconomics

NOTE: This is a work in progress. All topics in the syllabus are covered but editing for necessary corrections is in progress.
Thanks.
xvii
(ii) Macroeconomics
(d) Basic economic problems of society
(e) Types, features and functions of economic systems
(f) The methodology of Economics
2. Theory of Value 10%
(a) The concepts of demand and supply: Laws of demand and supply
(b) Determinants of demand and supply: Demand and supply functions
(c) Determination of consumer and producer surplus using demand and supply
diagrams
(d) Distinction between changes in quantity demanded/supplied and changes in
demand/supply
(e) Determination of equilibrium price
(f) Changes in demand and supply and their effects on the market situation
(g) Exceptions to the laws of demand and supply
(h) Application of demand – supply diagram: Price control and minimum wage
legislation
(i) Elasticity of demand and supply: Determinants, numerical evaluation, interpretation
and application of :
(i) Price elasticity of demand and supply
(ii) Income elasticity of demand
(iii) Cross-price elasticity of demand
3. Theory of Consumer Behaviour 5%
(a) The marginal utility theory
(b) The indifference curve theory
4. Theory of Production 15%
(a) Meaning, types and factors of production
(b) Rewards to factors of production:

NOTE: This is a work in progress. All topics in the syllabus are covered but editing for necessary corrections is in progress.
Thanks.
xviii
(i) Wages, rent, interest and profits
(ii) The concepts of economic rent, quasi rent and transfer earnings
(c) Short-run and long-run in production analysis
(d) Product concepts: total product, average product and marginal product
(e) Law of diminishing returns
(f) Law of returns to scale
(g) Economies and diseconomies of scales/predominance of small firms
(h) Cost concepts: total cost, average cost and marginal cost – their behaviours and
relationships
(i) Revenue concepts: total revenue, average revenue and marginal revenue
(j) Division of labour: meaning, advantages, disadvantages and limitations
(k) Location of industry: meaning and factors influencing location of industry
with appropriate examples from the West African Sub-region
(l) Localisation of industries: meaning, advantages and disadvantages
(m) (i) Business organisation: types, features, advantages and disadvantages
(ii) Privatisation, Commercialisation, Nationalisation and Deregulation.
5. Market Structures 5%
(a) The concept of market
(b) Distinction between perfect and imperfect markets
(c) Meaning and features of perfect competition, monopoly, monopolistic competition,
monophony, oligopoly and duopoly
(d) Price and output determination in the short-run and long-run under the conditions
of perfect competition, monopoly and monopolistic competition
(e) Product differentiation and price discrimination
(f) Sources and control of monopoly power
(g) Mergers and acquisitions, their advantages and disadvantages
MACROECONOMICS 60%
6. National Income 10%

NOTE: This is a work in progress. All topics in the syllabus are covered but editing for necessary corrections is in progress.
Thanks.
xix
(a) Basic national income accounting concepts: Gross Domestic Product (GDP), Gross
National Product (GNP), Net National Product (NNP), National Income (NI), Personal
Income (PI)and Personal Disposable Income (PDI)
(b) Methods of computing National Income
(i) Income approach
(ii) Output or product approach
(iii) Expenditure approach
(c) The concept of circular flow of income
(d) Problems of measuring national income
(e) Uses and limitations of national income statistics
(f) Factors determining the size of national income
(g) The concepts of consumption, savings and investments within the framework of
Keynesian macroeconomic setting
(h) Determination of equilibrium national income and the concept of multiplier
(i) The accelerator theory
7. Money and Banking 10%
(a) Money – Definition, evaluation, functions, characteristics, types and nature
(b) The supply of and demand for money
(c) The quantity theory of money
(d) The banking system:
(i) Commercial and Merchant Banks
(ii) Universal banking concept
(iii) The Central Bank - Conventional and developmental functions
(iv) Development banks, Deposit Insurance Corporation, Insurance Companies and
other Financial Institutions.
(e) The money and capital markets: institutions and instruments.
(f) Monetary policy: Meaning, targets and instruments.
8. Fundamentals of Public Finance 10%

NOTE: This is a work in progress. All topics in the syllabus are covered but editing for necessary corrections is in progress.
Thanks.
xx
(a) The concept of public finance
(b) Sources of government revenue and pattern of government expenditure
(c) Taxation: Forms, principles and uses
(d) National Budget
(i) Types and its role in the economy
(ii) Sources of finance for a deficit budget
(e) Public Debt: Meaning, types and its roles in the economy
(f) Fiscal Policy: Meaning, targets and instruments
9. Inflation and Unemployment 5%
(a) Inflation: concepts, types, causes, effects and control
(b) Unemployment: concepts, types, causes, effects and control
(c) Inflation and unemployment problems in West Africa and efforts to control them
10. International Trade and Finance 10%
(a) Distinction between Internal and International trade
(b) Reasons for International Trade
(c) Theory of comparative cost advantage
(d) Advantages and disadvantages of International Trade
(e) Terms of trade, balance of trade and balance of payments
(f) Trade barriers and the case for and against protectionism
(g) The concepts of foreign exchange, foreign exchange rate, foreign exchange markets
and foreign exchange regimes – fixed and floating exchange rate regimes
(h) Currency devaluation, revaluation, depreciation and appreciation, and their
implications for the economy
(i) Globalisation and developing countries
11. International and Regional Organisations 10%
(a) Functions of:

NOTE: This is a work in progress. All topics in the syllabus are covered but editing for necessary corrections is in progress.
Thanks.
xxi
(I) The World Bank Group
- International Bank for Reconstruction and Development (IBRD)
- International Finance Corporation (IFC)
- Multilateral Investment Guarantee Agency (MIGA)
(II) International Monetary Fund (IMF)
(III) The African Development Bank (ADB) Group
- African Development Bank (ADB)
- African Development Fund (ADF)
- The Nigerian Trust Fund (NTF)
(b) Economic Integration
(i) Meaning and levels
(ii) The Economic Community of West African States (ECOWAS)
(c) Organisation of Petroleum Exporting Countries (OPEC)
(d) United Nations Conference on Trade and Development (UNCTAD)
(e) General Agreements on Trade and Tariff (GATT)
(f) World Trade Organisation (WTO)
12. Economic Growth and Development 5%
(a) Concept and determinants of economic growth
(b) Concept of economic development
(c) Common characteristics of developing countries
(d) Development planning: Concepts, objectives, types and problems
RECOMMENDED TEXTS:
1. ATSWA Study Pack on Economics
2. Adebayo, Ademola (1988), Economics: A Simplified Approch, Lagos: African International
Publishing Ltd, Volume 1 and 2
3. Nkoom, J C (), Money Economics in Ghana

NOTE: This is a work in progress. All topics in the syllabus are covered but editing for necessary corrections is in progress.
Thanks.
xxii
OTHER REFERENCE BOOK
Begg, D., Fisher, S. and R. Dornbuscg (2008), Economics, New York: The McGraw Hill Education Ltd

NOTE: This is a work in progress. All topics in the syllabus are covered but editing for necessary corrections is in progress.
Thanks.
1
CHAPTER ONE
AN INTRODUCTION TO ECONOMICS AND THE ECONOMY
1.0 LEARNING OBJECTIVES
After studying this chapter, you should be able to
Understand the nature, scope and methodology of economics
Have good grasp of the fundamental economic problems facing all societies and how
the problems are solved in different econimics systems.
1.1 INTRODUCTION
A simple and most widely quoted definiation of economics is that given by the British
Econmists, Lionel Charles Robbin (1898 – 1984):
Economics is the science which studies human behaviour as a relationship between ends
and scare means which have alternative uses.
In the above definition, the word ‘ENDS’ refers to human wants usually classified as goods
and services. The word ‘MEANS’ refers to productive resources otherwise called factors of
production. In every society, the productive resources are combined in different ways to
produce different types of goods and services.
Economics is described as a science subject based on the way econimists study and explain
human behaviour concerning how best to allocate scarce resorces among competing uses.
The economists adopt scientific method in which theories of human beahviour and
developed and tested against the facts in a way similar to the practice in the pure sciences
like Chemistry and physics. However, economics is more appropriately placed within the
social sciences because its subject matter, human behaviour in the production, distribution
and comsumption of goods and services can neither be controlled in the laboratory nor be
predicted with absolute accuracy.
1.2 BASIC ECONOMIC CONCEPTS
A number of basic concepts or terms lie at the heart of economic science. The most
important ones are explaine in this section.
1.2.1 Economy
The word is used to refer to a particular system of organisation of economic
activities i.e. production, distribution, exchange and consumption of all things
required to satisfy human wants. In this sense, we often speak of the Nigeiran

NOTE: This is a work in progress. All topics in the syllabus are covered but editing for necessary corrections is in progress.
Thanks.
2
economy or the Ghanian economy, developed or developing economy, capitalist,
socialist or mixed economy.
1.2.2 Goods and Services
In economiics, the term goods referes to meterial or physical things which can be
seen or touched and used to satisfy human wants. Examinples include food items,
cars, shoes, wristwatch, industrial equipment and machineries, etc. Goods are
classified in different ways. One classification is economic goods and non-economic
goods. Economic goods are those goods whcih have prices and their production
requires scarce resources having competing uses. On the other hand the term non-
economic goods refers to things that are unlimited in supply and can be obtained
free-without paying a price. Examples on non-economic goods are stream water,
gutter sand, sunshine, air, bush trees, etc.
Economcs activities other than manufacturing or primary goods production are
referred to as services. Examples are banking, shipping, legal, insurance, taurism,
medical care, etc. But it is also common in economics to use the term goods to refer
to both material goods and services which, in this case, is regarded as non-material
goods.
1.2.3 Resources
These are things which are combined in numerous ways to produce goods and
services required for the satisfaction of human wants. Such things are alternatively
referred to as factors of production, and can be classified as:
(i) Natural resources: all free gifts of nature such as arable land, water,
minerals (such as limestone, good etc), fishing ground, forests,
hydroelectricity adn solar energy potentials etc. Natural resources are
collectively rerred to as land in economics.
(ii) Human resources: human efforts in the production process which consist of
various mental and physical ability and skills. The term labour is used for
human resources.
(iii) Capital: man-made resources such as roads, dams, buildings, equipments
and machines which help in the production of other goods that satisfy
human wants directly or indirectly.

NOTE: This is a work in progress. All topics in the syllabus are covered but editing for necessary corrections is in progress.
Thanks.
3
(iv) Enterpreneurship: the person (in case of one-man business) or the business
owners/managers who co-ordinate the other factors of production to
produce and market goods and services and possibly invent and innovate.
1.2.4 Utility
This is the economist’s term for the satisfaction and need fulfillment that people
derive from the consuption use of material goods and services.
1.2.5 Stock and Flow
The term stock referes to a vaiable which has no time demension e.g. 1,000 bags of
cement stored in a warehouse pending sales, which can occur anytime. On the
other hand, if a variable has time demension, it is called a flow. In other wards, the
term flow refers to the quantity of an economic variable measured over a particular
period of time. It follows that 1,000 bags of cement produced or supplied per day
by a cement company is a flow.
1.2.6 Ceteris Paribus
The Latin phrase meaining “all other things being equal”. The ceteris paribus
assumption is more commonly used in economic theory to isolate the effect of a
change in one variable or influencing factor. This implies that “all other variables or
detemining factors are held constant”. Economic theories are simplified and their
validity enhanced with explicit or implicit use of ceteris paribus.
1.27 Rational Behaviour
As used in economics, behaviour in which economic agents i.e. individuals, firms and
govenment do the best they can under given circumstances. For example, the
assumption of consumer rationality implies that the average comsumer in his
purchasing decision will always preper more to less, or the basket of goods that will
give him the maximum utility given his money income and the unit prices of the
goods. The assumption of rationality permits us to explain and predict how people
will act under specific conditions.
1.3 MICROECONOMICS AND MACROECONOMICS
Traditionally economics is divided into two main branches: microeconomics and
macroeconomics.
1.3.1 Microeconomics
Microeconomics is concerned with specific segments of the economy, particularly
the behaviour of individual consumer and firm and of groups of firms in industries.
As a branch of economics, it examines how resources are organised, controlled and
rewarded in various economics activities, as well as how relative prices of goods and

NOTE: This is a work in progress. All topics in the syllabus are covered but editing for necessary corrections is in progress.
Thanks.
4
services are detemined. The main topics falling within microeconomics include the
theory of price and wage determination, the theory of consumer bahaviour, the
theory of production and welfare economics.
1.3.2 Macroeonomics
Macroeconomic is the study of the economy as a whole. In macroeconomics;
emphasis is on aggregate economic variables such as the economy’s level of
employment, total output and income, total money supply, overall government
spending, the levels of taxes, investement and saving, and so on. It follows taht
macroeconomics explores the problems of unemployment, inflation, external
disequilibrium. Sluggish economic growth, general poverty and inequality in the
macroeconomy.
1.4 BASIC ECONOMIC PROBLEMS
Th foundamental economic problems facing every society are discussed in this section.
1.4.1 Scarcity
Economic scarcity means that people do not have as much as they desire. The
problem of scarcity arises as a result of the fact that, at any point in time, the
productive resources available in any soceity are limited, whereas human wants are
unlimited. It follows that the amount of goods and services that can be produced
are limited and inadequate to meet human wants.
Therefore, every society must resolve four fundamental economic questions.
(i) What is to be produceed? Every society must determine in some manner
what goods and services and how much of each to produce during any given
period of time.
(ii) How is the output to be produced? Each firm must decide how to cmpbine
the inputs to achieve optimal resources allocation i.e. the manner of
combination of factors of production in order to produce quantum of goods
and services.
(iii) For whom to produce? That is, for which category of consumer is the goods
being produced. Is it for the young, the old or for both categories?
(iv) How to facilitate future growth? The resources must be utilized at a rate
that would enhance future production possibilities.

NOTE: This is a work in progress. All topics in the syllabus are covered but editing for necessary corrections is in progress.
Thanks.
5
Scarcity is the most fundamental economic problem facing every society. If
resources are not scarce, goods and services would not be scarce and there
would be no need to economise. Consequently, there would be no need to
study economics.
1.4.2 Choice
Choices become necessary as a result of scarcity. Making a choice implies giving up
something in order to get something else. The concept of choice relates to all the
three main economic agents in the economy.
An individual consumer must choose among types of goods and services,
between present and future consumption because of his limited money
income.
The firm must choose what to produce and how to produce within cnstraint
imposeed by its limited resources.
The government must decide what public goods and services to provide for
the people given its limited revenue as projected in the budget documents.
1.4.3 Scale of Preference
It is described as a list of all wants to be satisfied arranged in order of priority
importance. The concept of Scale of Preference underscores the basic assumption in
economics that every economic agent exhibits rational behaviour in the process of
making a choice.
1.4.4 Opportunity Cost
Economists used the term opportunity cost to mean the next best alternative
forgone in the process of making a choice. To an individual consumer, the
opportunity cost of a commodity bought is the next most desirable commodity he
could have bought instead. For example, a housewife desires a tin of rice and a tin
of beans each selling for N200. But since she had only N200, she edecided to buy a
tin of rice. The opportunity cost of a tin of rice bought is a tin of beans forgone.
The concept of opportunity cost is central to the study of econonomics because it
guides the individual, the firm or the govenment to make rational decision on the
use of scarce resources. Opportunity cost is alternatively referred to as real cost or
economics cost.
Note that, the accountant’s review of cost i.e. (accounting cost) is quite different
from the economist’s view of cost i.e. (opportunity cost).

NOTE: This is a work in progress. All topics in the syllabus are covered but editing for necessary corrections is in progress.
Thanks.
6
To the accountants, the cost of a commodity purchased by the consumer or a factor
of production purchased by the firm is the amount of money paid to have that
commodity or productive resources. This is called money cost or accounting cost.
1.4.5 Production Possibilities Curve
A production possibilities curve (PPC) shows the various combinations of two goods
that can be produced in a country when all available resources are fully and
efficiently utilized.
Table 1: Production possibilities Schedule
Product combination
Rice (Bags) Butter (Tins) Opportunity cost of an additional bags
of rice
A B C D E F
0 1 2 3 4 5
80 76 70 60 40 0
- - 4 - 6
- 10 - 20 - 40
The production possibilities schedule presented in Table 1.1 is shown graphically as
production possibilities curve in Figure 1.1
The PPC in Figure 1.1 is drawn under the assumption that the society is using all its
resources to produce only two goods – rice and butter . Fig 1.1 illustates points (i –
iv) below 1.2 ilustrates point (v), while Figure 1.3 ilustrates point (vi).
Figure 1.1 Production Possibilities Curve (PPC)
100
80 A B H
C
60 D
40 G E
20
0 F 1 2 3 4 5 Rice
Bu
tter

NOTE: This is a work in progress. All topics in the syllabus are covered but editing for necessary corrections is in progress.
Thanks.
7
(i) Scacity. The boundary formed by the curve joining points A and F indicates that there is limit to the amount of both rice and better, the country can produce, at any point in time, with available resources and technology.
(ii) Full – employment. Any point on the PPC (such as A to F) shows the combinations of the two
goods that the economy can produce given that all available resources are fully and efficiently utilized.
(iii) Unemployment or underemployment. Any point inside the PPC, such as G. Shows that some
resources are either left completely idle (unemployed) or are not efficiently utilized (underemployed).
(iv) Unattainable output level. Any point outside the curve, such as H, shows the output level
that cannot be achieved by the country.
(v) Opportunity cost. The slope of the PPC usually referred to as marginal rate of transformation (MRT) measures the opportunities cost of a unit more or less of a commodity.
(vi) Economic growth. It can be defined as a sustained increase in the production capacity of an
economy which leads to a greater output of goods and services. This is represented by an outward shift in the production possibilities curve from PPC 1 to PPC2 in Figure 1.3.
Figure 1.2 THE PPC’S ILLUSTRATION OF OPPORTUNITY COST
b1 x
b2 Y
PPC
X
0 r1 r2 Rice
Figure 1.2, the opportunity cost of moving from output X(r1,b1) is output Y(r2, b2) is obtained as
MRTbg = ΔB <0
ΔR < 0
= 𝑏2−𝑏1 <0
r2−r1
If r2 – r1 = 1, the opportunity cost of moving from X to Y is b2 –b1 tins of butter forgone.
Applying this approach to Table 1.1, the opportunity cost of product the 3rd unit of rice is 10 tins
of butter forgone.
Bu
tter

NOTE: This is a work in progress. All topics in the syllabus are covered but editing for necessary corrections is in progress.
Thanks.
8

NOTE: This is a work in progress. All topics in the syllabus are covered but editing for necessary corrections is in progress.
Thanks.
9
1.3 THE PPC’S ILLUSTRATION OF ECONOMIC GROWTH
Butter
PPC1
PPC2
0 Rice 1.5 ECONOMIC SYSTEMS
An economic systems describes the mechanisims by which scarce resources are allocated in
society, both for production and distribution, the nature of the relationship between the
individual and society and the role of government in allocation of resources and the
direction economic activity (Donnelly, 1991).
1.5.1 Types of Economic System
The three main types of economic system – capitalism,socialism and mixed economy
are explained in this section.
1.5.1.1 Capitalisim
This type od economic system, otherwise called free market, free enterpise
or laissez – faire economy is based on private ownership and the freedom
of individuals and firms to conduct their economic activities without
interference from the government.
(a) Features
The main features of capitalism are:
(i) Private ownership: Private individuals and firms own the means of
production and goods in the economy.
(ii) Freedom of choice: Individuals as consumers are free to spend their
money income on those goods they consider desirable to satisfy
their wants. This idea is called consumer soverignty and it
influences what the producers will produce at any point in time.
Hence the statement in the market – economy consumer is the
king”.

NOTE: This is a work in progress. All topics in the syllabus are covered but editing for necessary corrections is in progress.
Thanks.
10
Similarly, the firms are also free to produce any good they want and
which they are capable of producing.
(iii) Limited role for government: The functions of the government are
limited to provision of enabling environment, rules and regulations
for private economic activities to thrive.
(iv) Competition: Individuals and firms freely compete for goods and
resources.
Therefore, in pure capitalism, the fundamental questions of what to
produce, how to prodice and for whom to produce are resolved by price –
mechanism i.e. the interplay of the forces of demand and supply.
(b) Advantages
(i) Optimal allocation of resources: Producers engage their resources
only on those goods which appear to yield maximum profits.
(ii) Greater output and higher income: There is increase in production
and productivity leading to increase in income, saving and
investment.
(iii) Increase in efficiency: The presence of competition leads to a better
use of resources to obtain cost advantage.
(iv) Progress and presperty: Intense competition promotes invention
and innovation thereby bringing economic growth and prosperity.
(c) Disadvantages
(i) Emmergence of Monopoly: cut – throat competition may force small
firms who could not cope to shut down while the big firms may merge
and monopolise the market charging exhorbitant prices.
(ii) Inequality problem is worsened: the rich who own resources and
control production are favoured while the poor become more
impoverished.
(iii) Innefficient production: more resources are allocated to the production
of frivolous goods that are desired by the rich who have the means
while the basic necessities required by the poor are in short supply.

NOTE: This is a work in progress. All topics in the syllabus are covered but editing for necessary corrections is in progress.
Thanks.
11
(iv) Economic depression and unemployment: excessive competition and
unplanned production leads to excess supply, low price level and cut in
the number of workers employed.
1.5.1.2 Soclialism
It is otherwise referred to as the command or centrally planned economy. The
economices of former Soviet Union, Cuba, a number of Eastern European countries
and China are often cited as ready examples.
(a) Features
The main features are
i. Public Ownership: means of production are owned entirely by the central
government.
ii. Public Allocation and Distribution: Prices of goods and services are fixed by
the agencies of government. In order words, the fundamental economic
questions of what to produce, how to produce and for whom to produced
are solved by the government.
(b) Advantages
i. Greater economic efficiency: the government ensures that resources are
allocated to those sectors where they can be used most productuvely.
Therefore, production efficiency is greater than under capitalism.
ii. Absence of Wasterful Competition: Duplication of goods and services or use
of resources on extensive advertisement campaign is avoided.
iii. Less Inequality of Income: Every member of the society is taken care of
within the limits of their relative capabilities and the overall resources of the
state.
iv. Exploitation of Private Monopoly if avoided: State monopoly exists only to
promote overall welfare of the people.
(c) Disadvantages
i. Malallocation of Resources:Resources allocation is based on trial and error
and selfish interest of the ruling class leading to underproduction of goods
required by the poor majority.

NOTE: This is a work in progress. All topics in the syllabus are covered but editing for necessary corrections is in progress.
Thanks.
12
ii. Loss of Consumers’ Sovereignty: Consumers are restricted to only the goods
and services dictated for production by the state.
iii. No Freedom of Enterprise: Every person is employed by the government
and there is tendency for underemployment misallocation of human
resources.
iv. Waste of Resources: Central Planning requires large bureaucratic structures
which waste resources.
v. Poor Quality Product: The absence of competition weakens the drive for
producers to improve on products’ quality.
1.5.1.3 Mixed Economy
It is an economic system which combines features of both capitalism and socialism.
In a mixed economy therefore, there exist private and public ownership of
productive resources. In those areas where the private individuals and firms are
dominat, allocation and distribution of resources is done by price – mechanism. But
in those activities reserved for the government, central planning and administrative
fiat decisions are used to solve fundamental questions on allocation and distribution
of resources, goods and services.
The state intervention, however, is considered necessary to remedy the defects of
the market economy earlier identified.
In the real – world, all economics are mixed, but the extent to which one maixed
economy differs from another depends largely on how the government interprets its
role in the economy.
Advantages
i. Best allocation of resources. A mixed economy combines the good features
of both capitalism and soclialism. Therefore, the resources of the economic
are utilized in a way that ensures the adequacy of all types of goods and
services and production efficiency increases,
ii. General Balance. The competition and cooperation between the public
sector and the private sector favours the realization of a high rate of capital
accumulation and economic growth.
iii. Welfare State. In a mixed economy, there is no exploitation either by the
capitalists or by the state. Government agencies are established to protect

NOTE: This is a work in progress. All topics in the syllabus are covered but editing for necessary corrections is in progress.
Thanks.
13
consumers’ interest, while legislative measures are adopted to reduce
proverty and inequalities of income and wealth.
Disadvantages
i. Non-cooperation between the private and the public sector. In real – life,
public – private sector partnership to promote economic progress is hardly
found. Most often, the private sector is subjected to heavy taxes and
restrictions that impact negatively on its performance, while the public
sector is given subsidies and preferences.
ii. Inefficient public sector. The public sector of a mixed economy works
inefficiently due to bureaucratic control, over-staffing of the personnel,
corruption and nepotism. As a result, resources are misutilised and the level
of production is low.
iii. Economic fluctuations. Periods of economic prosperity and hardship
alternating which are characteristic features of a capitalist economy are
equally experienced in a mixed economy. This is a result of the improper
mixture of the features of capitalism and socialism.
1.5.2 Functions of an Economic System
All economics perform the following functions
(i) Allocation of Resources: Every economy has to decide what and how much
good and services to produce at any given time.
(ii) Organisation of Production: Every economic system must decide what
alternative techniques of production are more suitanle to its circumstances.
(iii) Distribution of Goods and Services: How the goods are shared among
people is determined in every economic system.
(iv) Economic Growth and Development: The mechanisms to grow the
economy and raise average living standard at determined in each economy.
(v) Economic Stability: Every economic system had mechanisms designed to
control fluctuations in the level of economic activity eg. Using fiscal and
monetary policies.

NOTE: This is a work in progress. All topics in the syllabus are covered but editing for necessary corrections is in progress.
Thanks.
14
1.6 THE METHODOLOGY OF ECONOMICS
This section addresses how economists organize their studies to make economic science a
worthwhile field of human endeavour.
1.6.1 The Scientific Method
Economists adopt scientific method in their investigations of economic problems
and economic relationships. In this method, problems and identified and defined,
information relevant to the problem are collected, organized and analysed leading
to the estalishment of an economic theory.
1.6.2 An Economic Theory
An economic theory otherwise referred to as economic law, economic principle or
economic model helps to explain human economic behaviours especially productio,
distribution, exchange and consumption, as well as to predict the likely course of
future events. An economic theory to a particular problem on certain assumptions.
The usefulness of any theory to a particular problem situation depends on how
realistic the given assumptions are.
1.6.3 Words, Graphs and Equations
In economic discussions, three types of language are used – verbal, graphic and
mathematical.
(a) Verbal Statement: The use of words is oftern the easiest way to presentation. It has
the advantage of making discussions in economics available to a wide audience.
(b) Graphs: Bacause of their visual appeal, graphs are used as a further aid to
understanding economic discussions. Moreover, graphs provide a clear picture of
the reltionship between two economic variables.
(c) Equations: Complex relationships, ecpecially three or more dimensional relations or
more are expessed in mathematical language – algebraic statement or functional
relatioship. However, for ease of presentation, variables are often reduced to two
so that they can be shown on graphs.
1.6.4 Limitation of Scientific Method in Economics
The nature of the subject matter of economics i.e. human behaviour imposes limitations in
the use of scientific method in economics. Measurements and controlled experiments,
whcih are vital in the physical sciences, are rearely applicable in economics because people
cannot be expected to behave as predictably as inanimate matter, whcih can be subject of
controleed laboratory experiment.
1.6.5 Positive and Normative Economics
Economics analysis can be divided into two – positive economics and normative economics.

NOTE: This is a work in progress. All topics in the syllabus are covered but editing for necessary corrections is in progress.
Thanks.
15
Positive economics is concerened with describing and analyzing the way things are
or things will be if certain conditions exist. For instance, the statement, an increase
in demand for a commodity will cause its price to increase when other factors
influencing demand and supply condition remain unchanged is a statement in
positive economics. In other words, positive economics is an objective science,
which provides explanations of the working of the economic system.
Normative economics, on the other hand, is concerned with what ought to be,
particularly how economic problems should be solved. It is a subjective science
dealing with those areas of human economic behaviour in which personal value
judgements are made. Normative economics gives rise to statmeents such as
‘money supply should be reduced to lower inlcation rate in the economy’.
1.7 SUMMARY AND CONCLUSION
This chapter identified economic scarcity as the basic economic problem facing all societies,
the fundamental problems of economics and how they are resolved in different economic
societies, as well as how the economists organize the study of their subject. A good grasp of
the discussions in this chapter is critical to the understanding of all areas of economic
science.
1.8 REVISION QUESTIONS
Section A: Multiple Choice Questions
1. Economics can best be defined as the study of
A. How society resolves the problem of scarcity
B. Why productive resources are scarce?
C. How to interpret economic theories
D. The features of different types of economic system
E. How the consumers maximize their utility
2. The fundermental economic problems facing all soceities arise because of
A. Availability of unlimited resources
B. The insatiable wants of man
C. Resources being scarce in relation to human wants
D. Government’s passive role in the economy
E. Large bureaucratic structures of governments

NOTE: This is a work in progress. All topics in the syllabus are covered but editing for necessary corrections is in progress.
Thanks.
16
3. Pure capitalism is an economic system characterized by
I. Private ownership of productive resources
II Freedom of choice and enterpise
III Competition
A. I only
B. II only
C. I and II only
D. III only
E. I, II and III
4. Which of the following is a statement in positive economic?
` A. The pump litre price of petrol should be increased
B. The government ought to provide more hospitals
C. Anti-corruption agancy is desirable in all developing countries
D. There is high rate of inflation in most West-African countries
E. Government should tax the rich more
5. The production possibilities curve can be usefully employed to illustrate
A. Opportunity Cost
B. Economic Scarcity
C. Economic Growth
D. Unemployment
E. All of the above
Section B: Short Answer Questions
1. Goods that have prices and their production requires scarce resources which have
alternative uses are referred to as …………………..
2. The study of aggregate economic variables is the primary concern of……………….
3. The economic system characterized by private ownership of resources is……………
4. The economist who defined Economics as the social science which studies human
behaviour as a relationship between ends and scarce means which have alternative
uses is ………………..
5. The economic term for the satisfaction and fulfillment that people derive from the
consumption of goods and services is ………………

NOTE: This is a work in progress. All topics in the syllabus are covered but editing for necessary corrections is in progress.
Thanks.
17
Solution To Short Answers Questions
CHAPTER ONE
1. Economic goods
2. Macroeconomics
3. Capitalism
4. Lionel Charles Robbins
5. Utility
NOTE: This is a work in progress. All topics in the syllabus are covered but editing for necessary corrections is in progress.
Thanks.
18
CHAPTER TWO
THE PRICE SYSTEM
2.0 LEARNING OBJECTIVES
After studying this chapter, you should be able to:
- Explain the concept of demand
- Explain the concept of supply
- Explain equilibrium in the goods market and factors in the changes of market prices
- Explain application of demand-supply diagram to issues in price control and
minimum wage legislation.
2.1 INTRODUCTION Price is the monetary value of a commodity. It is the amount of money one exchanges for a
commodity. In the free market system, the price of a commodity is determined by the
interaction of the forces of market demand (the collective actions of buyers) and market
supply (the collective actions of sellers). The process by which the market forces of demand
and supply interact to fix the price of a commodity is referred to as the price mechanism.
The market mechanism is the process by which the market forces of demand and supply
interact to fix price and the quantity of a commodity. We will take the market forces of
demand and supply one by one and explain them and further show how they interact to fix
the price of a commodity.
2.2 THE CONCEPT OF DEMAND
As human beings we satisfy our wants by purchasing and consuming goods and services. In
ordinary terms, demand simply means a desire, a wish, or a want. In economics, demand
goes beyond the expression of mere desire, wish or want. It is the desire, wish or want,
backed by the ability to pay for what you desire, wish or want i.e. effective demand.
2.2.1 Definition of Demand Demand is the quantity of goods or services that consumers are willing and are able
to buy at a given price within a specified period of time when all other demand
factors remain unchanged. Hence demand could simply be a set of prices for a good
or service with a corresponding set of quantities.

NOTE: This is a work in progress. All topics in the syllabus are covered but editing for necessary corrections is in progress.
Thanks.
19
2.2.2 The Law of Demand
The way consumers react to a change in the price of a commodity is so typical that
economists state it as a rule of law. This law states that the quantity demanded of a
good is inversely (or opposite) related to its price, when we hold constant other
factors that influence consumer’s consumption of a commodity. An inverse
relationship between quantity demanded and price means that quantity demanded
will increase if or when price falls and quantity demanded will decline if price rises,
all things being equal.
2.2.3 Representative Of Demand
The demand for a commodity may be represented as a schedule, a curve or an
equation.
(a) The Demand Schedule
It is a table or a list of various prices of a commodity and the corresponding
quantities that would be purchased at a particular time period, when all
other demand factors remain constant. For example, Table 1 shows the
Demand Schedule for a commodity called Amala which is sold in bags.
Column 2.1 Table 1 shows a set of prices for Amala and column 2 shows the
quantities of Amala that consumers are wiling and able to buy at each price.
Note: As the price of Amala rose from N1,000 through to N7,000, quantity
demand declined from 120 units to 0 units depicting the law of demand.
Table 2.1 Demand Schedule for Amala
(b) The Demand Curve/Graph
When the demand schedule is graphed, we obtain a demand curve of
Amala. Hence, the demand curve is a graph (or a locus of points) showing
Price (N000)
Quantity Demanded (bags)
1
2
3
4
5
6
7
120
100
80
60
40
20
0

NOTE: This is a work in progress. All topics in the syllabus are covered but editing for necessary corrections is in progress.
Thanks.
20
the various quantities that will be bought at given prices of a commodity
for a given time period, when all other demand factors remain unchanged.
A typical demand curve has a negative slope. That is, it slopes downward
from left to right depicting the law of demand.
Figure 2.1: The Demand Curve of Amala
Price (N)
8 7 D 6 5 4 3 2 1 D 0 20 40 60 80 100 120 140 Quantity Demanded (in Bags)
In figure 2.1, the demand curve is plotted with ‘price’ on the vertical axis and
‘quantity demand’ on the horizontal axis. In Figure 2.1, the demand curve
(DD) is obtained when we plot from the demand schedule in Table 2.1.
(C) The Demand Function/Equation
In defining demand, we said it is the quantity of goods or services that consumers
are willing and are able to buy at a given price within a specified period of time
when all other demand factors remain unchanged. The “other factors” that
influence demand are expected to remain unchanged and thus include consumer
income (Y), prices of related goods and services (PR), consumer taste and preference
which is in turn influenced by advertisement (A). The demand function or demand
equation is a mathematical expression that relates the quantity demanded of goods
and services to all demand factors including the own price of the good or service.
Mathematically, the general demand function is stated as follows: QD = f (Po, Y, PR, A)
Where QD = quantity demanded; Po = the own price of the commodity; Y = consumers’ incomes; PR = prices of other commodities; A = advertisement expenditure on good and service

NOTE: This is a work in progress. All topics in the syllabus are covered but editing for necessary corrections is in progress.
Thanks.
21
This function or equation is read as, “Quantity demanded is a function of (or
depends on) the commodity’s own price, consumer income, prices pf other related
commodities, and the advertisement expenditure. The mathematical notation “f
(…)” read “is a function of” and tells us what factors the quantity demanded of a
commodity is dependent on. When the other demand factors apart from the
commodity’s own price are held constant the general demand function reduces to:
Qd = f (Po ) Illustration
The demand function for Amala is given as:
Qd = 140 – 0.02P,
where P is the price and Qd, the quantity demanded of the product.
Find the quantity that will be consumed when price is
(a) N1,000 (b) N1,500
Solution
From the demand function:
Qd = 140 – 0.02 P
(a) If price is c1,000, the quantity consumed will be:
Qd = 140 – 0.02 (1,000) = 140 – 20 = 120
i.e. consumers will buy 120 bags of Amala if the price is fixed at c1,000.
(b) If price is c1,500, the quantity consumed will be:
Qd = 140 – 0.02 (1,500) = 140 – 30 = 110
i.e. consumers will buy 110 bags of Amala if the price is fixed at c1,500
2.2.4 Determination (Shifters) of the Demand for a commodity
In economics, the determinants of demand refer to the shifters of the demand curve. The
quantity demanded of a commodity, however, is affected by the own price of the
commodity. For most commodities, when the price falls, more of it is purchased whilst
when the price rises, lesser quantity than before is purchased, all other demand influencing
factors remaining unchanged.
Under the determinants of demand, we will focus on those factors that collectively
determine the position of the demand curve in price- quantity demanded space.

NOTE: This is a work in progress. All topics in the syllabus are covered but editing for necessary corrections is in progress.
Thanks.
22
(a) Consumer Income
A change in consumer income may bring about a change in the demand for a good
or service. However, the direction of change in demand will depend on the type of
commodity in question.
i. For a normal good, demand might increase when consumer income
increases and demand might fall as consumer income falls, ceteris
paribus.
ii. For an inferior good, demand might decrease when consumer
income increases while demand might fall as consumer income
increases, ceteris paribus. Therefore, inferior goods are those goods
that we consume more when we are worse of financially and less
when we are better of. For instance, who would want to buy
“second hand” goods when he becomes richer?
iii. For a necessity, a change in consumer income may not affect
demand.
(b) Prices of Related Goods
Goods relate to each other in two ways. Goods are either compliments or
substitutes
(i) Complimentary goods are goods with joint demand. They are needed jointly
before a want could be satisfied, e.g., camera and film. With complimentary
goods, a steep rise in the price of one will lead not to only to a fall in its
consumption but also a decrease in demand for the other good. A fall in the
price of one good would lead to an increase in the demand of the other.
(ii) Substitute goods are goods that only one is needed to satisfy a want/need
(not both). For substitutes, a fall in the price of one leads to a decrease in
demand for the other while an increase in the price of one leads to an
increase in the demand for the other, ceteris paribus. For example,
margarine and butter could be considered as examples of substitute goods.
A sharp increase in the price of margarine will let people consume more
butter if the price of butter does not change.

NOTE: This is a work in progress. All topics in the syllabus are covered but editing for necessary corrections is in progress.
Thanks.
23
(c) Consumer Taste/Preference
Any change in consumer taste or preference causes demand to change. Increased
taste or preference for a particular good causes demand to increase whilst declining
taste or preference causes demand to fall, ceteris paribus. Taste or preference for
goods and services are influenced by advertisement, fashion and sales promotions.
(d) Consumer Expectations
The decision to buy commodity today is influenced by the expected future price of
the commodity and expected change in consumer income. If a consumer anticipates
the price of a commodity to increase in future, today’s demand for the commodity
will increase but if the consumer anticipates a fall in future price, then today’s
demand for the commodity will fall. Similarly, an expected consumer income
increase may cause current demand for a normal commodity to increase and vice
versa.
(e) Population of Consumers
Population and population changes may affect demand for a commodity. Areas of
high population may demand more of certain commodities than areas of low
populations. For example, Nigeria may demand more of certain goods and services
than Ghana because Nigeria’s population is higher than that of Ghana. And even as
the population of a country increases, the demand for goods and services will
increase. Also if the composition or structure of population changes the demand of
certain goods and services may also change.
(f) Market Strategies
Marketing strategies such advertising, publicity and sales promotions (e.g. raffles)
are means used to get consumers to increase their purchases of commodity. They
are intended to inform and persuade existing consumers as well as new ones to buy
more of the commodity. Effective marketing strategy will lead to an increase in
demand for the commodity, all other things being equal.
(g) Natural Factors
Seasonal variations may affect the demand for a commodity at certain times of the
year. For example, during the raining season, demand for jackets, raincoats and
umbrellas will increase while during the dry season, demand for commodities such
as fans and air conditioners will rise.

NOTE: This is a work in progress. All topics in the syllabus are covered but editing for necessary corrections is in progress.
Thanks.
24
(h) Availability of credit
When consumers are given credit facilities in the form of credit purchases, hire
purchases and the use of credit cards and cheques, they are encouraged to buy
more goods. Granting of credit facilities will increase demand for goods covered by
these facilities, all things being equal.
(i) Cost of borrowing (Interest rate)
If the cost of borrowing is low (lower interest rates) then people can borrow and
consume more of normal goods and services. If cost of borrowing is high then
people can borrow less and the investment reduces.
2.2.5 Types of demand
(a) Joint/Complementary Demand
Goods are said to be in joint/complementary demand when they produce more
consumer satisfaction when consumed together than when consumed separately.
Examples include bread and butter, camera and film, automobile and gasoline, and
cassette player and cassette.
(b) Competitive Demand
Goods are said to be in competitive demand when they all compete for the same
consumer’s income. Such goods are substitutes – i.e. goods that are alternative to
one another in consumption. Examples are peak milk and ideal milk; pork, beef and
chicken, pork meat and cow meat, etc.
(c) Derived Demand
This is where the demand for a final product leads to the demand for a second
product which is used to produce this final product – i.e. if the demand of a product
is not for its own sake, but for the manufacturer of another product which is in
demand. For example, the demand for furniture derives the demand for wood, the
demand for petrol derives the demand for crude oil. Generally, demand for any
factor of product is a derived demand.
(d) Composite Demand
A commodity is said to have a composite demand when it is demanded for
alternative uses. For example, wood has composite demand because it is demanded
for several alternative uses such as the making of table, chairs, windows, doors,
body of vehicles, leather for making shoes, belt, briefcase andand so on.

NOTE: This is a work in progress. All topics in the syllabus are covered but editing for necessary corrections is in progress.
Thanks.
25
2.2.6 Changes in Quantity Demanded and Change in Demand
Change in the own price of a commodity on one hand and changes in any of the
other demand factors such as prices of related goods, consumers’ income
tastes/preferences, expectations of future prices and incomes, consumer
population, etc., have two different effects on the demand for a commodity.
2.2.6.1 Changes in Quantity Demanded
A change in quantity demanded occurs when the consumption of a commodity
increases or decreases as a result a change in the price of the commodity, all other
demand factors remaining unchanged. This is shown as a movement along the same
demand curve. There are two types of changes in quantity demanded: an increase
in quantity demanded (downward movement along the same demand curve) and a
decrease in quantity demanded (upward movement along the same demand curve)
(a) Increase in Quantity Demanded
When consumption of a commodity increases as a result of a fall in the own
price of the commodity it is described as increase in quantity demanded. It
is shown as a downward movement along the same demand curve. (See
figure 2.2)
Figure 2.2: Increase in Quantity Demanded
Price (c000)
8
7 D
6
5 A
4 B
3
2
1 D
0 20 40 60 80 100 120 140
Quantity Demanded (in Bags)
From Figure 2.2 when the price of the commodity was c5,000, quantity demanded was 40
bags, and, when price fell to c4,000 consumption increases to 60 bags.

NOTE: This is a work in progress. All topics in the syllabus are covered but editing for necessary corrections is in progress.
Thanks.
26
(b) Decreases in Quantity Demanded
When consumption of a commodity reduces as a result of a rise in the own price of
the commodity it is described as decrease in quantity demanded. It is shown as an
upward movement along the same demand curve. (See Figure 2.3).
Figure 2.3: Decrease in Quantity Demanded
Price (c000)
8
7 D
6
5 B
4 A
3
2
1 D
0 20 40 60 80 100 120 140
Quantity Demanded (in Bags)
From Figure 2.3 when the price of the commodity was c3,000 quantity demanded
was 80 bags, and , when price rose to c4,000 consumption reduced to 60 bags.
2.2.6.2 Changes in Demand
These occur when either more or less quantity of a commodity is now demanded when the
own price of the commodity has not changed. A change in demand is normally brought
about when there is a change in any of the other demand factors (referred to as demand
shifters). It causes a complete shift in the demand curve.
(a) Increase in Demand
An increase in demand for a commodity is a situation where the consumption of a
commodity increases without an increase in the commodity‘s own price. For
instance, if during the 2006 World Cup the purchase of television (TV) sets increased
when there was no changes in TV prices it could be described as increase in the
demand for TV sets. An increase in demand causes a complete shift in the demand
curve of the commodity to the right.

NOTE: This is a work in progress. All topics in the syllabus are covered but editing for necessary corrections is in progress.
Thanks.
27
Figure 2.4: Increase in Demand
Price (c000)
8 D2
7 D1
6
5
4
3
2 D2
1
D1
0 20 40 60 80 100 120 140
Quantity Demanded (in Bags)
The initial demand curve is given as D1 D1 in Figure 2.4, and as a result of the
increase in demand D1 has shifted completely to D2 D2. The price of the commodity
remains at c5,000 but consumption has increased from 40 to 80 bags.
(b) Decrease in Demand
A decrease in demand for a commodity occurs when the consumption of a
commodity decreases without a change in the commodity`s own price. A decrease
in demand causes a complete shift in demand curve of the commodity to the left as
shown in Figure 2.5. The initial demand curve is given as D1D1 and as a result of a
decrease in demand D1 has shifted completed to D2D2. The price of the commodity
remains at c5,000 but consumption has increased from 80 to 40 bags.
Figure 2.5: Decrease in Demand
Price (c000)
8 D1
7 D2
6
5
4
3
2 D1
1 D2
0 20 40 60 80 100 120 140
Quantity Demanded (in Bags)

NOTE: This is a work in progress. All topics in the syllabus are covered but editing for necessary corrections is in progress.
Thanks.
28
Factors that cause a Change in Demand
A change in demand is caused by a change in any of the following factors:
Prices of related goods (substitutes and complements)
Consumer’s income (inferior and normal goods).
Consumer tastes or preferences
Consumer expectations (of changes in prices and income)
Population of consumers
Marketing strategies
Natural factors
Availability of credits
Cost of borrowing (interest rate)
The explanations of how a change in any of the above factors causes a change in
demand are given in the same ways as we did under determinants of demand for a
commodity. But note that a change in the own price of a commodity does not cause
a change in demand, it causes only a change in quantity demanded.
2.2.7 Individual Demand and Market Demand
When we say the demand for a commodity it means the “market demand” for that
commodity. Since individuals consume the commodity, we may talk of individual
demands too.
The Individual demand for a commodity is the quantities that would be purchased
by an individual consumer of the commodity at a given set of prices of the
commodity, when all other factors influencing demand remain unchanged. For a
given set of prices for the commodity, individuals make their purchases, the set of
prices and the corresponding quantities purchased by this individual consumer
represents his/her individual demand.
The market demand for a commodity on the other hand is the total quantities that
would be purchased by all individual consumers of a commodity at the same given
set of prices, when all other factors remain unchanged; Market demand reflects the
total demand of all individuals consuming the commodity. A market demand is a
horizontal summation of all individual demands for a commodity.
Illustration:
Let us assume that there are only two consumers, John and Rose, for Amala with
demand schedules as follows:

NOTE: This is a work in progress. All topics in the syllabus are covered but editing for necessary corrections is in progress.
Thanks.
29
Table 2.2: Individual and Market Demands for Amala
Price
(c)
John’s
Quantity
Demanded
(Q)
Rose’s
Quantity
Demanded
(QR)
Market
Quantity
Demanded
Q = (QJ + QR)
1,000 80 40 120
2,000 70 30 100
3,000 60 20 80
4,000 45 15 60
5,000 30 10 40
6,000 15 5 20
7,000 0 0 0
From Table 2.2, when we consider the of prices (c1,000 to c7,000) and what John will
consume at each price (ranging from 80 to 0 bags of Amala) when all other things remain the
same, that is John’s individual demand for Amala. Similarly, the same set of prices and the
corresponding set of purchases (ranging from 40 to 0 bags of Amala) by Rose constitutes
Rose’s individual demand for Amala. The market demand for Amala is obtained by summing
horizontally, all the individual’s purchases at the given price (as depicted by the last column
of Table 2.2). The market demand schedule will be the set of prices and market quantities
demanded.
2.3 SUPPLY
Firms make decisions about how many goods and services to supply to the market. They are
variously known as suppliers, sellers, producers, businesses or enterprises. They make their
decisions with respect to some set goals or objectives the key one of which is earning as much
profit as possible (profit maximization).
2.3.1 Definition of Supply
Supply is the maximum quantity of a commodity that firms will offer for sale at a given
market price within a specified time period when all other supply factors remain unchanged.
Simply put, it is a set of prices with a corresponding set or quantities that firm would offer
for sale at a given time and when all other supply factors remain unchanged.
2.3.2 The Law of Supply
The law states that suppliers will willingly increase the quantity supplied when the price of a
commodity rises and decrease the quantity supplied when the price falls, all other things

NOTE: This is a work in progress. All topics in the syllabus are covered but editing for necessary corrections is in progress.
Thanks.
30
remaining unchanged. A higher price gives producers incentive to increase production and
vice versa.
2.3.3 Representation of Supply
Supply may be represented in three ways: a schedule, curve or function/equation.
a) The Supply Schedule
It is a table or a list showing a set of market prices for a commodity and the
corresponding set of quantities that would be offered for sale by a firm, other things
remaining the same. Below table 2.3 represents a supply schedule of for Amala:
Table 2.3: The Supply Schedule for Amala
Price (c) Quantity Supplied
(Bags)
1000 0
2000 10
3000 20
4000 30
5000 40
6000 50
7000 60
From the supply schedule for Amala in Table 2.3, it is evident that as the price of it
rises, the suppliers are willing to offer more for sale. For example, if the price of
Amala rises from c4000 to c5000, suppliers are willing to increase the quantity
supplied from 30 to 40 bags.
(b) The supply curve
It is a graph (and more technically, a locus of points) that shows the relationship between
quantity supplied of a commodity and the market price when all other supply factors are
held constant. The normal supply curve has a positive slope or slopes upward from left to
right showing that more is willingly supplied by firms at higher prices than lower prices. The
supply curve is the graphical representation of the information in the supply schedule ( i.e.
plotting prices against corresponding quantities supplied). The supply curve, SS, in Figure
2.6 is drawn from the supply schedule of Amala om Table 2.3

NOTE: This is a work in progress. All topics in the syllabus are covered but editing for necessary corrections is in progress.
Thanks.
31

NOTE: This is a work in progress. All topics in the syllabus are covered but editing for necessary corrections is in progress.
Thanks.
32
Figure 2.6: The supply Curve for Amala
Price (c)
S 7000 S
6000
5000
4000
3000
2000
1000
S
0 10 20 30 40 50 60 Quantity Supplied (Bags)
(c) The Supply Function/Equation
The supply function or equation is a mathematical expression showing a
relationship between the quantity supplied of a commodity and the supply
factors with commodity’s market price inclusive. If all the other supply
factors are held constant and allow quantity supplied to depend only on the
market price of the commodity then we have:
Qs = f (P)
Where Qs is the quantity supplied and P, the market price
Illustration
Suppose the supply function for Amala is given as:
Qs = – 10 + 0.01P
Where P is the price and Qs, the quantity supplied. Find the quantity that
will be supplied when the market price of Amala is :
(a) c1,000 (b) c,1500
Solution:
From the supply function:
Q = - 10 + 0.01P
(a) If price is c1,000, the quantity supplied will be:
Qs = - 10 + 0.01(1,000) = -10 + 10 = 0
i.e. Suppliers of Amala will not supply the product if the market price
is c1,000

NOTE: This is a work in progress. All topics in the syllabus are covered but editing for necessary corrections is in progress.
Thanks.
33
(b) If price is c1,500, the quantity supplied will be:
Qs = -10 + 0.01 (1,500) = -10 + 15 = 5.
i.e. Suppliers of Amala will supply 5 bags if the market price is c1,500
2.3.4 Determinants of Supply
In economics, the determinants of supply refer to the shifters of supply curve. The
quantity supplied of a commodity, however, is affected by the market price of the
commodity. For most commodities, when the price falls, less quantity is supplied while
when the price rises, more quantity is supplied when all other supply factors remain
unchanged.
Under the determinants of supply, we will focus on those factors that collectively
determine the position of the supply curve in price-quantity supplied space.
(a) Prices of Inputs
These are the prices firms pay to obtain factors of production or inputs. Firms pay
wages and salaries for hiring labour, rent for the use of land and interest for
borrowing capital. Increase in input prices in turn increases cost of production
thereby causing supply to decrease. A decline in input prices lowers costs of
production and increases supply.
(b) Technology
The kind of technology a firm uses to produce its products determines the type and
quantity of inputs necessary to produce to produce a given quantity of a product.
When a firm uses the best technology available, it can produce a unit of a good at
the lowest possible cost (economic efficiency). An advancement or improvement in
technology is the development of new means of producing a good using a smaller
quantity of inputs than was previously possible (technical efficiency). Technological
innovation also results in the development of new products that are less costly to
produce than the products they replace. Thus, technological change lowers
production costs, which in turn leads to increase in profits and, therefore, increases
supply.
(c) Prices of other products/outputs
(i) Competitive supply products: Firms are not permanently committed to the
production of particular products. Because firms have the objective of
maximising profits, rising prices for other products could cause firms to
switch to the production of these products. For example, if the price of soft

NOTE: This is a work in progress. All topics in the syllabus are covered but editing for necessary corrections is in progress.
Thanks.
34
drinks were to rise sharply, breweries might switch form beer production to
soft drink bottling. Such products are said to be in competitive supply. The
same resources may be used to produce them.
(ii) Joint-supply products: These are products that are always produced
together. One is seen as the by-products of the other. Examples are beef
and hide. An increase in the price of say beef, which increase the quantity
of beef supplied to the market, will automatically increase the supply of
hides, from which leather products are made.
(d) Government Fiscal Policy (Taxes and Subsidies)
Taxes increase cost of supplying a product and anything that causes the cost of
supplying a product to increase in turn causes a decrease in supply of the product
whiles subsides decrease of the cost of supplying a product and hence cause an
increase in supply.
(e) Weather and other Natural Phenomena
Changes in weather affect the supply of certain commodities especially agricultural
products. A favourable weather condition such as good rainfall will increase the
supply of agricultural products whiles an unfavourable weather such as drought will
cause a decrease in the supply of agricultural products. Other natural phenomena
such as, floods, bush fire, pests and so on also affect the supply of agricultural
products. Other natural phenomena such as floods, bush fire, pests and so on also
affect the supply of agricultural products.
(f) Population of Suppliers or Firms
When firms in an industry are earning supernormal profits, this may attract new
firms into the industry (if it is not a monopoly industry) which would in turn increase
the supply of the product. On the other hand, if more firms exit an industry, this
could cause supply to decrease.
2.3.4 Types of Supply
a) Joint Supply
Products have joint supply when the supply of one product is in association of the
supply of other products. The other goods are seen as by-products of the main
product supplied. Examples are beef and hide (leather), oil and petrol, gas and coke.

NOTE: This is a work in progress. All topics in the syllabus are covered but editing for necessary corrections is in progress.
Thanks.
35
b) Competitive Supply
This entails the supply of goods/services which can most easily be produced with the
resources at the firm`s disposal.
2.3.5 Change in Quantity Supplied and Change in Supply
We make a distinction between change in quantity supplied and change in supply.
2.3.5.1 Change in Quantity Supplied
This occurs when more or less of a commodity is offered for sale as a result
of change in the market price of the commodity. It results in either an
upward movement or a downward movement along a supply curve. A
change in quantity supplied may either be an increase in quantity supplied
or a decrease in quantity supplied.
Figure 2.7: Increase in Quantity Supplied of Amala
Price (c)
7000
S
6000
B
5000
4000 A
3000
2000
1000 S 0 10 20 30 40 50 60 Quantity Supplied (Bags)
From the 2.7, an increase in the market price of Amala form c4,000 to c5,000 will lead to an increase
in its quantity supplied from 30 bags to 40 bags. This produces a movement along the supply curve, ,
from point A to Point B.
b) Decrease in Quantity Supplied
A decrease in quantity supplied occurs when less of a commodity is offered for saledue to a
fall in its market price. This produces a downward movement along the supply curve. From
figure 2.8, a fall in the market price from c6,000 to c5,000 led to a decrease in the quantity
supplied from 50 bags to 40 bags.

NOTE: This is a work in progress. All topics in the syllabus are covered but editing for necessary corrections is in progress.
Thanks.
36
Figure 2.8: Decrease in Quantity Supplied of Amala
Price (c) 7000 S 6000 C 5000 D 4000 3000 2000 1000 0 10 20 30 40 50 60 Quantity Supplied (Bags)
From Figure 2.8, a fall in the market price from c6,000 to c5,000 led to a decrease in the quantity
supplied from 50 bags to 40 bags. That is , moving from point C downwards to point D.
2.3.5.2 Change in Supply
A change in supply on the other hand occurs when suppliers offer either more or less of a
commodity for sale than before even though the market price has not changed. This
produces a complete shift of the supply curve either to the right or the left.
a) Increase in Supply
This is when more of a product is offered for sale than before when the market price
has not changed. An increase in supply completely shifts the supply curve to the
right. For example, if at the same market price of Amala, suppliers offer more for
sale than before then there is an increase in the supply of Amala. This will produce a
complete shift in the supply curve of Amala as shown in Figure 2.9 below. The initial
supply curve was S0SO but as a result of the increase in supply, it has completely
shifted to S1S1. From Figure 2.9, at the same market price of c5,000 per bag supply
has increased from 40 to 50 bags.

NOTE: This is a work in progress. All topics in the syllabus are covered but editing for necessary corrections is in progress.
Thanks.
37
Figure 2.9: Increase in Supply of Amala
Price (c) SO S1 7000 S1 6000 5000 4000 3000 2000 SO 1000 S1 0 10 20 30 40 50 60 70 Quantity Supplied (Bags)
b) Decrease in Supply
A decrease supply occurs when firms offer less of a product for sale than before
when the market price has not changed. This brings about a complete shift of the
supply curve to the left as shown in Figure 2.10 below. The initial supply curve was
SOS0 but as a result of a decrease in the supply of Amala. It has completely shifted to
S2S2. Though a result of a decrease in the supply of Amala. It has completely shifted
to S2S2. Though the market price of Amala still remains at c6,000 supply has
decreased from 60 bags to 50 bags.
Figure 2.10: Decrease in Supply of Amala
Price (c) 7000 S2 S0 6000 5000 4000 3000 2000 1000 S2 S0 0 10 20 30 40 50 60 70 QuantitySupplied(Bags)

NOTE: This is a work in progress. All topics in the syllabus are covered but editing for necessary corrections is in progress.
Thanks.
38
Factors that cause Changes in Supply
Changes in any of the following factors will cause a change in supply thereby completely shifting the
supply curve:
Prices of Inputs
Technology
Prices of other products/outputs
Government Fiscal Policies (Taxes and Subsidies)
Weather and other Natural Phenomena
Population of Suppliers.
Note: A change in the market price of a product does not cause a change in supply of that product
but causes a change in quantity supplied.
2.3.6 Individual Supply and Market Supply
An Individual supply is the quantity of a product an individual firm is willing to offer for sale
at a given price and at a given time period when all other supply factors remain unchanged.
The market supply, on the other hand, is the total quantity of a product that all firms in an
industry are willing to offer for sale at a given market price and at a given time period when
all other supply factors remain unchanged. The supply schedule could be used to illustrate
this. If we assume that the Amala is produced by only two firms. NICE Ltd, and FINE Ltd.
Table 2.4 shows the weekly individual supplies and market supply schedules of Amala. The
set of prices (Column 1) and the set of quantities that NICE Ltd. Will supply (column 2) is the
individual supply of NICE Ltd. Similarly, the set of prices (column 1) and the set of quantities
supplied by FINE Ltd (Column 3) constitute the individual supply of FINE Ltd. The market
supply of Amala is the horizontal summation of the individual supplies of NICE Ltd., and FINE
Ltd. That is, it is the set of market prices (column 1) and the corresponding set of quantities
supplied by both producers (column 4).
Table 2.4: Individual Supplies and Market Supply Schedules of Amala
Price (c)
(1)
Quantities Supplied (in bags)
NICE Ltd (2)
FINE Ltd (3)
Market (4)
1,000 0 0 0
2,000 6 4 10
3,000 12 8 20
4,000 20 10 30
5,000 25 15 40
6,000 30 20 50

NOTE: This is a work in progress. All topics in the syllabus are covered but editing for necessary corrections is in progress.
Thanks.
39
7,000 35 25 60
2.4 Market Determination of Equilibrium Price and Quantity
In the competitive market the determination of market price and quantity is by the market
mechanism. The market mechanism is the process by which the market forces of demand
and supply interact to establish a market price and determine the quantity of a commodity
exchanged in a market.
Table 2.5: The Demand and Supply Schedules of Amala
Price (c) Quantity Demanded (Bags)
Quantity Supplied (Bags)
Excess Type of Excess
1000 120 0 +120 Excess Demand
2000 100 10 +90 Excess Demand
3000 80 20 +60 Excess Demand
4000 60 30 +30 Excess Demand
5000 40 40 0 Equilibrium
6000 20 50 30 Excess Supply
7000 0 60 -60 Excess Supply
Table 2.5 shows the demand and supply schedules of Amala. Quantity demanded exceeds
quantity supplied at the price range of c1,000 to c4,000. For example, at c1,000 price,
consumers want to consume 120 bags whilst producers are not willing to supply the product
resulting in an excess demand or shortage of 120 bags. At c4,000 price, consumers want to
purchase 60 bags whilst producers are willing to supply only 30 bags resulting in excess
demand or shortage of 30 bags. None of these can remain as the market price of Amala for
the excess demand will force the price up.
Quantity supplied exceeds quantity demanded at prices greater than c5,000. For instance,
at c6,000 price of Amala, consumers want to buy only 20 bags whilst producers are willing to
offer 50 bags for sale resulting in an excess supply or surplus of 30 bags. C6,000 cannot
remain as the market price for the excess supply will force the price down.
At c5,000 price of Amala, the quantity consumers are willing to consume is equal to the
quantity producers are willing to offer for sale of 40 bags. In economics this price is called
the market-clearing or equilibrium price and the 40 bags of Amala is the equilibrium
quantity. Equilibrium price is the price of a commodity that equates quantity demanded
and quantity supplied. It is the price that clears the market and leaves it with no unsatisfied
buyers or sellers (excesses).
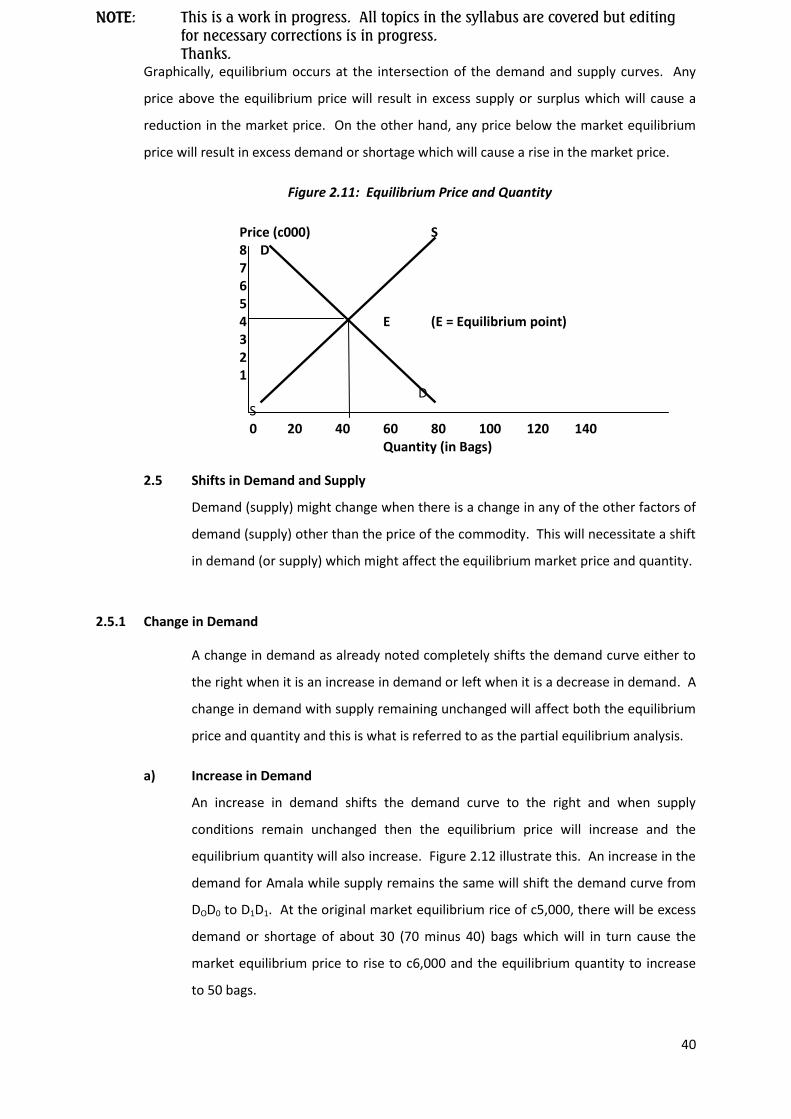
NOTE: This is a work in progress. All topics in the syllabus are covered but editing for necessary corrections is in progress.
Thanks.
40
Graphically, equilibrium occurs at the intersection of the demand and supply curves. Any
price above the equilibrium price will result in excess supply or surplus which will cause a
reduction in the market price. On the other hand, any price below the market equilibrium
price will result in excess demand or shortage which will cause a rise in the market price.
Figure 2.11: Equilibrium Price and Quantity
Price (c000) S 8 D 7 6 5 4 E (E = Equilibrium point) 3 2 1 D S 0 20 40 60 80 100 120 140 Quantity (in Bags)
2.5 Shifts in Demand and Supply
Demand (supply) might change when there is a change in any of the other factors of
demand (supply) other than the price of the commodity. This will necessitate a shift
in demand (or supply) which might affect the equilibrium market price and quantity.
2.5.1 Change in Demand
A change in demand as already noted completely shifts the demand curve either to
the right when it is an increase in demand or left when it is a decrease in demand. A
change in demand with supply remaining unchanged will affect both the equilibrium
price and quantity and this is what is referred to as the partial equilibrium analysis.
a) Increase in Demand
An increase in demand shifts the demand curve to the right and when supply
conditions remain unchanged then the equilibrium price will increase and the
equilibrium quantity will also increase. Figure 2.12 illustrate this. An increase in the
demand for Amala while supply remains the same will shift the demand curve from
DOD0 to D1D1. At the original market equilibrium rice of c5,000, there will be excess
demand or shortage of about 30 (70 minus 40) bags which will in turn cause the
market equilibrium price to rise to c6,000 and the equilibrium quantity to increase
to 50 bags.

NOTE: This is a work in progress. All topics in the syllabus are covered but editing for necessary corrections is in progress.
Thanks.
41

NOTE: This is a work in progress. All topics in the syllabus are covered but editing for necessary corrections is in progress.
Thanks.
42
Figure 2.12: Increase in Demand Price (c000)
8 D1 S 7 D0 6 5 4 3 2 D1 1 D0 0 20 40 70 80 100 120 140 Quantity (in Bags)
(b) Decrease in Demand
A decrease in demand shifts the demand curve to the left and when supply
conditions remain unchanged then the equilibrium price will fall and the equilibrium
quantity will also decrease.
Figure 2.13: Decrease in Demand
Price (c000) 8 D1 S1 7 D2 6 5 4 3 2 D1 1 D2 0 20 40 60 80 100 120 140 Quantity (in Bags)
Figure 2.13 illustrates this. A decrease in the demand for Amala while supply
remains the same will shift the demand curve from D1D1 to D2D2. At the initial
market equilibrium price of c6,000, there will be excess demand or shortage of
about 30 (50 minus 20) bags which will in turn cause the market equilibrium price to
fall to c5,000 and the equilibrium quantity to decrease to 40 bags. Price is held
constant and other factors or determinants of demand will lead to decrease in
demand (Shift backward).
2.5.2 Change in Supply
A change in supply on the other hand completely shifts the supply curve either to
the right when it is an increase in supply or left when it is a decrease in supply. A

NOTE: This is a work in progress. All topics in the syllabus are covered but editing for necessary corrections is in progress.
Thanks.
43
change in supply with demand remaining unchanged will also affect both the
equilibrium price and quantity.
(a) An Increase in Supply
If demand remains constant but supply increases, the supply curve will shift
completely to the right whiles nothing happen to the demand curve. This will
reduce the equilibrium market price and the equilibrium quantity on the other
hand will increase.
Figure 2.14: An increase in Supply of Amala
Price (c000)
8 S0 7 D0 S1 6 5 4 3 2 1 S0 D0 S1 0 20 40 60 80 100 120 140 Quantity (in Bags)
In Figure 2.14, an increase in the supply of Amala whilst its demand remains
constant will shift its supply curve from S0S0 to S1S1. At the initial equilibrium
market price of c5,000, there will be excess supply or surplus of Amala of 30 (70
minus 40) bags. The surplus will cause the market price of Amala to fall to an
equilibrium price of c4,000 and the equilibrium quantity will increase from 40 to
60 bags.
(b) A Decrease in Supply
On the other hand, if demand remains constant but supply decreases, the supply
curve will shift curve will shift completely to the left whiles nothing happens to the
demand curve. This will increase the equilibrium market price and the equilibrium
quantity on the other hand will decrease.

NOTE: This is a work in progress. All topics in the syllabus are covered but editing for necessary corrections is in progress.
Thanks.
44
Figure 2.15: Decrease in Supply of Amala
S2 Price (c000)
8 S0 7 D0 6 5 4 3 S2 2 1 S0 D0 0 20 40 60 80 100 120 140 Quantity (in Bags)
In Figure 2.15, a decrease in the supply of Amala whilst its demand remains constant
will shift its supply curve from S0 to S2. At the initial equilibrium market price of
c5,000. There will be excess demand or shortage of Amala of 30 (40 minus 10) bags.
The surplus will cause the equilibrium market price of Amala to rise to c6,000 and
the equilibrium quantity will decrease from 40 to 20 bags.
2.6 APPLICATIONS OF DEMAND –SUPPLY DIAGRAM
2.6.1 Price Control
Whenever the forces of demand and supply are allowed to fix market prices of
commodities in a competitive market, some of the prices may be unfairly high to
buyers or unfairly low to sellers. In such instances, the government may attempt to
regulate or limit prices through legislation. Price through legistation. Price controls
prevent markets from moving to equilibrium. Price controls are in the form of either
maximum price (price ceiling) or minimum price (price floor)
(a) Maximum Price Control(Price Ceiling)
A maximum price or price ceiling is a legal price set below the equilibrium market
price above which a seller cannot change for a product. It is set to safeguard
consumers when the equilibrium market price for a commodity is found to be
unfairly high. Maximum prices are normally set for essential goods such as
pharmaceutical drugs or services such as house rental. When a maximum price is
set for a good it increases the quantity demanded while the quantity supplied
decreases thereby resulting in persistent excess demand or shortage of the good.

NOTE: This is a work in progress. All topics in the syllabus are covered but editing for necessary corrections is in progress.
Thanks.
45
Figure 2.16
Price
S
Pbm
Pe E
Pmx A B
D
0 Qs Qe Q d Quantity
From Figure 2.16 the equilibrium market price is OPe which may be unfairly high
calling for the setting of a price ceiling of OPmx. Because the price ceiling is not a
market clearing price, quantity demanded will increase from OQe to OQd while
quantity supplied will decrease from OQe to OQs. The resulting shortage is QsQd or
AB. This re-affirms the assertion that whenever a price ceiling is set for a good it
results in persistent shortage of the good.
The persistent shortage created by price ceiling will in turn pose the following
problems:
(i) Rationing
Government may have to apportion the quantity supplied of QQs among
buyers who want to consume a greater amount of QQd. This may be done
through the issue of coupons which must be surrendered together with
cash, to obtain the good.
(ii) Queuing
Whenever the good is available people will form long queues for it. The
queues may be physical lines of people outside suppliers’ shops typically in
the case of essential commodities like drugs, bread, milk, etc. or tall waiting
lists in the case of consumer durables such as cars, television sets,
government flats/houses, etc.
(iii) Black (Parallel) Markets
Black or parallel markets in which the good will be illegally sold and bought will
spring up. In these illegal markets the price at which the good will be sold will even
be higher than the equilibrium price, i.e. OPbm in Figure 2.16.

NOTE: This is a work in progress. All topics in the syllabus are covered but editing for necessary corrections is in progress.
Thanks.
46
(iv) Selling at Sellers’ Preferences
Sellers may choose several ways to sell the good – first-come, first-served,
selling to relatives and friends first, etc.
(v) Random Allocation
This is selling by luck or chance. This may defeat the aim of setting the
maximum price to ensure that the poor as well as the rich get the good.
Selling may go to all rich, or all poor.
Government may solve the various problems caused by maximum price control by
accompanying it with certain other policies such as:
(i) The government coming out with policies to reduce consumption of the
good. Policies that will discourage consumption may include:
Reducing income levels through increased direct taxes when good is
a normal good.
Finding cheaper substitutes for the good.
Creating impression that the price of the good would be reduced
further in future to enhance consumer expectations of a further
price cut so that they demand less now.
(ii) Government may also adopt economic policies that would increase supply
of the good. Such supply management policies may include:
Government subsidising the cost of producing the good.
Creating investment incentives to attract new firms to supply more
of the good.
Importing more of the good from cheaper sources to augment
domestic supply.
(b) Minimum Price Control (Price Floor)
A minimum price or price floor is a legal price set above the equilibrium market price. One
can buy at or above the minimum price but cannot buy at a price below it. It is set to
protect incomes of producers when the equilibrium market price for a product is found to be
unfairly low. Minimum prices are normally set for agricultural products to protect the
incomes of farmers and labour (the minimum wage). When a minimum price is set for a
good it reduces quantity demanded while quantity supplied increase thereby resulting in
persistent excess supply or surplus of the good.

NOTE: This is a work in progress. All topics in the syllabus are covered but editing for necessary corrections is in progress.
Thanks.
47
Figure 2.17
PriceS
Pmn
Pe E
Pbm D
0 Qd Qe Qs Quantity
From Figure 2.17 the equilibrium market price is OPe which may be unfairly low necessitating the
setting of a price floor of OPmn by government because the price floor is higher than the equilibrium
price, quantity supplied will increase from OQe to OQs while quantity demanded will decrease from
OQe to OQd. This will create surplus of QdQs or AB of the good. Therefore whenever a price ceiling is
set it creates persistent surplus of the good.
The persistent surplus created by price floor will in turn pose the following problems to producers of
the good:
(i) It brings about a lot of frustrated sellers wishing to dispose off surplus supplies.
(ii) The sellers out of frustration, undercuts the legal minimum price from the diagram,
sellers when frustrated may be willing to sell the commodity at PBM, which is well
below the equilibrium market price.
(iii) The sellers will allocate quotas among themselves
(iv) There will be buyers’ preferences as they choose whom to buy from.
(v) It brings about conditional sales. The good with surplus may be sold with others
that are in shortage.
To make minimum price control policies achieve their aim certain policies should be adopted by the
government concurrently:
(i) Government may increase incomes of consumers so that they can buy more if the
commodity is a normal good, and/or increase consumption of the commodity
through advertisements and other sales promotions.

NOTE: This is a work in progress. All topics in the syllabus are covered but editing for necessary corrections is in progress.
Thanks.
48
(ii) The government enters the market after setting the price floor to buy the surpluses,
store and sell from its own stock piles during times of shortage.
(iii) Financial institutions may make funds available for private individuals to buy and
store the surpluses and sell them during lean season.
(iv) The surpluses could be exported to needy countries. The government could
promote such exports by creating incentives for exports.
(c) Minimum Wage Legislation
The minimum wage legislation entails the fixing of the wage rate for the least paid
worker in the society by the government. In every modern society, such legislation is
used by the government to ensure that the least paid worker have access to the
basic necessities of life.
The minimum wage is reviewed regularly by every progressive government using the
inflation rate trend to prevent workers standards of living from falling .The labour
unions, in addition, usually clamour for upward review of the minimum wage rate to
promote improvement of living standards their members.
The normal practice in the implementation of the legislation is for the government to
fix the minimum wage above the equilibrium wage rate as explained in Figure 2.18
Figure 2.18
Wage rate
DL SL
Wm Wage floor
We
SL DL
Li Le L2 No. of workers

NOTE: This is a work in progress. All topics in the syllabus are covered but editing for necessary corrections is in progress.
Thanks.
49
In Figure 2.18 DLDL and SLSL represent demand and supply of labour services, respectively.
Without government intervention, the wage rate will settle at We while Le number of
workers will be employed.
However, if the government fixes minimum wage at Wm above equilibrium, the likely
consequences are listed below.
i. The numbers of people willing to work at legislated wage rate Wm is greater than L1
that the labour market is able and willing to absorb i.e. excess supply of labour
ii. The problem of unemployment will worsen, precisely; Le-Li number of people will lose
their jobs.
iii. There is the likelihood of labour union entering into a clandestine arrangement with
their employer to receive wage rate that is less than the mandated minimum wage
rate in other to prevent retrenchment of some workers.
iv. Those workers who are retained by their employer will receive higher wage rate and
enjoy highest living standards given that price of goods and services remain stable in
the economy.
v. It is evident from the above discussion that, for the minimum wage legislation to
achieve its objectives there must be adequate job opportunities especially in the public
sector of the economy.
2.7 SUMMARY AND CONCLUSION
In the competitive market prices and quantity demanded are set by the market forces of
demand and supply.
Demand is the quantity of a commodity that consumers are willing and are able to buy at a
given price at a given time period when all other things remain the same. A change in any
of the other determinants of demand apart from the own price of the commodity (income of
consumers, prices of related commodities, consumer tasted demand and shift the demand
curve. A change in own price of the commodity will cause a change in quantity demanded
and produce a movement along the same demand curve.
Supply on the other hand is the quantity of a commodity that suppliers are willing and are
able to offer for sale at a given price at a given time period when all other things remain the
same. A change in any of the other supply factors apart from the market price of the
commodity (prices of inputs, technology, taxes or subsidies, prices of other commodities,
weather/natural phenomena and population of suppliers) will cause a change in supply and
shift the supply curve. A change in market price of a commodity will cause a change in
quantity supplied and produce a movement along the same supply curve.

NOTE: This is a work in progress. All topics in the syllabus are covered but editing for necessary corrections is in progress.
Thanks.
50
At equilibrium, the market clears. That is, quantity demanded is equal to quantity supplied.
A change in demand or supply will cause the equilibrium price and quantity to change.
Whenever the equilibrium price is realised to be unfairly high or low it may necessitate the
setting of a price ceiling or a price ceiling or a price floor by government. Price ceiling is a
legal price set below the equilibrium price.
2.8 REVISION QUESTIONS
SECTION A: MULTIPLE CHOICE QUESTIONS
CHAPTER TWO
1. The following are determinants of quantity demanded of a commodity except:
A. Income of the consumer
B. Price of the commodity
C. Prices of related commodities
D. Prices of factors of production
E. Taste
2. Which of the following is not responsible for a shift in supply curve?
A. Changes in technology
B. Increase in prices of related goods
C. A reduction in inputs prices
D. Prices of the good
E. Favourable weather conditions
3. When the price of a given commodity rises above the equilibrium price, the quantity
supplied of that commodity
A. Exceeds the demand
B. Equals demand
C. Less than the demand
D. Increases continuously
E. Cannot be determined
4. Given the demand function for milk as Qd = 12D – 3P, and supply function as Qs = 5D +
4P, the equilibrium quantity is
A. 90
B. 80
C. 70
D. 60
E. 50
5. Which of the following best describe a tabular arrangement of various prices of a
commodity and the corresponding quantities purchased at given time?
A. Demand curve

NOTE: This is a work in progress. All topics in the syllabus are covered but editing for necessary corrections is in progress.
Thanks.
51
B. Demand schedule
C. Demand demand
D. Market demand
E. Law of demand
Solution To Multiple Choice Questions (MCQ)
CHAPTER TWO
1. D
2. D
3. A
4. A
5. B
Short Answer Questions
1. The graphical relationship between price and quantity purchased of a particular
commodity is called …………………..
2. An increase in subsidies and reduction of taxes will shift the supply curve to the
……………….
3. The demand for a product for the production of another commodity is referred to as
………………..
4. The economic good whose demand decreases when the consumer’s income
increase, ceteris paribu, is classified as goods.
5. Given the demand and supply functions for a particular commodity as Qd=136-4p
and Qs= 100+2p respectively, the market price is……………
Solution To Short Answers Questions
CHAPTER TWO
1. Demand curve
2. Right
3. Derived demand
4. Inferior
5.
QUESTION 2.1
(a) Distinguish between a change in quantity demanded and a change in demand.
(b) What factors may cause a change in demand?
Answer
(a) A change in quantity demanded occurs when the consumption of a commodity increases
or decreases as a result a change in the price of the commodity, when all other demand
factors remain unchanged. This is shown as a movement along the same demand curve.

NOTE: This is a work in progress. All topics in the syllabus are covered but editing for necessary corrections is in progress.
Thanks.
52
There are two types of changes in quantity demanded: an increase in quantity
demanded and a decrease in quantity demanded. A change in demand, on the other
hand, occurs when either more or less quantity of a commodity is now demanded when
the own price of the commodity has not changed. A change in demand is normally
occurs when there is a change in any of the other demand factors (referred to as
demand shifters). It causes a complete shift in demand curve.
(b) The factors that can cause a change in demand may include the following:
(i) A change in consumer income
A change in consumer income may bring about a change in the quantity demanded
of a good or service. However, the direction of change in quantity demanded will
depend on the type of commodity in question. For a normal good, the quantity
demanded might increase when consumer income increases and quantity
demanded might fall when consumer income falls, ceteris paribus. Therefore,
inferior goods are those goods that we consume more when we are worse of
financially and less when we are better of. For instance who would want to buy
“second hand” goods when he becomes richer? For a necessity, a change in
consumer income may not affect quantity demanded.
(ii) A change in the price of a related good
Goods relate to each other in two ways. Goods are either complements or
substitutes.
Complementary goods are goods with joint demand. They are needed jointly before
a want could be satisfied, e.g., camera and film. With complementary goods, a
steep rise in the price of one will lead not only to a fall in its consumption but a fall
in the consumption of the other good too. A fall in the price of one good would lead
to an increase in the demand of the other. Substitute goods on the other hand, are
goods that only one is needed to satisfy a want/need (not both). For substitutes, a
fall in the price of one leads to a decrease in demand for the other and an increase
in the price of one leads to an increase in the demand for the other, ceteris paribus
(iii) A change in consumer Taste/preference
Any change in consumer taste or preference causes demand to change. Increased
taste or preference for a particular good causes demand to increase whilst declining
taste or preference causes demand to fall, ceteris paribus. Taste or preference for
goods and services are influenced by advertisement, fashion and sales promotions.

NOTE: This is a work in progress. All topics in the syllabus are covered but editing for necessary corrections is in progress.
Thanks.
53
(iv) A change in consumer expectations
The decision to buy a commodity today is influenced by the expected future price of
the commodity and expected change in consumer income. If a consumer anticipates
the price of a commodity to increase in future, today’s demand for the commodity
will increase but if the consumer anticipates a fall in future price, then today’s
demand for the commodity will fall. Similarly, an expected consumer income
increase may cause demand for a normal commodity to increase and vice versa.
(v) A change in the population of consumers
Population changes may affect the demand for a commodity. Areas of high
population may demand more of certain commodities than areas of low
populations. For example, Nigeria may demand more of certain goods and services
than Ghana because Nigeria’s population is higher than that of Ghana. And even as
the population of a country increases the demand for goods and services may also
change.
(vi) Changes in market strategies
Marketing strategies such as advertising, publicity and sales promotions (e.g. raffles
are means used to get consumers to increase their purchases of a commodity. They
are intended to inform and persuade existing consumers as well as new ones to buy
more of the commodity. Effective marketing strategy will lead to an increase in
demand for the commodity, all other things being equal.
(vii) Natural Factors
Seasonal variations may affect the demand for a commodity at certain times of the
year. For example, during the raining season, demand for commodities such as
jackets, raincoats and umbrellas will increase while during the dry season, demand
for commodities such as fans and air conditioners will rise.
(viii) Availability of credit
When consumers are given credit facilities in the form of credit purchases, hire
purchases and the use of credit cards and cheques, they are encouraged to buy
more goods. Granting credit facilities, therefore, increased demand for goods
covered by these facilities, all things being equal.

NOTE: This is a work in progress. All topics in the syllabus are covered but editing for necessary corrections is in progress.
Thanks.
54
(ix) A change in cost of borrowing (Interest rate)
If the cost of borrowing is low (lower interest rates) then people can borrow and
consume more of normal goods and services. If cost of borrowing is high then
people can borrow less and so cannot consume more goods and services.
Question 2.2
Explain the determinants of quantity supplied of a good.
Answer
The quantity of supplied of a product is influenced by factors such as the market price of the
commodity, prices of inputs, technology, other output prices, government fiscal policy
(taxes/subsidies), weather and other natural phenomena and population of suppliers (firms).
(i) The market price of the product
All things being the same, a firm offers more for sale as the price of the product rises and
less for sale as its price falls.
(ii) Prices of Inputs
These are the prices firms pay to obtain factors of production or inputs. Firms pay wages
and salaries for hiring labour, rent for the use of land and interest for borrowing capital.
Increase in input prices in turn increases cost of production thereby causing supply to
decrease. A supply decreases, the quantity of firms are willing to supply falls. A decline in
input prices lowers costs of production and increases supply.
(iii) Technology The kind of technology a firm uses to produce its products determines the type and quantity
of inputs necessary to produce a given quantity of a product. When a firm uses the best
technology available, it can produce a unit of a good at the lowest possible cost (economic
efficiency). An advancement or improvement in technology is the development of new
means of producing a good using a smaller quantity of inputs than was previously possible
(technical efficiency). Technology innovation also results in the development of new
products that are less costly to produce than the products they replace. Thus, technology
change lowers production costs, which in turn leads to increase in profits and , therefore,
increases supply.
iv) Prices of other products/outputs

NOTE: This is a work in progress. All topics in the syllabus are covered but editing for necessary corrections is in progress.
Thanks.
55
Competitive supply products: Firms are not permanently committed to the production of
particular products. Because firms have the objective of maximising profits, rising prices for
other products could cause firms to switch to the production of different these products.
For example, if the price of soft drinks were to rise sharply, breweries might switch from
beer production to soft drink bottling. Such products are said to be in competitive supply.
The same resources may be used to produce them.
Joint-supply products these are products that are always produced together. One is seen as
the by-product of the other. Examples are beef and hide. An increase in the price of say beef,
which increase the supply of hides, from which leather products are made.
V) Government Fiscal Policy (Taxes and Subsidies)
Taxes increase cost of supplying a product and anything that causes the cost of supplying a
product to increase in turn causes a decrease in supply of the product whiles subsidies
decrease of the cost of supplying a product and hence cause an increase in supply.
vi) Weather and other Natural Phenomena
Changes in weather affect the supply of certain commodities especially agricultural
products. A favourable weather condition such as good rainfall will increase the supply of
agricultural products whiles an unfavourable weather such as drought will cause a decrease
in the supply of agricultural products. Other natural phenomena such as floods, bush fire,
pests and so on also affect the supply of agricultural products.
vii) Population of Suppliers or Firms
When firms in an industry are earning supernormal profits, this may attract new firms into
the industry (if it is not monopoly industry) which would in turn increase the supply of the
product. On the other hand, if more firms exit an industry, this could cause supply to
decrease.
QUESTION 2.3
A demand equation for a good is given by
QD = -3P + 5000
And the supply equation for the same good is
Qs = 2P + 2000
Where QD, Qs and P are the quantity demanded, quantity supplied and price (in bags/units
and cedi) respectively.

NOTE: This is a work in progress. All topics in the syllabus are covered but editing for necessary corrections is in progress.
Thanks.
56

NOTE: This is a work in progress. All topics in the syllabus are covered but editing for necessary corrections is in progress.
Thanks.
57
Required:
(a) Find the equilibrium price and quantity
(b) If government in trying to control the price of the good fixes the price at c550
(i) Explain the type of price control the government has applied using an appropriate
diagram.
(ii) Calculate and explain the type of excess which will result from the price control.
(iii) Give three (3) problems that the excess in (ii) may cause.
Answer
(a) Given the demand function QD= -3P + 5000 and the supply function as
Qs = 2P + 2000. At equilibrium , QD = QS
-3 + 5000 = 2P + 2000 5000 – 2000 = 2P + 3P 3000 = 5P 3000/5 = P P = c600 Therefore Q = 2(600) + 2000 Q = 1200 + 2000 Q = 3200 bags/units
The equilibrium price and quantity are c600 and 3200 units respectively.
D Price (c) S D C
c600 c500
S B D
D S
0 3100 3200 3350 Quantity (bags/units) (N) or cedi (C) for price
(i) If government fixes the price of the good at c550, this will be a maximum price
control. This is because c550 is below the equilibrium price of c600.
(ii) At the price of c550.
QD = -3P + 5000 = -3(550) + 5000 = -1650 + 5000 = 3350 bags/units
Qs = 2(550) + 2000 =1100 + 2000 = 3100 bags/units

NOTE: This is a work in progress. All topics in the syllabus are covered but editing for necessary corrections is in progress.
Thanks.
58
Excess demand = QD – Qs = 3350 – 3100 =250 bags/units
At the maximum price of c550, quantity demanded of 3350 bags/units exceeds the
quantity supplied of 3100 bags/units resulting in an excess demand of 250
bags/units .
(iii) The persistent shortage created by price ceiling will in turn pose the following
problems:
Rationing
Government may have to apportion the quantity supplied of OQs among buyers
who want to consume a greater amount of OQd. This may be done through the
issue of coupons which must be surrendered together with cash, to obtain the
good.
Queuing
Whenever the good is available people will form long queues for it. The queues
may be physical lines of people outside suppliers’ shops typically in the case of
essential commodities like drugs, bread, milk, etc. Or tall waiting lists in the case
of consumer durables such as cars, television sets, government flats/houses, etc.
Black (Parallel) Market
Black or parallel markets in which the good will be illegally sold and brought will
spring up. In these illegal markets the price at which the good will be sold will
even be higher than the equilibrium price.
Selling at Sellers’ Preference
Sellers may choose several ways to sell the god-first come, first-serve, selling to
relatives and friends first, etc
Random Allocation
This is selling by luck or chance. This may defeat the aim of setting the
maximum price to ensure that the poor as well as the rich get the good. Selling
may to all rich, or all poor.
Question 2.4
Write short notes on the following:
(a) Derived demand

NOTE: This is a work in progress. All topics in the syllabus are covered but editing for necessary corrections is in progress.
Thanks.
59
(b) Demand schedule
(c) Market supply
(d) Joint-supply
(e) Increase in supply
Answer
(a) Derived demand is where the demand for a final product leads to the demand for a second
product which is used to produce this final product – i.e. if the demand of a product is not
for its own sake, but for the manufacture of another product which is in demand. For
example, the demand for furniture derives the demand for wood; the demand for petrol
derives the demand for crude oil.
(b) Demand schedule is a table or a list of various prices of a commodity and the corresponding
quantities that would be purchased at a particular time period, when all other demand
factors remain constant. For example, the table below shows the demand schedule for a
commodity sold in bags. Column 1 of the Table 1 shows a set of prices of the commodity
and column 2 shows the quantities of it that consumers are willing and able to buy at each
price.
(c) Market supply is the total quantity of a product that all firms in an industry are willing to
offer for sale at a given market price and at a given time period when all other supply
factors remain unchanged. The market supply is a horizontal summation of the supplies
of all individual firms.
(d) Products have joint supply when the supply of one product is in association of the supply
of other products. The other goods are seen as by-products of the main product
supplied. Examples are beef and hide (leather), oil and petrol gas and coke.
(e) There is an increase in supply when more of a product id offered for sale than before
when the market price has not changed. An increase in supply completely shifts the
Price (c000)
Quantity Demanded (bags)
1 120
2 100
3 80
4 60
5 40
6 20
7 0

NOTE: This is a work in progress. All topics in the syllabus are covered but editing for necessary corrections is in progress.
Thanks.
60
supply curve to the right and is caused by a change in the other supply factors apart
from the market price of the good.
S1
Price S2
P S1 S0 0 Q1 Q2 Quantity supplied
From the diagram above, an increase in supply the supply initial supply curve shifts
completely from S1S1 to S2S2 and at the same price of the good, quantity supplied has
increased from Q1 to Q2.
Question 2.5
With diagrams, examine the effect of each on the equilibrium price and quantity of cement:
i. A discovery and use of a cheaper raw material which is an alternative to
clinker, the main raw material used to produce cement.
ii. An increase in the supply of houses.
iii. The imposition of a tax on each bag of cement by government
iv. A fall in the general level of consumer income by an average of 20 percent.
Answer
(i) A discovery and use of a cheaper raw material which is an alternative to clinker, the
main raw material used to produce cement will decrease the cost of production of
cement and cause an increase in supply of it. This will completely shift the supply
curve to the right as shown in the diagram below.
S0
Price S1 D E0
PO P P1

NOTE: This is a work in progress. All topics in the syllabus are covered but editing for necessary corrections is in progress.
Thanks.
61
S0 E1 S1 D 0 Q0 Q1 Q2 Quantity
The supply curve will shift from S0 to S1 with demand conditions remaining the same. At
the initial equilibrium price of cement of OP0 excess supply (or surplus) of Q0Qs will be
created and this will force the equilibrium price down to OP1. Equilibrium quantity will
increase from OQ0 to OQ1.
(ii) Cement, being a new material for the building of houses, has a derived demand. That is, the
demand for houses derives the demand for cement. An increase in the supply of houses will
cause an increase in the demand for cement.
Price D1 S D0
P1 P0 S D1 O DO Qo Qo Q1 Quantity
As a result of the increase in the demand for cement, the demand for cement curve has shifted
completely from D0 to D1. If supply conditions remain unchanged then excess demand or shortage
of Q0QD is created a the initial equilibrium price of OP0. The shortage of cement will force its price up
to OP1 and equilibrium quantity will increase from OQ0 to OQ1.
(iii) An imposition of a per unit tax cement will increase the cost of producing cement and will in
turn cause a decrease in the supply of cement.
Price
D S1
E1 S0
P1 P0 E0

NOTE: This is a work in progress. All topics in the syllabus are covered but editing for necessary corrections is in progress.
Thanks.
62
S1 D S0 0 Qs Q1 Q0 Quantity
The supply curve will shift from S0 to S1. If demand conditions remain unchanged then excess
demand or shortage of Q0Qs is created at the initial equilibrium price of OP0. The shortage of
cement will force its price up to OP1 and equilibrium quantity will increase from OQ0 to OQ1.
(iv) Cement is a normal good and so a fall in the general level of consumer income by an
average of 20 percent will result in decrease in the demand for cement.
Price D0
D1 S
P0 P1 D0 D1 0 QD Q1 Q0 Quantity As a result of the decrease in demand for cement, the demand for cement curve will shift completely
from D0 to D1. If supply conditions remain unchanged then excess supply or surplus of Q0QD will be
created at the initial equilibrium price of OP0. The surplus created will force the price of cement
down to OP1 and equilibrium quantity will decrease from OQ0 to OQ1.

NOTE: This is a work in progress. All topics in the syllabus are covered but editing for necessary corrections is in progress.
Thanks.
63
CHAPTER THREE
ELASTICITY OF DEMAND AND SUPPLY
3.0 LEARNING OBJECTIVES
After studying this chapter you should be able to:
Explain the concept of elasticity
Calculate and interpret own price elasticity of demand
Calculate and interpret cross-price elasticity of demand
Calculate and interpret income elasticity of demand
State and explain the determinants of each type of elasticity concepts.
3.1 INTRODUCTION
From the study of the determination of price and output, it was explained that the quantity
demanded of a commodity is affected by several factors, some of which are changes in a
commodity’s own price, prices of other related commodities (substitutes and complements),
consumer income etc. In the same vain, a change in the market price of a commodity affects
thequantity supplied of a commodity. Elasticity measures the extend or degree to which the
quantity demanded or supplied is affected by a change in any of these factors. Elasticity is
explained differently in economics from its general use. It is the degree of responsiveness of
one economic variable to a change in another.
3.2 OWN PRICE ELASTICITY OF DEMAND
Own price elasticity of demand is the degree of responsiveness of the quantity demanded of
a commodity to a change in its own price.
3.2.1 Measurement of Own Price Elasticity of Demand
Own price elasticity of demand is measured as percentage change in quantity
demanded divided by percentage change in the price of the commodity. It can be
measured at a point or an arc-method
PED= Percentage change in quantity demand
Percentage change in price
𝑃𝐸𝐷 =𝛥𝑄
𝑄÷
𝛥𝑃
𝑃 =
𝛥𝑄
𝛥𝑄𝑥 𝑃
Q
Where:
Q =the original quantity
P = the original price
ΔQ = change in quantity demanded
= New quantity minus the original quantity
ΔP = change in price
= New price minus the original price
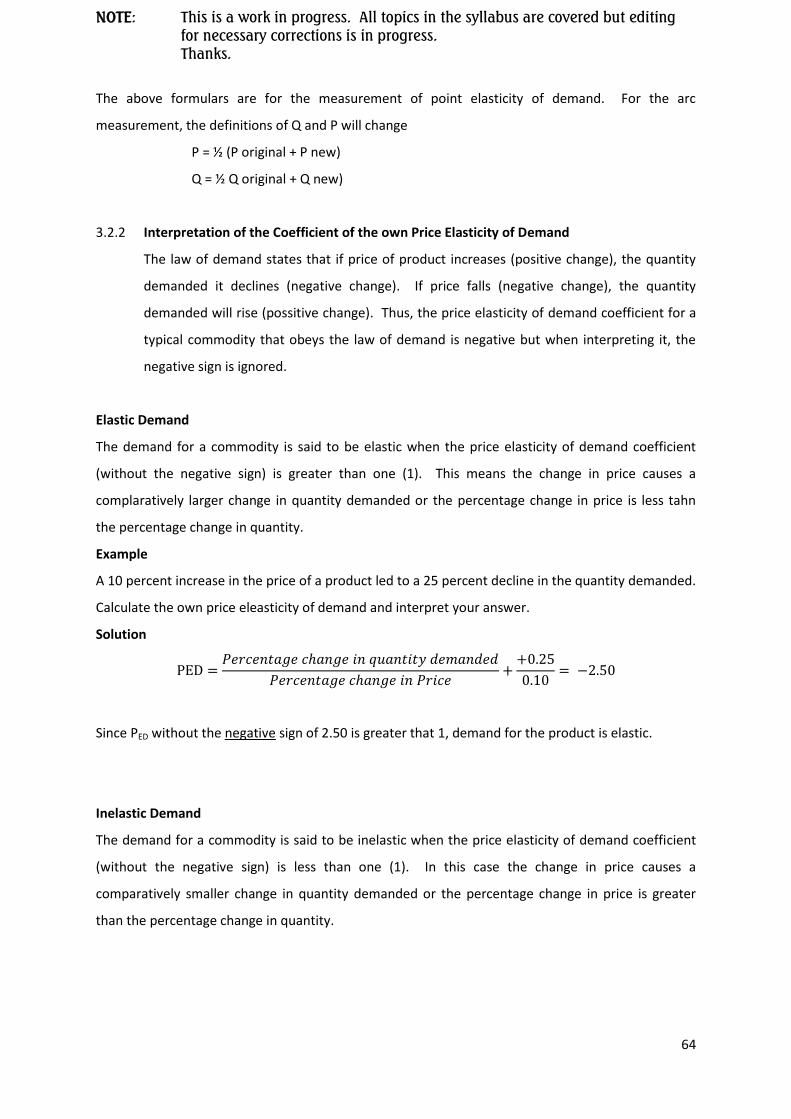
NOTE: This is a work in progress. All topics in the syllabus are covered but editing for necessary corrections is in progress.
Thanks.
64
The above formulars are for the measurement of point elasticity of demand. For the arc
measurement, the definitions of Q and P will change
P = ½ (P original + P new)
Q = ½ Q original + Q new)
3.2.2 Interpretation of the Coefficient of the own Price Elasticity of Demand
The law of demand states that if price of product increases (positive change), the quantity
demanded it declines (negative change). If price falls (negative change), the quantity
demanded will rise (possitive change). Thus, the price elasticity of demand coefficient for a
typical commodity that obeys the law of demand is negative but when interpreting it, the
negative sign is ignored.
Elastic Demand
The demand for a commodity is said to be elastic when the price elasticity of demand coefficient
(without the negative sign) is greater than one (1). This means the change in price causes a
complaratively larger change in quantity demanded or the percentage change in price is less tahn
the percentage change in quantity.
Example
A 10 percent increase in the price of a product led to a 25 percent decline in the quantity demanded.
Calculate the own price eleasticity of demand and interpret your answer.
Solution
PED =𝑃𝑒𝑟𝑐𝑒𝑛𝑡𝑎𝑔𝑒 𝑐𝑎𝑛𝑔𝑒 𝑖𝑛 𝑞𝑢𝑎𝑛𝑡𝑖𝑡𝑦 𝑑𝑒𝑚𝑎𝑛𝑑𝑒𝑑
𝑃𝑒𝑟𝑐𝑒𝑛𝑡𝑎𝑔𝑒 𝑐𝑎𝑛𝑔𝑒 𝑖𝑛 𝑃𝑟𝑖𝑐𝑒+
+0.25
0.10= −2.50
Since PED without the negative sign of 2.50 is greater that 1, demand for the product is elastic.
Inelastic Demand
The demand for a commodity is said to be inelastic when the price elasticity of demand coefficient
(without the negative sign) is less than one (1). In this case the change in price causes a
comparatively smaller change in quantity demanded or the percentage change in price is greater
than the percentage change in quantity.

NOTE: This is a work in progress. All topics in the syllabus are covered but editing for necessary corrections is in progress.
Thanks.
65
Example
The quantity demanded responded by increasing from 80 to 90 units to a reduction in the price of a
good from ¢136,000 to ¢102,000. Calculate the own price elasticity of demand and interpret your
results.
Solution
ΔP = ¢102,000 - ¢136,000 = - ¢34,000
ΔQ = 90 – 80 = 10
PED = (ΔQ/ ΔP) x (P/Q)+ = (10/-34,000) x (136,000/80) = -0.5
Since PED without the negative sign of 0.5 is less than 1, demand for the product is ineleastic.
Unit Elastic Demand
The deman for a commodity is said to be unit elestic when the price elasticity of demand is exactly
equal to one (1). The percentage change in price causes the same percentage change in quantity
demanded.
Example
A rise in the price of a product from ¢136,000 to ¢153,000 resulted in quantity demanded
decreasing from 80 to 70 units. Calculate the own price elasticity of demand and interpret
your results.
Solution
ΔP = ¢153,000 – ¢136,000 = ¢17,000
ΔQ = 70 – 80 = - 10
PED = (ΔQ/ΔP) x (P/Q) = (-10/17,000) x (136,000/80) = -1.0
Since PED without the negative sign is equal to 1, demand for the product is unit elastic.
Extreme Cases
These are situations where quantity demanded is either completely responsive or completely
unresponsive to a change in the price of a commodity. The demand for a commodity is perfectly
elastic when the absolute value of the price elasticity of demanf coefficient is equal to indinity (∞).
This is where a change in price causes a proportionately infinitely larger change in quantity
demanded. On the other hand, demand for a commodity is perfectly inelastic hen the price
elasticity of demand coefficient is equal to zero. This means a change in price a commodity does not
cause any change in quantity demanded.

NOTE: This is a work in progress. All topics in the syllabus are covered but editing for necessary corrections is in progress.
Thanks.
66
3.2.3 The Price Elasticity of Demand for a Straight Line Demand Curve
The price elasticity of demand is not the same along a downward sloping straight line
demand curve. For a linear demand curve sloping downward from left to right, the price
elasticity of demand starts from infinity (∞) at the point where the demand curve cuts the
price axis and falls as we move downward to the right along the curve to zero at the point
where the demand curve cuts the quantity axis.
Figure 3.1
Price
Perfectly elastic (PED = ∞)
Elastic (PED > 1)
Unit elastic (PED = 1)
Inelastic (PED <1)
Perfectly Inelastic
(PED=0)
0 Quantity demanded
At the price intercept, demand is perfectly elastic. At the mid-point of the demand curve, demand is
unit elastic. At the quantity intercept, demand is perfectly inelastic. Between the price intercept
and mid-point of the demand curve, demand is elastic while between the mid-point and the quantity
intercept, demand is inelastic.
3.2.4 Determinants of Price Elasticity of Demand
The price elasticity of demand varies widely across difference goods. Some goods have
more elastic demand while others have less elastic. The major factors that determine price
elasticity of demand are:
(i) The number of close substitute goods
The more substitutes a good has nad the more close the substitutes are, the more elastic the
demadn for the good. For example the beverage, bornvita, has a number of close
substitutes such as milo, chocomilo, ovaltine etc. Therefore, the demand for bornvita is

NOTE: This is a work in progress. All topics in the syllabus are covered but editing for necessary corrections is in progress.
Thanks.
67
likely space to be more elastic because the slightest increase in the price of bornvita,
comsumers of the product will switch to the comsumption of one of the substutes.
On the other hand, if the good does not have any close substitute, the demand tends to be
less elastic or inelastic. For example, there is hardly a substitute to food as a whole hence
the demand for food as a whole is inelastic.
(ii) The proportion of Income spent on the commodity
If the price of a good is relatively low such the expenditure on it is an insignificant fraction of
most individual or family incomes, then consumers of such a commodity are insensitive to a
price change of the good. It tends to have inelastic demand. On the other hand, if the price
is high and the proportion of income(s) spent on it large then it tends to have elastic
demand. For example, salt has relatively low price in Ghana and familites spent insignificant
percentage of their incomes on salt. Therefore even if the price of salt doubles, people find
little difficulty in buying the same quantity they used to buy.
(iii) Time
The demand for a product tends to be more elastic in the longer period of time and less
elastic in the shorter period of time. This is beacuse consumers need a longer time to adjust
to changes in price. In the case of substitutes like electricity and gas cookers, if the price of
electicity goes up it will take time for consumers to switch over from electicity cooker to gas
cooker for consumers need time to acquire the gadgets.
(iv) The number of possible uses
A commodity has high price elasticity of demand (or elastic demand) if it can be put into so
many uses. With such a commodity, if the price changes, the response of quantity
demanded to the price change becomes significant when changes in quantity demanded for
each use are put together. For instance, a commodity such as sugar is used for direct
comsumption, baking break and cake, making jam, etc. Thus the demand for sugar may be
fairly elastic.
(v) Habit Forming Commodities
Some commodities are habit forming while others are not. For habit forming commodities,
they tend to have less elastic or inelastic demand because once the habit is formed it is a bit
difficult to break away from it when the price of the commodity increases wven significantly.
For instance, one the habit of smoking cigarettes is formed, it is difficult to break away when

NOTE: This is a work in progress. All topics in the syllabus are covered but editing for necessary corrections is in progress.
Thanks.
68
the price of cigarettes rise. Non-habit forming commodities tend to have moreelastic
demand.
(vi) Luxuries and Necessities
Luxuries are things we can always do away with henace they tend to have elastic demand.
Necessities are difficult to dispense with. Therefore they tend to have inelastic demand.
(vii) Durability of the Commodity
With some commodities, we required one at a time and they are used for a very long time
before they get spoilt. Examples of such goods are cars, televisions, cars, furniture, building,
clothes etc. They tend to have low elasticity of demand (inelastic demand) because when
the price of a duable commodity changes, consumers will continue to use what they have.
Even when the price of such a commodity falls, it is new consumers who will mostly buy
them.
3.2.5 Price Elasticity of Demand and Total Revenue
Total Revenue (TR) is the product of a commodity’s market price (P) and the quantity of the
commodity purchased (Q):
Total Revenue (TR) = Price (P) x Qauntity purchased (Q)
The net effect of a price change on total revenue is determined by the size of the change is
relative to the size of the change in quantity demanded or the price elasticity of demand for
the goods. If demand is elastic, a fall in price increases the toal revenue whilst a rise in the
price reduces total revenue.
a) If demand is inelastic, a fall in price reduces total revenue whilst a rise in price creases
total revenue.
b) If demand is unit elastic, a change in price (either a fall or a rise) dies not affect total
revenue).
3.2.6 Applications of Price Elasticity of Demand
The concept of price elasticity of demand has some applications which inlcude the following:
(a) Pricing of Goods and services
It is important that price elasticity of demand is considered in decisions to change
prices of goods and services. If the demand for a good or service is elastic then to

NOTE: This is a work in progress. All topics in the syllabus are covered but editing for necessary corrections is in progress.
Thanks.
69
increase sales revenue, price should be reduced. On the other hand, if demand is
inelastic then to increase sales revenue, price should be increased.
(b) Government Taxation Policy
Government imposes indirect taxes on goods and services to either raise revenue or
discourage consumption of the good or service. Government pays attention to price
elasticity of demand imposing indirect taxes on goods and services. If government’s
aim is to raise revenue then goods and services with inelastic demand will be
selected. On the other hand, if the aim is to discourage consumption then goods and
services with services with inelastic demand will be slected.
(c) Minimum Wage Policy
Minimum wage is usually fixed above the equilibrum market wage. This causes
employers to demand less labour while supply of labour increases creating
unemployment of labour. For minimum wage policy to succeed and cause less
employment then demand for labour should be inelastic.
3.3 INCOME ELASTICITY OF DEMAND
Income elasticity of demand is the responsiveness of demand for a commodity to a change
in consumer income.
3.3.1 Measurement of Income Elasticity of Demand
Income electricity of demand (YED) is measured as percentage change in demand
divided by percentage change in income.
YED =𝑃𝑒𝑟𝑐𝑒𝑛𝑡𝑎𝑔𝑒 𝑐𝑎𝑛𝑔𝑒 𝑖𝑛 𝑑𝑒𝑚𝑎𝑛𝑑
𝑃𝑒𝑟𝑐𝑒𝑛𝑡𝑎𝑔𝑒 𝑐𝑎𝑛𝑔𝑒 𝑖𝑛 𝑖𝑛𝑐𝑜𝑚𝑒
=𝛥𝐷
ΔI𝑥
𝐼
𝐷
Where
D = the original demand
I = the original income
ΔD = change in demand
= New demand minus the original demand
ΔI = change in income
= New income minus the original income

NOTE: This is a work in progress. All topics in the syllabus are covered but editing for necessary corrections is in progress.
Thanks.
70
3.3.2 Interpretation of the Income Elasticity Coefficient (YED)
Usually it is the sign of the income elasticity of demand coefficient which is
explained though we can also explain the magnitude of the coefficient as we do for
price elasticity of demand.
Superior Good
This is when the income elasticity of demand coefficient is povitive and greater than
one, meaning as incomes increase by a given percentage demand for the good will
increase more than the given percentage increase.
Normal Good
This is when the income elasticity of demand coefficient is positive but less than or
equal to one meaning as incomes increase by a given percentage demand for the
good will increase less than the given percentage increase.
Inferior Good
A good is described as inferior when its income elasticity of demand coefficient is
negative, meaning less will be demanded as incomes rise.
Necessity Goods
Goods are necessity when its income elasticity of demand coefficient is zero (neutral
number) meaning demand for the good is insensitive to change in income.
When the coefficient without the sign is less than 1 its demand is income inelastic, if
greater than 1 its demand is income elastic and when equal to one its demand is
income unit elastic.
Example
Consider the following schedule for a good:
Income (¢) 50,000 70,000 Demand (units) 200 250 Calculate the income elasticity of demand for the good?
Solution
ΔD = 250 – 200 = 50
ΔI = 70,000 – 50,000 = 20,000
IED = (ΔD/ΔI) x (I/D) = (50/20,000) x (200/50,000) = 0.25

NOTE: This is a work in progress. All topics in the syllabus are covered but editing for necessary corrections is in progress.
Thanks.
71
Since the income elasticity of demand is positive and less than 1, the good in question is normal and
income inelastic.
3.3.3 Importance of Income Elasticity of Demand
(a) Income elasticity of demand shows how the pattern of consumer demand changes
in response to economic growth or decline. If an economy is growing, consumer
demand for m=normal goods increases while the demand for inferior goods falls.
(b) Income elasticity of demand is also important for businessmen when palling
investments. Outputs of inferior goods should not be expanded during times that
incomes are rising while those of normal goods could be expanded during times that
incomes are rising.
3.4 Cross-price Elasticity of Demand
Cross-price elasticity of demand is the responsiveness of the quantity demanded of one
commodity (say, A) to a change in the price of another commodity (say, B).
3.4.1 Measurement of Cross-price Elasticity of demand (CED)
It is measured as percentage change in demand for one commodity (say, A) divided
by percentage change in the price of another commodity (say, B).
That is, cross price elasticity of demand between goods A and B is calculated are:
CEDA, B =𝑃𝑒𝑟𝑐𝑒𝑛𝑡𝑎𝑔𝑒 𝑐𝑎𝑛𝑔𝑒 𝑖𝑛 𝐷𝑒𝑚𝑎𝑛𝑑 𝑜𝑓 𝐺𝑜𝑜𝑑 𝐴
𝑃𝑒𝑟𝑐𝑒𝑛𝑡𝑎𝑔𝑒 𝑐𝑎𝑛𝑔𝑒 𝑖𝑛 𝑃𝑟𝑖𝑐𝑒 𝑜𝑓 𝐺𝑜𝑜𝑑 𝐵
=𝛥𝐷A
𝛥𝑃𝐵 𝑥
𝑃𝐵
𝐷𝐴
Where:
QA1 = the original demand for good A
PB = the original price of good B
ΔQA = change in demand for good A
= New demand for good A minus the original demand for good A
ΔPB = change in price of good B
= New price og good B minus the original price of good B
3.4.2 Interpretation of the Cross-price Elasticity Coefficient (IED)
In the cae of cross-price elasticity of demand it is the sign of the coefficient which is
explained though we can also explain the magnitude of the coefficient as we do for
price elasticity of demand.

NOTE: This is a work in progress. All topics in the syllabus are covered but editing for necessary corrections is in progress.
Thanks.
72
Substitutes
The goods in question are substitutes when the cross-price elasticity of demand
coefficient is positive, meaning as the price of good B increases demand for the good
A will increase.
Complements
The goods in question are complements when the cross-price elasticity of demand
coefficient is negative, meaning as the price of good B increases demand for the
good A will decrease.
No Relation
The good in question is not related when the cross-price elasticity of demand
coefficient is zero, menaing any change price of good B does not affect demand for
the good A.
Example
Consider the following demand data on goods A and B
Good A Good B
Price (¢) Quantity Demanded Price (¢) Quantity Demanded
20 300 50 100
20 250 60 80
i) Calculate the cross-price elasticity of demand; and
ii) Interpret your results.
Solution
i) ΔQA = 250 – 300 = -50
QA = 300
ΔPB1 = 60 – 50 = 10
PB = 50
Therefore,
CEDAB = (ΔDA/ ΔPB) x (PB/DA) = (-50/10) x (50/300) = -0.83
ii) Since CEDA,B = -083 is negative, the two goods, A and B are complements, meaning
the increase in the price of good B has caused a fall in the demand of good A.

NOTE: This is a work in progress. All topics in the syllabus are covered but editing for necessary corrections is in progress.
Thanks.
73
3.5 PRICE ELASTICITY OF SUPPLY
It is the degree of responsiveness of quantity supplied of a commodity to a change in the
price of the commodity.
3.5.1 Measurment of Price Elasticity of Supply (PES)
It is measured as percentage change in quantity supplied divided by percentage change in
the market price of the commodity.
PES =𝑃𝑒𝑟𝑐𝑒𝑛𝑡𝑎𝑔𝑒 𝑐𝑎𝑛𝑔𝑒 𝑖𝑛 𝑄𝑢𝑎𝑛𝑡𝑖𝑡𝑦 𝑆𝑢𝑝𝑝𝑖𝑒𝑑
𝑃𝑒𝑟𝑐𝑒𝑛𝑡𝑎𝑔𝑒 𝑐𝑎𝑛𝑔𝑒 𝑖𝑛 𝑃𝑟𝑖𝑐𝑒
=𝛥𝑄𝑠
𝛥𝑃 𝑥
𝑃
𝑄𝑠
Where Qs = Initial Quantity Supplied
P = Initial Market Price
ΔQs = Change in Quantitty Supplied (New Quantity minus Initial
Quantity)
ΔP = Change in Price (New Price minus Initial Price)
3.5.2 Interpretation of the Price Elasticity of Supply Coefficient
The price elasticity of supply coefficient for a typical commodity that obeys the law
of supply is positive.
(a) Elastic Supply
The supply of a commodity is said to be elastic when the price elasticity of supply
coefficient is greater than one (1). This means a change in price causes a
comparatively larger change in quantity supplied or the percentage change in price
is less than the percentage change is quantity supplied.
Example
With a 5 percent increase in the market price of a product, supplied increased the
quantity supplied by 25 percent. Calculate the price elasticity of supply and
interpret your answer.
Solution
PES =𝑃𝑒𝑟𝑐𝑒𝑛𝑡𝑎𝑔𝑒 𝑐𝑎𝑛𝑔𝑒 𝑖𝑛 𝑄𝑢𝑎𝑛𝑡𝑖𝑡𝑦 𝑆𝑢𝑝𝑝𝑖𝑒𝑑
𝑃𝑒𝑟𝑐𝑒𝑛𝑡𝑎𝑔𝑒 𝑐𝑎𝑛𝑔𝑒 𝑖𝑛 𝑀𝑎𝑟𝑘𝑒𝑡 𝑃𝑟𝑖𝑐𝑒 =
0.25
0.05 = 5
Since PES is 5 is greater than 1, supply of the product is elastic.

NOTE: This is a work in progress. All topics in the syllabus are covered but editing for necessary corrections is in progress.
Thanks.
74
(b) Inelastic Supply
The supply of a commodity is said to be inelastic when the price elasticity of supply
coefficient is less tahn one (1). In this case a change in price causes a comparatively
smaller change in quantity demanded or the percentage change in price is greater
that the percentage change in quantity sypplied.
Example
The price of a good fell from ¢150,000 to ¢140,000 and quantity supplied responded
by falling from 80 to 75 units. Calculate price elasticity of supply and interpret your
results.
Solution
ΔP = ¢140,000 – ¢150,000 = ¢10,000
ΔQs = 75 – 80 = -5
PED = (ΔQs / ΔP) x (P/Qs)= (-5/-10,000) x (150,000/80) = 0.9
Since PES of 0.9 is less thatn 1, supply of the product is inelastic.
Unit Elastic Supply
The supply of a commodity is said to be unit elastic when the price elasticity of
supply is exactly equal to 1. The percentage change in price causes the same
percentage change in quantity supplied.
Example
A rise in the price of a product from 200,000 to 220,000 resulted in quantity supplied
increasing from 300 to 330 units. Calculate the price elasticity of supply and
interpret your results.
Solution
ΔP = ¢220,000 – ¢200,000 = ¢20,000
ΔQs = 330 – 300 = 30
PED = (ΔQs / ΔP) x (P/Qs)= (30/20,000) x (200,000/300) = 1
Since PES is equal to 1, supply of the product is unit elastic.
Extreme Cases
These are situations where quantity supplied is either completely responsive or
completely unresponsive to a change in the market price of a commodity. The
supply of a commodity is perfectly elastic when the price elasticity of supply
coefficient is equal to infinity (∞). This is where a change in price causes a
propertionately infinitely larger change in quantity supplied. On the other hand,

NOTE: This is a work in progress. All topics in the syllabus are covered but editing for necessary corrections is in progress.
Thanks.
75
supply of a commodity is perfectly inelastic when the price elasticity of supply
coefficient is equal to zero. This means a change in price elasticity of supply
coefficient is equal to zero. This means a change in price of a commodity does not
cause any change in quantity supplied.
3.5.3 Determinants of Price Elasticity of Supply
The price elasticity of supply also varies widely across different products. Some
products have more elastic supply while others have less elastic supply. The major
factors that determin price elasticity of supply are:
i) The Availability and Bobility of Factors of Production
If factors of production are available then supply respons quickly and largely
to a change in the price of a product (i.e. supply then tends to be more
elastic) but less elastic (inelastic) when factors transferred from the
production of one good to that of another, the greater the elasticity of
supply.
ii) Inflence of the Weather
If output is controlled by wether conditions, as in the case of agricultural
products, the output cannot be controlled by the produer. Hence the supply
of such product tends to be less elastic (inelastic).
iii) The level of Technology
The extend to which output can be increased depends on the level of
technology employed by the producer. Advanced technology used in
production tends to make the supply of a product more elastic.
iv) Costof Production
If the cost involved in the production of a product is very high, output
cannot be easily increased when the market price increases unless the
increase in price is great enough to absorb the cost.
v) Degree of Perishability
The supply of highly a perishable commodity is relatively inelastic and that
of a less perishable commodity is relatively elastic. The explanation is that

NOTE: This is a work in progress. All topics in the syllabus are covered but editing for necessary corrections is in progress.
Thanks.
76
highly perishable goods cannot be stocked for longer period to be released
when price for instance rises.
vi) Time (Gestation Period)
Supply elasticity to be greater in the longer period. The longer the period,
the easlier it is to shift factors of production among products, following a
change in their relative prices. This holds for agricultural products, because
of the natural time lag between planting andn harvesting of crops. In the
short-run, the supply of most products tends to be ralatively inelastic.
3.6 SUMMARY
Elasticity in economics is the degree of responsiveness of one economic variable to a
change in another.
Own price elasticity of demand is the degree of responsiveness of the quantity
demanded of a commodity to a change in its own price. Income elasticity of
demand is the responsiveness of demand for a commodity to a change in consumer
income.
Cross-price elasticity of demand is the responsiveness of the quantity demanded of
one commodity (say , A) to a change in the price of another commodity (say, B).
Price elasticity of supply is the responsiveness of quantity supplied of a commodity
to a change in the price of the commodity.
3.7 REVISION QUESTIONS
SECTION A: Multiple Choice Question (MCQ)
CHAPTER THREE
1. When the price elasticity of supply coefficient is greater than 1, the supply of the
product is said to be
A. Perfectly elastic
B. Perfectly inelastic
C. Elastic
D. Inelastic
E. Unit elastic
2. Which of the following factors does not determine price elasticity of demand for
particular goods?
A. Closeness of substitute goods
B. The percentage of income spent on the commodity
C. Habit of the consumer on the commodity

NOTE: This is a work in progress. All topics in the syllabus are covered but editing for necessary corrections is in progress.
Thanks.
77
D. The quantity of the goods demanded
E. The number of possible uses of the commodity
3. A good is described as inferior when its income elasticity of demand coefficient
is
A. Negative
B. Positive
C. Zero
D. Infinity
E. One
4. The responsiveness of the quantity demanded of one commodity to a change in
the price of another commodity defines
A. Own price elasticity of demand
B. Cross-price elasticity of demand
C. Income elasticity of demand
D. Income inelasticity of demand
E. Perfect elasticity of demand
5. When a 15 percent increase in the price of a product leads to a 25 percent
increase in the quantity supplied of the product, then the price elasticity of
supply coefficient is
A. 0.6
B. 1.7
C. 1.5
D. 0.33
E. 0.25
Solution To Multiple Choice Questions (MCQ)
CHAPTER THREE
1. C
2. D
3. A
4. B
5. B
Short Answer Questions
1. The responsiveness of quantity demanded for a commodity to changes in consumers
income is called…………………….
2. Two commodities are …………………….if the co-efficient of their cross price elasticity of
demand is positive.
3. If the quantity demanded of a commodity increases from 100 to 140 when unit price
falls from$ 50 to $ 45 , the co-efficient of price elasticity of demand is …………………….

NOTE: This is a work in progress. All topics in the syllabus are covered but editing for necessary corrections is in progress.
Thanks.
78
4. Given that any quantity of a particular commodity can be bought at a given price, the
demand for the commodity is said to be …………………………..
5. What will be the effect on the market price of a product if an increase in its demand
and its supply remains constant and perfectly price inelastic?
Solution To Short Answers Questions
CHAPTER THREE
1. Income elasticity of demand
2. Substitutes
3. 4
4. Perfectly elastic
5. The market price increases
Question 3.1
(a) Define own price elasticity of demand
(b) Explain the factors that determine the own price elasticity of demand?
Answer
(a) Own price elasticity od demand is the degree of responsiveness of the quantity demanded of
a commodity to a change in its own price and measured as percentage change in quantity
demanded divided by percentage change in the price of the commodity. That is
PED =𝑃𝑒𝑟𝑐𝑒𝑛𝑡𝑎𝑔𝑒 𝑐𝑎𝑛𝑔𝑒 𝑖𝑛 𝑄𝑢𝑎𝑛𝑡𝑖𝑡𝑦 𝐷𝑒𝑚𝑎𝑛𝑑𝑒𝑑
𝑃𝑒𝑟𝑐𝑒𝑛𝑡𝑎𝑔𝑒 𝑐𝑎𝑛𝑔𝑒 𝑖𝑛 𝑃𝑟𝑖𝑐𝑒
(b) The own price elasticity of demand varies widely across different goods. The demand for
some goods is more elastic while others are less elastic. The factors that determine price
elasticity of demand include:
i) The number of closesubstitute goods
The more substitutes of good has and the more close the substitutes are, the more
elastic the demand for the good. For example, the beverage, bornvita, has a number
of close sustitutes such as milo, chocolim, ovaltine etc. Therefore, the demand for
bornvita is likely to be more leastic because the slightest increase in the price of

NOTE: This is a work in progress. All topics in the syllabus are covered but editing for necessary corrections is in progress.
Thanks.
79
bornvita, consumers of the product will switch to the consumption of one of the
substitutes.
On the other hand, if the goods does not have any close sustitute, the demand tends
to be less elastic or inelastic. For example, there is hardly a substitute to food as a
whole hence the demand for food as a whole is inlestic.
ii) The proportion of Income spent on the Commodity
If the price of a good is relatively low such the expenditure on it is an insignigicant
fraction of most individual or family incomes, then consumers of such a commodity
are insensitive to a price change of the good. It tends to have inelastic demand. On
the other hand, if the price is high the proportion of income)s) spent on it is large
than it tends to have elastic demand. For example, salt has relatively low price in
Ghana and families spen insignificant percentage of their incomes on salt.
Therefore, even if the price of salt doubles, people find little difficulty in buying the
same quantity they used to buy.
iii) Time
The demand for a product tends to be more elastic in the longer period of time ad
less elastic in the shorter period of time. This is because consumers need a longer
time to adjust to changes in price. In the case of substitutes like elasticity and gas
cooker, if the price of electricity goes up it will take time for consumers to switch
over from electricity cooker to gas cooker for consumers need time to acquir the
gadgets.
iv) The number of possible uses
A commodity has high price elasticity of demand (or elastic demand) if it can be put
into so many users. With such a commodity, if the price changes, the responses of
quantity demanded to the price change becomes significant when changes in
quantity demanded for each use are put together. For instance, a commodity such
as sugar is used for direct comsumption, baking bread and cake, making jam etc.
Thus,
the demand for sugar may be fairly elastic.
v) Habit Forming Commodity

NOTE: This is a work in progress. All topics in the syllabus are covered but editing for necessary corrections is in progress.
Thanks.
80
Some commodities are habit corming while others are not. For habit forming
commodities, they tend to have less elastic or inelastic demand because once the
habit is formed it is abit difficult to break away from it when the price of the
commodity increases even significantly. For instance, once the habit of smoking
cigarettes is formed, it is difficult to break away when the price of cigarettes rise.
Non-habit forming commodities tend to have more demand.
vi) Luxuries and Necessities
Luxuries are things we can always do away with hence they tend to have elastic
demand. Necessities are difficult to dispense with and they tend to have inelastic
demand.
vii) Durability of the Commodity
With some commodities, we require one at a time and they are used for a very long
time before they get spoilt. Examples of such goods are cars, televisions, furnitures,
building, clothes etc. They tend to hve low elasticity of demand (inelastic demand)
because when the price of a durable commodity changes, consumers will continue to
use what the have. Even when the price of such a commodity falls, it is new
consumers who will mostly buy them.
Question 3.2
(a) Explain the concept of price elasticity of supply.
(b) What factors determine the price elasticity of supply?
Answer
(a) It is the responsiveness of quantity supplied of a commodity to a change in the price of the
commodity and measured as percentage change in quantity supplied divided by percentage
change in the market price of the commodity. That is:
PES =𝑃𝑒𝑟𝑐𝑒𝑛𝑡𝑎𝑔𝑒 𝑐𝑎𝑛𝑔𝑒 𝑖𝑛 𝑄𝑢𝑎𝑛𝑡𝑖𝑡𝑦 𝑆𝑢𝑝𝑝𝑖𝑒𝑑
𝑃𝑒𝑟𝑐𝑒𝑛𝑡𝑎𝑔𝑒 𝑐𝑎𝑛𝑔𝑒 𝑖𝑛 𝑃𝑟𝑖𝑐𝑒
(b) The price elasticity of supply varies widely across different products. Some products have
more leastic supply, while others have less elastic supply. The major factors that determine
price elasticity of supply are:
(i) The Availability and Mobility of Factors of Production

NOTE: This is a work in progress. All topics in the syllabus are covered but editing for necessary corrections is in progress.
Thanks.
81
If factors of production are available then supply response quickly and largely to a
change in the price of a product (i.e. supply then tends to be more elastic), but less
elastic (inelastic) when factors of production are not available. The more easily factors
can be transferred from the production of one good to that of another, the greater the
elasticity of supply.
(ii) Influence of the weather
If output is controlled by weather conditions, as in the case of agriculture products, the
output cannot be controlled by the producer. Hence the supply of such product tends to be
less elastic (inelastic).
(iii) The Level of Technology
The extend to which output can be increased depends on the level of technology employed
by the producer. Advanced technology used in production tends to make the supply of a
product more elastic.
(vi) Cost of production
If the cost involved the production of a product is very high, output cannot be easily
increased when the market price increases unless the icrease in price is great enough to
absorb the cost.
(vii) Degree of perishability
The supply of highly a perishable commodity is relatively inelastic and that of a less
perishable commodity is relatively elastic. The explanation is that highly perishable goods
cannot be stocked for longer period to be relased when price for instance rises.
(viii) Time (Gestation Period)
Supply elasticity tends to be greater in the longer period. The longer the period, the easier it
is to shift factors of production among products, following a change in their relative prices.
This holds for agricultural products, becasue of the natural time lag between planting and
harvesting of crops. In the short-run, the supply of most products tends to be relatively
inelastic.
Questions 3.3
(a) Distinguish between price elasticity of demand and income elasticity of demand.
(b) Of what uses are own price elasticity of demand and income elasticity of demand?

NOTE: This is a work in progress. All topics in the syllabus are covered but editing for necessary corrections is in progress.
Thanks.
82
Answer
(a) Own price elasticity of demand is the degree of responsiveness of the quantity demanded of
a commodity to a change in tis own price and measured as percentage change in quantity demanded
divided by percentage change in the price of the commodity. That is:
PED =𝑃𝑒𝑟𝑐𝑒𝑛𝑡𝑎𝑔𝑒 𝑐𝑎𝑛𝑔𝑒 𝑖𝑛 𝑄𝑢𝑎𝑛𝑡𝑖𝑡𝑦 𝑑𝑒𝑚𝑎𝑛𝑑
𝑃𝑒𝑟𝑐𝑒𝑛𝑡𝑎𝑔𝑒 𝑐𝑎𝑛𝑔𝑒 𝑖𝑛 𝑃𝑟𝑖𝑐𝑒
On the other hand, income elasticity of demand is the responsiveness of demand for a commodity to
a change in consumer income and measured as percentage change in quantity demanded divided by
percentage change in income.
IED =𝑃𝑒𝑟𝑐𝑒𝑛𝑡𝑎𝑔𝑒 𝑐𝑎𝑛𝑔𝑒 𝑖𝑛 𝑄𝑢𝑎𝑛𝑡𝑖𝑡𝑦 𝑑𝑒𝑚𝑎𝑛𝑑𝑒𝑑
𝑃𝑒𝑟𝑐𝑒𝑛𝑡𝑎𝑔𝑒 𝑐𝑎𝑛𝑔𝑒 𝑖𝑛𝑐𝑜𝑚𝑒
(b) The concept of price elasticity of demand has some uses whihc include the following:
(i) Pricing of goods and services
It is important that price elasticity of demand is considered in decisions to change prices of
goods and services. If the demand for a good or service is elastic then to increase sales
revenue, price should be reduced. On the other hand, if ademand is inelastic then to
increase sales revenue, price should be increased.
(ii) Government taxation policy
Government imposes indirect taxes on goods and services to either raise revenue or
discourage consuption of the good and service. Government pays attention to price
elasticity of demand imposing indirect taxes on goods and services. If goverenment’s aim is
to raise revenue then goods and services with inelastic demand will be selected. On the
other hand, if the aim is to discourage consumption then goods and services with inelastic
demand will be selected.
(iii) Minimum wage policy
Minimum wage is usually fixed above the equilibrium market wage. This causes employers
to demand less labour while supply of labour increases creating unemployment of labour.
For minimum wage policy to succeed and cause less employment then demand for labour
should be inelastic.

NOTE: This is a work in progress. All topics in the syllabus are covered but editing for necessary corrections is in progress.
Thanks.
83
Income elasticity of demand on the other hand, has the following uses
(i) Income elasticity of demand shows how the pattern of consumer demand changes in
response to econmic growth or decline. If an economy is growing, consumer demand for normal
goods increase while the demand for inferior goods falls.
(ii) Income elasticity of demand is also important for businessmen when planning investments.
Outputs of inferior goods should not be expanded during times that incomes are rising while those
of normal goods could be expanded furing times that incomes are rising.
Question 3.4
(a) The demand equation of a good is given as:
QD = 250,000 – 35P
Where QD and P are the quantity demanded and price of the goods respectively.
(i) How many of the good will be demanded at prices ¢2,000 and ¢3,000?
(II) Calculate the price elasticity of demand when the price of the good increases from ¢2,000 to
¢3,000 and interpret your result.
(b) The own price elasticity of demand for a product is estimated to be -2.2. If the price declines
by 20 per cent, what will be the expented percentage increase in the quantity of the
product sold?
Answer
(a) Given the demand function
QD = 250,000 – 35P
(i)If P = ¢2000,
QD = 250,000 – 35 (2000) = 250,000 – 70,000 = 180,000
If P = ¢3000.
QD = 250,000 – 35 (3000) = 250,000 – 105,000 = 145,000
(ii) 𝑃𝐸𝐷 =𝛥 𝑄
𝑄÷
𝛥 𝑃
𝑃=
𝛥 𝑄
𝛥 𝑃𝑥𝑃
𝑄
ΔQD = 145,000 – 180,000 = -35,000

NOTE: This is a work in progress. All topics in the syllabus are covered but editing for necessary corrections is in progress.
Thanks.
84
ΔP = 3,000 – 2,000 = 1,000
PED = {(-35,000)/1000} x {2000/180,000} = -7/18 = -0.39
Since |PED| = 0.39 less than 1, demand for the good is price inelastic.
(b)
PED =𝑃𝑒𝑟𝑐𝑒𝑛𝑡𝑎𝑔𝑒 𝑐𝑎𝑛𝑔𝑒 𝑖𝑛 𝑄𝑢𝑎𝑛𝑡𝑖𝑡𝑦 𝑑𝑒𝑚𝑎𝑛𝑑𝑒𝑑
𝑃𝑒𝑟𝑐𝑒𝑛𝑡𝑎𝑔𝑒 𝑐𝑎𝑛𝑔𝑒 𝑝𝑟𝑖𝑐𝑒
It follows that;
Given that PED = -2.2, and percentage change in price = -20%
-2-2 = 𝑃𝑒𝑟𝑐𝑒𝑛𝑡𝑎𝑔𝑒 𝑐𝑎𝑛𝑔𝑒 𝑖𝑛 𝑄𝑢𝑎𝑛𝑡𝑖𝑡𝑦 𝑑𝑒𝑚𝑎𝑛𝑑𝑒𝑑
−20%
Percentage change in quantity demanded = (-2.2) x (-20%) = 44%
That is, quantity demanded will increase by about 44%
Question 3.5
(a) What is cross-price elasticity of demand and how is it measured?
(b) APUS Plc, manufactures a line pf product which it sells at N5,000 each. Its sales have
averaged about 60,000 units per wel during the past years. Last week its closest competitor,
KELE Plc, cut its price from N6,000 to N4,500 and this caused a decline in the sales of APUS
Plc to 30,000 units per week.
(i) Calculate the cross-price elasticity of demand for the product
(ii) Are the two firms very close competitors? Explain your answer.
Answer
(a) Cross-price elasticity of demand is the responsiveness of the quantity demanded of one
commodity (say, A) to a change in the price of another commodity (say, B). It is measured as
percentage change in quantity demanded of one good (say, A) divided by percentage change in price
of another good (say, B). That is, cross price elasticity of demand between goods A and B is
calculated as:
EAB =𝑃𝑒𝑟𝑐𝑒𝑛𝑡𝑎𝑔𝑒 𝑐𝑎𝑛𝑔𝑒 𝑖𝑛 𝑄𝑢𝑎𝑛𝑡𝑖𝑡𝑦 𝑑𝑒𝑚𝑎𝑛𝑑𝑒𝑑 𝑜𝑓 𝐺𝑜𝑜𝑑𝑠 𝐴
𝑃𝑒𝑟𝑐𝑒𝑛𝑡𝑎𝑔𝑒 𝑐𝑎𝑛𝑔𝑒 𝑝𝑟𝑖𝑐𝑒 𝑜𝑓 𝐺𝑜𝑜𝑑 𝐵
=𝛥 𝑄𝐴
𝛥 𝑃𝐵 x
𝑃𝐵
𝑄𝐴
Where:
QA = the original quantity of good A
PB = the original price of good B

NOTE: This is a work in progress. All topics in the syllabus are covered but editing for necessary corrections is in progress.
Thanks.
85
ΔQA = changein quantity demanded of good A
EAB = Cross elasticity of demand for good A with respect to the price of good B.
ΔPB = changein price of good B
(b) (i) EAB =𝛥 𝑄𝐴
𝛥 𝑃𝐵 x
𝑃𝐵
𝑄𝐴
ΔQA = 30,000 – 60,000 = -30,000
ΔPB = 4,000 – 6,000 = -1,500
QA = 60,000 PB = 6,000
EAB = {(-30,000)/(-1.500)} x {6,000/60,000} = 2
(ii) Yes, the two firms are very close competitors. This is because every 1% cut in price
by KELE Plc causes a 2% fall in the demand for the product of APUS Plc. The product
of the two companies are close substitutes.

NOTE: This is a work in progress. All topics in the syllabus are covered but editing for necessary corrections is in progress.
Thanks.
86
CHAPTER FOUR
THE THEORY OF CONSUMER BEHAVIOUR
4.0 LEARNING OBJECTIVES
After studying this chapter, readers should be able to understand
How demand curve for a product can be derived
Analyze the effects of a change in price of a product on consumers’
purchases.
4.1 INTRODUCTION
The theory of consumer behaviour offers an explanation of how people as
consumers choose which goods and how much of each of them to buy within the
limits presented by each person’s budget. By implication, the theory is suggested to
explain the law of demand i.e the derivation of the demand curve which we
encountered in Chapter 2.
In this chapter, two main alternative explanations of the downward sloping demand
curve are presented. First, the marginal utility theory otherwise referred to as the
cardinalist approach. And second, the indifference curve theory, otherwise referred
to as the ordinalist approach.
4.2 THE MARGINAL UTILITY THEORY
4.2.1 Basic Concepts
Basic concepts in the explanation of the marginal utility theory of consumer
behaviour are highlighted in this sub-section.
4.2.1.1 Total Utility
This refers to the total satisfaction obtained by a consumer from the consumption of
some quantity of a good or service. For example, the total utility from Apple (TUa) is
dependent on the quantity of Apple (Qa) consumed. More formally written as
TUa=f(Qa) ...(4.1)
Equation 4.1 is called total utility function

NOTE: This is a work in progress. All topics in the syllabus are covered but editing for necessary corrections is in progress.
Thanks.
87
4.2.1.2 Marginal Utility
The marginal utility of a particular good or service is the additional satisfaction a
consumer derives from one more unit of the good or services. It is obtained as the
ratio of change in total utility (∆TU) to change in the quantity (∆Q) consumed of a
good or service. For instance, marginal utility of Apple can be expressed as
MU2 = TU2 – TU1 .....(4.2)
Table 4.1: Total and Marginal Utility of Apple
Quantity of Apple per day Total Utility (Utils) Marginal Utility
0 0 0
1 50 50
2 95 45
3 130 35
4 160 30
5 175 15
6 180 5
7 175 -5
8 160 -15
The MU column in Table 4.1 is obtained using the relationship described in equation
(4.2)
Figure 4.1
200
150
100
50
0 1 2 3 4 5 6 7 8 Quantity of apple

NOTE: This is a work in progress. All topics in the syllabus are covered but editing for necessary corrections is in progress.
Thanks.
88
Figure 4.2
MU
Quantity of apple
Table 4.1 shows a total utility schedule for consumption of apple by a hypothetical
consumer, while in Figures 4.1 the consumer’s total utility and marginal utility curves
are plotted from the data in Table 4.1
4.2.1.3 The law of Diminishing Marginal Utility
The principle of diminishing marginal utility states that as more and more units of a
particular good or service are consumed during a specific time period, the
satisfaction from each additional unit of the good or service decreases.
4.2.1.4 Consumer Equilibrium
This refers to a situation in which consumers cannot increase the total utility they
obtain from a given budget (i.e. the amount of money they have to spend at any
given time) by shifting expenditure from one good to another. For a consumer that
has a given amount of money to spend on two goods, the consumer equilibrium
80
60
40
20
0
-20
1
2
3
4
5
6
7
8
Mar
gin
al U
tilit
y To
tal U
tilit
y
NOTE: This is a work in progress. All topics in the syllabus are covered but editing for necessary corrections is in progress.
Thanks.
89
condition is said to prevail if the marginal utility per Naira worth of the two goods
are the same. Assuming a consumer has an amount of money income to spend on
meat pie and soft drink, the equilibrium conditions in equation form is
𝑀𝑈𝑚
𝑃𝑚 =
𝑀𝑈𝑠
𝑃𝑠 ...(4.3)
Subject to:=
Y = PmQm + PsQs ...(4.4)
Where
MUm = marginal utility of meat pie
MUs = marginal utility of soft drink
Pm = unit price of meat pie
Ps = unit price of soft drink
Y = consumer’s money income
Equation 4.4 is called the consumer’s budget constraint. Equations 4.3 and
4.4 are also referred to as the necessary and sufficient conditions for
consumer equilibrium, respectively. The consumer equilibrium condition is
alternatively referred to as utility maximization condition.
4.2.2 Derivation of The Demand Curve
The following assumptions are made in the derivation of the demand curve via the
utility approach:
i. Cardinal Utility: That the satisfaction derivable from a good or service is
measurable in some imaginary numerical terms called utils.
ii. Diminishing Marginal Utility: The satisfaction from a unit increase in the
rate of consumption of a good or service decreases as more and more units
of it are consumed.

NOTE: This is a work in progress. All topics in the syllabus are covered but editing for necessary corrections is in progress.
Thanks.
90
iii. Constant Marginal Utility of Money: The marginal utility of money remains
constant as income increases or decreases.
iv. Consumer Rationality: The average consumer will always maintain the utility
maximization position in his spending pattern.
Assuming again that the consumer has two goods – meat pie and soft drinks to buy,
the explanation of the law of demand goes like this:
From the initial equilibrium position described as
𝑀𝑈𝑚
𝑃𝑚 =
𝑀𝑈𝑠
𝑃𝑠 ...(1)
Subject to
Y = PmQm + PsQs ...(2)
Suppose the unit price of meat pie falls, the equality of the two ratios in equation (1)
will be upset to give a disequilibrium situation as described in equation (3) below
𝑀𝑈𝑚
𝑃𝑚 I
𝑀𝑈𝑠
𝑃𝑠 ...(3)
The assumption of consumer rationality dictates that the situation in equation (3)
will elicit a reaction from the consumer in terms of change in the quantity of meat
pie to be purchased in order to make the ratios in equation (1) equal again.
Mathematically, this will require (for example), MUm to fall in the same proportion as
the fall in Pm. According to the law of diminishing marginal utility, one way to get the
marginal utility of meat pie to fall is to consume more of meat pie - that is, acting
exactly as the law of demand predicts: A fall in the price of a commodity would cause
a greater quantity of it to be demanded, ceteris paribus.

NOTE: This is a work in progress. All topics in the syllabus are covered but editing for necessary corrections is in progress.
Thanks.
91
ILLUSTRATION 4.1
The following table gives the total utilities schedule for the
consumption of apple and beer by a hypothetical consumer.
Quantity Total Utility
Apple Beer
1
2
3
4
5
6
7
900
1600
2150
2550
2800
3000
3100
1440
2640
3600
4320
4800
5040
5160
Suppose the consumer has N900.00 to spend on apple and beer,
Required:
To determine how many units of each good he would buy to maximize his
utility subject to his budget constraint, and given that the unit price of apple is
N50, and price per bottle of beer is N120.
SUGGESTED SOLUTION 4.1
The problem requires calculation of the marginal utility – price ratios
for apple and beer – i.e 𝑀𝑈𝑎
𝑃𝑎 and
𝑀𝑈𝑏
𝑃𝑏 at each level of consumption
as shown in the table 4.2 below. Note that Pa = N50.00 and Pb =
N120.00

NOTE: This is a work in progress. All topics in the syllabus are covered but editing for necessary corrections is in progress.
Thanks.
92
Table 4.2: Total and Marginal Utility
Units of
Apple
(Qa)
TUa MUa 𝑀𝑈𝑎
𝑃𝑎
No of
bottles of
Beer (Qb)
TUb MUb 𝑀𝑈𝑏
𝑃𝑏
1
2
3
4
5
6
7
900
1600
2150
2550
2800
3000
3100
-
700
550
400
250
200
100
-
14
11
8
5
4
2
1
2
3
4
5
6
7
1440
2640
3600
4320
4800
5040
5160
-
1200
960
720
480
240
120
-
10
8
6
4
2
1
The above table reveals that the first condition for consumer equilibrium i.e. 𝑀𝑈𝑎
𝑃𝑎 =
𝑀𝑈𝑏
𝑃𝑏 is fulfilled at two different levels of consumption.
First: For Qa = 4 and Qb = 3
𝑀𝑈𝑎
𝑃𝑎 =
𝑀𝑈𝑏
𝑃𝑏 = 8
Second: For Qa = 6 and Qb = 5
𝑀𝑈𝑎
𝑃𝑎 =
𝑀𝑈𝑏
𝑃𝑏 = 4
Third: For Qa = 7 and Qb = 6
𝑀𝑈𝑎
𝑃𝑎 =
𝑀𝑈𝑏
𝑃𝑏 = 2
However, the first condition is necessary but not sufficient for
utility maximization. Thus, to identify which of the three
combinations of apple and beer would yield maximum
satisfaction, we need to consider the second condition for utility
maximization i.e. the budget constraint.

NOTE: This is a work in progress. All topics in the syllabus are covered but editing for necessary corrections is in progress.
Thanks.
93
4.3 THE INDIFFERENCE CURVE THEORY
4.3.1 Basic Concepts
The indifference curve theory of consumer behaviour is a graphic derivation of
demand curves for goods and services. The concepts which are germane to the
explanation of the theory are highlighted in this sub-section.
4.3.1.1 Budget Line
It is a line showing maximum combination of two goods that the consumer can
afford, given money income (i.e. consumer’s budget) and the prevailing market
prices of the two goods.
Table 4.2: Budget schedule for Apple and Beer
(consumer’s Income = N400; unit price of Apple = N50; price per bottle of Beer =
N100)
Table 4.3: Budget Line
Combinations Quantity of Apple Quantity of Beer
R
S
T
U
V
0
2
4
6
8
4
3
2
1
0
The budget schedule in Table 4.3 is plotted as budget line in Figure 4.3. the position
of the budget line is determined by its end – points R and V. Point R shows the
maximum quantity of apple (8) that the consumer’s budget will purchase if he
The second condition:
PaQa + PbQb = Y (Budget Constraint)
N50(6) + N120(5) = Y
N300 + N600 = N900.00
Therefore, given his budget constraint, the consumer would derive maximum
satisfaction from the consumption of 6 apples and 5 bottles of beer

NOTE: This is a work in progress. All topics in the syllabus are covered but editing for necessary corrections is in progress.
Thanks.
94
spends all his income on apple. Thus, the ratio of consumer’s income (Y) to the unit
price of apple (Pa) – that is 𝑌 𝑃𝑎 gives 8 that is located on the axis for apple.
Similarly, 𝑌 𝑃𝑏 gives 4 on the axis for beer as the quantity that the consumer’s
budget will purchase if he spends all his income on beer.
Figure 4.3 B
eer 4
3
2
1
0 2 4 6 8
The slope of the budget line depends on the ratio of the prices of the two gods. The
slope of a line is the change in the vertical distance (∆Qb) divided by the
corresponding change in the horizontal distance (∆Qa).
∆𝑸𝒃
∆𝑸𝒂 =
𝑷𝒃
𝑷𝒂 ˂ 0
∆𝑸𝒃
∆𝑸𝒂 =
𝑷𝒃
𝑷𝒂 ...(4.5)
Applying equation (4.5) gives the slope of the budget in Figure 4.3 as - 1
2. The minus
sign implies that there is a trade-off. We have to give up one good to obtain more of
the other good.
There will be a change in the position of the budget line if:
(i) Consumer’s income changes while the prices of the two goods remain constant.
(ii) Relative prices of the two goods change while consumer’s income remains
constant.
How the changes in consumer’s income and changes in the relative prices of the two
goods affect the positions of the budget line are illustrated in Figures 4.4a and b
respectively.
Budget Line
R
V
V
Apple
S
T
U
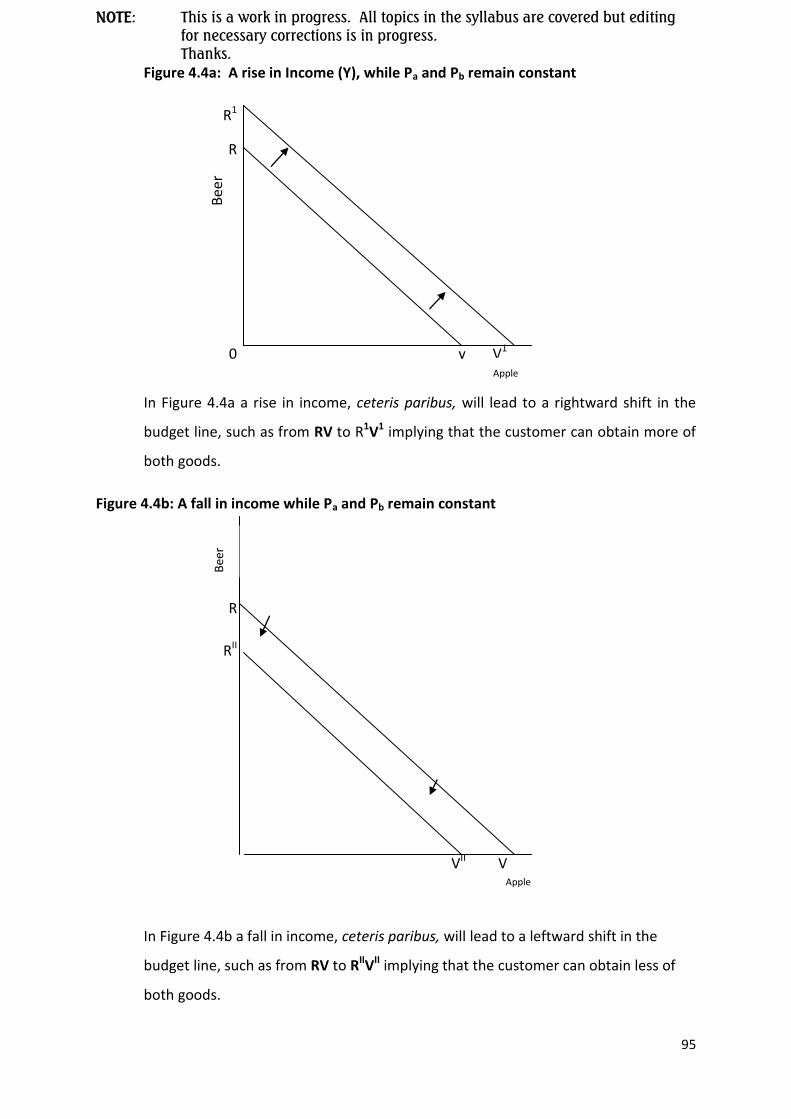
NOTE: This is a work in progress. All topics in the syllabus are covered but editing for necessary corrections is in progress.
Thanks.
95
Figure 4.4a: A rise in Income (Y), while Pa and Pb remain constant
In Figure 4.4a a rise in income, ceteris paribus, will lead to a rightward shift in the
budget line, such as from RV to R1V1 implying that the customer can obtain more of
both goods.
Figure 4.4b: A fall in income while Pa and Pb remain constant
In Figure 4.4b a fall in income, ceteris paribus, will lead to a leftward shift in the
budget line, such as from RV to RIIVII implying that the customer can obtain less of
both goods.
R1
R
Bee
r
0 v V1
R
RII
VII V V
Apple Apple
Apple
Bee
r

NOTE: This is a work in progress. All topics in the syllabus are covered but editing for necessary corrections is in progress.
Thanks.
96
Figure 4.5a: Arise in Pa, while Y and Pb remain constant
Figure 4.5a illustrates a leftward shift of the budget line along the axis representing
Apple. This implies that with the same amount of money income and the price of
Beer remaining constant, a rise in the price of Apple will lead to a situation where
the consumer can only buy less amount of the commodity.
Figure 4.5b: A fall in Pa, while Y and Pb remain constant
R
Figure 4.5b illustrates a rightward shift of the budget line along the axis representing Apple. It follows that with the same amount of money income and the price of Beer remaining constant, a fall in the price of Apple will lead to a situation where the consumer can only buy more of the commodity.
4.3.1.2 Indifference Curve
Bee
r
R
0 W V
0 V X
Apple
Apple
Bee
r

NOTE: This is a work in progress. All topics in the syllabus are covered but editing for necessary corrections is in progress.
Thanks.
97
An indifference curve joins together all points representing different combinations
of two goods which yield the same utility. It is defined as locus of various
combinations of two commodities.
Table 4.4: Indifference schedule for Apple and Beer
Combinations Quantity of Apple Quantity of Beer
M
N
O
P
Q
2
4
8
12
16
8
6
3
2
1
Figure 4.6 illustrates an indifference curve for the data in Table 4.4
The idea here is that all the combinations labelled M to Q are ranked equal in terms
of satisfaction derived by the consumer and, he has no reason to prefer one to the
other.
Figure 4.6
8 M
6
4 0
2
0 4 8 12 16
A set of indifference curves showing different levels of utility is called an indifference
map (see Figure 4.7), the farther away from the origin, the higher the level of utility
being illustrated.
Bee
r
Apple

NOTE: This is a work in progress. All topics in the syllabus are covered but editing for necessary corrections is in progress.
Thanks.
98
Figure 4.7 An Indifference Map
ICI ICII ICIII
It follows from figure 4.7, that a rational consumer will prefer combination Y to X,
and Z to Y.
4.3.1.3 Marginal Rate of Substitution (MRS)
This refers to the amount of one commodity that is required to compensate the
consumer for giving up an amount of another commodity for the consumer to
maintain the same level of utility. The marginal rate of substitution of apple for beer
(MRSab) is the rate at which apple can be substituted for beer, leaving the consumer
at the same level of utility.
Geometrically, MRSab is the negative slope of the indifference curve in Figure 4.5
MRSab = 𝑀𝑈𝑏
𝑃𝑎 > 0 ...(4.6)
4.3.1.4 The Law of Diminishing Marginal Rate of Substitution
A typical indifference curve also illustrates the law of diminishing marginal rate of
substitution.
The less of one good (beer) the consumer gave up and the more of another
commodity (apple) he obtained in the process, the less willing he is to give up
a unit of the former good (beer) for an additional unit of the latter good
(apple).
Apple
Bee
r
ICI
ICII ICIII
x
I
y
I
z
I

NOTE: This is a work in progress. All topics in the syllabus are covered but editing for necessary corrections is in progress.
Thanks.
99
A careful inspection of Figure 4.5 will confirm the law of diminishing marginal rate
of substitution.
4.3.2 Properties of Indifference Curves
The main properties of indifference curves are outlined below:
(i) An indifference curve has a negative slope: This means that as less quantity
of one commodity is consumed (beer), a greater quantity of the other
commodity (apple) must be consumed for the consumer to enjoy the same
level of utility
(ii) Indifference curves can never intersect (axiom of transitivity): If two
indifference curves intersect, the point of intersection will represent two
different levels of utility. Figure 4.7 shows two indifference curves for a
consumer that intersect at point x, meaning that the consumer would be
indifferent between x and y on IC2 and between x and z in IC1 and hence
indifferent between y and z. Since z offers more of both goods than y, this
violates the assumption that the consumer usually prefer more to less.
Figure 4.7: Indifference Curve cannot intersect.
0
(iii) An indifference curve cannot touch either axis. If an indifference curve
touches x – axis as IC2 in Figure 4.8 at G, it implies that the consumer will be
having OG quantity of apple and none of beer. Similarly, if an indifference
curve IC1 touches y – axis at F, the consumer will have only OF quantity of
Apple
Bee
r
IC2
IC1
x z
I
y
I s
I

NOTE: This is a work in progress. All topics in the syllabus are covered but editing for necessary corrections is in progress.
Thanks.
100
beer and none of apple. The assumption that the consumer buys two goods
in combinations is violated.
Figure 4.8: An Indifference Curve cannot touch either axis.
0
(iv) A higher indifference curve. An indifference curve to the right of another
represents a higher level of utility and preferable combination of the two
goods. In Figure 4.0 below, the indifference curve IC2, represents a higher
level of utility than indifference curve IC1. Therefore, as the distance of the
indifference curve to the origin increases, the level of utility represented by
the indifference curve also increase.
Figure 4.9: A higher Indifference Curve.
(v) Indifference curves are convex to the origin. This property is expressed in
the axiom of diminishing marginal rate of substitution which implies that, to
Apple
Bee
r
ICI
G
IC2
F
Apple
Bee
r
ICI
IC2

NOTE: This is a work in progress. All topics in the syllabus are covered but editing for necessary corrections is in progress.
Thanks.
101
obtain every additional unit of one commodity (apple), the consumer is
willing to sacrifice increasing number of the other commodity (beer).
4.3.3 Consumer Equilibrium Under Indifference Analysis
Under the indifference curve approach, the consumer equilibrium is achieved when
the consumer reaches the highest possible indifference curve given his budget
constraints represented by his budget line. The consumer equilibrium position is
illustrated in Figure 4.10.
Figure 4.10: Consumer Equilibrium Position
In Figure 4.10, the consumer can afford to buy any of the combination of apple and
beer described by points S, T, and U given his budget line RV. However, he prefers
the combination on point T i.e a1 of apple and b1 quantity of beer because it gives
him greater utility (IC2) then any of combination on points S and U (IC1). He should
have preferred x on IC3 but this is beyond the limit of his budget. it follows that:
In Figure 4.10, point T is called consumer equilibrium point or optimum consumption
point. At that point, the slope of the indifference curve is equal to the slope of the
budget line (see equation 4.7)
𝑀𝑈𝑎
𝑀𝑈𝑏 =
𝑃𝑎
𝑃𝑏 ...(4.7)
Apple
Bee
r
ICI
IC2
IC3
S
T
X
U
b1
a1
A consumer maximizes his satisfaction at the point where the budget line is just
tangent to an indifference curve

NOTE: This is a work in progress. All topics in the syllabus are covered but editing for necessary corrections is in progress.
Thanks.
102
Equation (4.7) is identical to equation (4.3) obtained for consumer equilibrium point
under the marginal utility approach.
4.3.4 Derivation of the Individual’s Demand Curve
Main Assumptions:
(i) The consumer acts rationally so as to maximize utility.
(ii) There are two goods (apple and beer) in his consumption basket.
(iii) The prices of the two goods and consumer’s choice besides commodity’s own
price (in this case, beside the price of apple) remain constant.
(iv) All other assumptions implicit in the properties of the indifference curve as
listed in sub-section (4.3.2).
To derive an individual’s demand curve, what we need to show is the effect of a
change (fall) in the price of a commodity (apple) on consumption (demand) for
apple.
Figure 4.11 Derivation of Individual’s Demand Curve
Beer
Price
Consumption
Curve
IC1
Q1 Q2 X Apple

NOTE: This is a work in progress. All topics in the syllabus are covered but editing for necessary corrections is in progress.
Thanks.
103
Figure 4.12 Derivation of Individual’s Demand Curve
Based on the assumption of consumer rationality, suppose the consumer is originally
on optimum consumption point A1 in figure 4.11 given the original budget RV and
original quantity Q1 of apple demanded.
A fall in the price of apple from P1 to P2 (ceteris paribus) pivots the budget line from
RV to RX and gives a new optimum consumption point A2, on higher inidifference
curve IC2. The point A2 gives a greater quantity Q2 as predicted by the law of
demand: A fall in the price of a commodity would cause a greater quantity of it to be
demanded, ceteris paribus.
The curve joining consumer equilibrium points such as A1 and A2 is called price-
consumption curve (PPC) and it gives individual’s demand curve as shown in Figure
4.12.
4.3.4.1 The Income and Substitution Effects of a Change in Price
The inverse relationship between the price and quantity demanded of a product has
been attributed to the consequence of two factors – (1) the income effect and (2)
the substitution effect.
(i) The Income effect: A fall in a commodity’s own price causes the consumer’s
real income (i.e. the physical quantity of the commodity that can be
purchased with the same money income) to increase. This is referred to as
the income effect of a change in price.
P1
P2
0
Quantity of Apple
PR
ICE
Q1
Q2
D
D
A1
A2

NOTE: This is a work in progress. All topics in the syllabus are covered but editing for necessary corrections is in progress.
Thanks.
104
(ii) The substitution effect: This refers to the fact that as the price of a
commodity falls, it becomes more attractive and preferable to a similar
commodity whose price remains constant, and hence we buy more of it.
This analysis of the effect of a change in price of a commodity was pioneered by
British economists, Sir John Hicks (1904 – 1989) and Roy Allen (1906 – 1983). Our
analysis is restricted to a normal good – a good whose demand increases as
consumer’s income increases.
4.4 THE CONSUMER’S SURPLUS
The term consumer’s surplus refers to the difference between what the consumer
would be willing to pay to purchase a given quantity of a commodity and what he
actually pays for this quantity rather than forgo it. It arises because the consumer
pays for all units of the commodity the price he is just willing to pay for the last unit
(Qn) purchased, whereas the marginal utility on each of earlier units is greater and
on those units the consumer is willing to pay prices higher than P1
Figure 4.13: The Consumer’s Surplus
In Figure4.13, the consumer’s surplus is represented by the area of the shaded
triangle P1RD
P1
0
Quantity for month Q2
D
D
R
Pri
ce

NOTE: This is a work in progress. All topics in the syllabus are covered but editing for necessary corrections is in progress.
Thanks.
105
4.5 SUMMARY AND CONCLUSION
In this chapter we discussed two alternative approaches to the derivation of
individual’s demand curve for a normal commodity, and we analysed the effect of a
price change on consumer’s consumption pattern.
4.6 REVISION QUESTIONS
SECTION A : Multiple Choice Questions
1. The theory of consumer behaviour is propounded primarily to
I. Validate the law of demand
II. Disprove the law of demand
III. Rationalize the downward slopping demand curve
A. I only
B. II only
C. III only
D. I and II only
E. I and III only
2. The presumption that the average consumer will always maintain the utility
maximization position in his spending is referred to as
A. Cardinal utility
B. Consumer equilibrium
C. Consumer rationality
D. Diminishing marginal utility
E. Constant marginal utility of money
3. Which of the following indicates the negative slope of the indifference curve?
A. Marginal rate of substitution
B. Axiom of transitivity
C. Budget schedule
D. Consumer equilibrium
E. Ordinal utility
4. Which of the following gives the reason why it would be logically impossible for
two indifference curves to cross?
A. The law of diminishing marginal utility

NOTE: This is a work in progress. All topics in the syllabus are covered but editing for necessary corrections is in progress.
Thanks.
106
B. Axiom of transitivity
C. Assumption of consumer rationality
D. The negative slope of the indifference curve
E. The law of diminishing marginal rate of substitution
5. The adjustment of demand to the relative price change alone is called
A. The substitution effect
B. The income effect
C. The total effect
D. Market demand curve
E. Individual demand curve
CHAPTER FOUR
Section A: Solutions to Multiple Choice Questions
1. A
2. C
3. A
4. B
5. A
SHORT B: Short Answer Questions
1. The additional satisfaction which a consumer derives from the consumption of one
more unit of a commodity is called ………………………
2. The maximum combination of two goods that the consumer can buy given money
income and unit prices of the goods is illustrated graphically by …………….
3. The locus of points representing different combinations of two goods which gives
the consumer the same level of satisfaction is ………………………
4. The negative slope of the indifference curve is called………………………
5. Under the indifference curve theory of consumer behavior, the equilibrium position
of rational consumer is illustrated graphically by……………………
Solution To Short Answers Questions
CHAPTER FOUR
1. Marginal utility
2. The budget line
3. Indifference curve
4. Marginal rate of substitution

NOTE: This is a work in progress. All topics in the syllabus are covered but editing for necessary corrections is in progress.
Thanks.
107
5. The point of tangency between the budget line and indifference curve.
CHAPTER FIVE
THE PRODUCTION PROCESS
5.0 LEARNING OBJECTIVES
After studying this chapter you should be able to:
Define production and explain the types of production
Discuss the factors of production
Describe a production function
Analyse short-run, long-run productions
Explain division of labour
Explain location and localization of industries
Describe the various forms of business organizations.
5.1 INTRODUCTION
Production is a process that transforms factors of production or inputs (land, labour,
capital and entrepreneurship) into output of goods and services. Goods are tangible
items or physical things that we can teach and see with our eyes such as television,
shirts and rice. Services, on the other hand are intangible thing or things we cannot
touch, such as medical service, teaching, transportation and concerts. A production
process is not complete until the good or service reaches the final consumer.
5.2 TYPES OF PRODUCTION
The production process is said not to be complete unless the good or service created
reaches the final consumer. Production therefore may be categorized into four main
types: extraction, manufacturing, commerce and direct service.
5.2.1 Extraction
This involves the gathering of raw materials from their natural locations. It may
include mining, quarrying, farming, forestry and fishing. This type of production

NOTE: This is a work in progress. All topics in the syllabus are covered but editing for necessary corrections is in progress.
Thanks.
108
provides raw materials for manufacturing and may also be called primary
production.
5.2.2 Commerce
This involves all stages that the good passes through after manufacturing to the final
consumer. It involves transportation services (road, sea and air), distribution
services (wholesale, retail, import and exports) and other auxiliary services such as
insurance, banking, advertising and warehousing. It may also be referred to as
tertiary production
5.2.4 Direct services
These involve the services people give directly to members of society. They include
the services rendered by teachers, lawyers, the police, the armed forces, doctors,
accountants, musicians, etc. These services have indirect impact on the production
of goods and services.
5.3 FACTORS OF PRODUCTION
The factors of production or inputs that are used to produce goods and services are
classified into land, labour, capital and entrepreneurship.
5.3.1 Land
Land is the natural resource used in combination with the other resources to
produce goods and services. Land includes the soils as well as all other resources
that have been provided by nature (the water bodies, forest resources, etc). the
price we pay to use land is rent.
Land is gift of nature, fixed in supply, geographically immobile (i.e. cannot be moved
around) but may be occupationally mobile (its usage can be changed).
5.3.2 Labour
Labour is the human resource used in production. It is human effort exerted in
production. Hardly can production go on without labour. Labour can be skilled,
meaning specialized intellectual or mental knowledge used in production. It can also

NOTE: This is a work in progress. All topics in the syllabus are covered but editing for necessary corrections is in progress.
Thanks.
109
be unskilled, meaning physical or manual work undertaken by individuals in
production. The reward or the price paid to hire labour is wage or salary.
Labour is both geographically and occupationally mobile and it is impossible to
separate both the ownership and use of labour. The supply of labour depends on
the size of population which in turn depends on birth rate, death rate and level of
migration.
5.3.3 Capital
Capital is a man-made resource which is used in production of goods and services. It
is wealth which is set aside for the creation of further wealth. It includes machines,
factory buildings, vehicles, etc. it may be classified into fixed capital and circulating
capital. Fixed capital includes any man-made item (such as machines, factory
buildings, vehicles, etc.) used in the production process but does not get exhausted
in the process. The circulating capital, unlike the fixed capital, is used up in the
production process and includes the stock of raw materials, partly finished goods
(known commonly as work-in-progress and stock of finished goods waiting to be
sold.
The reward or the price of capital is interest. Capital is accumulated over a period of
time and is subject to depreciation (wear and tear).
5.3.4 Entrepreneur
Entrepreneur is a special factor of production in the sense that it is in charge of the
organization of the other three factors of production (land, labour and capital) in
order to produce goods and services, bears the risk involved in business and
manages the business. The entrepreneur’s reward is profit or dividend.
Functions of the entrepreneur
(i) The entrepreneur is the owner of the business and provides the capital. The
ownership of business may be one person or a group of persons who have
provided the capital.

NOTE: This is a work in progress. All topics in the syllabus are covered but editing for necessary corrections is in progress.
Thanks.
110
(ii) The entrepreneur organizes and combines the other three factors of
production for the production of goods and services which are used to satisfy
human wants.
(iii) The entrepreneur bears the risk of business failure when there is any. On the
other hand if there are any benefits, he enjoys them.
(iv) The entrepreneur is the principal decision-maker, though this may be shared
with other people. He makes the broad decision of policy and is at the nerve-
centre of management control.
(v) It is the main objective of every nation to achieve economic growth and
development. A nation achieves economic growth when it is able to increase
the final goods and services produced in the country over a given period of
time usually one year. It is the entrepreneur who is the engine of economic
growth in every nation because he produces these goods and services.
5.4 THE PRODUCTION FUNCTION
The production process involves the transformation of inputs or factors of
production into output of goods and services. A production function shows the
maximum quantities of a product that can be produced using various sets of inputs
and an existing technology and at a given time period. It may be shown as a table or
a mathematical equation.
5.4.1 Periods of Production
Production is a process and goes on over a period of time. There are two main
periods of production in economics and they are short run and long run.
(a) Short-Run Period of Production
This is a period of production during which some factors of production are fixed
and some too are variable. The fixed inputs cannot be varied when demand
conditions require a change in output. This period varies from firm to firm,
depending on the type of production a firm undertakes and the inputs it uses.

NOTE: This is a work in progress. All topics in the syllabus are covered but editing for necessary corrections is in progress.
Thanks.
111
(b) Long-Run Period of Production
This is a period of production within which all inputs are variable. This implies
that if demand conditions warrant a change in production all the inputs can be
varied to achieve this.
5.4.2 Classification of Inputs
In production theory, inputs are divided into Fixed and Variable inputs. The
distinction is important in that it helps us to determine whether a firm which does
not cover its total costs of production (a loss making firm) should stay open or shut
down in the short-run.
(a) Fixed Input
A fixed input is an input whose quantity cannot be varied in the short-run when
demand conditions require an increase or a decrease in production e.g. factory
building, capital equipment, some skilled labour, etc.
(b) Variable Input
A variable input is that which can be changed in all times of production when
demand conditions change to require a change in production e.g. raw materials,
electrical power, unskilled labour, etc.
5.4.3 Production Analysis in the Short-run
In the production process, the output or product may be described in three ways in
economics: total product (TP), average product (AP) or marginal product (MP).
(a) Total Product (TP)
Total product is the maximum output that a firm can produce over a given period of
time when it employs a given set of inputs. Total product is the sum of marginal
products.
(b) Average Product (AP)
Average product is the output per unit of the variable factor employed. In other words, it is the productivity of the variable factor. It is measured by dividing total product (TP) by amount of variable factor employed i.e
AP = 𝑇𝑃
𝑉𝑎𝑟𝑖𝑎𝑏𝑙𝑒 𝐹𝑎𝑐𝑡𝑜𝑟

NOTE: This is a work in progress. All topics in the syllabus are covered but editing for necessary corrections is in progress.
Thanks.
112
Average product is measured in respect of a variable factor. For instance, where the
variable factor is say labour (L), then it is the average product of labour (APL) or the
productivity of labour that we can measure as:
APL = 𝑇𝑃
𝐿
(c) Marginal Product (MP)
Marginal product is the change in total product resulting from the use of one more
(or less) unit of a variable factor. It may also be explained as the rate of change in
total product with respect to a variable factor. i.e.
MP = ∆𝑇𝑃
∆ 𝑖𝑛 𝑉𝑎𝑟𝑖𝑎𝑏𝑙𝑒 𝐹𝑎𝑐𝑡𝑜𝑟
Where ∆ = change
Marginal product is also calculated in respect of variable factor. The MP of labour
(MPL) is measured as:
MPL = ∆𝑇𝑃
∆ 𝐿
(d) Production Schedule
Table 5.1: A Short-run Production Schedule
CAPITAL (K)
LABOUR UNITS (L)
TOTAL PRODUCT OF
LABOUR (TPL)
AVERAGE PRODUCT OF
LABOUR (APL)
MARGINAL PRODUCT OF
LABOUR (MPL)
10 0 0 0 -
10 1 100 100 100
10 2 240 120 140
10 3 390 130 150
10 4 520 130 130
10 5 610 122 90
10 6 660 110 50
10 7 660 94.3 0
10 8 620 77.5 -40
10 9 560 62.2 -60
10 10 460 46 -100

NOTE: This is a work in progress. All topics in the syllabus are covered but editing for necessary corrections is in progress.
Thanks.
113
Table 5.1 shows a Short-run Production Schedule. It is a short-run schedule because
it has fixed input (capital) as well as variable input (labour). From Table 5.1 it is
observed that as the employment of the variable factor (labour) increases, total
product also rises from zero (0) to six hundred and sixty (660) when employment of
labour is seven (7). Any additional employment of units of labour i.e. when labour is
eight units (8) and above causes the total product to decline to four hundred and
sixty (460) when ten units of labour is employed. The average and the marginal
products of labour as depicted in Table 5.1 increase, but both eventually decline.
Marginal product declines to zero (0) and even turns negative after the employment
of the seventh unit. Average product on the other hand declines but remains
positive so far as total product remains positive.
(e) Production Graphs
Figure 5.1: Total Product, Average Product and Marginal Product Curves
Product
0 Labour Units
Product 150
600
TPL
Panel A
Panel B
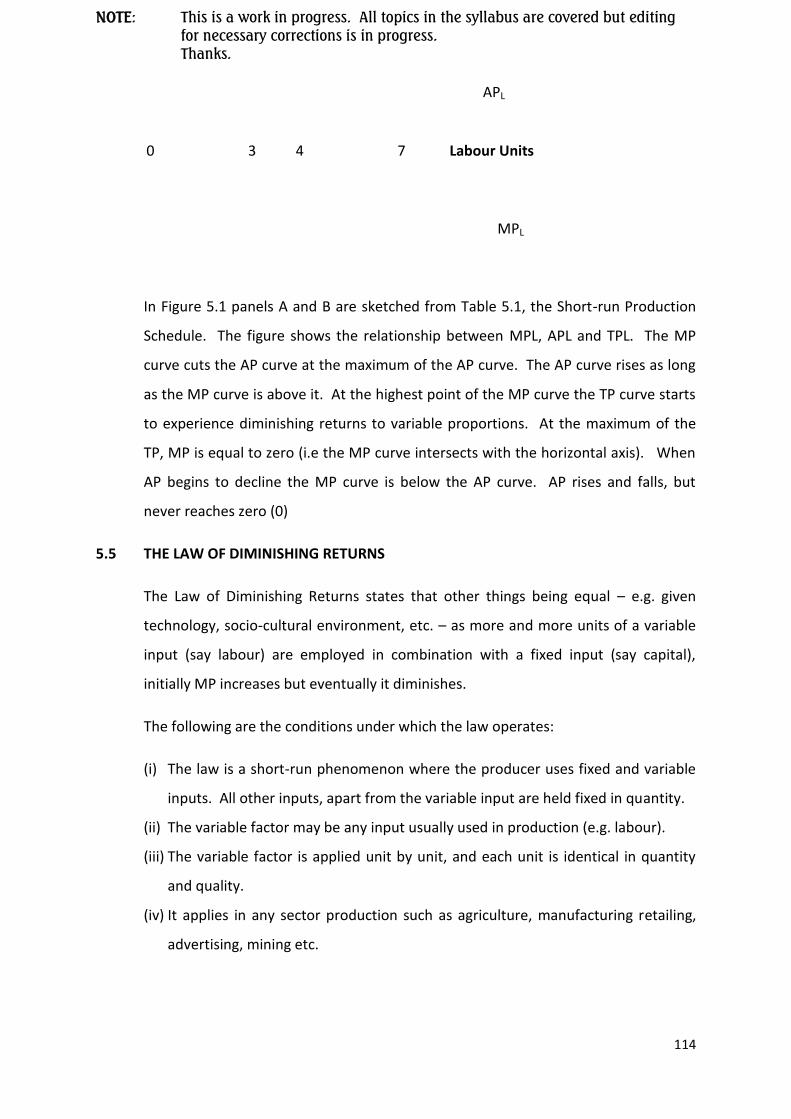
NOTE: This is a work in progress. All topics in the syllabus are covered but editing for necessary corrections is in progress.
Thanks.
114
APL 0 3 4 7 Labour Units MPL
In Figure 5.1 panels A and B are sketched from Table 5.1, the Short-run Production
Schedule. The figure shows the relationship between MPL, APL and TPL. The MP
curve cuts the AP curve at the maximum of the AP curve. The AP curve rises as long
as the MP curve is above it. At the highest point of the MP curve the TP curve starts
to experience diminishing returns to variable proportions. At the maximum of the
TP, MP is equal to zero (i.e the MP curve intersects with the horizontal axis). When
AP begins to decline the MP curve is below the AP curve. AP rises and falls, but
never reaches zero (0)
5.5 THE LAW OF DIMINISHING RETURNS
The Law of Diminishing Returns states that other things being equal – e.g. given
technology, socio-cultural environment, etc. – as more and more units of a variable
input (say labour) are employed in combination with a fixed input (say capital),
initially MP increases but eventually it diminishes.
The following are the conditions under which the law operates:
(i) The law is a short-run phenomenon where the producer uses fixed and variable
inputs. All other inputs, apart from the variable input are held fixed in quantity.
(ii) The variable factor may be any input usually used in production (e.g. labour).
(iii) The variable factor is applied unit by unit, and each unit is identical in quantity
and quality.
(iv) It applies in any sector production such as agriculture, manufacturing retailing,
advertising, mining etc.

NOTE: This is a work in progress. All topics in the syllabus are covered but editing for necessary corrections is in progress.
Thanks.
115
It is a law that describes the behaviour of the marginal product (MP). Therefore it is
the MP that eventually diminishes and it does so only after increasing. When fixed
and variable inputs are combined to produce a product, the fixed input (capital)
helps the variable input (labour). The marginal output of the variable input depends
on the amount of the fixed input the variable input has received. In the first
instance, if the amount of the fixed input received by the variable factor is relatively
plentiful marginal output of the variable factor increases. In the second instance, as
the variable input beyond a certain unit, they obtain less and less amounts of the
fixed input to combine with which leads to decrease in marginal output. Each extra
unit of the variable input adds less and less to total product. In the third instance, if
the employment of more and more units of the variable input continues, there will
be a cluster of the variable input such that the amount of fixed input each unit of
variable input gets to combine with becomes insignificant, the turns negative.
In summary, there is a certain optimum combination of fixed and variable inputs
which when exceeded will bring about diminishing returns. The law of diminishing
returns to variable proportion is important because it helps the producer to
determine the best proportion in which to employ the fixed and variable inputs. If
the MP is increasing it means there is too much of the fixed input in combination
with the variable input. If the MP falls to zero, there is too little of the fixed input.
This guides the producer in determining the best proportion between the fixed and
variable inputs.
5.6 Production Analysis in the Long-run
The long-run has been defined as a period of production within which all the inputs
are variable. This implies that if demand conditions require a change in production
all the inputs could be varied to achieve this. The long-run production analysis
therefore looks at the relationship between output and inputs based on the fact that
all the factors of production are variable. A firm which varies all its inputs is
described as changing its scale of production.
5.6.1 Returns To Scale

NOTE: This is a work in progress. All topics in the syllabus are covered but editing for necessary corrections is in progress.
Thanks.
116
The behaviour of output of a firm in the long run as its scale of operation (varying all
inputs) is changed is called Returns to scale. In other words, returns to scale are the
relationships between changes in scale and changes in output. When the scale of
production is increased the resulting output displays three (3) stages of returns to
scale: increasing returns to scale, constant returns to scale and decreasing returns to
scale. These are depicted by the long-run production schedule below:

NOTE: This is a work in progress. All topics in the syllabus are covered but editing for necessary corrections is in progress.
Thanks.
117
Table 5.2: A Long-run Production Schedule
Units of
Capital
(K)
Units of
Labour
(L)
Change in
Scale
(%)
Total
Product
(TP)
Change in
Total
Product (%)
1 2 1,000
2 4 2,500
4 8 6,000
8 16 12,000
16 32 21,600
32 64 32,400
Table 5.2 is a Long=run Production Schedule because both factors of production
(labour and capital) are varied to achieve an increase in output.
(a) Increasing Returns to Scale
Increasing returns to scale occur when increases in all inputs by a certain
percentage cause a relatively higher percentage increase in output or total
product. For instance in Table 5.2, when units of capital and labour were
increased from 1 and 2 units to 2 and 4 units respectively (i.e. 100% increase in
scale of production) output increased from 1000 to 2500 units (i.e. 150%
increase in output).
(b) Constant Returns to Scale
When the scale production of the firm continues to grow, the greater percentage
increase in total product ceases and instead a constant rate of growth in
production is observed. Constant returns to scale occur when the scale of
production is increased by a certain percentage, output or total product
increases by the same percentage. For instance, in Table 5.2 as the capital-
100
100
100
100
100
150
140
100
80
50

NOTE: This is a work in progress. All topics in the syllabus are covered but editing for necessary corrections is in progress.
Thanks.
118
labour combination was doubled from 4 is to 8 to 8 is to 16 (100% increase in
scale of production), output increased by the same 100%.
(c) Decreasing Returns to Scale
Finally, with further growth of the scale of the firm decreasing returns emerge.
Decreasing returns to scale occur when the scale of production of a firm is
increased by a certain percentage, output or total product increases by less than
the given percentage. The total product indeed becomes larger but does so at a
lower rate than the rate of growth of all the inputs used in production. For
instance, from Table 5.2, a 100% rise in scale went with a lower than 100% rise in
total product as when the inputs were increased from 8 and 16 units to 16 and
32 units.
5.7 Division of Labour
Division of labour involves dividing a production process into a number of smaller
tasks for each task to be undertaken by a different worker. It may also be referred
to as specialization because each worker specializes in doing only one task thereby
producing a part of the product as against producing the whole product. Division of
labour may be applied in all aspects of production including agriculture,
manufacturing, etc.
5.7.1 Advantages of Division of Labour
Division of labour has advantages including the following:
(i) Development of Greater Skill by the Worker
In division of labour, each worker specializes in doing only one task. By repeating
the same task again and again the worker develops greater skill in it and
becomes a specialist in the task.
(ii) Increase in Productivity
Division of labour leads to increased productivity of the worker. By developing a
greater skill and becoming a specialist in what the worker does increases the
productivity of the worker and production as a whole.

NOTE: This is a work in progress. All topics in the syllabus are covered but editing for necessary corrections is in progress.
Thanks.
119
(iii) Saving of Time
The time that would have been wasted by each worker moving around to
change tasks and tools is saved when division of labour is practiced.
(iv) Increased use of Machines and Equipment
In division of labour, because the production process is broken up into
smaller units of tasks and each worker routinely performs one task, machines
or equipment may be used to perform the task. It is easier to develop
machines and equipment to perform only a single and simple task than
several and complex tasks than several and complex tasks.
(v) Mass Production at decreasing cost
Division of labour has led to massive production arising from increased
productivity. This brings down the unit cost and cheaper selling price.
(b) Disadvantages of Division of Labour
Division of labour may also have disadvantages that may include the following:
(i) Lack of Craftsmanship
Division of labour does not make workers craftsmen. They are trained to be
producers of only parts of products rather than producers of whole products.
That is, each worker cannot claim the knowledge of all the processes used to
produce a product.
(ii) Monotony of Work
Performing the same task all the time and, over and over again may create
boredom of the part of workers. It may also be unchallenging and in turn kill
workers’ initiatives.
(iii) Over-dependence among Workers
In division of labour, there is total dependence of a worker on other workers.
The task performed by each worker is key to the production process to the
extent that the absence from work of a worker may halt production
(iv) Redundancy of Workers
In division of labour, a worker may be rendered redundant whenever his/her
skill is no longer needed. Because he/she is a specialist in the performance of
one task, transferring him/her to perform another task becomes a problem.

NOTE: This is a work in progress. All topics in the syllabus are covered but editing for necessary corrections is in progress.
Thanks.
120
(v) Dumping of Mass Produced Goods
Division of labour has led to mass production of certain goods and brought
about dumping of such goods in other countries to kill domestic production
in countries where the goods have been dumped.
5.8 LOCATION OF LOCALIZATION
Location of industry tries to answer the key economic question “where to produce”.
Where an industry should be located is an important decision to be taken because
the success or failure of the industry may depend on the location chosen. It involves
deciding on the area that an industry should be sited. In siting an industry, several
factors may be considered which may include the following:
(i) Closeness to the Source of Raw Materials
Cost of production of industries include both costs incurred in purchasing and
transporting the raw materials to the industry. When an industry is located
close to the source of its raw materials transportation costs are reduced
especially in the case of bulky raw materials
(ii) Closeness to Source of Power
A key necessity to industry is power. In most cases source of power from the
national supply is cheaper. Therefore when locating an industry the owner
considers availability of power for easy operation.
(iii) Supply of Labour
Another important factor of production is labour. Unskilled labour may easily
be found at all places but not specialized or skilled labour. Where the
industry is located if suitable labour is not available then it should be
attracted from other sources at higher costs.
(iv) Closeness to Market
When goods are produced they should be sold. This makes the decision to
site industries close to trading centres very critical and accounts for many
industries crowding around established trading centres. This is particularly
necessary if the goods are bulky to transport to the market.
(v) Good Transport Routes

NOTE: This is a work in progress. All topics in the syllabus are covered but editing for necessary corrections is in progress.
Thanks.
121
Transport routes include roads, railways, water-ways and airways.
Satisfactory all-weather transport routes essential to any industry because
raw materials should be transported to the industry and products produced
should be transported to markets.
(vi) Other Factors
Other factors that should be considered may include:
Reasonable social services and amenities in the form of hospitals, schools and
facilities for relaxation (cinemas, clubs) for workers welfare.
Reasonable communication facilities such as telephone services, banking
services, postal services, etc.
Reasonable security services such as police posts, fire services, etc.
5.9 LOCALIZATION OF INDUSTRIES
Localization of industry involves the concentration or centralization of firms in a
particular industry within a limited area. It is the tendency for all firms in an industry
to crowd or locate in a particular area, meaning the firms choose sites very close to
one another. When firms of an industry do this there are certain benefits the
industry as well as the community gains and there may be some problems too.
(a) Advantages of Localization of Industry
(i) When firms locate at one area, very often there is the tendency for the
development of pool of labour around the area. People around the area
learn skills needed by the industry. Institutions may spring up to train
people around in the skills needed by the industry.
(ii) Specialist-service industries such as banks, telecommunication
organizations, postal organizations, security services organizations may
extend their services to the area.
(iii) Subsidiary industries such as suppliers of raw materials, packaging
industries, marketing industries, etc. may develop around the area.

NOTE: This is a work in progress. All topics in the syllabus are covered but editing for necessary corrections is in progress.
Thanks.
122
(iv) Firms when concentrated at an area may create keen competition among
them. Competition leads to efficiency which can pass on to the consumers
in the form of lower prices and increased quality.
(b) Disadvantages of Localization
Despite the above advantages obtained from localization of industry, serious
problems may arise which may include:
(i) Localization of industry may lead to population congestion in and around
the area where the industry has been located. This will in turn lead to the
creation of slumps around the industry and the consequent vices such as
prostitution, crimes, etc.
(ii) The firms will compete with each other for factors of production and if
the demand for such factors exceeds the supply, shortages will be created
which will in turn lead to rising prices of these factors. This may be
passed on to consumers in the form of higher prices.
(iii) If there is depression then mass unemployment will occur in the area.
This can create serious economic problems unless there are alternative
industries to absorb those who have lost jobs.
(iv) Industrial concentration can be target of enemies during war and this
disrupts production and lower output as well as heavy casualty.
5.10 Forms of Business Organizations
Firms are the business organizations that organise factors of production to produce
goods and services which are used to satisfy human wants. A firm is thus a single
production unit. A group of firms producing the same good or service is called an
industry. In every country there are many firms ranging from those owned by one
person to those owned by several persons. Basically there are about three (3) types
of firms namely:
The Sole Proprietorship

NOTE: This is a work in progress. All topics in the syllabus are covered but editing for necessary corrections is in progress.
Thanks.
123
The Partnership
The Joint-Stock Company or Corporation

NOTE: This is a work in progress. All topics in the syllabus are covered but editing for necessary corrections is in progress.
Thanks.
124
5.10.1 The Sole Proprietorship (Sole Trader)
The sole proprietorship or sole trader is a business organization owned and
controlled by one person. It is often referred to as “one-man business”. It is the
most numerous or commonest form of business organization in West Africa.
Examples are the shoemakers, hairdressers, various drinking spots, peasant farmers,
doctors who operate their own clinics, etc.
(a) Features
i. It is the simplest form of business organization
ii. It is owned and controlled by one person meaning one person, the
owner, raises the capital, takes every decision and bears all the risk
involved in the business alone.
iii. One person, the owner, takes all profits or bears all losses that the
business might yield.
iv. This type of business usually employs only a handful of paid persons or
relatives for assistance.
(b) Advantages of the Sole Proprietorship
i. Easy to form: It is comparatively quite easy to start this type of business
because there are no laid down requirements with regard to its
formation. One only needs a small capital to start with.
ii. Personal Interest: The owner controls the business so takes good care of
it to avoid waste. Initiative, flexibility and efficiency are maintained. The
spirit of self-interest to operate the business efficiently and with much
dedication is also maintained.
iii. Quick Decision Making: The owner is the sole decision maker and does
not need to go through any bureaucratic channels before arriving at a
decision. This makes decision taking process very fast because it does not
involve any communications.
iv. Secrecy: The business strategy is completely kept secret by the
proprietor. He is not under any obligation to divulge his business secrets.

NOTE: This is a work in progress. All topics in the syllabus are covered but editing for necessary corrections is in progress.
Thanks.
125
v. Intimate Relationship: due to the small size of the business, the
proprietor maintains personal and close relationship with his workers. He
also maintains close contact with customers.
(c) Disadvantages of Sole Proprietorship
i. Unlimited Liability: If the business fails his liabilities may be extended not
only to his capital but to some personal properties depending on the
extent of the liability
ii. Limited Capital: Since capital is raised by him/her alone, he/she may not
be in the position to raise enough when expansion of the scale of
operation is needed benefit from economies of scale.
iii. Business Liquidation: The death of the proprietor may end the business
since the successor who is likely to be a relative may not be as efficient as
he/she.
iv. Lack of Credit Facilities: The sole proprietor may not have the requisite
collateral needed by financial institutions before loans are given out.
They thus have little access to capital to expand their businesses.
(d) Source of Finance of the Sole Trader
Personal savings
Borrowings from banks, relations and friends
Ploughing back his/her profits to expand the business
Inherited capital
5.10.2 Partnership
Partnership is a type of business organization usually formed by the coming together
of two to twenty persons. The members of a partnership business are called
partners. Usually they enter into legal agreement to run the business. However, in
West Africa, we have persons forming informal partnership where there are no
written down agreements.
(a) Features of Partnership
i. The membership of partnership ranges from two to twenty. Normally,
twenty being the maximum number.

NOTE: This is a work in progress. All topics in the syllabus are covered but editing for necessary corrections is in progress.
Thanks.
126
ii. It may be the amalgamation (union) of sole proprietors.
iii. All the partners collectively own the business. They set out rules to
govern the business and to define each partner’s rights and obligations.
iv. A partner could be either a dormant or an active partner. A dormant
partner only provides capital and share in profits and losses but does not
participate in the running of the business, whilst an active partner
provides capital and takes part in the day to day running of the business.
v. In the event of business failure, partners may not only lose their capital
but also their private properties.
(b) Advantages
i. Raising of Larger Capital: Since a number of people pool resources
together in partnership, larger capital can be raised as compared to sole
proprietorship. Thus partnership stands a greater chance of expansion.
ii. Better Decision-Making: Decisions are taken by many and so are likely to
be more effective than in the sole proprietorship. This is based on the old
adage that “two heads are better than one”.
iii. Credit Worthiness: The partnership business is more credit-worthy than
the sole-trader because of its large assets contributed by its large number
of partners.
iv. Business Management: The owners are themselves the managers and
controllers of the business; interest, dedication and responsibility of
partners in the business may be higher when compared with sole
proprietorship.
v. Business Liquidation: The death of a partner may not collapse the
business as in the case of a sole trader. This is because other partners are
there to carry out the operations of the business.

NOTE: This is a work in progress. All topics in the syllabus are covered but editing for necessary corrections is in progress.
Thanks.
127
(c) Disadvantages of Partnership
i. Disagreement: Partnership entails coming together of several people
with different business ambitions, it is therefore difficult to arrive at
decisions and maintain perfect understanding among partners, especially
in the distribution of profits and losses.
ii. Unlimited Liability: In the event of business failure, partners may loose
not only their contributed capital in the business but also their personal
properties depending on the extent of liabilities
iii. Transfer of Shares: Members cannot transfer their shares without the
authority of the others.
iv. Difficult to enter: Prospective entrants may find it difficult to do so
because each partner must agree before the new partner is admitted.
This may prevent dynamic persons from becoming a partner.
v. Limited Capital: in partnership capital raised may still be inadequate due
to the limited number of partners. It may be higher as compared with
sole proprietorship but lower as compared with corporations.
(d) Source of Finance of Partnership
Partnership may be financed through:
i. Contributions from members
ii. Benefit from credit facilities
iii. Re-investment of profits
iv. Borrowing from financial institutions
5.10.3 Joint-Stock Company or Corporations
A joint-stock company is a type of business organization which the law recognizes as
having a separate entity from those who formed it. This means that the business can
be treated as a person who can sue and be sued. It is at times referred to as limited
liability company because the liabilities of the owners are limited to their

NOTE: This is a work in progress. All topics in the syllabus are covered but editing for necessary corrections is in progress.
Thanks.
128
contributions to the capital of the company. The join-stock company is managed by
a board of directors usually appointed by the shareholders. There are two types of
joint-stock companies:
Private joint-stock companies
Public joint-stock companies
5.10.3.1
(a) Private Company
i) Small in size with membership between two (2) to fifty (50). The minimum
number of shareholders a private limited liability company can have is two
and a maximum number of fifty.
ii) It has larger capital shareholders when compared with partnership and sole
proprietorship.
iii) Stakeholders contribute their funds for the business as shares.
iv) A company does not sell shares to the public to raise capital.
v) The shareholders enjoy profits earned by the company.
(a) Advantages of Private Joint-stock Company
(i) It has a separate entity from the owner, meaning it can sue and be
sued.
(ii) Shareholders have limited liability i.e. in case of business failure, they
may lose only their contributed capital.
(iii) Private joint-stock companies can raise more capital than partnership
and sole trader. This is because the maximum membership of private
joint-stock company is fifty whilst those of partnership and sole trader
are twenty and one respectively.
(v) Shareholders have the chance to appoint specialists as board of
directors to direct the affairs of the company.

NOTE: This is a work in progress. All topics in the syllabus are covered but editing for necessary corrections is in progress.
Thanks.
129
(b) Disadvantages of Private Joint-stock Companies
(i) A shareholder cannot transfer his/her shares in this type of business
organization without the other shareholders agreeing to it.
(ii) Because membership is limited to fifty there may be a limit to the
capital they can contribute.
(iii) The private joint-stock company cannot raise capital from the public
through the sale of shares.
(iv) Unlike public joint-stock company, business risk is spread among a
limited number of people with fifty as maximum.
5.10.3.2 Public Joint-stock Company
A joint-stock company is a legal association therefore must be registered and the
promoters must submit the following documents:
(i) Memorandum of Association which must contain:
Name of the company, with limited attached meaning it is a company
with shareholders having limited liabilities,
Address of the registered office,
The capital,
Objective(s) of the company, and duly signed by two persons if private
company and seven if it is a public company.
(ii) Article of Association of the company containing the following:
The internal constitution of the company,
How shares are to be issued or transferred,
Right of the various shareholders,
The powers of the officers and
How they will be elected.
It possesses a large capital raised from the sale of shares to the public. These shares
are freely transferable to other members of the public. Liabilities of members are
limited to the capital they contribute. Profits are shared out to members according
to the contributions made. These are called “dividends”. The public joint-stock

NOTE: This is a work in progress. All topics in the syllabus are covered but editing for necessary corrections is in progress.
Thanks.
130
company also employs paid board of directors who run the business. Shareholders
therefore need not be involved in the administration of the company.
(a) Features of Joint-stock Companies
i) Large in size with membership of seven (7) and above.
ii) Has Large capital shareholders.
iii) Shareholders can freely transfer or sell their shares.
iv) Can sell shares to the general to raise capital.
(b) Advantages of Joint-stock Company
i. Generation of Large Capital: Joint-stock companies are able to raise
larger capitals when compared with the other forms of businesses, from
the sale of shares and debentures from the public. They are therefore
able to engage in large-scale production and thereby enjoy economics of
scale.
ii. Limited Liability: The liability of each shareholder is limited to the capital
he/she has contributed to the company.
iii. Efficient Staff: The companies are able to employ the services of
specialized and efficient staff in various aspect of the company. It is
possible for the public limited liability company to practice division of
labour to increase productivity of employees.
iv. Easy transfer of Membership: Membership is open to the general public
and does not require the approval of other members. It is also easy for a
shareholder to leave the company by selling or transferring his shares to
another person.
v. Size of Ownership: Business risks are spread over a greater number of
people (the shareholders) thereby reducing individual liability.
vi. Separate Entity: The public limited liability company has a separate
entity, can sue and be sued.
(c) Disadvantages of Public Joint-stock Company
i. Difficult to form: Due to the need to produce a lot of documents and
procedures before the company is incorporated, it is difficult to form and
not all persons can engage in it.

NOTE: This is a work in progress. All topics in the syllabus are covered but editing for necessary corrections is in progress.
Thanks.
131
ii. Since those responsible for the running of the business (Board of
Directors) may not be the owners, interest and personal involvement may
be low.
iii. Shareholders who are owners of the company have little control over
policy.
iv. Large size of business makes it difficult to monitor activities of all
employees.
5.11 PRIVATISATION AND COMMERCIALISATION
Privatisation and commercialization are part of the effort, mostly of developing
countries to restructure their economies for sustainable growth and development.
5.11.1 Privatisation
Privatisation can be defined as the process of transferring ownership and control of
publicly owned enterprises from government (public sector) to private individuals
and companies (private sector).
a) Types Of Privatisation
The main types of privatization include:
i. SHARE ISSUE PRIVATISATION: This involves selling shares of the enterprise to private
individuals and businesses on the stock market.
ii. VOUCHER PRIVATISATION: This entails distributing shares of ownership of the
enterprise to all citizens usually for free or at any low price.
iii. ASSET SALE PRIVATISATION: This involves selling the entire enterprise or a
substantial part of it to a strategic investor, usually by auction.
The choice of privatization method is influenced by capital market, political and enterprise-
specific factors
b) Objectives of Privatisation
According to Aderinto and Abdullahi (2007) government’s objectives for privatizing
public enterprises have been identified to include the following (Aderinto and
Abdullahi, 2007).
i. To disengage government from economic or business activities in which it has no
competence or in areas where the private sector is more competent.
ii. To make the enterprises and corporations more efficient by injecting private sector
efficiency into them.

NOTE: This is a work in progress. All topics in the syllabus are covered but editing for necessary corrections is in progress.
Thanks.
132
iii. To reduce government annual financial burden brought in the form of grants and
subsidies to these unprofitable ventures and use money saved in the process of
privatization to other needful sectors of the economy.
iv. To reduce government bureaucratic control which has militated against the
operational efficiency of the affected public enterprises.
v. To reduce incidence of corruption in the economy. Most cases of official corrupt
practices were perpetrated using public enterprises as the conduit pipes to steal
public money.
c) Impact of Privatisation
If a privatization programme is carefully packaged and faithfully executed, it could
impact positively on the economy in the following ways.
i. Free the government from heavy annual subventions and subsidies to
unprofitable enterprises.
ii. Promote competition, efficiency and improved service delivery, especially for
public utilities.
iii. Facilitate commerce and trade within the local economy.
iv. Promote integration of the economy into the global economy.
v. Facilitate the emergence of modern and innovative entrepreneurs and the
development of local ones.
However, if a privatization programme is poorly packaged it could lead to massive
retrenchment of public sector workers and engender over concentration of wealth in
the hands of a few individuals. This could worsen the problem of poverty in the
country.
5.11.2 Commercialisation
Commercialisation is the process of reorganizing a public enterprise to make it self-
sustaining and self accounting instead of depending on the government subventions
and subsidies for its survival and operation. Such reorganised enterprises are not sub
divided by government and product pricing is achieved by market forces.
The primary goal of commercialization is to promote efficient use of public resources
as well as improving quality of service delivery, especially in areas that are critical to
the growth of the economy and poverty reduction.
5.12 Nationalisation
Nationalisation refers to a process whereby the government assumes the exclusive
ownership and control of a firm or an industry. In most developing countries, the
term is used to refer to the transfer of ownership and control of an industry or some

NOTE: This is a work in progress. All topics in the syllabus are covered but editing for necessary corrections is in progress.
Thanks.
133
firms of an industry from the private sector to the public sector. In the later case,
nationalization is direct opposite to privatization.
a) The arguments for nationalisation
Nationalisation has been considered desirable or justifiable for the following
reasons:
i. To rescue ailing firms, that is firms that are about to go bankrupt. The policy will save
jobs not only in the firm itself, but also in other firms servicing it and in the local
community.
ii. To make it easier to manage the economy. For instance, through nationalized
industries government could keep price increases small to control inflation.
iii. To ensure adequate provision of essential services at affordable prices, especially
when huge capital is required or where there is tendency for the provision of poor
quality goods or services by private companies.
iv. To takeover foreign businesses that are considered could constitute security threat
or exploitative.
b) The argument against nationalisation
Critics of nationalisation argued that:
i. Nationalised industries are not exposed to market forces; hence there would be
inefficiency, slower growth and inadequate responsiveness to the wishes of the
customers.
ii. In nationalized industries, managers may be frequently required to adjust their
targets for political reason therefore most of the times, management decisions may
not be economically rational and there would be no good plan for future
investments.
iii. Since the industry is not competing for investment funds with other companies, it
may not be able capable of using these funds profitably.
5.13 Deregulation
The policy of deregulation refers to government removal of official barriers to
competition in an industry that was originally organised monopolistically. Such
barriers include sole licenses (entry barrier) and minimum quality standards. Thus,
deregulation creates competition and encourages more companies to supply the
market at competitive price levels.
Proponents of deregulation argued that the policy would lower prices, increase
output, and eliminate bureaucratic inefficiencies. On the other hand the critics
contended that, if not well packaged, it would result in gradual monopolization of

NOTE: This is a work in progress. All topics in the syllabus are covered but editing for necessary corrections is in progress.
Thanks.
134
the deregulated industry by one or two firms, higher prices, diminished output,
deteriorating service, and industry instability due to resulting merger, acquisition
and takeover.
In Nigeria, deregulation has occurred mostly in the telecommunications and postal
service industries with significant gains in terms of adequate supply and improved
quality of essential services. However, the deregulation in the banking industry has
caused increased corruption, loss of job, merger and acquisition.
5.14 SUMMARY AND CONCLUSION
Production is a process that transforms factors of production or inputs into output of
goods and services. Production may be classified into extraction, manufacturing,
commerce and direct services. The factors of production which are used to create
goods and services are land, labour, capital and entrepreneurship. The relationship
between inputs used and the maximum output that can be produced at a given time
period using an existing technology is depicted by the production function.
Production may be organised in the short-run or long-run period.
The concept of division of labour may be applied to production. It involves dividing a
production process into a number of smaller tasks for each task to be undertaken by
a different worker. It has various advantages as well as disadvantages.
Firms are the agents of production (they carry out production). In locating a firm,
various factors such as sources of raw materials, labour, power and others should be
considered. A firm may be established as sole proprietorship, partnership or
corporation.
The policies of privatisation, commercialisation, nationalisation and deregulation can
be used to restructure an economy for improved performance but the demerits of
them should be taken care of.
5.15 REVISION QUESTIONS
Multiple Choice Questions
CHAPTER FIVE
1. The output per unit of the variable factor employed is called
A. Marginal product
B. Average product

NOTE: This is a work in progress. All topics in the syllabus are covered but editing for necessary corrections is in progress.
Thanks.
135
C. Total product
D. Average cost
E. Productivity of labour
2. Which of the following occurs when increases in all inputs by a certain percentage causes a
relatively higher percentage increase in output?
A. Constant returns of scale
B. Decreasing returns to scale
C. Increasing returns to scale
D. Diminishing returns
E. Law of variable proportion
3. The following are advantages of division of labour except:
A. Increase in productivity
B. Monotony of work
C. Saves time
D. Improves skills of workers
E. Increases use of machines
4. Which of the following is not a possible source of finance of a sole proprietorship?
A. Personal savings
B. Borrowing from banks
C. Ploughing back profit
D. Inherited capital
E. Selling shares to the public
5. The following are contained in Article of Association of a limited liability company except:
A. The address of the registered office
B. The rights of the shareholders
C. Allocation of shares
D. Internal constitution of the company
E. How shares are transferred
Solution To Multiple Choice Questions (Mcq)
CHAPTER FIVE
1. B
2. C
3. B
4. E
5. A
Short Answer Questions

NOTE: This is a work in progress. All topics in the syllabus are covered but editing for necessary corrections is in progress.
Thanks.
136
1. The technical relationship between a set of inputs and output at given time period is
called…………………………
2. A man –made resource that is used up in a production process is referred to as
…………………………
3. A change in total production resulting from the use of one additional unit of a
variable input is …………………….
4. An operating period of production in which all factors of production are variables is
called ………………………
5. The simplest form of business organisation is the ………………………
SOLUTION TO SHORT ANSWERS QUESTIONS
CHAPTER FIVE
1. Production function
2. Circulating capital or capital
3. Marginal product
4. Long-run period
5. Sole proprietorship/sole trader
Question 5.1
Who is the entrepreneur? Discuss the role that the entrepreneur plays in the
economy.
Answer
(a)The entrepreneur or enterprise is a special factor of production that is in charge of
the organization of the other three factors of production (land, labour and capital) in
order to produce goods and services, bears the risk involved in business and
manages the business. The entrepreneur’s reward is profit or dividend.
(b)The functions of the entrepreneur include the following:
(i) The entrepreneur is the owner of the business and provides the capital. The
ownership of business may be one person or a group of persons who have
provided the capital.
(ii) The entrepreneur organizes and combines the other three factors of
production for the production of goods and services which are used to satisfy
human wants.

NOTE: This is a work in progress. All topics in the syllabus are covered but editing for necessary corrections is in progress.
Thanks.
137
(iii) The entrepreneur bears the risk of business failure when there is any. On the
other hand if there are any benefits or profits he enjoys them.
(iv) The entrepreneur is the principal decision-maker, though this may be shared
with other people. He makes the broad decision of policy and the nerve-
centre of management control.
(v) It is the main objective of every nation to achieve economic growth and
development. A nation achieves economic growth when it is able to increase
the final goods and services produced in the country over a given period of
time usually one year. It is the entrepreneur who is the engine of economic
growth in every nation because he produces these goods and services.
Question 2
Distinguish between each pair of the following:
(a) Fixed input and variable input
(b) Short run production period and long run production period
(c) Increasing returns to scale and decreasing returns to scale.
(d) Average product and marginal product.
(e) Location of industry and localization of industry.
Answer
(a) A fixed input is that input whose quantity cannot be varied in the short-run when
demand conditions require an increase or a decrease in production e.g. factory
building, capital equipment, some skilled labour, etc. a variable input on the
other hand is that where quantity can be changed in all times of production
when demand conditions change to require a change in production e.g. raw
materials, electrical power, unskilled labour, etc.
NOTE: This is a work in progress. All topics in the syllabus are covered but editing for necessary corrections is in progress.
Thanks.
138
(b) The short run is a period of production during which some factors of production
are fixed and some too are variable. The fixed inputs cannot be varied when
demand conditions require a change in output. This period varies from firm to
firm, depending on the type of production a firm undertakes and the inputs it
uses whiles the long run is a period of production within which all inputs are
variable. This implies that if demand conditions warrant a change in production
all the inputs can be varied to achieve this.
(c) Increasing returns to scale occur when increases in all inputs by a certain
percentage cause a relatively higher percentage increase in output or total
product. For instance when units of capital and labour are doubled (i.e. 100%
increase in scale of production) if output more than doubles (say increase by
150%), then the firm is experiencing increasing returns to scale.
On the other hand, decreasing returns to scale occur when the scale of
production of a firm is increased by a certain percentage, output or total product
increases by less than the given percentage. The total product indeed becomes
larger but does so at a lower rate than the rate of growth of all the inputs used in
production. for instance, if a 100% rise in scale results in a lower than 100% rise
in total product then the firm is experiencing decreasing returns to scale.
(d) Average product (AP) is the output per unit of the variable factor employed. In
other words, it is the productivity of the variable factor (VF). It is measured by
dividing total product (TP) by amount of variable factor employed. i.e
AP = 𝑇𝑃
(𝐴𝑃) AP =
𝑇𝑃
𝑉𝐹
Average product is measured in respect of a variable factor. Where the variable
factor is say labour (L), then it is the average product of labour (APL) or the
productivity of labour that we can measure as:
APL = 𝑇𝑃
𝐿
Where the variable factor is capital (K), then can measure the average product of
capital (APK) or the productivity of capital as:
AP = 𝑇𝑃
(𝑀𝑃)

NOTE: This is a work in progress. All topics in the syllabus are covered but editing for necessary corrections is in progress.
Thanks.
139
Marginal product is the change in total product resulting from the use of one
more (or less) unit of a variable factor. It may also be explained as the rate of
change in total product with respect to a variable factor (ΔVF), i.e.
MP = ∆𝑇𝑃
∆ 𝑖𝑛 𝑉𝑎𝑟𝑖𝑎𝑏𝑙𝑒 𝐹𝑎𝑐𝑡𝑜𝑟 =
Δ𝑇𝑃
Δ𝑉𝐹
where ∆ = change. Marginal product is also calculated in respect of variable
factor. The MP of labour (MPL) as:
MPL = ∆𝑇𝑃
∆𝐿
The MP of capital (MPK) as:
MPK = ∆𝑇𝑃
∆𝐾
(e) Location of industry tries to answer the key economic question “where to
produce”. It involves deciding on the area that an industry should be sited.
Localization of industry, on the other hand, involves the concentration or
centralization of firms in a particular industry within a limited area. It is the
tendency for all firms in an industry to crowd or locate in a particular area,
meaning the firms choose sites very close to one another. When firms of an
industry do this there are certain benefits the industry as well as the community
gains and there may be some problems too.
Question 5.3
Consider the following production schedule:
Fixed
Input (Y)
Variable Input
(X)
Total Product
(TPX)
Average
Product (APX)
Marginal
Product (MPX)
5
5
5
5
5
5
5
5
0
1
2
3
4
5
6
7
0
----
280
----
----
----
1080
----
-
----
----
180
----
200
----
----
-
80
----
----
260
----
----
-100

NOTE: This is a work in progress. All topics in the syllabus are covered but editing for necessary corrections is in progress.
Thanks.
140
(a) Is the above production schedule for a short run period or a long run period?
Explain your answer.
(b) Use your knowledge of production functions to complete the above
production schedule.
Answer
(a) The production schedule is for the short run period. This is because it has
fixed as well as variable input. Input Y is fixed whilst input X is variable.
Fixed
Input (Y)
Variable Input
(X)
Total Product
(TPX)
Average
Product (APX)
Marginal
Product (MPX)
5
5
5
5
5
5
5
5
0
1
2
3
4
5
6
7
0
80
280
540
800
1000
1080
980
-
80
140
180
200
200
180
140
-
80
200
260
260
200
80
-100
Question 5.4
What is division of labour? What are its advantages and disadvantages?
Answer
(a) Division of labour involves dividing a production process into a number of
smaller tasks for each task to be undertaken by a different worker. It may
also be referred to as specialization because each worker specializes in doing
only one task thereby producing a part of the product as against producing
the whole product. Division of labour may be applied in all aspects of
production including agriculture, manufacturing, etc.

NOTE: This is a work in progress. All topics in the syllabus are covered but editing for necessary corrections is in progress.
Thanks.
141
(b) Division of labour has advantages including the following:
(i) Development of Greater Skill by the Worker
In division of labour, each worker specializes in doing only one task.
By repeating the same task again and again the worker develops
greater skill in it and becomes a specialist in the task
(ii) Increase in Productivity
Division of labour leads to increased productivity of the worker. By
developing a greater skill and becoming a specialist in what the
worker does increases the productivity of the worker and production
as a whole.
(iii) Saving of Time
The time that would have been wasted by each worker moving
around to change tasks and tools is saved when division of labour is
practiced.
(iv) Increased use of Machines and Equipment
In division of labour, because the production process is broken up into
smaller units of tasks and each worker routinely performs one task,
machines or equipment may be used to perform the task. It is easier
to develop machines and equipment to perform only a single and
simple task than several and complex tasks.
(v) Mass Production
It leads to mass production of goods at cheaper costs and therefore
reduced selling price.
Division of labour may also have disadvantages that may include the following:
(i) Lack of Craftsmanship
Division of labour does not make workers craftsmen. They are trained to be
producers of only parts of products rather than producers of whole products.
That is, each worker cannot claim the knowledge of all the processes used to
produce a product.
(ii) Monotony of Work
Performing the same task all the time and, over and over again may create
boredom of the part of workers. It may also be unchallenging and in turn kill
workers’ initiatives.

NOTE: This is a work in progress. All topics in the syllabus are covered but editing for necessary corrections is in progress.
Thanks.
142

NOTE: This is a work in progress. All topics in the syllabus are covered but editing for necessary corrections is in progress.
Thanks.
143
(iii) Over-dependence among Workers
In division of labour, there is total dependence of a worker on other workers.
The task performed by each worker is key to the production process to the
extent that the absence from work of a worker may halt production.
(iv) Redundancy of Workers
In division of labour, a worker may be rendered redundant whenever his/her
skill is no longer needed. Because he/she is a specialist in the performance of
on task, transferring him/her to perform another task becomes a problem.
(v) Dumping of Mass Produced Goods
Division of labour has led to mass production of certain goods and brought
about dumping of such goods in other countries to kill domestic production
in countries where the goods have been dumped.
Question 5.5
Examine
(a) the features, and
(b) advantages of a joint-stock company
Answer
(a) features of Joint-stock Companies
i) Large in size with membership of seven (7) and above
ii) Has small capital shareholders.
iii) Shareholders can freely transfer or sell their shares
iv) Can sell shares to the general to raise capital
(b) Advantages of Joint-Stock Company
(i) Generation of Large Capital: Joint-stock companies are able to raise
larger capitals when compared with the other forms of businesses, from
the sale of shares and debentures from the public. They are therefore
able to engage in large-scale production and thereby enjoy economics of
scale.

NOTE: This is a work in progress. All topics in the syllabus are covered but editing for necessary corrections is in progress.
Thanks.
144
(ii) Limited Liability: The liability of each shareholder is limited to the capital
he/she has contributed to the company
(iii) Efficient Staff: The companies are able to employ the services of
specialized and efficient staff in various aspect of the company. It is
possible for the public limited liability company to practice division of
labour to increase productivity of employees.
(iv) Easy transfer of Ownership: Ownership is open to the general public and
does not require the approval of other members. It is also easy for a
shareholder to leave the company by selling or transferring his shares to
another person.
(v) Business risks are spread over a greater number of people (the
shareholders) thereby reducing individual liability.
(vi) Separate Entity: The public limited liability company has a separate
entity, can sue and be sued.

NOTE: This is a work in progress. All topics in the syllabus are covered but editing for necessary corrections is in progress.
Thanks.
145
CHAPTER SIX
COSTS, REVENUE AND PROFIT MAXIMIZATION
6.0 LEARNING OBJECTIVES
After studying this chapter, you should be able to:
explain cost concepts in the short run
explain cost concepts in the long run
explain revenue concepts
explain profit concepts
6.1 INTRODUCTION
To determine a firm’s profit, the revenue as well as the cost of the firm must be
obtained. Costs are the total amounts paid by a firm to obtain factors of production
it uses to produce a product. Whenever goods are produced, the individual firm
which has produced incurs costs (private cost) and also; costs are incurred by the
society in which the good has been produced (social costs).
6.1.1 Private Cost of Production
Private costs relate to all costs incurred by the firm in the course of production. They
include payments firms make for hiring or purchasing factors of production as well as
cost of resources owned and used by the firms. In determining private costs of
production, it is essential to consider both explicit and implicit costs incurred.
(a) Explicit Costs
Explicit costs are payments made by the firm when it purchases or hires
factors of production for the production of goods and services. They are
also referred to as historical costs. They may include rents on land, wages
and salaries of labour, interest or dividend earnings on capital and
producer’s normal profit.
(b) Implicit costs
Implicit costs arise as a result of the opportunity cost doctrine. A proprietor
of a firm may invest his own labour hours and capital in his/her business.

NOTE: This is a work in progress. All topics in the syllabus are covered but editing for necessary corrections is in progress.
Thanks.
146
The services rendered by these inputs could have generated salary and
interest if they were hired to another firm. Consider a teacher who stops
teaching and establishes his own “sachet water” business. By stopping his
teaching career and offering his labour to manage the business he forfeits
his salary from teaching. In deciding on the private costs of production, such
inputs provided by the proprietor ought to be valued at their market prices
and taken as part of production costs.
Thus, a firm’s total cost of production is made up of the sum of the explicit
and implicit costs incurred in the course of production.
6.1.2 Social Cost of Production
Social cost of production refers to the cost incurred by a society when its economic
resources are used to produce a given commodity. The usage of a society’s
resources to produce a given commodity implies sacrificing the production of some
other commodities. This is termed the opportunity cost of production. The social
cost of production is normally stated in terms of marginal social cost, which simply
means the increment in total cost to the entire society. It must be borne in mind
that the social cost of production may be higher than private cost because other
consequential effects of productive activities are considered (examples are water
and air pollution, environmental degradation, etc). For example, a mining firm may
degrade the environment in the course of its production activities.
6.2 SHORT-RUN COST CONCEPTS
The short-run period in production has been explained as when some inputs are
fixed and others are variable. On the fixed inputs, the firm will incur fixed costs and
on the variable inputs the firm will incur variable cost.
(a) Total Fixed Cost (TFC)
Total fixed cost is the cost incurred on fixed factors. It is the sum of all
explicit and implicit costs relating to the firm’s inputs. Since the level of fixed
factors employed do not change with output in the short-run, total fixed cost
tends to be constant over time. The firm still pays for fixed costs even if no
output has been produced. Hence, they are sometimes referred to as

NOTE: This is a work in progress. All topics in the syllabus are covered but editing for necessary corrections is in progress.
Thanks.
147
unavoidable costs. Examples of fixed costs include rent on premises, rates,
interest payments on loans, and hire purchase installment payments, etc.
Average Fixed Cost (AFC) is total fixed cost per unit of output produced,
meaning it is TFC divided by quantity of output produced (Q).
TFC AFC = Q
(b) Total Variable Cost (TVC)
Total variable cost is incurred when variable inputs are employed by the firm.
It is the total expenditure on variable factors used in the course of
production. This can also be considered as the total explicit and implicit costs
of variable inputs. Because the level of variable factors used in the short-run
determines the level of output, total variable cost changes whenever output
is varied. When the firm does not produce anything, variable costs are not
incurred. Hence they are sometimes referred to as avoidable costs. They
may include wages of operative staff, cost of fuel, cost of raw materials, etc.
Average variable cost (AVC) is the variable cost per unit of output produced
meaning it is TVC divided by quantity of output produced (Q).
TVC AVC = Q
(c) Total Cost (TC)
Total cost of production in the short-run is the total payments made in
respect of all fixed and variable inputs employed. That is to say the sum of all
implicit and explicit fixed and variable costs.
TC = TFC + TVC
Average Total Cost (ATC) is the total cost per unit of output produced
meaning it is TC divided by quantity of output produced (Q).
TC ATC = Q

NOTE: This is a work in progress. All topics in the syllabus are covered but editing for necessary corrections is in progress.
Thanks.
148
ATC may also be expressed as the sum of AFC and AVC. This is when we substitute
TC = TFC + TVC in the ATC equation as follows:
TC TFC + TVC TFC TVC ATC = = = + = AFC + AVC Q Q Q Q
(d) Marginal Cost (MC)
Marginal Cost (MC) is change in to total cost (TC) as a result of a unit change
in output. It is generally defined as the addition to TC resulting from an
additional unit of output produced. It is measured as:
MC= Δ𝑇𝐶
ΔQ
Where TC means change in total cost i.e. New TC minus Old TC and
QΔmeans change in quantity of output, i.e. New Q minus Old Q. The sum of
MCs up to a given level of output gives the TC of that level of output. i.e.,
TC = ∑MC
Table 6.1 is a hypothetical short-run costs schedule. Column 1 is the
quantities of output produced (Q). Column 2 depicts TFC which is constant.
It is c800 at every level of output. Column 3 shows TVC increases from c0 to
c3400. Column 4 depicts TC (TFC + TVC) which also increases from c800 to
c4200 as output increases from 0 to 10 units, AFC declines from c800 to c80.
Columns 6, 7 and 8 show AVC, ATC and MC respectively. All of these three
curves initially decline to a minimum before rising again. For instance, MC
initially declines form c600 (when output is 1 unit) to a minimum of c100
(when output is 5 units) before rising again to c600 at output level of 10
units.

NOTE: This is a work in progress. All topics in the syllabus are covered but editing for necessary corrections is in progress.
Thanks.
149
6.2.2 Schedule of Short-run Costs
Table 6.1: Short-run Costs Schedule
1 2 3 4 5 6 7 8
Output (Q)
TFC (C)
TVC (C)
TC (C)
AFC (C)
AVC (C)
ATC (C)
MC (C)
0 800 0 800 - - - -
1 800 600 1400 800.00 600.00 1400.00 600
2 800 1000 1800 400.00 500.00 900.00 400 3 800 1200 2000 266.67 400.00 666.67 200
4 800 1300 2100 200.00 325.00 525.00 100
5. 800 1400 2200 160.00 280.00 140.00 100
6. 800 1600 2400 133.33 266.67 400.00 200
7. 800 1900 2700 114.29 271.43 385.71 300
8. 800 2300 3100 100.00 287.50 387.50 400
9 800 2800 3600 88.89 311.11 400.00 500
10 800 3400 4200 80.00 340.00 420.00 600
6.2.3 Graphic Depiction of the Short-Run Cost Curves
a) TFC, TVC and TC Curves
Figure 6.1: TFC, TVC and TC Curves
TFC, TVC, TC TC
TVC
800 TFC
0 Output (Q)
Figure 6.1 plots total product or output (Q) against total fixed cost (TFC), total
variable cost (TVC) and total cost (TC) and total cost (TC). Total output on the
horizontal axis and TFC, TVC, and TC on the vertical axis. The total fixed cost (TFC)
curve is horizontal in nature and parallel to the output axis. This indicates that TFC is
insensitive to changes in the level of output in the short-run. Total variable cost
(TVC) starts from the origin (meaning TVC is zero when nothing is produced) and
increases as output rises. This is due to the fact that for any increase in output,

NOTE: This is a work in progress. All topics in the syllabus are covered but editing for necessary corrections is in progress.
Thanks.
150
there is the need to employ more variable factors in the short-run. Total cost (TC) is
equal to TFC (in our case c800) when output level is zero and also increases with
output because of the Total Variable Cost effect on it. It must be noted that TC = TFC
+ TVC hence TVC is a component of TC and as such its behavior with regard to
variations in output influences the behavior of TC.
(c) AFC, AVC, ATC and MC Curves
Figure 6.2: AFC, AVC,ATC and MC Curves
Cost (C)
MC, ATC, AVC, AFC MC
ATC
AVC
AFC
Q1 Q2 Q3 Output (Q)
Figure 6.2 shows the curves of AFC, AVC, ATC and MC. AFC steadily declining throughout.
The decline is very sharp at the initial stages as output rises. It however drops slowly at the
latter stages. AFC is positive throughout. The AFC curve is always a rectangular hyperbola.
The AVC, ATC and MC curves are all “U” shaped as shown in Figure 6.2. This shape is due to
the fact that at first, increases in Q results in decreasing AVC, ATC and MC but beyond
certain particular points, they increase with increases in output. The AVC and MC are “U”
shaped because of the law of diminishing returns to variable proportion. ATC can be
obtained by adding AFC to AVC. For those levels of output where both AVC and AFC are
falling, ATC must decrease. However, ATC attains its minimum after that of AVC because
the decreases in the AFC for a time more than offset the increases in the AVC.
6.2.4 Relationship among AFC, AVC, ATC and MC
The AFC curve is observed to be a rectangular hyperbola. The ATC (or AC) is also “U”
shaped because it is the vertical summation of the AVC and AFC. The AVC attains its
minimum at a lower level of output than ATC. In Figure 6.2, the minimum of the AVC

NOTE: This is a work in progress. All topics in the syllabus are covered but editing for necessary corrections is in progress.
Thanks.
151
occurs at output level Q2. At this level of output, ATC continues to fall and finally
attains its minimum at Q3, which is higher than Q2. Between Q2 and Q3, while AVC
is rising AFC continues to fall, but the fall in AFC far outweighs the rise in AVC now
outweighs the fall in AFC hence ATC rises. It is observable that when ATC and AVC
are falling, MC curve lies below both the ATC and AVC. On the other hand, when
ATC and AVC are rising, MC curve lies above the ATC and AVC. MC attains its
minimum before AVC and ATC, i.e. at Q1. The MC curve goes through the minimum
points of both the AVC and ATC.
6.3 LONG-RUN COST CONCEPTS
In the long run, all factors of production are variable. Therefore, all costs are
variable. The long-run average cost curve is a planning curve in the sense that it is a
guide to the entrepreneur in his decision to plan the future expansion of his output.
In this period, firms can plan to change their capacities or scale, which is prompted
by the desire to reduce cost of production. This period is characterized by a number
of possible capacities.
6.3.1 Derivation of the Long-Run Average Cost Curve (LAC)
The relationship between the Long-run Average Cost Curve (LAC) and the short-run
Average Cost curve (SAC) can be used to derive the conventional “U” shaped LAC
curve. Suppose technology is such that plants in a certain industry can assume only
three different sizes. That is, the fixed capital equipment making up the plant is
available only in three sizes – small, medium and large. Suppose again that the small
size plant gives rise to SAC1,the medium one yields SAC2, and the large plant results
in SAC3 as illustrated in Figure 6.3.
Figure 6.3: Long-Run Average Cost Curve
Cost (c) SAC1 SAC2 SAC3
C
C
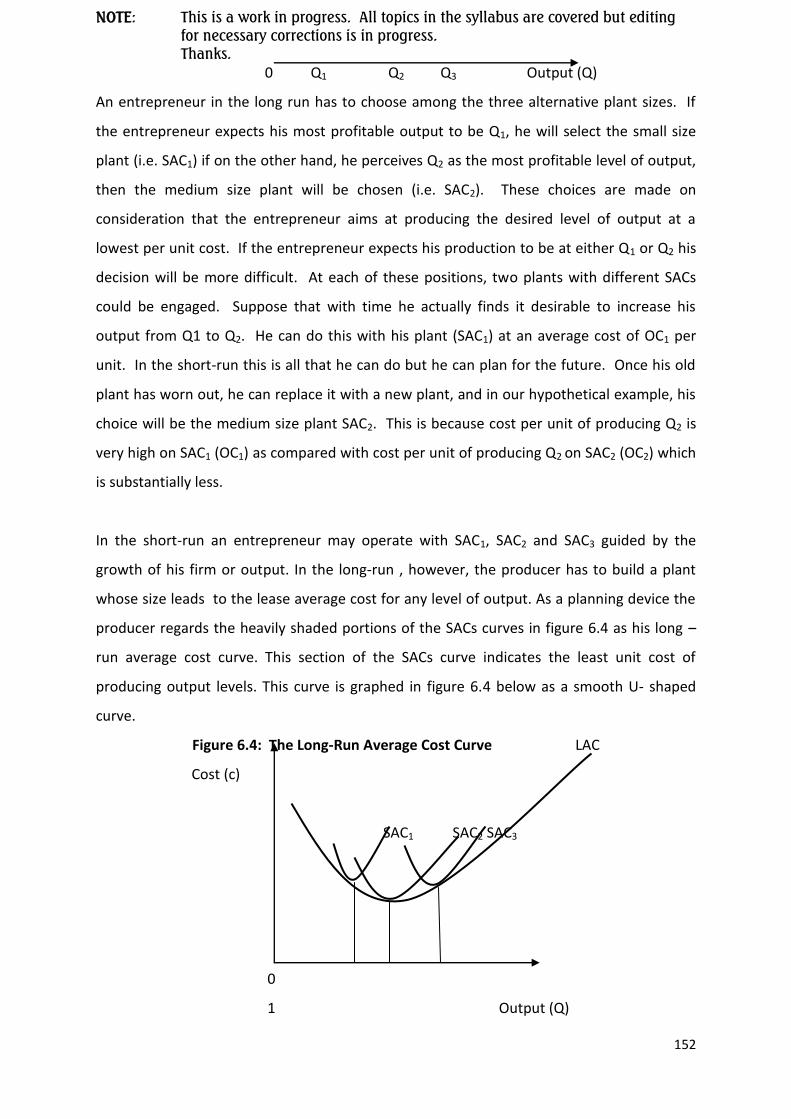
NOTE: This is a work in progress. All topics in the syllabus are covered but editing for necessary corrections is in progress.
Thanks.
152
0 Q1 Q2 Q3 Output (Q)
An entrepreneur in the long run has to choose among the three alternative plant sizes. If
the entrepreneur expects his most profitable output to be Q1, he will select the small size
plant (i.e. SAC1) if on the other hand, he perceives Q2 as the most profitable level of output,
then the medium size plant will be chosen (i.e. SAC2). These choices are made on
consideration that the entrepreneur aims at producing the desired level of output at a
lowest per unit cost. If the entrepreneur expects his production to be at either Q1 or Q2 his
decision will be more difficult. At each of these positions, two plants with different SACs
could be engaged. Suppose that with time he actually finds it desirable to increase his
output from Q1 to Q2. He can do this with his plant (SAC1) at an average cost of OC1 per
unit. In the short-run this is all that he can do but he can plan for the future. Once his old
plant has worn out, he can replace it with a new plant, and in our hypothetical example, his
choice will be the medium size plant SAC2. This is because cost per unit of producing Q2 is
very high on SAC1 (OC1) as compared with cost per unit of producing Q2 on SAC2 (OC2) which
is substantially less.
In the short-run an entrepreneur may operate with SAC1, SAC2 and SAC3 guided by the
growth of his firm or output. In the long-run , however, the producer has to build a plant
whose size leads to the lease average cost for any level of output. As a planning device the
producer regards the heavily shaded portions of the SACs curves in figure 6.4 as his long –
run average cost curve. This section of the SACs curve indicates the least unit cost of
producing output levels. This curve is graphed in figure 6.4 below as a smooth U- shaped
curve.
Figure 6.4: The Long-Run Average Cost Curve LAC
Cost (c)
SAC1 SAC2 SAC3
0
1 Output (Q)

NOTE: This is a work in progress. All topics in the syllabus are covered but editing for necessary corrections is in progress.
Thanks.
153
When the long-run average cost (LAC) curve is drawn for a firm with an
infinite number of plant sizes we obtain the conventional “U” shaped LAC
curve in Figure 6.5 above. The LAC curve is frequently referred to as an
envelope curve of the SAC curves, because it is derived from the least cost
points of the various SACs curves. The LAC is so regarded because each SAC
represents various short run period of the firm.
6.3.2 Economies and Diseconomies of Scale
Economies and Diseconomies of scale are respectively, the “advantages” and
“disadvantages” of large-scale production. The expression “advantages” is used to
present benefits that help the firm to produce at reduced unit cost of production.
They are referred to as economies of scale.
The word “disadvantages”, on the other hand, means those things that lead to
increases in the unit cost of producing larger output. These are referred to as
diseconomies of scale.
The advantages and disadvantages can be grouped into internal and external
economies and diseconomies of scale. Economies and diseconomies of scale are
long run phenomena.
(a) Internal Economies of Scale
Internal economies of scale are the advantages or benefits that the firm
enjoys as it expands its size or increases its scale of operation. These may
result from technical, financial, managerial, marketing and welfare
advantages enjoyed by the firm and are as such said to be firm specific.
(i) Technical Economies: They are economies that accrue from the use of large
machines with emphasis on full utilization and efficiency in production. First,
there are some equipment which are available only in certain minimum sizes,
and unless the plant acquisition and usage will permit the production of at least
these minimum output levels of production, it will not be economical. Secondly,
large-scale production allows for the specialization of different sets of equipment

NOTE: This is a work in progress. All topics in the syllabus are covered but editing for necessary corrections is in progress.
Thanks.
154
for the different functions. Thirdly, the firm can have a standby machine as an
insurance against any form of equipment breakdown. Also, the specialization of
machines aids the further development of division of labour. These benefits
derived by the firm from such approach to production lead to substantial
economies of scale thereby reducing the unit cost of output produced.
(ii) Marketing Economies: These are derived from the bulk purchasing of inputs
and bulk distribution of outputs. A large firm is able to buy its raw materials
in larger quantities. Such bulk purchases enable the firm to obtain discounts
and free transportation. It also costs a little more to sell smaller quantities of
output as sales cost per unit of output sold tends to fall as the volume of
sales increases. Distribution may even be taken over by subsidiary firms. As
sales increases, advertising cost per unit sold reduces too. These advantages
lead to a fall in per unit cost of production for the large firm.
(iii) Financial Economies: These are benefits obtained by large firms as a result
of contracting credit from financial institutions at lower interest rates than
smaller firms. The fact is that the large firms can provide collateral securities
for such loans and their mere sizes alone make them credit-worth as
compared to smaller firms. In addition to borrowing from financial
institutions, large firms can easily float shares in the stock market. At times
suppliers of materials to large firms may give them out on credit. This is a
sort of pre-financing of the firm’s activity. All these advantages lead to the
lower per unit cost of output produced.
(iv) Managerial Economies: There are many managerial economies associated
with large-scale production. A larger firm is in the position to employ more
highly qualified and specialist managers (such as production manager,
marketing manager, financial manager, etc) to man the various departments
of the firm. Large firms can also mechanize managerial activities by
introducing the usage of improved devices such as computers, telephones,
fax, e-mail, etc. Opportunities are also made available for the training of
young potential career managers for the firm. These economies lead to
increased output and lower per unit cost of production.

NOTE: This is a work in progress. All topics in the syllabus are covered but editing for necessary corrections is in progress.
Thanks.
155
(v) Economies of research and Development: All things being equal, larger firms
make greater profits and can set aside some of these profits for research and
develop the product.
(b) External Economies of Scale
These are advantages or benefits gained by a firm, as the industry in which it
operates grows larger. An industry grows when the number of firms
constituting the industry increases. These advantages are in the form of
availability of cheaper inputs like skilled labour, common services and
research.
(i) Economies of Skilled Labour: This involves upgrading the skills of
labour through the provision of education and training facilities in a
well-organised industry. This ensures that education and training of
labour do not become part of the industry’s operations but rather
some specialized institutions take over the performance of these
functions. This is often easier in well-organised ones. Such education
and training culminate in economies of manpower development and
generally lower the cost of production in the industry.
(ii) Economies of Research and Development: Another advantage
enjoyed by firms in well-organised industry relates to research and
development activities. The industry or other institutions may
provide these research activities with the result being made available
to all firms in that industry. This lowers per unit cost of output
produced in the industry.
(iii) Economies of Common Services: Through the concentration of firms
in a given geographical location, the firms may enjoy certain common
services. These services include special transport and
telecommunication facilities, water, power, good roads as well as
special treatment from bankers. Also, a well-organised industry may
enjoy excellent marketing arrangements through which it can buy raw
materials and sell finished products. All these lead to a lower per unit
cost of output in the industry.

NOTE: This is a work in progress. All topics in the syllabus are covered but editing for necessary corrections is in progress.
Thanks.
156

NOTE: This is a work in progress. All topics in the syllabus are covered but editing for necessary corrections is in progress.
Thanks.
157
(c) Internal Diseconomies of Scale
These are disadvantages a firm has to contend with as it grows larger
or increase its scale of operation. For instance managerial ability not
only leads to economies of scale but also diseconomies of scale. If the
firm’s size continues to increase, certain indivisible factors may be
duplicated. This increases the average cost of production as well as
creates problems of managing and coordinating the functions of other
productive factos. A typical example one can cite is the red tape
bureaucratic practices characterizing most industrial activities, which
delay decision making and implementation. Also, there is the
problem of alienating the workers from the product and management
and its consequential low morale of workers. The end-result of all
these undesirable effects of large-scale operations is a rise in average
total cost (ATC) of production.
(d) External Diseconomies of scale
These are the disadvantages that confront firms in an industry, as the
industry grows larger beyond the optimal size. These disadvantages
are due to external factors within the industry and not from within
the set up of the firms. Examples of these external diseconomies are:
(i) Increasing Raw material Cost: If an industry is growing, there will be
an increase in the demand for raw materials mainly used in the
industry. If supply conditions remain the same, then this will lead to
an increase in the price of raw materials and subsequently an increase
in the firms’ unit cost of production within the industry.
(ii) Increasing Cost of Skilled Labour: As firms demand more skilled
labour, they tend to compete among themselves for the limited pool
of such labour in the industry. To entice such labour to move from
one firm to another, one has to bid up the wage rate. This invariably
leads to an increase in production costs of the firms in the industry
and the resultant increase in unit cost of production.

NOTE: This is a work in progress. All topics in the syllabus are covered but editing for necessary corrections is in progress.
Thanks.
158
(iii) Excess Marketing Cost: With the increase in the number of firms in
the industry because of the growth of the industry, each firm has to
compete for market shares or consumers. Advertising and other
marketing strategies like sales promotions therefore become the
order of the day. The consequence of these is an increase in unit cost
of production of firms in the industry.
6.4 REVENUE CONCEPTS
Revenue is receipts from the sale of a firm’s output. It is earned
immediately a firm sells a given quantity of its output.
6.4.1 Total Revenue (TR)
Total revenue is the total receipts from the sale of a given quantity of
a firm’s output. It is found by multiplying price (P) by the
corresponding quantity (Q) sold by the firm. i.e.
TR = PQ
6.4.2 Average Revenue (AR)
Average revenue is the revenue per unit of output sold. It is found by
dividing total revenue (TR) by quantity sold (Q). i.e.
AR = TR
Q
But TR – P.Q
Therefore,
AR = 𝑇𝑅
𝑄 = P
Therefore Average Revenue is the same as price (P).
6.4.2 Marginal Revenue (MR)
Marginal revenue is the change in total revenue with respect to a change in
quantity sold. That is, it is the change in total revenue that results from the

NOTE: This is a work in progress. All topics in the syllabus are covered but editing for necessary corrections is in progress.
Thanks.
159
sale of one extra unit of the commodity. It is found by dividing the change in
total revenue ( TR) by the change in quantity sold ( ΔQ).
MR = TR
Q
Where TR = change in TR = New TR – Old TR
Q = change in Q = New Q – Old Q
6.4.3 Price-Taking Firm
A firm is described as a price-taker when it has no significant control over the price
of its product. This means that the firm cannot influence the price of its product by
altering its supply. Usually it is the market or industry demand and supply that will
interact to fix the price of the product which is handed over to all firms in the
industry. The firm can sell any quantity at the market or industry determined price.
The perfectly competitive firm is a price-taking firm.
(a) Demand and Revenue Schedules for a Price-taking Firm
Table 6.2 Demand and Revenue Schedule
Price (P) N
Quantity (Q)
Total Revenue (TR)
N
Average Revenue (AR)
N
Marginal Revenue (MR)
N
N1000 0 N0 - -
1000 1 1000 1000 1000
1000 2 2000 1000 1000
1000 3 3000 1000 1000
1000 4 4000 1000 1000
1000 5 5000 1000 1000
1000 6 6000 1000 1000
1000 7 7000 1000 1000
1000 8 8000 1000 1000
1000 9 9000 1000 1000
1000 10 10000 1000 1000
From the above schedules, we observe that for a price-taking firm price, average
revenue and marginal revenue are the same.
P = AR = MR.
(b) Demand and Revenue Curves for a price-taking Firm

NOTE: This is a work in progress. All topics in the syllabus are covered but editing for necessary corrections is in progress.
Thanks.
160

NOTE: This is a work in progress. All topics in the syllabus are covered but editing for necessary corrections is in progress.
Thanks.
161
Figure 6.5 Demand and Revenue Curve for a price-taking Firm
TR
AR = D = MR
Quantity (Q)
From Figure 6.5, the total revenue (TR) curve for a price-taking firm is an upward-sloping
straight line that passes through the origin meaning no revenue is earned by the firm can
influence the price of its product by altering its supply and allowing the market to set the
price or setting the price straight away and allowing the market to set the quantity sold. It
cannot do both simultaneously. The former option is preferable. A typical example of a
price-maker to set the quantity sold. It cannot do both simultaneously. The former option
is preferable. A typical example of a price-maker is the monopoly firm.
(a) Demand and Revenue Schedules for a price-making Firm
Table 6.3: Demand and Revenue Schedule (Price-making Firm)
Price (P)
Quantity (Q)
Total Revenue (TR)
Average Revenue Marginal Revenue (MR)
C1100 0 C0 - -
1000 1 1000 1000 1000
900 2 1800 900 800
800 3 2400 800 600
700 4 2800 700 400
600 5 3000 600 200
500 6 3000 500 0
400 7 2800 400 -200
300 8 2400 300 -400
200 9 1800 200 -600
100 10 1000 900 -800
From table 6.3 above it is still confirmed that price (P) is the same as average revenue (AR)
therefore the AR is the same as demand. From column 3 of Table 6.2, it is noticed that TR
for a price-making firm initially increases, gets to a maximum and then declines. It increases
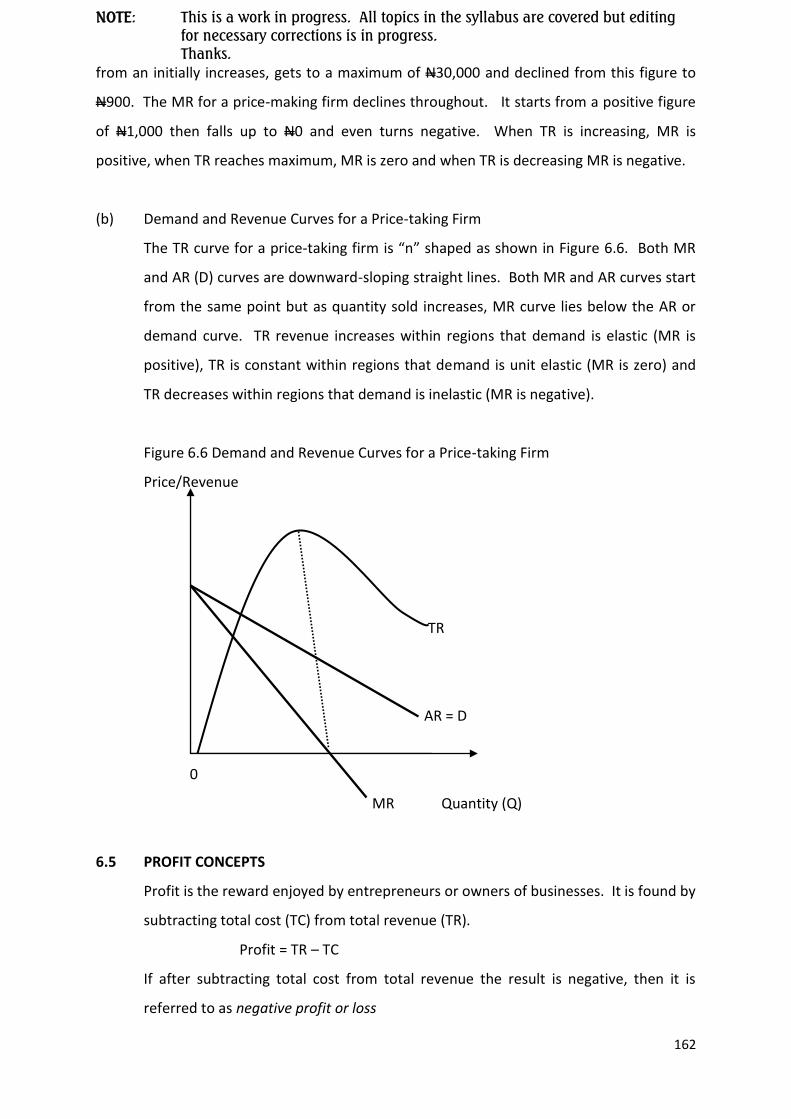
NOTE: This is a work in progress. All topics in the syllabus are covered but editing for necessary corrections is in progress.
Thanks.
162
from an initially increases, gets to a maximum of N30,000 and declined from this figure to
N900. The MR for a price-making firm declines throughout. It starts from a positive figure
of N1,000 then falls up to N0 and even turns negative. When TR is increasing, MR is
positive, when TR reaches maximum, MR is zero and when TR is decreasing MR is negative.
(b) Demand and Revenue Curves for a Price-taking Firm
The TR curve for a price-taking firm is “n” shaped as shown in Figure 6.6. Both MR
and AR (D) curves are downward-sloping straight lines. Both MR and AR curves start
from the same point but as quantity sold increases, MR curve lies below the AR or
demand curve. TR revenue increases within regions that demand is elastic (MR is
positive), TR is constant within regions that demand is unit elastic (MR is zero) and
TR decreases within regions that demand is inelastic (MR is negative).
Figure 6.6 Demand and Revenue Curves for a Price-taking Firm
Price/Revenue
TR
AR = D
0
MR Quantity (Q)
6.5 PROFIT CONCEPTS
Profit is the reward enjoyed by entrepreneurs or owners of businesses. It is found by
subtracting total cost (TC) from total revenue (TR).
Profit = TR – TC
If after subtracting total cost from total revenue the result is negative, then it is
referred to as negative profit or loss

NOTE: This is a work in progress. All topics in the syllabus are covered but editing for necessary corrections is in progress.
Thanks.
163
6.5.1 Accounting Profit versus Economic Profit
The difference between accounting profit and economic profit is that
economist include in total cost of production both implicit and explicit costs
whilst accountants see cost of production as only the explicit costs.
(a) Accounting Profit
Accounting profit is total revenue less total cost (made up of only explicit
costs). The result if positive then an accounting profit is earned, if
negative then an accounting loss is made and if zero then it is referred to
as breakeven.
(b) Economist’s Profit
Economic profit is total revenue less total cost (made up of explicit plus
implicit costs). The result if positive then an economic, pure or
supernormal profit has been earned, if negative then an economic loss is
made and if zero then normal profit has been earned.
6.5.2 Economic Profit, Normal Profit and Economic Loss
(a) Economic Profit
Economic profit is the excess of total revenue over total cost when the latter
includes both explicit and implicit costs. It is the type of profit when made by
firms in an industry attracts new firms into the industry when no barriers to
entry exist while existing firms expand their production. It is also called pure
or supernormal profit.
(b) Normal Profit
Normal Profit is when total revenue is exactly equal to total cost when the
latter includes both explicit and implicit costs. It is the type of profit when
made by firms in an industry does not attract new firms into the industry
even when no barriers to entry exist. Existing firms do not leave industry
also. The firm’s profit then is equal to the implicit costs.

NOTE: This is a work in progress. All topics in the syllabus are covered but editing for necessary corrections is in progress.
Thanks.
164
(c) Economic Loss
Economic Loss is the excess of total cost (both implicit and explicit) over total
revenue. This type of loss when made by firms in an industry would
discourage firms which are unable to cover their variable costs to exit the
industry while those who are able to cover their variable costs will stay in the
short run.
6.5.3 PROFIT MAXIMISATION
A firm is said to be in equilibrium, maximizing profit or minimizing loss at an output
level when
i. the firm’s marginal revenue (MR) is equal to its marginal cost (MC),
i.e. MR = MC (Necessary Condition)
ii. this should, however, occur when marginal cost is rising. (Sufficient Condition)
(a) Price-making Firm: If the firm is a price-maker then it has a downward-slopping
MR curve and profit maximization will be presented graphically as:
Figure 6.7: Profit Maximisation for a Price-making Firm
Revenue/Costs
MC
AC
Pe A
P B AR
MR
Qe output (Q)
The priced-making firm will be in equilibrium when it produces an output level of OQe and
sells at price OQe. Note that The MR and MC curves are used to show the profit maximizing
ouotput level but the AR curve is used to determine the price at which the output level will

NOTE: This is a work in progress. All topics in the syllabus are covered but editing for necessary corrections is in progress.
Thanks.
165
be sold. The lowest point of the AC curve is used to determine the unit cost of the output
produced. The rectangle PPe AB shows abnormal profit in the short-run period.
(b) Price-taking Firm
For a price-taking firm MR = AR = P. Since price is equal to marginal revenue, they
have a special necessary condition for profit maximization which is:
P = MC
The sufficient condition is the same
Figure 6.8 Profit Maximisation for a Price-taking Firm
Revenue/Costs
MC AC
Pe P = MR = AR = MC = AC
E
0 Qe Output (Q)
The price-making firm will be in equilibrium when it produces an output level of OPe and
sells at price OPe.
6.6 SUMMARY AND CONCLUSION
Whenever a good is produced, the individual firm which has produced incurs costs
which are are referred to as private costs and the society in which the good has been
produced also incurs costs which are known as social costs. Private costs include
payments firms make for hiring or purchasing factors of production as well as cost of
resources owned and used by the firms whereas social cost of production refers to
the cost incurred by a society when its economic resources are used to produce a
given commodity.
In the short run production period the firm incurs fixed costs on fixed inputs and
variable costs on the variable inputs. In the long because all inputs are variable the
firm incurs only variable costs. In the long run where the firm can vary all inputs,

NOTE: This is a work in progress. All topics in the syllabus are covered but editing for necessary corrections is in progress.
Thanks.
166
there some advantages and disadvantages that accrue to the firm when it expands.
The advantages of expansion are called economies of scales while he disadvantages
are called diseconomies of scale.
Revenue is what the firm receives when it sells its output. The excess revenue over
the firms’s cost of production is profit.
6.7 Revision Questions
SECTION A: MULTIPLE CHOICE QUESTIONS
CHAPTER SIX
1. Which of the following is time of a perfectly competitive firm?
A. Price = AR ≠ MR at equilibrium
B. Demand is always greater than AR
C. The MR curve is downward sloping
D. Price = AR = MR = D at equilibrium
E. At equilibrium position, MR > MC
2. The sum of the average variable cost and average fixed cost gives
A. Marginal cost
B. Average total cost
C. Total cost
D. Total fixed cost
E. Total variable cost
3. At the levels of output where the Average Cost is falling, the marginal cost is
A. Falling but less than Average cost
B. Rising faster than the average cost
C. Falling but greater than the average cost
D. Equal to the average cost
E. Rising but less than average cost
4. Which of the profit concept does not include implicit cost elements?
A. Accounting profit
B. Economists profit
C. Normal profit
D. Super normal profit
E. Economic loss
5. The necessary condition for a firm to be at equilibrium at a given output level is where:
A. The marginal cost is rising
B. MC = MR
C. AC = AR
D. TC < TR
E. TVC = TR

NOTE: This is a work in progress. All topics in the syllabus are covered but editing for necessary corrections is in progress.
Thanks.
167
Solution To Multiple Choice Questions
CHAPTER SIX
1. D
2. C
3. A
4. A
5. B
Short Answer Questions
1. A cost concept that is equivalent of the change in the total variable cost with respect
to output is……………………..
2. The benefits that a firm enjoys as it expands its scale of operation are
called……………….
3. The relationship P=MR=MC gives the profit maximisation condition for a market
structure called………………………..
4. The product of price and the corresponding quantity sold by a firm is
called………………
5. The cost disadvantages that a firm confronts as it expands its scale of production is
called……………………………..
Solution To Short Answers Questions
CHAPTER SIX
1. Marginal cost
2. Internal economies of scale
3. Perfect market/ competitive market
4. Total revenue
5. Internal diseconomies
QUESTION 6.1
Write short notes on the following:
(i) Social cost
(ii) Explicit cost
(iii) Economies of scale

NOTE: This is a work in progress. All topics in the syllabus are covered but editing for necessary corrections is in progress.
Thanks.
168
(iv) Marginal revenue
Answer
(i) Social cost of production refers to the cost incurred by a society when its
economic resources are used to produce a given commodity. The usage of a
society’s resources to produce a given commodity implies sacrificing the
production of some other commodities. This is termed the opportunity cost of
production. The social cost of production is normally stated in terms of marginal
social cost, which simply means the increment in total cost of the entire society.
It must be borne in mind that the social cost of production may be higher than
private cost because other consequential effects of productive activities are
considered (examples are water and air pollution, environmental degradation,
etc). For example, a mining firm may degrade the environment in course of its
production activities.
(ii) Explicit costs are payments made by the firm when it purchases or hires factors
of production for the production of goods and services. They are also referred to
as historical costs. They may include rents on land, wages and salaries of labour,
interest or dividend earnings on capital and producer’s normal profit.
(iii) Economies of scale are the “advantages” of large-scale production. The
expression “advantages” is used to represent benefits that help the firm to
produce at reduced unit cost of production as a result of increasing all inputs in
the long run. They are classified into internal economies of scale and external
economies of scale.
(iv) Marginal revenue is the change in total revenue with respect to a change in
quantity sold. That is, it is the change in total revenue that results from the sale
of one extra unit of the commodity. It is measured by dividing the change in
total revenue ( TR) by the change in quantity sold ( ΔQ). i.e.
MR = TR
Q
Where TR = change in TR = New TR – Old TR
Q = change in Q = New Q – Old Q

NOTE: This is a work in progress. All topics in the syllabus are covered but editing for necessary corrections is in progress.
Thanks.
169
Question 6.2
Complete the following cost table:
Output TFC TVC TC
AFC AVC AC Or ATC MC
0 C2000 C0 - - - - -
1 2000 500 - - - - -
2 2000 900 - - - - -
3 2000 1200 - - - - -
4 2000 1600 - - - - -
5 2000 2200 - - - - -
6 2000 3000 - - - - -
7 2000 4000 - - - - -
8 2000 5200 - - - - -
9 2000 6700 - - - - -
10 2000 9000 - - - - -
Answer
Output TFC TVC TC
AFC AVC ATC MC
0 C2000 C0 C2000 - - - -
1 2000 500 2500 2000 500 2500 500
2 2000 900 2900 1000 450 1450 400
3 2000 1200 3200 666.7 400 1066.7 300
4 2000 1600 3600 500 400 900 400
5 2000 2200 4200 400 440 840 600
6 2000 3000 5000 333.3 500 833.3 800
7 2000 4000 6000 285.7 571.4 857.1 1000
8 2000 5200 7200 250 650 900 1200
9 2000 6700 8700 222.2 744.4 966.7 1500
10 2000 9000 11000 200 900 1100 2300
Question 6.3
(a) Briefly distinguish between internal economies of scale and external economies
of scale.
(b) Explain three (3) sources of each type of economies of scale.

NOTE: This is a work in progress. All topics in the syllabus are covered but editing for necessary corrections is in progress.
Thanks.
170
Answer
(a) Internal economies of scale are the advantages or benefits that the firm enjoys as it
expands its size or increases its scale of operation. These may result from technical,
financial, managerial, marketing and welfare advantages enjoyed by the firm and are
as such said to be firm specific. External economies of scale on the other hand, are
advantages or benefits gained by a firm, as the industry in which it operates grows
larger. An industry grows when the number of firms constituting the industry
increases. These advantages are in the form of availability of cheaper inputs like
skilled labour, common services and research.
(b)
Any three (3) of the following sources of internal economies of scale
(i) Technical Economies: They are economies that accrue from the use of large
machines with emphasis on full utilization and efficiency in production. First,
there are some equipment which are available only in certain minimum sizes,
and unless the plant acquisition and usage will permit the production or at least
these minimum output levels of production, it will not be economical to acquire
them. Secondly, large-scale production, it will not be economical to acquire
them. Secondly, large-scale production allows for the specialization of different
sets of equipment for the different phases of the firm’s activities. This reduces
the cost (i.e. time and money cost) involved in setting and re-setting the same
equipment for different functions. Thirdly, the firm can have a standby machine
as an insurance against any form of equipment breakdown. Also, the
specialization of machines aids the further development of division of labour.
These benefits derived by the firm from such approach to production lead to
substantial economies of scale thereby by the firm from such approach to
production lead to substantial economies of scale thereby reducing the unit cost
of output produced.
(ii) Marketing Economies: These are derived from the bulk purchasing of inputs and
bulk distribution of outputs. A large firm is able to buy its raw materials in larger
quantities. Such bulk purchases enable the firm to obtain discounts and free
transportation. It also costs a little more to sell smaller quantities of output as
sales cost per cost per unit of output sold tends to fall as the volume of sales

NOTE: This is a work in progress. All topics in the syllabus are covered but editing for necessary corrections is in progress.
Thanks.
171
increases. Distribution may even be taken over by subsidiary firms. As sales
increases, advertising cost per unit sold reduces too. These advantages lead to a
fall in per unit cost of production for the large firm.
(iii) Financial Economies: These are benefits obtained by large firms as a result of
contracting credit from financial institutions at lower interest rates than smaller
firms. The fact is that the large firms can provide collateral securities for such
loans and their mere sizes alone make them credit-worthy as compared to
smaller firms. In addition to borrowing from financial institutions, large firms can
easily float shares in the stock market. At times suppliers of materials to large
firms may give them out on credit. This is a sort of pre-financing of the firm’s
activity. All these advantages lead to the lower per unit cost of output produced.
(iv) Managerial Economies: These are many managerial economies associated with
large-scale production. A large firm is in the position to employ more highly
qualified and specialist managers (such as production manager, marketing
manager, financial manager, etc.) to man the various departments of the firm.
Large firms can also mechanize managerial activities by introducing the usage of
improved devices such as computers, telephones, fax, e-mail, etc. Opportunities
are also made available for the training of young potential career managers for
the firm. These economies lead to increased output and lower per unit cost of
production.
(v) Economies of research and development: All things being equal, larger firms
make greater profits and can set aside some of these profits for research and
develop the product.
Any three (3) of the following sources of external economies of scale
(i) Economies of Skilled Labour: This involves upgrading the skills of labour through
the provision of education and training facilities in a well-organised industry.
This ensures that education and training of labour do not become part of the
industry’s daily operations but rather some specialized institutions take over the
performance of these functions. This is often easier in well-organised industries
than less organized ones. Such education and training culminate in economies of
NOTE: This is a work in progress. All topics in the syllabus are covered but editing for necessary corrections is in progress.
Thanks.
172
manpower development and generally lower the cost of production in the
industry.
(ii) Economies of Research and Development: Another advantage enjoyed by firms
in well-organised industry relates to research and development activities. The
industry or other institutions may provide these research activities with the
result being made available to the firms in that industry. This lowers per unit
cost of output produced in the industry.
(iii) Economies of Common Services: Through the concentration of firms in a
particular industry in a given geographical location, the firms may enjoy certain
common services. These services include special transport and
telecommunication facilities, water, power, publication of trade journals with
news and articles of special interest to the firms as well as even special
treatment from bankers. Also, a well-organised industry may enjoy excellent
marketing arrangements through which it can buy raw materials and sell finished
products. All these lead to a lower per unit cost of output in the industry.
Question 6.4
(a) How does accountant’s profit differ from economist’s profit?
(b) Explain each of the following:
(i) Normal profit
(ii) Economic profit
(iii) Economic loss
Answer
(a) The difference between accounting profit and economic profit is that economists
include in total cost of production both implicit and explicit costs whilst
accountants see cost of production as only the explicit costs. Accounting profit is
total revenue less total cost (made up of only explicit costs). The result if positive
then an accounting profit is earned. If negative then an accounting loss is made
and if zero then it is referred to as breakeven. Economic profit, on the other
hand, is total revenue less total cost (made up of explicit plus implicit costs). The
result if positive then an economic, pure or supernormal profit has been earned,

NOTE: This is a work in progress. All topics in the syllabus are covered but editing for necessary corrections is in progress.
Thanks.
173
if negative then an economic loss is made and if zero then normal profit has been
earned.
(b)
(i) Normal profit is when total revenue is exactly equal to total cost when the
latter includes both explicit costs. It is the type of profit when made by firms in an
industry does not attract new firms into the industry even when no barriers to entry
exist. Existing firms also do not leave industry also. The firm’s profit then is equal to
the implicit costs.
(ii) Economic profit is the excess if total revenue over total cost when the latter
includes both explicit and implicit costs. It is the type of profit when made by firms
in an industry attracts new firms into the industry when no barriers to entry exist
while existing firms also expand their production. It is also called pure or
supernormal profit.
(iv) Economic Loss is the excess of total cost (both implicit and explicit) over total
revenue. This type of loss when made by firms in an industry would discourage
firms which are unable to cover their variable costs to exit the industry while
those who are able to cover their variable costs to exit the industry while those
who are able to cover their variable costs to exit the industry while those who
are able to cover their variable costs will stay in the short run.
Question 6.5
Consider the following Output cost and revenue table for a firm:
Output TC
N
MC
N
TR
N
MR
N
0 100 - 0 -
1 2200 - 2000 -
2 4100 - 3800 -
3 5700 - 5400 -
4 6700 - 6800 -
5 7500 - 8000 -
6 8500 - 9000 -
7 10100 - 9800 -
8 12000 - 10400 -
9 14100 - 10800 -

NOTE: This is a work in progress. All topics in the syllabus are covered but editing for necessary corrections is in progress.
Thanks.
174
Required:
(a) Calculate the marginal cost (MC) and marginal revenue (MR) at each level of output.
(b) At which level of output would the firm maximize its profit and why?
(c) Is the firm making profit or loss at the profit maximizing level of out? Calculate it.
Answer
(a)
(b) The firm will maximize profits when it produces an output of 6 units. This because at
this output level, MR = MR = N1000 and MC is rising.
(d) At the profit maximizing level of 6 units, the firm earns economic profit of N500.
(Profit = TR – TC = N9000 – N8500 = N500).
Output TC N
MC N
TR N
MR N
Profit N
Π= TR -TC
0 100 - 0 - -100
1 2200 2100 2000 2000 -200
2 4100 1900 3800 1800 -300
3 5700 1600 5400 1600 -300
4 6700 1000 6800 1400 100
5 7500 800 8000 1150 450
6 8500 1000 9000 1000 500
7 10100 1600 9800 800 -300
8 12000 1900 10400 600 -600
9 14100 2100 10800 400 -3300

NOTE: This is a work in progress. All topics in the syllabus are covered but editing for necessary corrections is in progress.
Thanks.
175
C H A P T E R SEVEN
PERFECT COMPETITION
7.0 LEARNING OBJECTIVE
After studying this chapter, you should be able to:
Identify the features of firms and industry in perfect competition.
Understand the short-run and long-run profit-maximization positions of perfectly
competitive firms.
Understand the advantages and disadvantages of perfect competition.
7.1 INTRODUCTION
To the economist, the term market generally refers to the various arrangements
people have for trading with one another. The type of market structure within
which a firm operates is determined by essential features or characteristics of the
market, including the number of firms involved, the extent to which the products of
different firms are diverse or homogeneous, and the ease of entry into and exit from
the market.
The main types of market structure include perfect competition, monopoly,
monopolistic and oligopoly. In this chapter, we consider perfect competition while
monopoly, monopolistic competition and oligopoly are discussed in Chapters 8 and 9
respectively.
Basically, perfect competition refers to the market structure in which there is a large
number of relatively small firms, each firm having freedom of entry into and exit
from the industry. All firms produce homogeneous product and all market
participants (buyers and sellers) have full knowledge of the situation in the market,
especially about the present price and location of the product.
7.2 CHARACTERISTICS OF PERFECT COMPETITION

NOTE: This is a work in progress. All topics in the syllabus are covered but editing for necessary corrections is in progress.
Thanks.
176
From the definition of perfect competition provided in the preceding section, the
main characteristics or essential features of perfect competition can be identified as
follow:
(i) Large number of buyers and sellers: There are many buyers and sellers in
the market to the extent than no single buyer or seller can influence the
product price. Thus, all buyers and sellers are described as price-takers.
(ii) Homogeneous product: The products of all firms must be identical in the
eyes of the consumers. Hence, it makes no difference which firm they
purchase from, and especially since no factor other than price will influence
their purchasing decision.
(iii) Perfect mobility of resources: There must be perfect mobility of factors of
production so that firms can move freely into or out of the market (i.e. free
entry and exist).
(iv) Perfect knowledge of all relevant information: All buyers and sellers must
have adequate knowledge of existing market conditions. That is, the firms
must know technological conditions of production, price of inputs and price
at which the product can be sold, while all buyers must know where they can
get the product to buy and at what price.
7.2.1 A FIRM’S DEMAND CURVE IN PERFECT COMPETITION
Following from the assumption that all firms are price-takers, the demand curve
facing each firm in perfect competition is horizontal i.e. perfectly price elastic as
shown in Figure 7.1.
Figure 7.1. The Demand Curve for a Perfectly Competitive Firm
Price
P D= AR=MR

NOTE: This is a work in progress. All topics in the syllabus are covered but editing for necessary corrections is in progress.
Thanks.
177
0 Output
Figure 7.1 shows that the firm can sell all it wishes to at the prevailing market price,
and that price or average revenue (AR) is constant and it is equal to marginal
revenue (MR) because the sale of additional units does not require lowering of price.
7.2 An Industry’s Demand Curve In Perfect Competition
All the firms in a perfectly competitive industry together can influence the market
price by their collective action. Hence the industry’s demand curve is downward
sloping as shown in Figure 7.2.
Figure 7.2: Industry Demand Curve in Perfect Competition
Price D
P1
P1
D
0 Q1 Q1 Output
7.3. SHORT RUN EQUILIBRIUM OF THE PERFECTLY COMPETITIVE FIRM
A firm is said to be in equilibrium at the output level where there is no
incentive to alter output or supply decision e.g. at the profit – maximizing
output level.
The general rule for profit-maximization is that the firm will achieve the
maximum profit at the output level where marginal cost (MC) = (MR). Since
in the case of perfectly competitive firm, price and marginal revenue are
equal, the profit-maximizing rule can be redefined as the point (i.e. output
level) where MC = MR=P. It is also necessary that at that output level, MC is

NOTE: This is a work in progress. All topics in the syllabus are covered but editing for necessary corrections is in progress.
Thanks.
178
rising and the firm is incurring the least cost per unit i.e. short-run average
total cost (SAC) of output.
Figure 7.3: The short-run Profit-maximizing position for a Perfectly
Competitive Firm
SMC SAC
SAVC
C
P1 1 D =AR=MR
A B
0 Q1 Output
As shown in Figure 7.3, the firm maximizes its profit by producing output Q1 where MC = MR
=P. The firm’s total point represented by shaded rectangle P1ABC is obtained as total
revenue (rectangle P1OQ1C) less total cost (rectangle AOQ1B). Hence, the perfectly
competitive firm is making positive economic profit, otherwise referred to as abnormal
profit or supernormal profit in the short-run.
7.4. LONG RUN EQUILIBRIUM OF THE PERFECTLY COMPETITIVE FIRM
The existence of positive economic profit in the short-run will encourage new firms
to join the industry, especially when there are no barriers to entry. This process of
new entry will persist until the profit of each firm in the industry drops to zero; as a
result of excess supply and continuous downward review of price to the level where
price (P) equals average total cost (LAC).

NOTE: This is a work in progress. All topics in the syllabus are covered but editing for necessary corrections is in progress.
Thanks.
179
Figure 7.4: The Long run Equilibrium Position of the Perfectly Competitive Firm
LMC
LAC
B
P D = AR=MR
0 Q Output
In Figure 7.4, it is evident that the perfectly competitive firm makes zero economic
profit or what is alternatively referred to as normal profit in the long run because
total revenue (TR) equals total cost (TC).
7.5 THE SHUT DOWN POINT FOR A PERFECTLY COMPETITIVE FIRM
This section provides an analysis of the short-run supply decisions of the perfectly
competitive firm.
7.5.1 The Short-run Supply Decision of the Perfectly Competitive Firm
If a firm shut down operation in the short-run, it will incur a loss equal to its total
fixed cost (TFC) because no variable cost will be incurred. Therefore, the perfectly
competitive firm will shut down and produce nothing at any price below which the
firm’s loss will exceed its total variable cost (TVC) to include a fraction of or all the
TFC.

NOTE: This is a work in progress. All topics in the syllabus are covered but editing for necessary corrections is in progress.
Thanks.
180
Figure 7.5: The Short-run Shutdown Point for the Firm in Perfect Competition
SMC
SAC
SAVC
P1 B
P1 A
0 Q1 Q2 Output
In Figure 7.5, the firm’s short-run supply curve is the short-run marginal cost (SMC) curve
above that point A, the shutdown point corresponding to the output level (Q1) and price (P1)
below which the firm cannot cover average variable costs (SAVC) in the short-run.
7.5.2 The Long-run Supply Decision of the Perfectly Competitive Firm
The long-run shutdown point for a perfectly competitive firm is the minimum point
on its long-run average total cost (LAC) curve such as point C in Figure 7.6

NOTE: This is a work in progress. All topics in the syllabus are covered but editing for necessary corrections is in progress.
Thanks.
181
Figure 7.6: The Long-run Shutdown Point for a Perfect Competition Firm
LMC
C LAC
P3
0 Q3 Output
In Figure 7.6, point C is the firm’s shutdown point corresponding to price (P3) and
output (Q3) below which the firm will not produce any output. The long-run supply
curve of the firm is given by the long-run marginal cost curve (LMC) above point C
(the minimum point on LAC)
7.6 ADVANTAGES AND DISADVANTAGES OF PERFECT COMPETITION
Advantages and disadvantages of perfect competition are highlighted in this
section
7.6.1 Advantages of Perfect Competition
(i) Goods are sold at the lowest possible price: The absence of barriers to entry
makes it possible for new firms to emerge when positive economic profits are
being recorded in the industry. As industry supply increases the price falls, to
the extent that it may be possible for the consumers to pay prices equal to
marginal cost of production.
(ii) Efficient Utilization of resources: Every firm being a price-taker strives to
minimize costs thereby making most efficient utilization of resources.
(iii) Sales promotion is less expensive: In perfect competition, products are
homogenous in the eyes of the consumers, therefore, expensive
advertisement or sales promotional strategy is avoided.

NOTE: This is a work in progress. All topics in the syllabus are covered but editing for necessary corrections is in progress.
Thanks.
182
(iv) Consumers enjoy and are better off in terms of consumer surplus.
7.6.2 Disadvantages of Perfect Competition
(i) Firms make little or no profits: The perfectly competitive firm is generally
small and makes little profit in the short-run. And in the long-run the firm
earns only normal profits.
(ii) Inventions and Innovations are not encouraged: The absence of barriers to
entry promotes technological theft which in turn, discourages inventions and
innovations. Therefore, there is no guarantee that resources are most
efficiently utilized.
(iii) Social costs are disregarded: The firm equates its private costs to its
marginal costs in determining its optimum output. This means that the social
costs resulting from negative externalities, especially environmental pollution
are not considered in determining the actual benefit of an output to the
society.
(iv) The problem of income inequality is worsened: In the long-run, some
entrepreneurs who have access to bigger financial capital will adopt cost-
saving technology, lower price and drive the smaller firms out of business.
SUMMARY AND CONCLUSION
In this chapter, we discussed the behaviours of firms in perfect competition. It should be
noted that firms that fit into perfect competition model are very rare in real-life situations.
The closer examples are found mostly in agriculture and extractive industries. Nevertheless,
the model of perfect competition provides a standard with which the actual performances
of firms in certain segments of our economy can be compared.
7.8 REVISION QUESTIONS
SECTION A: Multiple Choice Questions
1. The demand curve facing each firm in perfect competition is

NOTE: This is a work in progress. All topics in the syllabus are covered but editing for necessary corrections is in progress.
Thanks.
183
A. Perfectly price elastic
B. Perfectly price inelastic
C. Fairly price elastic
D. Fairly price inelastic
E. Unit-price elastic
2. Which of the following statements is true of the perfectly competitive firm?
A. Marginal revenue is less than its price
B. Marginal revenue is equal to its price
C. Marginal revenue is higher than its price
D. Marginal cost is equal to its total cost
E. Marginal cost is equal to its fixed cost
3. The short-run supply curve of the perfectly competitive firm is given by the
A. Average revenue curve
B. SAC curve
C. SMC curve above the minimum point of the AVC curve
D. SMC curve below the minimum point of the AVC curve
E. LAC curve above the minimum point of the AVC curve
4. Which of the following statements is/are true of the perfectly competitive firm?
I. A normal profit is made in short-run
II. A supernormal profit is made in the long-run
III. There is freedom of entry to and exit from the industry
A. I only
B. II only
C. III only
D. I and II only
E. I and III only
5. In perfect competition, the industry`s demand curve is
A. Horizontal
B. Downward sloping from the right

NOTE: This is a work in progress. All topics in the syllabus are covered but editing for necessary corrections is in progress.
Thanks.
184
C. Upward sloping from the left
D. Identical to the firm`s demand curve
E. Downward sloping from the left
Section A: Solutions to Multiple Choice Questions
CHAPTER SEVEN
1. A
2. B
3. C
4. C
5. E
SECTION B: Short-Answer Questions
1. A market structure that is characterized by large number of buyers and sellers is
……………………
2. The demand curve facing the firm in perfect competition is ………………..elastic
3. A perfect competitive firm makes abnormal profit in the short- run when its average
revenue exceeds its………………………
4. A firm in competitive market shuts down operations when its short-run average
variable cost exceeds its ………………………..
5. The short – run supply curve of the perfectly competitive firm is given by the
………………………
Solution To Short Answers Questions
CHAPTER SEVEN
1. Perfect competition/perfect market
2. Perfectly elastic
3. Average cost
4. Price or average revenue
5. SMC curve above the minimum point of the AVC curve

NOTE: This is a work in progress. All topics in the syllabus are covered but editing for necessary corrections is in progress.
Thanks.
185
CHAPTER EIGHT
PURE MONOPOLY
8.0 LEARNING OBJECTIVES
After Studying this chapter, you should be able to:
Identify the essential features of monopoly and sources of monopoly power.
Understand the short-run and long-run profit-maximizing positions of a monopolist.
Understand the concept of price discrimination and the conditions necessary
for it.
Compare the perfect competition and monopoly models.
8.1 INTRODUCTION
Monopoly is the exact opposite of perfect competition. Strictly defined, pure
monopoly is a market structure in which there is a single firm producing a commodity
or providing a service that has no close substitutes.
As the sole supplier to its market, the pure monopolist is assumed to have no current
competitors, and it is protected against the potential competition of new entrants into
market.
8.2 CHARACTERISTICS OF MONOPOLY
The main characteristic of monopoly can be classified into three:
a. One firm in the industry: A pure monopoly is an industry consisting of only
one firm. The monopoly firm’s demand curve is therefore the industry
demand curve and it slopes downward – i.e. it must lower price to sell a
greater amount of its product.
b. Barriers to entry: In order for a firm to maintain its monopoly position,
barriers exist to prevent the entry of new firm. Such barriers including control

NOTE: This is a work in progress. All topics in the syllabus are covered but editing for necessary corrections is in progress.
Thanks.
186
over the factors of production, legal protection, economies of scale and
consumer loyalty are the main sources of monopoly power.
c. Absence of supply curve: When deciding how much to produce and what
price to change, the monopolist simultaneously considers demand and cost.
The monopolist does not have a supply curve independent of demand
conditions contrasts to what obtains under perfect competition.
8.3 SOURCES OF MONOPOLY POWER
Any of the following factors may explain the emergence of monopoly firm:
(i) Control of the entire supply of a basic input: If the entire supply of
the basic raw materials required in the production of a commodity is
controlled by single firm, such a firm will monopolize the supply of
the product.
(ii) Economies of scale: A large firm may retain a monopoly power
through cost advantages gained from the use of cost-saving technology
which enables it to sell profitably at a lower price than could any small
competitor.
(iii) Franchises and patents: If a firm invents a machine or production
process after huge costs have been incurred on research and
development (R and D) efforts, the government may grant the firm
monopoly privilege in the form of exclusive license or patent i.e. legal
protection that make it illegal for new firms to produce exactly the
same type of machine. This is to encourage creativity in the economy.
(iv) State monopoly: The government may assume a monopoly power in
the production of some commodities or in the provision of some
services; either to prevent people from being exploited or to ensure
adequate supply of essential facilities which cannot be provided by
private entrepreneurs because of huge capital and high risk involved.
This is the case for public utilities, such as electricity, water, railway
transport service, etc.

NOTE: This is a work in progress. All topics in the syllabus are covered but editing for necessary corrections is in progress.
Thanks.
187
(v) Merger and acquisition: Large firms may merge to control the entire
market supply or a large firm may acquire (buy) smaller firms that can
no longer operate profitably to gain total control of the market supply.
(vi) Locational factor: Due to the size of an area, there might not be
incentive for investors to establish firms in the areas until one investor
takes the risk and remains the sole firm in the community enjoying the
monopoly power. This is the case for rural banking scheme in most
developing economies.
8.4 THE SHORT-RUN EQUILIBRIUM OF A MONOPOLY
The monopoly attains its profit-maximizing objective by following exactly the same
rule as the perfectly competitive firm – that is, adjusting its rate of production to the
point where marginal cost (MC) is equal to marginal revenue (MR)
FIGURE 8.1 Short-Run Profit maximizing position for a monopoly
SMC
SAC
DD
P1 C
SAC=A B D
0 Q1 Quantity of output
MR
Figure 8.1 illustrates the case of a monopoly firm that earns supernormal profit (i.e. positive
economic profits) in the short-run by producing output Q1 where SMC equals MR., since
price. (P1) is greater than short-run average cost (SAC). The area of the shaded rectangle P1
ABC gives the magnitude of monopolist`s profits.
8.5 THE LONG-RUN EQUILIBRIUMOF A MONOPOLY
pri
ce C
ost

NOTE: This is a work in progress. All topics in the syllabus are covered but editing for necessary corrections is in progress.
Thanks.
188
Under monopoly, barriers to entry allow profits to remain supernormal in the long
run. Therefore, in the long-run a monopoly firm will maximize profit by producing
where marginal revenue (MR) is equal to long-run marginal cost (LMC), as long as
price (P) is greater or equal to long-run average cost (LAC). It also follows that the
monopoly firm is not forced to operate at the minimum point on LAC curve, hence,
long run prices will tend to be higher and output lower, under monopoly than under
perfect competition, ceteris paribus.
FIGURE 8.2 Long-run profit-maximizing positions for a monopoly.
SMC LMC
LAC
DD
P1 C
LAC=A B D
0 Q1 Quantity of output
MR
In Figure 8.2, the monopoly firm`s supernormal profit is represented by the shaded rectangle
P1 ABC, while the price charged and the profit-maximizing output are given as P2 and Q2
respectively.
8.6 MONOPOLY PRICE DISCRIMINATION
A monopolist may be able to charge different prices to different customers, primarily
to increase its profits, if it can identify different types of customers whose demand
curves are quite distinct. According to Edwin Dolan (1980):
The conditions under which a monopolist will be able to discriminate profitably are
given as
Pri
ce C
ost
Price discrimination is the practice of charging more than one price for different units of a
single product, when the price differences are not justified by difference in the cost of
serving different customers.

NOTE: This is a work in progress. All topics in the syllabus are covered but editing for necessary corrections is in progress.
Thanks.
189
(a) The price elasticity of demand for the product must be different between
classes of buyers or in each market. This may be due to differences in income
level or in tastes. The firm will charge higher price in the market where
demand is less elastic to gain higher total revenue and profit.
(b) The firm must be able to segregate the different buyers according to their
elasticities of demand, and the cost of such segregation must not be too high as
to wipe off the intended profit of price discrimination.
(c) It must be impossible for some buyers to purchase the commodity at the lower
price and then resell it to others at the higher price.
The profit-maximizing output level of the price discriminating monopoly firm is the
output level where the marginal cost of its entire output is equal to the marginal
revenue in each market.
8.7 ADVANTAGES AND DISADVANTAGES OF MONOPOLY
The usual arguments for and against monopoly are presented in this section.
8.7.1 The Advantages of Monopoly
(i) No risk of over – production: As a sole producer, the firm knows the
quantity that consumers of its product will demand and therefore will
not produce in excess of demand.
(ii) Efficient and full use of resources: The monopoly firm can use its
equipments and machines to their full capacity to producing a large
quantity of its product based on the known market. The perfectly
competitive firm is not sure of its market share and therefore its
resources may be underutilized.
(iii) Monopoly helps to reduce price: Monopoly is associated with large
scale production and low average cost; therefore, the firm can afford to
sell at a lower price than the perfectly competitive firm.
(iv) Inventions and innovations: The monopolist is encouraged to invest
in research and development (R and D) efforts because of the barriers
to entry. There is a tendency for the firm to introduce a cheaper
technique, sell at a lower price or improve the quality of its products
for the benefit of the consumers.
8.7.2 The Disadvantages of Monopoly

NOTE: This is a work in progress. All topics in the syllabus are covered but editing for necessary corrections is in progress.
Thanks.
190
(i) Exploitation of the consumers: Consumers pay higher prices than what they
would have paid under perfect competition because there is no other place
they can access the product.
(ii) Consumer choice is restricted: The firm is the only producer in the market;
therefore buyers cannot choose from a wide range of identical goods as it is
the case under perfect competition.
(iii) Creation of Artificial Scarcity: Most often the typical monopolist tries to
reduce output in order to sell at higher prices and enhance its profit.
(iv) Inefficiency: The monopolist faces no challenge as a result of absence of
competition. In other words, there is no urge for the firm to adopt cost-saving
production technique for efficient use of its resources.
8.8 COMPARISON BETWEEN MONOPOLY AND PERFECT COMPETITION
In the perfect competition and monopoly, maximum profit is the primary objectives of
the firm and, the objective is attained at the output at the output level where M C =
MR. Despite some similarities, there are a number of important difference between
the perfect competition and monopoly models.
(i) Number of firms in the Industry: There is a very large number of small firms
(sellers) and buyers in perfect competition. Price is determined for the entire
industry by the forces of demand and supply, and each firm is a price – taker.
On the other hand, a pure monopoly is an industry with only one firm, and the
firm fixes the price for its production. It is therefore called a price setter.
(ii) Output and price: The perfectly competitive price is lower than the level of
output greater than the monopoly price and output, respectively.
(iii) Equilibrium conditions: Under perfectly competitive equilibrium MC = MR
= Price (AR) because MR and AR coincide and is a straight line parallel to the
quantity axis. Under monopoly, the AR curve slopes down to the left with
MR curve below it. They are at equilibrium when MC = MR < Price (AR).
(iv) Profit maximization positions in the long-run: In the long-run, the firm in
perfect competition will earn normal profit because the short-run supernormal
profits are competed away by the new firms that will enter the industry. On

NOTE: This is a work in progress. All topics in the syllabus are covered but editing for necessary corrections is in progress.
Thanks.
191
the contrary, the monopoly firm will always earn supernormal profits in the
long-run because there are barriers preventing entry of new firms and
competition.
8.9 SUMMARY AND CONCLUSIONS
This chapter examined the market structure that is generally regarded as the polar
opposite of perfect competition – i.e. the monopoly model.
Like the perfect competition model, the monopoly model is designed to be an extreme
case and it is rarely found in the real world. However, the model offers an important
benchmark against which to compare less extreme forms of monopoly power.
8.10 REVISION QUESTIONS
SECTION A: Multiple Choice Question
1. The main features of monopoly include,
I. One firm in the industry
II. Existence of barriers to entry by new firms
III. The supply curve is the marginal cost curve above the minimum point on the
average variable cost curve.
A. I only
B. II only
C. III only
D. I and II only
E. II and III only
2. The demand curve faced by a pure monopoly is
A. Downward sloping
B. Horizontal
C. Vertical
D. Unit-price elastic
E. Upward sloping
3. Which of the following statements best explains the argument that the monopoly firm
is less efficient that the perfectly competitive firm?
A. Output is at the point where MC = MR.
B. Output is lower than the point where average total cost is at a minimum.
C. Price is equal to MC at the point –maximizing output level.
D. The demand curve and marginal revenue curve coincide.

NOTE: This is a work in progress. All topics in the syllabus are covered but editing for necessary corrections is in progress.
Thanks.
192
E. The firm is receiving only a normal profit in the long-run.
4. The monopoly firm is in short-run equilibrium when
A. Price equals marginal cost
B. Price equals average cost
C. Price equals marginal revenue
D. Marginal cost equal marginal revenue
E. None of the above
5. The persistence of the supernormal profit of a monopoly in the long-run is as a result
of
A. Price discrimination
B. Price being lower than the LAC
C. Inability of new firm to enter the industry because of barriers to entry.
D. Diseconomies of scale
E. The downward sloping demand curve.
Section A: Solutions to Multiple Choice Questions
1. D
2. A
3. B
4. D
5. C
SECTION B: Short Answer Questions
1. A single firm that produces a commodity which has no close substitutes is a
……………………
2. The demand curve facing a monopoly is …………..sloping
3. A monopoly firm is in short –run equilibrium when……………………….
4. The practice of charging different prices to different customers at different times is
referred to as…………………………..
5. A monopolist earns supernormal profits in long run because of ……………………
Solution To Short Answers Questions
CHAPTER EIGHT
1. Pure monopolist
2. Downward

NOTE: This is a work in progress. All topics in the syllabus are covered but editing for necessary corrections is in progress.
Thanks.
193
3. MC=MR
4. Price discrimination
5. Barriers to entry
CHAPTER NINE
MONOPOLISTIC COMPETITION AND OLIGOPOLY
9.0 LEARNING OBJECTIVES
After studying this chapter, you should be able to:
Identify essential features of monopolistic competition and oligopoly.
Understand he short-run and long-run profit maximizing positions of a
monopolistically competitive firm.
Understand how the Kinked demand curve for the oligopolistic firm is
derived.
9.1 INTRODUCTION
In chapter 8, perfect competition and monopoly have been described as two
extreme kinds of market structure that are rarely found in practice. Monopolistic
competition and oligopoly lie between these two extremes reflecting the industries
of most firms in the real world.
Monopolistic competition describes a market or industry where there are large
numbers of firms producing (selling) products which consumers believe are close but
not perfect substitutes for each other.
On the other hand, Oligopoly refers to an industry or market with a few firm
producing (selling) products that are either homogeneous or differentiated. The
firms are so few that the action of one firm affects the decision of other firms in the
industry. Where the firms produce homogeneous products, it is called pure or
perfect Oligopoly and where they produce heterogeneous or differentiated products
it is called imperfect or differentiated oligopoly. Examples of oligopoly are found in
the few industries producing automobiles, cement, cigarettes, rubber tyres,
newspapers and so on.

NOTE: This is a work in progress. All topics in the syllabus are covered but editing for necessary corrections is in progress.
Thanks.
194
Duopoly is a special case of the theory of oligopoly. Duopoly is a market structure in
which only two firms constitute the industry – i.e. they produce the entire market
supply. A change in the price – output policy of one will affect the other, and may
elicit a chain of reactions.
9.2 CHARACTERISTICS OF MONOPOLISTIC COMPETITION
The following are the main features of monopolistic competition.
(a) Larger market of firms in the industry: There are many small firms each
supplying only a small share of the total market output. Hence, no firm has any
perceptible influence on the price and output decisions of other firms in the
industry.
(b) Product differentiation: The firms supply products are differentiated i.e.
similar but not identical. Therefore, each firm has some degree of market power,
especially some discretion as to what price to charge for its products.
(c) Freedom of entry and exit of firms: Barriers to entry are relatively small or
non-existent, and productive resources are highly mobile. Product differentiation
tends to facilitate the entry of new firms in the industry.
(d) Nature of demand curve: The demand curve for each firm’s product is
downward sloping and highly price elastic due to the large number of close
substitutes. Price must be lowered to sell a large quantity hence, MR curve also
slopes downward and falls below the demand curve.
9.3 SHORT-RUN EQUILIBRIUM UNDER MONOPOLISTIC COMPETITION
Equilibrium follows the same rule as in perfect competition and monopoly. That is,
to maximize its profits, the monopolistic competitive firm will adjust its rage of
production to the point where MC is equal to MR. Similarly, the firm will be shut
down completely in the short-run to minimize its losses, if it is unable to cover all of
its variable cost of production at any positive rate of output.
Price Cost
SMC
C SAC
P1
SAC = A

NOTE: This is a work in progress. All topics in the syllabus are covered but editing for necessary corrections is in progress.
Thanks.
195
Q1 MR Quantity of output
Figure 9.1 Short-Run Profit Maximizing Position of a Monopolistically
Competitive Firm.
SMC
P1
SAC=A B
0
Q1 MR Quantity of output
Figure 9.1 above shows that, in the short-run, the firm is earning supernormal profits
represented by the shaded rectangle P1ABC by charging price P1 and producing output Q1.
9.4 LONG-RUN EQUILIBRIUM UNDER MONOPOLISTIC COMPETITION
The supernormal profits earned in the short-term is competed away in the long-run
as a result of the entry of new firms that are producing close substitutes (as
experienced by firms under perfect competition). Eventually, the monopolistically
competitive firm will reach long-run equilibrium (profit-maximization) position
whereby it receives a price (P) that is equal to long-run average total cost (LAC), so
that it will be earning only a normal profit as illustrated in Figure 9.2
Figure 9.2: Long-Run Profit Maximizing Position of a Monopolistically Competitive Firm
LMC
D LAC
P1 C
C
Pri
ce C
ost
SAC
Pri
ce C
ost

NOTE: This is a work in progress. All topics in the syllabus are covered but editing for necessary corrections is in progress.
Thanks.
196
D
0 Q2 Quantity of output

NOTE: This is a work in progress. All topics in the syllabus are covered but editing for necessary corrections is in progress.
Thanks.
197
9.5 CHARACTERISTICS OF OLIGOPOLY
The following are the main features of oligopoly:
(a) Interdependence: There is mutual interdependence among the firms. That is,
the market share of one firm is significantly affected by the actions of one or
more of its rival firms, and this is recognized by each firm in the industry.
(b) Barrier to entry: There are substantial barriers to entry into the oligopolistic
industry. Such barriers include exclusive patents, control over essential inputs,
economies of scale, high capital requirements, plant cost, etc.
(c) Advertisement: As in monopolistic competition, oligopolistic firms also strive to
achieve product differentiation and higher proportion of the market share
through intensive advertisement.
(d) Identical or differentiated products: The firms in the oligopolistic industry may
produce either identical or differentiated products. Firms in the steel and
banking industries produce virtually identical products, whereas firms in the
automobile industry are characterized by differentiated products.
(e) Lack of uniformity: The firms in the industry differ considerably in size. The
industry is highly concentrated as a result of several kinds of barriers preventing
new firms from entering. Note that, a concentrated industry is an industry that
has a large percentage of its output produced by a few firms.
(f) Absence of unique pattern of pricing behaviour: The rivalry arising from
interdependence among the oligopolistic firms lead to two conflicting motives.
Each firm wants to remain independent as well as achieve maximum possible
profit.
9.6 THE BEHAVIOUR OF FIRMS UNDER OLIGOPOLY
There is no unique relationship between price and output of firms in an oligopolistic
industry. The demand curve for the product of an oligopolistic firm is therefore
derived from assumptions regarding the actions and reactions of competitors in
terms of a price review, or a new advertising campaign, or development of a new
product, and so on.
Based on the features of oligopoly identified in section 9.5, the oligopolist also faces
a downward sloping demand curve whose nature is dependent on competitor’s

NOTE: This is a work in progress. All topics in the syllabus are covered but editing for necessary corrections is in progress.
Thanks.
198
reaction to a price change, especially where products are similar. For instance, the
tendency for the oligopolist to be driven by self-interest towards stable prices is
discussed in the context of the kinked demand curve theory.
Figure 9.3 THE KINKED DEMAND CURVE
As shown in Figure 9.3, the oligopolistic firm believes rivals will match price cuts but not per
unit. If price is raised above P1 , the quantity sold i.e. demand will decrease by a greater
proportion (demand is price elastic) because rivals will not raise their prices. A price
reduction, however, would be matched by rivals, and the quantity sold would not increase
proportionally (demand is price inelastic). Hence, the oligopolist’s demand curve is kinked
at A, which in turn, produces a discontinuity in the MR curve between B and C.
The general presumption is that firms in an oligopoly market tend to charge higher prices
and produce a smaller total industry output than do firms in perfectly or monopolistic
competitive industries due to the existence of substantial barriers to entry by new firms. In
social welfare terms, this implies that there is underproduction and inefficient allocation of
resources.
Similarly, following the same assumption of barriers preventing new firms from entering the
market, the firms in an oligopoly are also able to earn economic profit in the long-run.

NOTE: This is a work in progress. All topics in the syllabus are covered but editing for necessary corrections is in progress.
Thanks.
199
9.7 MERGERS AND ACQUISITION
Merger and acquisition (M& A) is a general term used to refer to the consolidation of
companies. But specifically, a merger is the amalgamation of two or more firms to
form a new company. It is a voluntary union in which the parties involved hope for
the improvement of their current level of operations and profitability. On the other
hand, an acquisition is the purchase of one company by another in which no new
company is formed.
Under acquisition arrangement the first firm usually put in a takeover bid- offering to
buy the share of the second for cash, to swap them for shares in the acquiring
company, or to issue fixed interest securities (debentures). The shareholders of the
second firm then vote on whether or not to accept the offer (Sloman, 2003).
It has been generally observed that merger and acquisition transactions provide
companies with important mechanisms for adjusting to challenges and opportunities
in an ever changing business environment.
9.7.1 Types of Merger
There are three types of merger
a) Horizontal merger: This is the union of two or more firms in the same industry
and at the same stage of production. For example, two motor car
manufacturers could merge to produce one or variety of brands within the
same company.
b) Vertical merger: This refers to a merger of firms in the same industry but at
different stages of production of a good e.g. a car manufacturer with a car tyre
manufacturer. The two firms thus become one and the tyre produced is used
directly to achieve the output of a complete car.
c) Conglomerate merger: This occurs where firms in different industries merge.
For example, a furniture making company might merge with a soap
manufacturer to reverse declining demand trend. Once the merger has taken
place, the organisation so formed can reorganize to reduce costs. For
example, only one head office will now be needed, a process known as
rationalization.

NOTE: This is a work in progress. All topics in the syllabus are covered but editing for necessary corrections is in progress.
Thanks.
200
9.72 Merits of Merging
The merits of merging transactions include the following.
i. Merging promotes growth and exploitation of economies scale
ii. Merging companies often enjoy better credit worthiness and therefore better access
to investment funds.
iii. It promotes efficient management of resources as different experience are shared
and new ideas are introduced
iv. Increase profitability resulting from production expansion and cost reduction.
v. It facilitates efficient planning for long term development of the business.
The extent to which any merger transaction could be adjudged as successful depends on the
primary motive for it .The motives for merger identified by economists include for growth,
economies of scale, monopoly power, increased market valuation, reduction of uncertainty,
and to respond to opportunities that may suddenly and unexpectly arise.
9.8 SUMMARY AND CONCLUSION
This chapter discussed monopolistic competition and oligopoly. It was recognized
that most industries exhibit the features of monopolistic competition in real-life.
However, it must be pointed out that the formal theory of oligopoly to date has not
been conspicuously successful. The reason adduced is that it is very difficult to
determine precisely how firms will react to the price and output decisions of their
rivals.
9.9 REVISION QUESTIONS
SECTION A: Multiple Choice Questions
1. In the short-run, the profit-maximizing output of the firm in monopolistic
competition is at the point where
A. Price is equal to marginal cost
B. Price is above marginal cost
C. Price is equal to marginal revenue
D. price is below marginal cost
E. Price is equal to short-run average cost.

NOTE: This is a work in progress. All topics in the syllabus are covered but editing for necessary corrections is in progress.
Thanks.
201
2. Because its product is a close substitute for the products of its competitors,
the monopolistically competitive firm faces a
A. Highly price elastic demand curve
B. Perfectly price elastic demand curve
C. Fairly price inelastic demand curve
D. Perfectly price inelastic demand curve
E. Unit price elastic demand curve
3. The necessity for each firm to pay close attention to the behaviour and likely
reactions of its rival when planning its own market strategy is a characteristic
of
A. Perfect competition
B. Pure competition
C. Monopolistic competition
D. Oligopoly
E. Monopoly
4. Which of the following statements explains why the firms in an oligopoly are
able to earn economic profit in the long-run
A. The existence of a large number of firms in the industry.
B. The firms recognize their mutual interdependence.
C. A large percentage of the industry’s output is produced by a few
firms.
D. There are substantial barriers to entry into the industry.
E. Firms attempt to achieve product differentiation through advertising
5. Under what type of market structure does one expect to find a kinked demand
curve?
A. Perfect competition
B. Pure competition
C. Monopolistic competition
D. Monopoly
E. Oligopoly

NOTE: This is a work in progress. All topics in the syllabus are covered but editing for necessary corrections is in progress.
Thanks.
202
Section A: Solutions to Multiple Choice Questions
1. B
2. A
3. D
4. D
5. E
SECTION B: Short Answer Questions
1. A market characterized by large number of firms producing differentiated product is
called …………………….
2. A kinked demand curve is a feature of ……………….market structure
3. The shut-down condition for a monopolistic firm is when ………………………
4. The demand curve of a monopolistic firm is ………………….and highly
price……………………..
5. A profit maximization position of a monopolistic firm is when…………………….
Solution To Short Answers Questions
CHAPTER NINE
1. Monopolistic competition
2. Oligopoly
3. The price is less than AVC
4. Downward sloping/elastic
5. MC=MR

NOTE: This is a work in progress. All topics in the syllabus are covered but editing for necessary corrections is in progress.
Thanks.
203
CHAPTER TEN NATIONAL INCOME ACCOUNTING
10.0 LEARNING OBJECTIVES
After studying this chapter, you should be able to:
Explain what is meant by national accounting
Distinguish between flow and stock variable, finished and intermediate products
Explain the key accounting concepts via GDP, final goods, value added, current output,
market prices and factor cost.
Demonstrate that there are three approaches to measuring national income.
Explain the stages involved in the three approaches to measuring national income.
Identify uses and limitations of national income statistics.
10.1 WHY NATIONAL ACCOUNTING
At the personal level, we all keep records of certain activities. Business people keep records
of their activities in an accounting period. At the national level, countries, do keep records of
their activities within an accounting period. National income account is one of the many
records countries keep.
Every year, immeasurable productive activities take place in a country. These activities are
classified into three main sectors viz. primary, secondary and services sectors. To keep track
with and value these activities, countries calculate their national incomes. The aim therefore
of national income accounting is to place a money value on an economy’s yearly output.
From the exposition above, we can comfortably say that National Income is a term used to
measure the monetary value of the flow of output of good and services produced within the
economy over a period of time.
10.2 DEFINITION AND BASIC CONCEPTS
In the literature of Economics there are many definitions of national income. We will be
wrong to think that some of them are right and others are wrong. We quote a definition
from a United Nation’s publication – Measurement of National Income and the Construction of Social
Accounts.
The national income or product or expenditure provides a measure of total value at factor cost of final
goods and services, which are available either for consumption or for addition to wealth. This total is
NOTE: This is a work in progress. All topics in the syllabus are covered but editing for necessary corrections is in progress.
Thanks.
204
valued in terms of money and it is equivalent to the income accruing to the factors of production, i.e.
Land, Labour, Capital and Enterprise.
The definition above shows that there are definitions of national income. The
definition given will depend on whether you are defining the concept from the
income or expenditure or the product side.
10.3 BASIC CONCEPTS OF NATIOANL INCOME
Understanding the basic concepts will help us to comprehend the terminologies
used in the system of national income accounting. This prepares us for the
accounting processes.
(a) Stock and Flow Variables: Stock variable is a variable measured at a point in time or at the
end of a period. A flow variable is measured over a period of time. National income is
calculated for an accounting period (an interval) hence it is calculate das a flow variable.
(b) Gross Domestic Product (GDP): It measures the total monetary value of goods and services
produced within the domestic boundaries of a country e.g. Ghana for an accounting period.
It includes all the goods and services produced by foreign owned firms that are located in
the country e.g. Nigeria for the accounting period.
(c) Nominal GDP: This is the monetary value of total goods and services produced in an
accounting period valued at the market prices of that period. For example GDP for 2005
measured the value of goods and services produces in 2005 at market prices that prevailed
in 2005.
(d) Real GDP: It measures the value of total goods and service at constant prices. This means
hold prices constant between periods. For example, real GDP for 2005 valued in prices of
2004.
(e) Final Goods: These are goods which are purchased for final use not for resale or further
processing. If a household bought sugar for its beverages this is final consumption. In
national income accounting we insist on final goods to avoid multiple counting of product or
expenditure.
(f) Valued Added: This is the extra worth that a firm or a producer adds to a product in the
course of its production. If a sugar processing firm purchases sugar canes worth c2 million

NOTE: This is a work in progress. All topics in the syllabus are covered but editing for necessary corrections is in progress.
Thanks.
205
and processes it into refined sugar worth c2.5 million the value added to the sugar canes in
this case is c500.000. The value added is the difference between the gross value of a product
and the raw materials that have gone into its production.
(g) Current Output: In national income accounting language, current output means output
produced within a defined accounting period. Current output for 2005 means all output
produced in 2005 whether sold in 2005 or not.
(h) Ex-post and Ex-ante Variables: Ex post variables measure what actually happened. On the
other hand ex ante variable measures what is intended to happen. In national income
accounting we are interested in actual production of goods and services for an accounting
period not what is expected to be produced for that accounting period. Therefore, in
national income accounting we use expost variables.
(i) Market prices: These are the prices that we pay for goods and services. These prices are
affected mainly by indirect taxes and subsidies. These effects do not make market prices to
reflect the through factor cost of goods and services. Indirect taxes imposed on goods make
their prices to be higher than they should have been. Conversely, subsidies paid to
producers will make market prices lower than they should have been. Simply market prices
do not show the true factor cost of production.
(j) Factor Cost: This is also referred to as the net price. The factor cost is the market price of a
product minus indirect taxes plus subsidies.
10.4 METHODS OF COMPUTING NATIONAL INCOME
There are three (3) methods used in computing national income: These are Income Method,
THE PRODUCT/OUTPUT Method and the Expenditure Method. The reason for this is shown
by the two sector circular flow of income below.
Basic Assumption:
(i) The economy has sectors – household sector and business
Sector.
(ii) The role of savings and investment is not captured.

NOTE: This is a work in progress. All topics in the syllabus are covered but editing for necessary corrections is in progress.
Thanks.
206
(iii) The government and the foreign sectors are also not represented.
Figure 10.1
The Circular flow of income
The diagram (Fig 10.1) shows Real Flow (goods and services) and Monetary flow (Income and
expenditure).
The bottom pair of arrows depicts the goods market. In this market, households exchange money for
the goods and services produced by the firms. The total value of these goods and services estimates
national income from the product/output side. The other arrow shows the expenditure approach.
The summation of these expenditures represents the expenditure approach.)
The top pair arrows represent the factor market in which the firms exchange money for the services
provided by the households, that is , wages – payments for labour services, interest for capital, rent
for land and profit for enterprise. This look at national income represents the incomes earned by
factors of production for producing the economy’s goods and services.
The circular flow diagram shows that national income may be measured by final output or product
(Product or Output Method), final incomes (Income Method) and final expenditure (Expenditure
Method)
Factor Services
FIRMS HOUSEHOLDS
Factor incomes (Income
Approach)
Expenditure Goods &
Services (Exp. Approach)
S
Goods and Services (Output Approach)
Factor Services
FIRMS HOUSEHOLDS
Factor incomes (Income
Approach)
Expenditure Goods &
Services (Exp. Approach)
S
Goods and Services (Output Approach)
Factor Services
FIRMS HOUSEHOLDS
Factor incomes (Income
Approach)
Expenditure Goods &
Services (Exp. Approach)
S
Goods and Services (Output Approach)

NOTE: This is a work in progress. All topics in the syllabus are covered but editing for necessary corrections is in progress.
Thanks.
207
The diagram gives us the basic national income identity: National Income = National Product=
National Expenditure. This identity means that actual incomes received in the economy are identical
to both actual expenditure and actual output or product produced in the economy.
We must also emphasize here that in accounting for national income, we use ex-post (what actually
happened in the economy) not ex-ante (what people wish or intend to happen).
(a) The product Method
Under this method the value of all goods and Services in a given economy during a particular
period e.g. a year are added or aggregated
The first stage in the aggregation process is to determine the value of goods and services
produced within the geographical boundaries of a country known as Gross Domestic product at
market prices (GDP). GDP is calculated by summing the values added at intermediate levels of
production or the monetary value of all final goods and services in a particular accounting period
within a country. Market prices are used to convert real values of goods and service to their
monetary values.
The addition of the relevant monetary values of goods and services produced during the
accounting period gives GDP.
GDP measures the value of goods and services produced within the domestic boundaries of a
country e.g. Ghana. It includes goods and services of foreign owned firms that are located in
Ghana.
The second stage is to determine GDP at factor cost . Market prices are used to convert real
values into monetary values to arrive at GDP. These values are distorted because of indirect
taxes and subsidies and do not reflect the factor cost of output. To adjust for these effects,
indirect taxes are subtracted and subside added to GDP to arrive at GDP factor cost.
GDP at factor cost = GDP – indirect taxes + subsidies
The third stage in using the product method is to calculate the gross national product at factor
prices (GNP). GNP measures the final monetary value of goods and services produced by
Nigerian owned factors of production whether they are located in Nigerian or overseas. For
example, Nigeria’s GDP will include the services of Chevron, a foreign owned communication
giant. But some of the profit made by Chevron in Nigeria will be sent to South Africa and will be
part of South Africa’s GNP. This is so because Chevron is owned by Oil consortium in Belgium.
Therefore,

NOTE: This is a work in progress. All topics in the syllabus are covered but editing for necessary corrections is in progress.
Thanks.
208
GNP = GDP± Net property income (NPI)
NPI is the net difference of interest, profits and dividends coming into the Ghana from Ghanaian
assets owned overseas matched against the flow of profits and other incomes from foreign
owned assets located within the Ghana.
Finally, we calculate the net national product. When capital stock is used to produce goods and
services they wear and tear. To account for wear and tear depreciation is provided for. When
depreciation is subtracted from GNP, we obtain net national product at (NNP), which is identical
to national income.
(b) The Income Method
This method values GDP as the sum of final incomes earned by factors of production located
in a country for the production of goods and services for a defined accounting period.
The first stage under the income method is to determine and sum up factor incomes. We
account for only factor incomes generated through the production of goods and services.
Some of these incomes are wages, salaries, commissions, etc. before taxes, social security
and pension deductions which accrue to labour; rent, royalties, etc. which accrue to land;
interest and dividends which are earned by capital and profits of private and public
businesses which accrue to enterprise.
We therefore, exclude from the accounts transfer payments e.g. state pension, private
transfer of money from one individual to another.
The summation of these relevant incomes before taxes and other deductions gives gross
domestic income at factor cost (GDYf).
The next stage is to calculate gross national income at factor cost (GNYf). This is done by
subtracting or adding net property income (NPI) to GDYf. That is GNYf =GDYf ±NPI
Finally we determine the net national income. This is done by subtracting depreciation from
the GNYF . this is what is referred to as national income.
(c) The Expenditure method
Under the expenditure method GDP is the sum of the final expenditure on goods and
services produced in a country measured at market prices. There are four main spending
sectors: Household consumption (C), Firms (l), Government (G) and Foreign sector (X-M).
Symbolically, GDP = C+1+G+(X-M)
Where:

NOTE: This is a work in progress. All topics in the syllabus are covered but editing for necessary corrections is in progress.
Thanks.
209
C = Household spending on consumption i.e. personal consumption expenditure. This is
made up of expenditure by households on durable and non-durable goods and services, for
example, household expenditure on plantain, cars, shoes, etc
I = Capital investment spending measured as gross private domestic Investment, i.e.
business fixed investment e.g. plant and machinery, all construction such as business and
residential buildings and changes in inventory.
G = General government spending i.e. government purchases of final goods and services.
They consist of central government expenditure on defence, wages and salaries of
government employees and other expenditure on and by local authority. However, it
excludes all government transfer payments because such outlays do not reflect any current
production.
(X-M) = Net exports: - these consist of exports of goods and services minus imports of goods
and services.
Having identified the spending sectors we now begin to sum them up. The first stage is to calculate
total spending in the domestic economy on all goods and service whether produced locally or
imported for an accounting period. This is referred to as Total Domestic Expenditure at market
prices (TDE). That is, TDE = C+I+G.
The second stage is to compute gross domestic expenditure (GDE) which is identical to GDP. GDE
which is identically to GDE is total spending on domestically produced goods and services. Since TDE
is total spending in a country on goods and services whether produced in the country or imported
we need to adjust the TDE to arrive at GDE. There two adjustments:
a. Exports are goods produced within the domestic economy but exported. If we are interested
in total value of output which is GDE we must determine the value of current output
exported and add it to TDE.
b. Imports, on the other hand, are goods and services we spent money on but are not
produced within the domestic economy and must be subtracted from TDE to have GDE.
Symbolically, GDE = C+I+G+(X-M)
GDE is calculated using market prices hence it must be converted to factor cost. This is done by
subtracting indirect taxes and adding subsidies to GDE at market prices.
From GDE at factor cost, we add or subtract net property income (NPI) to obtain GNE at factor. That
is GNE at factor cost = GDE at factor cost ± NPI.

NOTE: This is a work in progress. All topics in the syllabus are covered but editing for necessary corrections is in progress.
Thanks.
210
Finally, we subtract depreciation from GNE at factor cost to get NNE at factor cost which is referred
to as national income.
10.5 PROBLEM OF MEASURING NATIONAL INCOME
(i) Multiple or double counting: this has to do with intermediate goods, intermediate
expenditure and transfer payment. There is the likelihood of valuing, for example, cassava
and gari, counting expenditure on suiting material as well as the suit and counting incomes
earned not for productive activities (transfer payments). If this happens, the value of total
output will be grossly exaggerated. This problem is avoided to a very large degree by taking
note of only the value added or final expenditure and excluding transfer payments.
(ii) Marketability of goods:- National income is the money value of goods and services produced
in a given period. A problem arises in connection with goods and services that are not
exchanged through the market. This problem is solved to some extent by including goods
and services that do not enter the market. Conventionally, items that do not enter the
market are included. (a) Rent is imputed to owner occupied houses. (b) Value is also
imputed to food produced and consumed on the farm. (c) Housewives’
Services are excluded but services of maid – servants and washer-men are included.
(iii) Depreciation:- Capital stock wears and tears when used to produce goods or to render
services. We account for this as depreciation or capital allowance. To arrive at GNP
depreciation is subtracted from GNP. The problem here is how to accurately estimate
depreciation. If the value of depreciation is over estimated or under estimated national
will be invariable affected.
(iv) Inadequate statistical data:- One basic problem of estimating national income is the lack
statistical data. This problem is more pronounced in developing countries like Ghana and
Nigeria. Individuals, business firms and the government at times do not keep proper
records of incomes, output and expenditure. Government departments with the
responsibilities to collect and collate vital statistical data do not keep up-to-date records.
For example in Ghana because of lack of data on income the income method is not used
in estimating national income.
(v) Price Level Changes: National income is measured in terms of money whose value
changes from time to time. It is therefore, difficult to make a stable valuation of national
income. This problem is dealt with by expressing national income estimates in real terms
in constant prices.

NOTE: This is a work in progress. All topics in the syllabus are covered but editing for necessary corrections is in progress.
Thanks.
211
(vi) National income records legal incomes or goods and services. This means illegal incomes
are excluded. This may pose a practical problem to the national income accountants
since some illegal incomes may find their way into the national income.

NOTE: This is a work in progress. All topics in the syllabus are covered but editing for necessary corrections is in progress.
Thanks.
212
10.6 USE OF NATIONAL INCOME ESTIMATES
(i) Indices of Economic Welfare: National income estimates particularly the per capital income
is a very useful indicator of economic welfare. Per capital income in real terms gives a rough
idea about the economic welfare of people in a country.
(ii) Use for Economic planning: National income estimates are used to determine the savings
and investment potential rate of economic growth of a country. To plan for an increase in
the national income, current levels of national income must be known. This information is
provided if we calculate income estimates.
(iii) Helps policy makers to understand the economic structure of a country: The product
approach provides detailed information on the contributions of the various sectors and sub-
sectors of the economy. Data provided by the expenditure approach gives an idea about the
proportion of income invested, consumed or transferred. Finally, data provided by the
income approach provides information on functional distribution of income, which is useful
for income tax policies.
(iv) Used to approximate the potential demand: Per Capital Income data is used to estimate
demand for various commodities. This is a very useful piece of information for potential
investors. An investor will be interested in per capital income because generally the higher
the per capital income, all other things being equal, the higher will be the demand for goods
and services.
(v) National income estimates are used to determine the subscriptions of nations to
international bodies e.g. IMF, IBRD, UN, ECOWAS etc to which they belong.
(vi) National Income estimates are also useful as a basis for inter-temporal and international
comparison of living standards. These estimates make it possible for comparison of standard
of living of two or more countries. In this respect, the per capital income in real terms is
normally used. In addition, the performance of an economy after a planned period can be
ascertained by comparing the size of the national income before the plan with the national
income after the implementation of the plan. This is known as inter-temporal comparison.
The national income statistics of different countries can be compared. This type of
comparison is called the international comparison.
10.7 SUMMARY AND CONCLUSION
The national income or product or expenditure provides a measure of total value at factor cost of
final goods and services, which are available either for consumption or for addition to wealth.

NOTE: This is a work in progress. All topics in the syllabus are covered but editing for necessary corrections is in progress.
Thanks.
213
GDP is the monetary value of final goods and services produced in an economy (for example within
the four walls of Ghana) in a given time period, say one year.
National Income estimates are very useful to economists, policy makers, business people and
investors. However, some problems are faced in accounting for national income.
10.8 REVISION QUESTIONS
Multiple Choice Questions
CHAPTER TEN
1. Which of the following expressions best describes the GDP at factor cost?
A. GDP – subsidies + indirect taxes
B. GDP – Indirect taxes + subsidies
C. GDP + Indirect taxes + subsidies
D. Indirect taxes + Subsidies – GDP
E. Subsidies – indirect taxes + GDP
2. Using the income method of computing the National Income of a country, which of the
following are excluded?
A. Value added
B. Net wages
C. Transfer payments
D. Interest and dividends earned
E. Final values of goods
3. Which of the following measures the value of goods and services produced within a
given country for a given year?
A. GNP
B. NNP
C. NNI
D. Per Capita Income
E. GDP
4. The following are problems associated with National Income computation except:
A. Changes in price level
B. Depreciation
C. Double counting
D. Adequate statistical data
E. Illegal incomes
5. In a two-sector circular flow model, the factor services are provided by the
A. Firms and households
B. Households
C. Firms
D. Government
E. Foreign nations

NOTE: This is a work in progress. All topics in the syllabus are covered but editing for necessary corrections is in progress.
Thanks.
214
Solution To Multiple Choice Questions
CHAPTER TEN
1. B
2. C
3. E
4. D
5. B
Short Answer Questions
1. The monetary value of total goods and services in an economy during a year at the
prevailing market prices is called………………………
2. The difference between the gross value of a product and the raw materials used for
its production is described as the …………………..
3. Gross National expenditure less depreciation gives………………………..
4. The conventional identity of national income equilibrium of an open economy under
the expenditure approach is ……………………..
5. Payments made not in return for any contribution to current output are
called……………………
Solution To Short Answers Questions
CHAPTER TEN
1. Nominal GDP
2. Value added
3. Net National Expenditure
4. Y= C+I+G+(X-M)
5. Transfer payments
Question 10.1
(a) Explain the concept of Gross Domestic Product (GDP)
(b) How is Real Gross Domestic Product different from real Gross National Product
Answer
a) GDP measures the total monetary value of goods and services produced within the domestic
boundaries of a country e.g. Ghana for an accounting period. It includes all the goods and
services produced by foreign owned firms that are located in the country e.g. Ghana for the
accounting period.

NOTE: This is a work in progress. All topics in the syllabus are covered but editing for necessary corrections is in progress.
Thanks.
215
b) GNP measures the final monetary value of goods and services produced by citizens whether
they are located in the country or overseas. For example, Ghana’s GDP will include the
services of Areeba a foreign owned communication giant. But some of the profit made by
Areeba in Ghana will be sent to South Africa and will be part of South Africa’s GNP. This is so
because Areeba is owned by MTN South Africa.
Question 10.2
a) Define Gross Domestic Product at market prices.
b) Show how the Gross Domestic Product (GDP) at market prices is computed.
c) What is the economic merit of using the value added approach in computing the GDP?
Answer
a) GDP measures the total monetary value of goods and services produced within the
domestic boundaries of a country e.g. Ghana for an accounting period. It includes all the
goods and services produced by foreign owned firms that are located in the country e.g.
Ghana for the accounting period.
b) The first stage, GDP is calculated by summing the values added at intermediate levels of
production or the monetary value of all final goods and services in a particular
accounting period within a country. Market prices are used to convert real values of
goods and services to their monetary values.The addition of the relevant monetary
values of goods and services produced during the accounting period gives GDP.
The second stage is to determine GDP at factor cost. Market prices are used to convert
real values into monetary values to arrive at GDP. These values are distorted because of
indirect taxes and subsidies and do not reflect the factor cost of output. To adjust for
these effects, indirect taxes are subtracted and subsidies added to GDP to arrive at GDP
at factor cost.
GDP at factor cost = GDP – indirect taxes + subsidies
Question 10.3
a) Explain why Gross domestic Product is identical to Gross Domestic Expenditure and
Gross Domestic Income.
b) What is the importance of this national income identity in (a) to national income
statiscians?

NOTE: This is a work in progress. All topics in the syllabus are covered but editing for necessary corrections is in progress.
Thanks.
216
Answer
a) There are three (3) methods used in computing national income: These are the
Income Method, the Product /Output Method and the Expenditure Method. The
reason for this is shown by the two sector circular flow of income below.
Basic Assumptions:
1. The economy has two sectors – household sector and business sector.
2. The role of savings investment is not captured.
3. The government and the foreign sectors are also not represented.
The Circular Flow of Income
The diagram shows Real Flow (goods and services) and Monetary Flow (Income and expenditure).
The bottom pair of arrows depicts the goods market. In this market, households exchange money for
the goods and services estimates national income from the product/output side. The other arrow
shows the expenditure approach. The summation of these expenditures represents the expenditure
approach).
The top pair of arrows represents the factor market in which the firms exchange money for services
provided by the households, that is, wages-payment for labour services, interest for capital, rent for
land and profit for enterprise. This look at national income represents the incomes earned by factors
of production for producing the economy’s goods and services.
Factor Services
FIRMS
HOUSEHOLDS
Factors incomes (Income
Appraoch)
Expenditure on Goods &
Services (Exp. Approach)
Goods and Services (Output Approach)

NOTE: This is a work in progress. All topics in the syllabus are covered but editing for necessary corrections is in progress.
Thanks.
217
The circular flow diagram shows that national income may be measured by final output or product
(Product or Output Method), final incomes (Income Method) and final expenditure (Expenditure
Method)
The diagram gives us the basis national income identity: National Income National Product
National Expenditure. This identity means that actual incomes received in the economy are identity
to both actual expenditure and actual output or product produced in the economy.
The importance of this identity, is that it allows national income statisticians to decide on the best
method to use for the estimation of a country’s national income. Having taken into account the
strengths and the weaknesses of the three approaches as well as the conditions prevailing in and
specific to the country the statistician decides on which method(s) to use.
Question 10.4
a) Define National Income.
b) State and explain three (3) uses of national income statistics.
c) Identify and explain three (3) problems relating to national income estimation.
Answer
a) National Income is the total income that accrues to the inhabitants or normal residents of a
country for participating in economic activities within a year.
b) Any three (3) of uses of national income statistics.
- It helps to organize economic data and activities.
- It helps to classify economic activities into various segments or sectors.
- It helps to keep track of total production within the macro economy.
- It helps to determine the economic performance of a country.
- It helps in policy formulation and implementation etc.
c)
i. Changing prices of goods and services. Prices of goods and services do change from one
period to another. This makes comparison of national income estimates from year to year
difficult because the yearly estimates are in current prices of the various years (nominal
terms)
ii Multiple or double counting: This is the problem of intermediate goods, intermediate
expenditure and transfer payments. There is the likelihood of valuing, for example, both the

NOTE: This is a work in progress. All topics in the syllabus are covered but editing for necessary corrections is in progress.
Thanks.
218
corn and kenkey, counting expenditure on shoes as well as the leather that was used in
making them and counting incomes earned not for productive activities (transfer payments)
iii.) Marketability of goods:- Since national income is the money value of goods and services
produced in a given period, the problem arises in connection with goods and services that
are not exchanged through the market.
iv.) Depreciation: - when capital is used in production, it wears and tears. To account for this,
capital allowance must be deducted from the GNP to arrive at the NNP. A problem arises of
accurately estimating depreciation. If care is not taken, national income will be
overestimated or underestimated.
v.) Inadequate statistical data: - one basic problem of estimating national income is the lack
of statistical data. Individuals, as well as the businessmen, do not keep proper records of
incomes, output, expenditure, etc. this stems from the
Question 10.5
Explain the meaning of the following terms as used under national income accounting:
i. Final goods
ii. Value added
iii. Current output
iv. Factor Cost
Answer
Final Goods: Final goods are goods and services which are being purchased for final use and
not for resale or further processing or manufacturing.
Value Added: It is the extra worth that a firm or a producer adds to a product in the course
of its production. If a gari processing firm purchases cassava for hundred thousand cedis and
later turns it into gari which is sold or valued at hundred and fifty thousand cedis, then, the
value added is fifty thousand cedis (i.e. 150,000 - 100,000 = 50,000).
Current Output: It refers to goods and services produced in the accounting period. This is so
because under national income we are accounting for output within a defined time or
accounting period say for 1st January 2000 to 31st December 2000.

NOTE: This is a work in progress. All topics in the syllabus are covered but editing for necessary corrections is in progress.
Thanks.
219
Factor Cost: The net price, that is, the market price minus indirect taxes or plus subsidies, is
the factor cost, which is the amount received by the factors of production in that productive
activity.

NOTE: This is a work in progress. All topics in the syllabus are covered but editing for necessary corrections is in progress.
Thanks.
220
CHAPTER ELEVEN
NATIONAL INCOME DETERMINATION
11.0 LEARNING OBJECTIVES
At studying this chapter, you should be able to
Explain the concept of aggregate expenditure.
Define and explain the propensities to consume and save.
Identify and explain four determinants of consumption expenditure
Distinguish between investment as a component of aggregate expenditure and
investment used in the ordinary sense.
Explain at least two factors each that determine investment, government
expenditure and net exports.
Explain at least two factors each that determine investment, government
expenditure and net exports.
Explain the processes of determining equilibrium national income.
Explain factors that cause equilibrium national income to change over time.
Explain the role of multipliers in the Keynesian employment theory.
Distinguish between inflationary and recessionary gaps.
Explain the rudiments of the accelerator theory of the demand for investment.
Calculate equilibrium national income and the multiplier given a simple structural
equation.
11.1 INTRODUCTION
Under Chapter 11 we accounted for total production of goods and services which we
dubbed national income accounting. This chapter will take us through the
determinants of national income. A little bit of history is needed for thorough
understanding.
Classical Economics is the school of economics thought before the appearance of
Keynes’ work, propounded by Adam Smith in 1776. This school believed that
individual self-interest and competition determine prices and factor rewards. They

NOTE: This is a work in progress. All topics in the syllabus are covered but editing for necessary corrections is in progress.
Thanks.
221
argued that the price system is the most efficient device for resource allocation. The
classical macroeconomic theory is rooted on Say’s Law of markets. According to
Say’s Law, supply creates its own demand as prices move to balance demand with
aggregate supply. In effect the Classicals believed that supply (aggregate
production) determines national income and full employment is assured. In the
1930s this way of thinking ran into problems. This led to the Keynesian economics.
Keynesian Economics is the body of economics thought developed by John Maynard
Keynes who held the view that a capitalist system did not automatically tend
towards full employment equilibrium. Keynes believed that the resulting under
employment equilibrium could be cured by fiscal or monetary policies to raise
aggregate demand. According to Keynes aggregate production or national income is
determined by aggregate expenditure i.e. total planned spending by all sectors of
the economy.
11.2 FACTORS DETERMINING THE SIZE OF NATIONAL INCOME
The size of a nation’s national income is determined primarily by the size of its
planned aggregate expenditure.
(a) Planned Aggregate Expenditure (AE) or Y: This is planned total spending in
an economy on domestically produced goods and services within a specified
period of time. It is determined as the sum of planned spending by all sectors
of the macro economy represented as households (C), firms (I), government
(G), exports (X) and imports (M).
(b) Models of Aggregate Expenditure:
i. A closed economy without government: This also referred to as a two
sector economy made up of households and firms. In this economy
Y=AE = C + I.
ii. A closed economy with government. This is made up of households,
firms and government. Aggregate expenditure is the sum of C, I and
G. i.e. Y = C + I + G

NOTE: This is a work in progress. All topics in the syllabus are covered but editing for necessary corrections is in progress.
Thanks.
222
iii. An open economy: This is made up of households, firms, government
and the foreign sector (X-M) i.e. Y = AE = Y + I + G + (X –M)
11.3 COMPONENTS OF AGGREGATE EXPENDITURE (REVISED)
(a) Consumption Expenditure and Consumption Function
i. Planned Consumption Expenditure (C) is made up of planned
expenditure by households on durable and non-durable goods and
services, for example, household expenditure on plantain, cars, shoes,
etc.
ii. Consumption Function: it is the functional relationship between
consumption expenditure and disposable income. We will define
disposal income as gross income minus tax. For the simplest
consumption function, there are two arguments – non income
induced consumption disposable income is the main determinant of
the level of consumption: This function is
C = a+bYd a>0,:0<b<1
Where C = Consumption expenditure;
Yd = Disposable income and
The consumption function in this form is a linear function (a straight line) and
it is interpreted as follows:
“a” measures consumption expenditure when income is zero (0). This
is called autonomous consumption. It is independent of the level of
disposable income.
“bYd” is income induced consumption expenditure. This is the
proportion of consumption expenditure that is dependent on the
level of disposable income.
“b” measures the extent of a change in consumption expenditure
with respect to a change in disposable income. It is the slope of the

NOTE: This is a work in progress. All topics in the syllabus are covered but editing for necessary corrections is in progress.
Thanks.
223
consumption function. It is called the marginal propensity to consume
(MPC).
Figure 11.1: Consumption Function
Expenditure (C) C = a + bYd
∆C
a ∆Yd 0 Disposable Income (Yd)
Figure 11.1 depicts the consumption function. “a” is non-income induced consumption
expenditure or the autonomous consumption expenditure and the line marked C=abbey is
the consumption function. The slope of the consumption function is ∆C/∆Yd and is equal to
“b”
b) SAVING AND THE SAVING FUNCTION
i. Saving:- This is part of disposable income not consumed. It is disposal income less
consumption proportion. This is calculated as S = Yd – C where ‘S’ is saving, Yd
(disposal income) and C (consumption expenditure).
ii. The Saving Function is also a functional relationship between saving and disposable
income. The saving function complements the consumption function because
disposable income is either consumed or saved. There are two main components of
the saving function viz autonomous saving and income induced saving. Below is the
saving function that complements the consumption function specified above.
S = -a + (1-b) -a<0; (1 – b)<1
This equation is explained as follows:
“a” is the non income induced saving or autonomous saving, that is, saving at zero level of
disposal income (dis-saving).
“(1-b)” is the marginal propensity to save (MPS).

NOTE: This is a work in progress. All topics in the syllabus are covered but editing for necessary corrections is in progress.
Thanks.
224
“(I-b) Yd” is the income induced saving.

NOTE: This is a work in progress. All topics in the syllabus are covered but editing for necessary corrections is in progress.
Thanks.
225
Figure 11.2: The Saving Function
Saving S =-a + (I – b)Yd
S
Yd
0 Disposable Income -a
Figure 11.2 shows the saving function. The line labeled S = -a + (1 –b) Yd is the saving
function.
This function relates saving to the level of disposable income.
(c) Determinants of Consumption and Saving
i. The level of disposable income: The level of income is the basic determinant of how
much households will consume or save. An increase in disposable income will
increase consumption expenditure/saving and vice versa.
ii. Stock of durable goods on hand: In an economy, the stock of durable goods on hand
determines the amount of current consumption. If consumers in an economy find
themselves well supplied with various durable goods, e.g. cars, televisions, etc. all
worthy of years of service then the current level of consumption may fall. This is
because many households will be out of the market for such products with the result
that consumers will be willing to spend less and save more at each level of
disposable income.
iii. Wealth: This refers to the stock of accumulated purchasing power stored up from
the past. For example, savings done in the past can be used to finance current
consumption. The higher an economy’s wealth, all other things being equal the
higher will be current consumption.

NOTE: This is a work in progress. All topics in the syllabus are covered but editing for necessary corrections is in progress.
Thanks.
226
iv. Expectations: Households’ anticipation regarding future prices of goods, their
nominal income and the availability of goods may have an impact on their current
spending. Anticipation of rising prices and product shortages tend to cause more
spending and less saving.
v. Total household indebtedness: Debts are paid with current income. If in an
economy total household debts are huge there is the likelihood that current level of
consumption expenditure and saving will be low and vice versa.
vi. Level of prices: In an economy, the higher the level of prices the lower the volume of
savings.
(d) Planned Investment Spending
Planned Investment in this context is defined as planned spending devoted toward
increasing or maintaining the stock of capital. Planned Investment as defined here
does not include planned buying a bond, purchasing stocks, creating deposits in
banks, etc.
There are three kinds of investment
i. Housing construction (residential and business)
ii. Purchasing of machinery and
iii. Additions to a firm’s inventory of goods
For the sake of simplicity we will assume that investment as used here is autonomous,
meaning it does not depend on aggregate income. However, there are two main
determinants viz.
Anticipated Rate of Return: Businesses invest because of profit. This implies that
investment spending is based on profit motive; the business sector buys capital
goods only when anticipates such purchases to be profitable.
The real interest rate: Business firms at times borrow funds for investment. These
borrowed funds are repaid out of future revenues. The annual opportunity cost of
using a Naira to make an investment is represented by the real interest rate. Thus,

NOTE: This is a work in progress. All topics in the syllabus are covered but editing for necessary corrections is in progress.
Thanks.
227
the higher the real rate of interest, the less will be the profits to the business after
paying interest and the less it will want to invest and vice versa.
Figure 11.3: The Investment Function
Investment i1
2000 io i2
0 Y1 Y2 Real Income 0 I1 I2
Figure 11.3 shows that the level of investment spending is autonomous, i.e it remains at the
same level irrespective of income levels. Suppose I0 = 2000. At Y1 and Y2, Io remains at 2000.
This means that investment spending is independent of income changes.
Fig. 11.3 (b) shows that investment expenditure increases as interest rates (i) falls from i1 to
i2. However, in relationship with income, it is indirect. As income increases, savings also
increases to provide fund for investors who engage in investment.
(e) Planned Government Expenditure (G)
General government planned spending i.e. government planned purchases of final
goods and are based on political as well as economic decisions. They consist of
central government planned expenditure on defence, wages and salaries of
government employees and other expenditure on and by local authority. However,
it excludes all government transfer payments because such outlays do not reflect
any current production.

NOTE: This is a work in progress. All topics in the syllabus are covered but editing for necessary corrections is in progress.
Thanks.
228
Figure 11.4: The Government Function
Govt. Exp.
1500 Go
0 Y1 Y2 Real Income
In Figure 11.4, the government expenditure function is parallel to the income axis to show
that government expenditure is autonomous of changes in a nation’s aggregate income. At
Y1 and Y2 export spending remains at X0 = 1500.
(f) Foreign Sector (Rest of the world)
i. Net exports are the difference between exports and imports expenditures on goods
and services.
Planned export earnings are goods and services produced in a nation but are sold to
buyers in other countries. Since exports are sold to other nations, the amount of a
nations exports earnings does not depend on its current aggregate income but on
the aggregate incomes of other nations (importing nations). Export earnings are
therefore said to be autonomous of aggregate income changes (X = X0).
Figure 11.5: The Export Function
Govt. Exp.
1500 X0
0 Y1 Y2 Real Income

NOTE: This is a work in progress. All topics in the syllabus are covered but editing for necessary corrections is in progress.
Thanks.
229
In Figure 11.5, the export function is parallel to the income axis to show that exports
are autonomous of changes in a nation’s aggregate income. At Y1 and Y2 export
spending remains at Xo = 1500
ii. Planned imports expenditure is spending by individuals, firms and government of an
economy on goods and services produced in foreign nations. Imports depend
directly on nation’s aggregate income, i.e.
M = f(Y)
Where M= imports expenditure and Y = aggregate income. The import function M = f (Y) is written in an expressed form as:
M = M0 + mY M0 > 0; 0< m<1
Where
Mo = autonomous imports which depend on such things as the exchange rate and the terms
of trade.
mY = income induced imports
m = the marginal propensity to import
Figure 11.6: The Import Function
Import Exp. M = M0 + mY
850
700
M0
0 Y1 Y2 Real Income
The import function in Figure 11.6, however, is positively sloped showing that imports
expenditures are positively related to a nation’s aggregate real income. At Y1 and Y2 import
expenditures are 700 and 850 respectively. This means that imports are higher at a higher
aggregate income level.

NOTE: This is a work in progress. All topics in the syllabus are covered but editing for necessary corrections is in progress.
Thanks.
230
11.4 EQUILIBRIUM LEVEL OF NATIONAL INCOME AND MULTIPLIER
11.4.1 ACTUAL AGGREGARE OUTPUT PRODUCED (Y) = Planned Aggregate Expenditure(AE) (a) Introduction
We have looked at planned aggregate expenditure which is planned total
spending in an economy on domestically produced goods and services within
a specified period of time. We also noted that planned expenditure is the
sum of planned spending by all sectors of the macro economy represented as
households (C), firms (I), government (G), export (X) and imports (M).
Planned aggregate expenditure in an economy may be greater or smaller
than actual output produced in the economy. When planned aggregate
expenditure is greater than actual output we have under production of goods
and services. On the other hand, if planned aggregate expenditure is smaller
than actual output produced we have over production of goods and services.
In the two instances we are out of equilibrium. The question then is: When
do we get to equilibrium?
Equilibrium national income occurs when the total level of output produced
in the economy exactly matches the level of planned total spending
(aggregate expenditure) in the economy symbolically:
Y = AE = C + I + G + (X – M)
Where
Y = net national product (actual aggregate production of final goods and
services) and Services) and AE = actual aggregate expenditure
This means that equilibrium net national product corresponds to the intersection of
the aggregate expenditure schedule and the 450 line (aggregate output schedule).
(b) Derivation of Aggregate Expenditure: We have discussed the components of
planned aggregate expenditure. We now derive the aggregate expenditure
schedule.

NOTE: This is a work in progress. All topics in the syllabus are covered but editing for necessary corrections is in progress.
Thanks.
231
Planned aggregate expenditure we noted is the sum of C, I, G and (X –M). To derive
the aggregate expenditure schedule we add Figures 12.1, 12.3, 12.4, 12.5 and 12.6 to
obtain Figure 12.7
Figure 11.7: The Aggregate Expenditure Schedule
Agg. Exp. Y = AE = C + I + G + (X-M)
Z
0 Real Income/Output
(c) The 450 Line or Expenditure=Income Line:
This line depicts various possible levels of total output or income, which the business
sector might produce at various levels of aggregate expenditure (AE). The 450 line is
normally taken to typify aggregate output schedule. The 45 degree line is also
referred to as the aggregate income equals aggregate output identify (Y = AE
Identify). This line is a useful guideline, which denotes the fact that any point on the
line is equidistant to the two axes. It, therefore, depicts the fact that business will
produce any given level of aggregate national product or income only when they
expect a level of total spending (AE) just sufficient to dispose of that output.
Figure 11.8: The 450 Line
Agg. Exp Y = AE identity
450
0 Real Income (Y)

NOTE: This is a work in progress. All topics in the syllabus are covered but editing for necessary corrections is in progress.
Thanks.
232
Figure 11.8 illustrates the 450 line. This line is equidistant between the various levels of
aggregate output the various levels of aggregate output and the level of aggregate spending
that will clear them. This line is used to represent the aggregate production or output
schedule because business sector produces with the hope of selling.
(d) Depiction of Equilibrium
In equilibrium, actual aggregate output (Y) equals planned aggregate expenditure
(AE)
Figure 11.9: Equilibrium National Income in a closed Economy
Aggregate Exp Y = AF identity
Y = C + I + G + (X – M)
E0
Z
0 Y1 Y0 Y2 Real Output (Y)
Figure 11.9 illustrates equilibrium national income in an open economy where AE = C + I + G
+ (X – M). The basic condition for equilibrium is Y = AE and this occurs at point “E0 denoting
Y0 as the equilibrium national income. At this point, production and purchasing plans are
consistent with one another. Suppose real output level Y1, Y1 < AE depicting disequilibrium.
Again if we assume real output level Y2, Y2 > AE showing disequilibrium.
11.4.2 Leakages and Injections Approach
(a) Leakages (L)
A leakage represents a part of aggregate income that is not used to purchase
domestically produced goods and services during the year. There are three kinds of
leakages in an open economy. These are
i. Savings (S) e.g. personal saving from current disposable income.

NOTE: This is a work in progress. All topics in the syllabus are covered but editing for necessary corrections is in progress.
Thanks.
233
ii. Import purchases (M) e.g. the purchase of refined sugar from Cuba.
iii. Net taxes – the difference between taxes paid to government and transfer
payments (T).
(b) Injections (J)
An Injection of spending is a purchase made by business firms, governments or
foreign buyers that increase the flow of income in a nation. These injections are in
the form of:
i. Investment
ii Government expenditure
iii. Exports (X)
In an open economy when Y = AE, injections must equal leakages. Aggregate income
(Y) is disposed of in three main ways
First, as consumption expenditure: second as saving and finally as taxes. We can
represent this as
Y = C + S + T [11.1]
We also noted that in equilibrium
Y = C + I + G + X – M [11.2]
We can rewrite equation 11.2 as
C + S + T = C + I + G + X – M [11.3]
Re-arranging equation 11.3 gives 11.4
I + G + X = S + T + M [11.4]
Equation 11.4 shows that in equilibrium, injection must equal leakages.

NOTE: This is a work in progress. All topics in the syllabus are covered but editing for necessary corrections is in progress.
Thanks.
234
Figure 11.10: Injection – Leakages Approach
L and J
L = S + T + M
E0 Jo= Io + Go + X0
0 Y1 Y0 Y2 Real Income
In Figure 11.10, equilibrium income is given as Y0 and equilibrium point as “E0”. The
injections line is parallel to the income axis because the components of injections (I, G and
X) are autonomous of changes in aggregate income. On the other hand, the leakages line is
positively inclined because the components of leakages are income induced. At real income
level Y: Injections are more than leakages implying disequilibrium. At Y2, leakages are more
than injections showing disequilibrium.
11.4.3 ALGEBRAIC DETERMINATION OF EQUILIBRIUM INCOME
An open economy is represented by the structure equation (model) below:
Y=C+I+G+(X-M) (11.4)
Where C = a + byd a > 0; 0 < b < 1 (11.5)
Yd = Y-T [disposable income] (11.6)
T = To [Lump-sum tax] (11.7)
I = Io [Investment Expenditure] (11.8)
G = Go [Government Expenditure] (11.9)
X = Xo [Export (autonomous)] (11.10)
M= Mo [Import (autonomous)] (11.11)

NOTE: This is a work in progress. All topics in the syllabus are covered but editing for necessary corrections is in progress.
Thanks.
235
Derivation of equilibrium national income
Substitute into equation (11.4)
Y = a + bYd +Io +Go+ (Xo-Mo)
= a + b (Y – T) + Io +Go + (Xo – Mo)
= a + bY – bTo + Io +Go + (Xo – Mo)
Y -bY = (Y – T) + Io +Go + (Xo – Mo)
( 1- b)Y = (Y – T) + Io +Go + (Xo – Mo)
Y = 1
1−𝑏 [a - bTo + Io +Go + (Xo – Mo)] (11.12)
Where 𝐼
𝐼−𝑏 is the multiplier
Equation (11.12) gives the equilibrium national income
Note that, at this level, we are concerned with a simple national income model for an open-
economy.
Hence, our assumptions include that tax (T), investment expenditure (I) government
expenditure (G), export (X) and import (M) are fixed or given. (I.e. they are said to be
autonomous using economist’s jargon)
In a more complex national income model, the tax and import functions can be defined as:
T = To + tY (11.13)
M =mod + mYd (11.14)
Where To = lump sum tax
M = autonomous import expenditure
m = marginal propensity to import
When T and M are redefined as in equations (11.13) and (11.14), we will arrive at
equilibrium national income that is different from what we have in equation
(11.12). We consider such discussion to be outside of the current syllabus.
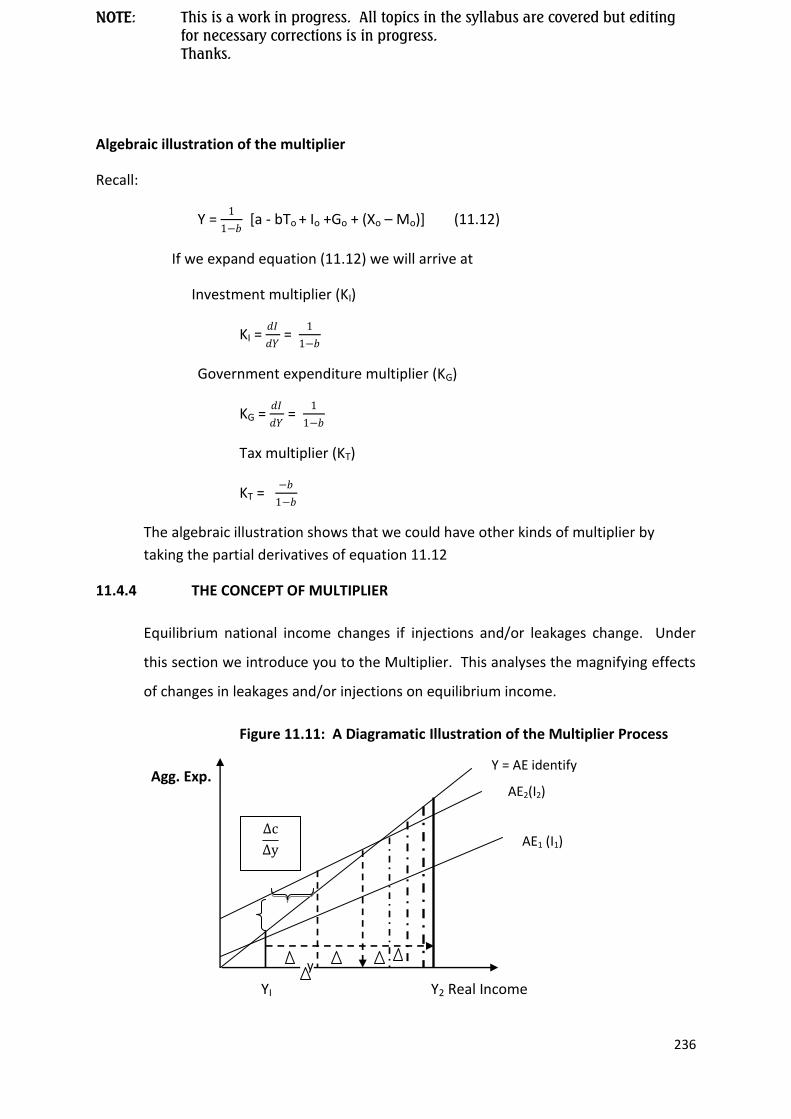
NOTE: This is a work in progress. All topics in the syllabus are covered but editing for necessary corrections is in progress.
Thanks.
236
Algebraic illustration of the multiplier
Recall:
Y = 1
1−𝑏 [a - bTo + Io +Go + (Xo – Mo)] (11.12)
If we expand equation (11.12) we will arrive at
Investment multiplier (KI)
KI = 𝑑𝐼
𝑑𝑌 =
1
1−𝑏
Government expenditure multiplier (KG)
KG = 𝑑𝐼
𝑑𝑌 =
1
1−𝑏
Tax multiplier (KT)
KT = −𝑏
1−𝑏
The algebraic illustration shows that we could have other kinds of multiplier by
taking the partial derivatives of equation 11.12
11.4.4 THE CONCEPT OF MULTIPLIER
Equilibrium national income changes if injections and/or leakages change. Under
this section we introduce you to the Multiplier. This analyses the magnifying effects
of changes in leakages and/or injections on equilibrium income.
Figure 11.11: A Diagramatic Illustration of the Multiplier Process
Agg. Exp.
YI Y2 Real Income
Δc
Δy
Y = AE identify
AE2(I2)
AE1 (I1)
y

NOTE: This is a work in progress. All topics in the syllabus are covered but editing for necessary corrections is in progress.
Thanks.
237
Figure 11.11 depicts the working of the multiplier. The initial change was an increase in
investment expenditure depicted as (+ I). This change caused an increase in income shown
as ∆y. The increase in income (∆y) gave rise to increase in consumption expenditure
depicted as C and an increase in savings. Since consumption expenditure is a component
of AE, aggregate expenditure increase necessitating increase in income denoted as y. This
sets in motion another chain of reactions until the economy converges to a new equilibrium
income level depicted as Y2.
11.5 THE ACCELARATOR PRINCIPLE OF INVESTMENT
(a) The Multiplier concept we introduced to you linked increased investment
spending with increased aggregate expenditure that invariably increased aggregate
income and employment. We however, did not account for what would cause the
increase in investment spending. The Accelarator Principle is one of the theories
that explains the demand for investment.
Accelarator Principle holds that a change in the rate of output induces a change in
the demand for investment in the same direction.
The accelerator Principle deals with the relationship between net investment, the
stock of capital and the level of income or output. The principle indicates that net
investment will take place only when aggregate output is increasing.
(b) How the Accelarator Works:
Assume that in period “t” the capital stock required to produce a given level
of (Yt) is given as
Kt =µYt (11.12)
Where µ is the capital-output ratio which shows the average amount of capital
required to produce a unit of output. If we assume that µ equals 2 then it means it
takes C2 worth of capital to produce one cedi worth of output.
If µ is assumed to be a constant then any change in output will require a
proportional change in K (capital stock). Assume again that the new period’s output
is given as Yt+1 the required capital stock in period t+1 will be given

NOTE: This is a work in progress. All topics in the syllabus are covered but editing for necessary corrections is in progress.
Thanks.
238
Kt+1 = µYt+1 (11.13)
Working in terms of changes to reflect the movement between period “t” and period
“t+1” we subtract equation (11.14) from equation (11.15) to obtain equation (11.16)
Kt+1 - Kt = µYt+1- µYt (11.17)
We factor out Bon the R.H.S of equation (11.18) to obtain equation (11.19)
Kt+1 - Kt = µ(Yt+1- Yt) (11.20)
Let K = K t+1 - Kt and
Y = Yt+1- Yt
We substitute K for Kt+1 - Kt and Y for Yt+1- Yt into equation (11.20) to obtain
equation (11.21)
K = µ ( Y) (11.22)
But changes in capital stock between two time periods for example, between period
“t” and period “t + 1” equals Net Investment (N1). We substitute N1 for K to obtain
equation (12.23)
NI = µ( Y) (11.23)
Equation (11.23) shows that net investment (NI) at any given time period depends
on changes in aggregate income or output. The coefficient µ is termed the
accelerator.
(c) Depreciation:
Gross investment is normally decomposed into two namely:
(i) Replacement investment and
(ii) Net Investment
Replacement investment equals capital consumption allowance or depreciation. If
the rate of depreciation is d% in period “t” it means that d% of the previous capital
stock “Kt-1” was used up for production in period “t”. This is represented as equation
(11.24)

NOTE: This is a work in progress. All topics in the syllabus are covered but editing for necessary corrections is in progress.
Thanks.
239
Dt = dkt-1 (11.24)
Where Dt is the capital consumption allowance
We noted earlier that gross investment (GI) is the sum of replacement investment
(Dt) and net investment (NI). This is given as equation (11.25)
GI = NI + Dt (11.26)
Substituting equations (11.23) and (12.24) into equation (12.26) we obtain equation
(11.27)
GI = B( Y) +dkt-1 (11.27)
From equation (12.27), if Y = 0 or if output is constant over time then net
investment (NI) will be zero and gross investment (GI) will equal consumption
allowance or replacement investment. This is investment just to maintain the
existing capital stock.
(d) Illustration
Table 11.1: An illustration of the Accelerator Theory of Investment (in cm)
1 2 3 4 5 6 7 8
TIME Y Y K=µy D RI=D NI GI
t-1 110 - - - - - -
T 110 0 220 22 22 0 22
t+1 110 0 220 22 22 0 22
t+2 111 1 222 22.2 22.2 2 24.2
t+3 113 2 226 22.6 22.6 4 26.6
t+4 116 3 232 23.2 23.2 6 29.2
t+5 119 3 238 23.8 23.8 6 29.8
Where Y = Aggregate output
Y= Change in aggregate output
RI = Replacement Investment
RI= Replacement Investment
K= Capital Stock
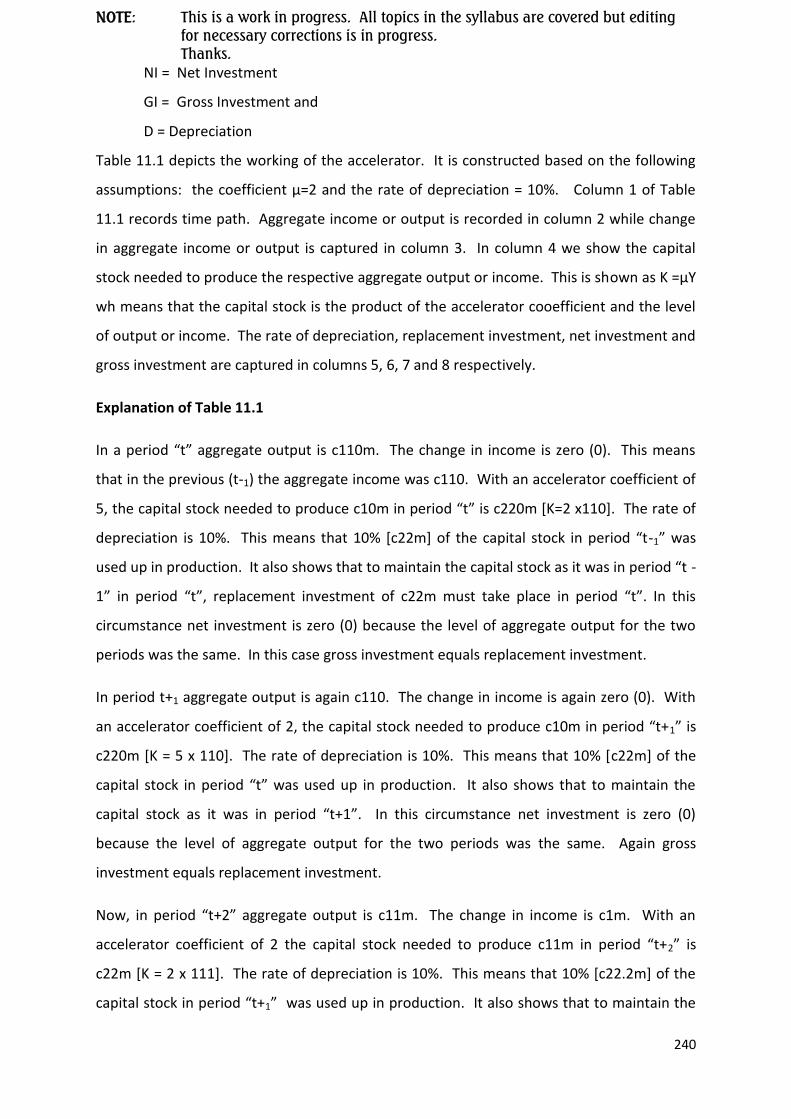
NOTE: This is a work in progress. All topics in the syllabus are covered but editing for necessary corrections is in progress.
Thanks.
240
NI = Net Investment
GI = Gross Investment and
D = Depreciation
Table 11.1 depicts the working of the accelerator. It is constructed based on the following
assumptions: the coefficient µ=2 and the rate of depreciation = 10%. Column 1 of Table
11.1 records time path. Aggregate income or output is recorded in column 2 while change
in aggregate income or output is captured in column 3. In column 4 we show the capital
stock needed to produce the respective aggregate output or income. This is shown as K =µY
wh means that the capital stock is the product of the accelerator cooefficient and the level
of output or income. The rate of depreciation, replacement investment, net investment and
gross investment are captured in columns 5, 6, 7 and 8 respectively.
Explanation of Table 11.1
In a period “t” aggregate output is c110m. The change in income is zero (0). This means
that in the previous (t-1) the aggregate income was c110. With an accelerator coefficient of
5, the capital stock needed to produce c10m in period “t” is c220m *K=2 x110+. The rate of
depreciation is 10%. This means that 10% *c22m+ of the capital stock in period “t-1” was
used up in production. It also shows that to maintain the capital stock as it was in period “t -
1” in period “t”, replacement investment of c22m must take place in period “t”. In this
circumstance net investment is zero (0) because the level of aggregate output for the two
periods was the same. In this case gross investment equals replacement investment.
In period t+1 aggregate output is again c110. The change in income is again zero (0). With
an accelerator coefficient of 2, the capital stock needed to produce c10m in period “t+1” is
c220m [K = 5 x 110]. The rate of depreciation is 10%. This means that 10% [c22m] of the
capital stock in period “t” was used up in production. It also shows that to maintain the
capital stock as it was in period “t+1”. In this circumstance net investment is zero (0)
because the level of aggregate output for the two periods was the same. Again gross
investment equals replacement investment.
Now, in period “t+2” aggregate output is c11m. The change in income is c1m. With an
accelerator coefficient of 2 the capital stock needed to produce c11m in period “t+2” is
c22m [K = 2 x 111]. The rate of depreciation is 10%. This means that 10% [c22.2m] of the
capital stock in period “t+1” was used up in production. It also shows that to maintain the

NOTE: This is a work in progress. All topics in the syllabus are covered but editing for necessary corrections is in progress.
Thanks.
241
capital stock as it was in period “t+2. But in period “t+2”, c222m worth of capital stock is
needed to produce c11m worth of aggregate output. In this circumstance the net
investment needed to increase the capital stock from c220m to c222m is c2. In this case
gross investment (c22.2) plus net investment (c2).
Finally, in period “t+s” aggregate output is c119m. The increase in output from period t+4
to period period t+5 is c3m. The capital stock needed to produce c119 in period “t+2” is
c238m [K=2 x 119]. The rate of depreciation is 10%. This means that 10% [c23.8] of the
capital stock in period “t+4” was used up in production. It also shows that to maintain the
capital stock as it was in period “t+4” in period “t+5”’ c238m worth of capital stock is
needed to produce c119m worth of aggregate output. In this case the net investment
needed to increase the capital stock from c232m to c238m is c6. In this case gross
investment (c2).
Finally, in period “t+5” aggregate output is c119m. The increase in output from period t+4
to period t+5 is c3m. The capital stock needed to produce c119m in period “t+2” is c238m
[K=2 x119]. The rate of depreciation is 10%. This means that 10% [c23.8] of the capital
stock in period “t+4” was used in production. It also shows that to maintain the capital
stock as it was in period “t+4” in period “t+5”, replacement investment of c23.8m must take
place in period “t+5”. But in period “t+5”, c238m worth of capital stock is needed to
produce c119m worth of aggregate output. In this case the net investment needed to
increase the capital stock from c232m is c6. In this case gross investment (c23) equals
replacement investment (c8) plus net investment (c29.8).
11.6 SUMMARY AND CONCLUSIONS
National Income Determination deals with what determines the size of a nation’s
national income. The size of a nation’s national income is determined primarily by
the size of its planned aggregate expenditure.
This is planned total spending in an economy on domestically produced goods and
services within a specified period of time. It is determined as the sum of planned
spending by all sectors of the macro economy represented as household spending
on consumption (C), firms (I), government (G), exports (X) and imports (M)

NOTE: This is a work in progress. All topics in the syllabus are covered but editing for necessary corrections is in progress.
Thanks.
242
Equilibrium national income occurs when the total level of output produced in the
economy exactly matches the level of planned total spending (aggregate
expenditure) in the economy.
The Multiplier analyses the magnifying effects of changes in leakages and/or
injections on equilibrium income.
The accelerator principle deals with the relationship between net investment, the
stock of capital and the level of income or output. The principle indicates that net
investment will take place only when aggregate output is increasing.
11.7 REVISION QUESTIONS SECTION A: Multiple Choice Questions
CHAPTER ELEVEN
1. A linear relationship between consumption expenditure and disposable income is
A. Consumption function
B. Marginal propensity to consume
C. Average propensity to consum
D. Autonomous consumption function
E. Aggregate consumption
2. In a three-sector closed economy, which of the following is a form of leakages?
A. Investment expenditure
B. Export
C. Personal savings
D. Government expenditure
E. Investment on intermediate goods
3. Given a consumption functionin an economy as C = 200 + 0.75Yd, the marginal
propensity to save is
A. 0.75
B. 200
C. 0.25
D. 200.75
E. 1.75
4. As disposable income increases, all things being equal
A. Both consumption and savings decrease
B. Both consumption and savings remain unchanged
C. Consumption decreases and saving increases
D. Both consumption and savings increases
E. Consumption increases and saving decreases
5. Which of the following is not a component of aggregate demand in an open economy
model?

NOTE: This is a work in progress. All topics in the syllabus are covered but editing for necessary corrections is in progress.
Thanks.
243
A. Households consumption
B. Investment expenditure
C. Net export
D. Government expenditure
E. National income
Solution To Multiple Choice Questions
CHAPTER ELEVEN
1. A
2. C
3. C
4. D
5. E
Short Answer Questions
1. The level of consumption that is independent of disposable income is called…………..
2. A change in saving with respect to a change in disposable income is referred to
as……………………………
3. The relationship between net investment, stock of capital and the level of output in
an economy is the concern of ……………..principle
4. Given the value of Marginal Propensity to Consume (MPC) in a simple national
income model as 0.8, the value of the investment multiplier is…………………..
5. The sum of marginal propensity to consume and marginal propensity to save
equals…………………….
Solution To Short Answers Questions
CHAPTER ELEVEN
1. Autonomous Consumption
2. Marginal Propersity to Save (MPS)
3. Accelerator
4. 5
5. One (1)
1. a) In a hypothetical economy a consumption function is given as
C = a + bYd a>0 and 0< b < 1
Where C = aggregate consumption expenditure and
Yd = aggregate disposal income
Required:

NOTE: This is a work in progress. All topics in the syllabus are covered but editing for necessary corrections is in progress.
Thanks.
244
i. Explain the meaning of “a”
ii. Define “b”
iii. What is the meaning of bYd
b) Explain four (4) factors that influence aggregate level of consumption.
Answer
a. (i) “a” is the intercept. It measures consumption expenditure when income is zero
(0). This amount of consumption is called autonomous consumption since it is
independent of the level of income (non-income induced consumption expenditure).
(3 marks)
(ii) “b” is the slope of the consumption function. It measures the extent of a change
in consumption expenditure with respect to a change in disposable income. This is
called the marginal propensity to consume (MPC). (2 marks)
(iii) “bYd” is the proportion of consumption expenditure that depends on disposable
income (income induced consumption expenditure). (3 marks)
b.
i. The level of disposable income: The level of income is the basic determinant of how
much households will consume. As households` income increase consumption
expenditure increases and vice versa.
ii. Stock of durable goods on hand: If the economy has enjoyed an extended period of
prosperity, consumers may find themselves well supplied with various durable
goods, e.g. cars, televisions, etc. all worth years of service. Hence, for sometime,
many households will be out of the market for such products with the result that
consumers will be willing to spend less and save more at each level of disposable
income.
iii. Wealth: This is a stock of accumulated purchasing power stored up from the past.
For example, if you have a fat savings account accumulated from your past earnings,
your current spending may be greater than your current income. This implies that
what actually determines consumption is not nominal wealth but real wealth, which
takes the price level into account.

NOTE: This is a work in progress. All topics in the syllabus are covered but editing for necessary corrections is in progress.
Thanks.
245
iv. Expectations: Households` expectations concerning future prices, money income
and the availability of goods may have a significant impact on their current spending.
Expectations of rising prices and product shortages tend to trigger more spending
and less saving, that is, it shifts the consumption function upward and the saving
function downward.
v. Aggregate household indebtedness: This is the purchasing power of the sum of
money outstanding that households have borrowed and are currently obligated to
repay. If households are in debt to the degree that part of their current incomes are
committed to instalment payments on previous purchases, they may well be obliged
to reduce current consumption.
vi. Availability of credits
vii. The level of prices etc.
Question 11.2
Given the following national income model for a hypothetical economy.
Y=C+I+G+(X-M)
Where C = $ 180 billion + 0.8 Yb (Consumption function)
Yd = Y-T (disposable income)
I = $ 24 billion (Investment Expenditure)
G = $ 46 billion ( Government Expenditure)
X = $ 25 billion ( Export)
M= $ 31 billion ( Import)
T = $ 10 billion ( Lump sum tax )
You are required to determine:
a) The equilibrium national income
b) The investment multiplier
c) The aggregate consumption
Answer
a) Equilibrium national income:

NOTE: This is a work in progress. All topics in the syllabus are covered but editing for necessary corrections is in progress.
Thanks.
246
Y=C+I+G+(X-M)
= 180+ 0.8 Yd + 24+ 46+ (25-31)
= 244+ 0.8 Yd
= 244+ 0.8(Y-T)
= 244 +0.8Y-0.8T
Y-0.8Y =244 -0.8(10)
0.2Y =236
Y = 236
0.2
Y =$ 1,180 billion
b) Investment multiplier (k)
Where
K = 1
1−𝑏 mpc = 𝑏 =
dc
dyd=0.8
= 1
1−0.8
=5
c) Aggregate consumption
C = 180 + 0.8 Yd
= 180 + 0.8(Y-T)
= 180 + 0.8Y-0.8T
= 180 +0.8(1180)-0.8(10)
= 180 + 944-8
= $1,116 billion
Question 11.3
In a hypothetical economy aggregate expenditure or demand (AE) is given as:
AE = C + I
Where C = Consumption Expenditure
I = Investment Expenditure
Required:
a. What is the meaning of C?
b. Identify two factors that influence C.

NOTE: This is a work in progress. All topics in the syllabus are covered but editing for necessary corrections is in progress.
Thanks.
247
c. Define Investment in this context
d. State the three main components of Investment in this context.
e. What are the two main determinant of investment|?
Answer
a. C = Personal Consumption Expenditure is made up of expenditure by households on
durable and non-durable goods and services. For example, household expenditure on
plantain, cars, shoes, etc.
b. Identify two factors that influence C.
i. The level of disposable income: The level of income is the basic determinant of how
much households will consume. As households’ income increase consumption
expenditure increases and vice versa.
ii. Stock of durable goods on hand: If the economy has enjoyed an extended period of
prosperity, consumers may find themselves well supplied with various durable goods,
e.g. cars, televisions, etc. all worth years of service. Hence, for sometime, many
households will be willing to spend less and save more at each level of disposable
income.
iii. Wealth: This is a stock of accumulated purchasing power stored up from the past. For
example, if you have a fat savings account accumulated from your past earnings, your
current current spending may be greater than your current income. This implies that
what actually determines consumption is not nominal wealth but real wealth, which
takes the price level into account.
iv. Expectations: Households’ expectations concerning future prices, money income and
the availability of goods may have a significant impact on their current spending.
Expectations of rising prices and product shortages tend to trigger more spending and
less saving, that is, it shifts the consumption function upward and the saving function
downward.
v. Aggregate household indebtedness: This is the purchasing power of the sum of
money outstanding that households have borrowed and are currently obligated to

NOTE: This is a work in progress. All topics in the syllabus are covered but editing for necessary corrections is in progress.
Thanks.
248
repay. If households are in debt to the degree that part of their current incomes are
committed to instalment payments on previous purchases, they may well be obliged
to reduce current consumption.
vi. Availability of credits
vii. The level of prices etc.
c. Investment as a component of aggregate expenditure is defined as spending devoted
towards increasing or maintaining the stock of capital.
d. State the three main components of investment in this context.
(i) Business fixed investment e.g. Plant and Machinery
(ii) Construction such as business and
(iii) Residential buildings and changes in inventory.
e. The two main determinants of investments are:
(i) Expected Rate of Return: Investment spending is guided by the profit
motive; the business sector buys capital goods only when it expects such
purchases to be profitable.
(ii) the real interest rate: Business firms typically borrow funds to make an
investment and to repay their borrowings out of future revenues. Even if they
do not borrow, managers know that if they use current revenues to finance
investment purchases, they forgo the opportunity to earn interest. The
annual opportunity cost of using a cedi to make an investment can therefore
be represented by the real interest rate. The real interest rate is the price of
using a cedi to make an investment purchase. Thus, the higher the real rate
of interest, the less would be the profits to the business after paying interest
and the less it will want to invest and vice versa.

NOTE: This is a work in progress. All topics in the syllabus are covered but editing for necessary corrections is in progress.
Thanks.
249
Question 11.4 Aggregate Income, Consumption Expenditure and Investment Table
Aggregate
Income (Y)
c million
Consumption
Expenditure (C)
c million
Investment
Expenditure (I)
c million
0 100 100
100 180 100
200 260 100
300 340 100
400 420 100
500 500 100
600 100
700 100
800 100
900 100
1000 100
Required:
a) Determine the level of autonomous Consumption Expenditure in this economy?
b) Determine the value of the marginal propensity to consume in this economy?
c) Specify the consumption function for this economy
d) Copy and complete the table
e) What is the equilibrium income in this economy?
Answer
a) 100 million cedis
b) Marginal propensity to consume is ΔC
ΔY =
80
100= 0.8
Y 100
c) C = 100 + 0.8Y

NOTE: This is a work in progress. All topics in the syllabus are covered but editing for necessary corrections is in progress.
Thanks.
250
d)
Aggregate
Income (Y)
c million
Consumption
Expenditure (C)
c million
Investment
Expenditure (I)
c million
0 100 100
100 180 100
200 260 100
300 340 100
400 420 100
500 500 100
600 580 100
700 660 100
800 740 100
900 820 100
1000 900 100
e. At equilibrium National Income y = c + 10 y = 100 + 0.8Y + 100 y - 0.8Y = 200 0.2Y = 200
Y = 200
0.2
Y= 1000 QUESTION 11.5 The Table below depicts national expenditure information for an
economy.
ITEM IN MILLIONS OF C
Private Consumption Expenditure (C) 786
General government final consumption (G) 530
Gross domestic capital formation (I) 135
Taxes on expenditure 192
Subsidies 50
Export of goods and services (X) 92
Import of goods and services (M) 127
Property income received from abroad 100
Property income paid to foreigners 165
Depreciation (capital consumption allowance) 58
Required:
a) What is Total Domestic Expenditure in this economy?
b) Calculate the Gross Domestic Expenditure in market prices for this economy

NOTE: This is a work in progress. All topics in the syllabus are covered but editing for necessary corrections is in progress.
Thanks.
251
c) What is the value of Net Property Income for this economy?
d) Calculate the Net National expenditure at factor cost for this economy
Answer
a) Total Domestic Expenditure = C + I + G = 786 + 530 + 135 = €1451million
b) Gross Domestic Expenditure in market prices = C + I + G + X – M = 1451 + 92 – 127 =
1416
c) Net Property Income = 100 – 165 = 65
d) Net National expenditure at factor cost NNPF = GTPM ± Net Property Income – Taxes
on Expenditure + Subsidies – Depreciation.
NNPF = 1416 – 192 + 50 – 58 = c1,151million.

NOTE: This is a work in progress. All topics in the syllabus are covered but editing for necessary corrections is in progress.
Thanks.
252
C H A P T E R TWELVE
MONEY
12.0 LEARNING OBJECTIVES
After studying this chapter, you should be able to
Explore the role of money in a modern economy
Identify the more important, desirable attributes of money
Appreciate the various forms of money, and have a good grasp of the
concept of money supply
Understand the main motives for holding money
Explain the quantity theory of money, and especially its policy relevance
towards the achievement of the macroeconomic goal of price stability.
12.1 INTRODUCTION
Money, as defined in economics, is anything that is readily and widely accepted as a
medium for the exchange for goods and services or in settlement of debts. Money
plays a crucial role in the economic system of any country. It is a means for
promoting specialization and exchange on which modern economic activity is based.
Before the invention of modern money in the forms of currency notes and coins as
we know today, trade had been conducted by barter, through the use of commodity
monies such as cowries shells, cow, manilas, iron bars, etc. The barter system refers
to a situation where goods are directly exchanged for goods. The problems
associated with the system are:
(i) Double coincidence of wants: It entails finding a person who has what you
want and requires what you have. For example, a person who has a cow and
needs a yam must search for another person who has a yam and needs a
cow. This process is cumbersome and leads to a waste of time.
(ii) No common unit of measure: It is difficult to arrive at a uniform or an easily
acceptable exchange rate between different commodities

NOTE: This is a work in progress. All topics in the syllabus are covered but editing for necessary corrections is in progress.
Thanks.
253
(iii) The absence of a means of storing wealth or value: Under the barter system. It
is difficult to store wealth because most articles of trade, especially agricultural
products are easily perishable.
(iv) Difficult in making deferred payment: As a result of exchange rate problem,
it is difficult to store wealth because most articles of trade, especially
agricultural products are easily perishable.
(v) Problem of bulkiness and indivisibility of most goods: The goods are often
too bulky to be carried from one place to the other, and are not capable of
being into divided similar units to facilitate transaction
The introduction of money has enabled man to overcome the problem associated
with the barter system.
12.2 THE FUNCTIONS OF MONEY
The four main functions of money in every modern economy are:
i. A medium of exchange: Money facilitates the exchange of goods and
services because, people exchange the goods and services they produce for
money and then use the money to buy other goods and services they want.
This enabled man to overcome the problem of ‘double coincidence of wants’
associated with trade by barter.
ii. A unit of account or a measure of value: Money serves as the unit in terms
of which the values of goods and services are measured and recorded. The
problem of barter with regards to the determination of exchange rate
between different goods is solved.
iii. A store of value: Money is a good store of value providing purchasing power
in a general form that can be used to meet future needs of goods and
services. Under the barter system, articles of trade are easily perishable and
cannot be stored for future transactions.
iv. A standard of deferred payment: Money makes it possible for people to
enter into contracts, such as lending, borrowing, and enjoyment of services

NOTE: This is a work in progress. All topics in the syllabus are covered but editing for necessary corrections is in progress.
Thanks.
254
for fixed amount of money payable at a future date. The exchange rate
problem makes this impossible under the barter system.
12.3 THE CHARACTERISTICS OF MONEY
For anything to perform the functions of money outlined above effectively, it must
possess the following attributes or qualities.
(i) General acceptability:- It must be acceptable by all economic agents in the
country in which it is used in payment for goods and services, and in settling
debts and obligations.
(ii) Divisibility: It should be available in units of a standard size sufficiently
divisible to facilitate the purchase and sale of goods and services over a wide
range of prices.
(iii) Durability: It should be able to last for a long time without losing its value.
This is the reason why high quality papers are used to print paper currency
and precious metals are used in minting coins.
(iv) Portability: Money should be convenient to carry about for easy transfer to
other people during transactions.
(v) Homogeneity: One unit of money must be the same in all respects (i.e.
identical) everywhere throughout the country. This will promote general
acceptability.
(vi) Relative Scarcity: It must be unique, not something that can be found easily
anywhere. And it must not be supplied in excess so as not to lose its value
whereby will not be able to serve effectively as a store of value and a
standard of deferred payment.
12.4 TYPES OF MONEY
The three main types of money are classified as:
a. Paper money and coins: These are money deposited with financial
institutions, especially commercial banks and the Central Bank. The three
types of deposit money are:
b. Bank deposits: These are money deposited with financial institutions,
especially commercial banks which are withdrawable or transferable
without prior notice by writing a cheque. Such deposits are held in
current account of the customer, and a fee is charged for processing the
cheque.

NOTE: This is a work in progress. All topics in the syllabus are covered but editing for necessary corrections is in progress.
Thanks.
255
Types of Bank Deposits
i. Demand deposits: It is deposit of funds (usually paper money and
coins) with a bank which are withdrawable or transferable without
prior notice by writing a cheque. Such deposits are held in current
account of the customer, and a fee is charged for processing the
cheque.
ii. Saving deposit: It is a deposit of fund with a bank which can be
withdrawn with or without a notice of withdrawal. Savings deposits
are held in savings account and they yield interest for the depositor.
iii. Time Deposit: It is a deposit of fund that cannot legally be withdrawn
from the bank without at least 30 days notice of withdrawal. Time
deposits are held in fixed deposit accounts opened for depositors and
they yield interests.
Quasi - money or near money: These are assets which adequately serve as a
store of value but do not fulfil the medium of exchange function. Examples
include saving and time deposits, stock and shares, postal and money orders,
treasury bills etc. What constitute quasi – money varies from one country to
another.
12.5 THE NATURE OF MONEY
The nature of money is usually discussed under three headings:
a. Legal tender: Money which by nature must be accepted in payment for
goods and in discharge of debt obligations. Currency notes and coins are
legal tender in all modern economies.
b. Fiat money: Money that is not a commodity and it is not redeemable in
any commodity. What gives such money value and acceptability is their
being declared as legal tender by the government. Money in the form of
currency notes fit into this description.
c. Token money: This refers to money whose face value is greater than the
actual value of the material of which it is made. In most economies, coins
are token money, whose value as metal is less than their monetary value.
12.6 THE SUPPLY OF MONEY
Money supply or money stock refers to the total amount of money in the
economy for purposes of policy various definitions or variants of money
supply (e.g. M1, M2, etc)
Generally, the narrow money or narrow definitions refers mainly to the
money used as medium of exchange while the broad money or broad
definitions include money being used as a store of value.

NOTE: This is a work in progress. All topics in the syllabus are covered but editing for necessary corrections is in progress.
Thanks.
256
In every country, the Central Bank always state which definitions of money it
is adopting at any particular time and for which purpose. The quantity of
money in an economy has direct effect on the price level and therefore on
the value of money. Hence, to promote price stability and economic growth,
the total money supply is subject to government control through the Central
Bank in every modern economy.
12.7 THE DEMAND FOR MONEY
Demand for money otherwise referred to as liquidity preference means the
desire of people to hold their resources or wealth in the form of cash i.e.
currency notes and coins, instead of interest – yielding assets. The British
economist John Maynard Keynes (1883 – 1946) identified three reasons for
demand for cash balances or why people hold money:
a. The Transactions Motive: This represents cash balances held in order to
carry out ordinary, everyday transactions. For example, individual
persons need to hold money to buy fares, and so on. Similarly, business
organisations need money to pay wages and electricity bills, buy raw
materials, vehicles and equipments, etc. The transactions demand for
money is directly related to income.
b. The Precautionary Motive: This refers to holding cash balances as a
precaution against unexpected expenses. For instance, people hold
money to provide them with some degree of security against sudden
illness, accidents, fire or flood disaster, etc., while firms hold money
against unpredictable occurrences such as sudden breakdown of vehicles,
equipments and so on. The main factor influencing this motive is the
level of income.
c. The Speculative Motive: This refers mostly to the desire to hold cash
balances in order to make speculative dealing in the bond or securities
(interest – yielding assets) markets. The demand for money for
speculative purposes is interest – elastic. The higher the rate of interest,
the lower the demand for speculative cash balances. Thus, there is an
inverse relationship between the price of bond and interest rate. This
motive for holding money, is a decreasing function of the rate of interest
and it is also influenced by incomes.
Lord Keynes refers to the money held for transactions and precautionary
motive as active balances, and that which is held for speculative motive as
idle balances. The total demand for money is found by the summation of
transactions, precautionary, and speculative demands.

NOTE: This is a work in progress. All topics in the syllabus are covered but editing for necessary corrections is in progress.
Thanks.
257
12.8 THE QUANTITY THEORY OF MONEY
The theory suggests the existence of a direct relationship between money supply
and the average price level in the macro economy. Specifically the quantity theory
of money states that the price level is strictly proportional to the money supply.
The quantity of money which was pioneered by the 18th century economists
including Adam Smith and David Hume, was modified and popularized in 1911 by the
American Economist, Irvin Fisher (1867 – 1947) in what is known equation of
exchange:
MV = PQ (12.1)
Where M = Total money supply
V = velocity of circulation of each unit of money
P = average price level
Q = real national output or real GNP
The assumptions of the theory are that:
(i) The velocity of money circulation (V) is fixed.
(ii) The real GNP denoted (Q) is fixed in the short – run.
(iii) The money stock (M) is determined from time to time by the
country`s monetary authorities.
(iv) The economy is at full employment level.
Given the above assumptions, the equilibrium price level (P) is determined by
the money stock (M) as expressed in equation (12.1)
P = MV (12.2) Q
Equation (12.2) which presents the quantity theory of money is obtained by making
P the subject of the relation in equation (12.1). It follows, for example, that a 5
percent increase in money stock will cause average price level in the economy to rise
by 5 percent. Thus, inflation is conceived as a monetary phenomenon.
The major policy implication of the theory is that monetary policy of the restrictive
type, is most relevant for effective control of inflation. In other words to curb the
problem of inflation effectively requires the reduction of money stock through the
use of monetary policy instruments such as open market operations (OMO) reserve
requirements, and bank rate.

NOTE: This is a work in progress. All topics in the syllabus are covered but editing for necessary corrections is in progress.
Thanks.
258
The weakness of the quantity theory of money lies in the underlying assumptions,
especially the assumption of fixed output and fixed velocity of money circulations
which are unrealistic.
However, the theory provides a guide to the government to regulate money supply
along the rate of changes in national output so as to avoid the problem of inflation.
12.9 SUMMARY AND CONCLUSION
The chapter explored the role of money in every modern economy. The
chapter also revealed that it is necessary for the government to ensure
consistency between the quantity of money and the amount of goods and
services available in the economy in order to promote price stability and
rapid economic growth.
12.10 REVISION QUESTIONS
SECTION A: Multiple Choice Questions
1. A situation where goods are directly exchanged for goods is described as
A. The functions of money
B. The barter system
C. The attributes of money
D. A medium of exchange
E. Quasi money
2. Which of the following statements is not true of the functions of money
A. Ability to last for a long time without losing its value
B. Facilitating the exchange of goods and services
C. A unit in terms of which the value of a good is determined
D. Providing purchasing power to meet future needs of goods and services
E. A standard of deferred payment
3. Money whose face value is greater than the actual value of the materials of
which it is made is referred to as
A. Legal tender
B. Quasi – money
C. Fiat money
D. Token money

NOTE: This is a work in progress. All topics in the syllabus are covered but editing for necessary corrections is in progress.
Thanks.
259
E. Near money
4. Which of these statements is/are true of speculative demand for money?
I. A liquid store of value which can be invested at opportune moment in
interest – bearing bonds or securities.
II. It is determined by the expectations about changes in bond price or in the
current market rate of interest.
III. It is a decreasing functions of the rate of interest.
A. I only
B. II only
C. III only
D. I and II only
E. I, II and III together
6. Which of the following statements is/are consistent with the quantity theory of
money?
I. It explains the main reasons why people may decide to hold cash balances
II. It predicts the effect of a change in money stock on the general price level
III. It explains the nature of money
A. I only
B. II only
C. III only
D. I and II only
E. I and III together
Section A: Solutions to Multiple Choice Questions
CHAPTER TWELVE
1. B
2. A
3. D
4. E
5. B
SECTION B: SHORT ANSWER QUESTIONS

NOTE: This is a work in progress. All topics in the syllabus are covered but editing for necessary corrections is in progress.
Thanks.
260
1. An acceptable medium for the exchange of goods and services or in settlement of
debts is called…………………….
2. The desire to hold wealth in form of cash instead of interest-yielding assets is
described as…………………………..
3. Assets which serve as a store of value but do not perform the function of medium of
exchange are called………………………
4. Money whose face value is greater than the actual value of the material of which it is
made is referred to as……………………….
5. In the quantity theory of money the equation of exchange approach shows that
money supply is proportionately directly related to………………..
Solution To Short Answers Questions
CHAPTER TWELVE
1. Money
2. Demand for money/ liquidity preference
3. Quasi- money
4. Token money
5. The price level

NOTE: This is a work in progress. All topics in the syllabus are covered but editing for necessary corrections is in progress.
Thanks.
261

NOTE: This is a work in progress. All topics in the syllabus are covered but editing for necessary corrections is in progress.
Thanks.
262
CHAPTER THIRTEEN
FINANCIAL INSTITUTIONS
13.0 LEARNING OBJECTIVES
After studying this chapter, you should be able to:
Explain the functions of commercial and merchant banks and the creation of
money by the commercial banking system.
Understand the role of the Central Bank in the economy.
Discuss the importance of development banks and other financial institutions
in the economy.
Distinguish between money market and capital market.
13.1 INTRODUCTION
Financial institutions are the main channel by which funds flow from the sectors of the
economy with surplus funds to other sectors with insufficient funds to ensure efficient
utilization of such resources in the promotion of economic growth and development.
Financial institutions may be broadly divided into two groups – banking and non-
banking financial institutions. The banking institutions include commercial and
merchant banks, development banks, and the Central Bank. On the other hand, the
non-banking institutions include insurance companies, equipment – leasing
companies, hire – purchase companies, building societies, discount houses, etc.
However, it is important to note that the legal framework within which the financial
institutions operate in an economy varies from one country to the other. Therefore,
only the conventional activities of financial institutions in most developing economies
are highlighted in this chapter.
13.2 COMMERCIAL AND MERCHANT BANKING
The commercial and merchant banks are profit – making enterprises, as well as the
major financial intermediaries through which the monetary authorities facilitate
effective distribution of money in the economy.

NOTE: This is a work in progress. All topics in the syllabus are covered but editing for necessary corrections is in progress.
Thanks.
263
13.2.1 Functions of Commercial Banks
The commercial banks offer a range of services which include the following:
(i) Accepting deposits of money: Commercial banks, as savings institutions,
provide facilities for the mobilization of savings by accepting deposits form
households, firms and government. They use current account, saving account
and fixed deposit account to accept demand deposits, saving deposits and time
deposits respectively.
(ii) Granting loans and advance: The most profitable function of commercial
banks is extending credits to worthy borrowers charging interest rate higher
than the rate they pay on deposits. Short – term credit facilities are extended
to customers using special loan account or in the form of overdraft using
current account. It may also take the form of loan syndication whereby two or
more banks agree to finance a large project.
(iii) Acting as agents of payment: Commercial banks` customers keep current
accounts from which they can draw for settlement of debt and for payments
for goods and services. They also transfer funds on behalf of their customers
through collection of standing orders and direct debiting.
(iv) Creating demand – deposit money: By lending out the money – i.e. deposit
that they collected from some customers, commercial banks create additional
purchasing power in the economy.
(v) Providing international trade service: Commercial banks are involved in the
financial aspects of international trade, especially by discounting bills of
exchange for their customers who are exporter and opening letters of credit in
favour of their customers who are importers. A letter of credit is an
undertaking by the bank accepting to redeem the liability of its customers on
an import contract.
(vi) Providing brokerage services: Commercial banks undertake to buy and sell
stocks and shares on behalf of their customers.

NOTE: This is a work in progress. All topics in the syllabus are covered but editing for necessary corrections is in progress.
Thanks.
264
(vii) Foreign exchange services: Commercial banks act as intermediaries between
the Central Bank or authorized foreign exchange declares and their corporate
customer to process foreign exchange allocation. They also provide traveler`s
cheque to their customers who are traveling out of the country.
(viii) Safekeeping of valuable items: The commercial banks undertake to keep, for
their customers, valuable items such as government stock, share certificates,
academic certificates, certificate of occupancy, jewelries, insurance policies,
etc.
(ix) Equipment leasing: This is the activity of banks in financing purchases of fixed
assets by their customers (mostly business enterprises) and allowing
repayment over an agreed period of time. The bank is the lessor, while the
beneficiary is the lessee.
13.2.2 Creation of Money by Commercial Banks
Creation of money by commercial banks reflects the view that by granting
loans, and advances, an initial deposit with a commercial bank can yield a
greater cumulative demand deposits in the entire commercial banking
system. When a commercial bank advances a loan, it opens an account in the
name of the customer creating a claim against itself and in favour of the
customer (borrower). Note that the loan is made, not by physically handing
over claims, but by creating a book keeping entry. The same procedure is
followed by other banks – each keeping small cash in reverse and lending the
remaining amount. The entire commercial banking system thus creates
demand deposit money and the economy is reflated.
The maximum total demand deposit money (Mdep) that the entire commercial banking
system will create given an initial deposit (A) and statutory cash reserve ratio (r) can
be obtained using the formula:
Mdep = A or 1

NOTE: This is a work in progress. All topics in the syllabus are covered but editing for necessary corrections is in progress.
Thanks.
265
r r (13.1) In equation (13.1), the deposit multiplier (Kdep) is Kdep = 1 (13.2)
r
According to equation (13.2), the deposit multiplier is the reciprocal of the cash reserve
ratio maintained by the banking system. The higher the cash ratio, the lower the deposit
multiplier and the lower the demand deposit expansion, vice versa. Multiplier and the
lower the demand deposit expansion, vice versa. Multiple demand – deposit expansion
occurs when an initial cash deposit causes an expansion of the money supply by a multiple
of the initial deposit.
The assumptions underlying the process of deposit money creation are:
i. The banking system is comprised of many banks.
ii. There is no cash leakage in the system.
iii. The statutory cash reserve ration i.e . the percentage of the total deposit liabilities of
the banks that they are legally required to keep with the Central Bank is given.
iv. All banks in the system are willing and able to make loans to the limit set by cash
reserve requirements.
v. The initial deposit of a customer in his current account is given.
ILLUSTRATION 13.2
Suppose a customer deposits N120,000 in a commercial bank, and the cash reserve
ratio imposed by the Central Bank is 5 per cent.
Required:
a. Calculate the deposit multiplier.
b. Determiner the maximum amount of deposits money that can be created by the
entire commercial banking system of the economy.

NOTE: This is a work in progress. All topics in the syllabus are covered but editing for necessary corrections is in progress.
Thanks.
266
The formula given in equation (13.1) will change if we relax the assumption of no cash
leakage so that there is vault cash (vc) and cash drain (cd). The vault cash is the amount of
money kept by banks in their vaults to meet their liquidity obligations, while cash drain
refers to the proportion of the loan which the borrower spent or not redeposited within the
banking system. The formula for obtaining Mdep becomes;
Mdep = A or 1 r + cd + vc r + cd + vc (13.3) In equation (13.3), the deposit multiplier becomes: Kdep = 1 r + cd + vc (13.4)
ILLUSTRATION 13.2
a) To obtain demand deposit multiplier (Kdep)
Kdep = 1 r
= 1 0.05
= 20
b) The maximum deposit money that can be created
(i) Mdep A r, where A = N120,000 i.e. deposit
(ii) 120,000
0.05
(iii) = N2.4 million

NOTE: This is a work in progress. All topics in the syllabus are covered but editing for necessary corrections is in progress.
Thanks.
267
From the foregoing discussions we can identify factors affecting creation of money by
commercial banks as:
i. Central Bank control via cash reserve ratio and special deposit
ii. Cash leakage out of the banking system
iii. Willingness of the banks to lend
iv. Willingness of customers to borrow
13.2.3 Functions of Merchant Banks
The traditional functions of merchant banks include the following:
(i) Acting as issuing houses in the capital market: Merchant banks are engaged
in issuing or floating of new securities for private and public companies and for
government (state and local) seeking to raise long-term or permanent finance
for their projects. For all services involved in the performance of this function,
merchant banks receive a commission called brokerage.
(ii) Accepting deposit: Merchant banks accept large deposits from their
customers mostly corporate bodies. Such deposits attract interest and can be
withdrawn only with certificate of deposits (CD) and not with cheques as in the
commercial banks transactions.
(iii) Providing foreign exchange services: Merchant banks are authorized dealers
in the foreign exchange market and as a result they are engaged in the buying
and selling of foreign exchange (forex) for commercial and other purposes.
They also provide services for both imports and exports.
(iv) Grating loans and advances: The banks provide medium and long-term loans
and advances to manufacturers and big-time traders. They are also engaged in
loan syndication.
(v) Project Financing: The mechant banks are engaged in the financing of new
industrial and agricultural projects on the understanding that the repayment
would be made from the revenue stream generated by the project.

NOTE: This is a work in progress. All topics in the syllabus are covered but editing for necessary corrections is in progress.
Thanks.
268
(vi) Providing advisory services: Merchant banks offer advice to their clients on
project financing, joint ventures, mergers and acquisitions debt financing, and
on the rationalization of the companies capital structure.
(vii) Equiment Leasing: The business of equipment leasing, as described under
commercial banking, is more popular with the merchant banks. Equipment
leasing can be in the form of finance lease where a bank provides funds to a
firm to purchase the equipment, or operation lease where a bank or lessor
buys the equipment and rent it out to the firm – i.e (the leasee).
13.2.4 Comparison between Commercial and Merchant Banks
The activities and functions of commercial and merchant banks in a typical
developing economy can be compared and contrasted as follow:
i. Commercial banks are retail bankers accepting deposit from individuals
businesses and government, not considering the size. On the other hand,
merchant bankers accepting deposit mostly from corporate bodies not below
a specified minimum.
ii. Commercial banks grant more of short-term loans and advances to their
customers. Merchant banks, on the other hand, grant medium and long-
term loans and advances.
iii. Commercial banks operate with wider branch network, while merchant
banks, as wholesale bankers, operate with limited branch network.
iv. Commercial banks offer more of general banking services such as deposit
taking and granting of loans and advances. Merchant banks offer mostly
specialized banking services such as equipment leasing debt factoring, project
financing, etc.

NOTE: This is a work in progress. All topics in the syllabus are covered but editing for necessary corrections is in progress.
Thanks.
269
v. Both commercial and merchant banks facilitate foreign trade by providing for
their customers facilities for establishing letters of credit with overseas
trading partners. Both also provide bill of exchange facility.
13.3 THE CONCEPT OF UNIVERSAL BANKING
Broadly defined, universal banking refers to an arrangement whereby a bank, that is,
any deposit taking institution, could engage in a wide range of financial activities and
could as well own and control non financial institutions.
It should be noted, however, that there is no generally accepted definition of
universal banking. Universal banking practice depends essentially on the definition of
banking business which varies from one country to the other. But there seems to be
an agreement on its silent features. For instance, Universal banking practice entails
the removal of restriction between money, capital and insurance markets such that a
banking institution can offer integrated financial service. These include deposit
taking and lending, underwriting of new debt/equity issues, stock broking, insurance,
investment management and so on.
a) Merits of Universal Banking
The following points are usually raised in favour of universal banking practice.
(i) It promotes economic growth through supply of long-term financing for
commerce and industry
(ii) It promotes efficiency through economics of scale and scope
(iii) It fosters competition by opening up various areas of financial and non-
financial activities for entry by banks.
b) Demerits of Universal Banking
The following arguments are often advanced against universal banking practice.
i. It distorts credit allocation to various economic activities because of
increased connected lending.
ii. It promotes greater concentration of economic and political power
iii. It leads to conflicts of interest with a bank engaging in more activities that
could cope with or difficulty in how to patronize its activities
iv. There is a great potential for banks to engaging in more risk activities which
could destabilize the banking system.
The adoption of universal banking practice in Nigeria commenced in the last quarter
of 2000, following the CBN circular (Ref no: BSD/DO/CIR/VOL.1/10/2000), dated 22
December, 2000, which was addressed to all licensed banks.

NOTE: This is a work in progress. All topics in the syllabus are covered but editing for necessary corrections is in progress.
Thanks.
270
13.4 CENTRAL BANK
A Central Bank is the apex institution of the monetary and banking system of every
country. It is owned by the government but the responsibility of its management is
usually rested in the Board of Directors whose members are appointed by the
government. The Bank of Ghana (BOG) and the Central Bank of Nigeria (CBN) are
among the earliest Central Banks established in the West African sub-region.
13.4.1 Traditional Functions of the Central Bank
In both developed and developing economies, the following are perform by
the Central Bank.
(i) Currency issue and distribution: The Central Bank is the only institution
empowered by law to issue currency notes and coins that are used as a
medium of exchange in the country. The monopoly power of issuing legal
tender currency is important to control the supply of money in order to
prevent inflation.
(ii) The bankers’ bank: The Central Bank provides facilities for other banks
especially commercial banks to keep their cash reserve and clear their
balance through the cleaning house. It also grants loans to or discount the
bills of commercial banks when they are short of fund; hence the Central
Bank is referred to as ‘lender of last resort’.
(iii) Banker to the government: The Central Bank keeps the accounts of the
government and of all its corporations and agencies. It receives all payments
due to the government, as well as undertake borrowing on behalf of the
government through the issuance of short-term and long-term securities e.g.
treasury bills, treasury certificates and long term securities e.g. development
stocks. The Central bank is also responsible for the management of domestic
and external debts of the government.
(iv) Promotion of monetary stability: The Central Bank controls money supply
in the economy to promote price stability. This involves the use of

NOTE: This is a work in progress. All topics in the syllabus are covered but editing for necessary corrections is in progress.
Thanks.
271
instruments of monetary policy such as open market operations (OMO),
reserve requirements, discount rate, etc.
(v) Foreign exchange management: To ensure that foreign exchange
disbursement and allocation are consistent with economic priorities, the
Central Bank acquires, allocates and monitors the use of scarce foreign
exchange resources as well as maintains the country`s foreign exchange
reserves.
(vi) Supervision of finance houses: In every modern economy, the Central
Bank is backed by law to monitor and supervise the activities and practices of
financial houses in order to promote effective execution of monetary policy.
13.4.2 Developmental Functions of The Central Bank
These are activities of the Central Bank to promote growth in various sectors of the
economy.
(i) Promotion of the growth of financial markets: The Central Bank usually
initiate instruments of mobilizing short-and long-term funds in both the
money and capital markets.
(ii) Promotion of development of financial institutions: The Central Bank
participates actively (morally and financially) in the establishment of
development banks e.g. Bank of Industry (BOI) and Nigeria Agricultural Co-
operative and Rural Development Bank (NACRDB) in Nigeria, as well as non
bank financial institutions including the Stock Exchange.
(iii) Human capital development: The Central Bank participates directly and
indirectly in the training of manpower for the banking industry. For example,
in Nigeria, the CBN is involved in the activities of the Chartered Institute of
Bankers of Nigeria (CIBN) and the Financial Institution-Training Centre (FITC).
(iv) Establishment of special schemes and funds: The Central Bank promotes
special schemes and funds in the areas of agricultural finance, export
development and small and medium scale enterprises so as to enhance

NOTE: This is a work in progress. All topics in the syllabus are covered but editing for necessary corrections is in progress.
Thanks.
272
economic development. Examples in Nigeria include the Agricultural Credit
Guarantee Scheme Fund (ACGSF) and Small and Medium Industries Equity
Investment Scheme (SMIEIS).
(v) Sources of data for research: Through its regular publications, the Central
Bank provides information on financial indices and indicators for use in
research and development (R&D) efforts.
13.5 DEVELOPMENT BANKING
Development banks or Development Financial Institutions (DFIs) are
specialized financial institutions established to contribute to the
development of specific sectors of the economy e.g. industrial, commence,
agricultural, rural, urban and housing sectors. The role of development
banks, especially in low-income countries (LICs) include:
(i) Provision of medium and long-term loans for investment in various
sectors agriculture, manufacturing and commerce.
(ii) Identification, promotion and development of viable projects for the
private sector.
(iii) Advice and assistance to indigenous businesses. This includes
financial technical and managerial advice to ensure profitable
outcomes.
(iv) Directly investing in agriculture, housing, and mining sector of the
economy
(v) Supervising the implementation of projects, they financed but
requesting progress reports and visiting the project sites,
(vi) They commission and/or carry out studies into the social and
economic needs of the economy with a view to making policy
recommendations to the government.
(vii) They develop in the citizens, entrepreneurial ability and support their
efforts with take-off loans.
(viii) They serve as a channel for bringing into the local economy investible
funds from international organisations.

NOTE: This is a work in progress. All topics in the syllabus are covered but editing for necessary corrections is in progress.
Thanks.
273
(viii) Nominating technical and managerial partners to both local and
especially foreign investors thereby promoting foreign direct
investments (FDIs).
Examples of DFIs in Nigeria include the Nigeria Agricultural Cooperative and
Rural Development Bank (NACRDB), Bank of Industry (BOI) and Urban
Development Bank (UDB)
13.6 OTHER FINANCIAL INSTITUTIONS
Some of the other institutions that play intermediating roles within the financial
system are discussed below.
13.6.1 Finance Companies
Finance companies are institutions that specialize in short-term non-bank financial
intermediation.
Their activities include:
i. Mobilising funds from the investing public in the form of borrowing and
providing facilities for local purchase order (LPO), project financing ,
equipment leasing, hire purchase, and debt factoring;
ii. Helping companies to establish efficient management structures and
controls; and
iii. Providing corporate finance advice such as on capital restructuring and
project financing services.
13.6.2 Discount Houses
Discount houses are financial institutions which intermediate funds between the
Central Bank, licensed banks and other financial institutions. Their activities include:
i. Mobilizing funds for investment in short-term securities, especially treasury
securities and other shor-term financial instruments by providing
discounting/re-discounting facilities.

NOTE: This is a work in progress. All topics in the syllabus are covered but editing for necessary corrections is in progress.
Thanks.
274
ii. Assisting financial institutions to effectively manage their idle cash balances
by bringing together surplus and deficit units in the money market.
iii. Underwriting issues of treasury securities thereby promoting monetary policy
objectives.
13.6.3 Insurance Companies
Insurance companies consisting of life and non-life institutions are also important
financial intermediaries in any economy. Their main functions are:
i. Mobilising relatively long-term funds in the form of premiums from policy
holders thereby promoting savings in the economy.
ii. Investing its funds in bonds, stocks, mortgages and government securities, in
the process contributing to effective utilization of scarce investible resources.
iii. Providing palliatives in the form of `claims` where a policy holder suffers a
loss. Hence, they encourage asset acquisition and facilitate the growth of
commerce and industry.
13.7 MONEY AND CAPITAL MARKETS
The money and capital markets are financial in markets created and nurtured by a
country`s monetary authorities to mobilize savings for economic growth.
13.7.1 The Money Market
The money market is a market for short-term loans. It consists of financial
institutions having surplus funds to lend on short-term basis, and those wishing to
borrow. The market allocates savings into investment thereby promoting rational
allocation of resources. It also encourages savings and investment habits by
promoting liquidity and safety of financial assets.
Institutions that operate in the market include the Central Bank, commercial banks,
and discount houses. The major short-term instruments associated with the Nigerian
money market include treasury securities, commercial papers, call money, Bankers
Unit Fund, Bankers` Acceptances, etc.

NOTE: This is a work in progress. All topics in the syllabus are covered but editing for necessary corrections is in progress.
Thanks.
275
13.7.2 The Capital Market
The Capital market is a market for mobilizing medium and long-term funds. It is a
market for new issues of securities as well as for trading in existing securities. The
major instruments for raising funds in the capital market include equities,
debentures, bonds, and stocks.
The main institutions in the market are the stock exchange, the issuing houses, and
the stock broking firms.
13.8 MONETARY POLICY
In this section we consider the meaning, instruments and targets of monetary policy.
13.8.1 Monetary Policy Defined
Monetary policy refers to the combination of measures designed to regulate the
value, supply and cost of money in the economy in consonance with the expected
level of economic activity. An expansionary monetary policy is that which is designed
to increase money supply, while a contractionary or restrictive monetary policy is that
which is intended to reduce money supply.
13.8.2 Instruments of Monetary Policy
he main instruments or tools of monetary policy vary between economies an over
time. However, the main instruments of monetary policy are:
i. Open market operations (OMO): This refers to purchases and sales of
securities in the open market by Central Bank in oder to achieve the desired
level of money stock in the economy. To reduce money supply, the Central
Bank will sell securities in the open market. Conversely, to increase money
supply it will require the purchase of government securities.
ii. Reserve requirements: This refers to the proportion of the total deposit
liabilities of the commercial and merchant banks which they are required by
law to keep as reserve with the Central Bank. The reserve requirements i.e
cash reserve ratio and liquidity ratio will be increased to reduce money
supply or reduced to increase money supply.

NOTE: This is a work in progress. All topics in the syllabus are covered but editing for necessary corrections is in progress.
Thanks.
276
iii. Discount rate: It is the minimum lending rate of the Central Bank at which it
rediscounts bills and government securities, or the rate charged by the
Central Bank on its loans to the commercial and merchant banks as a lender
of last resort. It is used to regulate credit conditions and availability in the
economy because other rates depend on it.
iv. Moral suasion: It is the use of persuasion rather than compulsion by the
Central Bank to get other financial institutions to adopt a pattern of
behaviours that is favourable to effective conduct of the monetary policy.
v. Special deposits: Sometimes, commercial and merchant banks are required
by law to hold a non-interest bearing special deposit with the Central Bank to
complement other contractionary monetary policy measures.
vi. Selective credit control: It involves issuance of credit guidelines to
commercial and merchant banks to direct their credit facilities to the so-
called favoured or preferred sectors of the economy.
vii. Credit ceiling: It is a directive by the Central Bank prescribing the growth rate
of credit expansion by the commercial and merchant banks. This is to ensure
stability in both the domestic and external sectors of the economy.
13.8.3 Monetary Policy Targets
The instruments of monetary policy can be manipulated in different ways by Central
Bank to achieve macroeconomic objectives of full employment, economic growth,
price stability, and balance of payment (BOP) equilibrium.
Monetary policy and inflation: The problem of inflation will call for contractionary
monetary policy measures:
i. Sales of government securities (under OMO)
ii. Increase of reserve requirements
iii. Increase of discount rate
iv. Call for special deposit

NOTE: This is a work in progress. All topics in the syllabus are covered but editing for necessary corrections is in progress.
Thanks.
277
All of these will reduce money supply and aggregate demand in the economy and
thereby operate to stem the inflationary pressure.
Monetary Policy and full employment: To raise the level of employment and
output in the economy will require adoption of expansionary monetary policy
measures i.e a reverse of the measures listed above for inflation.
13.9 SUMMARY AND CONCLUSION
This chapter dealt with banking and non-banking financial institutions, the money and
capital markets and the roles they play in the modern economy. It also treated
monetary policy, especially how it can be employed to influence the level of economic
activities in a developing economy.
14.10 REVISION QUESTIONS
SECTOION A: Multiple-Choice Questions
1. Which of the following is not a function of commercial banks?
A. Accepting deposits of money
B. Issuing and distributing currency notes and coins
C. Providing foreign exchange services
D. Granting loans and advances
E. Safe keeping of valuable items
2. Which of the following controls money supply in the economy to promote economic
growth and development?
A. Commercial banks
B. Development banks
C. Finance companies
D. Discount houses
E. Central Bank
3. One of the primary functions of development banks is
A. Providing medium and long-term loans for viable projects.

NOTE: This is a work in progress. All topics in the syllabus are covered but editing for necessary corrections is in progress.
Thanks.
278
B. Granting short-term loans for the development of private properties.
C. Accepting deposits from government agencies.
D. Printing of the country’s currency notes and coins.
E. Supervision of finance houses.
4. The practice whereby two or more banks agree to finance a large project is called
A. Overdraft facility
B. Bill of exchange
C. Loans syndication
D. Equipment leasing
E. Debt factoring
5. Which of the following is a relevant monetary policy measure to stem inflationary
pressures?
I. Purchase of government securities
II. Lowering of discount rate
III. Increasing reserve requirements
A. I only
B. II only
C. III only
D. I and II only
E. I, II and III together
CHAPTER THIRTEEN
Section A: Solutions to Multiple Choice Questions
1. B
2. E
3. A
4. C
5. C
SECTION B: Short Answer Questions

NOTE: This is a work in progress. All topics in the syllabus are covered but editing for necessary corrections is in progress.
Thanks.
279
1. Given the initial deposit of N 240,000 and cash reserve ratio of 5% in the commercial
banking system, the maximum money that can be created is ……………………..
2. The apex institution of the monetary and banking system in a country is known as
…………………………
3. The non –banking financial institution which intermediates funds between the
central bank, licensed banks and other financial institutions is called……………
4. The market for short term loans is …………………
5. The policy designed to regulate the value, supply and cost of money in an economy
is referred to as ………………………
SOLUTION TO SHORT ANSWERS QUESTIONS
CHAPTER THIRTEEN 1. N4,800,000 or N4.8 million 2. Central Bank 3. Discount Houses 4. Money market 5. Monetary policy

NOTE: This is a work in progress. All topics in the syllabus are covered but editing for necessary corrections is in progress.
Thanks.
280
CHAPTER FOURTEEN
FUNDAMENTALS OF PUBLIC FINANCE
14.0 LEARNING OBJECTIVES
After studying this chapter, you should be able to:
Identify alternative sources of government revenue.
Account for the growth in government expenditure, especially in developing
countries.
Distinguish between direct and indirect taxes; progressive, regressive and
proportional taxes.
Explain the general uses of taxation, and specifically as a tool for implementing
government fiscal policy.
14.1 INTRODUCTION
Public finance is concerned with the revenue – raising and spending activities of the
government and, especially how such activities affect the economic life of people.
Bhatia (2002) identified five main areas of the subject matter of public finance.
revenue
i. The theory of public revenue: This aspect deals with alternative sources of
government revenue taxation, non-tax revenue, public debt and creation of
additional currency notes and coins.
ii. Theory of public expenditure: How government through its expenditure,
influences financial flows in the economy, and how public expenditure serves
as a tool for implementing growth, welfare and other policies of government.
iii. Financial administration: The formulation, execution, and auditing of
government budgetary policies and related matters.
iv. Stabilization, growth and distributive justice: The financial implications of
government economic policies meant to promote issues relating to all these.

NOTE: This is a work in progress. All topics in the syllabus are covered but editing for necessary corrections is in progress.
Thanks.
281
v. Federal Finance: An analysis of issues and problems relating to inter-
governmental financial flows where multilevel or federal system of
government exists.
It is evident from the above discussion that public finance explores the principles and
problems of the public sector of the economy.
14.2 GOVERNMENT REVENUE
Government exists in every society to perform a number of functions which are
critical to the general well-being of the people. Such functions include:
i. Provision of legal framework and a social environment conducive to the
effective operation of the price system.
ii. Creation and maintenance of social and economic infrastructure e.g. roads,
bridges, electricity, pipe-borne water, sanitation, etc. They are called public
goods or social overheads.
iii. Redistribution of income e.g through direct transter payments or welfare
programmes for the vulnerable members of the society.
iv. Re-allocation of resources, and
v. Promotion of macroeconomic objectives
To be able to perform these and other related functions, however, government
requires some funds. Government revenue is the income which accrues to the
government to enable it perform its traditional functions.
Sources of government revenue are conventionally classified into two:- tax revenue
and non-tax revenue.

NOTE: This is a work in progress. All topics in the syllabus are covered but editing for necessary corrections is in progress.
Thanks.
282
(a) Tax Revenue: A tax is a compulsory contribution imposed by the government on
individual, business or institutions without any service rendered to the tax payer in
return. The composition of the various taxes in total tax revenue i.e. the tax
structure varies from one country to the other.
With the exception of major oil exporting countries like Nigeria and other
members of Organisation of Petroleum Exporting Countries (OPEC), tax revenue
constitutes the major part of government revenue in most countries.
(b) Non – Tax Revenue: Sources of non-Tax revenue include
i. Fees, Fine, and Specific charges: These include fees received from services
rendered by government e.g. court fees, school fees, stamp duties, fines
imposed for violating government rules, charges like water rates, vehicles
licences, toll fees, contrators’ registration fees.
ii. Rents, Royalties, and Profits: These are income derived from the use of
government property, profits from government business enterprises and
income from mining rights.
iii. Grants: These are income received in the form of aid from other countries
or from international organization, in most cases, to finance specific
developmental programmes. But all grants are voluntary gifts and are thus
very uncertain source of government revenue.
iv. Loans: These are incomes generated by borrowing from private individuals
or business within the country (domestic public debt) or from foreign
countries or international financial institutions (external public debt).
14.3 GOVERNMENT EXPENDITURE

NOTE: This is a work in progress. All topics in the syllabus are covered but editing for necessary corrections is in progress.
Thanks.
283
This refers to government spending in the performance of its functions as identified
in the preceding section. They are usually classified into two: recurrent expenditure
and capital expenditure.
14.3.1. Recurrent Expenditure
These are expenditures on running costs of government – that is, expenses incurred
in the maintenance of government’s administrative machinery. Such expenditures
include salaries and wages of public servants and members of armed forces, interest
on public debts, travel and transport expenses, charges for utility services enjoyed
e.g. electricity bill, etc.
14.3.2 Capital Expenditure
This refers to government spending on projects which are not recurrent in nature,
especially developmental projects that enhance the productive capacity of the
economy as well as improve the general standard of living of the people. Expenses
on the construction and maintenance of roads, bridges, dams, schools, and hospitals
readily fall within this category.
14.3.3 Functional Classification of Government Expenditure
In a typical developing economy, each of recurrent and capital expenditures is
usually grouped into the following headings:
a. General Administration: These are expenditures on defence, police and the
cost of running the entire civil service.
b. Social and community services: These are expenditures on health care,
education, public housing and other items which promote social and
community development.
c. Economic Services: These are payments that take the form of a gift i.e.,
they are not for good exchanged or service rendered and they need not be
repaid e.g. pension payments, unemployment allowance, payments to
victims of national disasters like flood, fire, bird flew and motor accidents as
well as bilateral grants.

NOTE: This is a work in progress. All topics in the syllabus are covered but editing for necessary corrections is in progress.
Thanks.
284
Direct Money Transfers are usually a very important instrument of
government to share money among the tiers of governments, as well as
make payments to service debts.

NOTE: This is a work in progress. All topics in the syllabus are covered but editing for necessary corrections is in progress.
Thanks.
285
14.3.4 Growth of Public Expenditure
In most countries of West Africa, government expenditure has been growing over
time. The reasons for this cannot be far fetched.
a. Increasing population: As the population increases, there are many more
people requiring schools, hospitals, and other government-supplied
amenities.
b. Inflation: Government expenditure usually exhibits a rising trend because of
rising price level over time. For example, items of government expenditure
become more expensive and contracts and salaries are periodically adjusted
upward in line with inflation rate.
c. Crises and wars: It costs more to arrest crisis and also to prosecute wars e.g.
civil wars in Nigeria, Liberia, Sierra Leone and Sudan.
d. Growth in national income: The growth of public expenditure is functionally
and positively related to national income. As the level of national income
rises, so also is the level government expenditure.
e. Development projects: After independence, most West African governments
embarked on development projects, especially in the areas of dam
construction, electricity, water supply, etc. The implementation of such
projects has partly explained the growth in government expenditure.
f. Public debt servicing: The servicing of both domestic and external public
debts requires large payments of interest and principal as they fall due. This
has also contributed significantly to the growth of government expenditure.
g. Increased urbanization: Increasing rate of rural urban migration of people
also translates into increasing demand for social amenities such as road,
water supply, electricity, sanitation services, and consequently an increase in
government expenditure.
h. Changing political and bureaucratic structure: As borne out of Nigerian
experience, the various changes in its administrative and bureaucratic
structure, from a four regional structure, to nineteen and now thirty six
states have meant an upsurge in public expenditure in administration and
governance.
i. Promotion of technological progress: To accelerate economic growth and
development most West African countries established research institutes of

NOTE: This is a work in progress. All topics in the syllabus are covered but editing for necessary corrections is in progress.
Thanks.
286
various kinds. The need for adequate and regular funding of such agencies
has also led to the growth of government expenditure.
14.4 TAXATION
A tax is a compulsory levy payable by individuals and business organizations to the
government without receiving any definite corresponding service or good directly
from the government i.e. without quid pro quo.
14.4.1 Elements In A TAX
There are three elements in a tax, the base, the rate, and the yield.
(a) Tax Base: This is the object being taxed. For example, in personal income
tax, the tax base is the taxpayers income (salary), while in value added tax
(VAT), taxpayers expenditure is the tax base.
(b) Tax rate: This refers to the proportion of the tax base which is paid in tax. It
is usually expressed as a flat rate (lump sum) or as a percentage.
(c) Tax Yield: It is the amount of revenue received by the government from tax.
14.4.2 Principles of Taxation
A good tax system should have certain attributes. These are:
a. Equity: Every taxpayer should pay tax in proportion to his income i.e.
taxpayers should make equal sacrifice by pay the same percent of their
incomes in tax. This is also known as ability to pay principle.
b. Convenience: Taxes due should be paid at times most convenient to the
taxpayer.
c. Certainty: The taxpayer should know in advance the exact amount to pay
and when to make the payment.
d. Economy: The cost of assessing and raising taxes should be kept to a
minimum.

NOTE: This is a work in progress. All topics in the syllabus are covered but editing for necessary corrections is in progress.
Thanks.
287
e. Flexibility: It should be possible at any time to revise the tax structure to
meet the revenue requirements of government without delay and at no
significant extra costs.
f. Productivity: A tax should bring large revenue which should be adequate for
the government.
g. Simplicity: A tax should not be difficult to administer and understand so as
not to breed problems of differences in interpretation. Its calculations must
be simple.
The first four principles were first mentioned by the acknowledged founder of modern
economics, Adam Smith (1723 – 1790), in his famous book – The Wealth of Nations (1776).
He referred to these principles as cannons of taxation.
14.4.3 Direct Versus Indirect Taxes
Taxes are classified as direct or indirect based on the method of payment or in terms
of their incidence i.e. how their burden is shared.
(a) Direct Taxes: These are taxes levied directly on the incomes of individuals and
business enterprises. The burden of direct taxes falls directly on the taxpayers, but
they are usually progressive. Examples of direct taxes include personal income tax,
company tax, capital gain tax, capital transfer tax, petroleum profit tax.
i) Personal Income Tax: It is levied as a graduated tax on the income of individuals after
reliefs and allowances in respect of personal needs, wife, children, dependent
relatives, pension fund, life insurance, research effort, etc. Have been deducted. The
pay-as-you-earn (PAYE) scheme is applied to people in employment. The personal
income tax satisfies most of the criteria for a good tax system as specified in sub-
section (15.4.2)
ii) Company Tax: This is levied on the net profits of companies. That is, it is applied to
the whole of a company’s profit after deducting depreciation and other allowances.

NOTE: This is a work in progress. All topics in the syllabus are covered but editing for necessary corrections is in progress.
Thanks.
288
iii) Capital Gain Tax: This is a tax on the appreciated value of an asset on disposal. This is
usually caused by inflation.
iv) Capital Transfer Tax: This tax applies to both life – time and after death transfer of
wealth.
v) Petroleum Profit Tax: This tax is levied specifically on the profits of oil companies. It
has been a major source of government revenue in Nigeria since the oil boom started
in the early 1970s.
b) Indirect Taxes: These are taxes levied on goods and services. The burden of such
taxes first fall on the manufacturers, wholesalers or importers who passed it on to the
consumers through upward review of prices. Examples of indirect taxes are import
duties, export duties, excise duties, value-added tax (VAT), and sales tax.
i) Import Duties: These are taxes levied on goods which are imposed from
other countries. Apart from being a source of government revenue, import
duties is also used to protect import substitution industries (ISIs) and to
correct adverse balance of payments.
ii) Export Duties: These are taxes which are levied on goods that are exported
to other countries. In West Africa, export duties are paid on agricultural
products such as cocoa, cotton, rubber, cashew, etc.
iii) Excise Duties: These are taxes levied on goods which are manufactured
within the country. In most West African countries, excise duties are paid on
commodities such as soft drinks, cement, textiles, beer, cigarettes, plastic
products, etc.
iv) Sales Tax: This is levied on goods as they are purchased by the consumer
from the seller. The producer or seller adds the tax to the cost of the product
especially for a commodity whose demand is price inelastic.

NOTE: This is a work in progress. All topics in the syllabus are covered but editing for necessary corrections is in progress.
Thanks.
289
v) Value – Added – Tax (VAT): It is a consumption tax levied on business at
every stage of production and distribution on the value they add to the raw
materials and other inputs. The tax is borne by the final consumer of goods
and services because it is included in the price paid. It has wide coverage as
it applies to most goods and services. VAT was introduced in Nigeria in
January 1994 to replace Sales Tax.
Some of the advantages of direct taxes over indirect taxes include that they are based on
ability to pay and their collection is economical, especially with reference to PAYE method.
On the other hand, a major disadvantages of direct taxes is that they can be easily evaded,
whereas evasion rate is relatively low for direct taxes.
14.4.4 Progressive, Regressive, and Proportional Taxes
An alternative classification of taxes is according to the proportion of a person’s
income ( or the tax base) which is paid in tax.
a) Progressive Tax: A tax is progressive if the proportion of income paid in tax
varies directly with the level of income. That is, the higher the income, the
higher the proportion of that income which is paid in tax. Personal income
tax is a good example of a progressive tax.
b) Regressive Tax: A tax that takes lower percentage of income as income rises.
The most regressive tax of all is the poll tax under which every person pays
the same amount in tax, irrespective of each person’s income.
c) Proportional Tax: A tax is said to be proportional if taxpayers pay the same
percentage of their incomes in taxes, at any level of income. An example of
proportional tax is the company tax.

NOTE: This is a work in progress. All topics in the syllabus are covered but editing for necessary corrections is in progress.
Thanks.
290
The concept of progressive, regressive and proportional taxes can be illustrated using either
Table 15.1 or Figure 15.1 as shown below.
Income
(1)
Progressive Tax
(2)
Regressive Tax
(3)
Proportional Tax
(4)
James
Kofi
Kabiru
N5 million
N10 million
N2 million
2%=100000
3%=300000
5%=600000
5%=250000
3%=300000
2%=240000
5%=250000
5%=500000
5%=600000
Figure 15.1 Progressive, Regressive, and Proportional Taxes
Progressive Tax
5% Proportional Tax
Regressive Tax
Income (Cedis)
Note specifically that column 4 of Table 15.1 shows a proportional tax of 5 percent. All
individuals pay the same percentage of income in tax, but the main amount increases as
income increases.
14.4.5 Uses of Taxation
The various ways by which taxation can be used to further the growth and
development processes, especially in a developing economy are outlined below:
(i) To finance government expenditure: The primary purpose of imposing taxes is to
generate revenue for the financing of government activities including
maintenance of administrative machinery of government and financing socio-
economic infrastructures.
Tax
rate
%

NOTE: This is a work in progress. All topics in the syllabus are covered but editing for necessary corrections is in progress.
Thanks.
291
(ii) To manage the economy: Government can grant tax concessions to local
industries to stimulate production activities in the domestic economy during
economic depression or raise personal income tax to lower aggregate
demand during the period of inflation.
(iii) To redistribute income and wealth: Under a progressive tax system more
money is taken from the rich than from the poor. Such money used to
provide public goods that are equally beneficial to both the rich and the poor.
(iii) To protect infant industries: Import duties on imported goods that have local
substitutes are raised to protect import substituting industries.
(iv) To correct balance of payments deficit: A tax on imports especially on non-
essential items will also serve to reduce import volume and consequently
reduce the deficits in the current account component of the country’s overall
balance of payments account.
(v) To discourage the consumption of certain goods: High import duties on
harmful goods will raise the price at which they are available and serve to
discourage their consumption.
14.5 GOVERNMENT BUDGET
A national budget is a document containing estimates of expected government
revenue and intended expenditure for the coming year. It usually consist of the
review of the performance of the immediate preceding budget, objectives of the
present budget, revenue projection, estimates of current and capital expenditures as
well as policy measures to promote the achievement of the stated objectives.
14.5.1 Types of Budget
There are basically three types of budget.
a. Surplus budget: A surplus budget occurs when the government revenue is
planned to exceed the proposed government expenditure. It can be achieved
by reducing government expenditure or increasing taxation or both. A

NOTE: This is a work in progress. All topics in the syllabus are covered but editing for necessary corrections is in progress.
Thanks.
292
surplus budget is usually adopted to reduce inflationary pressures because it
reduces aggregate effective demand in the economy.
b. Deficit Budget: A deficit budget occurs when the government revenue estimate is less
than the proposed government expenditure. The fiscal deficit can be financed by
raising loans from both internal and external sources. A deficit budget may be used to
stimulate domestic production during economic recession or depression.
c. Balanced Budget : A government budget is balanced when its revenue estimate is
equal to the proposed expenditure. It is also called neutral budget because it is
usually adopted to keep the level of economic activities relatively stable as in the
preceding year.
14.5.2 Sources of Finance for a Deficit Budget
The main sources of finance for government fiscal deficit are:
(i) Internal borrowing: This involves raising loans from the bank and non-bank
public within the country. This could be through the sale of government
securities.
(ii) External borrowing from Bilateral Creditors: A bilateral credit is provided by
one government to another. Such credits are intended for development
projects in the recipient country.
(iii) External borrowing form Multilateral Creditors: This involves raising of
loans from international institutions funded by member nations. They
include the World Bank, International Monetary Fund (IMF), African
Development Bank (ADB), etc.
(iv) External borrowing from Paris and London clubs: These are official and
commercial creditors respectively. The Paris club is formed by governments
of some advanced industrialized countries, while members of London Club
are commercial banks mainly in industrialized countries.

NOTE: This is a work in progress. All topics in the syllabus are covered but editing for necessary corrections is in progress.
Thanks.
293
(iv) Drawing down on external reserves: An external reserve is like saving of a
country. The government may decided to draw from the external reserves to
meet the discrepancy between revenue and expenditure.
(vi) Printing of currency: Instead of borrowing, a country may decide to print
more money currency to finance fiscal deficit. But most countries rarely
adopt this option because of its inflationary consequences.
14.6 PUBLIC DEBT
Public debt refers to the total outstanding debt obligations or accumulated borrowing
of the government. Public debt is usually divided into two: domestic public debt that
which is owed by the government to its citizens, and external public debt the total
money owed by the government to overseas government and residents. A
government will resort to borrowing to finance its fiscal deficits.
14.6.1 Sources of Public Debt
Public debt may be contracted through the following sources:
a. Internal sources: Public debt can be procured within the country through the
purchase of government securities by commercial and merchant banks,
central bank, and non-bank private individuals and financial institutions who
subscribe to instruments such as treasury securities bonds and development
stocks.
b. External sources: Most countries have contracted external public debt
through the following sources;
i. Paris Club of Creditors: It represents only government guaranteed
creditors. Membership includes the United States of America, United
Kingdom, Federal Republic of Germany, France and Ghana who
guarantees and export activities of their nationals through their
Official Export Credit Agencies.

NOTE: This is a work in progress. All topics in the syllabus are covered but editing for necessary corrections is in progress.
Thanks.
294
ii. London Club of creditors: These are mainly uninsured and
unguaranteed debts extended by commercial banks in some
industrialised countries to nationals of debtor nations.
iii. Multilateral creditors: These are international institutions funded by
member nations. They include the World Bank Group, International
Monetary Fund (IMF), African development Bank (ADB) Group,
International Fund for Agricultural Development (IFAD), etc. These
institutions provided credit for development purposes, balance of
payments support and private ventures.
iv. Bilateral Creditors: A bilateral credit is provided by a government to
another government. Bilateral credits are usually meant for
developmental projects in the recipient country.
14.6.2 Economic Bases for Public Debt
Government borrowing may be justified on the following grounds.
(i). Capital formation: Debts can be translated into real capital stock which in
turn enhance the growth of the economy.
(ii) Investment opportunities: The availability of public debt gives private
investors, public corporation, state, and local government an opportunity to
buy government securities which are virtually risk free (gilt-edge).
(iii) Stabilisation of the economy: A large public debt can serve as an automatic
fiscal stabilizer. A good proportion of the public debt is by the banking
system to control the supply of money.
(iv) Provision of development finance: Most development projects that are
critical to the development of low income countries like those in West African
sub-region e.g dams, water supply etc. are financed by external loans.

NOTE: This is a work in progress. All topics in the syllabus are covered but editing for necessary corrections is in progress.
Thanks.
295
14.6.3 Argument Against Public Debt
Public debt has several disadvantages such as:
(i) Problem of debt financing: If public debt is financed by selling bond
to the public, it tends to crowd out private investment. This may lead
to loss of employment opportunities and income.
(ii) Problem of debt servicing: Government may result to increasing
taxation to be able to pay interest on the loan and the principal to the
creditors. This may reduce work and investment incentives
(iii) Inflationary potential: The expectation that loan facilities are readily
available may tempt the government into undertakings that are
inflationary and economically unviable.
(iv) Distortion of income distribution: Debt services and positive rate of
interest would enhance the economic status of bondholder. During
the period of unanticipated inflation, government (as the debtor)
tends to gain at the expense of the public holders of government
securities.
14.7 FISCAL POLICY
Fiscal policy is the use of taxation and government expenditure to regulate economic
activity, Fiscal policy can be employed to achieve macroeconomic objectives of full
employment, economic growth, external balance, price stability, and equitable
distribution of income and wealth.
For example, a period of economic recession or depression characterized by sluggish
economic growth with rising unemployment would call for an increase in the level of
government expenditure (especially to raise aggregate demand), as well as tax reliefs
and concessions to local industries to stimulate domestic production. These measures
are collectively referred to as expansionary fiscal policy.
On the other hand, to control inflation pressure would require contractionary fiscal
measures such as curtailing the growth of government spending, and raising taxes to
reduce disposable income and aggregate demand.

NOTE: This is a work in progress. All topics in the syllabus are covered but editing for necessary corrections is in progress.
Thanks.
296
14.8 SUMMARY AND CONCLUSION
In this chapter, we discussed sources of government revenue, pattern and growth of
government expenditure, taxation, government budget, public debt and fiscal policy –
all as vital components of the subject matter of public finance.
14.9 REVISION QUESTIONS
SECTION A – Multiple Choice Questions
1. Which of the following statements is/are not true?
I. A major disadvantage of direct taxes is that they can be easily evaded.
II. To protect infant industries requires lowering import duties.
III. A deficit budget may be used to promote economic growth.
A. I only
B. II only
C. III only
D. I and II only
E. I, II and III together
2. A surplus budget is best adopted during
a. Economic recession
b. War time
c. Economic depression
d. Unemployment crisis period
e. Inflationary period
3. Which of the following sources of finance for government fiscal deficit has strong
inflationary potential?
A. Printing of currency notes and coins
B. Sales of government securities
C. Borrowing from IMF
D. Borrowing from bilateral creditors
E. Borrowing from World Bank

NOTE: This is a work in progress. All topics in the syllabus are covered but editing for necessary corrections is in progress.
Thanks.
297
4. Which of the following statements is/are true of national budget?
I. It is an estimate of government revenue and expenditure for the coming year
II. It refers to accumulated borrowing of government
III. It is an instrument of government economic policy
A. I only
B. II only
C. III only
D. I and II only
E. I, II and III together
5. Which of the following statement is/are true of taxation?
I. A tax is progressive if the percentage of income paid in tax varies inversely
with the level of income.
II. The tax base is the proportion of income paid in tax.
III. A regressive tax is a tax that takes a lower percentage of income as income
rises.
A. I only
B. II only
C. III only
D. I and II only
E. I, II and III together
CHAPTER FOURTEEN
Section A: Solutions to Multiple Choice Questions
1. B
2. E
3. A
4. D
5. C
SECTION B – SHORT ANSWER QUESTIONS
1. The taxies levied on goods and services are called………………………

NOTE: This is a work in progress. All topics in the syllabus are covered but editing for necessary corrections is in progress.
Thanks.
298
2. The aspect of economics that concerns with revenue raising and spending
activities of the government is called………………………
3. The famous economist who first developed the principle of taxation usually
referred to as connons of taxation is ……………………..
4. A compulsory levy on individuals and business organisations by the
government is……………………………
5. The government spending on developmental projects that enhance
productive capacity of an economy is called…………..
SOLUTION TO SHORT ANSWERS QUESTIONS
CHAPTER FOURTEEN
1. Indirect taxes
2. Public finance
3. Adam smith
4. Tax
5. Capital expenditure

NOTE: This is a work in progress. All topics in the syllabus are covered but editing for necessary corrections is in progress.
Thanks.
299
CHAPTER FIFTEEN
INFLATION AND UNEMPLOYMENT
15.0 LEARNING OBJECTIVE
After studying this chapter, you should be able to:
Define inflation
Explain the two main theories of inflation viz. Demand Pull and Cost Push.
Identify and explain five causes of inflation.
Explain five effects of inflation.
Explain how demand management policies and supply side policies could be used
to control inflation.
Explain the meaning of unemployment.
Identify and explain types of unemployment.
15.1 MEANING OF INFLATION
Inflation describes a persistent and an appreciable increase in the general price level.
The inflation rate is measured as a percentage change in a price index, such as the
consumer price index (CPI).
15.2 THEORIES OF INFLATION
15.2.1 Demand Pull Inflation: It describes a sustained increase in the general price level
that is caused by a permanent increase in nominal aggregate demand. Simply, is can
be viewed as an inflation that occurs as a result of increase in aggregate demand.
When aggregate demand exceeds aggregate supply at current prices, prices are
pulled upwards to equilibrate aggregate supply and demand.
Figure 15.1: Demand Pull Inflation
Price Level
AS0
E1
P1
P0 E0
AD1
AD0
Excess aggregate
demand at P0

NOTE: This is a work in progress. All topics in the syllabus are covered but editing for necessary corrections is in progress.
Thanks.
300
Y0 Y1 Q = Y = Output In figure 15.1, an increase in aggregate demand from ADo to AD1 given the aggregate
supply creates demand at P0. This causes price levels to increase from P0 to P1. A
new equilibrium is established at point E1 with output at Y1 and at a higher price
level of P1. The continuous repetition of this process will lead to a sustained increase
in the price level with characterizes demand-pull inflation.
15.2.1 Cost Push Inflation or supply Inflation: It is a situation where the process of
increasing price level is caused by increasing costs of production which push up
prices.
Cost push inflation is also referred to as supply inflation. Price level in this case
increases due to an increase in business costs e.g. wage increase, high interest rates,
etc. These increases in prices occur in the face of high unemployment and slacken
resource utilization. The increase in cost of production causes supply of final goods
and services to fall. This creates excess aggregate demand and a new equilibrium is
attained at a higher price level..
Figure 15.2 Cost-Push Inflation
Price level
P3 E3
P2 E2
P1 E1
AD0
Y3 Y2 Y1 Q =Y = Output
Figure 15.2 illustrates the process of cost push inflation. The aggregate demand and
aggregate supply curves interest at point ‘E1’ and the general price level is p1 and
output is at Y1. Assuming there is an increase in cost of production via increased
wages throughout the economy, the aggregate supply curve will shift upward from
As1 to As2. The general price level will increase and output will fall from Y1 to Y2. If
this process continues it leads to another round of increase in cost of production.
Aggregate supply falls from AS2 to AS3 and the general price level, rises from P2 to P3.
Output will fall again to Y3.
AS3
AS2
AS1

NOTE: This is a work in progress. All topics in the syllabus are covered but editing for necessary corrections is in progress.
Thanks.
301
15.3 CAUSES OF INFLATION
(i) Excessive growth in wages relative to productivity can cause inflationary pressures. This cause aggregate demand to increase relative to aggregate supply and pulls up prices level.
(ii) Government sector causes. Changes such as an increase in government expenditure can produce an increase in the price level in the economy via increased aggregate demand.
(iii) Price shocks. These are substantial increases in the prices of some items, for
example, due to drought, floods, or massive oil price hike. These increases in the prices of these items may feed into cost of production. Aggregate output may fall and given the aggregate demand the price level is pushed up.
(iv) Excessive growth in money supply relative to the level of production in the
economy. This causes the level of aggregate demand in the economy to increase relative to aggregate output, shortages occur and the price level rises.
(v) Changes in exchange rate. If the external value of the domestic currently falls
relative to other nations’ currencies this may be inflationary. Under this circumstance imported goods become more expensive and this may add to domestic cost and price structure in the economy fuelling inflation.
(vi) Fall in Output. Due to war, natural disaster or even high cost out put can fall and supply constrained relative to demand.
15.4 EFFECTS OF INFLATION
(i) On income Earners: Those on fixed incomes or assets in nominal terms) lose. However, those on incomes, which are directly related to the price level, real incomes may remain relatively unchanged or may even increase.
(ii) On Profits: Generally, profits increase when the inflation is the demand pull
type and decline when the inflation is the cost push type. During demand
pull inflation the prices of final goods and services tend to be more flexible in
an upward direction than many other prices.
(iii) On Lenders and Borrowers: Inflation tends to encourage borrowing and
discourage lending. This is to because what is borrowed today which could
have been used to purchase, say a bowl of gari today, would not enable the
creditor to purchase the same bowl of gari when the loan is paid back. This is
true only when nominal interest rate is fixed or rises at a lower pace than
inflation.

NOTE: This is a work in progress. All topics in the syllabus are covered but editing for necessary corrections is in progress.
Thanks.
302
(iv) On Production: Demand pull inflation may lead to inefficiency in production
since competitive pressures to improve both product and performance will
be greatly reduced. Cost push inflation however, puts a premium on
efficiency.
(v) On Foreign Trade: Rising domestic prices can hurt exports. If domestic
prices are rising faster than the rest of the world prices, exports will fall and
imports will tend to increase and this will invariably affect our net exports
and may have devastating balance payment implications.
15.5 CONTROL OF INFLATION
How inflation is controlled in an economy depends on the causes and the type of
inflation economy is experiencing.
15.5.1 Use of Fiscal Policy
Fiscal policy is one of the two main macroeconomic policies used to control
aggregate demand and thereby achieve economic stability. Fiscal measures relate to
taxation, government expenditure and public debt management, which seek to
influence the level of aggregate demand in an economy.
There are three main tools of fiscal policy viz. government spending (G), the income
tax rate (t) and government transfer payments (Tr). In times of demand pull inflation
these tools are used to reduce aggregate demand. All increase in tax rate, decrease
in government expenditure and decline in government transfer payment will reduce
aggregate expenditure in the economy. That is, there is contractionary fiscal policy.
15.5.2 Use of Monetary Policy
Monetary policy is that part of macroeconomic policy which regulates the changes in
money supply in order to maintain price stability.
Tools of monetary policy are changing discount rate (d); changing required reserve
ratio (rr) reduces the extent to which commercial banks create credit hence reduces
money supply. When the discount rate is increased short term interest rates
increase and this discourages borrowing to finance investment spending. This
invariably reduces aggregate demand. Central bank selling of its own government
securities to the general public reduces money supply which reduces aggregate
demand. Generally, there will be contractionary monetary policy.
We employ Figure 15.3 to illustrate how monetary and fiscal policies shift the
aggregate demand curve.

NOTE: This is a work in progress. All topics in the syllabus are covered but editing for necessary corrections is in progress.
Thanks.
303
Figure 15.3: Effect of Monetary and Fiscal Policy on Aggregate Demand
Price Level
AS0
E0
P0
P1
AD0
AD1
0
Y0 Q = Y = Output
In the mainstream macroeconomics, monetary policy shifts the aggregate
demand curve of an economy.
In Figure 15.3, the equilibrium price level is P0 and the equilibrium aggregate
output is Y0. If the central bank increases the discount rate (d) or engages in
open market sales or increases the required reserve ratio the AD-curve shifts
to the left (aggregate demand falls) from AD0 to AD1 and the price level
declines to P1 o. This is known as restrictive monetary policy. The central
bank in an attempt to fight inflation may embark on restrictive monetary
policy.
Contractionary fiscal policy via reduction in government expenditure (G),
decrease in transfer payments (Tr) and increase in the income tax rate (t),
would also cause the AD0 to shift to AD1.
15.5.3 Income and Price Policy
Income Policy measures may take the form of wage freeze, linking wage
increases to increase in productivity.
Price Policy may also be used. Maximum prices are used in this case. These
prices are the highest possible legal prices for scarce goods. However, these
prices may lead to queues, rationing and black marketing in scarce products.
15.5.4 Supply Side Policies
In addition to the demand management policies, supply side policies could
also be used in controlling inflation. This however is a long-term measure.
The following may increase aggregate supply. Increasing productivity in all

NOTE: This is a work in progress. All topics in the syllabus are covered but editing for necessary corrections is in progress.
Thanks.
304
sectors of the economy. Increases in productivity may increase output,
which will subsequently increase supply. This may be achieved by the
retraining of labour, improving technology, removing all structural rigidities
e.g. land tenure system, poor road infrastructure e.t.c.
15.6 UNEMPLOYMENT
15.6.1 Definition
It refers to a situation where people who are willing and able to work do not
find jobs at the existing wage rate. For a person to be referred to as
unemployed he or she must be qualified for a job, willing to work at the
current wage rate and unable to find a job.
15.6.2 Types of Unemployment
(a) Frictional Unemployment; It refers to unemployment caused by
changes in individual labour markets. This is the type of
unemployment resulting from people who have left jobs that did not
work out and are searching for new employment or people who are
either entering or re-entering the labour force to search for a job.
(b) Structural Unemployment: This is unemployment resulting from
changes in the pattern of demand for goods and services or changes
in technology. These changes may in turn alter the structure of the
total demand for labour rendering some particular skill less in demand
or may become obsolete. The demand for other skills however may
expand. Unemployment in this case is the result of the composition
of the labour force which does not respond quickly to new structures
of job opportunities.
(c) Cyclical Unemployment: This is the type of unemployment resulting
from decline in real aggregate output in the economy. It can also be
defined as unemployment caused by deficiency of aggregate or total
spending. This is sometimes referred to as deficient-demand
unemployment.
(d) Seasonal Unemployment: This occurs as a result of seasonal
fluctuations in employment. For example in the cocoa season – there
will be demand for more farm hands. These farm hands are laid off
after the cocoa season.
15.7 SUMMARY AND CONCLUSIONS

NOTE: This is a work in progress. All topics in the syllabus are covered but editing for necessary corrections is in progress.
Thanks.
305
Inflation describes a persistent and an appreciable increase in the general price
level. The inflation rate is measured as a percentage change in a price index, such as
the consumer price index.
Demand Pull Inflation describes a sustained increase in the general price level that is caused
by a permanent increase in nominal aggregate demand. Cost Push or Supply Inflation is a
situation where the process of increasing price level is caused by increasing costs of
production which push up prices.
Unemployment refers to a situation where who are willing and able to work do not find jobs
at the existing wage rate. For a person to be referred to as unemployed he or she must be
qualified for a job, willing to work at the current wage rate and unable to find a job.
15.8 REVISION QUESTIONS
SECTION A: Multiple Choice Questions
CHAPTER FIFTEEN
1. The following are instruments of monetary policy except:
A. Cash reserve ratio
B. Taxation
C. Moral suasion
D. Discount rate
E. Selective credit control
2. Which of the following types of unemployment is caused by changes in the technology?
A. Frictional
B. Structural
C. Cyclical
D. Seasonal
E. voluntary
3. when aggregate demand exceeds aggregate supply, the result is
A. cost push inflation
B. demand-pull inflation
C. imported inflation
D. spiral inflation
E. creeping inflation
4. The following are negative effects of inflation except:
A. Increase in real income
B. Discourages lending
C. Borrowers gain
D. Value of imports may increase
E. Inefficiency in production
5. Which of the following can be used to check inflation caused by excess demand?
A. Reduction in cash reserve ratio
B. Increase in government expenditure
C. Reduction in income taxes
D. Increase in discount rates

NOTE: This is a work in progress. All topics in the syllabus are covered but editing for necessary corrections is in progress.
Thanks.
306
E. Purchase of treasury bills in open market operation
SOLUTION TO MULTIPLE CHOICE QUESTIONS
CHAPTER FIFTEEN
1. B
2. B
3. B
4. A
5. D
SECTION B: Short Answer Questions
1. An inflation that occurs as a result of increase in aggregate demand is known
as…………………………….
2. The term that describes the policy of reducing government spending and increasing
the income tax is called………………………..
3. A situation where people who are willing and able to work at prevailing wage rate do
no find jobs is called………………………..
4. Increase in price level caused by increasing costs of production is termed
…………………….
5. Define Open Market Operation (OMO) .
Solution To Short Answers Questions
CHAPTER FIFTEEN
1. Demand pull inflation
2. Contractionary or restrictive fiscal policy
3. Unemployment
4. Cost push inflation
5. Open Market Operation is the sale and purchase of government securities (Treasury
bills).
1. With the aid of diagrams, explain
i. Demand-pull inflation

NOTE: This is a work in progress. All topics in the syllabus are covered but editing for necessary corrections is in progress.
Thanks.
307
ii. Cost-push inflation

NOTE: This is a work in progress. All topics in the syllabus are covered but editing for necessary corrections is in progress.
Thanks.
308
Answer
a. Demand Pull Inflation: It describes a sustained increase in the general price level that
is caused by a permanent increase in nominal aggregate demand. Simply, is can be
viewed as an inflation that occurs as a result of increase in aggregate demand.
Price Level
AS0
E1
P1
P2 E0
AD0
AD1
0
Y0 Y1 Q = Y = Output
In Figure 16.1, an increase in aggregate demand from AD0 to AD1 given the aggregate
supply creates excess demand at P0. This causes price levels to increase from P0 to P1.
A new equilibrium is established at point E1 with output at Y1 and at a higher price
level of P1. The continuous repetition of this process will lead to a sustained increase
in the price level, which characterizes demand-pull inflation.
Cost Push or Supply Inflation: It is a situation where the process of increasing price
level is caused by increasing costs of production which push up prices.
Cost push inflation is also referred to as supply inflation. Price level in this case
increases due to an increase in business costs. These increases in prices occur in the
face of high unemployment and slacken resource utilization. The increase in cost of
production causes supply of final goods and services to fall. This creates excess
aggregate demand and a new equilibrium is attained at a higher price level.
Excess aggregate
at demand P0

NOTE: This is a work in progress. All topics in the syllabus are covered but editing for necessary corrections is in progress.
Thanks.
309
Figure 15.2 Cost-Push Inflation
Price Level AS3
AS2
AS1
P3 E3
P2 E2
P1 E1 AD1
AD0
ADO
Y3 Y2 Y1 Q =Y = Output
The Figure above illustrates the process of cost push inflation. The aggregate
demand and aggregate supply curves intersect at point ‘E1’ and the general price
level is P1 and output is at Y1. Assuming there is an increase in cost of production via
increased wages throughout the economy, the aggregate supply curve will shift
upward from AS1 to AS2. The general price level will increase and output will fall from
Y1 to Y2. If this process continues it leads to another round of increase in cost of
production. Aggregate supply falls from AS2 to AS3 and the general price level, rises
from P2 to p3. Output will fall again to Y3.
QUESTION 15.2
(a) Explain briefly Demand Pull Inflation and Cost-Push Inflation.
(b) State and explain four effects of inflation on an economy
Answer
a. Demand Pull Inflation: It describes a sustained increase in the general price level
that is caused by a permanent increase in nominal aggregate demand. Simply, it can
be viewed as an inflation that occurs as a result of increase in aggregate demand.
Cost Push or Supply Inflation: It is a situation where the process of increasing price
level is caused by increasing costs of production which push up prices. Cost push
inflation is also referred to as supply inflation. Price level in this case increases due
to an increase in business costs. These increases in prices occur in the face of high
unemployment and slacken resource utilization. The increase in cost of production
causes supply of final goods and services to fall. This creates excess aggregate
demand and a new equilibrium is attained at a higher level.

NOTE: This is a work in progress. All topics in the syllabus are covered but editing for necessary corrections is in progress.
Thanks.
310
Two points to note about Demand Pull and Cost Push Inflation.
(i) It must be used noted that in both processes, inflation is caused by excess
demand. It is the cause of this excess demand that distinguishes one from
the other.
(ii) Demand pull inflation may cause an increase in output up to the potential
output level whilst cost push inflation causes supply (output) to fall and the
economy declines further away from potential output.
(b) Any four of the following effects of inflation:
(i) On Income Earners: Those on fixed incomes or assets (fixed in nominal
terms) lose. However, those on incomes, which are directly related to the
price level, real incomes may remain relatively unchanged or may even
increase.
(ii) On Profits: Generally, profits increase when the inflation is the demand pull
type and decline when the inflation is the cost push type. During demand
pull inflation the prices of final goods and services tend to be more flexible in
an upward direction than many other prices.
(vi) On Lenders and Borrowers: Inflation tends to encourage borrowing and
discourage lending. This is so because what is borrowed today which could
have been used to purchase, say a bowl of gari today, would not enable the
creditor to purchase the same bowl of gari when the loan is paid back. This is
true only when nominal interest rate is fixed or rises at a lower pace than
inflation.
(vii) On Production: Demand pull inflation may lead to inefficiency in production
since competitive pressures to improve both product and performance will
be greatly reduced. Cost-push inflation however, puts a premium on
efficiency.
(viii) On Foreign Trade: Rising domestic prices can hurt exports. If domestic
prices are rising faster than the rest of the world prices, exports will fall and
imports will tend to increase and this will invariably affect our net exports
and may have devastating balance of payment implications.
QUESTIION 15.3
a. Identify and explain three causes of inflation in your country.
b. Explain three measures your country can use to control inflation.

NOTE: This is a work in progress. All topics in the syllabus are covered but editing for necessary corrections is in progress.
Thanks.
311
Answer
a. Any three of the following causes of inflation
i. Excessive growth in wages relative to productivity can cause inflationary
pressures. This causes aggregate demand to increase relative to aggregate
supply and pulls up prices level.
ii. Government sector causes. Changes such as an increase in government
expenditure can produce an increase in the price level in the economy via
increased aggregate.
iii. Price shocks. These are substantial increases in the prices of some items, for
example, due to drought, floods, or massive oil price hike. These increases in
the prices of these items may feed into cost of production. Aggregate output
may fall and given the aggregate demand the price level is pushed up.
iv. Excessive growth in money supply relative to the level of production in the
economy. This causes the level of aggregate demand in the economy to
increase relative to aggregate output, shortages occur and the price level
rises.
v. Changes in exchange rate. If the external value of the domestic currency
falls relative to other nations’ currencies this may be inflationary. Under
this circumstance imported goods become more expensive and this may
add to domestic cost and price structure in the economy fuelling inflation.
vi. Fall in Output. Due to war, natural disaster or even high cost output can fall
and supply constrained relative to demand.
b. Any three of the following measures to control inflation
i. Fiscal policy is one of the two main macroeconomic policies used to control
aggregate demand and thereby achieve economic stability. Fiscal measures
relate to taxation, government expenditure and public debt management,
which seek to influence the level of aggregate demand in an economy. There
are three main tools of fiscal policy viz government spending (G), the income
tax rate (t) and government transfer payment (Tr). In times of demand pull
inflation these tools are used to reduce aggregate demand. An increase in
tax rate, decrease in government expenditure and decline in government
expenditure and decline in government transfer payment will reduce
aggregate expenditure in the economy.
ii. Monetary policy is that part of macroeconomic policy which regulates the
changes in money supply in order to maintain price stability. Tools of
monetary policy are changing discount rate (d); changing required reserve
ratio (rr) reduces the extent to which commercial banks create credit hence

NOTE: This is a work in progress. All topics in the syllabus are covered but editing for necessary corrections is in progress.
Thanks.
312
reduces money supply. When the discount rate is increased short term
interest rates increase and this discourages borrowing to finance investment
spending. This invariably reduces aggregate demand. Central bank selling of
its own government securities to the general public reduces money supply
which reduces aggregate demand.
iii. Income Policy: These measures may take the form of wage freeze, linking
wage increases to increase in productivity.
iv. Price controls may also be used. Maximum prices are used in this case.
These prices are the highest possible legal prices for scarce goods. However,
these prices may lead to queues, rationing and black marketing in scarce
products.
v. Supply Side Policies: In addition to the demand management policies, supply
side policies could also be used in controlling inflation. This however is a
long-term measure. The following may increase aggregate supply: increasing
productivity in all sectors of the economy. Increases in productivity may
increase output, which will subsequently increase supply. This may be
achieved by the retraining of labour, improving technology, removing all
structural rigidities e.g. land tenure system, poor road infrastructure etc.
QUESTION 15.4
(a) What is meant by unemployment?
(b) Explain three types of unemployment?
Answer
(a) Unemployment refers to a situation where people who are willing and able to work
do not find jobs at the existing wage rate. For a person to be referred to as
unemployed he or she must be qualified for a job, willing to work at the current
wage rate and unable to find a job.
(b) Any thereof the following types of unemployment:
i. Frictional Unemployment:- It refers to unemployment caused by changes
in individual labour markets. This is the type of unemployment resulting
from people who have left jobs that did not work out and are searching for
new employment or people who are either entering or re-entering the labour
force to search for a job.
i. Structural Unemployment: This is unemployment resulting from changes in
the pattern of demand for goods and services or changes in technology.
These changes may in turn alter the structure of the total demand for labour
rendering some particular skill less in demand or may become obsolete. The

NOTE: This is a work in progress. All topics in the syllabus are covered but editing for necessary corrections is in progress.
Thanks.
313
demand for other skills however may expand. Unemployment in this case is
the result of the composition of the labour force which does not respond
quickly to new structures of job opportunities.
ii. Cyclical Unemployment: This is the type of unemployment resulting from
decline in real aggregate output in the economy. It can also be defined as
unemployment caused by deficiency of aggregate or total spending. This is
sometimes referred to as deficient-demand unemployment.
QUESTION 15.5
(a) Who is an unemployed person?
(b) Explain the following types of unemployment.
i. Frictional
ii. Structural
iii. Cyclical
Answer
(a) For a person to be referred to as unemployed he or she be qualified for a job, willing
to work at the current wage rate and unable to find a job.
(b)
(i) Frictional Unemployment: It refers to unemployment caused by changes in
individual labour markets. This is the type of unemployment resulting from
people who have left jobs that did not work out and are searching for new
employment or people who are either entering or re-entering the labour force to
search for a job.
(ii) Structural Unemployment:- This is unemployment resulting from changes in the
pattern of demand for goods and services or changes in technology. These
changes may in turn alter the structure of the total demand for labour rendering
some particular skill less in demand or may become obsolete. The demand for
other skills however may expand. Unemployment in this case is the result of the
composition of the labour force which does not respond quickly to new
structures of job opportunities.
(iii) Cyclical Unemployment: This is the type of employment resulting from decline in
real aggregate output in the economy. It can also be defined as unemployment
caused by deficiency of aggregate or total spending. This is sometimes referred
to as deficient-demand unemployment.

NOTE: This is a work in progress. All topics in the syllabus are covered but editing for necessary corrections is in progress.
Thanks.
314

NOTE: This is a work in progress. All topics in the syllabus are covered but editing for necessary corrections is in progress.
Thanks.
315
CHAPTER SIXTEEN
INTERNATIONAL TRADE AND FINANCE
16.0 LEARNING OBJECTIVES
After studying this chapter, you should be able to:
Explain reasons for International trade.
Give a detailed account of the theory of Comparative Cost Advantsge.
Explain the advantages and disadvantages of international trade.
Explain the Terms of Trade and Balance of Payments.
Identify and explain trade barriers.
Explain methods of protecting international trade.
Give an account of foreign exchange markets.
16.1 MEANING OF INTERNATIONAL TRADE
It refers to the exchange of goods and services between countries. Goods sold to
other countries are referred to as exports and goods bought from them are dubbed
as International trade also involves movement of capital between countries.
16.2 BASIS OR REASONS FOR INTERNATIONAL TRADE
The underlining basis of trade is the same, whether trade takes place between
individuals or between business enterprises, on a regional basis within a country or
internationally between countries. Under this section we answer the question “
Why nations trade?” There have been various answers to this question, some of
which are:
(i) From the supply side differences in factor endowment: Countries are endowed
differently e.g. differences in climate and soil, differences in availability of natural
resources, differences in capital endowment and differences in labour skills.
These differences translate into differences in the abilities of countries to
produce goods and services. Some Countries, because of their factor
endowment can produce certain goods chapter than other countries. For e.g.
Nigeria is endowed with crude oil and natural gas. These can be produced
cheaper in Nigeria than in Ghana. Ghana therefore imports them from Nigeria.
This is an example of International trade.

NOTE: This is a work in progress. All topics in the syllabus are covered but editing for necessary corrections is in progress.
Thanks.
316
(ii) From the demand side, the need to satisfy certain wants.
Countries are faced with demand for goods and services that their factor
endowment cannot produce. In order to satisfy these wants they are sourced from
foreign countries as imports. Nigeria imports capital equipment for its oil sector
from the rest of the world. The rest of the world imports crude oil from Nigeria.
We acknowledge here that the bottom line for the existence of international trade is
differences in cost of production across countries.
16.3. THE THEORIES OF INTERNATIONAL TRADE
Under this section we develop the theories of Absolute Advantage and
Comparative Cost Advantage.
16.3.1 The Theory of Absolute Advantage
Adam Smith postulated that each country should specialize in those commodities
she can produce. At the lower absolute cist than other countries. He made this
assertion when he was writing about Division of labour and specialization in
international trade in his “Wealth of Nations” in 1776.
Adam Smith above argued for free trade by comparing nations to households.
Since every household finds it prudent to produce only some of its needs and to
buy others with products it can sell, the same should apply to nations.
Adams Smith, assuming a two (2) good and a two (2) country world, concluded
that trade is mutually beneficial if one nation has an absolute advantage in the
production of one good and the other nation has absolute advantage in the
production of the second good.
Illustration of Absolute Advantage
Assume a two nation (Nigeria and Ghana), a two good (Crude Oil and Cocoa)
model. Assume again that only one factor of production (Labour) is used and
each nation has the same amount of labour. Now, suppose that each nation
devotes half of its limited resources (Labour) to the production of Crude Oil and

NOTE: This is a work in progress. All topics in the syllabus are covered but editing for necessary corrections is in progress.
Thanks.
317
the other half to the production of cocoa. The production totals without trade
are shown in Table 16.1 below.
Table 16.1: Production and Consumption Totals without trade
In Table 16.1. Nigeria produces 20 units of Crude Oil combined with 10 units of cocoa.
Ghana on the other hand, produces 10 units of Crude Oil combined with 20 units of Cocoa.
From Table 16.1. Nigeria has an absolute advantage in Crude Oil production because given
the same labour resources more of crude oil is produced in Nigeria. Ghana has an absolute
advantage in cocoa production; given the same resources more cocoa can be produced in
Ghana than Nigeria.
According to the theory of Absolute Advantage Specialization and trade would be beneficial
to Nigeria and Ghana. Nigeria should specialize completely in Crude Oil production whilst
Ghana specializes completely in cocoa production. The production totals are depicted in
Table 16.2
Table 16.2: Production after Specialization
Nation
Crude Oil (units)
Cocoa (units)
Nigeria
40 0
Ghana
0 40
Table 16.2. Shows the production totals after specialization. Nigeria now produces 40units
of Crude and Zero (0) unit of Cocoa. Ghana, after specialization produces zero (0) crude oil
and 40 units of cocoa. Total World Output increased after specialization based on the
theory of absolute advantage. Gains from specialization based on absolute advantage are
10 units each of crude oil and cocoa. Some of the assumptions underlying the theory of
Absolute Advantage are
Nation Crude oil (units)
Cocoa Units
Nigeria
20 10
Ghana
10 20

NOTE: This is a work in progress. All topics in the syllabus are covered but editing for necessary corrections is in progress.
Thanks.
318
1. Factors of production are perfectly mobile within each nation and they can
be instantly switched between industries. However, factors are immobile
between countries, though final goods and services can be traded.
2. There are constant returns to scale and constant average costs of
production in both industries.
3. The limited resources and factors of production in each nation are fully
employed.
4. These are no transport costs between the two countries.
5. The theory assumes value in real magnitude entirely different from
monetary phenomenon i.e. in units of crude oil and cocoa.
16. 3.2 The theory of Comparative Cost Advantage
Adam Smith’s theory of absolute advantage fails to explain the basis of trade
in situation where a country has absolute advantage in the production of
both goods.
David Ricardo in his “Principle of Political Economy and Taxation” published
in 1817 proved that even if a nation has absolute advantage in the
production of both commodities it is still possible for trade to exist between
them for which countries could benefit. He pointed out that what was
relevant therefore was comparative advantage and not absolute advantage.
According to Ricardo, absolute advantage is not a sufficient condition for
mutually beneficial trade. According to him the sufficient condition for
mutually beneficial trade is a pattern of comparative advantage across
nations.
According to the theory of comparative advantage whether or not one of the
two countries is in absolute terms more efficient in the production of every
commodity than the other, if each specializes in the product in which it has a
greater comparative advantage trade will be mutually beneficial.

NOTE: This is a work in progress. All topics in the syllabus are covered but editing for necessary corrections is in progress.
Thanks.
319
Illustration of Comparative Advantage
From the previous example in Table 16.1. suppose that a nation becomes more
efficient in both Crude Oil and Cocoa Production. Now if each nation devotes half of
its resources to each good the production totals are:
Table 16.3: Production and Consumption Totals without trade
Nation
Crude Oil (units)
Cocoa (units)
Nigeria 30 15
Ghana 5 10
Table 16.3 shows that Nigeria has an absolute advantage over Ghana in the
production of both crude oil and cocoa. Both commodities can be produced more
cheaply in Nigeria than in Ghana. In this case the principle of absolute advantage
fails to explain the reason for specialization and trade.
The principle of comparative cost advantage is needed here to explain the basis for
specialization and trade. With given resources, more of each good could be
produced in Nigeria than in Ghana. To determine which good Nigeria and Ghana to
specialize in we need to calculate the opportunity cost ratios. These are done in
Table 16.4. below.
Table 16.4. Opportunity Cost ratio of Production
In Nigeria, the opportunity cost of producing one unit (1) of crude oil in terms of
cocoa is ½ unit of cocoa. This means that if Nigeria needs one more unit of crude oil
they must be prepared to reduce the production of cocoa by ½ units. It also means
Nigeria Ghana
Opportunity cost of Producing one unit (1) Of crude oil in terms of Cocoa.
15/30 = ½ unit cocoa
10/5 = 2unit of cocoa
Opportunity Cost of Producing one unit (1) Of cocoa in terms of Crude oil
30/15 = 2 units of crude oil
5/10 = ½ unit of crude oil

NOTE: This is a work in progress. All topics in the syllabus are covered but editing for necessary corrections is in progress.
Thanks.
320
that a unit of crude oil in Nigeria costs ½ unit of cocoa. In Ghana, the opportunity
cost of producing one unit (1) of cocoa in terms of crude oil is 2 units of cocoa. That
is, in Ghana, the price of a unit of crude oil equals 2 units of cocoa.
Nigeria (which has the absolute advantage in both commodities) possesses a
comparative advantage in crude oil production, whereas Ghana (with an absolute
disadvantage in both has comparative advantage in cocoa production. Nigeria
specialises in crude oil and Ghana in cocoa.
16.4. ADVANTAGES AND DISADVANTAGES OF INTERNATIONAL TRADE
16.4.1. Advantages
(i) It leads to increase total world production of goods and services. International
trade based on comparative cost advantage allows countries to specialise in what
they can best. This allows for increase in output and invariably increases in the
volume of total world output.
(ii) It leads to efficiency in use of world resources. International trade is based on
specialization in what you can do best. This means each country involved in
international trade uses the resource available to her in the most efficient way and
hence world resources are efficiently used.
(iii) It leads to availability of variety of goods and services. International trade makes
citizens of nations to consume goods and services their resources cannot be used to
produce.
(iv) International trade leads to economies of scale. International trade leads to increase
output and firms involved in producing for exports may enjoy cost reducing
advantages that go with increased output.
(v) International trade brings about interdependence. This, politically, may help a
nation to be conscious of the existence of other nations. The interdependence of
nations helps promote good neighbourliness.
16.4.2. Disadvantages
(i) It may lead to collapse of infant firms. These are young firms not enjoying
economies of scale and producing at high unit cost. If International trade is allowed
cheap imports are brought in and these may lead to the collapse of infant firms.

NOTE: This is a work in progress. All topics in the syllabus are covered but editing for necessary corrections is in progress.
Thanks.
321
(ii) International trade may lead to excessive interdependence. This may have negative
effects on the Country in times of crises Ghana and Nigeria, Nigeria may halt its
exports of crude oil to Ghana.
(iii) It may lead to unemployment. If through international trade infant firms collapsed
in a country their employees will be laid off and it will create unemployment.
(iv) International trade may lead to dumping. Dumping occurs when goods are old in
foreign countries below their cost of production at home. This will under-cut
competition in the foreign country and destroy local firms.
16.5 TERMS OF TRADE
These are various terms of trade viz. The commodity or net barter terms of trade,
income Terms of trade, single factorial terms of trade and double factorial terms of
trade. We discuss here the commodity terms of trade.
The Commodity or Net Barter Terms of Trade is the rate at which a country’s exports
are exchanged for its imports for a given period of time. In other words, it is the
ratio of the price index of the nation’s exports (Px) to the price index of imports (Pm)
multiplied by 100.
T12004 = Index of export prices (Px) x 100
Index of import prices (Pm) 1
For example, if we take 2005 as the base year then TT equals 100. Suppose that by
the end of 2005 the nation’s Px declined by 20% (to 80%), while its Pm rose by 10%
(to 110%) then this nation’s commodity or net barter terms of trade would be
T12005 = (80/110) 100 = 72.73
This means that between 2004 and 2005 thr nation’s export prices fell by 27.27% in
relation to its Import prices. This also means that given the current export and
import price indexes, the nation Needs 27.27% more of its exports to buy the same
volume of imports in 2005 as in 2004.
Variations in the terms of trade can be described as favourable/improvement or
unfavourable/Deterioration. In the example above, between 2004 and 2005 the
nation’s Terms of Trade deteriorated. We summarize the descriptions of the
movements in the Terms of Trade below.

NOTE: This is a work in progress. All topics in the syllabus are covered but editing for necessary corrections is in progress.
Thanks.
322
(Px/Pm) increases it implies improvement/favourable in Terms of Trade
(Px/Pm) declines it depicts deterioration/unfavourable in Terms of trade
16.6. REASONS FOR TRADE PROTECTION
In this section we introduce the reader to various reasons for trade protection in
spite of the benefits from free trade.
(i) The protection of infant firms: Infant industries are those firms, which are
young. The absence of economies of scale to them makes their unit cost of
production higher than older and efficient firms in other countries. Protection
may be justified during the early growth of an infant firm. As the infant firms
grow, skills and productivity, as well as economies of scale will grow, so
increasing the firms’ relative competitive advantage.
(ii) To protect domestic labour against cheap foreign labour: The theory comparative
cost advantage assumes that factors of production are both fully employed and
mobile within countries. If large-sale unemployment exists within a country,
protection may be used to increase employment.
(iii) Protection against dumping: It could be looked at as the export of commodities
priced below cost of production. Dumping is generally looked upon as an unfair
trading practice and for that reason industries fearing competition from
dumped goods asks for tariffs to protect them. An export subsidy is a salient
form of dumping. Export subsidies are direct payments made or the granting of
tax relief and subsidized loans to the nation’s exporters or potential exporters so
as to stimulate the nation’s exports. These make the nation’s export price
competitive on the international markets.
(iv) National Security: Some key industries such as agriculture and industries
producing goods that are important for the defence of the country must be
maintained. Countries therefore protect these industries.

NOTE: This is a work in progress. All topics in the syllabus are covered but editing for necessary corrections is in progress.
Thanks.
323
(v) To raise revenue: Tariffs are sometimes justified as a means of raising revenue
for the government, but in modern economies this is a comparatively
unimportant source of government revenue.
16.7: TRADE BARRIERS
Under this section we discuss methods used to protect international trade. We
will discuss three main methods.
(a) Tariffs: These are taxes imposed on traded commodities as they cross
national boarders. These are two main types of tariffs. An import tariff is a
duty on an imported commodity.
Export tariff is a duty on an exported commodity.
Tariffs may be specific, and valorem or compound (a combination of an ad
valorem and specific tariff). The effect of a tariff on imports depends on its
size and the elasticity of demand for the imported commodity. If demand for
the imports is elastic, a tariff imposed will reduce imports by switching
demand towards the domestically produced substitutes. Conversely, if
demand for imports is price inelastic, the main effect of the tariff will be on
import prices rather than on the quantity of imports.
(b) Domestic Subsidies: These may be provided in many forms to avoid
dumping. They are subsidies provided to certain domestic industries as a
means of protecting them from lower priced foreign goods. These subsidies
reduce the prices of the domestic products and make them more price-
competitive.
(c) Quotas: They are quantitative restrictions (non tariff restrictions) on the
imports and exports. They restrict the amount of commodities allowed to
be imported or exported. It may also involve total ban of some products
from being imported into the country.

NOTE: This is a work in progress. All topics in the syllabus are covered but editing for necessary corrections is in progress.
Thanks.
324
Other forms of non-tariff barriers are voluntary export restrain (VER), technical,
administrative and other regulations (these include safety regulation, health
regulation, packaging, labelling requirement etc).
16.8. BALANCE OF PAYMENT
16.8.1 Meaning
It is an account that summarizes a country’s total payments and total receipts from
international economic transactions within a specific period usually one year.
The main reason for compiling the balance of payments is to inform the government
authorities in a particular country of the international position of the country. It also
helps policy makers in taking decisions on monetary and fiscal policy on one hand,
trade and payment policies on the other.
16.8.2. The Accounting Principle of the Balance of Payment
Under the balance of payments international transactions are classified as
either credit (positive) or debits (negative). A credit transaction involves the
receipt of payment from a foreigner. A debit transaction is a transaction that
involves the making of payment to a foreigner.
The export of goods and services, unilateral transfers (gifts) received from
foreigners and capital inflows are recorded as credits (+). On the other hand,
the import of goods and services, unilateral transfers (gifts) made to foreigners
and capital outflows are recorded as debits (-).
16.8.3 The Accounts of the Balance of Payments
The Balance of payments has three main parts namely: the Current Account, the
Capital account and the Official Reserves Account.
(a) The Current Account
The Current account is subdivided into three main items: merchandise imports
and exports, services imports and exports and unilateral transfers.
Merchandise imports and exports are also referred to as visible trade and
services imports and exports and unilateral transfers dubbed invisible trade.
(i) Merchandise Account or Visible Trade: This records trade in merchandise, that
is, export and import of goods. Visible goods are for example, crude oil, timber,

NOTE: This is a work in progress. All topics in the syllabus are covered but editing for necessary corrections is in progress.
Thanks.
325
cars, etc. The difference between merchandise exports and Merchandise
imports is termed as the Balance of Trade.
When merchandise exports exceed visible merchandise import, the country is
said to have trade surplus. The country has a trade deficit if merchandise
imports exceed merchandise exports.
(ii) Services Accounts or Invisible Trade
The second section consists of services. It records the services of shipping and
civil aviation, insurance, dividends, profits, remittances, government services,
travel and tourism, banking services, etc. This section also includes unilateral
transfers (gifts), that is, money transferred to and from without rendering any
services.
Transactions on the current account except unilateral transfers are referred to
as autonomous meaning they are undertaken because of profit motive. The
difference between invisible exports and invisible imports is called the balance
of services. This is classified as favourable or unfavourable. When invisible
exports exceed invisible imports we have favourable balance of services, other
wise we have unfavourable balance of services.
The total of the current account is the sum of (1) merchandise trade account (2)
services account and (3) unilateral transfers.
(b) The Capital Account
The capital account deals with long and short-term capital movement. These
capital movements are referred to as autonomous because they take place
for business or profit motive. Long-term capital movements are overseas
investments in shares or long-term securities or from the establishment of
factories in foreign countries or the reporting country. The short-term are
usually portfolio investment.
The movement of capital to a country represents an inflow of foreign capital
and there is a corresponding outflow when such funds are withdrawn. An
inflow of funds represents credit while an outflow represents debit.
(c) Official Reserve Account
This part of the balance of payments informs us about how the balance of both
current and capital accounts taken together is settled. Transaction in this section

NOTE: This is a work in progress. All topics in the syllabus are covered but editing for necessary corrections is in progress.
Thanks.
326
is called accommodation transaction. They are accommodating transaction
because the funds are moved to make the balance of payments balance. When
the net balance on the current and capital accounts is in deficit, the deficit must
be settled with an equal net credit in the official reserve account. If on the other
hand, a country has a surplus, the surplus must be used up to balance the
balance of payments.
16.8.4. Balance of Payments Deficit and Surplus
(a) Balance of Payments Deficit: It refers to net deficit on current and capital
accounts. Some possible causes of balance of payments deficit are:
(i) Declining export earnings either due to falling export volume or
export price.
(ii) Rising import bills owing to rising import prices.
(iii) Rising domestic prices may discourage exports because our
exportables will become non price competitive in the world market.
Also rising domestic prices may encourage imports because imports
will become relatively cheap.
(iv) Overvalued currency: When a country’s currency is overvalued it
encourages flight of capital and reduces the inflow of autonomous
capital.
A deficit account may be financed by:
(i) Using a country’s gold reserves and foreign currency reserves.
(ii) Increasing the assets of foreigners in the country.
(iii) Selling investment overseas.
(iv) Borrowing from foreign governments, banks or the IMF, etc.
(b) Balance of Payments Surplus: It occurs when the total receipts on the current
and capital account exceed total payments on current and capital accounts. A
surplus on the balance of payments may be used in the following ways:
(i) To augment a country’s foreign reserves.
(ii) As loans to other countries.
(iii) To invest in businesses in other countries.
(iv) Buying assets abroad.

NOTE: This is a work in progress. All topics in the syllabus are covered but editing for necessary corrections is in progress.
Thanks.
327
16.9 FOREIGN EXCHANGE
16.9.1. Introduction
The foreign exchange market is an organizational setting within which individuals,
business firms, banks etc buy and sell foreign currency. It has no centralised meeting
place and not limited to one country.
The exchange rate is the amount of foreign currency that may be bought for I unit of
domestic currency. It is simply the price at which one currency can be traded for
another. If the US dollar sells for c9200, this defines the exchange rate between the
US dollar and the Ghanaian cedi.
16.9.2 Exchange Rate Regimes
There are basically two types of exchange rate regimes viz fixed and flexible regimes.
(a) Fixed Exchange Rate Regime
In a fixed exchange rate regime, the external value a country’s currency is
determined by explicit government policy and fixed at a certain amount of the
domestic currency per unit of foreign currency.
Periodic changes in the exchange rate by government are described as devaluation
or revaluation Devaluation refers to the deliberate reduction in the external value of
a domestic currency. On the other hand, revaluation is a deliberate increase in the
value of a country’s currency relative to other currencies.
The main advantages of fixed exchange rate are: (i)It removes the uncertainty
associated with the flexible exchange rate regime and brings stability. (ii) It also
indirectly imposes some anti inflationary discipline on policy makers since there is
need to maintain and defend the exchange rate.
In contrast, the main disadvantages are that the currency may stay overvalued or
under valued: may create a parallel foreign exchange market referred to as black
market.
(b) Flexible Exchange Rate Regime

NOTE: This is a work in progress. All topics in the syllabus are covered but editing for necessary corrections is in progress.
Thanks.
328
Under the flexible or freely floating exchange rate regime, the external value of a
country’s currency is determined by the forces of demand and supply. The exchange
rate for the country is the result of the interaction between demand and supply of
foreign currency. Many Countries of the world in recent times have adopted flexible
exchange rate with some modifications.
In a flexible exchange rate regime variations in the exchange rate are referred to as
depreciation or appreciation. Appreciation means the value of a country’s domestic
currency has increased relative to foreign currencies. Depreciation refers to a fall in
the value of a country’s domestic currency relative to foreign currencies. Like
appreciation, depreciation is used when a country operates a flexible exchange
regime where the forces of demand and supply determine the external value of a
country’s currency.
The main advantages of flexible exchange rate are: Automatic stabilisation of the
balance of payments: Under this regime any balance of payments disequilibrum is
rectified by a change in the exchange rate and it prevents overvaluation and
undervaluation of the domestic currency since its external value is determined by
demand and supply.
The arguments against flexible exchange rate are: Some degree of uncertainty may
be introduced into the economy since the value the currency changes from day-to-
day. It may also lead to speculation in the foreign exchange markets due to the day-
to-day changes in the currency’s value.
16.10 GLOBALISATION AND DEVELOPING COUNTRIES
Globalisation is multidimensional, affecting all aspects of life economic, cultural,
environmental and social including relating between nations of the world. However,
the focus here is globalization from economic perspective.
(a) The Concept of Globalisation
From the economic perspective, globalization may be defined as the increasing
interaction among, and integration of, the economic activities of nations around the
world. Specifically, globalization is characterized by an intensification of cross-border
trade and increased financial and foreign direct investment flows, promoted by rapid

NOTE: This is a work in progress. All topics in the syllabus are covered but editing for necessary corrections is in progress.
Thanks.
329
liberalization and advances in information technologies (Ajayi, 2001) and (Danas,
2001).
(b) Requirements for Globalisation
To participate in, and fully integrate into the global economy, developing countries
need to do the following:
i. Intensify promotion of free trade by removing trade barriers, adopting
appropriate exchange rate policies and diversify into export of manufactured
products.
ii. Promoted increased inflow of financial and foreign direct investments by
liberalizing investment laws, offering tax incentives, easing restrictions on
entry and profit remittances, strengthening the financial system and
improving security system to protect lives and properties.
iii. Promoting adequacy and upgrading of existing telecommunications and
transportation infrastructures to ease and reduce costs of communication
and transportation.
iv. Facilitate the movement of people across borders to promote integration
through human migration.
v. Ensure good governance by promoting macroeconomic discipline, limitation
of government’s role in the economy preventing and sanctioning all forms of
official and business corrupt practices.
vi. Promote the understanding and use of information and communication
technology (ICT) in international trade and payments system.
(c) Benefits from Globalisation
Developing countries can reap the following benefits if their economies are fully
integrated with the global economy.
i. Access to larger market resulting from widespread trade barriers. This would
promote large scale production and economics of scale, especially in areas
where they have comparative advantage.
ii. Increased employment opportunities as a result of the growth of local
industries and access to foreign job opportunities.
iii. A steady inflow of foreign exchange from workers’ remittances would boost
the positions of developing countries in international trade, especially giving
them access to foreign inputs required for rapid industrial growth.
iv. Contacts with developed nations would lead to acquisition of better skills,
experience, and exposure to the latest technologies which are also relevant
for economic growth.
To reap the benefits is listed above, governments in developing countries must
introduce comprehensive economic and political reforms that would prevent their

NOTE: This is a work in progress. All topics in the syllabus are covered but editing for necessary corrections is in progress.
Thanks.
330
economies from becoming dumping grounds for the goods of developed nations. In
this way, the benefits associated with globalization would translate into sustainable
economic growth and remarkable reduction in the incidence of poverty across
developing economies.
16.11 SUMMARY AND CONCLUSION
International trade refers to the exchange of goods and services between countries.
Goods sold to other countries are referred to as exports and goods bought from
them are dubbed as imports. International trade also involves movement of capital
between countries.
The bottom line for the existence of international trade is differences in cost of
production across countries.
Balance of payments is an account that summarizes a country’s total payments and
total receipts from international economic transactions within a specific period
usually one year.
The foreign exchange market is an organizational setting within which individuals,
business firms, banks etc buy and sell foreign currency, It has no centralised meeting
place and not limited to one country.
16.12 REVISION QUESTIONS
SECTION A: Multiple Choice Questions
CHAPTER SIXTEEN
1. The following are arguments for trade protections except:
A. Prevent dumping
B. Raise revenue for the government
C. Protect the newly established industries
D. To increase the import values
E. Reduction of dependency on foreign nations
2. When the value of visible exports exceed the value of visible imports, we have balance of
A. Payment surplus
B. Services surplus
C. Trade surplus
D. Payment deficit
E. Trade deficit
3. Under the flexible exchange rate regime, an increase in the value of a country’s currency in
relation to foreign currencies is called
A. Revaluation

NOTE: This is a work in progress. All topics in the syllabus are covered but editing for necessary corrections is in progress.
Thanks.
331
B. Devaluation
C. Depreciation
D. Appreciation
E. Nominal rate
4. Balance of payments deficit account may be financed by the following except
A. Selling investment overseas
B. Decreasing the assets of foreigners
C. Borrowing from foreign government
D. Using the country’s foreign reserves
E. Borrowing from IMF
5. Under the flexible exchange rate system, the exchange rate is determined by the
A. Government fiat
B. Forces of demand and supply
C. Minister of finance
D. Central bank governor
E. Oil producing countries
SOLUTION TO MULTIPLE CHOICE QUESTIONS
CHAPTER SIXTEEN
1. D
2. C
3. D
4. B
5. B
SECTION B: Short Answer Questions
1. The theory of comparative cost advantage in international trade was propounded by
………………………..
2. The exchange of goods and services between two countries is called………………..
3. The ratio of index of export prices to index of import prices expressed in percentage
is referred to as…………………
4. The excess of exports value over imports value of visible goods of a country is
called………………………..
5. Quantitative restrictions on imports and exports are referred to as ………………………….
Solution To Short Answers Questions
CHAPTER SIXTEEN
1. David Ricardo
2. Bilateral Trade
3. Commodity terms of trade

NOTE: This is a work in progress. All topics in the syllabus are covered but editing for necessary corrections is in progress.
Thanks.
332
4. Balance of trade surplus
5. Quotas
1. a) Explain any two (2) gains from International Trade.
b) Explain any three (3) reasons for imposing restrictions on International Trade.
c) Describe any two (2) measures used to restrict International Trade.
Answer
a. (any two points)
It leads to increased total world production of goods and services.
International trade based on comparative cost advantage allows countries to
specialise in what they can do best. This allows for increase in output and
Invariably increases in the volume of total world output.
It leads to efficiency in use of world resources. International trade is based
on specialization in what you can do best. This means each country involved
in international trade uses the resources available to her in the most efficient
way and hence world resources are efficiently used.
It leads to availability of variety of goods and services. International trade
makes citizens of nations to consume goods and services their resources
cannot be used to produce.
International trade leads to economies of scale. International trade leads to
increased output and firms involved in producing for exports may enjoy cost
reducing advantages that go with increased output.
International trade brings about interdependence. This, politically, may help
a nation to be conscious of the existence of other nations. The
interdependence of nations helps promote good neighbourliness.
b. (any three points)
The protection of infant firms: Infant industries are those firms, which are
young. The absence of economies of scale to them makes their unit cost of
production higher than older and efficient firms in other countries.
Protection may be justified during the early growth of an infant firm, As the
infant firms grow, skills and productivity, as well as economies of scale will
grow, so increasing the firm’s relative competitive advantage.

NOTE: This is a work in progress. All topics in the syllabus are covered but editing for necessary corrections is in progress.
Thanks.
333
To protect domestic labour against cheap foreign labour. The theory
comparative cost advantage assumes that factors of production are both fully
employed and mobile within countries. If large-scale unemployment exists
within a country, protection may be used to increase employment.
Protection against dumping: It could be looked at as the export of
commodities priced below cost of production. Dumping is generally looked
upon as an unfair trading practice and for that reason industries fearing
competition from dumped goods ask for tariffs to protect them. An export
subsidy is s salient form of dumping. Export subsidies are direct payments
made or the granting of tax relief and subsidized loans to the nation’s
exporters so as to stimulate the nation’s exports. These make the nation’s
exports price competitive on the international markets.
National Security: Some key industries such as agriculture and industries
producing goods that are important for the defense of the country must be
maintained. Countries therefore protect these industries.
To raise revenue: Tariffs are sometimes justified as a means of raising
revenue for the government, but in modern economies this is a
comparatively unimportant source of government revenue.
c. (any two points)
Tariffs: These are taxes imposed on traded commodities as they cross
national boarders. These are two main types of tariffs. An import tariff is a
duty on an imported commodity. Export tariff is a duty on an exported
commodity.
Tariffs may be specific, ad valorem or compound (a combination of an ad
valorem and specific tariff). The effect of a tariff on imports depends on its
size and the elasticity of demand for the imported commodity, If demand for
imports is elastic, a tariff imposed will reduce imports by switching demand
towards the domestically produced substitutes, conversely, if demand for
imports is price inelastic, the main effect of the tariff will be on import prices
rather than on the quantity of imports.
Domestic Subsidies: These may be provided in many forms to avoid
dumping. They are subsidies provided to certain domestic industries as a
means of protecting them from lower priced foreign goods. These subsidies

NOTE: This is a work in progress. All topics in the syllabus are covered but editing for necessary corrections is in progress.
Thanks.
334
reduce the prices of the domestic products and make them more price-
competitive.
Quotas: They are quantitative restrictions (non tariff restrictions) on the
imports and exports. They restrict the amount of commodities allowed to be
imported or exported.
Question 16.2.
a) What is Balance of payment?
b) Describe the main components of a Balance of payments
c) Explain Balance of Payment Deficit.
Answer
a. It is an account that summarizes a country’s total payments and total receipts from
international economic transactions within a specific period usually one year.
b. The current Account
The current account is subdivided into three main items: merchandise imports and exports.
Services imports and exports and unilateral transfers. Merchandise imports and exports are
also referred to as visible trade and services imports and exports and unilateral transfers
dubbed invisible trade.
The Capital Account
The capital account deals with long and short-term capital movement. These capital
movements are referred to as autonomous because they take place for business or profit.
Long-term capital movements are overseas investments in shares or long-term securities or
from the establishment of factories in foreign countries or the reporting country.
The movement of capital to a country represents an inflow of foreign capital and there is a
corresponding outflow when such funds are withdrawn. An inflow of funds represents
credit while an outflow represents debt.
Official Reserve Account
This part of the balance of payments informs us about how the balance of both current and
capital accounts taken together is settled. Transaction in this section is called
accommodating transaction. They are accommodating transaction because the funds are

NOTE: This is a work in progress. All topics in the syllabus are covered but editing for necessary corrections is in progress.
Thanks.
335
moved to make the balance of payments balance. When the net balance on the current and
capital accounts is in deficit, the deficit must be settled with an equal net credit in the
official reserve account. If on the other hand, a country has a surplus, the surplus must be
used up to balance the balance of payments.
Question 16.3
3. The table below shows the Balance of Payments information for a hypothetical
country:
N Billion
Merchandise Exports 100
Merchandise Import (-) 300
Export of Services 200
Import of services (-) 300
Portfolio Investment (-) 400
Direct Investment 450
Net Unilateral Transfer 100
Required:
a) What is Balance of Payments?
b) Compute this country’s Current Account Balance
c) Calculate this Country’s Capital Balance
d) Is this country running an overall Balance of Payments deficit or surplus? Explain
your answer.
Answer
a.
BOP is an account that summarizes a country’s total payments and total receipts
from international economic transactions within a specific period usually one year.
b.
Item Credit Debit
Merchandise Exports
Merchandise Imports
Export of Services
Import of services
Net Unilateral Transfer
100
200
100
300
300

NOTE: This is a work in progress. All topics in the syllabus are covered but editing for necessary corrections is in progress.
Thanks.
336
Total 400 600
Current Account Balance = 400 – 600 = -200 (deficit)
c.
Item Credit Debit
Direct Investment
Portfolio Investment
450
400
Capital Account Balance = 450 – 400 = 50 (surplus)
4. Overall Balance of Payments = -200 + 50 = -150 (deficit)
Question 16.4.
4. a) Define the balance of payments account
b) Describe the main components of the balance of payments account.
Answer
a. The foreign exchange market is an organizational setting within which individuals,
business firms, banks etc buy and sell foreign currency. It has no centralised meeting place
and not limited to one country.
b. A fixed exchange rate regime is where the external value a country’s currency is
determined by explicit government policy and fixed at a certain amount of the domestic
currency per unit of foreign currency.
Periodic changes in the exchange rate by government are described as devaluation or
revaluation Devaluation refers to the deliberate reduction in the external value of a
domestic currency. On the other hand, revaluation is a deliberate increase in the value of a
country’s currency relative to other currencies.
c.

NOTE: This is a work in progress. All topics in the syllabus are covered but editing for necessary corrections is in progress.
Thanks.
337
It removes the uncertainty associated with the flexible exchange rate regime and
brings stability.
It also indirectly imposes some anti inflationary discipline on policy makers since
there is the need to maintain and defend the exchange rate.
5. a) What is a foreign Exchange market?
b) What is meant by a fixed exchange rate regime?
c) Explain two advantages of the fixed exchange rate regime.

NOTE: This is a work in progress. All topics in the syllabus are covered but editing for necessary corrections is in progress.
Thanks.
338
CHAPTER SEVENTEEN
INTERNATIONAL AND REGIONAL ORGANISATIONS
17.0 LEARNING OBJECTIVES
After studying this chapter you should be able to understand the features, objectives
and activities of each of the following organizations:
∙ The World Bank
∙ The International Monetary Fund (IMF)
∙ The African Development Bank (ADB) Group
∙ The European Union (EU)
∙ The Economic Community of West African States (ECOWAS)
∙ Organisation of Petroleum Exporting Countries (OPEC)
∙ United Nations Commission for Trade and Development (UNCTAD)
∙ World Trade Organisation (WHO)
17.1 INTRODUCTION
Following the serious economic conditions encountered worldwide during the Great
Depression of 1930s, political leaders in both developed and less developed
countries recognised that “no country is free from poverty until every country is free
from poverty”.
Therefore, the desire to promote economic well-being of their people coupled with
the realization that trade and economic cooperation can be an important stimulus to
rapid economic growth, has led to the establishment of a number of international
and regional organizations immediately after the second World War (1939 – 1945).
In this chapter we examine the main features and objectives of some of the
organizations and , especially their relevance to the development aspirations of their
developing member-countries.
17.2 THE WORLD BANK GROUP
The World Bank Group comprises of the following four institutions:
(i) International Bank for Reconstruction and Development (IBRD)
(ii) International Finance Corporation (IFC)
(iii) International Development Association (IDA)

NOTE: This is a work in progress. All topics in the syllabus are covered but editing for necessary corrections is in progress.
Thanks.
339
(iv) The Multilateral Investment Guarantee Agency (MIGA)
17.2.1 International Bank for Reconstruction and Development (IBRD)
The IBRD – the original organization of the World Bank group was established in
1945. The bank and the International Monetary Fund (IMF) were products of the
articles of agreement signed by representatives of a group of 44 nations at the
United Nations Monetary and Financial Conference held at Britton Woods, New
Hampshire, USA in July 1944. Therefore, both IBRD and IMF were usually referred to
as Britton Woods Institutions.
The membership of the IBRD which was 44 at its inception in 1945 reached 182 in
2000 including developing countries of the West African Sub-region.
The main objectives of the IBRD, also called the World Bank are:
i. To assist the economic development of member countries by providing loans,
on reasonable terms, for the development of productive facilities and
resources.
ii. To provide and coordinate staff training and technical assistance for member
countries on investment projects in which they lack the requisite manpower
and technical knowledge.
iii. To promote private foreign investment by guarantees or through
participation in loans and other investments made in the private sector of the
economies of member countries.
iv. To conduct project feasibility and evaluation studies and act as executing
agency for development projects financed by the United Nations
Development Programme (UNDP).
v. To promote balanced growth of international trade and the maintenance of
viable balance of payments positions by member countries.
The IBRD derives its resources from capital subscribed by member countries, funds
received in repayment of past loans, and borrowing in the world capital markets
through the issuance and sales of bonds. Over the years, the IBRD has been more
relevant in the development efforts of the developing member countries in the areas
of:
NOTE: This is a work in progress. All topics in the syllabus are covered but editing for necessary corrections is in progress.
Thanks.
340
i. Staff training and technical assistance, and
ii. Loan financing of projects in agriculture and rural development, energy,
telecommunications, urban development, population programme, water
supply, education , health and nutrition.
However, some points of criticism of the IBRD include that;
i. Its lending procedure is faulty because it lays emphasis on the repaying
capacity of the borrowing country before granting any loan.
ii. The conditionalities attached to its loan facilities, especially Structural
Adjustment Facility (SAF), Enhanced Structural Adjustment Facility (ESAF)
were too harsh for developing member countries.
iii. The loans granted to developing countries so far have not been sufficient to
meet their development financial needs.
17.2.2 International Finance Corporation (IFC)
The IFC is a member of the World Bank Group established in 1956 to promote the
growth of productive private enterprises in the developing member countries. All
member countries of World Bank are qualified to the membership of the IFC.
The objectives of the IFC are:
i. To provide loans and equity capital for private enterprises thereby
complementing the resources of private investors.
ii. To bring together investment opportunities, by encouraging local and foreign
private investors cooperate in joint ventures.
iii. To provide technical assistance for member countries on private investment
projects so that their enterprises can be productive and financially sound.
iv. To stimulate and help create conditions conducive to the flow of private
domestic and foreign capital into productive investments in member
countries.
Although the IFC has been promoting productive private investments in developing
member countries in line with the objectives of its establishment, however, the
foreign capital flow into these countries has not been sufficient to make for
impressive private sector performance.
NOTE: This is a work in progress. All topics in the syllabus are covered but editing for necessary corrections is in progress.
Thanks.
341
17.2.3. The International Development Association (IDA)
The IDA was established as the soft loan window of the World Bank in September
1960. Its membership is open to all members of the World Bank.
The main objectives of IDA are:
i. To provide long-term soft loans to the governments of the world’s poorest
countries for poverty alleviation.
ii. To promote human capital development in the poorest countries.
To achieve these two objectives, the IDA has extended credits to the poorest
member countries at concessional rates. Such loans, which are repayable over a
period of 30 – 40 years and with, a 10 year grace period, were meant for poverty-
alleviation related projects e.g. population control, education and health, nutrition,
social safety, environment security, etc.
17.2.4. The Multilateral Investment Guarantee Agency (MIGA)
MIGA was established in April 1988 to make the World Bank Group more relevant to
the development aspirations of the member countries. The primary aim of the MIGA
is to encourage the flow of Foreign Direct Investment (FDI’s) into developing
countries.
The principal objectives of MIGA are:
i. To provide insurance covers for investors against political and non-
commercial risks e.g. war and civil disturbance, breach of contract by
government, the danger involved in currency transfer and expropriation.
ii. To insure new investment, including the expansion of existing ones, and
promote financial restructuring.
iii. To provide promotional and advisory services to the governments of
developing member countries in their efforts to create enabling environment
for local and foreign private investments.
iv. To establish credibility among investors, and higher credit rating among
global banking and financial markets of its members.
Many developing member countries have been able to attract more foreign direct
investment as a result of the insurance guarantee provided by the MIGA.

NOTE: This is a work in progress. All topics in the syllabus are covered but editing for necessary corrections is in progress.
Thanks.
342
17.3. INTERNATIONAL MONETARY FUND (IMF)
The IMF, also referred to as The Fund, is an autonomous international financial
institution established in 1945 under the Breton Woods Agreement of 1944. Thus, it
is a sister institution of the International Bank for Reconstruction and Development
(IBRD).
The main objectives of the IMF, set out in article 1 of its articles of Agreement are:
i. To promote international monetary co operations through a permanent
institution that provides the machinery for consultation and collaboration on
international monetary problems.
ii. To facilitate the expansion and balanced growth of international trade, and to
contribute thereby to the promotion and maintenance of high levels of
employment and real income.
iii. To promote exchange rate stability, to maintain orderly exchange
arrangement among members, and to discourage competitive currency
devaluation.
iv. To assist in the establishment of a multilateral system of payment in respect
of current transactions and in the elimination of foreign exchange restrictions
which hamper the growth of world trade.
v. To help member countries overcome their balance of payment difficulties
through the provision of short to medium term credit and technical guidance.
The IMF introduced the Special Drawing Rights (SDRs) in 1970 to facilitate the
expansion and balanced growth of world trade. The SDRs is an international financial
asset designed to supplement gold, dollars, and convertible currencies in setting
international debt between countries. Most countries now use their allocation of
SDRs (which are mere book entries) when they face balance of payment or reserve
problems.
A member country that applies for IMF loan is expected to meet certain stipulated
conditions, known collectively as “IMF conditionalities”, before such facility is
granted. The conditions stipulated for some developing member countries to be met
to qualify them for the use of the Fund’s financial resources have included
devaluation of currency, removal of government subsidy on some products,

NOTE: This is a work in progress. All topics in the syllabus are covered but editing for necessary corrections is in progress.
Thanks.
343
reduction of public expenditure, trade liberalization, strengthening of the
operational efficiency of revenue collection agencies, and reduction of grants and
subventions to government parastatals.
The benefits derived by developing member countries, including West African
countries, from their membership of the IMF include:
i. The signing of agreement with the Fund for stand-by facilities worth millions
of dollars which boosted their credit worthiness in international trade.
ii. The use of SDRs allocation to solve their balance of payments and reserve
problems.
iii. Manpower development efforts of member countries have been
complemented by the Fund through training courses provided on economic
and financial management.
iv. The Fund, on a regular basis, conducts studies on member countries
economies and recommends necessary reform measures to improve growth
performance.
17.4. THE AFRICAN DEVELOPMENT BANK (ADB) GROUP
The ADB Group is made up of the following institutions:
(i) African Development Bank (ADB)
(ii) African Development Fund (ADF)
(iii) Nigerian Trust Fund (NTF)
17.4.1. African Development Bank (ADB)
The ADB was established by the articles of Agreement signed in Khartoum, Sudan, by
the finance ministers of 30 independent African countries on 4 August, 1963. It
started business at its headquarters in Abidjan, Ivory coast (now Cote D’Ivore) in
July, 1966. The member nations of the ADB include all independent African states
and the non African members such as USA, Canada, Britain, France, Japan, etc. who
were admitted following an amendment to its Charter in 1982.
The objectives of ADB are:
i. To finance investment projects and programmes of its members using its
resources.

NOTE: This is a work in progress. All topics in the syllabus are covered but editing for necessary corrections is in progress.
Thanks.
344
ii. To mobilize resources from outside Africa, especially from developed
countries, for the financing of such investment projects and programmes.
iii. To undertake or participate in the selection, study and preparation of
projects, enterprises and activities contributing to the development of its
members.
iv. To provide technical assistance required in the selection, study, preparation
and execution of development projects or programmes.
v. To promote investment in Africa of public and private capital projects or
programmes designed to boost economic development or social progress of
its members.
In pursuit of its policies of poverty alleviation and promotion of equitable growth in
the continent, the ADB has granted loans to its African members, especially for
projects and programmes which foster regional cooperation and integrated
development within the member countries.
The problems of the bank in recent times have been identified as including:
i. The rapid decline in its financial resources due to increasing arrears on loan
repayments from member countries.
ii. The continued concentration of its lending to a few member countries.
iii. Failure of member countries to pay their subscriptions timely and regularly
17.4.2 The African Development Fund (ADF)
The ADF was established in 1972 as an affiliate of the African Development Bank
(ADB) to provide development finance on easier repayment and interest terms than
the ADB. The loans of the ADF are granted at no interest, a service charge of 0.7 per
cent, a 10-year moratorium and repayment period spanning another 40 years. Thus,
the ADF can be described as the ‘soft loan window’ of the ADB group.
However, the ADF facility is specifically meant for poorer countries with per capital
GNP of less than $510. About 34 African countries have qualified under that category
in the past 20 years. The primary objective of the ADF is to promote the economic
development and integration of its members.

NOTE: This is a work in progress. All topics in the syllabus are covered but editing for necessary corrections is in progress.
Thanks.
345
17.4.3. The Nigerian Trust Fund (NTF)
The NTF was established by the federal government of Nigeria in April 1976 to assist
the development efforts of the poorest and most indebted member countries of the
ADB. The NTF is therefore a member of the ADB group – it is administered by the
ADB in consultation with the Nigerian government.
The NTF started with an initial capital of $80 million which grew to about $350
million in 1988. The NTF loans are granted at a 4 per cent interest, grace period is 5
years, and the repayment period ranges between 15 and 25 years. Not less than 18
member countries of the ADB benefited from the NTF loan commitment. The loans
were granted to finance projects in the social/educational, industrial and agricultural
sectors in those countries.
17.5 THE EUROPEAN UNION (EU)
What is today known as the European union (EU) was originally established as the
European Economic Community (EEC) on 25 March, 1957 by the Treaty of Rome
agreed to by the governments of Belgium, France, the Federal Republic of Germany,
Italy, Luxemburg and the Netherlands. The EEC came into operation on January
1958, and was renamed the EU in November 1993. By 2006, the membership has
increased to 25 including the United Kingdom, Denmark, Ireland, Greece, Spain,
Portugal, Sweden, Austria and Finland that joined between 1973 and 1995.
The economic objectives of the EU include the following:
i. To promote free trade between member countries through the removal of
tariffs and other non-tariff barriers to free trade.
ii. To harmonize trade policies of members by ensuring that members impose
tariffs on import from non member countries at the same rate.
iii. To guarantee common internal price levels and promote stabilizations of
farmers’ incomes by penalizing imported food items through a Common
Agricultural Policies (CAP).
iv. To encourage free movement of factors of production, especially labour and
capital, within the community.
v. To harmonize the tax systems of member countries with a view to removing
any hidden barriers to trade.

NOTE: This is a work in progress. All topics in the syllabus are covered but editing for necessary corrections is in progress.
Thanks.
346
vi. To integrate the monetary systems of member countries so as to facilitate
the expansion of bilateral trades between member countries.
vii. To promote common regional policy through the establishment of a regional
development fund. The EU is to ensure that no member nation is left to
suffer economic depression.
viii. To develop common transport policy.
ix. To create new world economic order and agreement with developing
countries.
A number of institutions, organizations and funds were established as well as
common economic policies adopted to promote the realization of the above
objectives.
The major achievements of the EU from the standpoint of the impact of the various
actions taken, on the economics of the member countries include:
i. The EU promotes specialization among member countries such that each
member tends to specialize in their line of comparative cost advantage. This
leads to efficient utilization of productive resources, greater output and
improved standards of living within the sub-region.
ii. The EU provides a large market for the products of member countries. This
encourages large-scale production with its concomitant economies of scale
and increased employment opportunities.
iii. The removal of quotas and tariffs leads to keener competition in the larger
market. This leads to effective resources allocation as a result of which
factors of production receive higher incomes.
The EU has been relevant to the development aspirations of countries in West
African sub-region under the Yaounde and Lome Conventions in the following ways:
i. Financing rural-electrification projects.
ii. Providing grants to improve health facilities.
iii. Encouraging industrial cooperation through the transfer of technology, and
funding research programmes to boost industrial activities.
Note that the Lome Convention is a series of trade and economic co-
operations and agreements between the EU and countries from the African,
Caribbean and Pacific states (ACP).

NOTE: This is a work in progress. All topics in the syllabus are covered but editing for necessary corrections is in progress.
Thanks.
347
17.6 THE ECONOMIC COMMUNITY OF WEST AFRICAN STATES (ECOWAS)
ECOWAS was formed by 15 West African countries under the treaty of Lagos on 28
May, 1975. The community now has 16 members – The Republic of Benin, Ghana,
Burkina Faso, Cape Verde, Guinea, Guinea – Bissau, Cote D’ivore, Liberia, Mali,
Mauritania, Niger, Nigeria, Senegal, Sierra – Leone and Togo.
ECOWAS was established primarily to promote cooperation and development
between member countries in all fields of economic activity. The main objectives of
the Community are:
i. To promote free trade between member countries through gradual reduction
of tariffs and other non-tariff barriers (NTBs).
ii. To eliminate obstacles restricting the free movement of persons, services and
capital between member countries.
iii. To establish common tariff structure and commercial policy towards non-
member countries.
iv. To harmonise the agricultural policies, and the promotion of common
projects within the community, especially in the fields of marketing, research
and agric business.
v. To promote joint development of transport, communication, energy and
infrastructural facilities.
vi. To harmonise industrial and monetary policies of member countries.
vii. To establish fund for the purpose of promoting and financing development
projects as well as to provide compensation to member states which may
suffer losses as a result of trade liberalization within the Community.
Member countries of ECOWAS stand to derive benefits similar to those of EU if its
objectives are vigorously pursued.
However, the Community is facing a number of problems which prevent it from
making significant impact on the economies of the member countries. These include:
i. The low level of trade among member countries as a result of similarity of
products. All countries in West Africa (except Nigeria, to some extent)
depend heavily on their agricultural sector.

NOTE: This is a work in progress. All topics in the syllabus are covered but editing for necessary corrections is in progress.
Thanks.
348
ii. Immobility of factors of production between the countries due to poor
infrastructural facilities coupled with language barrier.
iii. Closer socio-economic ties with former colonial administrators. It is difficult
for the Community to adopt discriminatory tariff policies that could have
adverse consequences on the economies of such countries i.e. United
Kingdom, France and Portugal.
iv. How to distribute benefits of integration and compensate countries for loss in
revenue due to abolition of tariffs.
v. Differences in social, monetary and commercial policies of the member
countries constitute a major obstacle to international trade and joint
investment programmes.
vi. Disparities in the levels of socio-economic activities and fear of domination
by some countries.
17.7. THE GENERAL AGREEMENT ON TARIFFS AND TRADE (GATT)
The GATT was a multilateral trade agreement signed originally by 96 governments at
the General Conference on October 30, 1947 and came into force on January 1,
1948. It was a forum where the contracting parties met from time to time to set out
rules of conduct for international trade relations, and for multilateral negotiations
regarding the solution of trade problems and to enlarge their trade.
The principal objectives of GATT are:
i. To promote free trade through the removal of the existing trade barriers,
especially tariffs, quotas and embargo.
ii. To eliminate discriminations in international trade. To this end, every
member nation is expected to have a single tariff rate on a particular item for
all member nations.
iii. To prevent the establishment of further trade barriers by getting member
nations to agree to consult together rather than take unilateral actions.
The ultimate aim of establishing liberal world trading system as noted by Jhingan
(2001) was to raise living standard, ensure full employment through a steadily
growing effective demand and real income, develop fully the resources of the world,
and expand the production and exchange of goods on global level.

NOTE: This is a work in progress. All topics in the syllabus are covered but editing for necessary corrections is in progress.
Thanks.
349
The major rounds of GATT negotiations include the Kennedy Round (1964 – 1967),
the Tokyo Round (1973 – 1979) and the Uruguay Round (1986 – 1994). Trade
negotiations conducted under the auspices of GATT have resulted in significant
reductions in the average level of world industrial tariffs, as well as directed special
attention towards the trade problems of developing countries.
The major problems of GATT are:
i. Non-adherence to the principle of most favoured nations treatment.
ii. The exclusion of many developing countries from its membership as a result
of which GATT is regarded as a rich countries’ club.
iii. The Articles of Agreement has been waived on a number of occasions, to help
members solve balance of payment difficulties e.g. American protection of
her agricultural sector.
At the conclusion of the Uruguay Round in Marrakech, Morocco on 15th April 1994,
the final Act of Agreement establishing World Trade Organisation (WTO) as
successor to the GATT was signed by 111 countries.
17.8. WORLD TRADE ORGANISATION (WTO)
The WTO was established through the WTO Agreement which came into force on
January 1, 1995. The WTO Agreement is in fact the Uruguay Round agreements
whereby the original GATT is now a part of the WTO Agreement. It follows that the
WTO is a successor to the GATT, it completely replaces it and has a legal status.
The main objectives of the WTO are:
i. To conduct its affairs in the field of trade and economic endeavor with a view
to ensuring full employment of resources, large and steadily growing volume
of real income and effective demand, expanding the production and trade in
goods and services, and raising standards of living.
ii. To promote optimal use of the world resources in accordance with the
objective of sustainable development.
iii. To make positive efforts designed to ensure that developing countries secure
a share in the growth of international trade commensurate with the need of
their economic development.

NOTE: This is a work in progress. All topics in the syllabus are covered but editing for necessary corrections is in progress.
Thanks.
350
iv. To work towards substantial reduction of tariffs and other barriers to trade
and the elimination of discriminatory treatments in international trade
relations.
v. To ensure linkages between trade policies, environmental policies and
sustainable development.
To achieve the above and other related objectives, the functions of the WTO include:
i. Facilitating the implementation, administration and operation of the
objectives of the Agreement and of the Multilateral Trade Agreements.
ii. Providing the framework for the implementation, administration and
operation of the plurilateral Trade Agreements relating to trade in civil
aircraft, government procurement, trades in dairy products and bovine meat.
iii. Cooperating with the IMF and the World Bank and its affiliated agencies with
a view to achieving greater coherence in global economic policy-making.
The organization of the WTO is headed by the Ministerial Conference of
representatives of all member countries. It carries out the functions of the WTO.
There is also the General Council of representatives of all member countries sitting in
Geneva on a regular basis to oversee the operations of the WTO Agreements and
Ministerial decisions.
The major criticism of the WTO is that the developing member countries have not
succeeded in getting market access in developed countries. The opening of market
since the WTO Agreement has been only in the developing countries.
17.9 UNITED NATIONS CONFERENCE ON TRADE AND DEVELOPMENT (UNCTAD)
UNCTAD, an organ of the general assembly of United Nations (UN) was first
convened in 1964. All members of the UN are members of the Conference and it has
a permanent executive organ and a permanent secretariat.
The major concern of UNCTAD has been to protect and champion the cause of
developing countries against the restrictive trade policies of the developed
countries, e.g. the Common Agricultural policy (CAP)of the European Union and the
American Agricultural policy.
The main objectives of UNCTAD can be summarized as follows:

NOTE: This is a work in progress. All topics in the syllabus are covered but editing for necessary corrections is in progress.
Thanks.
351
i. To promote easier access of the export of developing countries to the
markets of developed countries.
ii. To increase the flow of financial resources into developing countries in order
to boost their positions in world trade, and thereby reducing their external
debt burden.
iii. To evolve an international debt strategy aimed at restoring debtor countries
external viability.
UNCTAD’s major success has been in pressing successfully for the Generalised
System of Preferences by means of which some exports from developing countries
are given preferential access to the markets of industrial countries. However, there
has been no appreciable increase in the prices of commodity exports as well as
export volume of the developing countries due to the general reluctance of
developed countries to accede to the various proposals of UNCTAD.
17.10 ORGANISATION OF PETROLEUM EXPORTING COUNTRIES (OPEC)
OPEC was formed in 1960 by 5 oil-producing countries, and it has its headquarters in
Vienna, Austria. It is an organization consisting of some major oil-exporting
developing countries acting as a cartel or oligopoly to promote their common
interests. The membership of OPEC grew to 13 in 1973 but, following the withdrawal
of Equador (1992) and Gabon (1996), the organization is now made up of 11
countries: Venezuela, Saudi Arabia, Iran, Kuwait, Libya (the founding members) as
well as Nigeria, Qatar, United Arab Emirate, Algeria and Indonesia.
The principal objectives of OPEC are:
i. To promote oil price stability in international market through periodic review
of members’ oil – export volume (quota).
ii. To coordinate and unify the petroleum policies of member countries and
determine the best means of safeguarding their interest individually and
collectively.
iii. To provide an efficient economic and regular supply of petroleum to
consuming nations.
iv. To guarantee a fair return on capital to those individuals and corporate
bodies investing in the petroleum industry.

NOTE: This is a work in progress. All topics in the syllabus are covered but editing for necessary corrections is in progress.
Thanks.
352
v. To provide financial assistance to poor non-oil producing countries so as to
close the gap between the rich and the poor nations (OPEC special fund was
established in 1976 in furtherance of this objective).
OPEC member countries including Nigeria have benefitted from their membership of
the organization in the following ways:
i. Earning reasonable prices on per barrel of oil due to the regulation of their
export volume by OPEC.
ii. Through research activities carried out at OPEC’s headquarters in Vienna,
modern technologies have evolved resulting in efficient exploitation and
extensive exploration of oil.
iii. Enjoying increased revenue from sales of her crude oil, especially whenever
her quota is increased by the organization.
The major problems of OPEC include:
i. Non-compliance of members to the export quota dictated by OPEC leading to
over-production and the decline in prices and their revenues.
ii. The production and market strategies of independent non OPEC oil exporting
countries have always tended to undermine OPEC’s resolutions.
17.11 SUMMARY AND CONCLUSIONS
This chapter explored the feature , objectives/functions, performance and problems
confronting a number of regional and international economic organizations. It was
observed that most of these organizations have not been able to achieve their
specified objectives because of the conflicting interests of the member nations.
17.12. REVISION QUESTIONS
SECTION A: Multiple Choice Questions
1. One of the main functions of the International Monetary Fund (IMF) is to
A. Encourage member countries to engage in competitive currency devaluation.
B. Facilitate the contraction of world trade.
C. Provide financial assistance to member countries that have temporary balance of
payment difficulties.
D. Discourage rapid industrialization in the developing nations of the world.
E. Discourage the maintenance of stable exchange rates.

NOTE: This is a work in progress. All topics in the syllabus are covered but editing for necessary corrections is in progress.
Thanks.
353
2. A major reason for the establishment of the Economic Community of West African
States (ECOWAS) was to
A. Promote international monetary cooperation
B. Promote the economic progress of member countries
C. Monitor and control the outflow of foreign exchange in the region
D. Help member countries overcome their balance of payment difficulties by
providing financial assistance.
E. To encourage member countries to pursue vigorously their independent
trade policies
3. Which of the following is not an objective of the Organisation of Petroleum Exporting
Countries (OPEC)?
A. Stabilisation of oil prices
B. Stabilisation of exchange rates of currencies of member countries
C. Co-ordination and harmonization of oil policies of member countries
D. Provision of financial assistance to poor non-oil producing countries
E. Provision of relatively cheaper supply of oil to developed countries
4. A member of the World Bank Group established majorly to promote the growth of
productive private enterprises in the developing countries is
A. International Development Association (IDA)
B. Multilateral Investment Guarantee Agency (MIGA)
C. International Financial Corporation (IPC)
D. International Monetary Fund (IMF)
E. World Trade Organisation (WTO)
5. One main criticism of the World Trade Organisation (WTO) is that it is
A. Working towards substantial reduction of all forms of barriers to international
trade.
B. Only the developed member countries have succeeded in getting market access
in the developing countries.
C. Promoting optimal use of the world resources.
D. Discouraging discriminatory treatment in international trade relation.

NOTE: This is a work in progress. All topics in the syllabus are covered but editing for necessary corrections is in progress.
Thanks.
354
E. Co-operating with the IMF and the World Bank for greater coherence in global
economic policy-making.
CHAPTER SEVENTEEN
Section A: Solutions to Multiple Choice Questions
1. C
2. B
3. E
4. C
5. B
SECTION B: Short Answer Questions
1. A member of the World Bank Group whose activities include provision of insurance
services and private investment guarantee is _________________
2. An international financial asset introduced by the International Monetary Fund (IMF)
to facilitate the expansion and balanced growth of world trade is called
__________________
3. An affiliate of the African Development Bank (ADB) established by Nigeria to assist
the poorest and most indebted member countries is ___________________
4. A permanent organ of the United Nations established in 1964 principally to promote
international trade between countries, especially for accelerating the economic
development of less developed countries is ____________________
5. A permanent organization properly established to completely replace the General
Agreement on Tariff and Trade (GATT) and promote a liberal world trading system is
_________________
Section B: Solutions to Short Answer Questions
CHAPTER SEVENTEEN
1. The Multilateral Investment Guarantee Agency (MIGA)
2. Special Drawing Rights (SDRs)
3. The Nigerian Trust Fund (NTF)
4. United Nations Conference on Trade and Development (UNCTAD)
5. World Trade Organisation (WTO)

NOTE: This is a work in progress. All topics in the syllabus are covered but editing for necessary corrections is in progress.
Thanks.
355
CHAPTER EIGHTEEN
ECONOMIC GROWTH AND DEVELOPMENT
18.0 LEARNING OBJECTIVES
After studying this chapter, you should be able to
Distinguish between economic growth and economic development
Demonstrate good understanding of Development Planning
Analyse the link between population and economic growth
Explain the Terms of Trade and Balance of Payments
18.1 INTRODUCTION
Under this section we introduce the reader to the concepts of economic growth and
economic development. Understanding these concepts will help the reader
appreciate the state of developing nations and the possible causes and the way
forward.
18.2 ECONOMIC GROWTH AND ECONOMIC DEVELOPMENT
Generally, economic growth is defined as the expansion in a nation’s real output.
Some economists however, prefer to define economic growth as the expansion in a
nation’s capability to produce the goods and services its people want.
Economic Growth refers to an increase in real aggregate output (real GDP) reflected
in increased real per capita income. A country is said to experience economic
growth if overtime, its real output (real GDP) increases as well as its real per capita
income.
The rate of economic growth is measured as the percentage increase in real GDP
overtime. We need to distinguish between growth in real GDP and economic
growth. Growth in real GDP refers to increase in real GDP on yearly basis. Economic
growth on the other hand shows sustained increase in real GDP over a period.
Economic development is not the same as economic growth. Economic growth is a
necessary condition for economic development. This presupposes that there is more

NOTE: This is a work in progress. All topics in the syllabus are covered but editing for necessary corrections is in progress.
Thanks.
356
to economic development. Economic development is a sustainable increase in real
GDP that implies increased real per capita income, better education and health as
well as environmental protection, legal and institutional reforms and an efficient
production and distribution system for goods and services.
18.3 SOURCES OF ECONOMIC GROWTH
(i) Human resources: Investment in human capital is considered as an important
factor for economic growth. This is done by increasing the quality of a nation’s
labour force through education and training in advance technology. It has also been
proved that literacy not only improves productivity but also makes an individual
more adaptable to new challenges.
(ii) Natural resources: Availability of natural resources (land and mineral) to a nation
is also a vital source of growth. It is not only the availability of these resources but
the extent to which they are exploited. It should be noted that for the exploitation
of these resources care should be taken not to sacrifice the environment. This
means that growth through exploitation of these resources should be sustainable
and maintain environmental quality.
(iii) Capital formation: Growth Economists believe that accumulation of capital is one
main source of the growth of an economy. Emphasis is given to the accumulation of
more capital per head (machines, factories, roads etc.). It should however be noted
that mere accumulation of capital will not fuel growth. Unless there are areas of
investment unexploited, productive capacity cannot be increased merely by
increasing the stock of capital. Capital is also only one of the many productive
factors of production. If it is increased relative to other factors of production its
marginal efficiency falls.
(iv) Technology: Expansion of knowledge through science and engineering that leads
to new inventions and innovations in production techniques play an important role
in growth. Technology can either be developed internally or can be imported from
other countries.

NOTE: This is a work in progress. All topics in the syllabus are covered but editing for necessary corrections is in progress.
Thanks.
357
18.4 COMMON CHARACTERISTICS OF DEVELOPING COUNTRIES
This section introduces the reader to some common features exhibited by
developing nations. Developing nations are nations in transition. A careful study of
these nations will reveal the following characteristics:
(i) Low standards of living: In developing nations general standards of living tend to be
very low for the vast majority of the people. These low standards of living are
manifested quantitatively and qualitatively in the form of low incomes (poverty),
inadequate housing, poor health, limited or no education, high infant mortality, low
life and work expectancy and sometimes a general sense of hopelessness. Income
levels in Ghana and Nigeria are relatively low as compared to levels in the developed
world. The distribution of GDP is also severely unequal.
(ii) Health and Life Expectancy: In addition to struggling on low income, many people
in the developing nations fight a constant battle against malnutrition, disease and ill
health. The average life expectancy in developing nations in 2003 was 57 years as
compared to 74 years in developed nations. Infant mortality rate is approximately
73 (66 for Ghana). This compares poorly with 12 in developed nations. Medical care
is an extremely scarce social service in many parts of the developing world.
(iii) Low levels of productivity: In addition to low standards of living, developing
countries are characterized by relatively low levels of labour productivity.
Throughout the developing world, levels of labour productivity (output per worker)
are extremely low compared with those in developed countries. In crop production,
rural small-scale farmers form the majority of the producers. Their productivity level
is low due to the use of rudimentary tools (such as hoes, cutlasses and sticks) and
simple and outmoded technology.
(iv) Dependence on agricultural production and primary product for exports. The
external sector comprises Imports and Exports. Ghana shows dependence on a
single crop, Cocoa, for export. In Ghana, the major exports including cocoa account
for about 60 per cent of the total foreign exchange earnings of the country. Minerals
in general earn on the average about 15 per cent of our total foreign exchange

NOTE: This is a work in progress. All topics in the syllabus are covered but editing for necessary corrections is in progress.
Thanks.
358
earnings. Normally, primary products in LDCs account for between 80-90% of export
earnings but in the developed countries it is about 35 per cent. In Ghana, the
primary sector accounts for on the average, about 80 per cent of our foreign
exchange earnings implying that Ghana is more of a developing country than a
developed country.
(v) Dominance, dependence and vulnerability in international relations. A greater
volume of Ghana’s exports comes from primary commodities like cocoa, timber and
gold. The contribution from other sectors, for instance, manufacturing in terms of
export is relatively insignificant. Since exports are mainly primary products, it is
quite apparent that income from export will fluctuate. This stems from the fact that
prices of primary raw materials fluctuate more than those of manufactured goods. It
is therefore, inevitable that our revenue from export will fall because the terms of
trade will be unfavourable and consequently, this will have adverse effect on our
Balance of Payment (BOP).
18.4 ECONOMIC PLANNING
Economic planning involves the conscious allocation of resources by the government
to the various sectors of the economy to promote rapid economic growth. This is
done through development plans. There are three dimensions to development
planning namely: resource accumulation, resource allocation and resource
management.
A Development Plan is a document which contains a policy framework and
programme of development for a time period for a country, usually five years. It sets
out the general measures and programmes of actions arranged according to a set of
stated goals or priorities.
Objectives of Planning
a) To maximize the utilization of economic resources: The resources of any nation are
not always enough for her use. In this wise, resources must be allocated in such a
way that they achieve maximum utilization of them. It is through the proper

NOTE: This is a work in progress. All topics in the syllabus are covered but editing for necessary corrections is in progress.
Thanks.
359
allocation of their resources that nations can accelerate their pace of economic
development.
b) To correct the imperfection of the market system – The market system in reality is
not perfect and therefore allocation of resources which occur under perfect
competition model does not happen. There is therefore the need by government to
interfere to ensure efficient allocation of resources
c) To bridge the gap between private cost and social cost, and private benefit and social
benefit. Under perfect market, there may be a divergence between social and
private cost on one hand and social and private benefit on the other. This occurs as
a result of the existence of externalities (benefits provided to or costs imposed on
third parties as a result of the production or consumption of goods or services).
Because of external benefits many projects which are needed may not be profitable
under pure market system in which all investment decisions are left to the private
individuals. The level of investment may fall below the social optimum because
private investors ignore external benefits and supplementary benefits of projects in
calculating the prospective returns of their investment.
d) To ensure balanced growth: Planning may be used to ensure balanced growth for all
sectors of the economy. By this there will be uniform growth and provision of
complementary services and intra sectoral linkages.
e) To attract foreign investment – Developing Plans are used as a means of attracting
foreign investment or foreign aid. Foreign government and international
organizations giving grants and loans need to be satisfied that the finance they
provide wil be put to good use. Private investment will also be encouraged by
realistic plans showing the extent of economic growth that is expected to be
attained. Donor countries are therefore interested in well coordinated plans to
direct investment funds.
f) To match the available resources with the desired goals: The complementary nature
of some investment decisions make for planning. The viability of one project may be

NOTE: This is a work in progress. All topics in the syllabus are covered but editing for necessary corrections is in progress.
Thanks.
360
conditioned upon another project. For example, the development of the agriculture
sector may the require setting up of irrigation projects and a special transport facility
for carrying fresh vegetables, fish etc between the farms and the market places. In
this wise, planning may be used to coordinate these activities.
18.4.1 Problems of Economic Planning
(i). Lack of Data: The basic limitation to economic planning in West Africa is lack of
accurate, sufficient or detailed information on the economy. In the absence of
adequate data planning cannot be effectively done. There is the need to improve
our database so as to enhance effective planning and implementation.
(ii). Lack of coordination – Planning involves coordination between various ministries.
These bodies may become semi-autonomous and as such coordination between
them becomes very difficult. This may affect the formulation and implementation of
economic development plans.
(iii). Failures of Foreign Resources to Materialize - To make supply to funds consistent
with projected requirement, all foreign aids are specified in the Plan. This does not
ensure that the level of foreign aid specified will materialize. In both the 5-year and
the 7-year D-Plans in Ghana, the expected foreign investment and loans did not
materialize. This affected the implementation of the 5yr as well as the 7yr
development plans.
(iv). Failure of Politicians to Follow the Plan –Politicians at times may not subject
themselves to the disciplines of planning even when actual projects contained n the
plan had been launched. Crucial elements in the plan may be unpalatable to
particular classes, groups, and tribes which have vested interest in the status quo
within a country.
(v). Political instability – Historically, economic planning had been affected by political
instability. Ghana’s 7 year D-Plan was abandoned during the 1966 coup. These
instabilities discourage investment since the safety of investors cannot be
guaranteed.

NOTE: This is a work in progress. All topics in the syllabus are covered but editing for necessary corrections is in progress.
Thanks.
361
(vi). Shortage of Manpower – The formulation and implementation of any economic
development programme poses management problems. Without the right skilled
personnel and properly structured management, an economic development plan
cannot be effectively implemented. Availability of such skilled manpower is a
problem in developing countries.
18.5 POPULATION
a. Meaning: Population refers to the total number of people living within a
geographical area or a country.
b. Population Census: A population census is the head count of people living in a
geographical area or in a country. A population census collects comprehensive data
on people to know e.g. sex, age, educational and occupational backgrounds, religious
affiliation, nationality etc.
c. Importance of Population Census
(i). It is used to determine the size and the growth rate of the population at a
country. This helps the government in planning for education,
transportation, health, etc.
(ii). It helps authorities to have adequate and relevant data. These data include
the size, composition, distribution of population etc. These data aid the
planners of the economy to forecast the future needs of the country.
(iii). Data provided by population census help in the allocation of resources to the
various regions and states of the country.
(iv). It provides data for demographic studies.
d. Problems of Census in West Africa
(i). High Cost of Census: Censuses are supposed to be conducted at a 10 year
interval. The high cost of conducting census has made it impossible for West
African countries to conduct censuses at regular intervals.
(ii). Bad town planning and inaccessibility of some areas: In many developing
countries street and houses are not properly numbered. This makes it
difficult for census officials to locate people for enumeration.

NOTE: This is a work in progress. All topics in the syllabus are covered but editing for necessary corrections is in progress.
Thanks.
362
(iii). Shortage of census officers: In many developing countries there are very few
qualified census officers. During census all kinds of people are used without
any proper training. This makes census figures inaccurate.
(iv). Customary beliefs: Certain beliefs in West Africa work against census. In
certain cultures people can not be counted.
(v) Suspicion of use of census data. There can be deliberate falsehood on number of
people declared in order to get more resources.
18.6 SUMMARY AND CONCLUSION
Economic Growth refers to an increase in real aggregate output (real GDP)
reflected in increased real per capita income. A country is said to experience
economic growth if overtime, its real output (real GDP) increases as well as
its real per capita income.
Economic planning involves the conscious allocation of resources by the
government to the various sectors of the economy to promote rapid
economic growth. This is done through development plans. There are three
dimensions to development planning namely: resources accumulation
resource allocation and resource management.
A population census is the head count of people living in a geographical area
or in a country. A population census collects comprehensive data on people
to know e.g. sex, age, educational and occupational backgrounds, religious
affiliation, nationality, etc.
18.7 REVISION QUESTIONS
SECTION A: Multiple Choice Questions
1. Which of the following best describes the concept of economic growth?
A. Increase in the welfare of the citizens
B. Increase in real per capita income
C. Reduction in prices of goods and services
D. Increase in the exchange rate of country’s currency
E. Increase in industries established in a country

NOTE: This is a work in progress. All topics in the syllabus are covered but editing for necessary corrections is in progress.
Thanks.
363
2. The following are problems associated with development planning in the less
developed nations except.
A. Inadequate statistical data
B. Lack of proper co-ordination of various units in the system
C. Political stability in the country
D. frequent changes in socio-economic and political policies
E. Shortage of skilled and technical manpower
3. Which of the following is a not common feature of developing countries?
A. High level of industrial productivity
B. High standard of living
C. Dependence on agricultural production for export
D. Advance level of technology
E. High level of illiteracy
4. Which of the following does not stimulate the economic growth of a nation?
A. Availability of skilled human recourses
B. Accumulation of capital
C. Expansion of the knowledge
D. Depletion of the environmental quality
E. Availability of mineral resources
5. The following are popular objectives of developing plans except
A. To increase the unemployment rate
B. To attract foreign investment
C. Ensure balance growth of all sector in the economy
D. Efficient utilisation of available resources
E. Improve on the quality of existing infrastructural facilities
SECTION B: Short Answer Questions
1. A sustainable increase in the per capita income of a country is termed……………….
2. A document that contains a policy framework, development programmes and
actions to achieve stated objectives is called……………………..
3. Mention any two characteristics of developing nations
4. For a country, the ratio of GNP to population for any given year gives………………..
5. An increase in real GDP coupled with sustainable general human well- being in a
country is known as…………………..
Solution To Short Answers Questions
CHAPTER EIGHTEEN

NOTE: This is a work in progress. All topics in the syllabus are covered but editing for necessary corrections is in progress.
Thanks.
364
1. Economic growth
2. Development plan
3. Any two of the following
i. Low standard of living
ii. Low level of productivity
iii. Dependence on agricultural
iv. Low level of technology
v. High level of illiteracy
vi. High level of infant mortality
vii. Low per capita income
4. Per capita income
5. Economic development
1. a) Distinguish between economic growth and economic development.
b) Identify and explain three sources of growth for your country.
Answer
a. Economic Growth refers to an increase in real aggregate output (real GDP) reflected
in increased real per capita income. A country is said to experience economic
growth if overtime, its real output (real GDP) increases as well as its real per capita
income.
Economic development is a sustainable increase in real GDP that implies increased
real per capita income, better education and health as well as environmental
protection, legal and institutional reforms and an efficient production and
distribution system for goods and services.
b. (any three points)
(i) Human resources: Investment in human capital is considered as an important factor
for economic growth. This is done by increasing the quality of a nation’s labour force
through education and training in advance technology. It has also been proved that
literacy not only improves productivity but also makes an individual more adaptable
to new challenges.
(ii) Natural resources: Availability of natural resources (land and mineral) to a nation is
also a vital source of growth. It is not only the availability of these resources but the
extent to which they are exploited. It should be noted that for the exploitation of
these resources care should be taken not to sacrifice the environment. This means
that growth through exploitation of these resources should be sustainable and
maintain environmental quality.

NOTE: This is a work in progress. All topics in the syllabus are covered but editing for necessary corrections is in progress.
Thanks.
365
(iii) Capital formation: Growth Economists believe that accumulation of capital is one
main source of growth of an economy. Emphasis is given to the accumulation of
more capital per head (machines, factories, roads etc.). It should however be noted
that mere accumulation of capital will not fuel growth. Unless there are areas of
investment unexploited, productive capacity cannot be increased merely by
increasing the stock of capital. Capital is also only one of the many productive
factors of production. If it is increased relative to other factors of production its
marginal efficiency falls (MEC).
(iv) Technology: Expansion of knowledge through science and engineering that leads to
new inventions and innovations in production techniques play an important role in
growth. Technology can either be developed internally or can be imported from
other countries.
QUESTION 18.2
2. Explain five features of less developing nations.
Answer
i. Low standards of living: In developing nations general standards of living
tend to be very low for the vast majority of the people. These low standards
of living are manifested quantitatively and qualitatively in the form of low
incomes (poverty), inadequate housing, poor health, limited or no education,
high infant mortality, low life and work expectancy and sometimes a general
sense of hopelessness. Income levels in Ghana and Nigeria are relatively low
as compared to levels in the developed world. The distribution of GDP is also
severely unequal.
ii. Health and Life Expectancy: In addition to struggling on low income, many
people in the developing nations fight a constant battle against malnutrition,
disease and ill health. The average life expectancy in developing nations in
2003 was 57 years as compared to 74 years in developed nations. Infant
mortality rate is approximately 73 (66 for Ghana). This compares poorly with

NOTE: This is a work in progress. All topics in the syllabus are covered but editing for necessary corrections is in progress.
Thanks.
366
12 in developed nations. Medical care is an extremely scarce social service in
many parts of the developing world.
iii. Low levels of productivity: In addition to low standards of living, developing
countries are characterized by relatively low levels of labour productivity.
Throughout the developing world, levels of labour productivity (output per
worker) are extremely low compared with those in developed countries. In
crop production, rural small-scale farmers form the majority of the
producers. Their productivity level is low due to the use of rudimentary tools
(such as hoes, cutlasses and sticks) and simple and outmoded technology.
iv. Dependence on agricultural production and primary product for exports. The
external sector comprises Imports and Exports, Ghana shows dependence on
a single crop, Cocoa, for export. In Ghana, the major exports including cocoa
account for about 60 per cent of the total foreign exchange earnings of the
country. Minerals in general earn on the average about 15 per cent of our
total foreign exchange earnings. Normally, primary products in LDCs account
for between 80-90% of export earnings but in the developed countries it is
about 35 per cent. In Ghana, the primary sector accounts for on the average,
about 80 per cent of our foreign exchange earnings implying that Ghana is
more of a developing country than a developed country.
v. Dominance, dependence and vulnerability in international relations. A
greater volume of Ghana’s exports comes from primary commodities like
cocoa, timber and gold. The contribution from other sectors, for instance,
manufacturing in terms of export is relatively insignificant. Since exports are
mainly primary products, it is quite apparent that income from export will
fluctuate. This stems from the fact that prices of primary raw materials
fluctuate more than those of manufactured goods. It is therefore, inevitable
that our revenue from export will fall because the terms of trade will be
unfavourable and consequently, this will have adverse effect on our Balance
of Payment (BOP).

NOTE: This is a work in progress. All topics in the syllabus are covered but editing for necessary corrections is in progress.
Thanks.
367
QUESTION 18.3
3. Give five reasons why you will classify your country as a developing
nation.
Answer
Same as points for Question 2
4. a) What is a development plan?
b) Explain three reasons for development planning.
Answer
a. A Development Plan is a document which contains a policy framework and
programme of development for a time period for a country. It sets out the general
measures and programmes of actions arranged according to a set of stated goals or
priorities.
b. (any three points)
To maximize the utilization of economic resources: The resources of any nation are
not always enough for her use. In this wise, resources must be allocated in such a
way that they achieve maximum utilization of them. It is through the proper
allocation of their resources that nations can accelerate their pace of economic
development.
To correct the imperfection of the market system – The market system in reality is
not perfect and therefore allocation of resources which occur under perfect
competition model does not happen. There is therefore the need to interfere to
ensure efficient allocation of resources
To bridge the gab between private cost and social cost, and private benefit and social
benefit. Under perfect market, there may be a divergence between social and
private cost on one hand and social and private benefit on the other. This occurs as
a result of the existence of externalities (benefits provided to or costs imposed on
third parties as a result of the production or consumption of goods or services).
Because of external benefits many projects which are needed may not be profitable

NOTE: This is a work in progress. All topics in the syllabus are covered but editing for necessary corrections is in progress.
Thanks.
368
under pure market system in which all investment decisions are left to the private
individuals. The level of investment may fall below the social optimum because
private investors ignore external benefits and supplementary benefits of projects in
calculating the prospective returns of their investment.
To ensure balanced growth: planning may be used to ensure balanced growth for all
sectors of the economy. By this there will be uniform growth and provision of
complementary services and intra sectoral linkages.
To attract foreign investment – Developing Plans are used as a means of attracting
foreign investment or foreign aid. Foreign government and international
organizations giving grants and loans need to be satisfied that the finance they
provide will be put to good use. Private investment will also be encouraged by
realistic plans showing the extent of economic growth that is expected to be
attained. Donor countries are therefore interested in well coordinated plans to
direct investment funds.
To match the available resources with the desired goals: The complementary nature
of some investment decisions make for planning. The viability of one project may be
conditioned upon another project. For example, the development of the agriculture
sector may the require setting up of irrigation projects and a special transport facility
for carrying fresh vegetables, fish etc between the farms and the market places. In
this wise, planning may be used to coordinate these activities.
QUESTION 18.5
5. a) What is a population census?
b) Explain three uses of population census
c) Identify and explain three problems of census in West Africa
Answer

NOTE: This is a work in progress. All topics in the syllabus are covered but editing for necessary corrections is in progress.
Thanks.
369
A population census is the head count of people living in a geographical area or in a country.
A population census collects comprehensive data on people to know e.g. sex, age,
educational and occupational backgrounds, religious affiliation, nationality etc.
b. (any three points)
It is used to determine the size and the growth rate of the population at a country.
The helps the government in planning for education, transportation, health etc.
It helps authorities to have adequate and relevant data. These data include the size,
composition, distribution of population etc. These data aid the planners of the
economy to forecast the future needs of the country.
Data provided by population census help in the allocation of resources to the various
regions and states of the country.
It provides data for demographic studies.
c. (any three points)
High Cost of Census: Censuses are supposed to be conducted at a 10 year interval.
The high cost of conducting census has made it impossible for West African countries
to conduct censuses at regular intervals.
Bad town planning and inaccessibility of some areas: In many developing countries
street and houses are not properly numbered. This makes it difficult for census
officials to locate people for enumeration.
Shortage of census officers: In many developing countries there are very few
qualified census officers. During census all kinds of people are used without any
proper training. This makes census figures inaccurate.
Customary beliefs: Certain beliefs in West Africa work against census. In certain
cultures people are not counted.
Religious belief/Practice: Some people use religion, e.g. Islam to prevent actual
headcount which affect reliability of data provided.

NOTE: This is a work in progress. All topics in the syllabus are covered but editing for necessary corrections is in progress.
Thanks.
370
APPENDIX I
SUGGESTED SOLUTIONS TO REVISION QUESTIONS
CHAPTER ONE
Section A: Solutions to Multiple Choice Questions
1. A
2. C
3. E
4. D
5. E
Section B : Solutions to Short Answer Questions
1. Scientific method is adopted in the study and analysis of human economic behavior.
2. Economists use the term opportunity cost to mean the next best alternative forgone
in the process of making a choice
3. Positive economics
4. Two functions of any economic system are:
i. Allocation of resources
ii. Organization of production
5. Two features of a free – market are:
a. Private ownership of the means of production and goods
b. Freedom of choice of what to consume by individual consumer and what to
produce by private firms.
SECTION B: Solutions to Short Answer Questions
1. For a consumer that has a given amount of money to spend on two goods the
consumer equilibrium condition prevails if the marginal utility per naira worth of the
two goods are the same.

NOTE: This is a work in progress. All topics in the syllabus are covered but editing for necessary corrections is in progress.
Thanks.
371
2. The law of diminishing marginal utility states that as more and more units of a
particular good or service are consumed during a specific period, the satisfaction
derived from each additional unit of the commodity or service decreases.
3. The budget line shows maximum combinations of two goods that the consumer can
afford to buy, given his money income and the prevailing prices of the two goods.
4. Two properties of an Indifference Curve are:
a. An indifference curve has a negative slope
b. Indifference curves can never intersect (axiom of transitivity)
5. The term consumer’s surplus refers to the difference between what the consumer
would be willing to pay to purchase a given quantity of a commodity and what he
actually pays for this quantity rather than forgoing it.
Section B: Solutions to Short Answer Questions
1. Two features of a firm in perfect competition are:
i. Large number of buyers and sellers
ii. Homogeneous product
2. i. In the short–run a perfectly competitive firm makes a supernormal or
abnormal profit.
ii. In the long–run, the profit of a perfectly competitive firm is described as
normal or zero economic profit.
3. In the short-run, the short down point of the perfectly competitive firm corresponds
to the output level and price below which the firm cannot cover average variable
costs.
4. The long-run supply curve of the perfectly competitive firm is given by the long – run
marginal cost curve above the minimum point on the long – run average total cost
(LAC)
5. Two advantages of perfect competition are:
i. Goods are sold at the lowest possible price
ii. Efficient utilization of resources
Two disadvantages of perfect competition are:
i. Firms make little or no profit
ii. Inventions and innovations are not encouraged.

NOTE: This is a work in progress. All topics in the syllabus are covered but editing for necessary corrections is in progress.
Thanks.
372
CHAPTER EIGHT
SECTION B: Solutions to Short Answer Questions
1. The term monopoly describes a market structure in which there is a single firm
producing a commodity or providing a service that has no close substitutes.
2. Two main features of monopoly are:
i. One firm in the industry
ii. Existence of barriers to entry
3. Two sources of monopoly power are:
i. The control of the entire supply of a basic input
ii. Economies of scale
4. Price discrimination is the practice of charging more than one price for different
units of a single product, when the price differences are not justified by differences
in the cost of serving different customers.
5. The conditions under which a monopolist will be able to practice price discrimination
profitably include:
i. The price elasticity of for the product must be different between classes of
buyers in each market.
ii. It must be impossible for some buyers to purchase the commodity at the
lower price and then resell it to others at the higher price.
CHAPTER NINE
Section B: Solutions to Short Answer Questions
1. a) Monopolistic competition describes a market or industry where there
are large number of firms producing or selling products which consumers
believe are close but not perfect substitutes for each other.
b) Oligopoly refers to an industry or market with a few firms producing or selling
products that are either homogeneous or differentiated.
c) Duopoly is a market structure in which only two firms constitute the industry.
2. Two features of monopolistic competition are:
i. Large number of firms in the industry.
ii. Product differentiation.
3. Two main features of Oligopoly are:
i. Interdependence among firms.

NOTE: This is a work in progress. All topics in the syllabus are covered but editing for necessary corrections is in progress.
Thanks.
373
ii. Existence of substantial barriers to entry.
4. The Kinked demand curve theory is meant to explain the tendency for the oligopolist
to be driven by self – interest towards stable prices.
5. The firms in an oligopoly are able to earn positive economic profit in the long-run on
the assumption of the existence of barriers preventing new firms from entering the
market.
Section B: Solutions to Short Answer Questions
1. Two problems associated with the barter systems are:
i. Double coincidence of wants
ii. No common unit of measure
2. Two functions of money are:
i. A medium of exchange
ii. A unit of account or a measure of value
Two essential attributes of money are:
i. General acceptability
ii. Divisibility
3. Demand deposit is a deposit of funds (usually paper money and coins) with a bank
which are withdrawable or transferable without prior notice by writing a cheque.
4. The three main motives for holding money are:
i. The transactions motive
ii. The precautionary/motive
iii. The speculative motive
5. The quantity theory of money states that the price level in an economy is strictly
proportional to the money supply.
Section B: Solutions to Short Answer Questions
1. Four functions of commercial banks are:
i. Accepting deposits of money
ii. Granting loans and advances
iii. Acting as agents of payments
iv. Providing international trade services

NOTE: This is a work in progress. All topics in the syllabus are covered but editing for necessary corrections is in progress.
Thanks.
374
2. Equipment leasing refers to the activity of banks in financing purchases of fixed
assets by their customers and allowing repayment over an agreed period of time.
3. Two examples of development financial institutions in Nigeria are:
i. The Nigeria Agricultural Cooperative and Rural Development Bank (NACRDB)
ii. Bank of Industry (BOI)
Two essential attributes of money are:
i. General acceptability
ii. Divisibility
4. Two development functions of the Central Bank are:
i. Promotion of the growth of financial markets
ii. Human capital development
5. a. Monetary policy refers to the combination of measures designed to regulate the
value, supply and cost of money in the economy in consonance with the expected
level of economic activity.
b. Three instruments of monetary policy are:
i. Open Market Operations (OMO)
ii. Reserve requirements
iii. Discount rate
Section B: Solutions to Short Answer Questions
1. Three sources of government revenue are:
i. Taxes (direct and indirect)
ii. Grants
iii. Loans
2. (a) A government budget is a document containing estimates of expected
revenue and
intended expenditure for the coming year
(b) Public debt refers to the total outstanding debt obligations or accumulated
borrowing of the government
(c) Fiscal policy is simply defined as the use of taxation and government
expenditure to regulate economic activity.
3. Three uses of taxation in a developing economy are:
(i) To finance government expenditure

NOTE: This is a work in progress. All topics in the syllabus are covered but editing for necessary corrections is in progress.
Thanks.
375
(ii) To manage the economy
(iii) To protect infant industries.
4. Two sources of finance for government fiscal deficit are:
(i) Internal borrowing from banks and non-bank public
(ii) External borrowing from bilateral creditors.
(iii) External borrowing from multilateral creditors e.g. The World Bank, IMF,
ADB, etc.
5. Government borrowing can be justified on the following three grounds:
(i) Capital formation
(ii) Stabilization of the economy
(iii) Provision of development finance

NOTE: This is a work in progress. All topics in the syllabus are covered but editing for necessary corrections is in progress.
Thanks.
376

NOTE: This is a work in progress. All topics in the syllabus are covered but editing for necessary corrections is in progress.
Thanks.
377
APPENDIX II
COMPREHENSIVE QUESTIONS AND SUGGESTED SOLUTIONS
CHAPTER ONE
1. (a) Identify and explain briefly the four fundamental economic questions
that every society must resolve, and why.
(b) Distinguish between the two main branches of economics –
microeconomics and macroeconomics.
Suggested Solution
(a) Every economic society must resolved the following fundamental economic
questions
(i) What is to be produced? Every society must determine in some manner what goods
and services and how much of each to produce during any given period of time
(ii) How is the output to be produced? Each firm must decide how to combine the
inputs to achieve optimal resources allocation. That is, what method of production
(e.g. labour intensive or capital – intensive) to adopt to realize the firm’s profit-
maximization objective.
(iii) For whom to produce? This is based on demand for products such that resources
are directed towards producing goods that are being demanded.
(iv) To whom is the output to be distributed? This question is about how to reward
factors of production, and how to take care of the poor and non-productive
members of the society.
(v) How to facilitate future growth? Each society must decide at what rate it will use up
its resources to enhance future production possibilities.
The above questions arise because all economies are faced with the problem of
economic scarcity – that is, human wants exceed the amounts of production possible
with the limited resources that are available`. Therefore, making choices between
what to have and what to forgo become necessary and unavoidable.

NOTE: This is a work in progress. All topics in the syllabus are covered but editing for necessary corrections is in progress.
Thanks.
378
(b) The study of economics is generally separated into two major areas-microeconomics
and macroeconomics
Microeconomics is concerned with the behavior of individual consumers and firms.
Specifically it examiners how relative prices are determined, how resources are
allocated to the production of particular goods and services, how the goods and
services are distributed among people, and how efficient resources are used.
Discussions in microeconomics are based on the assumptions of utility-maximization
goal for the individual consumer, and profit-maximization goal for the firm.
Macroeconomics, on the other hand, is the study of the economy as a whole. It
deals with aggregate variables such as national income, employment, volume of
money and the general price level, aggregate demand, total expenditure, savings
and investment, total exports and imports, and so on. Moreover, it explores the
causes and suggests possible solutions to such economic problems as inflation,
unemployment, balance of payments, deficits, sluggish economic growth, etc.
income inequality, and poverty.
CHAPTER FOUR
1. (a) Make a clear distinction between a budget line and an indifference curve.
(b) Outline the main properties of an indifference curve.
Suggested Solution
(a) A budget line shows different combinations of two goods that the consumer
can afford, given his money income and market prices of the two goods.

NOTE: This is a work in progress. All topics in the syllabus are covered but editing for necessary corrections is in progress.
Thanks.
379
4
Budget line
O 8Apple
The above budget line is drawn on the assumption that the consumer’s income is N400, unit
per apple (Pa) is N50, and unit price of beer (Pb) is N100
An indifference curve, on the other hand, joins together all points representing different
combinations of two goods which yield the same utility.
Beer
An indifference curve
O Apple
An indifference curve is illustrated in the above diagram. The idea here is that the
combination of beer and apple labelled points M and N are ranked equal in terms of
satisfaction derived by the consumer – i.e. the consumer has no reason to prefer M to N, or
vice versa.
(b) The main properties of an indifference curve are highlighted below:
(i) An indifference curve has a negative slope. This means that as less quantity of one
commodity is consumed a greater quantity of the other commodity must be
consumed for the consumer to enjoy the same level of utility.
Bee
r

NOTE: This is a work in progress. All topics in the syllabus are covered but editing for necessary corrections is in progress.
Thanks.
380
(ii) Indifference curves can never intersect. If two indifference curves intersect, the point
of intersection will represent two different levels of utility, and this will be
unreasonable and illogical.
(iii) An indifference curve cannot touch either axis. The assumption that the consumer
buys two goods in combination if it indifference curve touches either of the two axis.
(iv) A higher indifference curve. An indifference curve to the right of another represents
a higher level of utility and preferable combination of the two goods.
(v) Indifference curves are convex to the origin. This property is expressed in the axiom
of diminishing marginal rate of substitution which implies that, to obtain every
additional unit of one commodity the consumer is willing to sacrifice increasing
number of the other commodity.
Note:
It would be necessary to explain with relevant diagrams if it is explicitly stated in the
question that the characteristics of the indifference curve should be discussed or explained
fully.
CHAPTER SEVEN
1. (a) Explain what you understand by perfect competition
(b) Explain the short–and long–run equilibrium position of a firm operating
under conditions of perfect completion. (12 Marks)
Suggested Solution
1(a) Perfect completion refers to the market structure in which there are a large number
of relatively small firms, each firm having freedom of entry into and exit from the
industry. All firms produce homogeneous product and all market participants
(buyers and seller) have full knowledge of the situation in the market, especially
about the present price and location of the product.
(b) In the short-run, the perfectly competitive firm maximizes its profit by producing
output where MC=MR=P. This is shown in the diagram below (labeled Figure I) as
output Q1. The firm’s total profit is represented by the shaded rectangle P, ABC
which is obtained as total revenue (rectangle P,OQ,C) less total cost (rectangle
A,OQ,B). It follows that, in the short-run, the firm in perfect competition is making
positive economic profit, otherwise referred to as abnormal profit or supernormal
profit.

NOTE: This is a work in progress. All topics in the syllabus are covered but editing for necessary corrections is in progress.
Thanks.
381
Figure I: The Short-run Equilibrium position for a Perfectly Competitive firm
Price Cost SMC SAC SAVC
P1 D = AR = MR
A
O Q Output
In the above diagram, the short-run marginal cost, average total cost, average variable cost
curves are labelled SMC, SAC, and SAVC respectively.
In the long-run, on the other hand, the firm in perfect competition is making normal profit
or zero economic profit as shown in Figure 2 below (total cost equal total revenue)
Figure 2: The Long-run Equilibrium Position of the Perfectly Competitive Firm.
LMC
LAC
D = AR = MR
P1
O Q output
The existence of positive economic profit in the short-run serves as an incentive for new
firms to join the industry, especially since there are no barriers to entry. The process of
P
rice
Co
st

NOTE: This is a work in progress. All topics in the syllabus are covered but editing for necessary corrections is in progress.
Thanks.
382
new entry will persist until the profit of each firm in the industry is competed out. That is,
excess supply and continuous downward review of price to the level where price (P) equals
average total cost (LAC) will engender zero economic or normal profit in the long-run.
CHAPTER EIGHT
1. (a) Explain the term ‘monopoly’
(b) Outline four main sources of monopoly power
Suggested Solution
1(a) Monopoly is a market structure in which there is a single firm producing a
commodity or providing a service that has no close substitutes. As the sole supplier
to its market, the pure monopolist is assumed to have no current competitors, and it
is protected against the potential competition of new entrants into its market.
(b) The main sources of monopoly power include the following:
(i) Control of the entire supply of a basic input. It only one firm has access to or
controls the entire supply of the basic raw materials required in the production of a
product, such a firm will monopolize the supply of the product.
(ii) Economic of scale. A large firm may retain a monopoly power through cost
advantages gained from the use of cost – saving technology which enables it to sell
profitably at a very low price that discourages other firms or make it unprofitable for
other firms.
(iii) Franchise and patent right. A discovery or invention of a give product or a new
production process can lead to emergence of monopoly, when government gives the
firm legal backing so that no other firm produces the same product or copy the
technology. This is to allow the inventor derive the benefit of the money (resources)
committed to research and development (R ad D) effort.
(iv) State monopoly. The government may assume monopoly power in the production
of some commodities or in the provision of some services; either to prevent people
from being exploited or to ensure adequate supply of essential facilities which
cannot be provided by private entrepreneurs because of huge capital and high risk
involved. This is the case for public utilities, such as electricity, water, railway,
transport service, and so on.

NOTE: This is a work in progress. All topics in the syllabus are covered but editing for necessary corrections is in progress.
Thanks.
383
CHAPTER NINE
1. (a) Give four main features of monopolistic competition.
(b) A firm operating under conditions of monopolistic competition has the
following total cost and total revenue function.
Output/month
(000s)
Total Cost
(N’000s)
Total Revenue
(N’000)
1
2
3
4
5
6
47
80
105
125
160
215
90
140
170
190
200
180
Using the data, determine:
(i) The marginal revenue (MR) and marginal cost (MC) trends
(ii) The profit-maximizing level of monthly output
(iii) The profit – maximizing selling price
Suggested Solution
1(a) The main features of monopolistic competition are:
(i) Large number of firms in the industry. There are many small firms each supplying
only a small share of the total market output. Hence, no firm has any perceptible
influence on the price and output decisions of other firms in the industry.
(ii) Product differentiation. The firms supply products that are differentiated i.e. similar
but not identical. Therefore, each firm has some degree of market power, especially
some discretion as to what price to charge for its products.
(iii) Freedom of entry and exit of firms. Barriers to entry are relatively small or non-
existent, and productive resources are highly mobile. Product differentiation tends
to facilitate the entry of new firms in the industry.
(iv) Nature of demand curve. The demand curve for each firm’s product is downward
sloping and highly price elastic due to the large number of close substitutes. Price

NOTE: This is a work in progress. All topics in the syllabus are covered but editing for necessary corrections is in progress.
Thanks.
384
must be lowered to sell a large quantity hence, MR curve also slopes downward and
falls below the demand curve.
(b) (i) To obtain the MC and MR trends, use the following formulas:
ΔTC MC = ΔQ ΔTR MR = ΔQ Where ΔTC = change in total cost ΔTR = change in total revenue ΔC = change in output (quantity)
Q
(000s)
MC
(N000s)
MR
(N’000)
1
2
3
4
5
6
-
33
5
20
35
55
-
50
30
20
10
-20
(ii) The profit – maximizing output level is the level of output at which MC = MR.
Therefore, in the above table of MC = MR trends, the profit – maximizing level of monthly output is 4, 000 (i.e. where MC = MR = N20)
(iii) Profit – maximizing selling price (P) can be obtained at the profit – maximizing
output Level as: P = ΔTR Q 190,000 P = ----------- = N47.50 4,000
CHAPTER TEN
1. (a) Highlight the roles of money in any modern economy

NOTE: This is a work in progress. All topics in the syllabus are covered but editing for necessary corrections is in progress.
Thanks.
385
(b) Distinguish between the ‘transaction motive and ‘precautionary motive’ for
holding money.
Suggested Solution
1(a) The principal roles or functions of money in any modern economy are:
(i) A medium of exchange: Money facilitates the exchange of goods and services
because, people exchange the goods and services they produce for money and
then use the money to buy other goods and services they want. This enabled
man to overcome the problem of ‘double coincidence of wants’ associated with
trade by barter.
(ii) A unit of account or a measure of value: Money serves as the unit in terms of
which the values of goods and services are measured and recorded.
(iii) A store of value: Money provides the purchasing power in a general form that
can be used to meet future needs of goods and services. Under the barter
system, articles of trade are easily perishable and cannot be stored for future
transactions.
(iv) A standard of deferred payment: Money makes it possible for people to enter
into contracts, such as lending, borrowing, and enjoyment of services for fixed
amount of money payable at a future dates. The exchange rate problem makes
this impossible under the barter system.
b(i) Transactions demand for money represents cash balances held by economic
agents in order to carry out ordinary everyday transactions. For example,
individual consumers need to hold money to buy food, cloth, pay bus fares, and
so on. Similarly, business organizations need money to pay wages and electricity
bills, buy raw materials, fuel for vehicles, etc. the transactions demand for
money is directly related to income, and inversely related to the rate of interest
that could be earned from holding interest-yielding assets in the alternative.
The precautionary motive, on the other hand, refers to holding cash balances as
a precaution against unexpected events. For instance, people hold money to
provide them with some degree of security against sudden illness, accidents, fire
or flood disaster, and so on. The main factor influencing this motive is the level
of income.
CHAPTER THIRTEEN
1. (a) Give four main functions of Central Bank
(b) Distinguish clearly between the ‘money market’ and ‘capital market’

NOTE: This is a work in progress. All topics in the syllabus are covered but editing for necessary corrections is in progress.
Thanks.
386
Suggested Solutions
1(a) The main functions of the Central Bank in both developed and developing economies
include:
(i) Currency issue and distribution: The Central Bank is the only institution empowered
by law to issue currency notes and coins that are used as a medium of exchange in
the country. The monopoly power of issuing legal tender currency is important to
control the supply of money in order to prevent inflation.
(ii) The bankers’ banks: The Central Bank provides facilities for other banks, especially
commercial banks to keep their cash reserve and clear their balance through
clearing house. It also grants loans to or discount the bills of commercial banks
when they are short of fund; hence the Central Bank is referred to as ‘lender of last
resort’.
(iii) Banker to the government: The Central Bank keeps the accounts of the
government and of all its corporations and agencies. It receives all payments due to
the government, as well as undertake borrowing on behalf of the government
through the issuance of short-term securities e.g. treasury bills and treasury
certificates, and long-term securities – e.g. development stocks. The Central Bank is
also responsible for the management of domestic and external debts of the
government.
(iv) Promotion of monetary stability: The central bank controls money supply in the
economy to promote price stability. This involves the use of instruments of
monetary policy such as open market operation (OMO), reserve requirements,
discount rate, etc.
(b) The money market is a market of short-term loans. It consists of financial institutions
having surplus fund to lend on short-term basis, and those wishing to borrow. The
market allocated savings into investments thereby promoting rational allocation of
resources. It also encourages savings and investment habits by promoting liquidity
and safety of financial assets. Institutions that operates in the market include the
Central Bank, commercial banks, and discount houses. The major short-term
instruments associated with the Nigerian money market includes treasury securities,
commercial papers, call money, Bankers’ Unit Fund, Banker’ Acceptance, etc.
The capital market on the other hand, is a market for mobilizing long-term funds. It is
a market for new issues of securities as well as for trading in existing securities. The
major instruments for raising funds in the market include equities, debentures,

NOTE: This is a work in progress. All topics in the syllabus are covered but editing for necessary corrections is in progress.
Thanks.
387
bonds, and stocks. The main institutions in the capital market are the stock exchange,
the issuing houses, and the stock broking firms.
CHAPTER FOURTEEN
1. (a) What is National Budget?
(b) Discuss briefly the three types of national budget.
Suggested Solution
1 (a) A National Budget is a document showing estimates of expected government
revenue and intended expenditure for the coming financial year. It usually consist of
the review of the performance of the immediate preceding budget, objectives of the
present budget, revenue projection, estimates of current and capital expenditures as
well as policy strategies to promote the achievement of the stated objectives.
(b) The three types of budget are:
(i) Surplus Budget: A surplus budget occurs when the expected government revenue is
planned to exceed the proposed government expenditure. It can be achieved by
reducing government expenditure or increasing taxation or both. A surplus budget is
usually adopted to reduce inflationary pressures because it reduces aggregate
effective demand in the economy.
(ii) Deficit Budget: A deficit budget occurs when the government revenue estimate is
less than the proposed government expenditure. The fiscal deficit can be financed by
raising loans from both internal and external sources. A deficit budget may be used
to stimulate domestic production during economic recession or depression.
(iii) Balanced Budget: A government budget is balanced when its revenue estimate is
equal to the intended expenditure. It is also called a neutral budget because it is
usually adopted to keep the level of economic activities stable as in the preceding
year.
CHAPTER SEVENTEEN
1. (a) Highlight the main objective of the African Development Bank (ADB)
(b) What are the problems facing the African Development Bank (ADB) in the
course achieving the objectives for which it was established

NOTE: This is a work in progress. All topics in the syllabus are covered but editing for necessary corrections is in progress.
Thanks.
388
Suggested Solution
1(a) The main objectives of the African development Bank (ADB) are:
i. To finance investment projects and programmes of its members using its resources.
ii. To mobilize resources from outside Africa, especially from developed countries, for
the financing of such investment projects and programmes.
iii. To undertake or participate in the selection, study and preparation of projects,
enterprises, and activities contributing to the development of its members.
iv. To promote technical assistance required in the selection, study, preparation and
execution of development projects or programmes.
v. To promote in investment in Africa of public and capital projects or programmes
designed to boost economic development or social progress.
(b) The problems of the ADB in recent times have been identified to include:
(i) The rapid decline in its financial resources due to increasing areas on loan repayments
from member countries.
(ii) Failure of member countries to pay their subscriptions timely and regularly
(iii) The continued concentration of its lending to a few countries.