ATS Company Reports: Camlin fine sciences
12
-
Upload
ats-investments -
Category
Economy & Finance
-
view
33 -
download
2
Transcript of ATS Company Reports: Camlin fine sciences


Company Details
Camlin Fine Sciences is one of the India's leading manufacturers and exporters of food grade
antioxidants and industrial chemicals. The company exited the pharmaceutical business in the
early 2000s and focused more on the specialty niche products business. Camlin Fine Sciences
was demerged in the year 2006 from the Camlin Group and it was a mirror holding with an
investor getting one share of Camlin Fine Sciences and one share of Camlin Limited (Kokuyo
Camlin now).
Camlin Fine Sciences (Camlin Fine) is one of the largest players across the globe in the anti-
oxidant industry. The company has a 40-45 per cent market share in the TBHQ (Tertiary Butyl
Hydroquinone) segment and 70 per cent in the BHA (Butyl Hydroxyl Anisole) segment. It has set
up a wholly owned subsidiary in Brazil, North America and Spain to facilitate better customized
products and services for its American and European clients. It is in the process of setting up
distribution hubs across key geographies to attain faster growth and garner larger market share.
The current market capitalization stands at Rs 865.45 crore. The company has reported a
standalone sales of Rs 108.25 crore and a Net Profit of Rs 6.84 crore for the quarter ended Dec
2014.
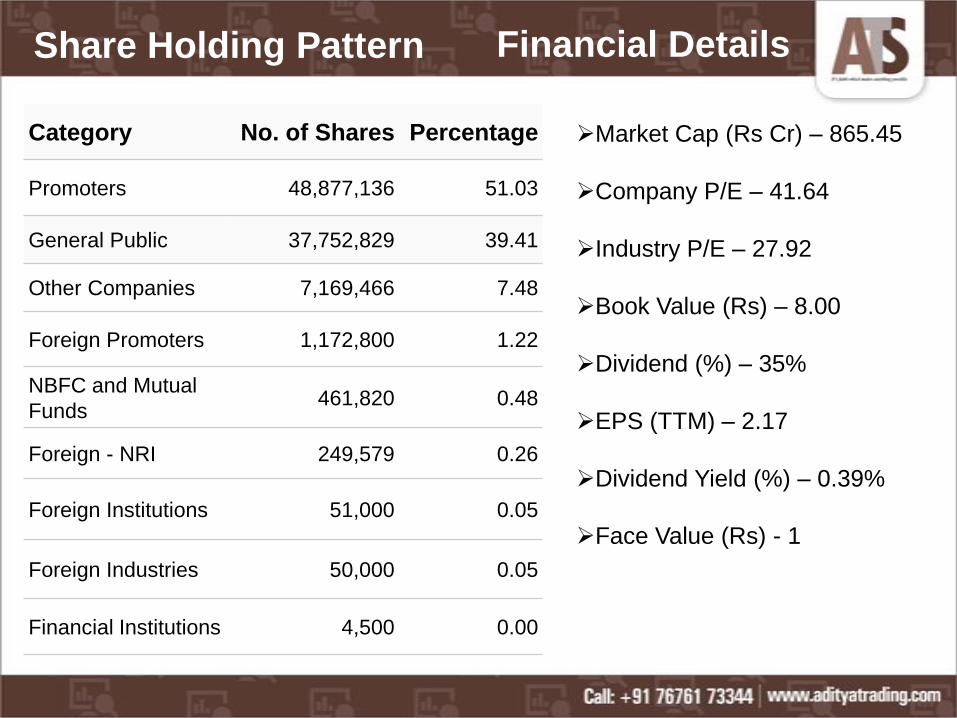
Category No. of Shares Percentage
Promoters 48,877,136 51.03
General Public 37,752,829 39.41
Other Companies 7,169,466 7.48
Foreign Promoters 1,172,800 1.22
NBFC and Mutual
Funds461,820 0.48
Foreign - NRI 249,579 0.26
Foreign Institutions 51,000 0.05
Foreign Industries 50,000 0.05
Financial Institutions 4,500 0.00
Market Cap (Rs Cr) – 865.45
Company P/E – 41.64
Industry P/E – 27.92
Book Value (Rs) – 8.00
Dividend (%) – 35%
EPS (TTM) – 2.17
Dividend Yield (%) – 0.39%
Face Value (Rs) - 1
Share Holding Pattern Financial Details

Industry Forecast
Global chemical market size was estimated at USD 3.9 trillion in 2013 and is expected to grow at 3-4% per
annum over the next 5 years to reach USD 4.7 trillion by 2018. India currently accounts for approximately 3%
of the world chemical market. The Indian chemical and petrochemical industry expanded in 2013 despite
weakness in key export markets and subdued growth in the domestic market. The Indian chemical and
petrochemical industry currently stands at USD 118 Bn and is expected to grow at a CAGR of 8% for the next
five years. The share of this sector in the manufacturing GDP was 15% during 2012-13 and it accounted for
~9% of the total India's exports. Bulk chemicals form the largest sub-segment of Indian chemical industry with
40% market share whereas specialty chemicals with ~19% market share is the fastest growing segment.
The current low per capita consumption across industries and segments and strong growth outlook for the key
end use are the key growth drivers for this industry. To meet the increasing demand either the local production
will have to ramp up or it will be met by imports. In the past decade, India didn't tap its manufacturing potential
to the fullest which led to a surge in the chemical imports. Net imports have grown at ~20% between FY09 and
FY13 where in the same period the domestic output has grown by ~4%.However, going forward, 'Made in
India' could become the next big manufacturing growth story. The Government has set an ambitious plan of
increasing the share of manufacturing in GDP from 16% to 25% by 2022.
Driven by the strong growth outlook for end use industries, the domestic market for specialty chemicals is
expected to grow strongly, buoyed also by the increased adoption of specialty chemicals and their increased
usage in different products categories. Paints coating and construction chemicals, colorants, Active
Pharmaceutical Ingredients (APIs), personal care chemicals and flavors & fragrances are the specific
segments that are expected to do well in the Indian market.
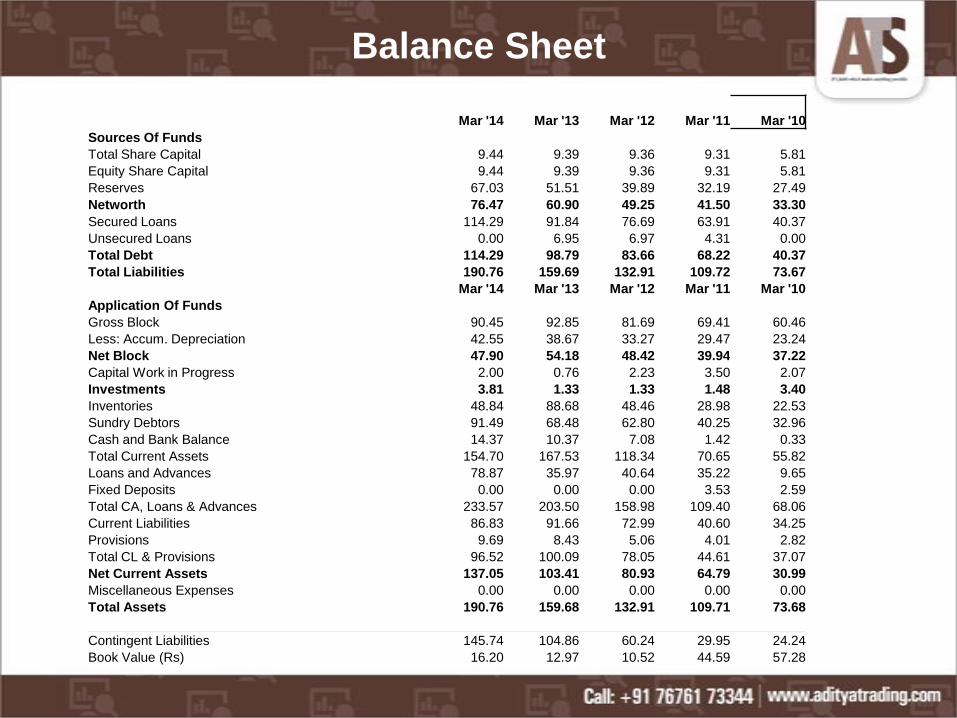
Balance Sheet
Mar '14 Mar '13 Mar '12 Mar '11 Mar '10
Sources Of Funds
Total Share Capital 9.44 9.39 9.36 9.31 5.81
Equity Share Capital 9.44 9.39 9.36 9.31 5.81
Reserves 67.03 51.51 39.89 32.19 27.49
Networth 76.47 60.90 49.25 41.50 33.30
Secured Loans 114.29 91.84 76.69 63.91 40.37
Unsecured Loans 0.00 6.95 6.97 4.31 0.00
Total Debt 114.29 98.79 83.66 68.22 40.37
Total Liabilities 190.76 159.69 132.91 109.72 73.67
Mar '14 Mar '13 Mar '12 Mar '11 Mar '10
Application Of Funds
Gross Block 90.45 92.85 81.69 69.41 60.46
Less: Accum. Depreciation 42.55 38.67 33.27 29.47 23.24
Net Block 47.90 54.18 48.42 39.94 37.22
Capital Work in Progress 2.00 0.76 2.23 3.50 2.07
Investments 3.81 1.33 1.33 1.48 3.40
Inventories 48.84 88.68 48.46 28.98 22.53
Sundry Debtors 91.49 68.48 62.80 40.25 32.96
Cash and Bank Balance 14.37 10.37 7.08 1.42 0.33
Total Current Assets 154.70 167.53 118.34 70.65 55.82
Loans and Advances 78.87 35.97 40.64 35.22 9.65
Fixed Deposits 0.00 0.00 0.00 3.53 2.59
Total CA, Loans & Advances 233.57 203.50 158.98 109.40 68.06
Current Liabilities 86.83 91.66 72.99 40.60 34.25
Provisions 9.69 8.43 5.06 4.01 2.82
Total CL & Provisions 96.52 100.09 78.05 44.61 37.07
Net Current Assets 137.05 103.41 80.93 64.79 30.99
Miscellaneous Expenses 0.00 0.00 0.00 0.00 0.00
Total Assets 190.76 159.68 132.91 109.71 73.68
Contingent Liabilities 145.74 104.86 60.24 29.95 24.24
Book Value (Rs) 16.20 12.97 10.52 44.59 57.28

Profit and Loss Account
Mar '14 Mar '13 Mar '12 Mar '11 Mar '10
Income
Sales Turnover 374.39 313.53 252.06 166.76 126.99
Excise Duty 0.00 0.00 0.00 2.09 2.58
Net Sales 374.39 313.53 252.06 164.67 124.41
Other Income 2.33 2.87 3.56 1.40 1.85
Stock Adjustments -6.27 0.85 5.67 6.03 -1.91
Total Income 370.45 317.25 261.29 172.10 124.35
Expenditure
Raw Materials 231.52 202.38 171.46 113.01 73.44
Power & Fuel Cost 10.40 10.20 10.68 8.71 9.05
Employee Cost 13.98 11.28 9.45 8.11 6.46
Other Manufacturing Expenses 0.00 0.00 0.00 6.13 3.79
Selling and Admin Expenses 0.00 0.00 0.00 12.83 10.64
Miscellaneous Expenses 53.62 44.78 30.56 3.58 3.94
Total Expenses 309.52 268.64 222.15 150.20 107.32
Operating Profit 58.60 45.74 35.58 20.50 15.18
PBDIT 60.93 48.61 39.14 21.90 17.03
Interest 22.40 17.52 16.20 8.00 6.04
PBDT 38.53 31.09 22.94 13.90 10.99
Depreciation 9.32 8.56 6.49 5.46 4.43
Profit Before Tax 29.21 22.53 16.45 8.44 6.56
PBT (Post Extra-ord Items) 29.21 22.53 16.45 8.44 6.56
Tax 10.24 7.77 6.30 1.76 2.30
Reported Net Profit 18.97 14.76 10.14 6.66 4.29
Total Value Addition 78.00 66.26 50.70 37.21 33.87
Equity Dividend 3.32 2.82 2.34 1.86 1.16
Corporate Dividend Tax 0.56 0.48 0.38 0.30 0.20
Per share data (annualised)
Shares in issue (lakhs) 472.04 469.44 467.94 93.06 58.14
Earning Per Share (Rs) 4.02 3.14 2.17 7.16 7.37
Equity Dividend (%) 35.00 30.00 25.00 20.00 20.00
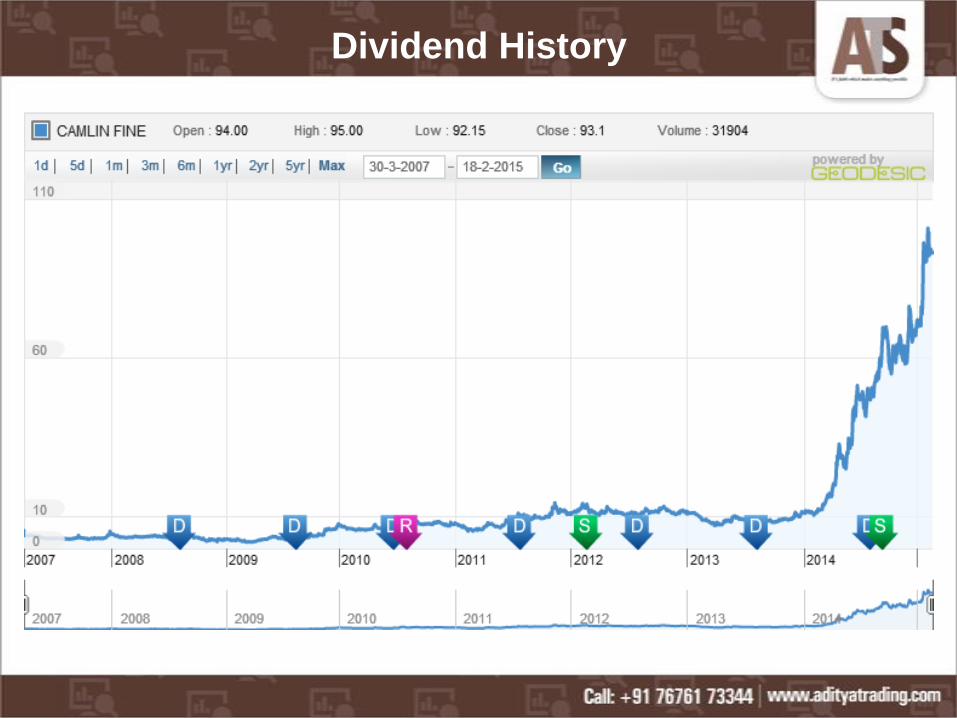
Dividend History

Index and Company Price Movement Comparison

Symbol Value Action
RSI(14) 50.125 Neutral
STOCH(9,6) 79.583 Buy
STOCHRSI(14) 90.436 Overbought
MACD(12,26) -0.130 Sell
ADX(14) 25.986 Buy
Williams %R -5.000 Overbought
CCI(14) 50.8656 Buy
ATR(14) 0.3679 Less Volatility
Highs/Lows(14) 0.0929 Buy
Ultimate Oscillator 55.992 Buy
ROC -0.386 Sell
Bull/Bear Power(13) 0.3140 Buy
Technical Indicators

PBIT – 13.07 v/s 11.75
RoCE – 27.04 v/s 25.07
RoE – 36.19 v/s 25.52
Net Profit Margin – 5.03 v/s 4.66
Return on net worth – 24.80 v/s 24.23
D/ E Ratio – 1.49 v/s 1.62
Interest Cover – 2.30 v/s 2.29
Current Ratio – 0.87 v/s 0.92
Reserves – 67.03 cr v/s 51.51 cr
PAT – 18.97 cr v/s 14.76 cr
Total assets – 190.76 cr v/s 159.08 cr
Net sales – 374.39 cr v/s 313.53 cr
Book Value – 16.20 v/s 12.97
Important Ratios
Days BSE
30 87.15
50 80.03
150 65.29
200 58.31
Simple Moving Average

Recommendations
Buy Camlin Fine Sciences Ltd. at current or
lower market levels
Reasons for the recommendations are :
Healthy financial position and attractive ratios.
Very less competition for the company products.
Increase in demands for junk foods, pharma products and cosmetics will increase in
revenue of the company.
Good performance by company owned subsidiaries will increase profits.
Growth forecast of the this sector of the industry.
Attractive CAGR of the company in recent years.