
Atomic Structure and Composition of Pt Co Nanocatalysts in
6
Atomic Structure and Composition of “Pt 3 Co” Nanocatalysts in Fuel Cells: An Aberration-Corrected STEM HAADF Study Brian Patrick, †,‡,# Hyung Chul Ham, §,∇ Yang Shao-Horn, ∥,⊥ Lawrence F. Allard, ⊗ Gyeong S. Hwang, § and Paulo J. Ferreira* ,† † Materials Science and Engineering Program, ‡ Department of Mechanical Engineering, and § Department of Chemical Engineering, University of Texas at Austin, Austin, Texas 78712, United States ∥ Department of Mechanical Engineering and ⊥ Department of Materials Science and Engineering, Massachusetts Institute of Technology, Cambridge, Massachusetts 02139, United States ⊗ Materials Science and Technology Division, Oak Ridge National Laboratory, Oak Ridge, Tennessee 37831, United States * S Supporting Information ABSTRACT: Pt 3 Co nanoparticles are used to promote the oxygen reduction kinetics and increase the efficiency of proton exchange membrane (PEM) fuel cells. For the first time, aberration-corrected scanning transmission electron microscopy (STEM), STEM image simulations, and DFT calculations are combined to provide insight into the origin of enhanced catalysis of Pt 3 Co nanoparticles. Acid-leached nanoparticles exhibit a solid-solution structure but heterogeneous composition, while heat-treated nanoparticles exhibit an ordered structure, except for the first three surface layers where Pt enrichment is observed. KEYWORDS: PEM fuel cells, platinum-alloyed catalysts, aberration-corrected STEM, nanoparticles ■ INTRODUCTION Proton exchange membrane fuel cells (PEMFCs) are promising energy conversion devices for transport, stationary and portable applications. 1,2 At the anode side of the PEMFCs, hydrogen fuel is delivered and split into protons and electrons by catalyst nanoparticles (NPs). At the cathode side, air is delivered and the oxygen is catalytically reduced by NPs, where it reacts with the protons crossing the proton exchange membrane, and the electrons travel through the external circuit to form water. The oxygen reduction reaction (ORR) occurring at the cathode has been shown to limit significantly the fuel cell efficiency. 3 In addition, catalyst NPs are typically composed of platinum (Pt), which imposes large costs on PEMFC technology. Pt-alloy catalysts have been investigated as a replacement for Pt to promote the kinetics of the oxygen reduction reaction (ORR) in the cathode of PEMFCs. Two strategies are shown to increase the intrinsic ORR activity on Pt from studies of extended Pt-alloy surfaces: (1) Pt-segregated surfaces induced by high-temperature annealing 4,5 and (2) Pt-enriched surfaces by acid removal of less noble alloying elements than Pt, 6,8,9 where intrinsic ORR activity (ORR current per true Pt surface area) can increase by 2−10 times relative to that of Pt. 5−12 Combined computational and experimental studies 6,13−16 have shown that the enhanced ORR activity of Pt alloys can be attributed to reduced surface reactivity toward surface oxy- genated species as a result of a lower d-band center energy normalized to the Fermi level of Pt alloy surfaces. These developments have motivated research to extend the existing understanding of the ORR mechanism and enhanced activity of bulk Pt-alloy surfaces to nanocatalysts with sizes of practical relevance. It is well-known that Pt-alloy NP catalysts have ORR activities considerably higher than Pt NPs. 17−22 Pt-alloy NP catalysts can also be subjected to either an acid leaching treatment, which is thought to remove the more reactive alloying elements from the NP surface region, 6,16,23−27 or an annealing step in vacuum or argon to induce surface Pt segregation. More recently, Xin et al. 28 have performed atomic resolution electron energy loss spectroscopy (EELS) analysis on as received NPs, as well as NPs which were subsequently heat-treated and as-received NPs which were heat-treated followed by an acid leaching treatment. The authors 28 showed that there is a Co-free shell on as received NPs, while there is one monolayer Pt shell on {111} facets of NPs which were subjected to a heat treatment after being received. In addition, when the heat-treated NPs were subjected to an acid treatment, the shell thickness grew to around 2.5 monolayers and was independent of facet orientation. Received: September 10, 2012 Revised: January 18, 2013 Published: January 21, 2013 Article pubs.acs.org/cm © 2013 American Chemical Society 530 dx.doi.org/10.1021/cm3029164 | Chem. Mater. 2013, 25, 530−535
Transcript of Atomic Structure and Composition of Pt Co Nanocatalysts in

Atomic Structure and Composition of “Pt3Co” Nanocatalysts in FuelCells: An Aberration-Corrected STEM HAADF StudyBrian Patrick,†,‡,# Hyung Chul Ham,§,∇ Yang Shao-Horn,∥,⊥ Lawrence F. Allard,⊗ Gyeong S. Hwang,§
and Paulo J. Ferreira*,†
†Materials Science and Engineering Program, ‡Department of Mechanical Engineering, and §Department of Chemical Engineering,University of Texas at Austin, Austin, Texas 78712, United States∥Department of Mechanical Engineering and ⊥Department of Materials Science and Engineering, Massachusetts Institute ofTechnology, Cambridge, Massachusetts 02139, United States⊗Materials Science and Technology Division, Oak Ridge National Laboratory, Oak Ridge, Tennessee 37831, United States
*S Supporting Information
ABSTRACT: Pt3Co nanoparticles are used to promote the oxygenreduction kinetics and increase the efficiency of proton exchangemembrane (PEM) fuel cells. For the first time, aberration-correctedscanning transmission electron microscopy (STEM), STEM imagesimulations, and DFT calculations are combined to provide insight intothe origin of enhanced catalysis of Pt3Co nanoparticles. Acid-leachednanoparticles exhibit a solid-solution structure but heterogeneouscomposition, while heat-treated nanoparticles exhibit an orderedstructure, except for the first three surface layers where Pt enrichmentis observed.
KEYWORDS: PEM fuel cells, platinum-alloyed catalysts, aberration-corrected STEM, nanoparticles
■ INTRODUCTION
Proton exchange membrane fuel cells (PEMFCs) are promisingenergy conversion devices for transport, stationary and portableapplications.1,2 At the anode side of the PEMFCs, hydrogenfuel is delivered and split into protons and electrons by catalystnanoparticles (NPs). At the cathode side, air is delivered andthe oxygen is catalytically reduced by NPs, where it reacts withthe protons crossing the proton exchange membrane, and theelectrons travel through the external circuit to form water. Theoxygen reduction reaction (ORR) occurring at the cathode hasbeen shown to limit significantly the fuel cell efficiency.3 Inaddition, catalyst NPs are typically composed of platinum (Pt),which imposes large costs on PEMFC technology.Pt-alloy catalysts have been investigated as a replacement for
Pt to promote the kinetics of the oxygen reduction reaction(ORR) in the cathode of PEMFCs. Two strategies are shownto increase the intrinsic ORR activity on Pt from studies ofextended Pt-alloy surfaces: (1) Pt-segregated surfaces inducedby high-temperature annealing4,5 and (2) Pt-enriched surfacesby acid removal of less noble alloying elements than Pt,6,8,9
where intrinsic ORR activity (ORR current per true Pt surfacearea) can increase by 2−10 times relative to that of Pt.5−12
Combined computational and experimental studies6,13−16 haveshown that the enhanced ORR activity of Pt alloys can beattributed to reduced surface reactivity toward surface oxy-genated species as a result of a lower d-band center energy
normalized to the Fermi level of Pt alloy surfaces. Thesedevelopments have motivated research to extend the existingunderstanding of the ORR mechanism and enhanced activity ofbulk Pt-alloy surfaces to nanocatalysts with sizes of practicalrelevance.It is well-known that Pt-alloy NP catalysts have ORR
activities considerably higher than Pt NPs.17−22 Pt-alloy NPcatalysts can also be subjected to either an acid leachingtreatment, which is thought to remove the more reactivealloying elements from the NP surface region,6,16,23−27 or anannealing step in vacuum or argon to induce surface Ptsegregation. More recently, Xin et al.28 have performed atomicresolution electron energy loss spectroscopy (EELS) analysison as received NPs, as well as NPs which were subsequentlyheat-treated and as-received NPs which were heat-treatedfollowed by an acid leaching treatment. The authors28 showedthat there is a Co-free shell on as received NPs, while there isone monolayer Pt shell on {111} facets of NPs which weresubjected to a heat treatment after being received. In addition,when the heat-treated NPs were subjected to an acid treatment,the shell thickness grew to around 2.5 monolayers and wasindependent of facet orientation.
Received: September 10, 2012Revised: January 18, 2013Published: January 21, 2013
Article
pubs.acs.org/cm
© 2013 American Chemical Society 530 dx.doi.org/10.1021/cm3029164 | Chem. Mater. 2013, 25, 530−535
In this paper, we have taken a different approach bysubjecting a group of as-received “PtCo” alloy NPs with anaverage atomic ratio of Pt/Co close to 1 first to an acid leachingtreatment, and a second group to the same acid leachingprocedure, followed by a heat-treatment. As discussed by Chenet al.23,24 the reason for this is that the acid-treatment produces,for the most part, NPs with a truncated octahedron shape,which is the typical equilibrium shape for Pt NPs, while thesubsequent annealing treatment produces a large amount ofNPs with a truncated cuboid shape. In terms of ORR activity,acid-leached “Pt3Co” NPs, show twice the activity of pure PtNPs, while acid-leached “Pt3Co” subjected to an additionalannealing treatment show an ORR intrinsic activity 4 times thatof pure Pt NPs.However, the near-surface atomic distribution of Pt and Co
within individual “Pt3Co” NPs treated by the above two routes(acid leaching or acid leaching followed high- temperatureannealing), which is believed to strongly affect the electronicstructure and ORR activity of surface Pt atoms, is stillunknown. In addition, there is currently no direct correlationbetween the atomic distribution and the composition of theseNPs (atomic-column by atomic-column basis), particularly onthe surface layers, and their catalytic activity. This is mainly dueto (1) limitations in the spatial resolution of conventionalSTEM imaging; (2) the difficulty in separating thickness andmass effects when using high-angular annular dark field(HAADF) STEM imaging; (3) challenges associated withusing atomic resolution EELS and energy dispersive spectros-copy (EDS), due to spatial resolution and sample drift and (4)lack of experimental data at the atomic level as inputinformation to theoretical models that may predict the surfacereactivity and ORR activity.29
In this study, aberration-corrected HAADF STEM imaging,coupled with STEM HAADF simulations, were employed tostudy the subnanometer-scale distribution of Pt and Co withinindividual acid-leached or acid-leached and annealed “Pt3Co”NPs. The combination of these techniques is unique becauseaberration-corrected HAADF STEM is capable of atomic-column by atomic-column imaging, providing mass−thicknesscontrast at the atomic level, while the computer simulationsallow us to separate the mass and thickness effects and thusdetermine the local composition of “Pt3Co” NPs at the atomicscale. In addition, to achieve a fundamental understanding ofthe near-surface atomic arrangements in “Pt3Co” NPs and theireffect on the ORR activity, density functional theory (DFT)calculations were performed.
■ METHOD SECTIONTwo samples of “Pt3Co” NPs supported on carbon (Pt 46 wt %) wereexamined. One was prepared by acid treatment from “PtCo” alloy NPswith an average atomic ratio of Pt/Co close to 1, which was suppliedby Tanaka Kikinzoku (TKK) International, Inc. This sample had anaverage Co atomic percentage of ∼22 atom %.23,24 The other wasobtained by annealing acid-treated-“Pt3Co” at 1000 K for 3 h at a lowpressure of 3 × 10⁻² Torr and then cooled in the furnace to 373 K(average heating: 30 K/min; average cooling: 5 K/min).Both samples were then imaged using a high-resolution JEOL
2010F TEM/STEM located at the University of Texas at Austin, andan aberration-corrected JEOL 2200FS TEM/STEM, equipped with aHAADF detector and located at Oak Ridge National Laboratory.These high-resolution TEM and aberration-corrected STEM imageswere first analyzed in great detail to create atomic models of the NPs.As shown previously,23,24 the histograms of 200 randomly selectedparticles for both the acid-treated and the heat-treated “Pt3Co” NPs
revealed an average particle size of 4 and 5 nm, respectively. Inaddition, the acid-treatment produced, for the most part, NPs with atruncated octahedron shape (see Supporting Information, Figures S1aand S1b). On the other hand, the annealing treatment produced alarge amount of NPs with a truncated cuboid shape (see SupportingInformation, Figures S1c and S1d).
From the projected TEM and STEM images and diffractioninformation, the basic geometries of the NPs were determined. This isimportant as the STEM simulations depend on crystal orientation andsample thickness. This information was then used in conjunction withthe crystal building software, VESTA, to create initial atomic models ofthe NPs. The atomic models were then exported from VESTA30 to theHREM Simulation Suite, which is a TEM/STEM simulation softwarepackage based on the FFT Multislice technique.31 The HREMSimulation Suite evaluates both the wave function and its Fouriertransform at each slice, using the approximation by Weickenmeier andKohl,32 to calculate the elastic scattering amplitude. This is a goodapproximation when considering electrons scattered at high angles,such as the case of HAADF images.33,34 The HAADF intensity is thencalculated by adding the thermal diffuse scattering factor to the elasticscattering amplitude.21 This is essential as atomic vibrations dampenthe intensity of the electron waves going through the specimen. Themicroscopy parameters used for the simulations are shown in Table 1.
These parameters correspond to the settings used for the operation ofthe JEOL 2200FS aberration-corrected STEM at Oak Ridge NationalLaboratory. The multislice simulations were carried out assuming astep scanning size of 0.18 Å (less than the distance to be resolved), aminimum slice thickness of 1.9 Å (approximately half of the latticeparameter for Pt3Co), and a Debye−Waller factor of 0.0051 Å2, whichis related to the mean square of the thermal displacement of an atomfrom its equilibrium position, and obtained from X-ray diffraction.24
After the simulations were completed, the simulated images werecompared with the actual images for verification, and the localchemical composition was approximated.
The spin polarized DFT calculations were performed within thegeneralized gradient approximation (GGA-PW91),35 as implementedin the Vienna Ab-initio Simulation Package (VASP).36 The projectoraugmented wave (PAW) method with a planewave basis set wasemployed to describe the interaction between core and valenceelectrons.37 The valence configurations employed to construct theionic pseudopotentials are as follows: 5d10 6s1 for Pt and 3d8 4s1 forCo. An energy cutoff of 350 eV was applied for the planewaveexpansion of the electronic eigenfunctions. For PtCo(100) modelsurfaces, we constructed nine (and five) atomic-layer slabs withrectangular 2 × 2 (and 4 × 4) unit cells where each layer consists of 4(or 16) atoms. Each slab is separated from its periodic images in thevertical direction by a vacuum space corresponding to seven atomiclayers. While the bottom two layers of the nine/five-layer slabs werefixed at corresponding bulk positions, the upper layers were fullyrelaxed using the conjugate gradient method until residual forces on allthe constituent atoms become smaller than 5 × 10⁻² eV/Å. For theBrillouin zone integration, we used a (3 × 3 × 1) Monkhorst−Pack
Table 1. Microscope Parameters Used for the ComputerSimulations and Associated with the JEOL 2200 FSAberration-Corrected STEM Located at Oak Ridge NationalLaboratory
aperture radius 26 mraddefocus −19.01 Å(third order spherical aberration) 1 μm(2-fold astigmatism) 1.344 nm −75.15 deg(3-fold astigmatism) 39.59 nm 37.1 deg(4-fold astigmatism) 6.797 μm −175.35 deg(5-fold astigmatism) 11.3 μm 46.3 degHAADF detector (inner radius) 100 mradHAADF detector (outer radius) 170 mrad
Chemistry of Materials Article
dx.doi.org/10.1021/cm3029164 | Chem. Mater. 2013, 25, 530−535531
mesh of k points to calculate geometries and total energies, andincreased the k-point mesh size up to (11 × 11 × 1) to reevaluatecorresponding electronic structures. The lattice constant for bulk Pt ispredicted to be 3.98 Å, close to the experimental value of 3.92 Å.
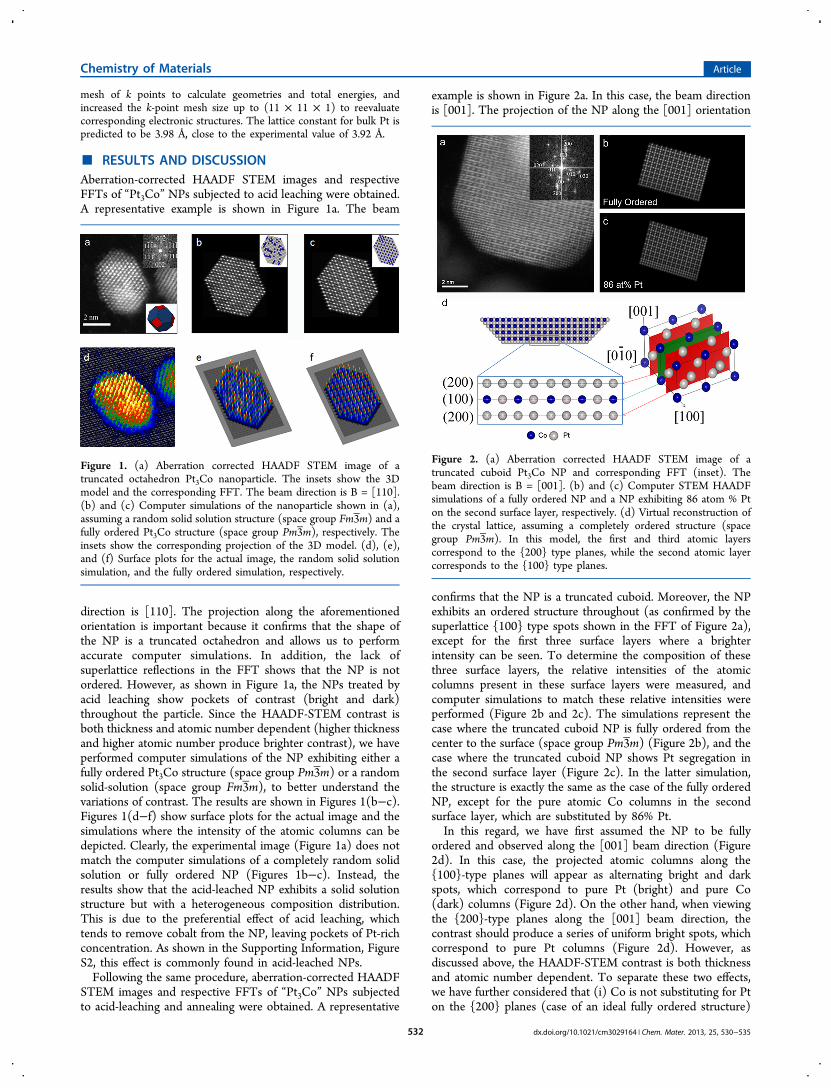
■ RESULTS AND DISCUSSIONAberration-corrected HAADF STEM images and respectiveFFTs of “Pt3Co” NPs subjected to acid leaching were obtained.A representative example is shown in Figure 1a. The beam
direction is [110]. The projection along the aforementionedorientation is important because it confirms that the shape ofthe NP is a truncated octahedron and allows us to performaccurate computer simulations. In addition, the lack ofsuperlattice reflections in the FFT shows that the NP is notordered. However, as shown in Figure 1a, the NPs treated byacid leaching show pockets of contrast (bright and dark)throughout the particle. Since the HAADF-STEM contrast isboth thickness and atomic number dependent (higher thicknessand higher atomic number produce brighter contrast), we haveperformed computer simulations of the NP exhibiting either afully ordered Pt3Co structure (space group Pm3̅m) or a randomsolid-solution (space group Fm3 ̅m), to better understand thevariations of contrast. The results are shown in Figures 1(b−c).Figures 1(d−f) show surface plots for the actual image and thesimulations where the intensity of the atomic columns can bedepicted. Clearly, the experimental image (Figure 1a) does notmatch the computer simulations of a completely random solidsolution or fully ordered NP (Figures 1b−c). Instead, theresults show that the acid-leached NP exhibits a solid solutionstructure but with a heterogeneous composition distribution.This is due to the preferential effect of acid leaching, whichtends to remove cobalt from the NP, leaving pockets of Pt-richconcentration. As shown in the Supporting Information, FigureS2, this effect is commonly found in acid-leached NPs.Following the same procedure, aberration-corrected HAADF
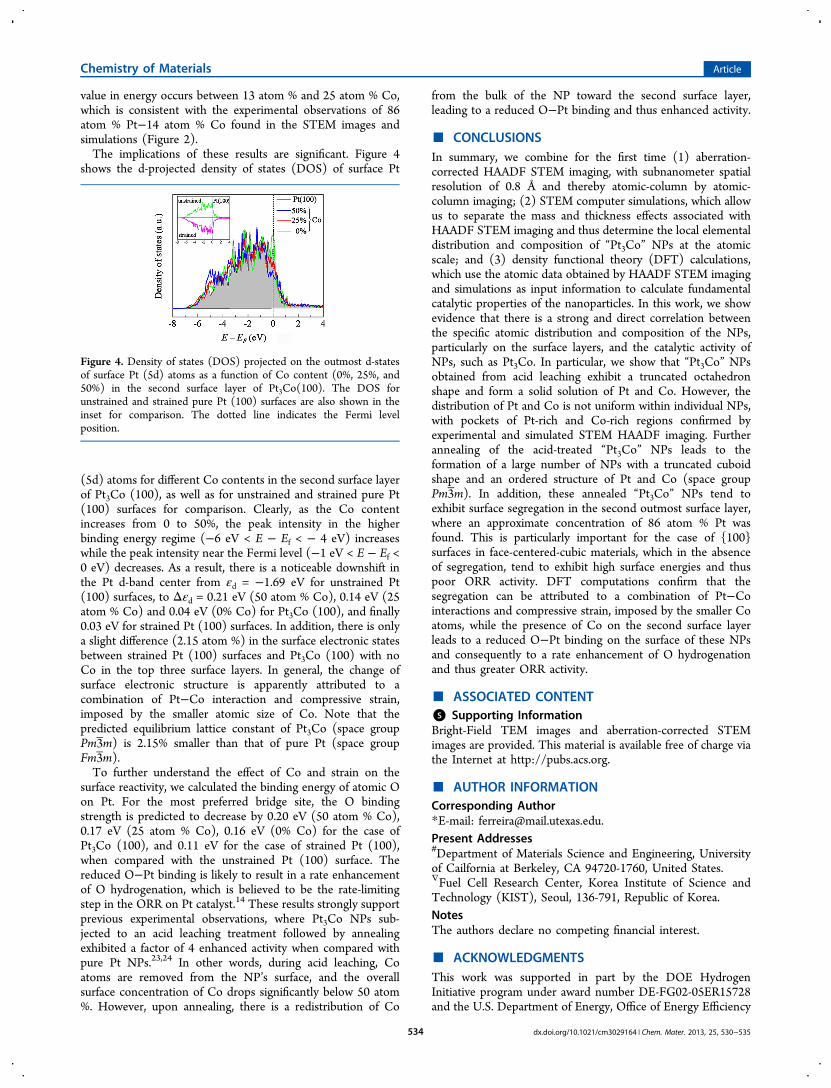
STEM images and respective FFTs of “Pt3Co” NPs subjectedto acid-leaching and annealing were obtained. A representative
example is shown in Figure 2a. In this case, the beam directionis [001]. The projection of the NP along the [001] orientation
confirms that the NP is a truncated cuboid. Moreover, the NPexhibits an ordered structure throughout (as confirmed by thesuperlattice {100} type spots shown in the FFT of Figure 2a),except for the first three surface layers where a brighterintensity can be seen. To determine the composition of thesethree surface layers, the relative intensities of the atomiccolumns present in these surface layers were measured, andcomputer simulations to match these relative intensities wereperformed (Figure 2b and 2c). The simulations represent thecase where the truncated cuboid NP is fully ordered from thecenter to the surface (space group Pm3̅m) (Figure 2b), and thecase where the truncated cuboid NP shows Pt segregation inthe second surface layer (Figure 2c). In the latter simulation,the structure is exactly the same as the case of the fully orderedNP, except for the pure atomic Co columns in the secondsurface layer, which are substituted by 86% Pt.In this regard, we have first assumed the NP to be fully
ordered and observed along the [001] beam direction (Figure2d). In this case, the projected atomic columns along the{100}-type planes will appear as alternating bright and darkspots, which correspond to pure Pt (bright) and pure Co(dark) columns (Figure 2d). On the other hand, when viewingthe {200}-type planes along the [001] beam direction, thecontrast should produce a series of uniform bright spots, whichcorrespond to pure Pt columns (Figure 2d). However, asdiscussed above, the HAADF-STEM contrast is both thicknessand atomic number dependent. To separate these two effects,we have further considered that (i) Co is not substituting for Pton the {200} planes (case of an ideal fully ordered structure)
Figure 1. (a) Aberration corrected HAADF STEM image of atruncated octahedron Pt3Co nanoparticle. The insets show the 3Dmodel and the corresponding FFT. The beam direction is B = [110].(b) and (c) Computer simulations of the nanoparticle shown in (a),assuming a random solid solution structure (space group Fm3 ̅m) and afully ordered Pt3Co structure (space group Pm3 ̅m), respectively. Theinsets show the corresponding projection of the 3D model. (d), (e),and (f) Surface plots for the actual image, the random solid solutionsimulation, and the fully ordered simulation, respectively.
Figure 2. (a) Aberration corrected HAADF STEM image of atruncated cuboid Pt3Co NP and corresponding FFT (inset). Thebeam direction is B = [001]. (b) and (c) Computer STEM HAADFsimulations of a fully ordered NP and a NP exhibiting 86 atom % Pton the second surface layer, respectively. (d) Virtual reconstruction ofthe crystal lattice, assuming a completely ordered structure (spacegroup Pm3 ̅m). In this model, the first and third atomic layerscorrespond to the {200} type planes, while the second atomic layercorresponds to the {100} type planes.
Chemistry of Materials Article
dx.doi.org/10.1021/cm3029164 | Chem. Mater. 2013, 25, 530−535532

and (ii) for sufficiently thin crystals, the HAADF STEMcontrast is linearly dependent on thickness.32,33 On this basis,the variation in intensity of the Pt columns on the {200} planesprojected along the [001] direction should be only dependenton thickness when measured along the [100] direction. Thisprocedure allows us to determine the exact geometry of the NPand thus, deconvolute the thickness and atomic number effects.In other words, once we determine the exact shape of thenanoparticle, the simulated intensity of the atomic columnsprojected along the [001] direction on the {100} and {200}planes, and measured along the [010] direction, should reflectvariations in chemical composition only.For the case of a fully ordered structure, the computer
simulated intensity ratio between adjacent atomic columnsprojected along the [001] direction on the {100} planes andmeasured along the [010] direction is 2.4. This corresponds tothe ratio between columns of pure Pt and the adjacent columnsof pure Co (100 atom % Pt÷100 atom % Co) (Figure 2d). Onthe other hand, for the {200} planes the intensity ratio betweenadjacent columns of pure Pt is obviously 1 (100 atom %Pt÷100 atom % Pt). The simulation results for the fully orderedcase are shown in Figure 2b. When compared with the intensityratios of the actual HAADF STEM image (Figure 2a) along thesame [010] direction and for the same {100} and {200} planes,the computer simulations for a fully ordered NP match well theSTEM image, except for the second outmost surface layer(Figure 2b). In fact, the actual STEM image shows acontinuous brighter contrast along the second outmost layer(Figure 2a), which reveals a high Pt concentration in this layer.To quantify the amount of Pt present in the second outmost
layer, an intensity profile of the atomic columns projected alongthe [001] direction on the {100} plane and corresponding tothe second outmost surface layer was measured along the [010]direction on the actual STEM image. In this case, the averagemeasured intensity ratio between adjacent columns was foundto be 1.2. This ratio is clearly smaller than the 2.4 ratio foundfor a fully ordered alloy, where a composition of 100 atom %Pt÷100 atom % Co exists between columns of pure Pt and theadjacent columns of pure Co. Thus, the 1.2 ratio confirms thehigh concentration of Pt on the second outmost layer of theNP, where Pt is substituting for Co along the previously pureCo columns. At this point, several computer simulations wereperformed, assuming different amounts of Pt and Co alongadjacent columns, to match the experimentally observedcontrast shown by the second outmost surface layer of theNP. Upon several iterations, the best match was found for anapproximate composition of 86% Pt and 14% Co (Figure 2c).This corresponds to a simulated intensity ratio of 1.2 betweenadjacent atomic columns on the second outmost layer,projected along the [001] direction and measured along the[010] direction; the same value found in the actual HAADFSTEM image. The simulations also match a pure Ptcomposition for the first and third layers. Thus, to a firstapproximation, the annealed “Pt3Co” NP shown in Figure 2ahas a composition of 100% Pt for the first and third surfacelayers, while for the second surface layer an approximatecomposition of 86% Pt and 14% Co was found. Similarexamples can be seen in the Supporting Information, Figure S3.We emphasize that these composition values are approximatenumbers as the contrast of the STEM images depends on theprobe shape, probe size, crystal orientation, thermal scatteringfactor, defocus and aberration coefficients. For the simulations,we have considered the crystal orientation, thermal scattering
factor, defocus and aberration coefficients. However, the probeshape and probe size are not available in the HREM SimulationSuite, and the probe shape is difficult to obtain experimentally.To better understand the near-surface atomic arrangements
of “Pt3Co” NPs during annealing, particularly on the {100}surfaces, DFT calculations were performed. To start, wecalculated the variation in total energy of the Pt−Co system bysubstituting Pt by 25 atom % Co in one of the first three layers.As shown in Figure 3a, Co atoms prefer to remain in the
second surface layer, rather than in the first or third surfacelayers, where the segregation of Co is unfavorable, asdemonstrated by the increase in the overall energy of thesystem in these layers. With respect to a fully ordered structure,this suggests that the first and third layers prefer to remain100% Pt, whereas the second layer will experience some sort ofcomposition mix among Pt and Co. To determine the Pt/Coratio on the second surface layer, we have calculated thevariation in the formation energy Ef of Pt−Co alloying with Cocontent (Figure 3b). The formation energy is given as Ef =[EPtCo − EPt +NCo(EPt‑bulk − ECo‑bulk)]/NCo, where EPtCo and EPtrefer to the total energies of Pt3Co (100) with and without Coin the second surface layer, respectively, EPt‑bulk and ECo‑bulkrepresent bulk Pt and bulk Co energies per atom, respectively,and NCo is the number of Co atoms in the second surface layer.The negative formation energies shown in Figure 3b indicatethat Pt−Co alloying is energetically favorable in the secondsurface layer. A more detailed observation of Figure 3b showsthat the formation energy drops steeply and then slowlyincreases as the Co content increases. According to the cubicspline interpolation based on the calculated data, the minimum
Figure 3. (a) Variation in total energy of the Pt−Co system as afunction of composition on the top three surface layers. SL1, SL2, andSL3 represents the cases where the first, second, and third surfacelayers are composed of 75 atom % Pt: 25 atom % Co, respectively. Foreach case, the other two surface layers are 100% Pt. The cyan andwhite spheres indicate Co and Pt atoms in the top three surface layers,while the blue and gray spheres indicate Co and Pt atoms in the fourthand deeper layers. (b) Variation in the formation energy (per Co) ofPt−Co alloying as a function of Co composition on the second surfacelayer of Pt3Co (100). In the insets, the blue and light gray spheresindicate Co and Pt atoms, respectively, in the second surface layer.
Chemistry of Materials Article
dx.doi.org/10.1021/cm3029164 | Chem. Mater. 2013, 25, 530−535533
value in energy occurs between 13 atom % and 25 atom % Co,which is consistent with the experimental observations of 86atom % Pt−14 atom % Co found in the STEM images andsimulations (Figure 2).The implications of these results are significant. Figure 4
shows the d-projected density of states (DOS) of surface Pt
(5d) atoms for different Co contents in the second surface layerof Pt3Co (100), as well as for unstrained and strained pure Pt(100) surfaces for comparison. Clearly, as the Co contentincreases from 0 to 50%, the peak intensity in the higherbinding energy regime (−6 eV < E − Ef < − 4 eV) increaseswhile the peak intensity near the Fermi level (−1 eV < E − Ef <0 eV) decreases. As a result, there is a noticeable downshift inthe Pt d-band center from εd = −1.69 eV for unstrained Pt(100) surfaces, to Δεd = 0.21 eV (50 atom % Co), 0.14 eV (25atom % Co) and 0.04 eV (0% Co) for Pt3Co (100), and finally0.03 eV for strained Pt (100) surfaces. In addition, there is onlya slight difference (2.15 atom %) in the surface electronic statesbetween strained Pt (100) surfaces and Pt3Co (100) with noCo in the top three surface layers. In general, the change ofsurface electronic structure is apparently attributed to acombination of Pt−Co interaction and compressive strain,imposed by the smaller atomic size of Co. Note that thepredicted equilibrium lattice constant of Pt3Co (space groupPm3̅m) is 2.15% smaller than that of pure Pt (space groupFm3̅m).To further understand the effect of Co and strain on the
surface reactivity, we calculated the binding energy of atomic Oon Pt. For the most preferred bridge site, the O bindingstrength is predicted to decrease by 0.20 eV (50 atom % Co),0.17 eV (25 atom % Co), 0.16 eV (0% Co) for the case ofPt3Co (100), and 0.11 eV for the case of strained Pt (100),when compared with the unstrained Pt (100) surface. Thereduced O−Pt binding is likely to result in a rate enhancementof O hydrogenation, which is believed to be the rate-limitingstep in the ORR on Pt catalyst.14 These results strongly supportprevious experimental observations, where Pt3Co NPs sub-jected to an acid leaching treatment followed by annealingexhibited a factor of 4 enhanced activity when compared withpure Pt NPs.23,24 In other words, during acid leaching, Coatoms are removed from the NP’s surface, and the overallsurface concentration of Co drops significantly below 50 atom%. However, upon annealing, there is a redistribution of Co
from the bulk of the NP toward the second surface layer,leading to a reduced O−Pt binding and thus enhanced activity.
■ CONCLUSIONSIn summary, we combine for the first time (1) aberration-corrected HAADF STEM imaging, with subnanometer spatialresolution of 0.8 Å and thereby atomic-column by atomic-column imaging; (2) STEM computer simulations, which allowus to separate the mass and thickness effects associated withHAADF STEM imaging and thus determine the local elementaldistribution and composition of “Pt3Co” NPs at the atomicscale; and (3) density functional theory (DFT) calculations,which use the atomic data obtained by HAADF STEM imagingand simulations as input information to calculate fundamentalcatalytic properties of the nanoparticles. In this work, we showevidence that there is a strong and direct correlation betweenthe specific atomic distribution and composition of the NPs,particularly on the surface layers, and the catalytic activity ofNPs, such as Pt3Co. In particular, we show that “Pt3Co” NPsobtained from acid leaching exhibit a truncated octahedronshape and form a solid solution of Pt and Co. However, thedistribution of Pt and Co is not uniform within individual NPs,with pockets of Pt-rich and Co-rich regions confirmed byexperimental and simulated STEM HAADF imaging. Furtherannealing of the acid-treated “Pt3Co” NPs leads to theformation of a large number of NPs with a truncated cuboidshape and an ordered structure of Pt and Co (space groupPm3 ̅m). In addition, these annealed “Pt3Co” NPs tend toexhibit surface segregation in the second outmost surface layer,where an approximate concentration of 86 atom % Pt wasfound. This is particularly important for the case of {100}surfaces in face-centered-cubic materials, which in the absenceof segregation, tend to exhibit high surface energies and thuspoor ORR activity. DFT computations confirm that thesegregation can be attributed to a combination of Pt−Cointeractions and compressive strain, imposed by the smaller Coatoms, while the presence of Co on the second surface layerleads to a reduced O−Pt binding on the surface of these NPsand consequently to a rate enhancement of O hydrogenationand thus greater ORR activity.
■ ASSOCIATED CONTENT*S Supporting InformationBright-Field TEM images and aberration-corrected STEMimages are provided. This material is available free of charge viathe Internet at http://pubs.acs.org.
■ AUTHOR INFORMATIONCorresponding Author*E-mail: [email protected] Addresses#Department of Materials Science and Engineering, Universityof Cailfornia at Berkeley, CA 94720-1760, United States.∇Fuel Cell Research Center, Korea Institute of Science andTechnology (KIST), Seoul, 136-791, Republic of Korea.NotesThe authors declare no competing financial interest.
■ ACKNOWLEDGMENTSThis work was supported in part by the DOE HydrogenInitiative program under award number DE-FG02-05ER15728and the U.S. Department of Energy, Office of Energy Efficiency
Figure 4. Density of states (DOS) projected on the outmost d-statesof surface Pt (5d) atoms as a function of Co content (0%, 25%, and50%) in the second surface layer of Pt3Co(100). The DOS forunstrained and strained pure Pt (100) surfaces are also shown in theinset for comparison. The dotted line indicates the Fermi levelposition.
Chemistry of Materials Article
dx.doi.org/10.1021/cm3029164 | Chem. Mater. 2013, 25, 530−535534
and Renewable Energy, Fuel Cell Technologies Programthrough Argonne National Laboratory under contract DE-AC02-06CH11357. This research at the Oak Ridge NationalLaboratory’s High Temperature Materials Laboratory wassponsored by the U.S. Department of Energy, Office of EnergyEfficiency and Renewable Energy, Vehicle TechnologiesProgram. G.S.H also acknowledges partial support under R.A.Welch Foundation Grant F-1535.
■ REFERENCES(1) Steele, B.; Heinzel, A. Nature 2001, 414, 345−352.(2) Nogami, M.; Miyamura, K.; Abe, Y. J. Electrochem. Soc. 1997, 144(6), 2175.(3) Gasteiger, H. A.; Kocha, S. S.; Sompalli, B.; Wagner, F. T. Appl.Catal., B 2005, 56, 9.(4) Gauthier, Y. Surf. Rev. Lett. 1996, 3, 1663.(5) Ruban, A. V.; Skriver, H. L.; Norskov, J. K. Phys. Rev. B 1999, 59,15990.(6) Stamenkovic, V. R.; Mun, B. S.; Mayrhofer, K. J. J.; Ross, P. N.;Markovic, N. M. J. Am. Chem. Soc. 2006, 128, 8813.(7) Stamenkovic, V. R.; Fowler, B.; Mun, B. S.; Wang, G. F.; Ross, P.N.; Lucas, C. A.; Markovic, N. M. Science 2007, 315, 493.(8) Toda, T.; Igarashi, H.; Uchida, H.; Watanabe, M. J. Electrochem.Soc. 1999, 146, 3750.(9) Stamenkovic, V. R.; Mun, B. S.; Arenz, M.; Mayrhofer, K. J. J.;Lucas, C. A.; Wang, G. F.; Ross, P. N.; Markovic, N. M. Nat. Mater.2007, 6, 241.(10) Stamenkovic, V.; Schmidt, T. J.; Ross, P. N.; Markovic, N. M. J.Electroanal. Chem. 2003, 554, 191.(11) Paulus, U. A.; Wokaun, A.; Scherer, G. G.; Schmidt, T. J.;Stamenkovic, V.; Radmilovic, V.; Markovic, N. M.; Ross, P. N. J.Phys.Chem. B 2002, 106, 4181.(12) Stamenkovic, V.; Schmidt, T. J.; Ross, P. N.; Markovic, N. M. J.Phys. Chem. B 2002, 106, 11970.(13) Norskov, J. K.; Rossmeisl, J.; Logadottir, A.; Lindqvist, L.;Kitchin, J. R.; Bligaard, T.; Jonsson, H. J. Phys. Chem. B 2004, 108,17886.(14) Stamenkovic, V.; Mun, B. S.; Mayrhofer, K. J. J.; Ross, P. N.;Markovic, N. M.; Rossmeisl, J.; Greeley, J.; Norskov, J. K. Angew.Chem., Int. Ed. 2006, 45, 2897.(15) Xu, Y.; Ruban, A. V.; Mavrikakis, M. J. Am. Chem. Soc. 2004,126, 4717.(16) Greeley, J.; Norskov, J. K. Electrochim. Acta 2007, 52, 5829.(17) Paulus, U. A.; Wokaun, A.; Scherer, G. G.; Schmidt, T. J.;Stamenkovic, V.; Radmilovic, V.; Markovic, N. M.; Ross, P. N. J. Phys.Chem. B 2002, 106, 4181−4191.(18) Watanabe, M.; Tsurumi, K.; Mizukami, T.; Nakamura, T.;Stonehart, P. J. Electrochem. Soc. 1994, 141, 2659−2668.(19) Mukerjee, S.; Srinivasan, S. J. Electroanal. Chem. 1993, 357,201−224.(20) Mukerjee, S.; Srinivasan, S.; Soriaga, M. P.; Mcbreen, J. J. Phys.Chem. 1995, 99, 4577−4589.(21) Koh, S.; Strasser, P. J. Am. Chem. Soc. 2007, 129, 12624.(22) Mukerjee, S.; Srinivasan, S.; Soriaga, M. P.; Mcbreen, J. J.Electrochem. Soc. 1995, 142, 1409−1422.(23) Chen, S.; Ferreira, P. J.; Sheng, W.; Yabuuchi, N.; Allard, L. F.;Shao-Horn, Y. J. Am. Chem. Soc. 2008, 130, 13818−13819.(24) Chen, S.; Sheng, W.; Yabuuchi, N.; Ferreira, P. J.; Allard, L. F.;Shao-Horn, Y. J. Phys. Chem. C 2009, 113, 1109−1125.(25) Lai, F.; Su, W.; Sarma, L.; Liu, D.; Hsieh, C.; Lee, J.; Hwang, B.Chem.Eur. J. 2010, 16, 4602−4611.(26) Oezaslan, M.; Heggen, M.; Strasser, P. J. Am. Chem. Soc. 2011,134, 514−524.(27) Heggen, M.; Oezaslan, M.; Houben, L.; Strasser, P. J. Phys.Chem. C 2012, 116, 19073−19083.(28) Xin, H.; Mundy, J.; Liu, Z.; Cabezas, R.; Hovden, R.;Kourkoutis, L.; Zhang, J.; Subramanian, N.; Makharia, R.; Wagner,F.; Muller, D. A. Nano Lett. 2012, 12 (1), 490−497.
(29) Schlapka, A.; Lischka, M.; Groß, A.; Kas̈berger, U.; Jakob, P.Phys. Rev. Lett. 2003, 91, 016101.(30) Momma, K.; Izumi, F. J. Appl. Crystallogr. 2008, 41, 653−658.(31) Ishizuka, K. Ultramicroscopy 2001, 90, 71−83.(32) Weickenmeier, A.; Kohl, A. Acta Crystallogr. 1991, A47, 590−603.(33) Dinges, C.; Berger, A.; Rose, H. Ultramicroscopy 1995, 60, 49−70.(34) Dinges, C.; Rose, H. Scanning Microsc. 1997, 11, 277−286.(35) Perdew, J. P.; Wang, Y. Phys. Rev. B 1992, 45, 13244−13249.(36) Kresse, G.; Furthmuller, J. VASP the guide; Vienna University ofTechnology: Vienna, Austria, 2001.(37) Blochl, P. E. Phys. Rev. B 1994, 50, 17953−17979.
Chemistry of Materials Article
dx.doi.org/10.1021/cm3029164 | Chem. Mater. 2013, 25, 530−535535


![Advances in nanocatalysts design for biofuels production · 2018-03-01 · Advances in nanocatalysts design for biofuels production Alessio Zuliani[a], Francisco Ivars[b]*, Rafael](https://static.fdocuments.in/doc/165x107/5ec6c6e32e26f1010c6d8ff2/advances-in-nanocatalysts-design-for-biofuels-production-2018-03-01-advances-in.jpg)


