Atomic number - Professor Welday's Weebly Website -...
90
1
Transcript of Atomic number - Professor Welday's Weebly Website -...

1
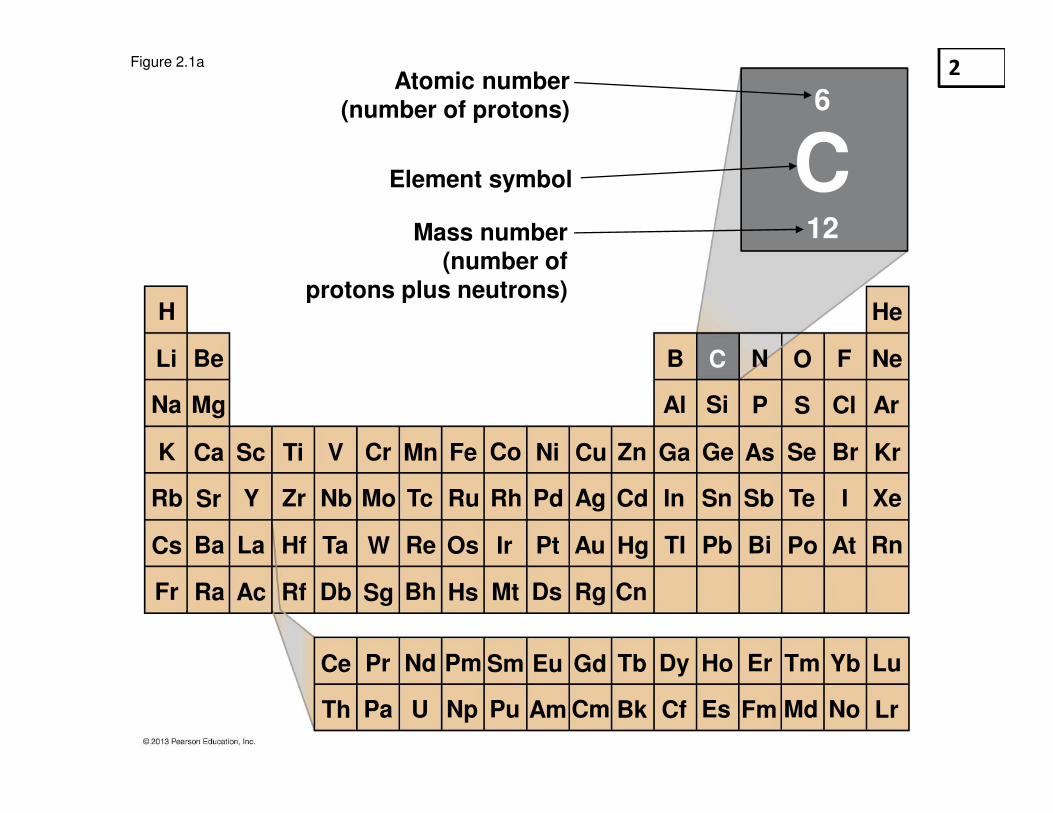
Figure 2.1a
Atomic number(number of protons)
Mass number(number of
protons plus neutrons)
Element symbol
12
6
C
He
Ne
Se Br
Cl
F
Ar
Kr
Xe
ONCB
SPSiAl
I
Ge AsGa
TeSbSnIn
MnCr
Po At RnPb BiTI
CoFeV CuNi Zn
Tm Yb LuHo ErDy
BeLi
MgNa
K ScCa Ti
MoNb RuTc PdRh AgYSrRb Zr
H
Cd
LaBa TaHf OsRe IrW AuPt HgCs
BhSg MtHs RgDs CnFr AcRa Rf Db
Md No LrEs FmCfAm Cm BkNp PuU
Eu Gd TbPm SmNd
Pa
Pr
Th
Ce
2

Table 2.1 3

Figure 2.8
Electron configuration Structural formula
Hydrogen gas (H2)
Space-filling model
Oxygen gas (O2)
Methane (CH4)
H H
H
O O
H
H HC
Ball-and-stick model
4

Figure 2.7-1
Na
Sodium atom
Cl
Chlorine atom
Na Cl
Figure 2.7-2
Completeouter shells
Sodium chloride (NaCl)
Cl–
Chloride ion
Na++++ Cl–
Na
Sodium atom
Cl
Chlorine atom
Na Cl
Na++++
Sodium ion
5

– The polarity of water results in weak electrical
attractions between neighboring water molecules.
• These weak attractions are called hydrogen bonds.
Hydrogen Bonds
© 2013 Pearson Education, Inc.
O
H H(slightly ++++) (slightly ++++)
(slightly −)
6

Figure 2.9
Hydrogen bond
Slightlypositivecharge
Slightlynegativecharge
7
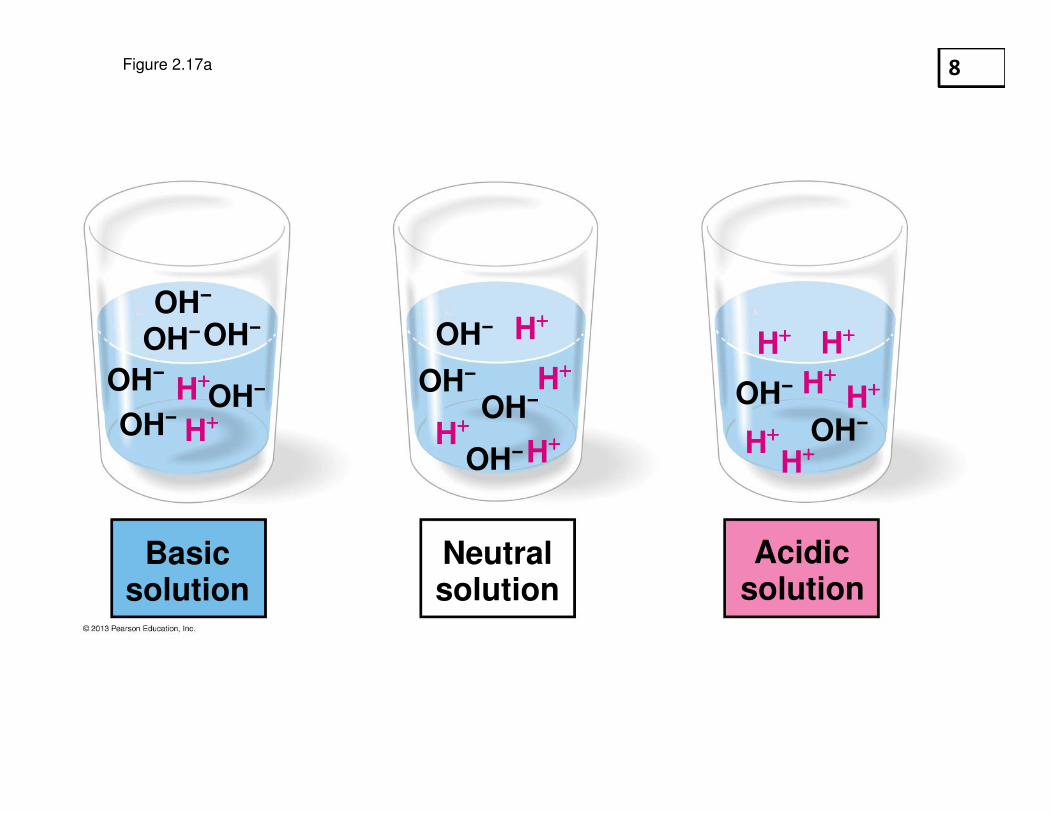
Figure 2.17a
OH−
OH−
OH−
OH−
OH−
OH−H++++
H++++
Basic solution
OH−
OH−
OH−OH−
H++++
H++++
H++++
H++++
OH−
OH−
H++++
H++++
H++++
H++++
H++++
H++++
Neutral solution
Acidic solution
8

Figure 3.UN02
Large biologicalmolecules
Functions Components Examples
Carbohydrates
Lipids
Proteins
Nucleic acids
Dietary energy;storage; plantstructure
Long-termenergy storage(fats);hormones(steroids)
Enzymes,structure,storage, contraction,transport, etc.
Informationstorage
Monosaccharides:glucose, fructose;Disaccharides:lactose, sucrose;Polysaccharides:starch, cellulose
Fats (triglycerides);steroids(testosterone,estrogen)
Lactase(an enzyme);hemoglobin(a transport protein)
DNA, RNA
Monosaccharide
Components ofa triglyceride
Amino acid
Nucleotide
Sidegroup
T
9

Figure 3.16Aminogroup
Carboxylgroup
Sidegroup
Hydrophobicside group
Hydrophilicside group
The general structure of an amino acid
Leucine Serine
10

Figure 3.17-2
Dehydration reaction
Carboxyl Amino
Peptide bond
H2O
OH H
11
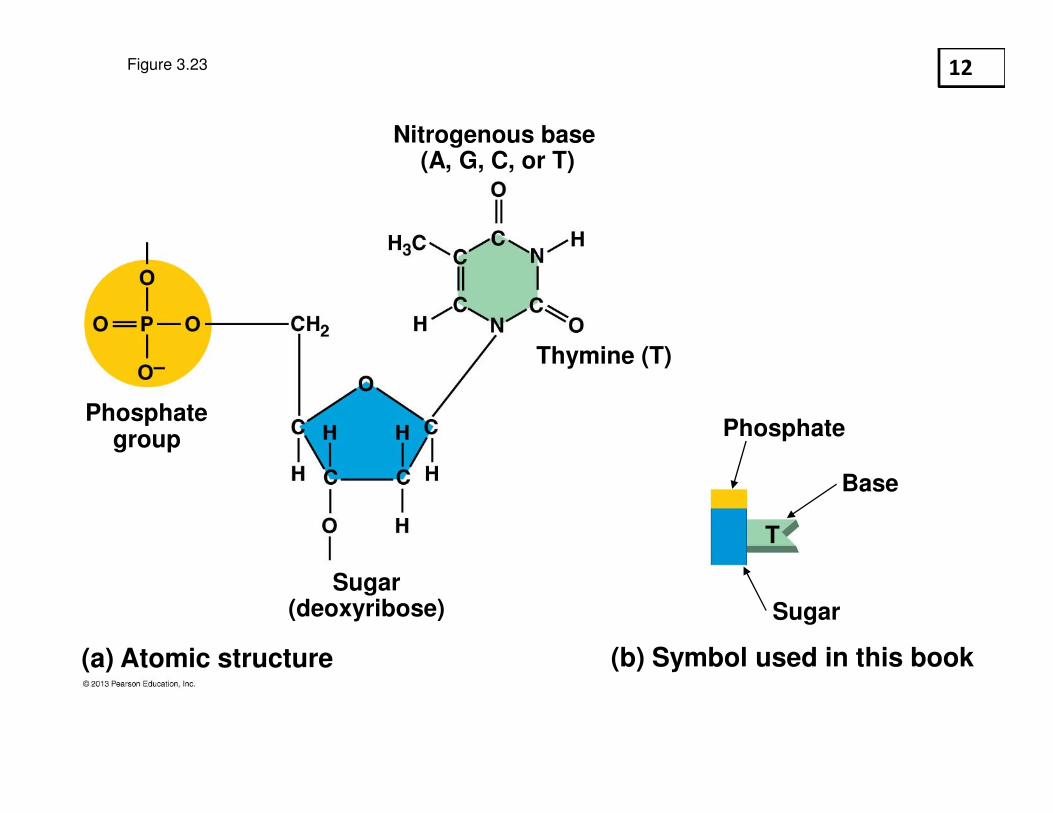
Figure 3.23
Nitrogenous base(A, G, C, or T)
Thymine (T)
Phosphategroup
Sugar(deoxyribose)
(a) Atomic structure (b) Symbol used in this book
Phosphate
Base
Sugar
T
12
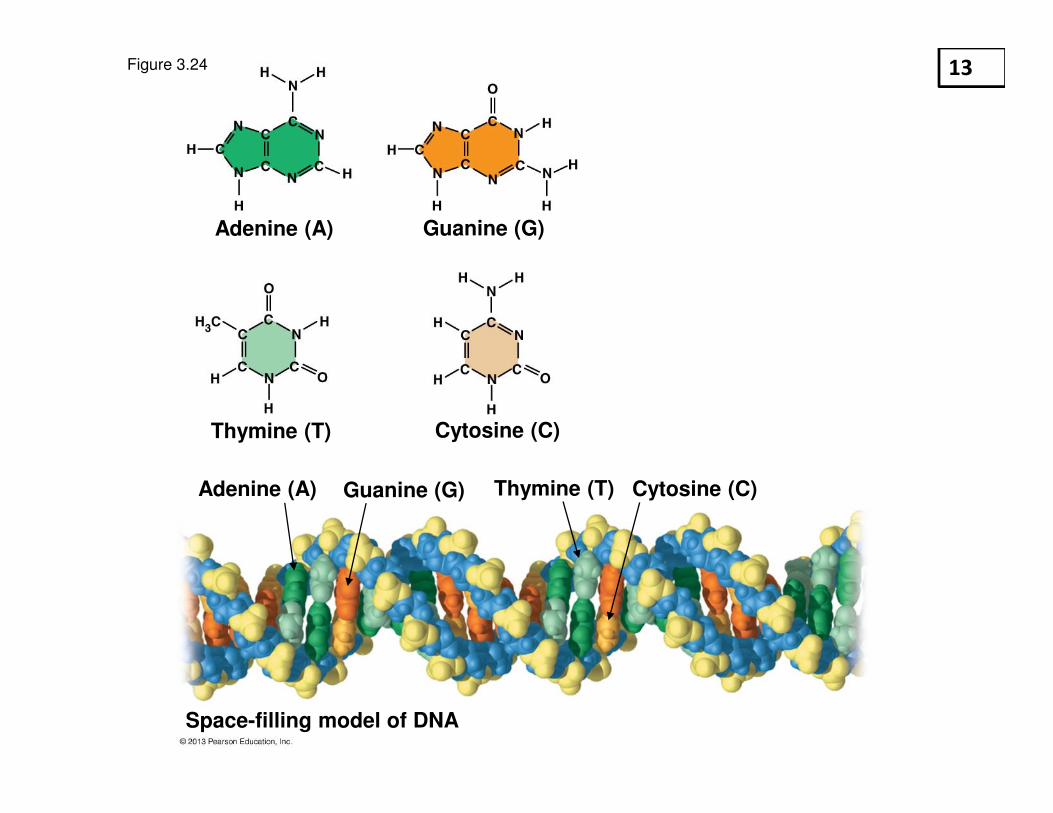
Figure 3.24
Adenine (A) Guanine (G)
Thymine (T) Cytosine (C)
Adenine (A) Guanine (G) Thymine (T) Cytosine (C)
Space-filling model of DNA
13

Figure 3.25
Sugar-phosphatebackbone
NucleotideBasepair
Hydrogenbond
Bases
(a) DNA strand(polynucleotide)
(b) Double helix(two polynucleotide strands)
T
G
C
T
G
A
T
G
C
A
C
T
A
A
A
T
A T
AT
G
14

Figure 4.12-3
Synthesis of
mRNA in the
nucleus
Nucleus
DNA
mRNA
Cytoplasm
mRNAMovement of
mRNA into
cytoplasm via
nuclear pore
Ribosome
Protein
Synthesis of
protein in the
cytoplasm
1
2
3
15

Figure 4.UN13
Light energy
PHOTOSYNTHESIS
Chloroplast
Mitochondrion
ATPCELLULAR
RESPIRATION
Chemical
energy
(food)
16

© 2013 Pearson Education, Inc.
Animation: Energy Concepts
Right click slide / select “Play”
17

Figure 5.1
Climbing
converts kinetic
energy to
potential energy.
Greatest
potential
energy
Diving converts
potential
energy to
kinetic energy.
Least
potential
energy
18

Figure 5.4
Triphosphate Diphosphate
Adenosine Adenosine
Energy
ATP ADP
P P P P P P
Phosphate
(transferred
to another
molecule)
19
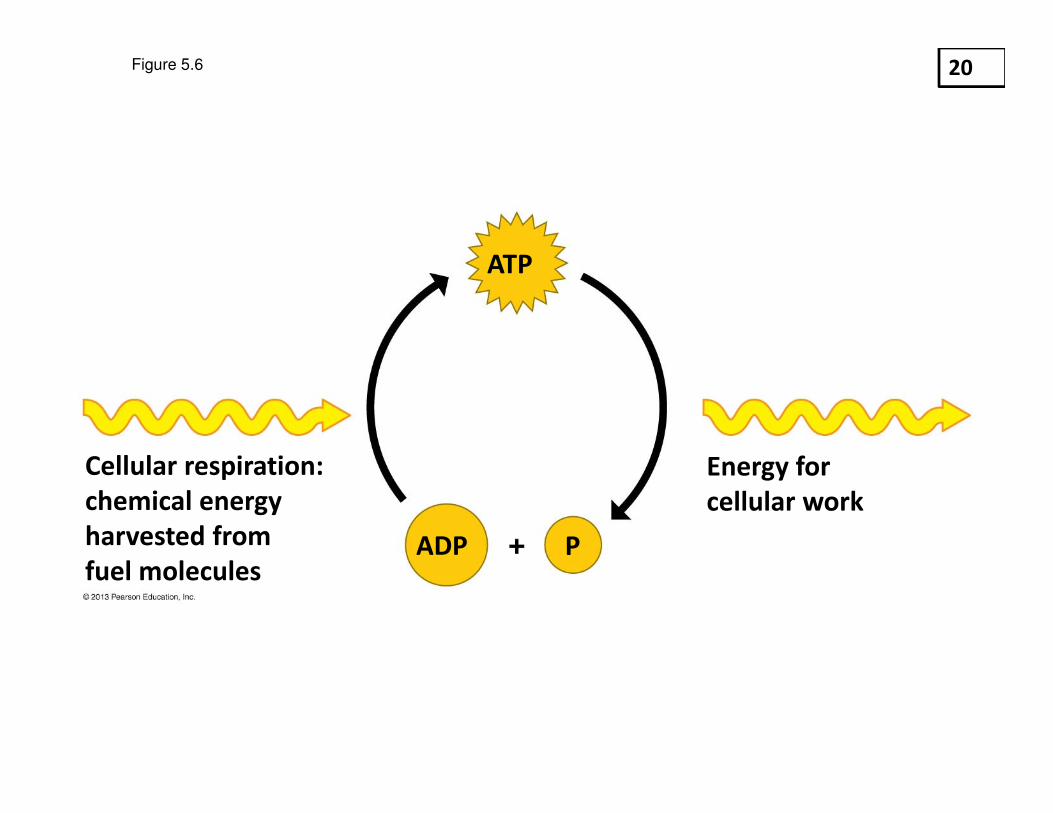
Figure 5.6
Cellular respiration:
chemical energy
harvested from
fuel molecules
Energy for
cellular work
ATP
ADP P
20

Figure 5.UN01
Energy for cellular work
Adenosine
Adenosine
diphosphateEnergy from
organic fuel
Phosphate
(can be transferred
to another molecule)
ATP
cycle
ATP ADP
P P P P P PAdenosine
Adenosine
triphosphate
21

Figure 5.9-1
Active site
Enzyme
(sucrase)
Ready for
substrate
1
22
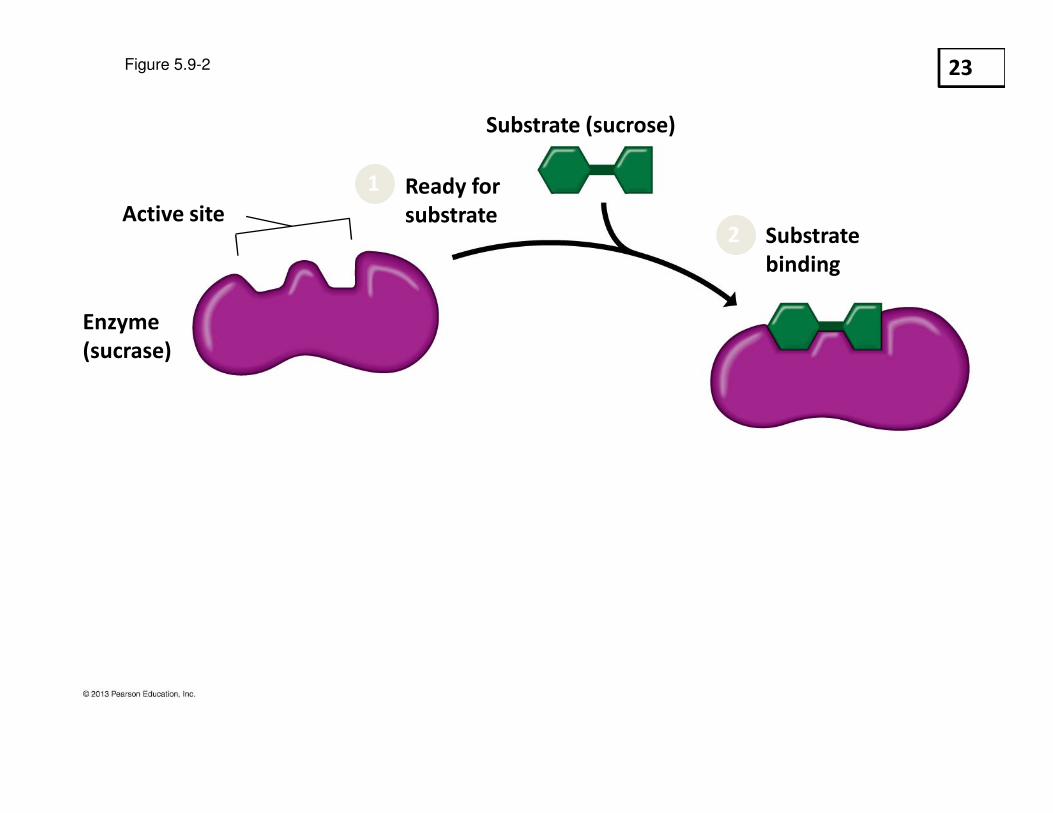
Figure 5.9-2
Active site
Enzyme
(sucrase)
Ready for
substrate
Substrate (sucrose)
Substrate
binding
1
2
23

Figure 5.9-3
Active site
Enzyme
(sucrase)
Ready for
substrate
Substrate (sucrose)
Substrate
binding
Catalysis
H2O
1
2
3
24

Figure 5.9-4
Active site
Enzyme
(sucrase)
Ready for
substrate
Substrate (sucrose)
Substrate
binding
Catalysis
H2O
Fructose
Glucose
Product
released
4
1
2
3
25
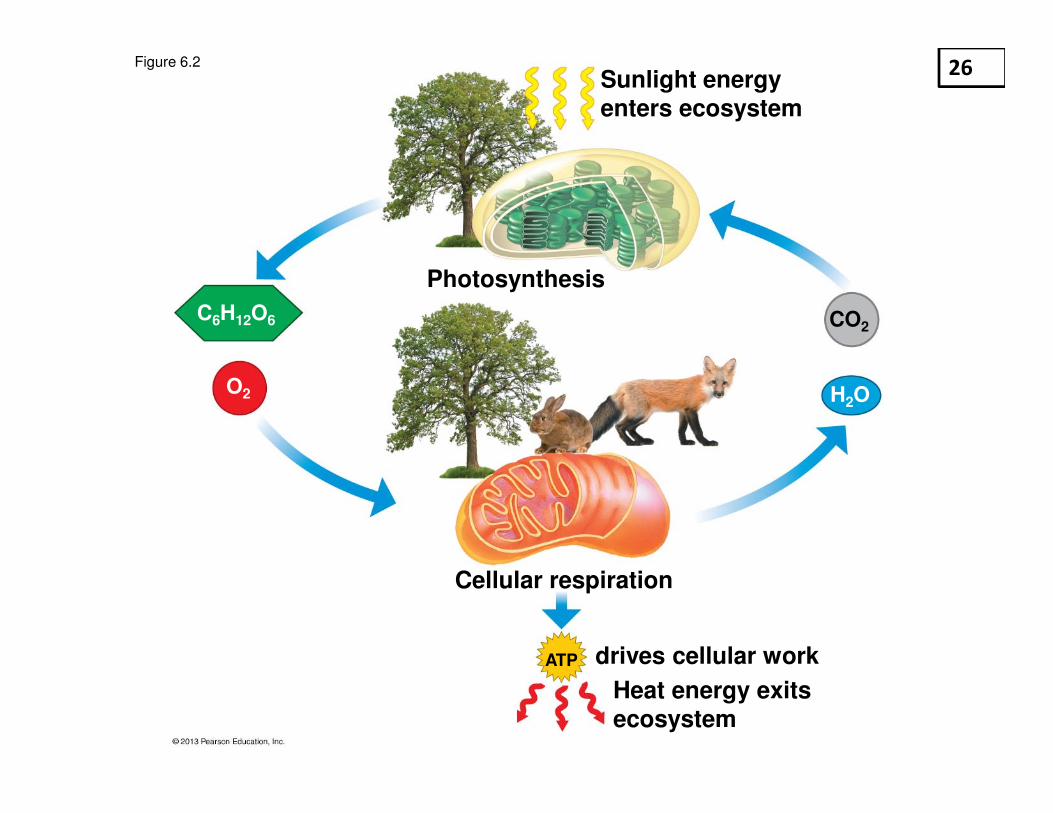
Figure 6.2
Sunlight energyenters ecosystem
Photosynthesis
Cellular respiration
C6H12O6 CO2
drives cellular work
Heat energy exits ecosystem
ATP
O2 H2O
26

Figure 6.UN01
C6H12O6 CO2 ATPO2 H2O
Glucose Oxygen Carbon
dioxide
Water Energy
6 66
27

Figure 6.6
Cytoplasm
Cytoplasm
Cytoplasm
Animal cell Plant cell
Mitochondrion
Mitochondrion
High-energyelectronsvia carriermolecules
CitricAcidCycle
ElectronTransport
Glycolysis
Glucose
2Pyruvic
acid
ATP ATP ATP
28

Figure 6.7a
2 Pyruvic acid
Glucose
INPUT OUTPUT
29

Figure 6.7b-3
Energy investment phase
2 ATP2 ADP
Energy harvest phase
NADH
NADH
NAD++++
NAD++++ 2 ATP
2 ATP
2 ADP
2 ADP
P
PP
P
PP
P
– –
– –
2
2
3
3
1
P
30

Figure 6.9
(from glycolysis)
(to citric acid cycle)
Oxidation of the fuelgenerates NADH
Pyruvic acidloses a carbon
as CO2
Acetic acidattaches tocoenzyme APyruvic acid
Acetic acid Acetyl CoA
Coenzyme A
CoA
CO2
NAD++++ NADH
INPUT OUTPUT2
31
– –
31

Figure 6.10
3 NAD++++
ADP ++++ P
3 NADH
FADH2FAD
Aceticacid
Citricacid
Acceptormolecule
CitricAcidCycle
ATP
2 CO2
INPUT OUTPUT
3
12
4
5
– –
– –
6
32
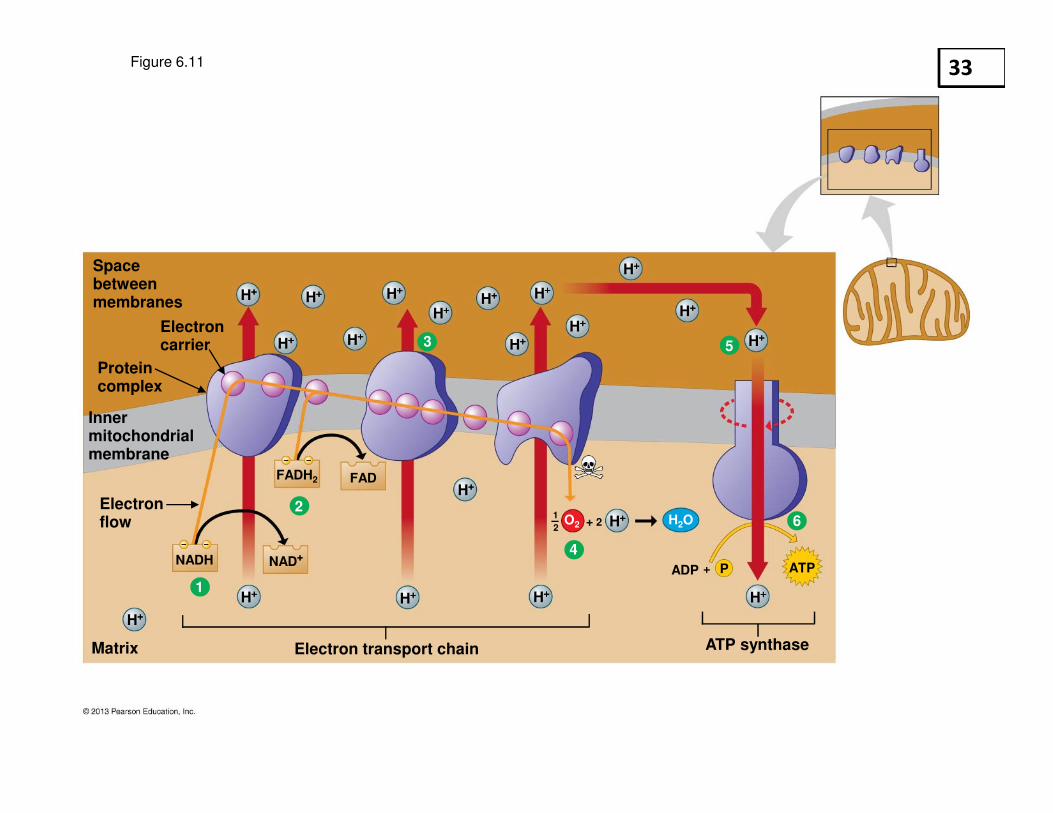
Figure 6.11
Space betweenmembranes
Innermitochondrialmembrane
Electroncarrier
Proteincomplex
Electronflow
Matrix Electron transport chain ATP synthase
NADH NAD++++
FADH2 FAD
ATPADP
H2OO21
2
H++++
2
P
H++++
H++++
H++++
H++++
H++++
H++++
H++++
H++++
H++++
H++++
H++++
H++++
H++++
H++++ H++++
H++++
H++++
H++++
H++++1
2
4
6
53
– –
– –
33

Figure 6.16
Glucose
2 ATP
2 NADH 2 NAD++++
2
++++ 2 P
2 Pyruvicacid
2 Ethyl alcohol
Glycolysis
INPUT OUTPUT
2 CO2 released
2 ADP
H++++++++
2 NADH2 NAD++++
– –– –
34

Figure 6.12a
Citric
AcidCycle
Electron
Transport
Glycolysis
Glucose2
Pyruvic
acid
2ATP
2ATP
2Acetyl
CoA
About28 ATP
by direct
synthesis
by direct
synthesisby ATP
synthase
35
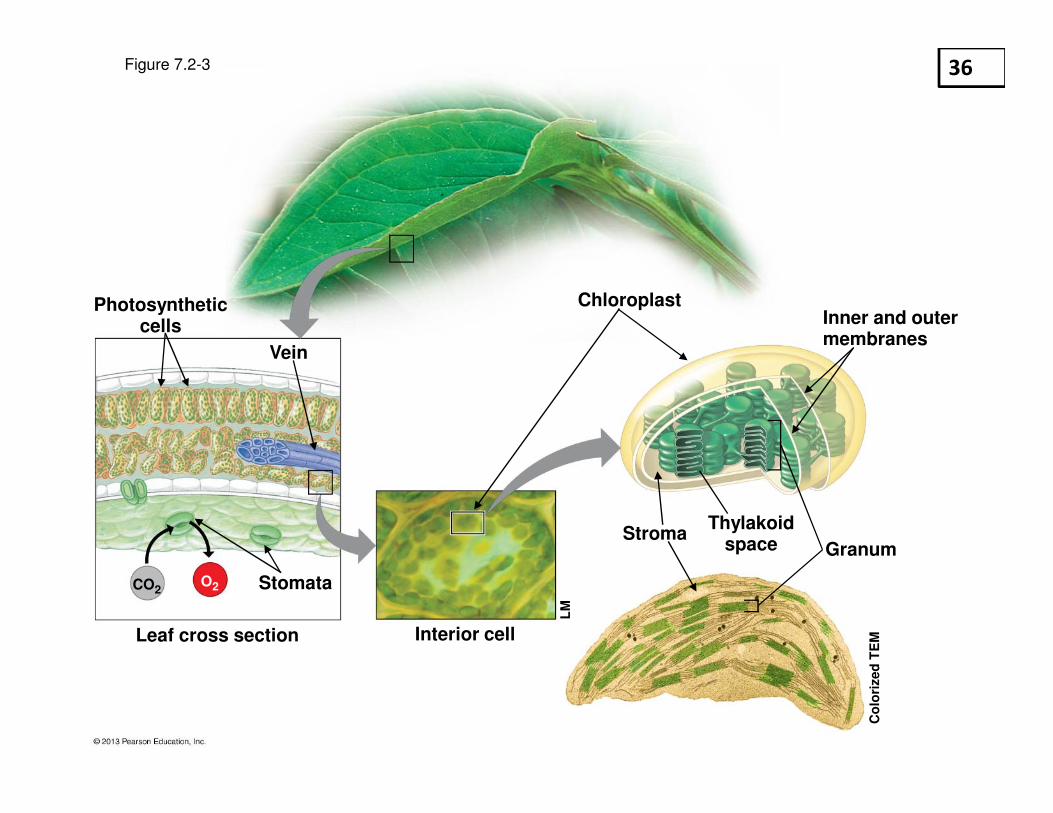
Figure 7.2-3
Interior cell
LM
StromaGranum
Thylakoidspace
ChloroplastInner and outermembranes
Co
lori
zed
TE
MLeaf cross section
Stomata
Vein
CO2O2
Photosyntheticcells
36
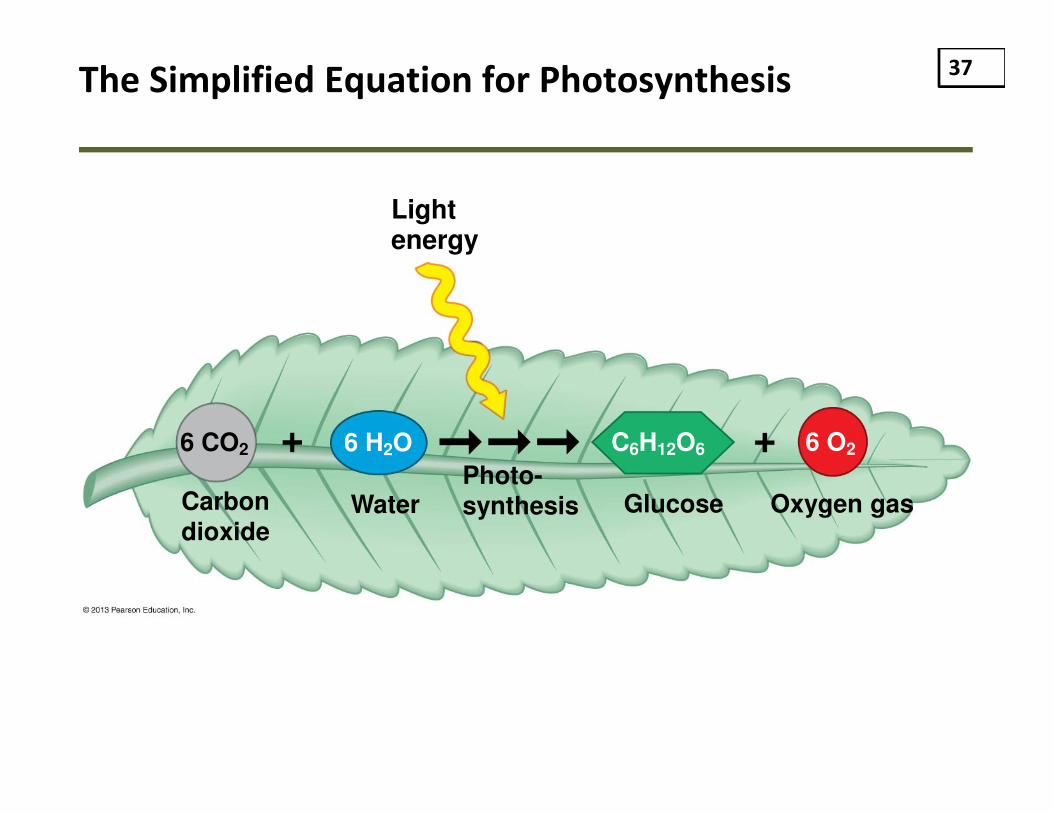
Carbon
dioxide
6 O26 CO2 6 H2O C6H12O6
Water GlucosePhoto-
synthesis Oxygen gas
Light energy
The Simplified Equation for Photosynthesis 37
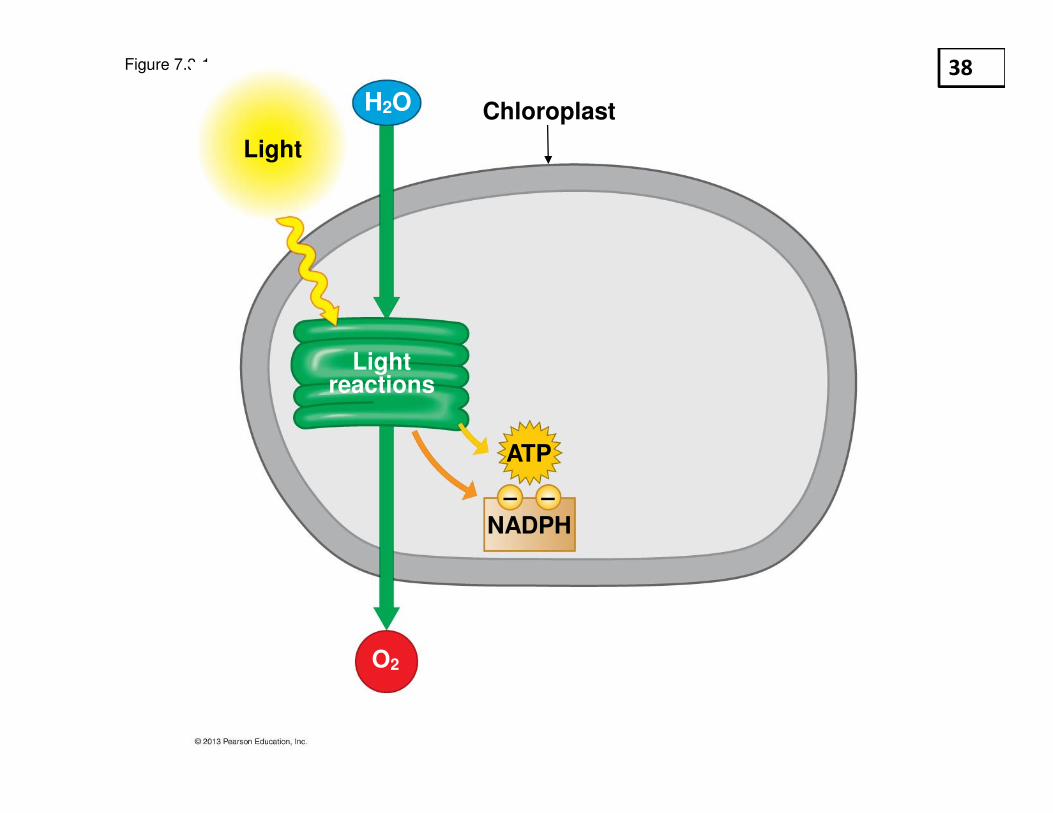
Figure 7.3-1
Light
H2O
O2
Chloroplast
Lightreactions
NADPH
ATP
– –
38

Figure 7.3-2
Calvincycle
CO2
NADP+
ADPP
Sugar
Light
H2O
O2
Chloroplast
Lightreactions
NADPH
ATP
++++
– –
39
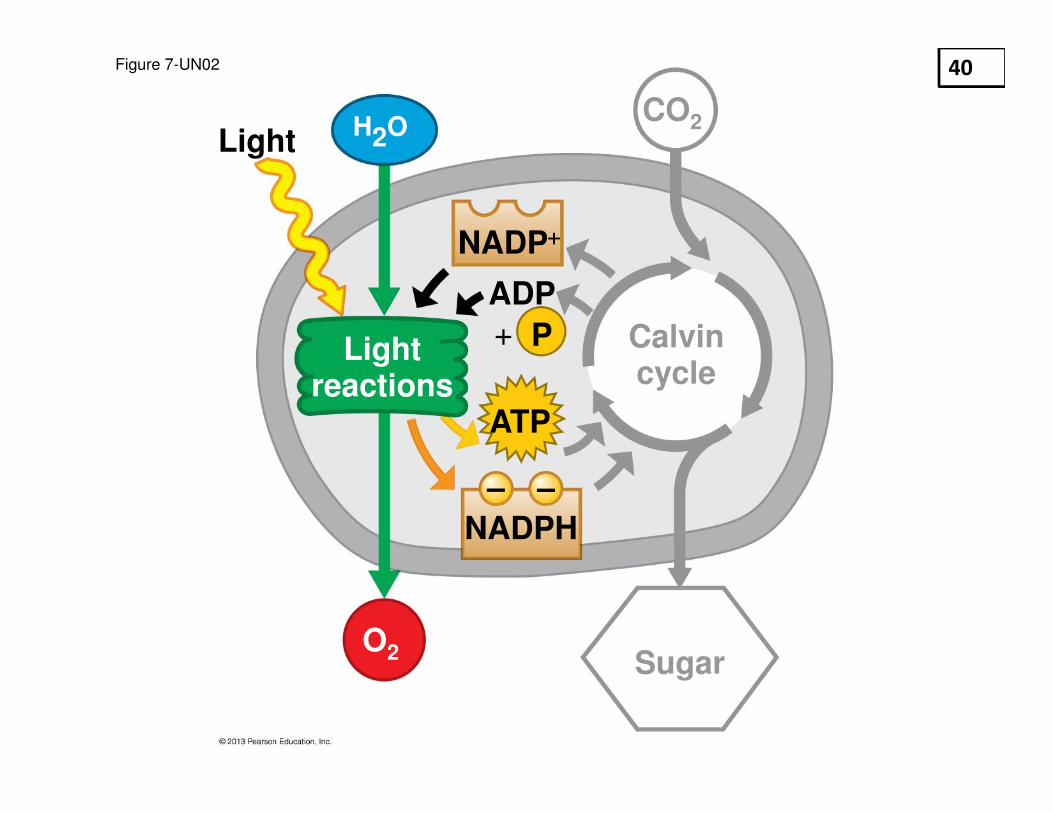
Figure 7-UN02
Light reactions
CO2
O2
H2O
NADPH
Light
Sugar
ATP
ADP
P
NADP++++
Calvin cycle
– –
+
40

Figure 7-UN03
Light reactions
CO2
O2
H2O
NADPH
Light
Sugar
ATP
ADPP
NADP++++
Calvin cycle
– –
+
41

Figure 7.10-3
Primaryelectronacceptor
Water-splittingphotosystem
Light
H2O
2 H++++ O2++++
Energyto make ATP
Primaryelectronacceptor
2e–
Light
NADPH-producingphotosystem
Reaction-centerchlorophyll
2e–
NADPH
NADP++++
1
2
2e–
2e–
1
2
3
– –
Reaction-centerchlorophyll
42

Figure 7-UN07
NADPH
Calvincycle
ADP P
NADP++++
P
ATP
G3P
CO2
Glucose andother compounds(such as celluloseand starch)
– –
43

Figure 8.4
Duplicated chromosomes(sister chromatids)
TE
M
Tight helical fiber
Thick supercoil
TE
M
Centromere
Nucleosome
“Beads on a string”
Histones
DNA double helix
44

Figure 8.6
Cytokinesis
(division of
cytoplasm)Mitosis
(division
of nucleus)
Mitotic
(M) phase:
cell division
(10% of time)
Interphase: metabolism and
growth (90% of time)
S phase
(DNA synthesis; chromosome duplication)
G1 G2
45

Figure 8.7a
Nuclear
envelopePlasma
membrane
Chromosome
(two sister chromatids)Spindle microtubules
Fragments of
nuclear envelopeCentrosome
Centromere
Early mitotic
spindleCentrosomes
(with centriole
pairs) Chromatin
PROPHASEINTERPHASE46

Figure 8.7b
ANAPHASEMETAPHASE TELOPHASE AND CYTOKINESIS
Spindle Daughterchromosomes
Cleavagefurrow
Nuclearenvelopeforming
47
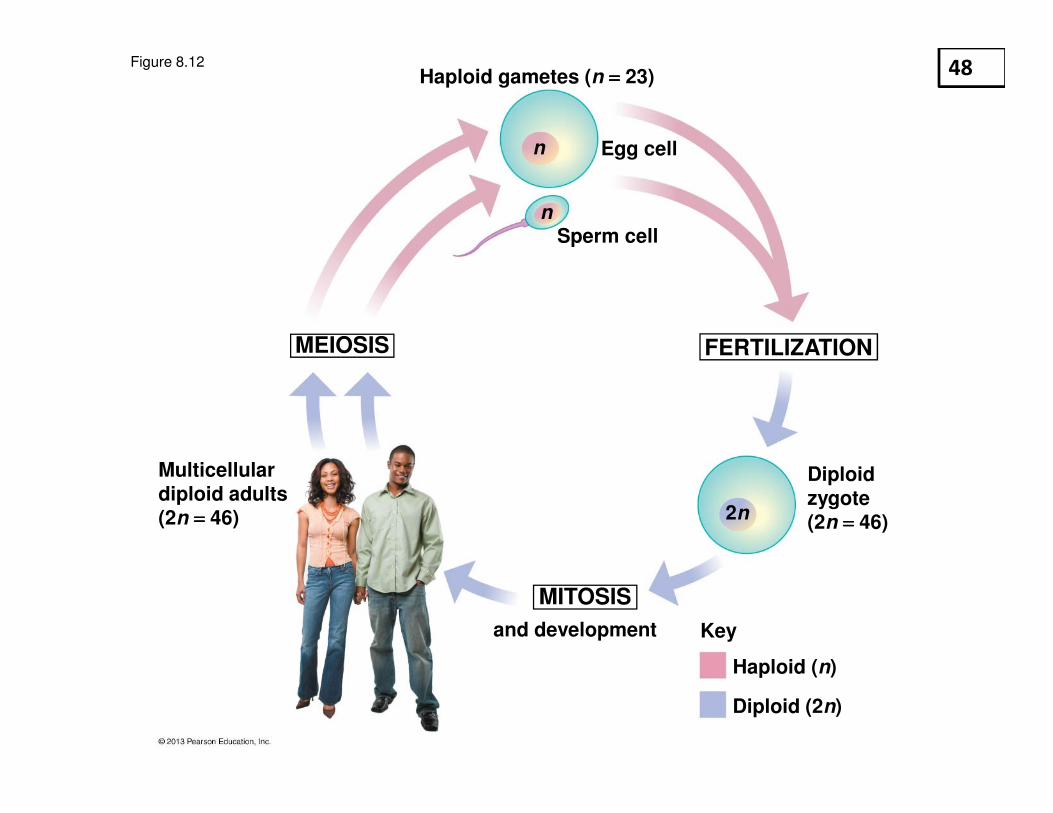
Figure 8.12
Multicellulardiploid adults(2n ==== 46)
MEIOSIS FERTILIZATION
MITOSIS
2n
and development Key
Sperm celln
n
Diploidzygote(2n ==== 46)
Diploid (2n)
Haploid (n)
Egg cell
Haploid gametes (n ==== 23) 48

Figure 8.13-3
MEIOSIS I
Sister chromatidsseparate.
MEIOSIS II
Homologouschromosomesseparate.
INTERPHASE BEFORE MEIOSIS
Sisterchromatids
Duplicated pair of homologouschromosomes
Chromosomesduplicate.
Pair of homologouschromosomes in diploid parent cell
1 2 3
49

Figure 8.14a
MEIOSIS I: HOMOLOGOUS CHROMOSOMES SEPARATE
Sister chromatids
remain attached
Pair ofhomologous
chromosomes
INTERPHASE
Sister
chromatids
Homologouschromosomespair up andexchangesegments.
Chromosomesduplicate.
Pairs of homologouschromosomesline up.
Pairs of homologouschromosomessplit up.
Nuclear
envelopeChromatin Centromere
Microtubulesattached to chromosome
Sites of crossing over
Spindle
Centrosomes
(with centriole pairs)
PROPHASE I METAPHASE I ANAPHASE I
50

Figure 8.14b
TELOPHASE IIAND
CYTOKINESIS
Sister chromatidsseparate
ANAPHASE II
Cleavage
furrow
TELOPHASE I AND
CYTOKINESIS
Two haploidcells form;chromosomesare still doubled.
MEIOSIS II: SISTER CHROMATIDS SEPARATE
PROPHASE II METAPHASE II
Haploid daughtercells forming
During another round of cell division, the sisterchromatids finally separate; four haploiddaughter cells result, containing single
chromosomes.
51
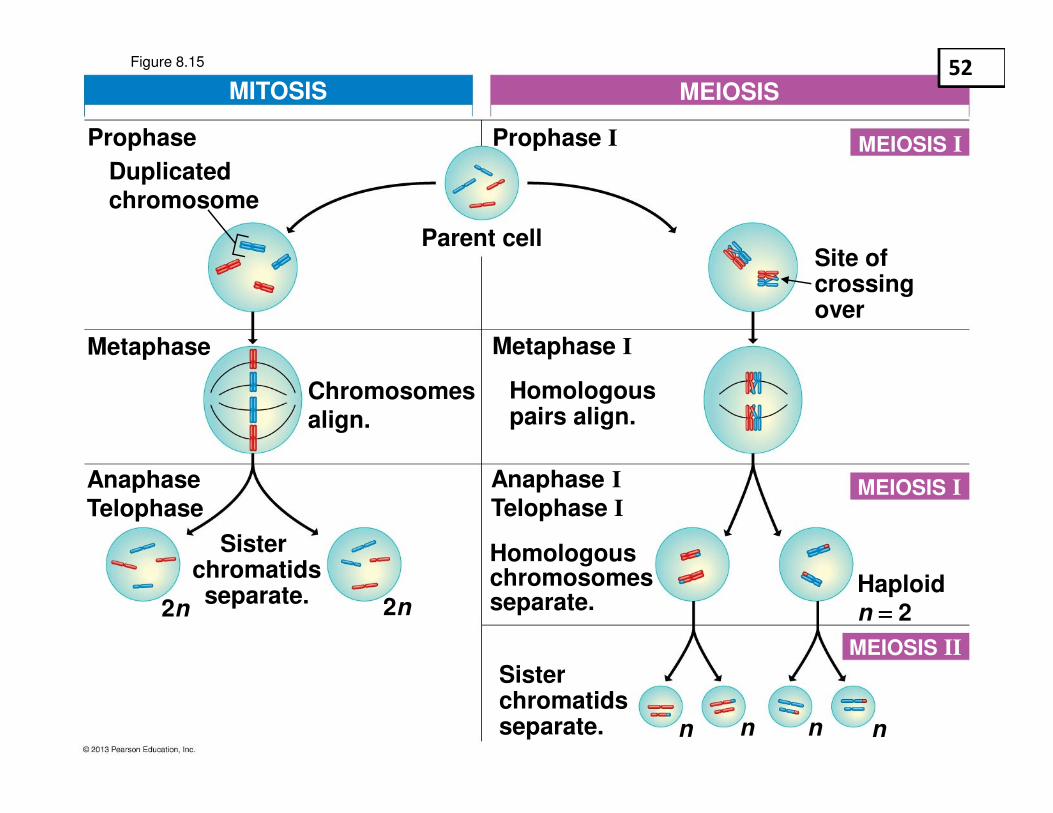
Figure 8.15
Duplicated chromosome
MITOSIS
Prophase
Chromosomes
align.
Metaphase
Sister chromatidsseparate.
Anaphase
Telophase
2n
Prophase I
Metaphase I
Anaphase I
Telophase I
MEIOSIS
MEIOSIS I
Site of crossing over
Homologous pairs align.
Homologous chromosomes separate.
Sister chromatidsseparate.
Haploid
n ==== 2
MEIOSIS II
Parent cell
n
MEIOSIS I
2n
n n n
52

Figure 8.18
Prophase I of meiosis Duplicated pair of homologouschromosomes
Chiasma, site ofcrossing over
Spindlemicrotubule
Homologouschromatids exchangecorrespondingsegments.
Metaphase I
Metaphase II
Sister chromatidsremain joined at theircentromeres.
Gametes
Recombinantchromosomes combinegenetic informationfrom different parents. Recombinant chromosomes
53

• A character is a heritable feature that varies
among individuals.
• A trait is a variant of a character.
• Each of the characters Mendel studied occurred in
two distinct traits.
In an Abbey Garden
© 2013 Pearson Education, Inc.
54
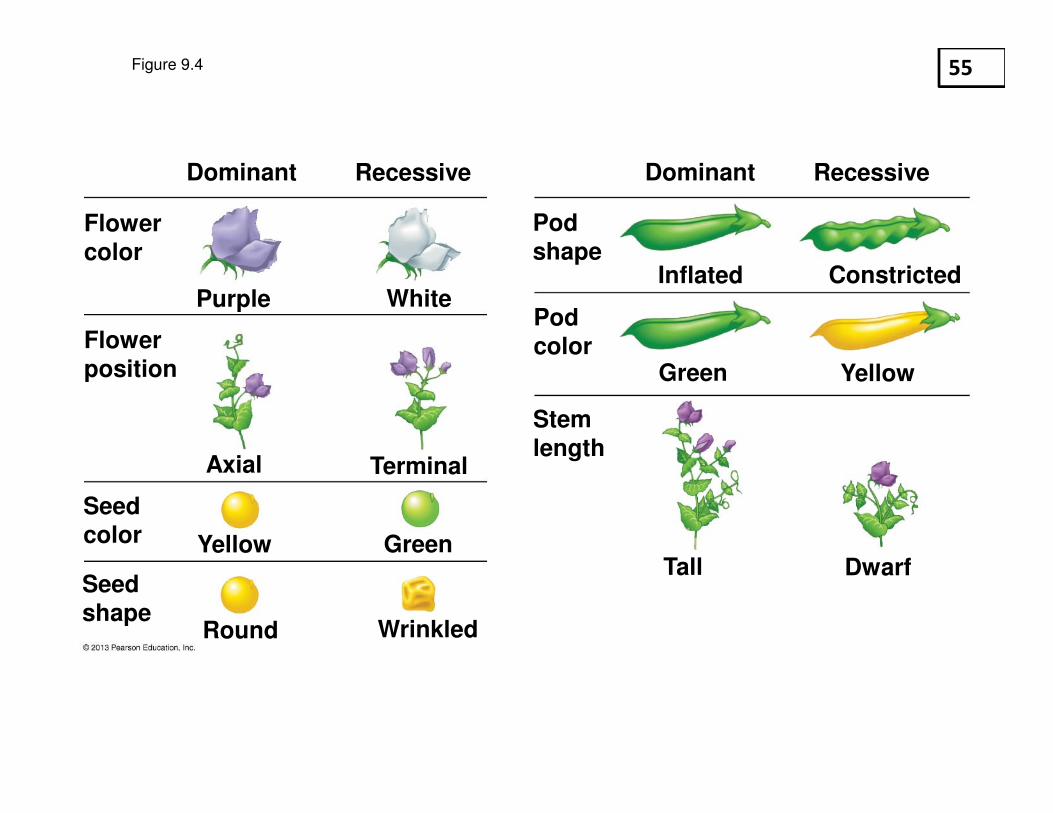
Figure 9.4
WhitePurple
RecessiveDominant
Green Yellow
Terminal Axial
Wrinkled Round
Green Yellow
Seed
shape
Seed color
Flower
position
Flower
color
Pod color
RecessiveDominant
Pod
shape
Stem length
Inflated Constricted
Tall Dwarf
55

2. For each inherited character, an organism inherits two
alleles, one from each parent.
– An organism is homozygous for that gene if both alleles are
identical.
– An organism is heterozygous for that gene if the alleles are different.
Monohybrid Crosses
© 2013 Pearson Education, Inc.
56
– Geneticists distinguish between an organism’s
physical appearance and its genetic makeup.
• An organism’s physical appearance is its phenotype.
• An organism’s genetic makeup is its genotype.
Monohybrid Crosses
© 2013 Pearson Education, Inc.
57

Figure 9.6P Generation Genetic makeup (alleles)
Alleles carried by parents
Gametes
Purple flowersPP
White flowerspp
All P All p
pP
F1 Generation(hybrids)
F2 Generation(hybrids)
Allelessegregate
Gametes
Purple flowersAll Pp
21
21
Sperm fromF1 plant
Eggs fromF1 plant
Phenotypic ratio3 purple : 1 white
Genotypic ratio1 PP : 2 Pp : 1 pp
p
p
P
PPP Pp
Pp pp
58

Figure 9.7
Homologouschromosomes
P
Genotype:
Gene loci
P
a
aa
b
B
Dominantallele
Recessive
alleleBbPP
Homozygous
for the
dominant allele
Homozygous
for the
recessive allele
Heterozygous
with one dominant
and one recessiveallele
a
59
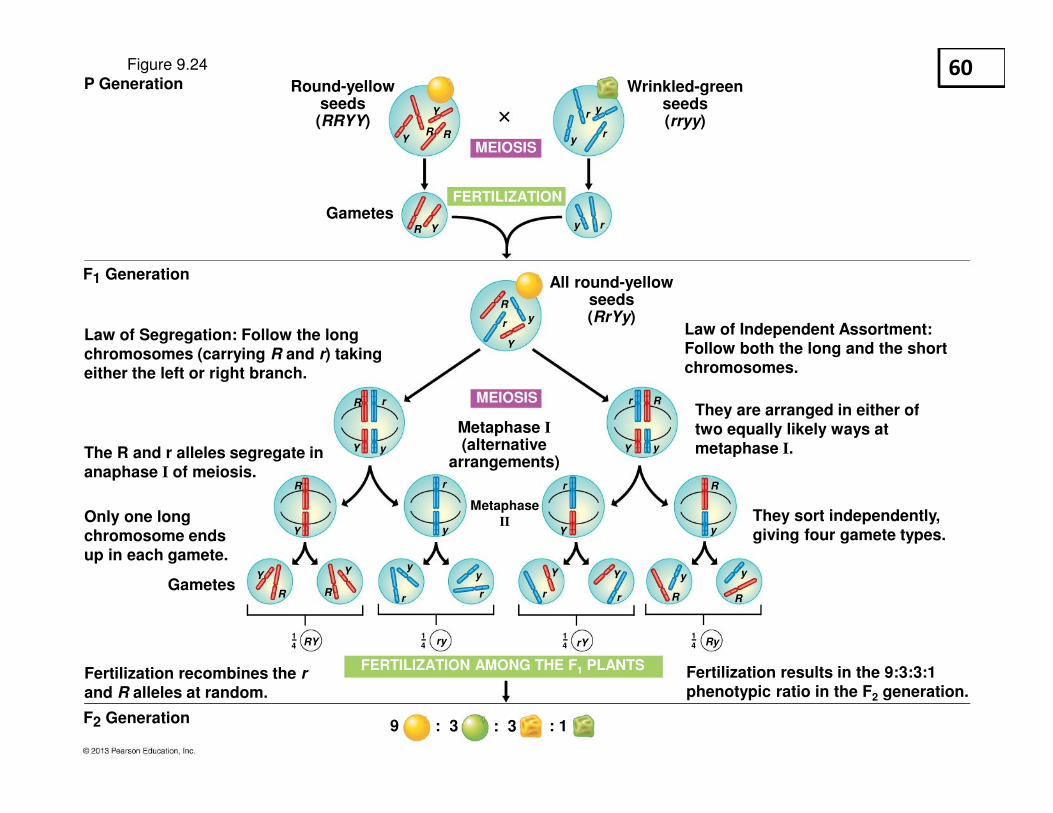
Figure 9.24
F1 Generation
P Generation
Gametes
Round-yellowseeds
(RRYY)
Wrinkled-greenseeds(rryy)
MEIOSIS
FERTILIZATION
MEIOSIS
All round-yellowseeds(RrYy)
Law of Segregation: Follow the longchromosomes (carrying R and r) takingeither the left or right branch.
The R and r alleles segregate inanaphase I of meiosis.
Only one longchromosome endsup in each gamete.
Gametes
Fertilization recombines the rand R alleles at random.
F2 Generation9 : 3 : 3 : 1
FERTILIZATION AMONG THE F1 PLANTS Fertilization results in the 9:3:3:1phenotypic ratio in the F2 generation.
They sort independently,giving four gamete types.
They are arranged in either oftwo equally likely ways atmetaphase I.
Law of Independent Assortment:Follow both the long and the shortchromosomes.
Metaphase I(alternative
arrangements)
Metaphase
II
Y
Y
Y
R R
R
y
y
y
r
r
r
r
r r
rr
r r r r
y
y y
yy
yy y y
RRRR
R R
R R
R
Y
Y Y
YY
Y Y Y Y
RY ry rY Ry4
1
4
1
4
1
4
1
60

Figure 9.26
Crossing overPair ofhomologouschromosomes
A
Recombinant gametes
B
A B
a b
a b
Parental gametes
A Bab
61
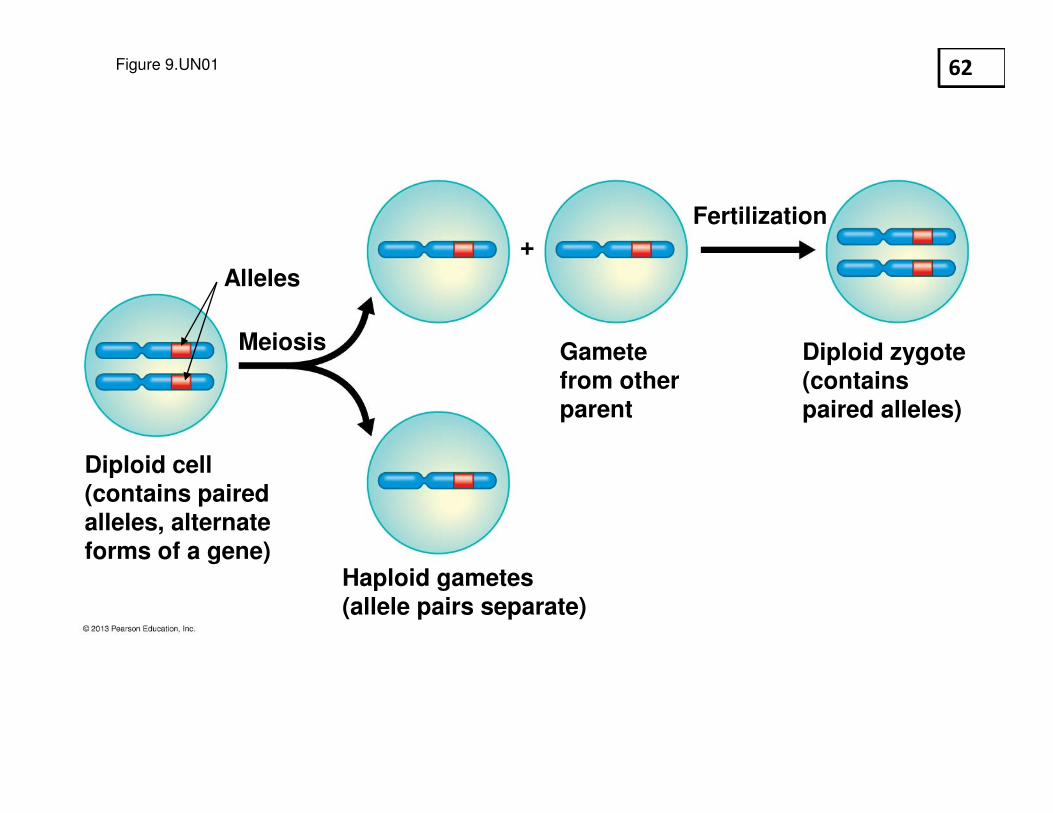
Figure 9.UN01
Meiosis
Haploid gametes
(allele pairs separate)
Diploid cell
(contains paired
alleles, alternateforms of a gene)
Diploid zygote
(contains
paired alleles)
Gamete
from other
parent
Alleles
Fertilization
62
DNA and RNA Structure
– DNA and RNA are nucleic acids.
• They consist of chemical units called nucleotides.
• A nucleotide polymer is a polynucleotide.
• Nucleotides are joined by covalent bonds between the
sugar of one nucleotide and the phosphate of the next,
forming a sugar-phosphate backbone.
© 2013 Pearson Education, Inc.
63
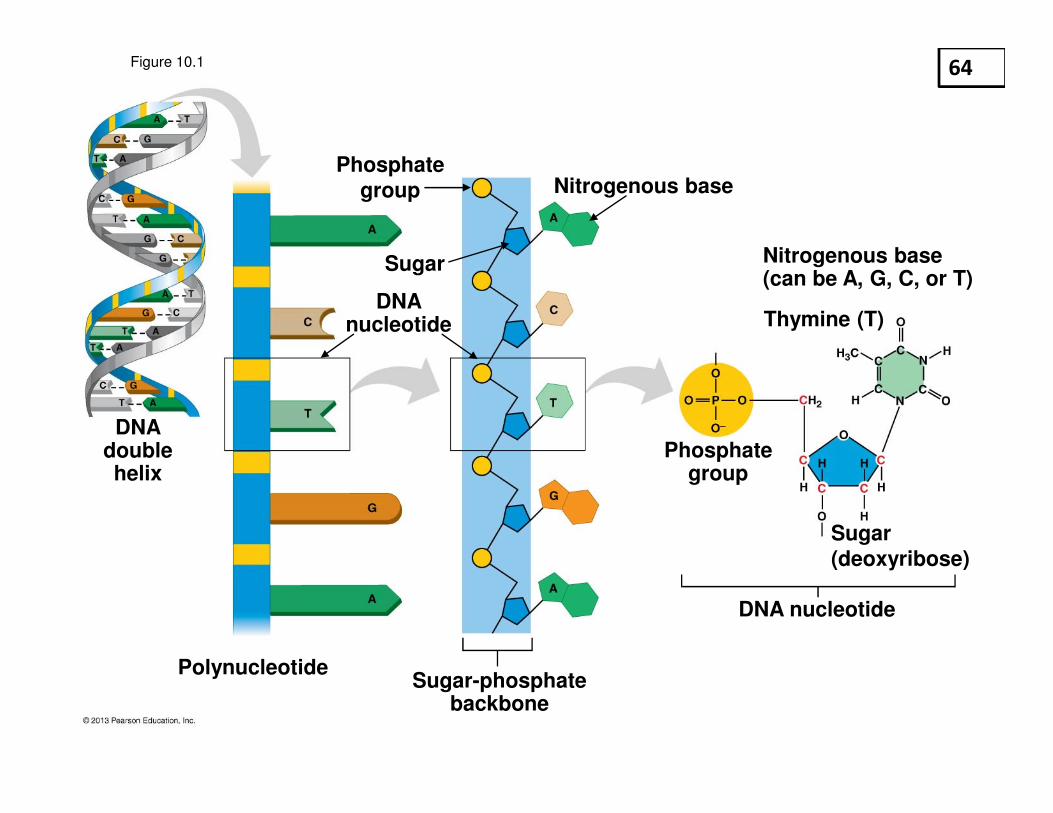
Figure 10.1
Sugar-phosphatebackbone
Phosphate
group Nitrogenous base
DNA nucleotide
DNAnucleotide Thymine (T)
Sugar
Polynucleotide
DNAdoublehelix
Sugar
(deoxyribose)
Phosphategroup
Nitrogenous base(can be A, G, C, or T)
64

Figure 10.5
(c) Computer model(b) Atomic model(a) Ribbon model
Hydrogen bond
65
The Central Dogma of Molecular Biology
– Central dogma of molecular biology
• Formulated by Francis Crick
• Genetic information is transferred within biological system
in 3 distinct processes
– Replication
– Transcription
– Translation
© 2013 Pearson Education, Inc.
66

The Central Dogma of Molecular Biology
– Replication
• creating an exact copy. Using nucleotide sequence in DNA to produce
another double stranded DNA molecule with the exact same
sequences
– Transcription
• Same language and essentially the same words but in a slightly
different format. Uses nucleotide sequence in DNA to produce an
equivalent nucleotide sequence in an RNA molecule
– Translation
• Converting words from one language into different words in a different
language. Using nucleotide sequence in RNA to produce a sequence of amino
acids in a polypeptide according to specific translation rules. In essence going
from the language of nucleotides to the language of amino acids.
© 2013 Pearson Education, Inc.
67
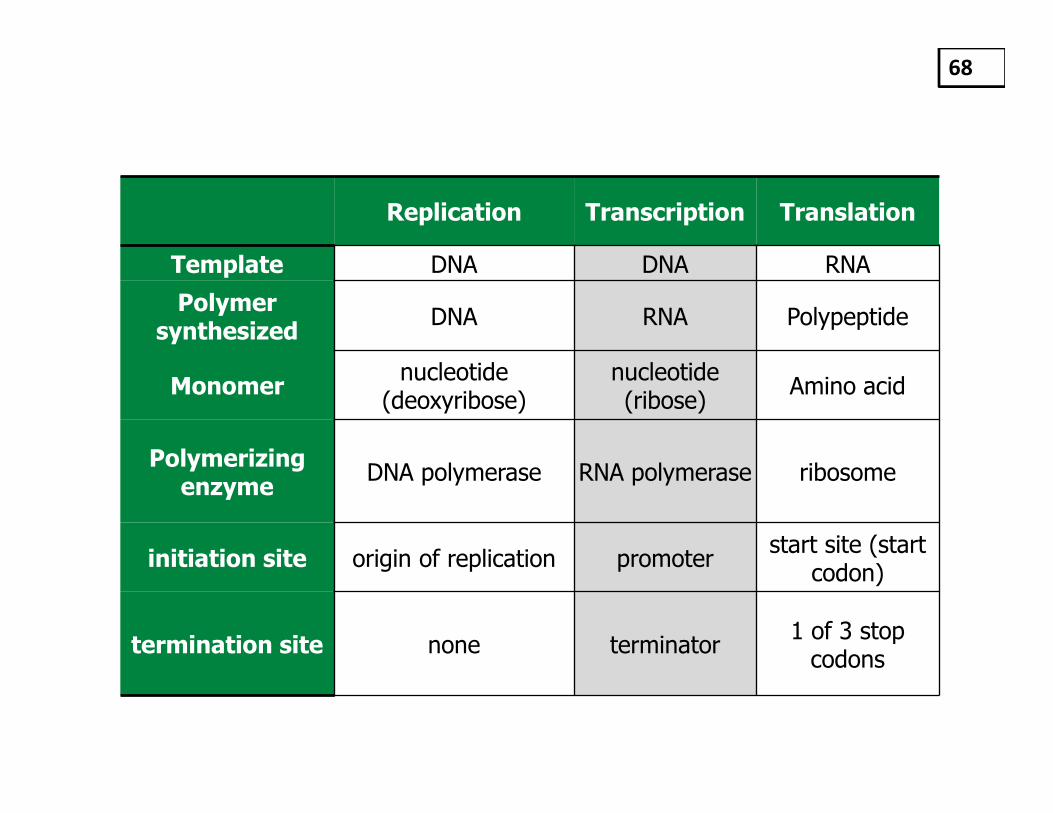
Replication Transcription Translation
Template DNA DNA RNA
Polymer synthesized
DNA RNA Polypeptide
Monomernucleotide (deoxyribose)
nucleotide (ribose)
Amino acid
Polymerizing enzyme
DNA polymerase RNA polymerase ribosome
initiation site origin of replication promoterstart site (start codon)
termination site none terminator1 of 3 stop codons
68
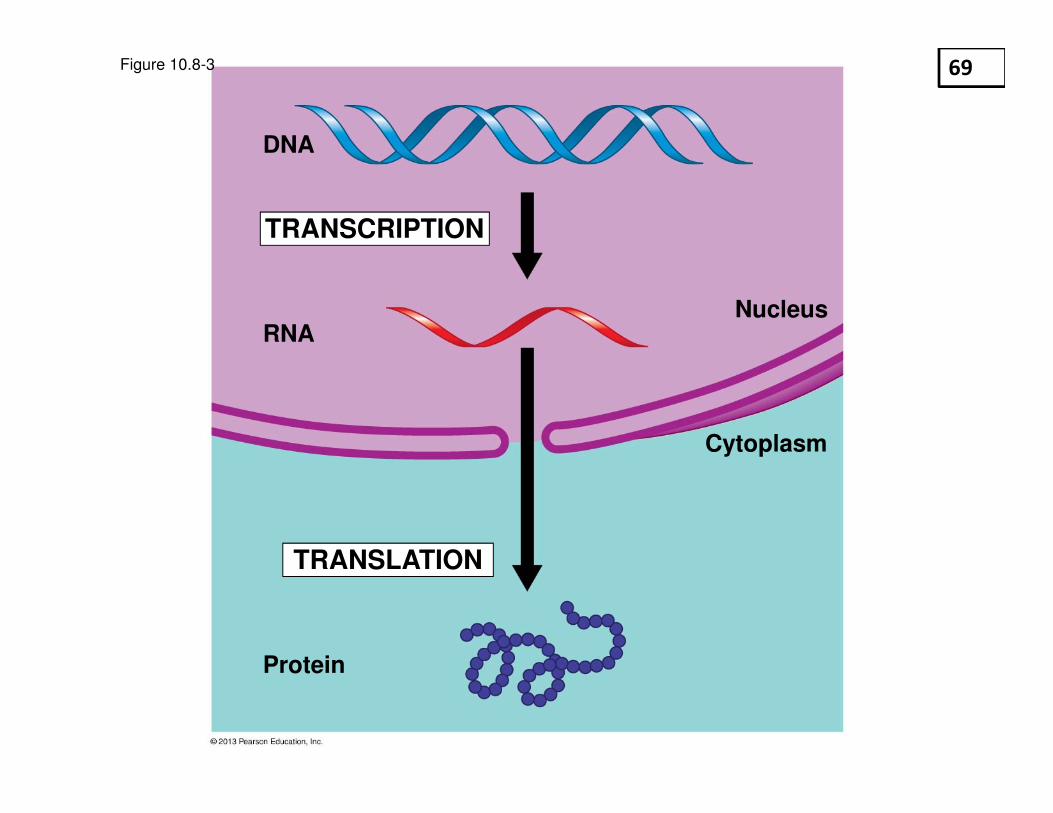
Figure 10.8-3
DNA
Cytoplasm
NucleusRNA
Protein
TRANSCRIPTION
TRANSLATION
69

Figure 10.10
Amino acid
RNA
TRANSCRIPTION
DNA strand
Polypeptide
Codon
Gene 1
Gene 3
Gene 2DNA molecule
TRANSLATION
70

Figure 10.16a
tRNA binding sites
Ribosome
(a) A simplified diagram of a ribosome
Large
subunit
Smallsubunit
P site
mRNA
binding
site
A site
71

Figure 10.16b
Next amino acidto be added to polypeptide
Growing
polypeptide
tRNA
mRNA
(b) The “players” of translation
Codons
72

Figure 10.16
Next amino acidto be added to polypeptide
Growing
polypeptide
tRNA
mRNA
tRNA
binding sites
Codons
Ribosome
(b) The “players” of translation
(a) A simplified diagram
of a ribosome
Large
subunit
Small
subunit
P site
mRNA
binding
site
A site
73

Figure 10.19
Amino acid
Anticodon
A site
Codons
mRNA
P site
Polypeptide
Codon recognition
Peptide bond formation
Translocation
Stop codon
New peptidebond
mRNAmovement
2
1
3
ELONGATION
74
HOW AND WHY GENES ARE REGULATED
– Every somatic cell in an organism contains
identical genetic instructions.
• They all share the same genome.
• So what makes cells different from one another?
© 2013 Pearson Education, Inc.
75
– In cellular differentiation, cells become
specialized in
• structure and
• function.
– Certain genes are turned on and off in the
process of gene regulation.
HOW AND WHY GENES ARE REGULATED
© 2013 Pearson Education, Inc.
76

Patterns of Gene Expression in Differentiated Cells
– In gene expression,
• a gene is turned on and transcribed into RNA and
• information flows from
– genes to proteins and
– genotype to phenotype.
– Information flows from DNA to RNA to proteins.
– The great differences among cells in an
organism must result from the selective
expression of genes.
© 2013 Pearson Education, Inc.
77
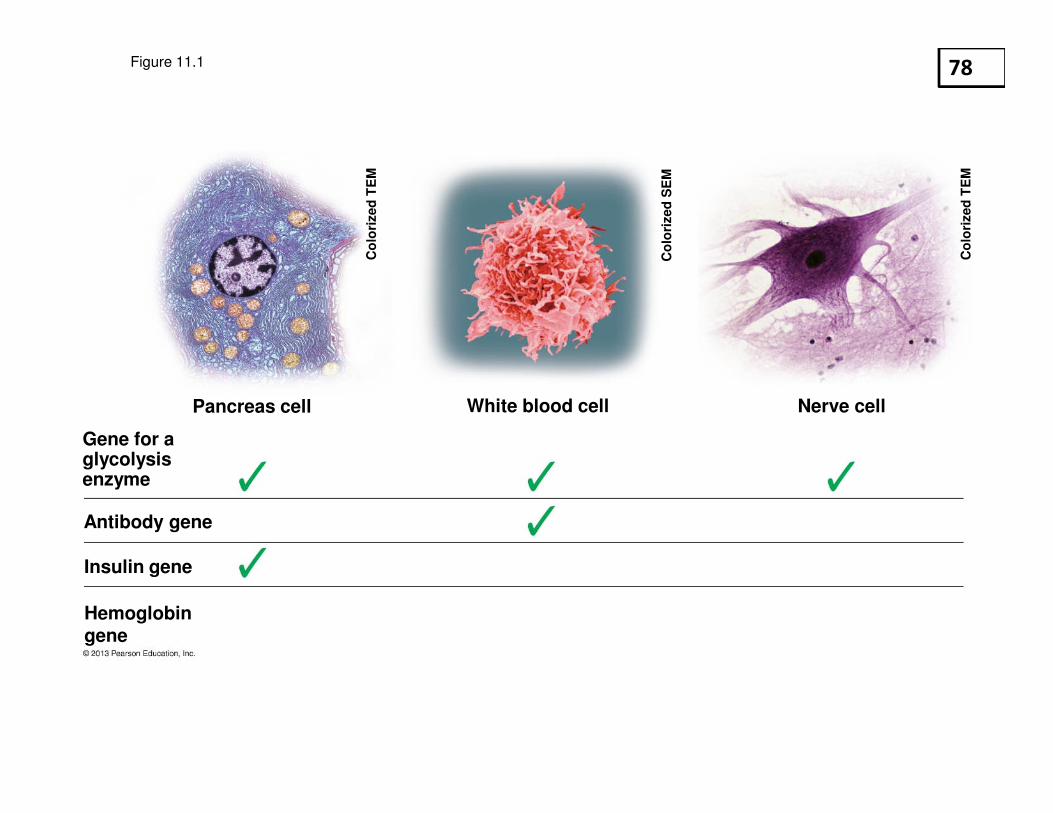
Figure 11.1
Gene for a glycolysis enzyme
Hemoglobin gene
Antibody gene
Insulin gene
White blood cellPancreas cell Nerve cell
Co
lori
zed
TE
M
Co
lori
zed
TE
M
Co
lori
zed
SE
M
78

Gene Regulation in Bacteria
– Natural selection has favored bacteria that
express
• only certain genes
• only at specific times when the products are needed
by the cell.
– So how do bacteria selectively turn their genes
on and off?
© 2013 Pearson Education, Inc.
79

Figure 11.2
Operon turned on (lactose inactivates repressor)
Lactose
Protein
mRNA
DNA
Protein
mRNA
DNA
Operon turned off (lactose absent)
80

Genes That Cause Cancer
– As early as 1911, certain viruses were known to
cause cancer.
– Oncogenes are
• genes that cause cancer and
• found in viruses.
© 2013 Pearson Education, Inc.
81

Oncogenes and Tumor-Suppressor Genes
– Proto-oncogenes are
• normal genes with the potential to become oncogenes,
• found in many animals, and
• often genes that code for growth factors, proteins that
stimulate cell division…
• …or tumor supressor genes which code for proteins that
inhibit cell growth and division
© 2013 Pearson Education, Inc.
82
Oncogenes and Tumor-Suppressor Genes
– A cell can acquire an oncogene
• from a virus or
• from the mutation of one of its own proto-oncogenes.
© 2013 Pearson Education, Inc.
83

Figure 11.17
New promoter
Normal growth-stimulating
protein in excess
Hyperactive
growth-stimulatingprotein
Gene in
new position,
under new controls
Multiple copies
of gene
DNA
Mutation withingene
Proto-oncogene
Oncogene
84

Figure 11.UN09Proto-oncogene
(normal) Oncogene
Mutation
Normal protein
Mutant protein
Defective protein
Mutation
Normal regulationof cell cycle
Normal growth-inhibitingprotein
Out-of-controlgrowth (leadingto cancer)
Mutatedtumor-suppressor
gene
Tumor-suppressorgene (normal)
85

Homeostasis
– Homeostasis is the body’s ability to stay relatively
unchanged even when the world around it
changes.
– The internal environment of vertebrates includes
the interstitial fluid that
• fills the spaces between cells and
• exchanges nutrients and wastes with microscopic
blood vessels.
© 2013 Pearson Education, Inc.
86

Figure 21.12
Externalenvironment
Large external changes
HOMEOSTATICMECHANISMS
Small internal changes
Animal’s internalenvironment
87
Negative and Positive Feedback
– Most mechanisms of homeostasis depend on a
principle called negative feedback,
• in which the results of a process inhibit that same
process,
• such as a thermostat that turns off a heater when room
temperature rises to the set point.
© 2013 Pearson Education, Inc.
88
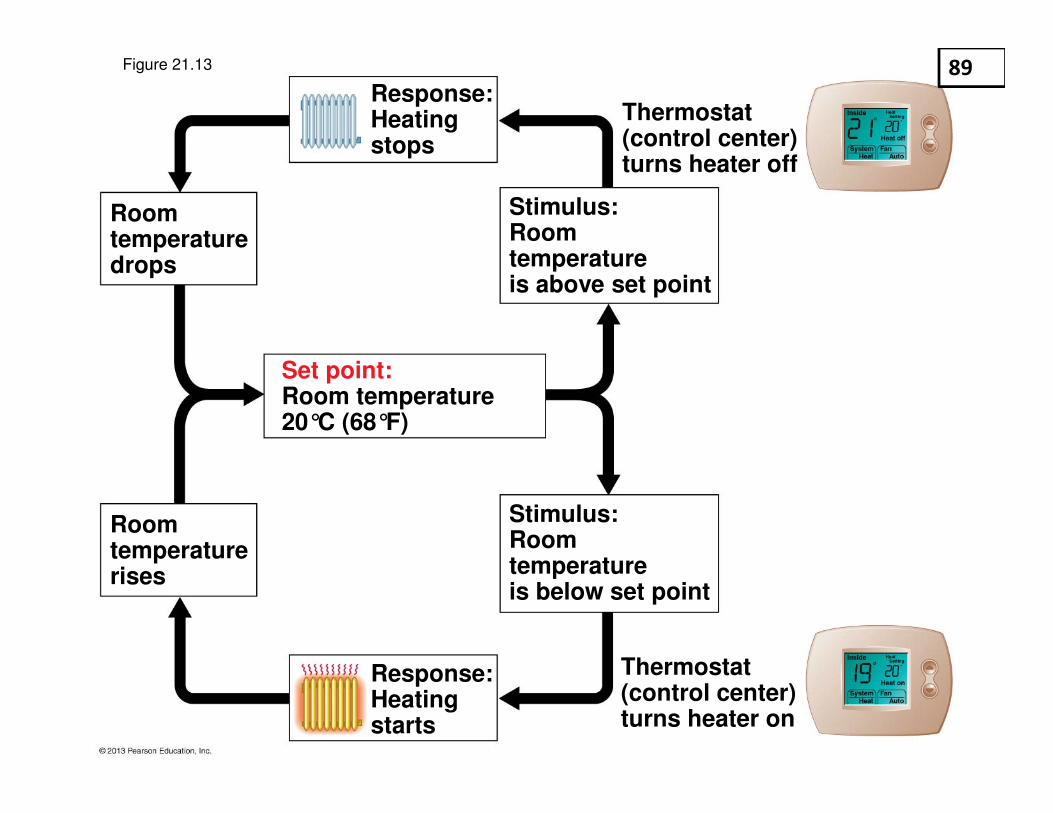
Figure 21.13
Thermostat(control center)turns heater off
Thermostat(control center)turns heater on
Set point:Room temperature20°C (68°F)
Roomtemperaturedrops
Roomtemperaturerises
Response:Heatingstops
Response:Heatingstarts
Stimulus:Room temperatureis above set point
Stimulus:Room temperatureis below set point
89

– Less common is positive feedback,
• in which the results of a process intensify that same
process,
• such as uterine contractions during childbirth.
Negative and Positive Feedback
© 2013 Pearson Education, Inc.
90