
Atomic data (Fe XIII density diagnostics for Hinode EIS)
30
Atomic data (Fe XIII density diagnostics for Hinode EIS) Giulio Del Zanna DAMTP, CMS, University of Cambridge, UK
Transcript of Atomic data (Fe XIII density diagnostics for Hinode EIS)

Atomic data (Fe XIII density diagnostics for Hinode EIS)
Giulio Del Zanna DAMTP, CMS, University of Cambridge, UK

Atomic data SPECTROSCOPY OF STELLAR CORONAE:
Measurements of Ne, Te, DEM(T), flows
CALCULATION:
UK APAP Network http://www.apap-network.org/ has become the main ion atomic data provider for fusion and astrophysics (Strathclyde, UCL, Cambridge)
BENCHMARK:
EUV line identifications and benchmark
DISTRIBUTION: CHIANTI (www.chiantidatabase.org) has now become the reference atomic database for ions CHIANTI v.7 are available in VAMDC (Virtual Atomic and Molecular Data Center: http://portal.vamdc.eu) G. Del Zanna - ISSI meeting - May 2015

G. Del Zanna - ISSI meeting - May 2015
Ionization vs. excitation
Charge=Z
Charge=Z-1 Charge=Z+1
Ionizations/recombinations occur on timescales of 1-100s Dipole-allowed lines decay in 10-10 s. Forbidden ones in 10-4 s or longer
Normally consider separately excitation / ionization

G. Del Zanna - ISSI meeting - May 2015
Line intensities
In optically-thin plasmas line intensities are proportional to:
Ion abundance
(Te, Ne)
El. abundance
Level population
(Ne,Te)
A-value
The Hydrogen/electron density depends on the elemental abundances relative to H. For the solar corona, H, He are fully ionised and the ratio is about 0.8--0.9.

G. Del Zanna - ISSI meeting - May 2015
Contribution function
Spectral line intensity:

G. Del Zanna - ISSI meeting - May 2015
Level population
Eij
j
i
The main processes affecting the level populations within one ion are scattering with particles and photons.
All excitations/de-excitations need to be considered.
Most abundant particles in the quiescent corona are thermal electrons, protons, alpha.
Electron collisions are the main excitation process in the low corona.
Proton collisions are also important for some ions.
Non-thermal particles could be present.

G. Del Zanna - ISSI meeting - May 2015
Collision strength The number of transitions form level i to level j due to electron collisions
per unit volume and time is given by Ni Ne Cij where Cij is the rate:
collision strength
Assuming a Maxwellian distribution function f:
G. Del Zanna - ISSI meeting - May 2015
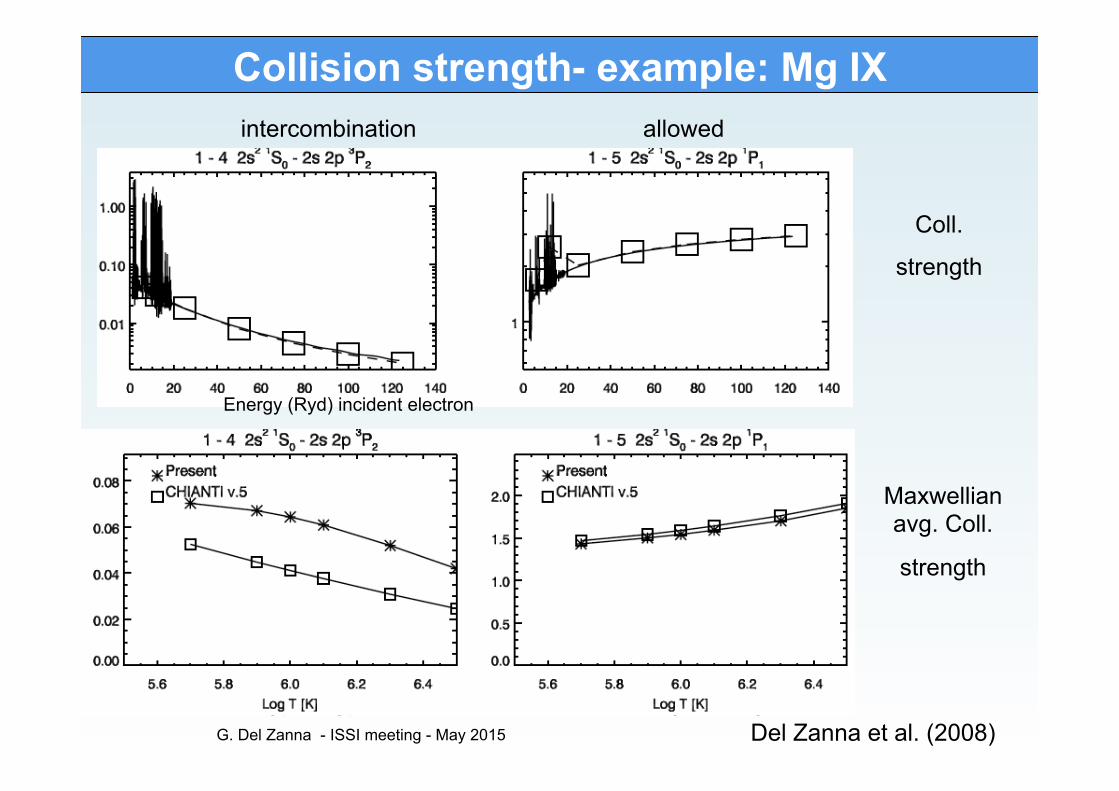
Collision strength- example: Mg IX
Energy (Ryd) incident electron
intercombination allowed
Coll.
strength
Maxwellian avg. Coll.
strength
Del Zanna et al. (2008)

G. Del Zanna - ISSI meeting - May 2015
Metastable levels- electron density diagnostics
As the electron density increases, the population of the metastable levels increases. The intensity of spectral lines connected with metastable levels varies accordingly.

G. Del Zanna - ISSI meeting - May 2015
The CHIANTI IDL program to measure densities from line ratios

G. Del Zanna - ISSI meeting - May 2015
Hinode EUV imaging spectrometer (EIS)
E I S F O V (576”x512”)
XRT (2048”x2048”)
W

G. Del Zanna - ISSI meeting - May 2015
Hinode EIS Young et al. (2008)

Young et al. 2008
G. Del Zanna - ISSI meeting - May 2015
Used older collision strengths from Gupta & Tayal (1998)

Storey & Zeippen (2010) performed an IP scattering calculation much superior than previous ones.
G. Del Zanna - ISSI meeting - May 2015

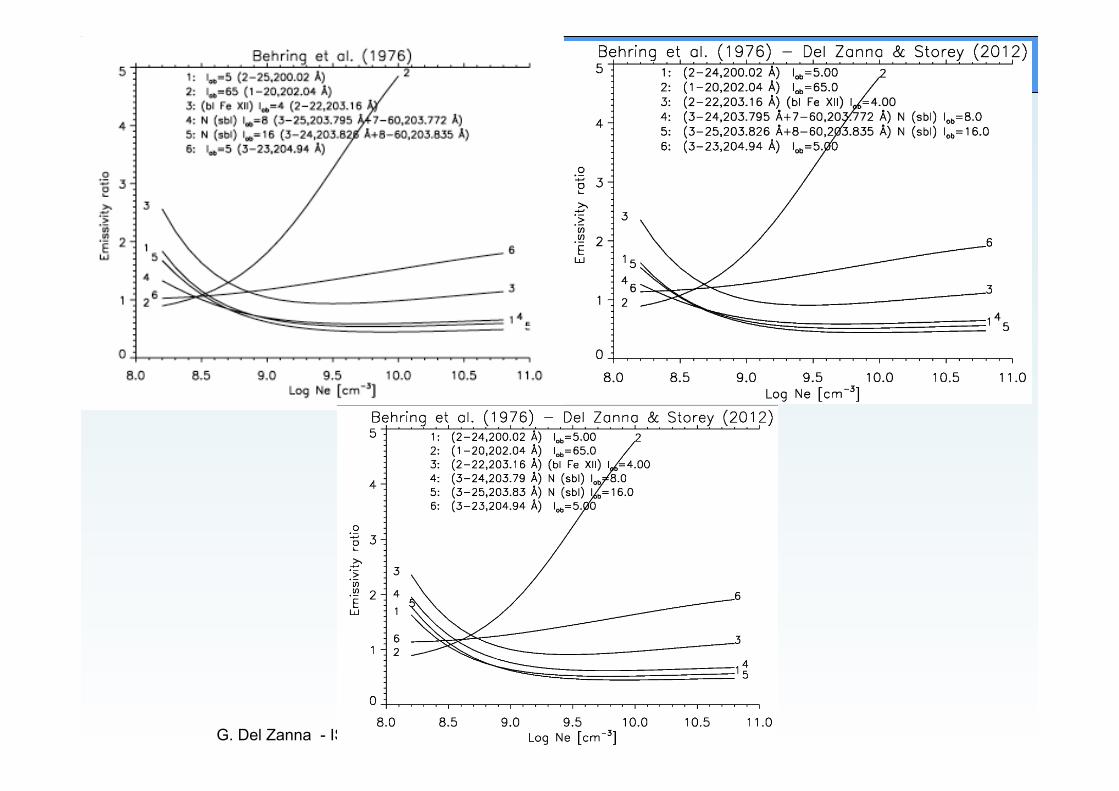
Benchmarking atomic data (Del Zanna)
1) observed and theoretical wavelengths and line intensities for a wide range of astrophysical and laboratory plasmas using the emissivity ratios:
For iso-density plasmas, curves cross.
The method in principle could be used to infer the density distribution alos. (Doschek (1984) But.. large uncertainties in atomic data and calibration!
2) compared level lifetimes with beam-foil spectroscopy. RESULTS: new wavelengths (with uncertainties), new identifications, new level energies (with uncertainties), new diagnostics A-values of strongest lines normally accurate to better than 10% Excitation data can be accurate to better than 20%
G. Del Zanna - ISSI meeting - May 2015
Storey et al.(2005)

Large problems with atomic data of Aggarwal & Keenan 2005. Gupta & Tayal (1998) – CHIANTI v6 (learn who to trust!) Del Zanna A&A 533, A12 (2011)
G. Del Zanna - ISSI meeting - May 2015
Storey & Zeippen (2010)

G. Del Zanna - ISSI meeting - May 2015
Several new identifications, to be confirmed ! Del Zanna A&A 533, A12 (2011)

G. Del Zanna - ISSI meeting - May 2015
Several new identifications Del Zanna A&A 533, A12 (2011)

G. Del Zanna - ISSI meeting - May 2015
High-resolution observations seem to confirm the new identifications Del Zanna A&A 533, A12 (2011)

Del Zanna & Storey (2012): largest scattering calculation to date à CHIANTI v.8 (Del Zanna+2015). Only minor differences for strongest lines, compared to Storey & Zeippen (2010).
G. Del Zanna - ISSI meeting - May 2015
Older Storey & Zeippen CC expansion
G. Del Zanna - ISSI meeting - May 2015
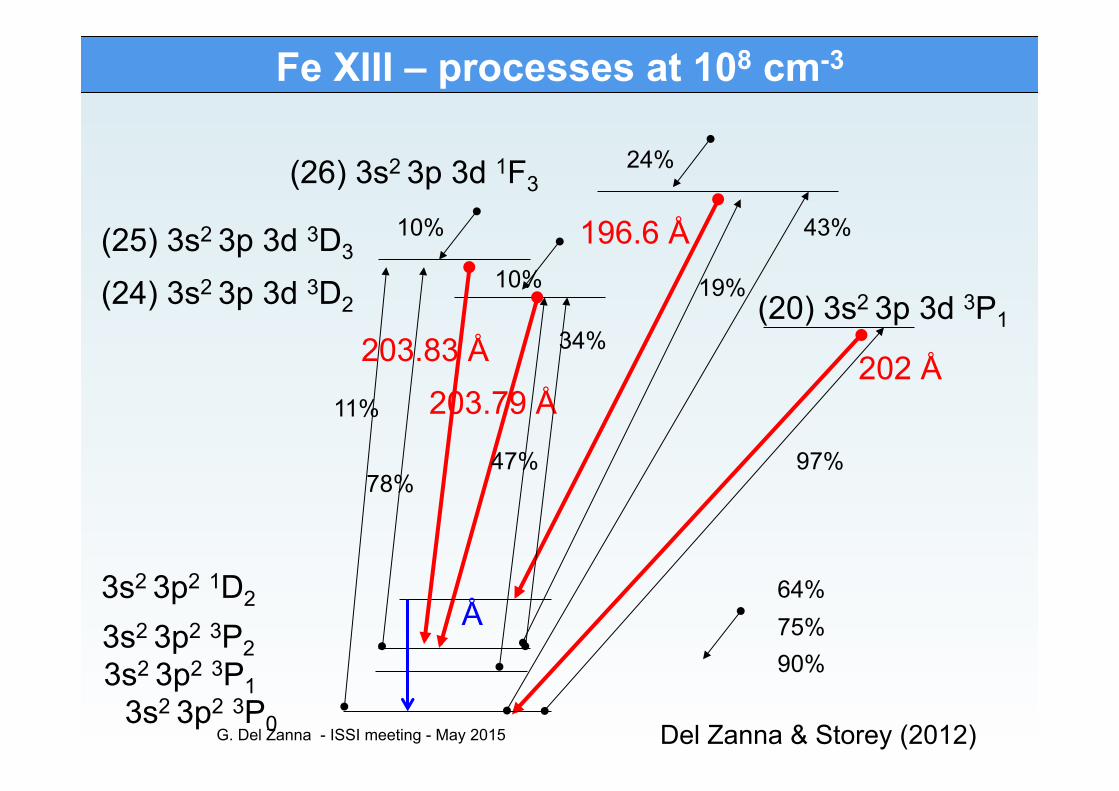
Fe XIII – processes at 108 cm-3
(24) 3s2 3p 3d 3D2 (20) 3s2 3p 3d 3P1
202 Å 203.79 Å
Del Zanna & Storey (2012) 3s2 3p2 3P0
3s2 3p2 3P1 3s2 3p2 3P2
Å 3s2 3p2 1D2
G. Del Zanna - ISSI meeting - May 2015
(25) 3s2 3p 3d 3D3
203.83 Å
196.6 Å
(26) 3s2 3p 3d 1F3
97%
24%
43%
19%
11%
78%
10%
10%
34%
47%
90% 75% 64%

G. Del Zanna - ISSI meeting - May 2015

Young (2004) performed atomic structure calculations with TEC. In some case, large differences in the A-values of the strong allowed transitions are found (learn who to trust!).
G. Del Zanna - ISSI meeting - May 2015

G. Del Zanna - ISSI meeting - May 2015

Non-Maxwellian electrons
Dudik, Del Zanna et al. 2014, A&A
G. Del Zanna - ISSI meeting - May 2015

G. Del Zanna - ISSI meeting - May 2015

G. Del Zanna - ISSI meeting - May 2015

EIS calibration (Del Zanna 2013)
G. Del Zanna - Feb 2015
The EIS SW and LW sensitivities at the start of the mission were somewhat lower than the values measured
on the ground
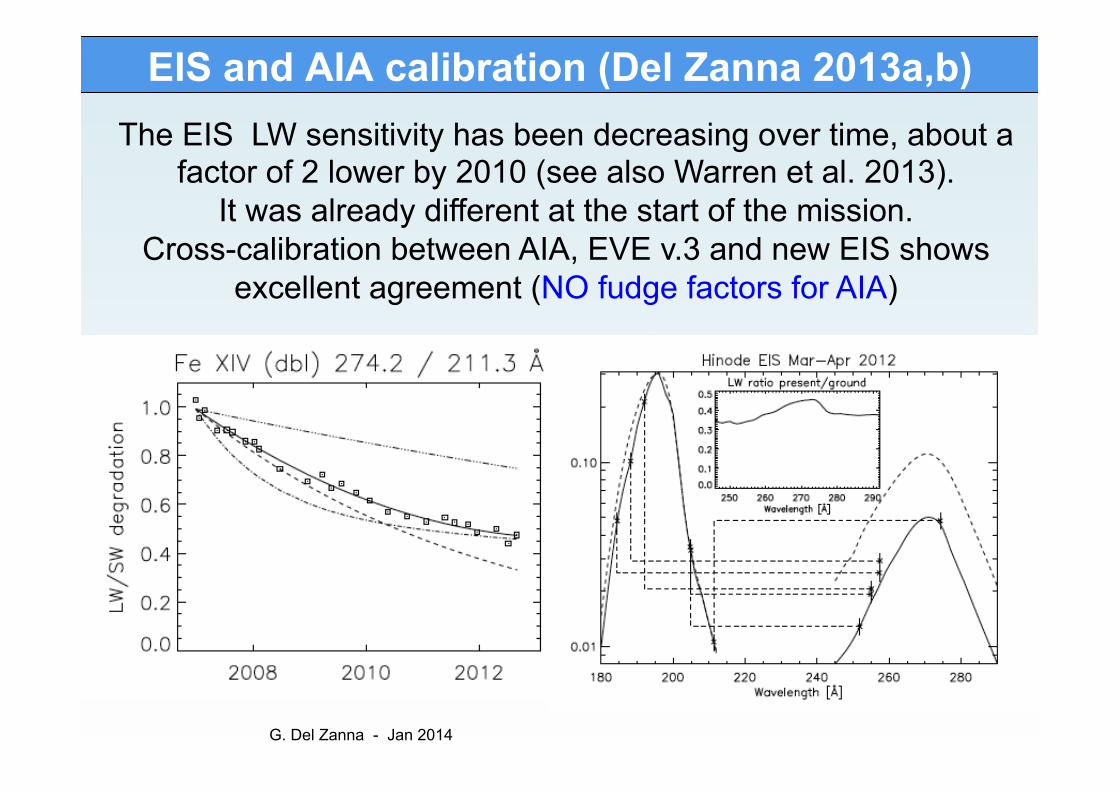
EIS and AIA calibration (Del Zanna 2013a,b)
G. Del Zanna - Jan 2014
The EIS LW sensitivity has been decreasing over time, about a factor of 2 lower by 2010 (see also Warren et al. 2013).
It was already different at the start of the mission. Cross-calibration between AIA, EVE v.3 and new EIS shows
excellent agreement (NO fudge factors for AIA)


![EIS/Hinode Spectroscopic Data Analyses · EIS/Hinode Spectroscopic Data Analyses A.K. Srivastava & Pradeep Kayshap [A] Analyses of RASTER SCANS : Raster is generated when a slit is](https://static.fdocuments.in/doc/165x107/5f0762407e708231d41cb6e9/eishinode-spectroscopic-data-analyses-eishinode-spectroscopic-data-analyses-ak.jpg)


![Active region loops: Hinode/EIS observations region loops: Hinode/EIS observations ... [A (b) G(N e,T e)] I ... loop_presentation_new_tripathi.ppt [Read-Only]](https://static.fdocuments.in/doc/165x107/5ac88c167f8b9acb7c8cd11d/active-region-loops-hinodeeis-region-loops-hinodeeis-observations-a-b.jpg)