
Atomic, Crystal, Elastic, Thermal, Nuclear, and Other Properties of ...
50
UCRL-TR-224850 Atomic, Crystal, Elastic, Thermal, Nuclear, and Other Properties of Beryllium A. Goldberg September 29, 2006
Transcript of Atomic, Crystal, Elastic, Thermal, Nuclear, and Other Properties of ...

UCRL-TR-224850
Atomic, Crystal, Elastic, Thermal,Nuclear, and Other Properties ofBeryllium
A. Goldberg
September 29, 2006
Disclaimer
This document was prepared as an account of work sponsored by an agency of the United States Government. Neither the United States Government nor the University of California nor any of their employees, makes any warranty, express or implied, or assumes any legal liability or responsibility for the accuracy, completeness, or usefulness of any information, apparatus, product, or process disclosed, or represents that its use would not infringe privately owned rights. Reference herein to any specific commercial product, process, or service by trade name, trademark, manufacturer, or otherwise, does not necessarily constitute or imply its endorsement, recommendation, or favoring by the United States Government or the University of California. The views and opinions of authors expressed herein do not necessarily state or reflect those of the United States Government or the University of California, and shall not be used for advertising or product endorsement purposes.
This work was performed under the auspices of the U.S. Department of Energy by University of California, Lawrence Livermore National Laboratory under Contract W-7405-Eng-48.

DTED Report No: CODTU-2004-1514
ATOMIC, CRYSTAL, ELASTIC, THERMAL, NUCLEAR, AND OTHER PROPERTIESOF BERYLLIUM
Alfred Goldberg
One of a Series of Reports on Beryllium
May 15, 2004
Lawrence Livermore National Laboratory, Livermore, CA 94551
This effort is funded by the Weapons System EngineeringCertification Campaign (C6)

2
ATOMIC, CRYSTAL, ELASTIC, THERMAL, NUCLEAR, AND OTHER PROPERTIES OF BERYLLIUM
Table of Contents
Introduction ....................................................................................................................................... 3II-1—Atomic/Crystal Structure ........................................................................................................ 3II-2—Elastic Properties ..................................................................................................................... 5II-3—Thermal Properties................................................................................................................ 14II-4—Nuclear Properties ................................................................................................................. 32II-5—Miscellaneous Properties ....................................................................................................... 36References ........................................................................................................................................ 46

3
Introduction
This report is part of a series of documents that provide a background to those involved in the construction of beryllium components and their applications. Topics on beryllium that have been or will be presented in this series are the following:
I General Background II Atomic, Crystal, Elastic, Thermal, Nuclear, and other Properties of Beryllium III ExtractionIV Purification and Casting of IngotsV Beryllium PowdersVI Consolidation and Grades of BerylliumVII Mechanical Properties of Beryllium and the Factors Affecting these PropertiesVIII Mechanical Working, and Forming, and ReductionIX JoiningX MachiningXI Health AspectsXII Examples of Production of ComponentsXIII Corrosion and Corrosion Protection of Beryllium
These reports will be combined as a handbook on beryllium. In the handbook, the subject of this report, “Atomic, Crystal, Elastic, Thermal, Nuclear, and other Properties of Beryllium” is identified as Section II with the prefix II being maintained for the sub-sections, figures, and tables. Accordingly, the same identification system is also used in this report. To date, in addition to this report, the reports on “Mechanical Properties of Beryllium and the Factors Affecting these Properties,” “Consolidation and Grades of Beryllium,” “Corrosion and Corrosion Protection of Beryllium,” and “Joining of Beryllium” have been published. The second report (VI) includes room-temperature mechanical properties of the different beryllium grades.
The present report is divided into five sub-sections: Atomic/Crystal Structure, Elastic Properties, Thermal Properties, Nuclear Properties, and Miscellaneous Properties. In searching through different sources for the various properties to be included in this report, inconsistencies were at times observed between these sources. In such cases, the values reported by the Handbook of Chemistry and Physics1
was usually used. In equations, except where indicated otherwise, temperature (T) is in degrees Kelvin.
II-1—Atomic/Crystal Structure
Beryllium normally exists in the close-packed hexagonal crystalline form, referred to as α-beryllium, in contrast to β-beryllium, the body-centered cubic form that is stable between 1250oC and its melting point of 1287oC. Some characteristics of beryllium related to the beryllium atom and crystal are listed in Table II-1-1. In the un-ionized state, beryllium has four electrons, 1s2 and 2s2. The orbital radii are 0.143 and 1.19 Å for the 1s and 2s electrons, respectively.2 The first and second ionization potentials are 9.320 and 18.206 eV. The valence is 2. The variation of the two lattice parameters (a- and c-axes)

4
of α-beryllium with temperature is given in Table II-1-2.2 Note that the c/a ratio decreases as the crystal (lattice) expands with increasing temperature.
A plot of the change in the crystal-lattice parameters with temperature is shown in Fig. II-1-1.
Table II-1-1. Atomic/Crystal Structure/Characteristic of Beryllium.1, 3-5
Atomic number 4Atomic radius 1.125 ÅAtomic volume 4.96 cm3/g-atomAtomic weight 9.01218 gDensity 1.8477 g/cm3 (Commercial grades in range of 1.82 to 1.85 g/cm3)Electronic structure 1s22s2
Crystal structure < 1250oC Hexagonal close-packed (α Be)
Crystal structure > 1250oC Body-centered cubic (β Be)Lattice constants a = 2.286 Å; c = 3.583 Å; c/a = 1.568; ideal = 1.633
The density of beryllium between room temperature and1227°C is given by the following expression:6 (g/cm3) = 1.823 - 6.933 x 10⁻⁵T - 1.513 x 10⁻⁸T2 (T in oC)
Fig. II-1-1. The effect of temperature on the lattice parameters of beryllium.7

5
Table II-1-2. Variation of Lattice Parameterswith Temperature.2
oC a-axis c-axis c/a50 2.287 3.585 1.5679
100 2.288 3.587 1.5676200 2.292 3.591 1.5670300 2.296 3.596 1.5664400 2.300 3.601 1.5658500 2.304 3.607 1.5652600 2.309 3.613 1.5646800 2.319 3.625 1.56331000 2.330 3.639 1.5620
II-2—Elastic Properties
The elastic properties can be given either as a tensorial (matrix) representation or in terms of engineering constants. The elastic properties in the tensorial representation are defined by the stiffness (cij) and compliance (sij) matrices and individually referred to as elastic constants. The engineering elastic constants are Young’s modulus (E), shear modulus (G), Poisson’s ratio (ν), bulk modulus (β), and compressibility (κ). Some variability is reported in elastic properties values, especially for Poisson’s ratio. This can be attributed to the anisotropy of beryllium. Because of the anisotropic crystalline properties of the hexagonal beryllium crystal and the preferred orientation (texture) of the polycrystalline material, these properties should be related to the corresponding crystallographic axis. Unfortunately, this is not always done. The elastic properties at room temperature are listed in Table II-2-1.
Table II-2-1. Elastic Properties of Beryllium at Room Temperature.1, 4, 5, 8
Elastic constants (1011 Pa) c11 = 2.923; c12=0.267; c13 = 0.140; c33 = 3.364; c44 =1.625Young’ modulus 3.03 x 10⁵ Mpa [(2.87-3.21)105 Mpa]Shear modulus 1.35 x 10⁵ MpaBulk modulus 1.10 x 10⁵ MpaPoisson’s ratio 0.01 to 0.08Isothermal compressibility 0.0883 x 10⁻¹⁰ m2/Na
Adiabatic compressibility 0.103 x 10⁻¹⁰ m2/NaStress/(change in volume)/(unit volume) = stress
Young’s modulus as a function of crystallographic orientation for a single crystal of beryllium is shown in Fig. II-2-1.8 Young’s modulus as a function of temperature for various grades of beryllium is shown in Fig. II-2-26 and that for two hot-pressed beryllium grades, S-200E and S-65B are shown in Fig. II-2-3.9 At room temperature, Young’s modulus is unaffected by strain rate. Above about 425°C (797°F), it increases with increasing strain rate. This is illustrated in Fig. II-2-4, which also includes the change in dynamic modulus with temperature.8 The differences between the static and dynamic values are explained in terms of thermodynamics involving the difference between specific heats at

6
constant pressure and at constant volume as well as being attributed to creep at the elevated temperatures. The dynamic Young’s modulus of elasticity of beryllium for two different orientations as a function of temperature is shown in Fig. II-2-5.8 The change in modulus with temperature below 25°C is shown in Fig. II-2-6.8 The grades and histories of the metals for Figs. II-2-5 and II-2-6 were not given.a
Fig. II-2-1. Young’s modulus of a single crystal of beryllium as a function of the crystallographic orientation in a plane normal to the basal plane.8
Fig. 2-2. Young’s modulus of various grades of beryllium as a function of temperature: a) pressure sintered, b) cast and cross rolled, c) cast and extruded, d) powder metallurgy and extruded, e) pressure sintered (1 wt.% BeO).6
a Reference 8 is a report consisting of an extensive review of elastic properties; it does not include any original work. Inconsistencies between different figures may be due, at least to some extent, to results from different investigators.

7
Fig. II-2-3. Young’s modulus as a function of temperature for smooth-bar specimens from VHP blocks of S-65B and S-200E beryllium. Included are results of a competing graphite product.9
Fig. II-2-4. Comparison of dynamic modulus with static modulus of QMV Beryllium between room temperature and 1500°F (815°C). 8

8
Fig. II-2-5. Dynamic Young’s modulus between room temperature and 1200°F (649°C) for two different orientations of a beryllium sample. 8
Fig. II-2-6. Dynamic Young’s modulus as a function of temperature below 300K (27oC).8
Precision elastic limit (P. E. L.), 0.01% offset yield strength, and Young’s modulus for the S-200F material are listed in Table II-2-2. The P. E. L. determination followed the MAB specification
9
method.I Young’s modulus was obtained according to ASTM E-111. The P. E. L. is the stress required to produce a permanent strain of 10-6; it is also known as the microyield stress.
Table II-2-2. Tensile Elastic Limits and Yield Strength at Room Temperature for VHP S-200F Beryllium.10
Orientation P. E. L.,MPa
Yield strength,0.01% offset, MPa
Young’s modulus,GPa
Longitudinal 32.4 190 3.11 ± .07Transverse 34.5 203 3.10 ± .05
The elastic properties are affected by porosity. Young’s modulus (E) for a wide variety of as-fabricated beryllium, containing less than 0.3 volume fraction of porosity and at temperatures below1000oC, can be represented to within ± 15% by:
E (MPa) = 3.00 x 10⁵ e-4.574p[1-2.016 x 10⁻⁴(T-293)],
where p is the volume fraction of porosity and T is the temperature in degrees K.11 The ultimate tensile strength for VHP S-200 beryllium can similarly be represented to within ±10% by:
UTS (MPa) = 324 e-4.733p[1-1.925 x 10⁻⁴(T-293)-1.750 x 10⁻⁶
(T-293)2+9.198 x 10⁻¹⁰(T-293)3].
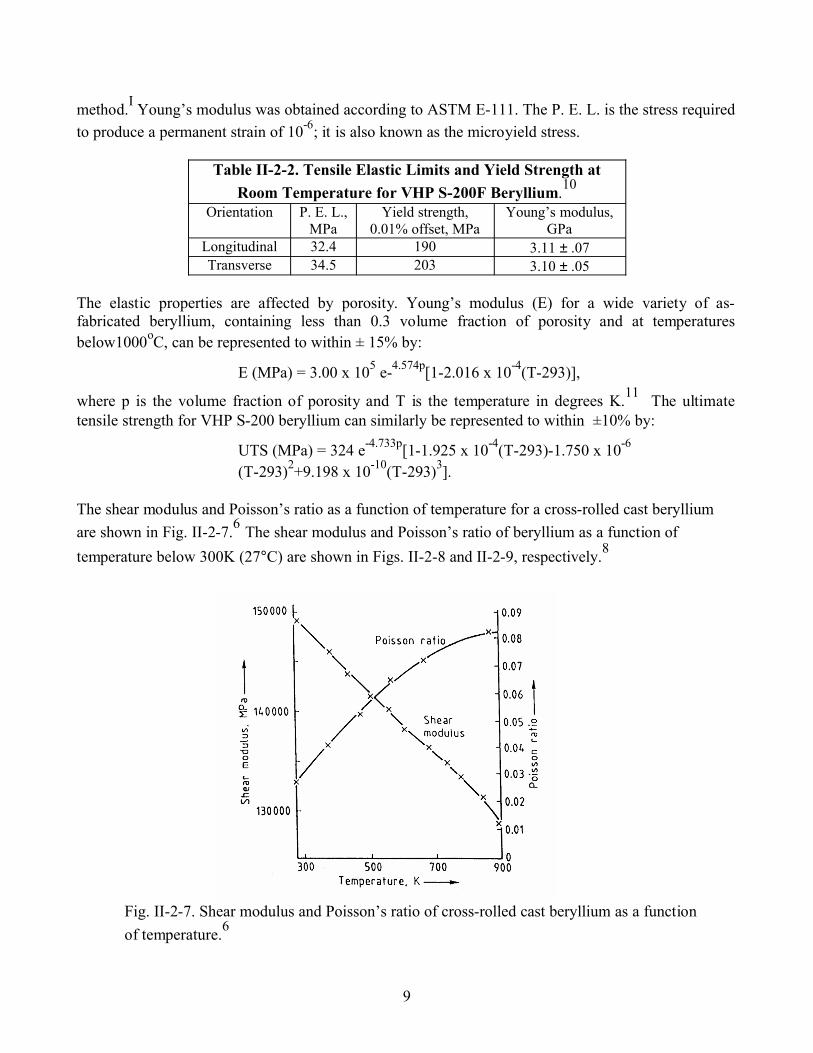
The shear modulus and Poisson’s ratio as a function of temperature for a cross-rolled cast beryllium are shown in Fig. II-2-7.6 The shear modulus and Poisson’s ratio of beryllium as a function of temperature below 300K (27°C) are shown in Figs. II-2-8 and II-2-9, respectively.8
Fig. II-2-7. Shear modulus and Poisson’s ratio of cross-rolled cast beryllium as a function of temperature.6

10
Inconsistencies can be seen between the values at 300K in Fig. II-2-7 compared to those in Figs. II-2-8and II-2-9, namely, 148 GPa versus 141 GPa for the shear modulus and 0.027 versus 0.01 for Poisson’s ratio. Such differences are probably due to material composition, processing history, and sample orientation. The room-temperature shear properties for VHP S-200F reported for torsion tests are listed in Table II-2-3.10 The shear values close to 300 K are given as 134 GPa.
Fig. II-2-8. Shear modulus for beryllium between 0 and 300K.8
Fig. II-2-9. Poisson’s ratio for beryllium between 0 K and 300 K.9

11
A number of elastic properties reported for VHP S-200E are listed in TableII-2-4.12 Tests were performed in the pressing direction and in two orthogonal directions perpendicular to the pressing direction. The measured values indicated that there was little anisotropy in the pressed
Table II-2-3. Shear Properties of VHP S-200F Obtained from Torsion Tests at Room
Temperature.10
Orientation Shear modulus,GPa
Shear rupturemodulus, MPa
Longitudinal. 134 ± 5 297 ± 12Transverse 134 ± 3 309 ± 8
beryllium; however, the calculated values (Lamé’s parametera and Poisson’s ratio) showed significant differences. The elastic stiffness constants from six different published sources were compared to illustrate the variable results obtained for beryllium.12 These data are tabulated in Table II-2-5. Table II-2-6 compares results obtained for compliance constants from four published sources. Table II-2-7 lists Poisson’s-ratio values calculated for six different compliance directions.
Table II-2-4 Elastic Properties of VHP S-200E Beryllium.8
Property Pressing direction (Z)
Average of transverse(X & Y) directions
Dilatational wave velocity, mm/µsec 12.84 ± 0.04 12.57 ± 0.1Shear-wave velocity, mm/µsec 8.86 ± 0.04 8.82 ± 0.1
Shear modulus, MPa 1.453 x 10⁵ 1.440 x 10⁵
Bulk modulus, MPa 1.114 x 10⁵ 1.005 x 10⁵
Young’s modulus, MPa 3.038 x 10⁵ 2.923 x 10⁵
Lamé’s parameter 145.6 44.8Poisson’s ratio 0.046 0.015
Fig. II-2-10 shows the shear modulus as a function of temperature calculated from experimental data of Young’s modulus for three different values of Poison’s ratio.8 Averaging published data from 14 different sources, gave a value of 0.0476, which was suggested as the most probable value for Poisson’s ratio. The shear modulus as a function of temperature for three different values of Poisson’s ratio is shown in Fig. II-2-11. The compressibility, which is the reciprocal of the bulk modulus, is shown in Fig. II-2-12 as a function of temperature.8
Assuming isotropic properties, the shear modulus (G) can be calculated from Young’s modulus (E) and Poison’s ratio (ν ) using the relationship:
E = 2G (1 + ν).
a Lamé’s parameter, λ, is defined as: λ = νE/(1+ν)(1-2ν), where ν is Poisson’s ratio.

12
Table II-2-5. Beryllium Stiffness Constants at RoomTemperature Reported by Six Different Sources.8 (1010 Pa)
C11 C12 C13 C33 C44 C6629.23 2.67 1.40 33.64 16.25 13.2830.8 -5.8 8.7 35.7 1.0 17.5
29.54 2.59 -0.10 35.61 17.06 13.4830.87 2.16 1.05 34.25 15.54 14.0429.39 2.69 1.4 33.78 16.33 13.3529.2 2.4 0.6 34.9 16.3 13.4
29.65 2.50 0.87 34.44 16.30 13.51The bottom row consists of averages (of five rows) excluding thesecond row. The author excluded this row since its values differed
considerably from the other reported values. C66 is calculated by: C66 = 1/2 (C11 – C12); C66 is calculated by: C66 = 1/2 (C11 – C12).
Table II-2-6. Beryllium Compliance Constants at Room Temperature Reported byFour Different Sources.8 (10-11 Pa-1)
S11 S12 S13 S33 S44 S660.341 -0.0299 0.001 0.2808 0.5862 0.74200.35 -0.03 -0.01 0.30 0.61 0.760.326 -0.023 -0.009 0.292 0.644 0.712
0.345 -0.028 -0.005 0.287 0.616 0.7460.341 -0.0.028 -0.006 0.290 0.614 0.740
The bottom row consists of averages of the prior four rows. S66 is calculated by: S66 = 2 (S11 – S12).
Table II-2-7. Poisson’s Ratio (ν) for Different Directions in Beryllium Single Crystals.8
ν12 = E100 x S12 = 0.07 ν31 = E001 x S13 = 0.03ν21 = E101 x S12 = 0.07 ν23 = E010 x S23 = 0.03ν13 = E100 x S13 = 0.03 ν32 = E001 x S23 = 0.03

13
Fig. II-2-10. Shear modulus as a function of temperature calculated from experimental Young’s-modulus values for different values of Poisson’s ratio.8
Fig. II-2-11. Shear modulus of beryllium as a function of temperature for three different values of Poisson’s ratio.8

14
Fig. II-2-12. Typical compressibility curves for beryllium as a function of temperature.8
II-3—Thermal Properties
Some room-temperature thermal properties of beryllium are listed in Table II-3-1. Results of several thermal-property measurements of grade S-65-B beryllium are listed in Table II-3-2.9
The mean coefficient of thermal expansion from room temperature to 900oC is shown in Fig. II-3-1.13
The average coefficient of thermal-expansion values for VHP S-200E and S-200F over the range of 5 to 65oC (278 to 338 K) for the longitudinal and two transverse directions are listed in Table II-3-3.10
The author points out that measurements were made on only one sample of each material.10 Table II-3-4 lists the change in length relative to the length at 20oC and the coefficient of thermal expansion over a range of temperatures from -268 to -27oC (5 to 300 K) for HIP beryllium. The specimens were manufactured by Brush Wellman from material designated as “0-50 HIP.” Average coefficients of thermal expansion of beryllium over temperature ranges from 25 to 100oC up to 25 to 1000oC are listed in Table II-3-5.4 The coefficients of thermal expansion of beryllium single crystals at low temperatures, perpendicular and parallel to the c-axis, are reported in Table II-3-6.2, 14

15
Table II-3-1. Some Room-Temperature Thermal Properties of Beryllium. 1, 3-5, 15
Melting point 1287°CLatent heat of fusion 1.89 (1.89 to 2.92) kcal/g-atom
Boiling point (760Torr) 2471°CHeat of sublimation 75.56 (75.5 to 78.8) kcal/g-atomHeat of evaporation 53.55 (53.5-74.1) kcal/g-atom
Specific heat (25°C, constant pressure) 3.92 cal/g-atom/οCEnthalpy at 25°C 465 cal/g-atom
Heat of transformation (α to β) 1.80 cal/g-atomEntropy (25oC) 2.28 cal/g-atom
Thermal conductivity 216 W/m/οCThermal diffusivity (room temperature) 0.18 m2/h
Temperature coefficient of linear expansion 11.3 x 10⁻⁶/οC (0-50οC)Temperature coefficient of resistivity 0.025 ∆ρ/ρo/oC
Contraction on solidification 3%
Table II-3-2. Some Thermal-Property Measurements of Grade S-65-BBeryllium covering a Range of Temperatures.9
Temperature,oC (K)
Thermalconductivity,
W/cmoC
Heatcapacity,cal/goC
Thermaldiffusivity,
cm2/s
Density,g/cm3
51 (324K) 1.873 0.455 0.540 1.820139 (412K) 1.523 0.535 0.376 1.814183 (456K) 1.438 0.560 0.339 1.808242 (415K) 1.338 0.583 0.304 1.806291 (564K) 1.288 0.604 0.283 1.801336 (609K) 1.252 0.624 0.267 1.797400 (673K) 1.166 0.637 0.244 1.791464 (737K) 1.104 0.653 0.225 1.785543 (816K) 1.018 0.664 0.206 1.777619 (892K) 0.961 0.683 0.190 1.769700 (973K) 0.884 0.702 0.171 1.760854 (1127K) 0.758a 0.737a 0.141 1.742
996 (1269K) 0.638a 0.769a 0.115 1.725a Extrapolated value

16
Fig. II-3-1. Mean coefficient of thermal expansion from room temperature to indicated temperature of normal-purity beryllium block and sheet.13
Table II-3-3 Average Coefficient of Thermal Expansion (α) for Vacuum-HotPressed
S-200E and S-200F from 5 to 65oC.10
DirectionS-200E
α (10-6/oC)S-200F
α (10-6/oC)Longitudinal 11.39 11.39Transverse-1 11.57 11.76Transverse-2 11.45 11.82

17
Table II-3-4. Coefficient of Thermal Expansion (α) and Length Change Relative to 293.16 K for HIP Beryllium Metal16
T(oK)
α(K–1)
∆L/L293
(10–6)T
(K)α
(K–1)∆L/L29
3(10–6)
0 0.00 –1298 110 1.77 x 10⁻⁶ –12545 3.16 x 10⁻¹⁰ –1298 120 2.27 –1234
10 9.60 –1298 130 2.82 –120915 2.31 x 10⁻⁹ –1298 140 3.41 –117820 4.83 –1298 150 4.01 –114025 9.14 –1298 160 4.62 –109730 1.61 x 10⁻⁸ –1298 170 5.24 –104835 4.83 –1298 180 5.84 –99340 4.24 –1298 190 6.43 -93145 6.48 –1298 200 7.00 –86450 9.61 –1297 210 7.54 –79155 1.38 x 10⁻⁷ –1297 220 8.07 –71360 1.94 –1296 230 8.57 –63065 2.66 –1295 240 9.04 –54270 3.56 –1293 250 9.50 –44975 4.67 –1292 260 9.94 –35280 5.99 –1289 270 1.04 x 10⁻⁵ –25185 7.52 –1286 273.16 1.05 –21890 9.26 –1281 280 1.08 –14595 1.12 x 10⁻⁶ –1276 290 1.11 –35100 1.32 –1270 293.16 1.13 0105 1.54 -1263 300 1.15 +78
Table. II-3-5. Average Coefficients of Thermal Expansion of Beryllium for Several Ranges of
Temperature. 4
Temperature range, oC
Average coefficient of expansion (10-6)
25 to 100 11.625 to 300 14.525 to 600 16.525 to 1000 18.4
Low-temperature results of the thermal expansion relative to 300 K and the coefficient of thermal expansion are shown in Figs. II-3-2 and II-3-3, respectively, for VHP S-200F beryllium. Only one sample was used that had been machined, stress relieved at 788oC for one hour, final machined, etched to remove any machine damage, nickel plated, and finally polished to a 1/4-wavelength finish.17 The thermal expansion results reported for HIP’ed beryllium made using impact-ground powder is shown

18
in Fig. II-3-4. The process was evaluated in its use for large precision mirrors (space applications) where anisotropy cannot be tolerated.11
Table. II-3-6. Coefficients of Thermal Expansion of Beryllium Single Crystals at Low Temperatures.2, 14
Temp., oK Perpendicular toc-axis (10-6)
Parallel toc-axis (10-6)
Volume coefficient (10-6)
273 to 270 10.6 7.7 29.0265 to 260 10.2 7.3 27.6255 to 250 9.5 6.9 26.0250 to 245 9.2 6.7 25.1240 to 235 8.5 6.3 23.4230 to 225 7.9 5.9 21.7225 to 220 7.6 5.7 20.9220 to 215 7.3 5.5 20.1210 to 205 6.7 5.0 18.3200 to 195 6.1 4.6 16.9190 to 185 5.6 4.1 15.2180 to 175 5.0 3.6 13.5175 to 170 4.7 3.3 12.7165 to 160 4.1 2.7 10.9160 to 155 3.8 2.5 10.1150 to 145 3.2 1.9 8.3140 to 135 2.7 1.5 6.8130 to 125 2.1 1.0 5.3125 to 120 1.9 0.9 4.6115 to 110 1.3 0.5 3.2105 to 100 0.9 0.3 2.1100 to 95 0.7 0.2 1.695 to 90 0.6 0.1 1.385 to 80 0.4 --- 0.8
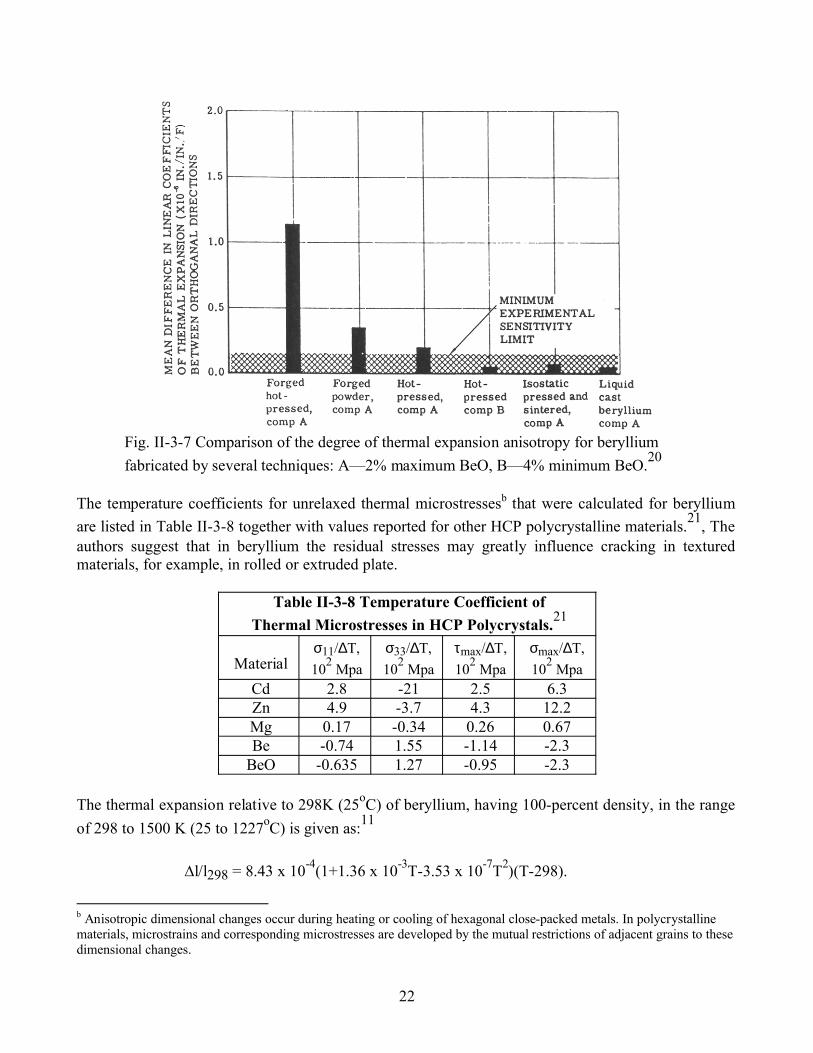
Figure II-3-5 compares the thermal linear expansion between a polycrystalline beryllium and that of a single beryllium crystal in directions parallel to the a-axis and c-axis, respectively. The curves are based on the equations shown in Table II-3-7.18 Figure II-3-6 shows expansion-versus temperature curves recommended for polycrystalline beryllium and single crystals of beryllium. The curves are based on data obtained from 38 sources.18 Figure II-3-7 compares the average degree of anisotropy of thermal expansion for beryllium of essentially constant chemical composition for a structural grade beryllium (indicated as “comp A”) produced by five different fabrication techniques.19 Also included is an instrument-grade hot-pressed beryllium having a high oxide content and a very fine grain size (indicated as “comp B”).20 The results are based on two specimens per material with 12 determinations on each specimens. The authors state that the thermal expansion results are consistent with the degree of preferred orientation that was observed.

19
Fig. II-3-2 Low temperature thermal expansion, ∆L/L300 K, for VHP S-200F relative to 300K (27oC).17
Fig. II-3-3 Coefficient of thermal expansion of beryllium versus temperature for VHP S-200F.17

20
Fig. II-3-4. Coefficient of thermal expansion of a beryllium cube in two orthogonal directions showing excellent isotropy. The cube was HIP’d beryllium using impact-ground powder.11
Fig. II-3-5. Thermal linear expansion relative to 293 K of polycrystalline beryllium and of a beryllium single-crystal parallel to the a-axis and c-axis, respectively.18

21
TABLE II-3-7 EQUATIONS for CURVES SHOWN in FIGURE II-3-518
Orientation/type
Thermal linear expansion, (L – L0)/L0 Temperature range, K
ll a-axisSingle crystal
1.242 x 10⁻³ (T-293) + 1.144 x 10⁻⁶ (T-293)2 –4.567 x 10⁻¹⁰ (T-293)3
293 to 895
ll a-axis Single crystal
1.063 + 2.123 x 10⁻³ (T-895) + 3.197 x 10⁻⁷
(T-895)2 –1.373 x 10⁻¹⁰ (T-895)3895 to 1500
ll c-axis Single crystal
9.881 x 10⁻⁴ (T-293) +5.475 x 10⁻⁷
(T-293)2 + 7.916 x 10⁻¹¹ (T-293)3293 to 895
ll c-axis Single crystal
0.809 +1.733 x 10⁻³ (T-895) + 6.904 x 10⁻⁷
(T-895)2 –1.519 x 10⁻¹⁰ (T-895)3895 to 1500
Polycrystalline 1.148 x 10⁻³ (T-293) +9.724 x 10⁻⁷
(T-293)2 – 2.978 x 10⁻¹⁰ (T-293)3293 to 895
Polycrystalline 0.978 +1.995 x 10⁻³ (T-895) + 4.346 x 10⁻⁷
(T-895)2 –1.307 x 10⁻¹⁰ (T-895)3895 to 1500
Fig. II-3-6 Recommended thermal linear expansion curves for beryllium based on a large number (38) of investigations. The vertical axes from left to right are for polycrystalline material and for single crystals parallel to a-axis and c-axis, respectively. Details on the temperature ranges, the materials evaluated, and the original references are presented in the current reference.18
22
Fig. II-3-7 Comparison of the degree of thermal expansion anisotropy for beryllium fabricated by several techniques: A—2% maximum BeO, B—4% minimum BeO.20
The temperature coefficients for unrelaxed thermal microstressesb that were calculated for beryllium are listed in Table II-3-8 together with values reported for other HCP polycrystalline materials.21, The authors suggest that in beryllium the residual stresses may greatly influence cracking in textured materials, for example, in rolled or extruded plate.
Table II-3-8 Temperature Coefficient of Thermal Microstresses in HCP Polycrystals.21
Materialσ11/∆T,102 Mpa
σ33/∆T,102 Mpa
τmax/∆T,102 Mpa
σmax/∆T,102 Mpa
Cd 2.8 -21 2.5 6.3Zn 4.9 -3.7 4.3 12.2Mg 0.17 -0.34 0.26 0.67Be -0.74 1.55 -1.14 -2.3
BeO -0.635 1.27 -0.95 -2.3
The thermal expansion relative to 298K (25oC) of beryllium, having 100-percent density, in the range of 298 to 1500 K (25 to 1227oC) is given as:11
∆l/l298 = 8.43 x 10⁻⁴(1+1.36 x 10⁻³T-3.53 x 10⁻⁷T2)(T-298).
b Anisotropic dimensional changes occur during heating or cooling of hexagonal close-packed metals. In polycrystalline materials, microstrains and corresponding microstresses are developed by the mutual restrictions of adjacent grains to these dimensional changes.

23
The mean coefficient of thermal expansion for a near-isotropic S-65B beryllium over the temperature range from 20 to 1200°C is given as:6
α (10-6K-1) = 11.0388 +1.0859 x 10⁻²T-4.4735x10⁻⁶T2 + 8.6305 x 10⁻¹⁰T3.
In both expressions, T is temperature in degrees K.
A study on thermal expansion and dimensional stability that was performed on several different beryllium histories showed that cast, hot-pressed, and isopressed forms were found to have nearly isotropic expansion properties. By contrast, the difference between anisotropic and isotropic thermal expansion ranged from 0.09 x 10⁻⁶/°C for hot-pressed beryllium to 2.07 x 10⁻⁶/°C for heavily forged beryllium. The average value for the hot-pressed material was 11.5 x 10⁻⁶/°C.20 For isotropic sintered blocks such as S-65, differences in thermal expansion in different directions are small (not more than a few percent); for heavily deformed grades differences in thermal expansion could exceed 20 percent.6
Both the specific heat and thermal conductivity of beryllium are claimed to be relatively insensitive to fabrication method, low levels of impurity, and, to a certain extent, radiation in a neutron environment above room temperature.6 Small levels of impurities and displacement damage have little effect on thermal conductivity.11 However, the presence of as-fabricated porosity and/or helium bubbles can cause a large reduction in the effective thermal conductivity. The following expression is claimed to be a relatively good fit to data of both vacuum-hot-pressed and foam (low-density) beryllium for porosities up to 50%:11
keff = (1-p)(1+3.7p2)-1ko,
where keff is the effective thermal conductivity, p is the volume fraction of porosity, and ko is the thermal conductivity for virtually zero porosity. Plasma-sprayed beryllium shows a significantly lower value than that predicted by this expression. The thermal conductivity of a normally dense beryllium over the temperature range from 27 t0 550oC is given as:11
ko =291(1-1.650x10⁻³T+1.464x10⁻⁶T2-5.125x10⁻¹⁰T3)W/m/οC
A number of expressions reported for the specific heat at constant pressure (Cp) of beryllium are presented here. The temperature range for the first expression was not given. The next two expressions cover the range between room temperature and 1283oC; the fourth between 327 and 1287oC; the fifth between 1287 and 1927oC (As previously indicated, throughout this report, except where noted, T refers to degrees K):
Cp = 4.54 + 2.12 x 10⁻³T - 0.82 x 10⁵T-2 cal/oC/g-atom,5
Cp = 5.238 + 13.378 x 10⁻⁴T -15.31 x 10⁴T-2 cal/oC/g-atom,11

24
Cp = 3.752 + 7.185 x 10⁻³T - 6.704 x 10⁻⁶T2 + 2.746 x 10⁻⁹T3 cal/oC/g-atom,6
Cp = 4.322 + 2.18 x 10⁻³T cal/oC/g-atom,2 and
Cp = 6.079 +5.138 x 10⁻⁴T cal/oC/g-atom.2
Fig. II-3-8. Specific heat of beryllium as a function of temperature. Results from two different sources. Dashed line is for a brake grade of normal-purity block.13
The specific heat as a function of temperature covering both solid and liquid beryllium is shown in Fig. II-3-8.13 A plot of specific heat as a function of temperature is also shown in Fig. II-3-9.7 The plot consists of data reported for nine different investigations and shows excellent agreement between these various studies. Some low-temperature results reported for specific heat and enthalpy are shown in Table II-3-9.2 Figures 1022 and 1123 show the specific heat as a function of temperature covering both solid and liquid regions, with the curve in Fig. 11 extending down below 40 K.

25
Fig. II-3-9 The specific heat of beryllium (per gram) as a function of temperature. 7
Fig. II-3-10. Specific heat of beryllium as a function of temperature from four different sources for both solid and liquid regions: Ο, —99.8% Be; ∆, σ—99.5% Be.22

26
The thermal conductivity as a function of temperature for several different sources of beryllium is shown in Figs. II-3-12 13 and II-3-13. 7 The thermal conductivity as a function of temperature of beryllium from six different sources plotted on the same graph is shown in Fig. II- 3-14.22 The thermal conductivity as a function of temperature for well annealed high-purity beryllium over a wide range of temperatures (2 to 1000 K) is shown in Fig. 15. A peak value in the conductivity is seen at about 35 K (-238OC).
Fig. II-3-11 The specific heat of beryllium covering a wide temperature range, from 40 K up to 2200 K: 1—0 to 300 K, 99.5% Be, high-temp. extrusion of powder; 2—600 to 2200 K, 99.8% Be, pulverized and tightly filled into ampoules; 3—323 to773 K, 99.8% Be, history not given.23
Thermal diffusivity (m2/h) as a function of temperature is shown in Fig. II- 3-16. The thermal diffusivity determines the rate of heat propagation by conduction. It can be calculated by the following expression:
α = λ/ρCp,

27
where α is the thermal diffusivity, λ is the thermal conductivity, ρ is the density, and Cp is the specific heat.13
Table II-3-9. Specific Heat and Enthalpy at Low Temperatures.2
Temp., ºK Cp,cal/g/ºK ∆H, cal/g Temp.,ºK Cp,cal/g/ºK ∆H, cal/g1 0.000006 0.000003 80 0.0217 0.4043 0.000019 0.000028 100 0.0476 1.086 0.000043 0.000119 140 0.125 4.42
10 0.000093 0.00038 180 0.220 11.320 0.00038 0.0025 220 0.308 21.940 0.00238 0.026 260 0.392 36.160 0.0081 0.125 300 0.471 53.3
Fig.II-3-12 Thermal conductivity of normal-purity beryllium block and sheet as a function of temperature.13
Fig. II-3-13. Thermal conductivity of several types of beryllium as a function of temperature.7

28
Fig. II-3-14. Thermal conductivity of beryllium as a function of temperature:—data from 322 to 672 K, listed as as-received condition with a density of 1.829 g/cm3; ∆—322 to 672 K, as previous plus heat treated to above 700 OC; ◊—322 to 672 K, listed as as-received condition with a density of 1.865 g/cm3; ∇—322 to 672 K, as previous plus heat treated to above 700 OC; Ο—273 to 875 K, no additional information; —273 to 875 K vacuum-cast and extruded pure Be; —273 to 875 K, flake, extruded pure Be.22

29
Fig. II-3-15. Thermal conductivity for well annealed high-purity beryllium showing a maximum in conductivity at about 360 K. Data is believed to be accurate to 5% near room temperature and from 5 to 15% at other temperatures.25
Fig. II-3-16 Thermal diffusivity of normal-purity block and instrument-grade block of beryllium.13
Thermal diffusivity as a function of temperature for well annealed high-purity beryllium is shown in Fig. II-3-17.24

30
Fig. II-3-17. Thermal diffusivity as a function of temperature for well annealed high-purity beryllium. Uncertainty of ± 15% above room temperature and ± 25% below, where values are only applicable to beryllium having a residual electrical resistivity of 0.0135 µΩ cm.24
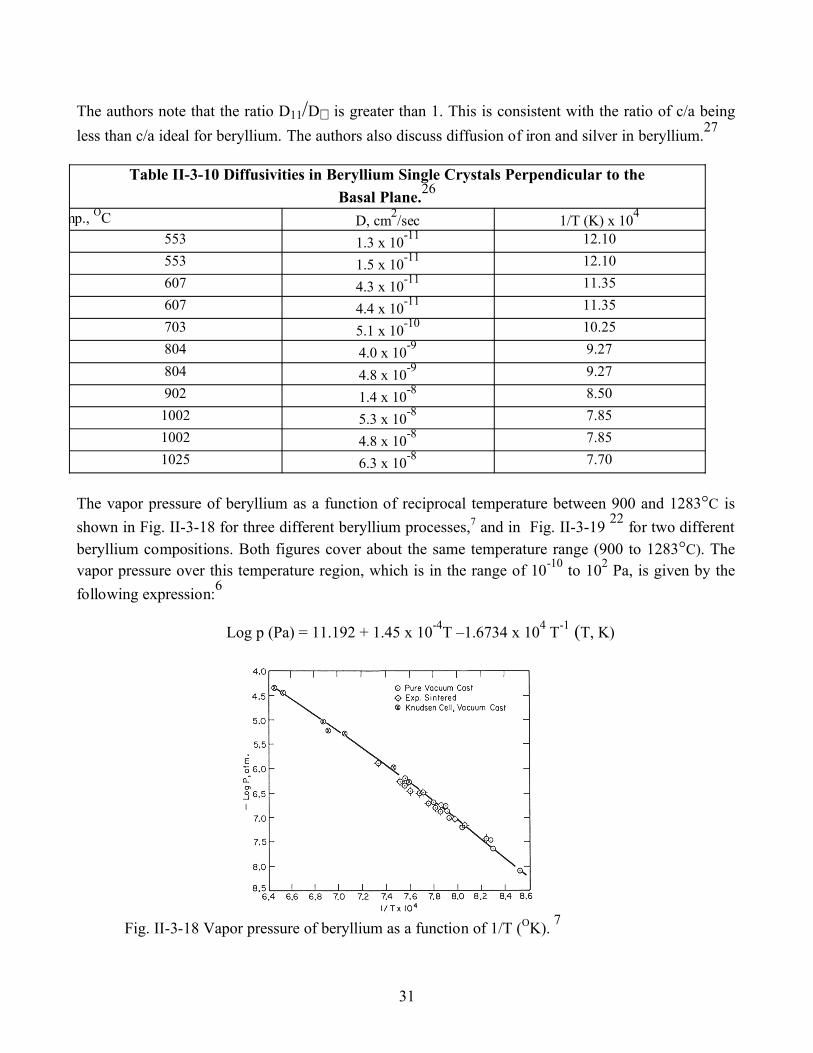
The self-diffusion in beryllium single crystals perpendicular to the basal plane over a series of temperatures are listed in Table II-3-10. A plot of D versus 1/RT yields a straight line with the following expression:26
D⊥ = 0.19 x exp (-38,600/RT),
where D⊥ is the self diffusion perpendicular to the basal plane. In a different investigation the expressions for self diffusion of beryllium perpendicular and parallel (D11) to the basal plane are given as:27
D⊥ = (0.62 ± 0.15) x exp [(-39,400 ± 700) /RT], and
D11 = (0.52 ± 0.15) x exp [(-37,600 ± 700) /RT].
31
The authors note that the ratio D11/D⊥ is greater than 1. This is consistent with the ratio of c/a being less than c/a ideal for beryllium. The authors also discuss diffusion of iron and silver in beryllium.27
Table II-3-10 Diffusivities in Beryllium Single Crystals Perpendicular to the Basal Plane.26
Temp., OC D, cm2/sec 1/T (K) x 104
553 1.3 x 10⁻¹¹ 12.10553 1.5 x 10⁻¹¹ 12.10607 4.3 x 10⁻¹¹ 11.35607 4.4 x 10⁻¹¹ 11.35703 5.1 x 10⁻¹⁰ 10.25804 4.0 x 10⁻⁹ 9.27804 4.8 x 10⁻⁹ 9.27902 1.4 x 10⁻⁸ 8.501002 5.3 x 10⁻⁸ 7.851002 4.8 x 10⁻⁸ 7.851025 6.3 x 10⁻⁸ 7.70
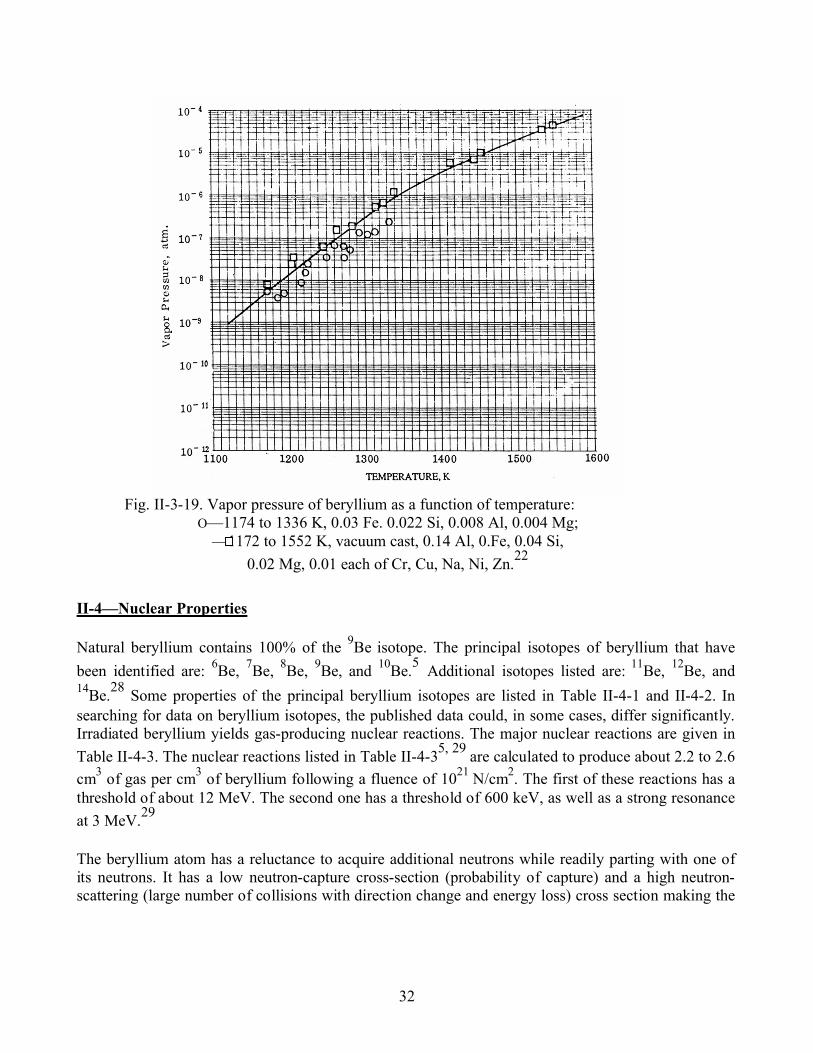
The vapor pressure of beryllium as a function of reciprocal temperature between 900 and 1283°C is shown in Fig. II-3-18 for three different beryllium processes,7 and in Fig. II-3-19 22 for two different beryllium compositions. Both figures cover about the same temperature range (900 to 1283°C). The vapor pressure over this temperature region, which is in the range of 10-10 to 102 Pa, is given by the following expression:6
Log p (Pa) = 11.192 + 1.45 x 10⁻⁴T –1.6734 x 10⁴ T-1 (T, K)
Fig. II-3-18 Vapor pressure of beryllium as a function of 1/T (OK). 7
32
Fig. II-3-19. Vapor pressure of beryllium as a function of temperature:O—1174 to 1336 K, 0.03 Fe. 0.022 Si, 0.008 Al, 0.004 Mg;
—1172 to 1552 K, vacuum cast, 0.14 Al, 0.Fe, 0.04 Si,0.02 Mg, 0.01 each of Cr, Cu, Na, Ni, Zn.22
II-4—Nuclear Properties
Natural beryllium contains 100% of the 9Be isotope. The principal isotopes of beryllium that have been identified are: 6Be, 7Be, 8Be, 9Be, and 10Be.5 Additional isotopes listed are: 11Be, 12Be, and 14Be.28 Some properties of the principal beryllium isotopes are listed in Table II-4-1 and II-4-2. In searching for data on beryllium isotopes, the published data could, in some cases, differ significantly. Irradiated beryllium yields gas-producing nuclear reactions. The major nuclear reactions are given in Table II-4-3. The nuclear reactions listed in Table II-4-35, 29 are calculated to produce about 2.2 to 2.6 cm3 of gas per cm3 of beryllium following a fluence of 1021 N/cm2. The first of these reactions has a threshold of about 12 MeV. The second one has a threshold of 600 keV, as well as a strong resonance at 3 MeV.29
The beryllium atom has a reluctance to acquire additional neutrons while readily parting with one of its neutrons. It has a low neutron-capture cross-section (probability of capture) and a high neutron-scattering (large number of collisions with direction change and energy loss) cross section making the

33
metal an excellent moderating material. Both of these cross-section areasc are dependent on the energy of the neutrons and the condition of the metal (e. g., impurities and grain size). The effect of impurities on the thermal neutron-capture (absorption) cross section is illustrated in Table II-4-4. 19 With these nuclear properties, beryllium is used as a neutron moderator in nuclear-chain reactions, as a source of neutrons, and as a window in X-ray tubes.
The (n, 2n) reaction with a high reaction cross-section, enables beryllium to function as a neutron multiplier. Beryllium is the leading neutron-multiplier candidate material for fusion applications. The combination of high neutron multiplication, low absorption, and high scattering characteristics provide excellent neutron thermalization. Therefore, beryllium can provide a high performance-breeding blanket for fusion systems.5 The absorption cross section for thermal neutrons is 0.008 barnsd; the scattering cross section for fast neutrons is 6 barns.28 The resonance integrale is 0.004 barns. The mass-absorption coefficient for copper K-alpha radiation is 1.007 cm2/g.4
The adsorption and desorption of deuterium have been measured on clean and on oxidized berylliumsurfaces corresponding to the basal plane. The oxidized surfaces released all the adsorbed deuterium by about 177oC. By contrast, for the clean surfaces, the desorption was not complete until the temperature was above 327oC. The electron-affinity energy (difference between the ground state of the neutral atom and the lowest state of the corresponding negative ion) is indicated as being unstable for beryllium.1
Irradiated beryllium exhibits an increase in yield strength with a loss in ductility and a decrease in fracture toughness. Nil ductility is obtained when tested below 100oC, whereas a small increase in yield strength with only a small decrease in ductility are obtained above 350oC. Although the fracture toughness decreases with an increase of neutron fluence, the trend reverses at high fluences. It is suggested that all the beryllium grades exhibit approximately the same fracture toughness response to irradiation. At the lower temperatures, the helium atoms remain in the matrix; at the higher temperatures, the atoms diffuse and agglomerate causing swelling. As the fluence increases, the temperature required to produce complete annealing appears to increase and the temperature to produce 1% swelling decreases.5.
c The neutron cross section measures the probability of interaction of a neutron with matter. The cross section is visualized as a target area presented to the neutron by the nucleus. It is usually measured in units of barns (10-24 m2 per atom). Absorption and scattering cross section refers to the capture and scattering of neutrons, respectively. The thermal-neutron absorption cross section is the sum of the cross sections of all reactions except that of the scattering cross section.d A “barn” is a unit of 10-24 m2/atom.e Narrow peaks (at exceptionally high rates of reaction) in a plot of cross section versus energy are referred to as resonances. The resonance integral is the integral of the cross section as a function of neutron energy multiplied by the flux density.

34
Table II-4-1 Some Properties of Beryllium IsotopesL30
Isotope Half-life Radiation, MeV Source6Be 0.4 s (3x10-21 s)
dn — —7Be 53.5 days γ 6Li (d, n)
0.453-0.485 7Li (p, n)10B (p, d)10B (p, α)
10B (d, α, n)8Be 1.4 x 10⁻¹⁶ seconds α 9Be (γ, n)
0.055 9Be (n, 2n)9Be Stable — —
10Be 2.7 X 10⁶ years β 9Be (α, p)0.56-0.65 9Be (d, p)
9Be (n, γ)10Be (n, p)13C (n, α)
Nuclear reactions of the stable isotope 9Be:Gamma-ray bombardment 9Be(γ, n)8BeNeutron bombardment 9Be(n, α)6He
9Be(n, γ)10Be 9Be(n, 2n)8Be
Table II-4-2 Some Additional Properties of Beryllium Isotopes1
Isotope Half life Thermal-neutroncross section,
barns
Resonance integral(RI), barns
Coherent scatterlength (fm)a
7Be 53.28 days σp = 3.9 x 10⁴ bb
σa = 0.1 bRIp = 1.75 x 10⁴ b
9Be stable 8.8 mb 3.9 mb 7.7910Be 1.52 x 10⁶years <1.0 mb
a (fm = 10-13 cm). bσp and σa proton and alpha production , respectively.
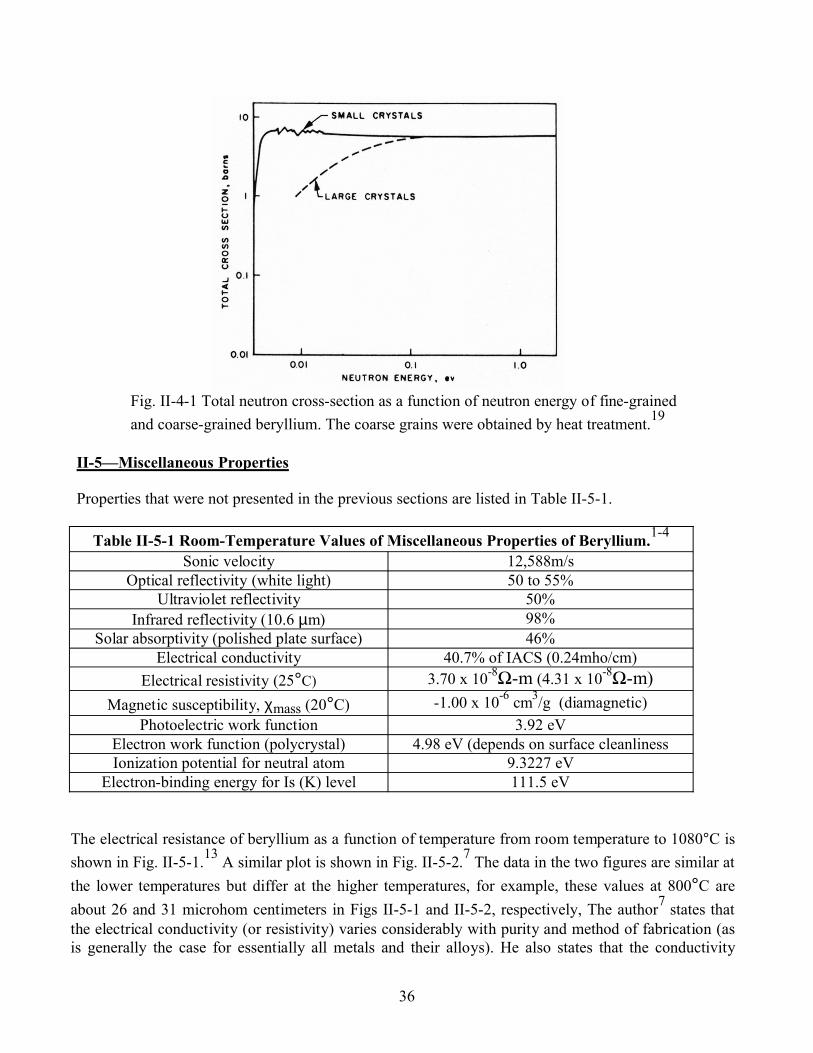
The total neutron cross section of beryllium is a function of neutron energy and the grain size. This is illustrated in Fig. II-4-1, which shows the much greater transparency of the coarser-grained material in the lower energy range.19 Apparently, there is no difference in the transparency at the higher energies. The figure depicts the behavior over the low-energy thermal range, where the neutrons are in thermal equilibrium with the moderator and where the cross section area increases with energy, and in the intermediate region, where the neutrons have been moderated but have not yet reached equilibrium. In the latter region, also known as the “slowing-down region”, the cross section changes little with energy. In this range, the neutrons have wavelengths

35
Table II-4-3 Irradiated beryllium yielding gas-producing nuclear
reactions5
Irradiation source
Reaction
Fast neutrons Be9 + nf → Li7 + H3
Be9 + nf → Be8 + 2nBe8 → 2He4
Be9 + nf → He6 + He4
B-He6 → Li6
Thermal neutrons Li6 + nt → H3 +He4
Table II-4-4 Effect of Various Impurities on the Thermal Neutron-Absorption Cross Section of Beryllium.19
Impurity Thermal neutron cross section, barns
Addition cross section to Be, mb
Boron 766 638Cobalt 37.0 5.7
Manganese 13.2 2.2Nickel 4.8 0.7
Iron 2.73 0.44Calcium 0.44 0.10
Aluminum 0.24 0.08Magnesium 0.07 0.03
comparable with the crystal lattice spacings and thus diffraction plays a role here with interactions occurring between incoming and scattered neutron wave fronts due to coherent scattering. For beryllium, a pronounced backward scattering occurs for neutrons having an energy of 0.00525 eV and a wave length of 3.96 Å, which is twice the longest lattice spacing of 1.98 Å for beryllium.31 In the “fast region” (above about 1 eV), where the neutrons are produced by fission, the cross section decreases significantly with increasing energy. Other reactions, which may be similarly discussed, are nuclear reactions produced by gamma rays, alpha particles, deuterons, and protons.31
36
Fig. II-4-1 Total neutron cross-section as a function of neutron energy of fine-grained and coarse-grained beryllium. The coarse grains were obtained by heat treatment.19
II-5—Miscellaneous Properties
Properties that were not presented in the previous sections are listed in Table II-5-1.
Table II-5-1 Room-Temperature Values of Miscellaneous Properties of Beryllium.1-4
Sonic velocity 12,588m/sOptical reflectivity (white light) 50 to 55%
Ultraviolet reflectivity 50%Infrared reflectivity (10.6 µm) 98%
Solar absorptivity (polished plate surface) 46%Electrical conductivity 40.7% of IACS (0.24mho/cm)
Electrical resistivity (25°C) 3.70 x 10⁻⁸Ω-m (4.31 x 10⁻⁸Ω-m)Magnetic susceptibility, χmass (20°C) -1.00 x 10⁻⁶ cm3/g (diamagnetic)
Photoelectric work function 3.92 eVElectron work function (polycrystal) 4.98 eV (depends on surface cleanlinessIonization potential for neutral atom 9.3227 eV
Electron-binding energy for Is (K) level 111.5 eV
The electrical resistance of beryllium as a function of temperature from room temperature to 1080°C is shown in Fig. II-5-1.13 A similar plot is shown in Fig. II-5-2.7 The data in the two figures are similar at the lower temperatures but differ at the higher temperatures, for example, these values at 800°C are about 26 and 31 microhom centimeters in Figs II-5-1 and II-5-2, respectively, The author7 states that the electrical conductivity (or resistivity) varies considerably with purity and method of fabrication (as is generally the case for essentially all metals and their alloys). He also states that the conductivity

37
values for beryllium range from 35 to 42% of the IACS values. Figure II-5-3 shows a significant spread in resistivity values of beryllium having various densities (1.823 to 1.865 g/cm3), impurity level, and processing levels.22
Table II-5-2 lists the electrical resistivities of polycrystalline beryllium over a range of temperatures from –263 to 673oC (10 to 900 K). Electrical resistivity measurements were reported on 4-mm beryllium rods, grades CR and CS (French). Billets were extruded into rods in the temperature range between 1000 and 1050°C and then annealed at 800°C producing a recrystallized structure with polygonization (substructure within the grains). The extruded rods had similar textures that were not “appreciably altered” by the anneal. Both as-swaged and swaged-and-annealed rods were evaluated at four temperatures. The results are shown in Table II-5-3.32 The author points out that the resistivity varies considerably with metallic impurity, and, the lower the temperature the greater is this variation.
Fig. II-5-1 Electrical resistivity as a function of temperature of normal-purityberyllium block.13

38
Fig. II-5-2 Effect of temperature on the resistivity of beryllium for two investigations.7
Fig. II-5-3 Electrical resistivity as a function of temperature of beryllium having various densities (1.823 to 1.865 g/cc), impurity levels, and processing histories.22

39
Table II-5-2 Electrical Resistivity of Polycrystalline Beryllium6
T, K
10-8
ΩmT, K
10-8
ΩmT, K 10-8
ΩmT, K
10-8
ΩmT, K 10-8
ΩmT, K
10-8
Ωm10 0.0332 60 0.067 150 0.510 293 3.56 400 6.76 700 16.520 0.0336 80 0.075 200 1.29 298 3.70 500 9.9 800 20.040 0.0367 100 0.133 273 3.02 300 3.76 600 13.2 900 23.7
Table II-5-3 Electrical Resistivity of Beryllium Rods at Different Temperatures.32
Rod history RodNo.
Grade BeO, %
Total metallic impurities
Grain size, µm
Resistivity, microhm-cm273°K 77.4°K 20.3°K 4.2°K
1 CR 0.9 0.18 10-80 3.92 1.09 1.03 1.032 CR 1.2 0.10 10-80 3.49 0.65 0.61 0.613 CR 0.1 0.08 30-200 3.28 0,55 0.51 0.51
As-extruded
4 SR 0.2 0.02 30-200 2.79 0.066 0.037 0.0371 CR 0.9 0.18 10-80 3.72 0.96 0.88 0.882 CR 1.2 0.10 10-80 3.17 0.41 0.37 0.373 CR 0.1 0.08 30-200 3.15 0.50 0.45 0.45
Extruded and
annealed4 SR 0.2 0.02 30-200 2.85 0.063 0.37 0.37
The electrical resistivity at room temperature and at 4.2 K and the residual resistance ratiosf for various purity levels of beryllium are listed in Table II-5-4. The purity level appears to have an appreciate affect on the resistance at 4.2 K, while only a minor affect at room temperature. Significant effects are seen for the relative resistance ratios [ΩRT/Ω4.2 (K)].
2 Different processing histories are also indicated in Table II-5-4
Table. II-5-4 Electrical Resistivity and Residual Resistance Ratios (Relative Resistance) for Various Purity Levels of Beryllium.2
Specimen history Resistivity, µΩ-cm, Room Temp.
Resistivity, µΩ-cm, 4.2 K
Relative resistance, ΩRT/Ω4.2 K
Commercial purity, rolled sheet, longitude
5.350 1.068 5.01
Commercial purity, rolled sheet, transverse
4.864 0.967 5.03
Commercial purity, hot pressed 5.543 1.167 4.75Intermediate purity, hot pressed 4.706 0.394 11.94High purity Pechiney SR,hot pressed
4.266 0.027 158
Vacuum-melted Pechiney flake, single distilled
—— —— 80 to 750
Vacuum-melted Pechiney flake, double distilled
—— —— 200 to 900
f The residual resistance ratio is the ratio of the resistance at room temperature to that at 4.2 K.

40
The electrical resistance as a function of pressure relative to the resistance at 10 GPa and 25°C is shown in Fig. II-5-4.33
Fig. II-5-4 Residual (relative) resistance, R/R10, of beryllium as a function of pressure taken during the second or third cycle (as indicated) while increasing pressure.33
The thermo-electric power of hot-pressed beryllium relative to copper as a function of temperature at low temperatures is shown in Fig. II-5-5. Curves for both parallel and perpendicular to the pressing direction are presented.2 The thermo-electric power of beryllium against platinum is given as 1.6 and 2.6 µV/oC for 99.96 and 99.78% purity, respectively. A straight-line increase from 8.2 µV/oC at 336oC to18 µV/oC at 800oC is reported for beryllium against platinum as shown in Fig. II-5-6.2, 7

41
Fig. II-5-5 The thermo-electric power of hot-pressed beryllium against copper: A—specimen axis parallel to pressing direction, B—specimen axis perpendicular to pressing direction.2
Fig. II-5-6 Thermoelectric power of beryllium against platinum as a function of temperature.7
The normal spectral reflectance at a series of wave lengths of anodized beryllium anodized by two different methods are listed in Table II-5-5.2 Figure II-5-7 is a plot of normal spectral reflectance of beryllium as a function of wave length using 0.625-mm-thick samples.22 The data reflects the use of three different hohlraum (target chamber) temperatures (523, 773, and 1273 K).

42
Table II-5-5 Normal Spectral Reflectance of Anodized Beryllium at a Series of Temperatures.2
Wavelength, µm Anodized in chromic acid Anodized in sodium hydroxide0.4 0.172 0.0750.6 0.179 0.0520.8 0.168 0.0581.0 0.165 0.682.0 0.280 0.2034.0 0.355 0.2866.0 0.335 0.5148.0 0.317 0.77210 0.560 0.77315 0.673 0.60620 0.494 0.899
Fig. II-5-7 Normal spectral reflectance of as-received, washed, unalloyed,0.635 mm-thick beryllium as a function of wave length :Ο—hohlraum (h) at 523 K, measuring temperature (mt) < 322 K, wavelength range (wr) 2.00 to 15.00 µm; —h at 773 K, mt < 322 K, wr 1.00 to 14.00 µm; ∆—h at 1273 K, mt < 322 K, wr 0.50 to 15.00 µm.22
43
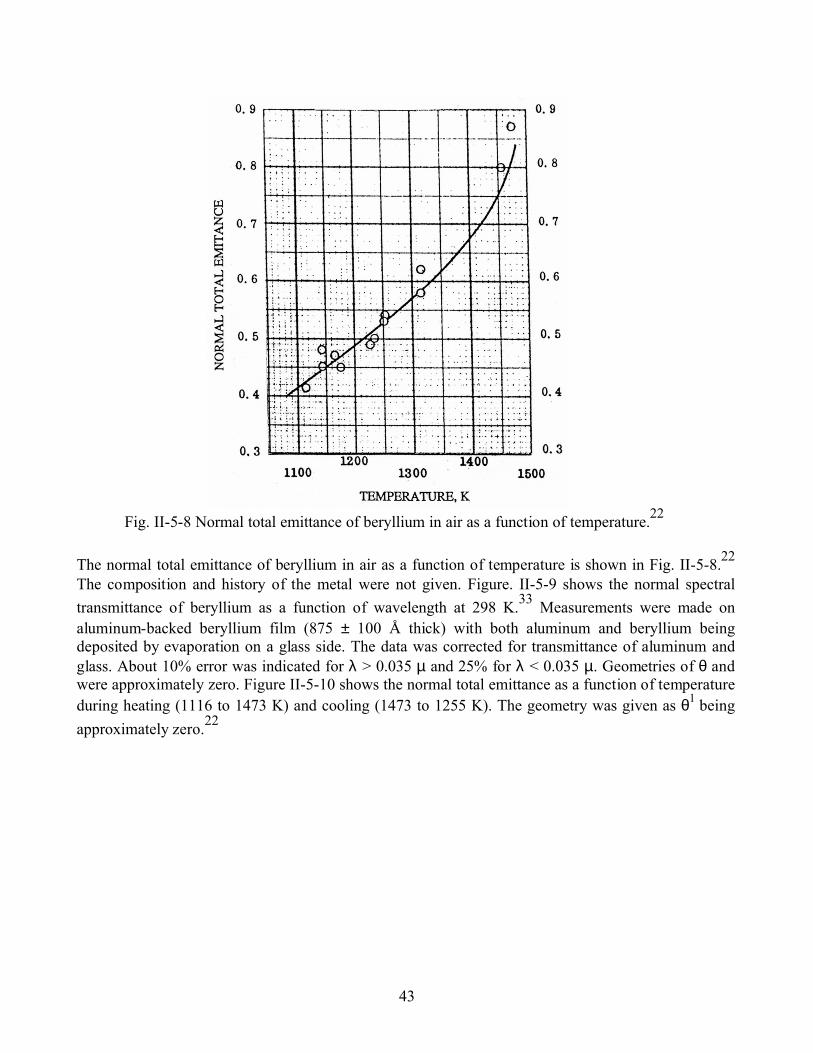
Fig. II-5-8 Normal total emittance of beryllium in air as a function of temperature.22
The normal total emittance of beryllium in air as a function of temperature is shown in Fig. II-5-8.22
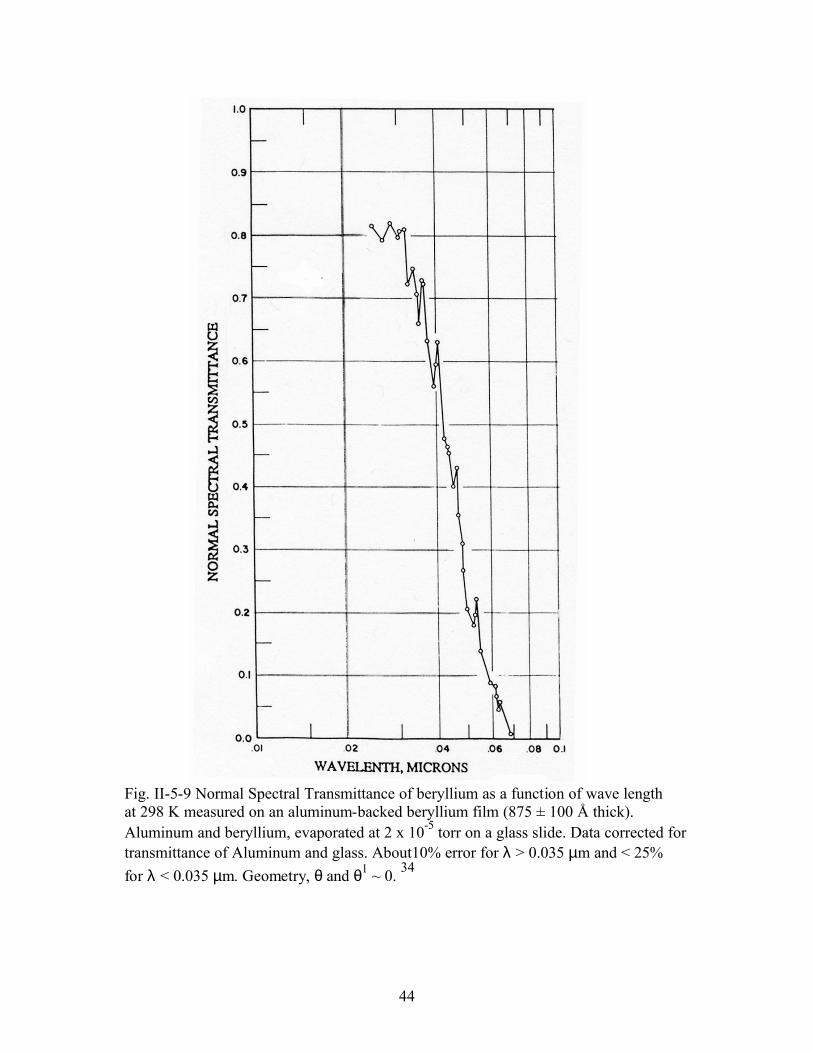
The composition and history of the metal were not given. Figure. II-5-9 shows the normal spectral transmittance of beryllium as a function of wavelength at 298 K.33 Measurements were made on aluminum-backed beryllium film (875 ± 100 Å thick) with both aluminum and beryllium being deposited by evaporation on a glass side. The data was corrected for transmittance of aluminum and glass. About 10% error was indicated for λ > 0.035 µ and 25% for λ < 0.035 µ. Geometries of θ and were approximately zero. Figure II-5-10 shows the normal total emittance as a function of temperature during heating (1116 to 1473 K) and cooling (1473 to 1255 K). The geometry was given as θ1 being approximately zero.22
44
Fig. II-5-9 Normal Spectral Transmittance of beryllium as a function of wave length at 298 K measured on an aluminum-backed beryllium film (875 ± 100 Å thick).Aluminum and beryllium, evaporated at 2 x 10⁻⁵ torr on a glass slide. Data corrected for transmittance of Aluminum and glass. About10% error for λ > 0.035 µm and < 25% for λ < 0.035 µm. Geometry, θ and θ1 ~ 0. 34

45
Fig. II-5-10 Normal total emittance of beryllium as a function of temperature: 1—heating (1116 to 1473 K); 2—cooling (1473 to 1255 K); geometry, θ1 ~ 0.22

46
References
1. Handbook of Chemistry and Physics, 84th Edition, CRC Publication, 2003-20042. A. J. Stonehouse etal., Physical Properties, in Beryllium: Its Metallurgy and Properties, Editor,
Henry H. Hauser, Publ. University of California Press, Berkeley, California, pp.191-205,19653. Beryllium and Beryllium Alloys, in Kirk-Othmer Encyclopedia of Chemical Technology, Publ.
John Wiley and Sons, Inc., 20024. Metals Handbook, Ninth Edition, vol. 2, Properties and Selection: Nonferrous Alloys and Pure
Metals. Publ., American Society of Metals, Metals Park, Ohio, 1979. Also Tenth Edition, vol. 2, Nonferrous Alloys and Special Purpose Materials, 1990
5. A. J. Stonehouse, Physics and Chemistry of Beryllium, J. Vac. Sci. Technol., vol. A4 (3), pp. 1163-1170, 1986
6. F. Scaffidi-Argentina et al., Beryllium R&D for Fusion Applications, Fusion Eng. and Design, vol 51-52, pp. 23-41, 2000
7. D. W. Lillie, The Physical and Mechanical Properties of Beryllium, , in The Metal Beryllium, Eds., D. W. White, Jr., and J. E. Burke, Publ. American Society for Metals, Cleveland, Ohio, pp. 304-327, 1965
8. D. H. Killpatrick, Elastic Properties of Beryllium, Internal Report, Logicon, (now Northrup Gruman), Albquerque, NM
9. M. F. Smith et al., Thermomechanical Testing of Beryllium for Limiters in ISX-B and JET, Fusion Technology, vol. 8, pp 174-1183, July, 1985
10. W. J. Haws, Characterization of Beryllium Structural GradeS-200F, TM-778 Report, Brush Wellman, May 27, 1985
11. M. C. Billone, Status of Beryllium Development for Fusion Applications, Fusion Engineering and Design, vol. 27, pp. 179-190, 1995
12. D. R. Christman and F. J. Feistmann, Dynamic Properties of S-200-E Beryllium, DNA 2785F-MSL 71-23 Report, Materials and Structures Laboratory, General Motors Technical Center, Warren, MI 48090, February, 1972
13. N. P. Pinto, Properties, in Beryllium Science and Technology, vol. 2, Eds. D. R. Floyd and J. N. Lowe, Plenum Publishing Corp., pp. 319-350,1979
14. W. Meyerhoff and J. F. Smith, Anisotropic Thermal Expansion of Single Crystals of Thalium, Yttrium, Beryllium, and Zinc at Low Temperatures, Journal of Applied Physics, vol. 33 (1), pp. 219-224, 1961
15. Chemical Properties Handbook, Ed., C. L. Yaws, Publ., McGraw-Hill, 199916. C. A. Swenson, Thermal Expansivity from 4 to 300 K and Heat Capacity from 1 to 108 K, J.
Appl. Phys., vol. 70, pp. 3046-3051, 199117. W. J. Haws, Thermal Expansion of S-200F Beryllium from 100 to 450 K, Brush Wellman
Report, TM-894, May, 1988

47
18 Thermophysical Properties of Matter, vol. 12, Thermal Expansion, Metallic Elements and Alloys, Eds. Y. S. Touloukian and R. K. Kirby, R. E. Taylor, and P. D. Desai, Publ., IFI/Plenum, New York, 1975
19. Henry H .Hauser, Nuclear Properties, in Beryllium: Its Metallurgy and Properties, Editor, Henry H. Hauser, Publ., University of California Press, Berkeley, California, pp. 234-239, 1965
20. C. G. Jennings et al., Dimensional Stability and Thermal Expansion Characteristics of Beryllium, in Beryllium Technology, vol. 1, Proceedings of the Second International Conference on Beryllium Technology, 1964 Conf. Co-Chairmen, L. McD. Schetky and H. A. Johnson, Gordon and Breach, Science Publishers, Inc, New York, 1966, pp. 467-478
21. R. W. Armstrong and N. R. Borch, Thermal Microstresses in Beryllium and other HCP Metals, UCRL-72915 Rev. 1 Preprint June 15, 1971. Also Met. Trans. vol 2, pp 3073-3077, 1971
22. Thermophysical Properties of High Temperature Solid Materials, vol. 1 Elements, Ed. Y. S. Touloukian, Publ., The Macmillian Company, New York, 197?
23. Thermophysical Properties of Matter, vol. 4, Specific Heat, Metallic Elements and Alloys, Eds. Y. S. Touloukian, and E. H. Buyco, Publ., IFI/Plenum, New York, 1970
24. Thermophysical Properties of Matter, vol. 10 Thermal Diffusivity, Eds. Y. S. Touloukian, R. W. Powell, C. Y. Ho, and M. C. Nicolaou, Publ., IFI/Plenum, New York, 1973
25. Thermophysical Properties of Matter, vol. 1, Thermal Conductivity, Metallic Elements and Alloys, Eds. Y. S. Touloukian, R. W. Powell, C. Y. Ho, and P. G. Klemenss, Publ., IFI/Plenum, New York, 1975
26. C. H. Lee, Self Diffusion in Beryllium Single Crystals, in Beryllium Technology, vol 1, Proceedings of the Second International Conference on Beryllium Technology, 1964 Conf. Co-Chairmen, L. McD. Schetky and H. A. Johnson, Publ., Gordon and Breach, Science Publishers, Inc, New York,, 1966, pp. 307-317
27. J. M. Dupouy etal., Self Diffusion and Diffusion of Foreign Atoms in Beryllium, in Beryllium Technology, vol. 1, Proceedings of the Second International Conference on Beryllium Technology, 1964 Conf. Co-Chairmen, L. McD. Schetky and H. A. Johnson, Gordon and Breach, Science Publishers, Inc, New York,, 1966, pp. 319-333
28. Chart of the Nuclides with Physical Constants, Conversion Factors and Period Table, 13th Edition, Publ. General Electric Company San Jose Ca, 95125, 1984
29. A. Khomutov et al., Beryllium for Fusion Application—Recent Results, J. Nucl. Mater., vol. 307-311, pp. 630-637, 2002
30. G. Petzow, et al., Beryllium and Beryllium Compounds, Table 1, in Ullmann’s Encyclopedia of Industrial Chemistry, Publ. Wiley-VCH Vertag GmbH, Weinheim, Germany, 2002
31. J. R. Stehn, The Nuclear Properties of Beryllium, in The Metal Beryllium, Eds., D. W. White, Jr., and J. E. Burke, Publ. American Society for Metals, Cleveland, Ohio, pp. 328-366, 1965
32. J. M. Logerot, Mechanical and Electrical Properties of Beryllium Wire, in Beryllium Technology, vol. 1, Proceedings of the Second International Conference on Beryllium Technology, 1964 Conf. Co-Chairmen, L. McD. Schetky and H. A. Johnson, Gordon and Breach, Science Publishers, Inc, New York, 1966, pp. 445-466

48
33. R. Reichlin, Measuring the Electrical Resistance of Metals to 40 GPa in the Diamond-Anvil Cell UCRL-88370 Preprint, Lawrence Livermore National Laboratory, Livermore, CA, June, 1983
34. Thermophysical Properties of Matter, vol. 7, Thermal Radiative Properties, Metallic Elements and Alloys, Eds. Y. S. Touloukian and D. P. DeWitt, IFI/Plenum, New y York, 1970


![3D-printed phononic crystal lens for elastic wave focusing ... · vibration energy harvesting methods [1–4]. Besides such standing waves, elastic energy in engineered structures](https://static.fdocuments.in/doc/165x107/5f419c8b816fbf313317cd5a/3d-printed-phononic-crystal-lens-for-elastic-wave-focusing-vibration-energy.jpg)


