Atomic absorption spectroscopy, History, atomization techniques, and instrumentation of AAS
43
ATOMIC ABSORPTION SPECTROSCOPY M Asif Shaheen Lecturer Department of Pathology KEMU Lahore [email protected] 1
-
Upload
muhammad-asif-shaheeen -
Category
Health & Medicine
-
view
326 -
download
6
Transcript of Atomic absorption spectroscopy, History, atomization techniques, and instrumentation of AAS

ATOMIC ABSORPTION SPECTROSCOPY
M Asif Shaheen
Lecturer
Department of Pathology
KEMU Lahore
1

Introduction
• It is very reliable and simple to use
• It can analyze over 62 elements
2
Atomic absorption spectroscopy is a
quantitative method of analysis of any kind of sample ; that is applicable to many metals

HISTORY
• The technique was introduced in 1955 by Alan Walsh in Australia ( 1916 – 1998 ).
• The first commercial atomic absorption spectrometer was introduced in 1959.
3
The application of atomic
absorption spectra to chemical
analysis

Principle
• The analyzed sample must contain the reduced metal in theatomic vaporized state. Commonly, this is done by using theheat of a flame to break the chemical bonds and form free,unexcited atoms.
• The sample, in solution, is aspirated as a spray into achamber, where it is mixed with air and fuel. This mixturepasses through baffles, here large drops fall and are drainedoff. Only fine droplets reach the flame.
• Light from the hollow-cathode lamp passes through thesample of ground-state atoms in the flame. The amount oflight absorbed is proportional to the concentration.
4

• When a ground-state atom absorbs light energy, an excitedatom is produced. The excited atom then returns to theground state, emitting light of the same energy as itabsorbed
• The flame sample thus contains a dynamic population ofground-state and excited atoms, both absorbing andemitting radiant energy. The emitted energy from the flamewill go in all directions, and it will be a steady emission
• Because the purpose of the instrument is to measure theamount of light absorbed, the light detector must be able todistinguish between the light beam emitted by the hollowcathode lamp and that emitted by excited atoms in theflame.
5

• To do this, the hollow-cathode light beam is modulated byinserting a mechanical rotating chopper between the lightand the flame or by pulsing the electric supply to the lamp
• Because the light beam being absorbed enters the sample inpulses, the transmitted light also will be in pulses. There willbe less light in the transmitted pulses because part of it willbe absorbed. There are, therefore, two light signals from theflame
• an alternating signal from the hollow-cathode lamp and
• a direct signal from the flame emission.
6


INSTRUMENTATION
Atomic Absorption
Spectrometer
Hollow cathode lamp
Detector
MonochromatorAtomizer
Nebulizer
8


LIGHT SOURCE
• Hollow Cathode Lamp are the most common radiation source in AAS.
• It contains a tungsten anode and a hollow cylindrical cathode made of the element to be determined.
• These are sealed in a glass tube filled with an inert gas (neon or argon ) .
• Each element has its own unique lamp which must be used for that analysis .
14

• When voltage is applied, the filler gas is ionized. Ionsattracted to the cathode collide with the metal, knock atomsoff, and cause the metal atoms to be excited.
• When they return to the ground state, light energy isemitted that is characteristic of the metal in the cathode.
• Generally, a separate lamp is required for each metal (e.g., acopper hollow-cathode lamp is used to measure Cu)
15

Hollow Cathode Lamp
16

Hollow Cathode Lamp for Aluminum (Al)
17

18

Sample Atomization Technique
Flame Atomization
Electro thermal Atomization
Hydride Atomization
Cold-Vapor Atomization
19
Atomization is separation of particles into individualmolecules and breaking molecules into atoms. Thisis done by exposing the analyte to hightemperatures in a flame or graphite furnace .
Atomization

Flame Atomization
• Nebulizer suck up liquid samples at controlled rate.
• Create a fine aerosol spray for introduction into flame.
• Mix the aerosol and fuel and oxidant thoroughly for introduction into flame.
• An aerosol is a colloid of fine solid particles or liquid droplets, in air or another gas.
20

Flame Atomization
sample
mist
Solid/gas aerosol
Gaseous molecules
Atoms
21
nebulization
disolvation
volatilization
dissociation
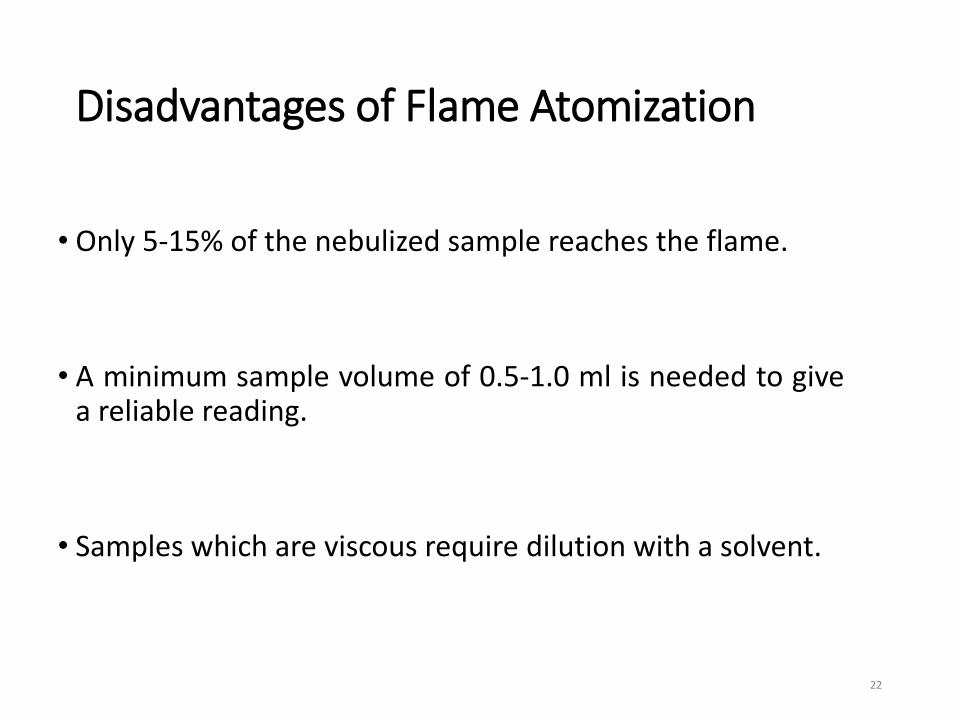
Disadvantages of Flame Atomization
• Only 5-15% of the nebulized sample reaches the flame.
• A minimum sample volume of 0.5-1.0 ml is needed to givea reliable reading.
• Samples which are viscous require dilution with a solvent.
22

Electro Thermal Atomization
• Uses a graphite coated furnace to vaporize the sample.
• ln GFAAS sample, samples are deposited in a smallgraphite coated tube which can then be heated to vaporizeand atomize the analyte.
• The graphite tubes are heated using a high current powersupply.
23

Graphite Furnace Technique
24

Advantages of Graphite Furnace Technique
• Small sample size
• Very little or no sample preparation is needed
• Sensitivity is enhanced
• Direct analysis of solid samples
25
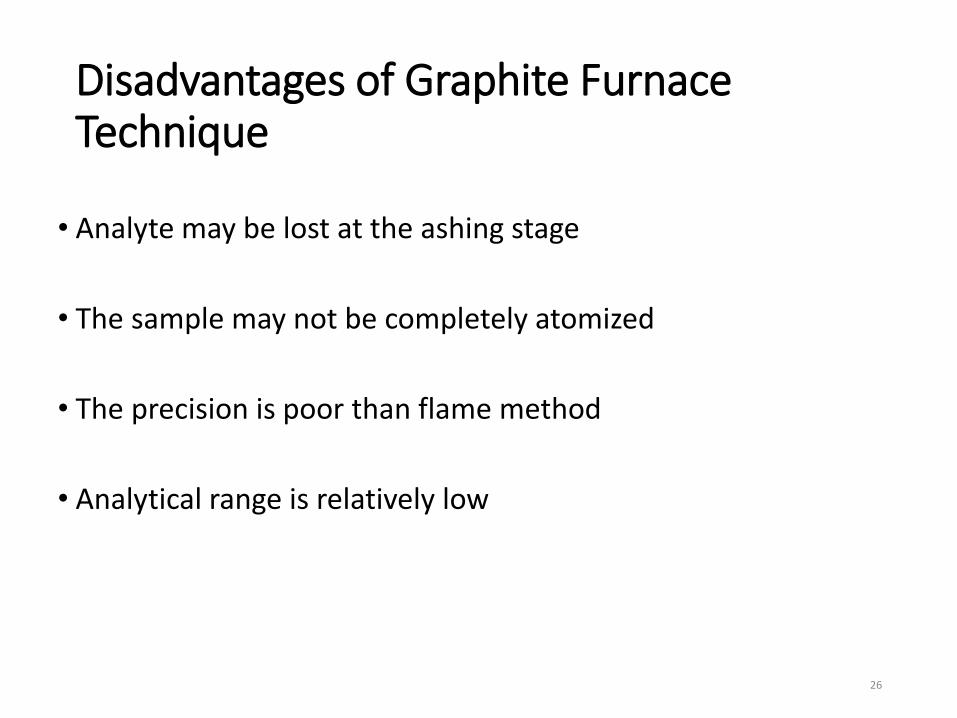
Disadvantages of Graphite Furnace Technique
• Analyte may be lost at the ashing stage
• The sample may not be completely atomized
• The precision is poor than flame method
• Analytical range is relatively low
26

Hydride generation AAS
• A type of AAS where metal samples are vaporized by converting them into volatile hydride.
•Hydride
•Any class of chemical compounds in which hydrogen is combined with another element.
•Three types
• Ionic
•Metallic
•Covalent
27

28
Hydride generation system
1.Pump
2.reactor
3,separator
1. Suck up (aspirate)
liquid sample at a
controlled rate
4. Flow that gaseous
hydride into the optical
cell
3. Create a volatile
hydride of the analyte
metalloid from that reaction
2. Mix liquid sample with
sodium borohydride
and HCl

MONOCHROMATOR
• This is a very important part in an AA spectrometer. It is usedto separate out all of the thousands of lines.
• A monochromator is used to select the specific wavelengthof light which is absorbed by the sample, and to excludeother wavelengths.
• The selection of the specific light allows the determinationof the selected element in the presence of others.
29

DIFFRACTION GRATING
30
the process by which a beam of light or other system of waves is spread out as a result of passing through a narrow aperture or across an edge, typically accompanied by interference between the wave forms produced

DETECTOR
• The light selected by the monochromator is directed onto adetector that is typically a photomultiplier tube , whosefunction is to convert the light signal into an electrical signalproportional to the light intensity.
• The processing of electrical signal is fulfilled by a signalamplifier . The signal could be displayed for readout , orfurther fed into a data station for printout by the requestedformat.
31

PHOTOMULTIPLIER
32

Calibration Curve
• A calibration curve is used to determine the unknownconcentration of an element in a solution.
• The instrument is calibrated using several solutions of knownconcentrations.
• The absorbance of each known solution is measured and then acalibration curve of concentration vs absorbance is plotted.
• The sample solution is fed into the instrument, and theabsorbance of the element in this solution is measured.
• The unknown concentration of the element is then calculatedfrom the calibration curve
33

Applications
1) Presence of metals as an impurity or in alloys could be done easily
2) Level of metals could be detected in tissue samples like Aluminum in blood and Copper in brain tissues
3) Due to wear and tear there are different sorts of metals which are given in the lubrication oils which could be determined for the analysis of conditions of machines
4) Determination of elements in the agricultural and food products
34

35

COMPARISON
ATOMIC EMISSION SPECTROSCOPY
• Examines the wavelengths of photons emitted by atoms or molecules during their transition from an excited state to a lower energy state.
• Each element emits a characteristic set of discrete wavelengths.
• By observing these wavelengths the elemental composition of the sample can be determined.
ATOMIC ABSORPTION SPECTROSCPY
• Measures the loss of electromagnetic energy after it illuminates the sample under study.
• The energy in certain amount is absorbed during transition to the higher level.
• The amount of energy absorbed gives estimate of the concentration of the analyte in the sample.

“Increase or decrease in the size of the signal obtained from the analyte as a result of the presence of some other known or unknown component in the sample”
Types of interference:
Spectral interference
Chemical interference

Spectral interference
This may be caused by direct overlap of the analytical line with the absorption line of the matrix element.
HOW TO OVERCOME ?
By choosing an alternate analytical wavelength
By removing the interfering element from the sample.

Examples of spectral interferences

40

Chemical interference
Formation of compound of low volatility
Decrease in calcium absorbance is observed
with increasing concentration of sulfate
or phosphate

By increasing flame temperature
Use of releasing agents (La 3+ )
Cations react with the interferent releasing the analyte
Use of protective agents:
They form stable but volatile compounds with analyte.

THANK YOU
43