Atomic Absorption Spectroscopy: Fundamentals...
24
1 Atomic Absorption Spectroscopy: Fundamentals and Applications in Medicine José Manuel González-López 1 , Elena María González-Romarís 2 , Isabel Idoate-Cervantes 3 and Jesús Fernando Escanero 4 1 Miguel Servet University Hospital, Clinical Biochemistry Service, Zaragoza 2 Galician Health Service, Clinical Laboratory, Santiago de Compostela 3 Navarra Hospital Complex, Clinical Laboratory, Pamplona 4 University of Zaragoza, Faculty of Medicine, Department of Pharmacology and Physiology, Zaragoza Spain 1. Introduction Spectroscopy measures and interprets phenomena of absorption, dispersion or emission of electromagnetic radiation that occur in atoms, molecules and other chemical species. Absorption or emission is related to the energy state changes of the interacting chemical species which characterise them, which is why spectroscopy may be used in qualitative and quantitative analysis. The application of spectroscopy to chemical analysis means considering electromagnetic radiation as being made up of discrete particles or quanta called photons which move at the speed of light. The energy of the photon is related to the wavelength and the frequency by Plank’s constant (h = 6.62 x 10 -34 J second) and the speed of light in a vacuum (c = 3 x 10 8 m/s) according to the following equation (Skoog et al., 2001): E = hǎ = hc/ nj The interaction of radiation with matter is produced throughout the electromagnetic spectrum which ranges from cosmic rays with wavelengths of 10 -9 nm to radio waves with lengths over 1000 Km. Between both extremes, and from the shortest upwards, can be found the following: gamma rays, X-rays, ultraviolet rays (far, mid and near), the visible portion of the spectrum, infrared rays and radio microwaves. All radiations are of the same nature and travel at the speed of light, being differentiated by the frequency, wavelength and the effects they produce on matter (Skoog et al., 2008). The Bouguer-Lambert-Beer Law is fundamental in molecular absorption spectrophotometry. According to this law, absorbance is directly proportional to the trajectory of the radiation through the solution and to the concentration of the sample producing the absorption although there are limitations to its application. The Law is only applied to monochromatic radiation although it has been demonstrated experimentally that the deviations with polychromatic light are unappreciable (Skoog & West, 1984). www.intechopen.com
Transcript of Atomic Absorption Spectroscopy: Fundamentals...
1
Atomic Absorption Spectroscopy: Fundamentals and Applications in Medicine
José Manuel González-López1, Elena María González-Romarís2, Isabel Idoate-Cervantes3 and Jesús Fernando Escanero4
1Miguel Servet University Hospital, Clinical Biochemistry Service, Zaragoza 2Galician Health Service, Clinical Laboratory, Santiago de Compostela
3Navarra Hospital Complex, Clinical Laboratory, Pamplona 4University of Zaragoza, Faculty of Medicine,
Department of Pharmacology and Physiology, Zaragoza Spain
1. Introduction
Spectroscopy measures and interprets phenomena of absorption, dispersion or emission of electromagnetic radiation that occur in atoms, molecules and other chemical species. Absorption or emission is related to the energy state changes of the interacting chemical species which characterise them, which is why spectroscopy may be used in qualitative and quantitative analysis.
The application of spectroscopy to chemical analysis means considering electromagnetic radiation as being made up of discrete particles or quanta called photons which move at the speed of light. The energy of the photon is related to the wavelength and the frequency by Plank’s constant (h = 6.62 x 10⁻³⁴ J second) and the speed of light in a vacuum (c = 3 x 10⁸
m/s) according to the following equation (Skoog et al., 2001):
E = h┥ = hc/ ┣
The interaction of radiation with matter is produced throughout the electromagnetic spectrum which ranges from cosmic rays with wavelengths of 10-9 nm to radio waves with lengths over 1000 Km. Between both extremes, and from the shortest upwards, can be found the following: gamma rays, X-rays, ultraviolet rays (far, mid and near), the visible portion of the spectrum, infrared rays and radio microwaves. All radiations are of the same nature and travel at the speed of light, being differentiated by the frequency, wavelength and the effects they produce on matter (Skoog et al., 2008).
The Bouguer-Lambert-Beer Law is fundamental in molecular absorption spectrophotometry. According to this law, absorbance is directly proportional to the trajectory of the radiation through the solution and to the concentration of the sample producing the absorption although there are limitations to its application. The Law is only applied to monochromatic radiation although it has been demonstrated experimentally that the deviations with polychromatic light are unappreciable (Skoog & West, 1984).
www.intechopen.com
Macro to Nano Spectroscopy
4
According to the Bouguer-Lambert-Beer Law:
A = abc
when b (trajectory of the radiation) is expressed in cm and c (concentration of the substance) in g.L-1, the units of a (absorptivity) are L.g-1.cm-1, or
A = ┝bc
when b is expressed in cm and c in mol.L-1, a (absorptivity) is called molar absorptivity and it is represented by the symbol ┝ and its units are L.mol-1.cm-1
The absorption of light (A) = log Po/P ( = Optical density or extinction)
where:
Po: Incident radiation P: Transmitted radiation Absorptivity, a, is A/bc (= Coefficient of extinction) Molar absorptivity, ┝, is A/bc (= Coefficient of molar extinction)
The Bouger-Lambert-Beer Law is fulfilled with limitations in molecular absorption spectrophotometry (Skoog et al., 2008).
In 1927, Werner Heisenberg proposed the principle of uncertainty, which has important and widespread implications for instrumental analysis. It is deduced from the principle of superposition, which establishes that, when two or more waves cross the same region of space, a displacement is produced equal to the sum of the displacements caused by the individual waves. This is applied to electromagnetic waves in which the displacements are the consequence of an electric field, as well as to various other types of waves in which atoms or molecules are displaced. The equation ∆t x ∆E = h, expresses the uncertainty principle, signifying that, for finite periods, the measurement of the energy of a particle or system of particles (photons, electrons, neutrons, protons) will never be more precise than h/∆t, in which h is the Planck´s constant. For this reason, the energy of a particle may be known as a zero uncertainty only if it is observed for an infinite period (Skoog et al., 2001).
In 1953, the Australian Physicist Alan Walsh laid the foundations and demonstrated that atomic absorption spectrophotometry could be used as a procedure of analysis in the laboratory (Willard et al., 1991). The theoretical background on which most of the work in this field was based is due almost entirely to this author (Elwell & Gidley, 1966).
1.1 Fundamentals
The spectra of atomic absorption of an element are made up of a series of lines of resonance from the fundamental state to different excited states. The transition between the fundamental state and the first excited state is known as the first line of resonance, being that of greatest absorption, and is the one used for analysis.
The wavelength of the first line of resonance of all metals and some metaloids is greater tan 200 nm, while for most non-metals it is lower than 185 nm. The analysis for these cases requires modifications of the optical systems which increases the cost of atomic absorption instruments.
www.intechopen.com
Atomic Absorption Spectroscopy: Fundamentals and Applications in Medicine
5
In atomic absorption spectrometry, no ordinary monochromator can give such a narrow band of radiation as the width of the peak of the line of atomic absorption. In these conditions the Beer Law is not followed and the sensitivity of the method is reduced. Walsh demonstrated that a hollow-cathode, made of the same material as the analyte, emits narrower lines than the corresponding lines of atomic absorption of the atoms of the analyte in flame, this being the base of the instruments of atomic absorption. The main disadvantage is the need for a different lamp source for each element to be analysed, but no alternative to this procedure improves the results obtained with individual lamps.
The energy source most frequently used in atomic absorption spectroscopy is the hollow-cathode lamp.
1.2 Types
The field of atomic absorption spectroscopy (AAS) includes: flame (FAAS) and electrothermal (EAAS or ETAAS) atomic absorption spectroscopy (Skoog et al., 2008). The base is the same in both cases: the energy put into the free atoms of the analyte makes its electrons change from their fundamental state to the excited state, the resulting absorbed radiation being detected. However the fundamental characteristic of the FAAS is the stage of atomization which is performed in the flame and which converts the analyte into free atoms, whereas in the EAAS the stage of atomization goes through successive phases of drying, calcination and carbonization, and it is not required to dissolve the sample in the convenient matrix as occurs with the FAAS (Skoog et al., 2008; Vercruysse, 1984).
1.2.1 Flame atomic absorption spectroscopy
Prior steps to the stage of atomization in flame are the treatment of the sample, dissolving it in a convenient matrix, and the stage of pneumatic nebulisation. In FAAS the stage of atomization is performed in flame. The temperature of the flame is determined by the fuel/oxidant coefficient. The optimum temperatures depend on the excitation and ionization potentials of the analyte.
The concentration of excited and non-excited atoms in the flame is determined by the fuel/oxidant coefficient and varies in the different regions of the flame (Willard et al., 1991).
1.2.2 Electrothermal atomic absorption spectroscopy
The electrothermal atomic absorption spectrophotometer has three part: the atomizing head, the power source and the controls for feeding in the inert gas. The atomizing head replaces the nebulising-burning part of the FAAS. The power source supplies the work current at the correct voltage of the atomizing head. The computer control of the atomizing chamber ensures reproducibility in the heating conditions, establishing a suitable profile of temperatures in the heating scale from environmental temperature to that of atomization so that the successive stages of drying, calcination and carbonization the sample must go through are those required. The working temperature and the duration of each stage of the electrothermal process must be carefully selected taking into account the nature of the analyte and the composition of the matrix of the sample. The control unit which measures and controls the flow of an inert gas within the atomizing head is designed to avoid the destruction of the graphite at high temperatures due to oxidation with the air.
www.intechopen.com
Macro to Nano Spectroscopy
6
One variant of the graphite oven is the carbon bar atomizer.
The main advantages of electrothermal atomic absorption are:
a. high sensitivity (absolute quantity of analyte of 10-8 to 10-11 g); b. small volumes of liquid samples (5–100 ┤L); c. the possibility of analysing solid samples directly without pretreatment and, d. low noise level of the oven (Willard et al., 1991).
2. Applications of atomic absorption spectroscopy in medicine
Atomic absorption spectroscopy is a sensitive means for the quantification of some 70 elements and is of use in the analysis of biological samples (Skoog & West, 1984). FAAS allows the detection of Ag, Al, Au, Cd, Cu, Hg, Pb, Te, Sb and Sn with great sensitivity (Taylor et al., 2002). For most elements, the EAAS has lower detection limits than the FAAS. The incorporation of the new technology in the Laboratory of Clinical Biochemistry opened the possibility of approaches which had been unthinkable until then. For many of them it meant a reinforcement in the central position they held in hospital research. For those which incorporated spectroscopy it meant the possibility of new diagnostic, therapeutic and toxic controls.
In this chapter, a series of research studies are presented as example of the above mentioned. Thus, with respect to the Sr, refer to section 2.1, the first paper deals with the discrimination factor between Ca/Sr in absorption intestinal mechanisms. Afterwards, the different behavior of these metals in the binding to serum proteins is studied. And finally, the possibility of a hormonal regulation mechanism of serum levels of this element is evaluated, given the similarity of its biological behavior with the Ca.
The quantification of element bound to protein derived towards the direct applications for the study of medical problems such as the distribution of Zn in the acute and chronic overload and de Zn and Cu in the serum proteins in myocardial infarction.
Later, in section 2.2, a specific problem resulting from industrial development among other causes, threatening a part of the population –Pb poisoning– was tackled, analysing the serum and urine concentration of Pb and the hem biomarkers. This example is particularly useful not only because of what the technology meant for the diagnosis and control of this disorder but also because it has allowed to observe how the levels of this element in our city and, in general, in the West has declined over the years.
Finally, in section 2.3, an actual research is included: the design of a new strategy or approach possibility in the knowledge of the physiopathology of different neurological conditions based on the concentration of certain trace elements in the CSF, as well as of other parameters such as the cellularity, the proteins concentration, etc.
2.1 Strontium
This first group of papers serves as a model to analyze how this new technique allows evolving from the specific research problems (intestinal absorption, transport of element bound to proteins, etc.) to applications in medical pathology, such as the binding of Zn and Cu to plasma proteins after myocardial infarction.
www.intechopen.com
Atomic Absorption Spectroscopy: Fundamentals and Applications in Medicine
7
2.1.1 Introduction
The disintegration of uranium and plutonium atoms in atomic explosions provokes the appearance of a series of elements with maxima in atomic weight of around 90 and 140. The isotopes of heavier atomic weight (140) fall in the area of the explosion while those of lower atomic weight (90) enter the troposphere and stratosphere. The particles which enter the troposphere spread out forming a gigantic belt around the area and are later deposited in local rain. Those others which reach the higher zones – the stratosphere – can be disseminated in over wide areas.
Atmospheric and tropospheric precipitation follow more or less quickly but the contaminants in the stratosphere may take many years before falling into the troposphere and being deposited in zones of greater rainfall.
Among the elements thrown into the troposphere and stratosphere are found those of the first peak of atomic weight (about 90), with two of the artificial isotopes of Sr, 89Sr and 90Sr, with different half lives. In particular, the half life of 90Sr is 28.79 years.
The Sr deposited by the rain together with the Sr present in nature is absorbed by plants through the roots and that which is deposited on the leaves may also be absorbed. From here it enters the human organism, either directly by consuming the plants or, indirectly, by eating the animals which have eaten them.
Once the Sr has entered the organism it is carried in the blood to the cartilage and bone, choice sites for bonding. Far lower rates are found in other tissues.
In face of this threat, the analyses of animal milk for human consumption as markers of radioactive contamination and strategies to prevent the uptake (intestinal absorption) or to facilitate the elimination of 90Sr from the bone once it has bonded are priority research into Sr domain (Escanero, 1974).
2.1.2 Development
2.1.2.1 A curiosity in biological barriers: discrimination between strontium and calcium
It is assumed axiomatically that biological organisms use Sr less effectively than Ca, which means that they discriminate against Sr in favour of Ca. This may be expressed in another manner by the concept “Strontium-Calcium Observed Ratio” (OR), the value of which is lower than 1. Comar et al. (1956) introduced the term to denote the overall discrimination observed in the movement of the two elements from one phase to another under steady-state conditions. The term OR denotes the comparative rates of Sr and Ca in balance between a sample and its precursor and is defined as:
OR= (Sr/Ca) sample/(Sr/Ca) precursor.
More precisely, the OR can be defined as the product of a number of 'discrimination factors' (DF), each of which is a measure of the extent to which the physiological process to which it refers contributes to the overall discrimination.
In this line it is shown one of the first studies which aimed to ascertain at what intestinal level the Sr/Ca discrimination takes place. Vitamin D3, 25-hydroxy-cholecalciferol (25-0H-CC) and 1,25-dihydroxy-cholecalciferol (1,25 (OH)2-CC) were administered to rats. The apparent and
www.intechopen.com
Macro to Nano Spectroscopy
8
real intestinal absorption were analysed at those moments when their activity was maximum. Different concentrations of Sr were used and it was concluded that the discrimination occurred in the passive rather than in the vitamin-dependent transport (Escanero et al., 1976).
2.1.2.2 Hormonal regulation of strontium
From a general point of view, this research with Sr was designed to find the hormonal regulatory mechanisms in order to be able to act on them, provoking or forcing its elimination. This approach was based on several facts: a) The chemical similarity between Ca and Sr and their common participation in certain physiological processes lead one to think that both elements share a hormonal regulatory mechanism; b) The contribution of Chausmer et al. (1965) who had demonstrated the existence of specific action of calcitonin (CT) on the distribution of Zn, contrary to that exercised in the distribution of Ca, reducing the levels of this element in different tissues -thymus, testicles- seemed guiding; and c) Comar’s idea (1967) that the plasmatic levels of Ca could participate in the regulation of Sr metabolism was particularly attractive. Taking these facts into account and with the possibility of a shared hormonal regulation for different trace elements (Zn and Sr among others), with specific properties for each one, the first steps in this approach were addressed to finding out more about serum Sr.
In the first study (Escanero, 1974), Comar’s idea was proved since, at the same time as the concentration of Sr in bovine blood increased, so did that of Ca in total proteins, the contrary phenomena occurring with inorganic phosphorus and Ca in albumin.
In a later study (Alda & Escanero, 1985), the association constant and the maximal binding capacity for Ca, Mg and Sr to human serum proteins taken as a whole were determined. For Sr, a maximal binding capacity of 0.128 mmol/g of proteins and the association constant (Kprs) of 49.9 ± 16 M-1 were obtained. These values were not far from those of Ca (0.19 mmol/g of proteins and 55.7 ± 18 M-1).
Later, Córdova et al. (1990) studied the regulating hormones of Ca and the effects of the administration of parathormone (PTH) and CT in rats and after thyroparathyroidectomy (TPTX) were analyzed. The PTH excess and defect (TPTX treated with CT + T4) showed plasmatic increases in Sr. However, CT excess provokes decreases while the defect (administration of PTH + T4 to TPTX rats) causes increases. Consequently, CT may be the hormone that plays a regulating role in the plasmatic Sr concentrations.
In this line, a study (Escanero and Córdova, 1991) was conducted in order to known the effect of the administration of glucagon on the serum levels of the alkaline earth metals since the phosphocalcic response to glucagon was already known in different animal species and it had been reported that, in mammals, glucagon triggered the release of CT by the thyroid gland. The study was completed with the analysis of the changes induced in these metals by the administration of CT. The effect (reduction) was observed two hours after administration and in daily administration the effect peaks on the 3rd day and CT significantly reduces the serum levels of these metals up to the 3rd day of treatment, just when the glucagon effect is highest.
2.1.2.3 Continuing with serum proteins
While the alkaline metals hardly bond in proteins and the alkaline earth metals do so in a proportion of 50% or slightly less, the trace elements do so almost completely. Zinc is
www.intechopen.com
Atomic Absorption Spectroscopy: Fundamentals and Applications in Medicine
9
deposited in a proportion of more than 99% and the proteins involved with albumin and the alpha2 macroglobulin (┙2MG). The α2MG bound tightly to the metal is responsible for 30-40%. The aminoacids are only responsible for about 2% of bonded Zn (Giroux & Henkin, 1972). The serum levels of Zn vary in different pathological symptomatologies and in relation to the amount of exercise. Several studies have shown these variations are related to the percentage of the element bound to albumin and another one established this relation between total serum Zn and ┙2MG-bound Zn, in athletes after exercise (Castellano et al., 1988). This last study was aimed at analysing the variations in the serum levels of Zn after acute and chronic overload of this element and verifying whether these variations may be correlated to changes in the percentage of the element bound to albumin, ┙2MG or both.
After a single intragastric administration of 0.5 mL of a solution containing 1000 ppm of Zn, the levels of this metal increased significantly (p<0.01) in serum 30 min after the beginning of the experiment, reaching maximum values at one hour and returning to normal levels 24 h later. It should be noted, however, that 8 h after administration the increases were no significant (p>0.05). The concentration of Zn bonded to albumin varied in parallel to the total serum levels of Zn. The values of bonded Zn in the globulins α2MG also varied but the values returned to basal concentrations 4 h after the beginning of the experiment.
The chronic overload was performed with different groups who underwent a daily intragastric dosis of 0.5 mL of the same solution used for the acute overload. Different group of animals were sacrificed on days 7, 14, and 30 after the beginning of the experiment, with the aim of collecting values at different times of the overload. The control group and one other were used for recuperation and were kept for ten days with no treatment after day 30. Chronic overload of Zn caused significant increases in the serum levels of Zn throughout all the experiments. The highest values were found on the 14th day. The amount of Zn bonded to albumin varied in parallel with the total serum Zn; however, the concentrations of Zn bonded to globulins (┙2MG) showed a significant decrease (p<0.05) on the seventh day, increasing significantly (p<0.01) on the 14th day and the 30th day and returning to normal values 10 days after Zn overload was interrupted.
The results of the acute overload suggest a correlation with the proportion of element bonded to the albumin and those of the chronic overload showed a rapid response of the albumin while the increases of element bonded to the ┙2MG responded slowly and remained constant until the end of the experiment. However, at this time the total serum Zn and the Zn bonded to albumin decreased.
These results suggest that albumin may play a new physiological role by adjusting its binding capacity to the serum Zn levels.
In the same line the levels and distribution of serum Cu and Zn were studied in patients diagnosed with acute myocardial infarction from the day of admission to the Cardiovascular Intensive Care Unit until the 10th day following the attack (Gómez et al., 2000). The results obtained showed that Cu increased significantly after the 5th day after the myocardial infarction, while Zn decreased significantly (p<0.01) with relation to the control group after the 1st day, the lowest values being found on the 3rd day after the attack.
Later, the total serum Cu showed an excellent correlation with the Cu bonded to the albumin and to the globulins (ceruloplasmin), as well as with the concentration of both
www.intechopen.com
Macro to Nano Spectroscopy
10
fractions of serum proteins. In contrast, the total serum Zn only presented this correlation with the Zn bonded to the albumin, but not with the Zn bonded to the globulin or the albumin concentration.
These findings suggest the existence of some kind of relationship between the two fractions of the element bonded to proteins, which is probably different for each metal.
A further step was taken when wanting to analyse the possible role of albumin in the uptake of Zn by erythrocytes (Gálvez et al., 2001). Zinc is incorporated to erythrocytes by several mechanisms: i) passive transport, ii) anionic exchanger, iii) amino acid transport and iv) especially in the efflux, the Zn2+-Ca2+ exchanger. In accordance with the free-ligand hypothesis only the free fraction could be used for the erythrocyte uptake. The results showed a significantly higher uptake (p<0.01) of Zn in the absence than in the presence of albumin for equimolar concentrations in both cases. However, the uptake of Zn in an albumin-free medium with a similar free-Zn concentration to Zn ultrafiltrable (20%) to another with albumin, a significantly (p<0.01) greater Zn uptake was observed in the latter. The DIDS (4-4´-diidothiocyanatostilbene-2.2´-disulphonic acid), that inhibits an important fraction of the Zn bonded to the anion carrier, also triggered a greater inhibition in the uptake of Zn when the albumin was present. Consequently, it was suggested that albumin must be directly or indirectly involved in Zn capture, facilitating the processes of passive transport and anionic exchanger.
Other properties of the uptake of Zn by erythrocytes were published in previous reports (Galvez et al., 1992, 1996a, 1996b):
- high dependence on temperature (Zn uptake was almost eliminated at 4º C) - dependence on the concentrations of external Na+ and K+ and - the apparent dissociation constant for the fast uptake step (15 minutes) is 0.46 ┤M for a
medium without albumin and 0.121 ┤M with human albumin. For physiological concentrations of Zn the value was 15,3 ┤M (unpublished data).
2.2 Study of the effects of lead in hem biosynthesis
These studies are shown as an example of integration of the analysis provided for Pb by FAAS and EAAS with the results of the biomarkers of hem obtained with other laboratory techniques.
2.2.1 Introduction
Lead produces interferences in the hem biosynthesis pathway (Cambell et al., 1977), inhibiting the enzymatic effects of ALA-Dehydratase (ALA-D, EC 4.2.1.24) in cytosol and coproporphyrinogen oxydase (EC 1.3.3.3) and ferrochelatase (EC 4.99.1.1), both in mitochondria (González-López, 1992).
In the exposed organism, Pb produces affection of the target organs and critical effects which are characteristic of the disease known as saturnism since the days of Ancient Rome. Lead poisoning is diagnosed in the clinic and is shown by the analysis of Pb in blood. However, the concentration of Pb in blood depends on the metabolic condition of the individual (pH of the internal medium, bone activity, etc.) as well as on interactions with
www.intechopen.com
Atomic Absorption Spectroscopy: Fundamentals and Applications in Medicine
11
other metals such as Ca, Fe, Zn, Cu and Mg, among others. In order to ascertain the intensity and degree of affection of the Pb intoxication, it is necessary the study the so-called biomarkers of Pb exposure and poisoning. The most frequently analysed are the enzyme ALA-D in erythrocytes, protoporphyrin IX in erythrocytes, 5-aminolevulinic acid (5-ALA) in urine and the coproporphyrins in urine (Meredith et al., 1979).
The extreme sensitivity of ALA-D to divalent Pb ions has resulted in the measurement of its activity, as an indirect measurement of Pb in human blood (Berlin et al., 1977). Of all the enzymes involved in the hem biosynthesis pathway, it is the one which has been most studied due to the inhibiting effect that Pb has on its activity and the practical importance of the measurement of the enzymatic activity of ALA-D is considered to be of interest as a bioanalytic marker of environmental exposure to Pb. This has been assisted by the development of a method which has been standardised at the proposal of the executive council of the European Union. Hemberg & Nikkanen (1972) have published an extensive report on the biological meaning of ALA-D inhibition and its use as an exposure test.
As well as because of the effect of Pb, the activity of ALA-D may be also reduced by the effect of ethanol in alcoholics and by carbon monoxide in smokers although, in both cases, the reduction of activity is slight. In this line, porphyria of Doss is a recessive autonomous hereditary disease produced by the alteration of the gen which codifies the synthesis of ALA-D located in allele q34 of chromosome 9. It is a rarely presented porphyria, characterised by a deficit of ALA-D. In the homozygote form, a great reduction of ALA-D activity is observed in erythrocytes (2% of the control mean value), while in the heterozygotes, the enzymatic activity of ALA-D is reduced to 50%, being asymptomatic but especially sensitive to the toxic effect of Pb even with scarcely increased levels of Pb. The improvement of environmental and working conditions as well as the use of unleaded petrol, has led to the reduction of the concentration of Pb in blood in the population, a phenomenon observed over the last twenty years (González-López, 1992).
Taking into account the precedent facts, this section will analyse the effects of Pb poisoning in the biomarkers of hem studied in order to evaluate the recovery in the post-treatment with CaNa2EDTA as chelating agent.
2.2.2 Development: Subjects and methods
Subjects: The study of the biomarkers of Pb poisoning was performed in 377 adults (30-65 years old) and in 36 healthy children aged between 6 and 14. The adults were distributed as follows: 325 healthy (control group) and 52 cases of Pb poisoning: 24 severe, 15 slight and 13 treated with chelating agents. The children were another control group.
For inclusion in the group of healthy people, control groups, were required to:
a. No symptoms of lead poisoning and other diseases, b. No changes in routine biochemical parameters and c. Normal values of biomarkers characteristic of lead poisoning.
The group of the 13 patients treated with chelating agents were integrated as patients with severe poisoning and they were treated with CaNa2-EDTA at doses of 50-75 mg/Kg body weight per day for five days, not exceeding the amount of 500 mg. It may be given an additional set after two days of interruption. This treatment requires hospitalization and
www.intechopen.com
Macro to Nano Spectroscopy
12
clinical management with special attention to controlling renal function due to its nephrotoxicity.
Methods: The parameters analyzed were: Pb in blood and urine and the biomarkers of hem characteristic of Pb poisoning, ALA-D and protoporphyrin IX in blood and 5-ALA and coproporphyrins in urine.
The methods used were as follows:
Lead was analyzed in heparinized whole blood and 24-hour urine collection in container without additives. The first results of Pb were performed in both blood and urine by FAAS, using a modification of the method of Hessel (1968) by extraction into n-butyl acetate of the complex formed by the Pb with dithiocarbamate ammonium pyrrolidine (Pb-APDC).
Subsequently, the latest determinations were obtained by EAAS with Zeeman correction spectrometry, given the recent introduction of this technique to the laboratory. Blood was used diluted to 0.2% nitric acid (Pearson & Slavin, 1993).
Biomarkers: ALA-D of erythrocytes (in total blood with heparine) was determined applying the method of the European Standards Committee (Sibar Diagnostici) (Berlin & Schaller, 1974; Schaller & Berlin, 1984).
Erythrocyte-free Protoporphyrin IX (in total blood with heparine) was performed applying the method of Piomelli (1977), (Sibar Diagnostici).
At present, both products are manufactured by Immuno Pharmacology Research (IPR) Diagnostics.
ALA/PBG in urine was determined by means of column chromatography. For analysis a modification of the method of Mauzerall & Granick (1956), manufactured by Bio-Rad, was applied.
Determination of porhyrins in urine was performed after the separation of uro- and coproporphyrins by means of ethyl acetate which extracts the coproporphyrins from the aqueous phase and later absorption of uroporphyrins from the aqueous phase with activated Al2O3. Finally, the uroporphyrins are extracted from the Al2O3 activated and the coproporphyrins from the ethyl acetate by means of HCl 1.5 N, performing a fluorimetric reading of the extracts obtained (Schwartz et al., 1960).
In cases of the increased excretion of porphyrins, it is important to analyze the porphyrin biosynthesis pathway, applying the following analytic methods:
Analysis of carboxylic acids of free porphyrins in urine, by means of HPLC/FD. The chemical structure of the porphyrins presents the natural property of being fluorescent compounds, which makes them detectable by spectrofluorimetry.
The application of high pressure liquid chromatography (HPLC), constitutes a valuable resource in research applied to the study of the porphyrin biosynthesis pathway.
The analysis of the carboxylic acids of free porphyrins does not require any prior treatment of the samples (urine or faeces) to be chromatographed. They are only passed through a 22 ┤m Millex-GS (Millipore) filter. If the quantity of porphyrins contained in the sample is very high, it will be diluted with the eluyent.
www.intechopen.com
Atomic Absorption Spectroscopy: Fundamentals and Applications in Medicine
13
The method used allows us to obtain a type of chromatogram in which the separation can be observed and the identification performed of the carboxylic acids of free porphyrins, from the octacarboxylic porphyrins (8-COOH, uroporphyrins) followed by the heptacarboxylic porphyrins (7-COOH), hexacarboxylic (6-COOH) and pentacarboxylic (5-COOH) and the tetracarboxylic porphyrins (4-COOH, coproporphyrins). The dicarboxylic form (2-COOH, protoporfirin) is not excreted in urine (Meyer et al., 1980a; Meyer, 1985).
As standard the Porphyrin acids chromatographic marker kit is used (Porphyrin products, INC., CMK-IA).
Analysis of type I and II isomers of uroporphyrins and coproporphyrins in urine by means of HPLC/FD. According to the disposition the substitutes may adopt around the tetrapyrrol ring of the porphyrin molecule, there are only four possible types of uroporphyrinogens (I, II, III and IV), but in nature only the type I and III uroporphyrinogens exist and, consequently, decarboxylation will only produce coproporphyrinogens I and III.
The use of high pressure liquid chromatography (HPLC) with fluorimetric detection (FD) allows to separate and identify the isomer forms of type I and III uro- and coproporphyrins as metabolytes derived from the oxidation of the corresponding porphyrinogens, produced in the process of natural metaloporphyrin biosynthesis. With this aim, the application method described by Jacob et al. (1985) was used.
With this method, a chromotagram is obtained in which the separation and identification can be observed of the isomers of uroporphyrins I and III and coproporphyrins I and III which are eluated and detected in this order.
The following standards are used: Uroporphyrin fluorescence standard, Uroporphyrin I (Porphyrin products, INC. UFS-I), Uroporphyrin III octamethyl ester (Sigma), Coproporphyrin I (Sigma), Coproporphyrin fluorescence standard, Coproporphyrin III (Porphyrin products, INC. CFS-3).
Analysis of protoporphyrin-Zn of erythrocytes in blood.
The alteration of the enzymatic activity of ferrochelatase due to the inhibition of this enzyme by the effect of Pb produces an increase in the protoporphyrin IX concentration in erythrocytes. This increase of protoporphyrin IX produces and accumulation of Zn-protoporphyrin I due to the complexation formation of this porphyrin with Zn2+.
The method described by Meyer et al. (1980) was used for the analysis of porphyrins in erythrocytes. They developed a procedure for the separation of porphyrins from erythrocytes in blood with HPLC/FD in reverse phase by formation of the ionic pair (Meyer et al., 1982).
The standards used were Coproporphyrin fluorescente Standard (Porphyrin products, INC. CFS-3, Logan, UTA, USA), Protoporphyrin fluorescent Standard (Porphyrin products, INC. PFS-9, Logan, UTA, USA) and Mesoporphyrin IX (Porphyrin products, INC. M 566-9, Logan, UTA, USA).
2.2.3 Development: Results
The first group of values (results not published) were obtained in an early study and show the concentrations of Pb in blood and urine, as well as the values of various biomarkers of
www.intechopen.com
Macro to Nano Spectroscopy
14
the porphyrin biosynthesis pathway. Moreover, it was also included the results of a second study from some years later, presenting the normality values of Pb in blood as an update, observing the difference of Pb concentration with respect to the earlier study.
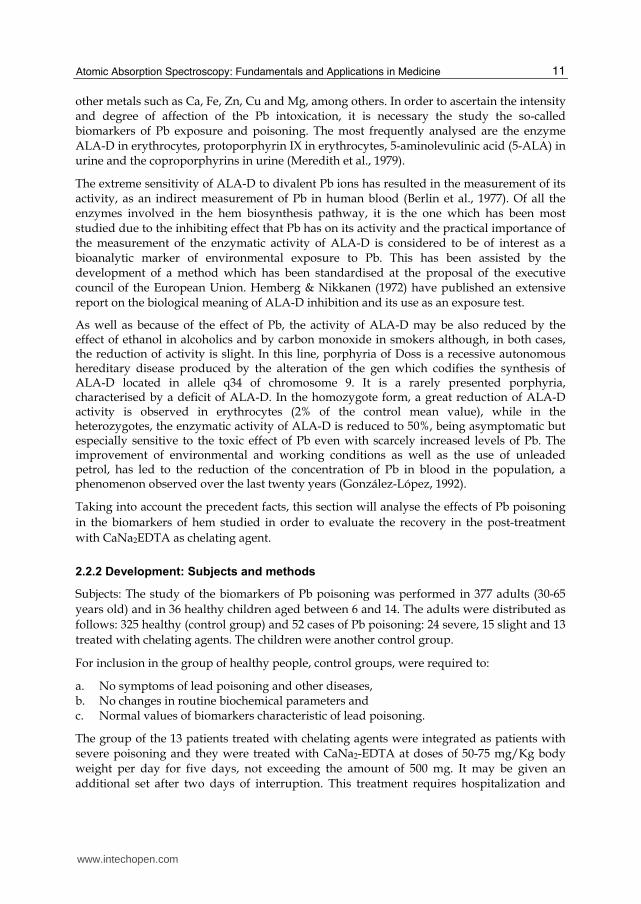
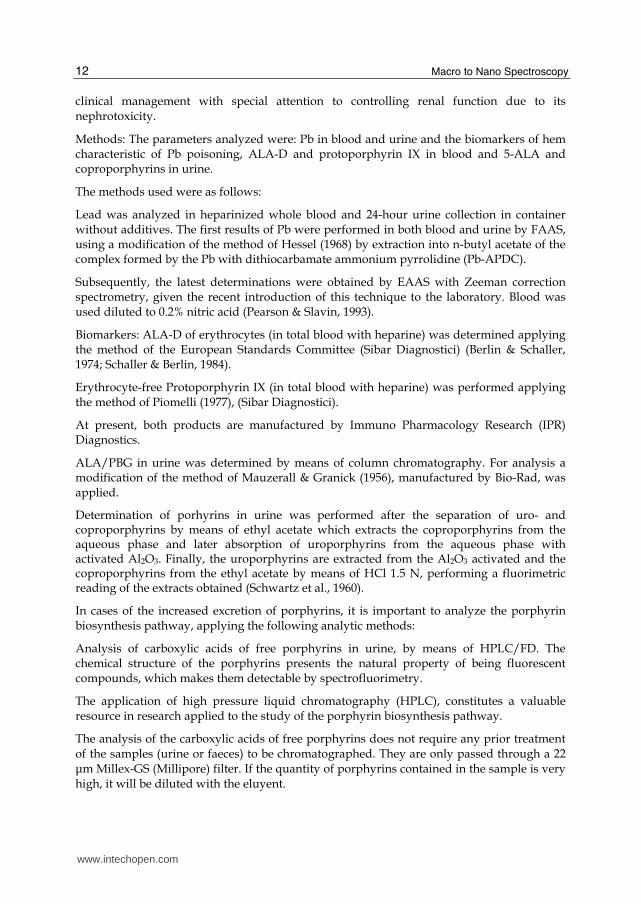
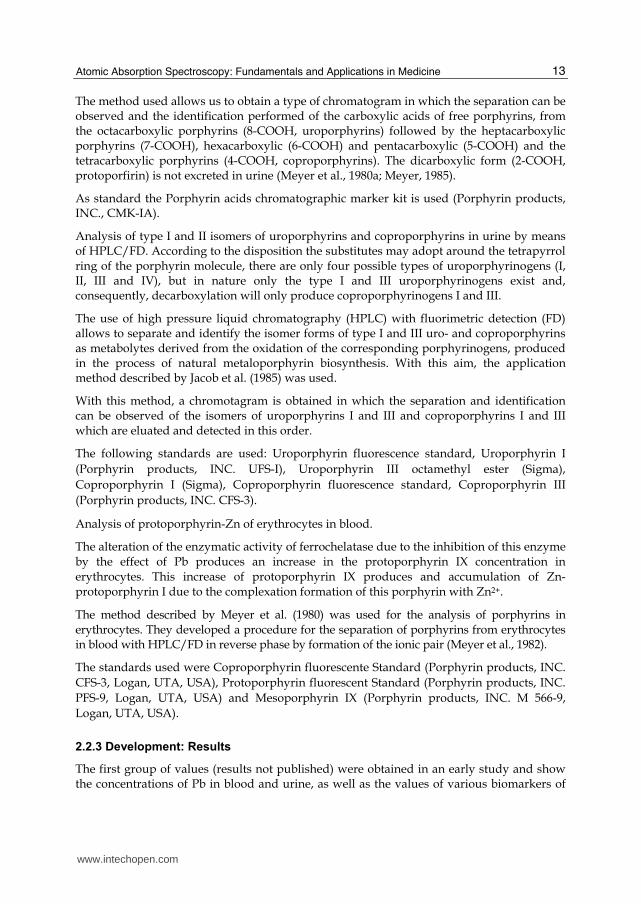
I.A Control group. The results of the control group for Pb in blood and in 24 hours urine are shown in Table I. In Table 2 are presented the values of ALA-D and protoporphyrin IX in erythrocytes for the same population and in Table III those of the hemoglobin concentration and protoporphirin IX/g of haemoglobin coefficient. In table 4 are indicated the values of 5-ALA and porphobilinogen (PBG) in 24 hours urine and in the last (table 5) are presented the results found in urine of 24h of uroporphyrins and coproporphyrins.
Pb in blood Pb in 24 hours urine
µg/dL µg/dL
x ± SD x ± SD
Men (n = 104) 17.72 ± 6.01 45.10 ± 39.85
Women (n = 61) 14.00 ± 3.86 35.78 ± 27.26
Adults (n = 165) 16.54 ± 5.49 40.96 ± 35.01
Children (n = 36) 14.58 ± 2.79 -
Table 1. Values (x ± SD) of Pb in blood and in 24 hours urine
ALA-D Protoporphyrin IX
U. of CEE/mL erythrocytes* µg/dL of blood
x ± SD x ± SD
Men (n = 104) 44.70 ± 13.94 28.92 ± 11.50
Women (n = 61) 50.41 ± 17.27 26.80 ± 9.66
Adults (n = 165) 46.81 ± 15.45 28.13 ± 10.87
Children (n = 36) 64.42 ± 13.39 28.53 ± 9.28
(*): Units of the European Standards Committee
Table 2. Values (x ± SD) of ALA-D and protoporphyrine IX in erythrocytes
Hemoglobin Protoporphyrin IX
g/dL of blood µg/g Hb
x ± SD x ± SD
Men (n = 104) 15.27 ± 1.54 1.92 ± 0.84
Women (n = 61) 13.39 ± 1.16 2.02 ± 0.78
Adults (n = 165) 14.57 ± 1.68 1.96 ± 0.82
Children (n = 36) 12.94 ± 0.71 2.19 ± 0.65
Table 3. Values of Hb in blood and protoporphyrin IX/g of Hb coefficient
www.intechopen.com
Atomic Absorption Spectroscopy: Fundamentals and Applications in Medicine
15
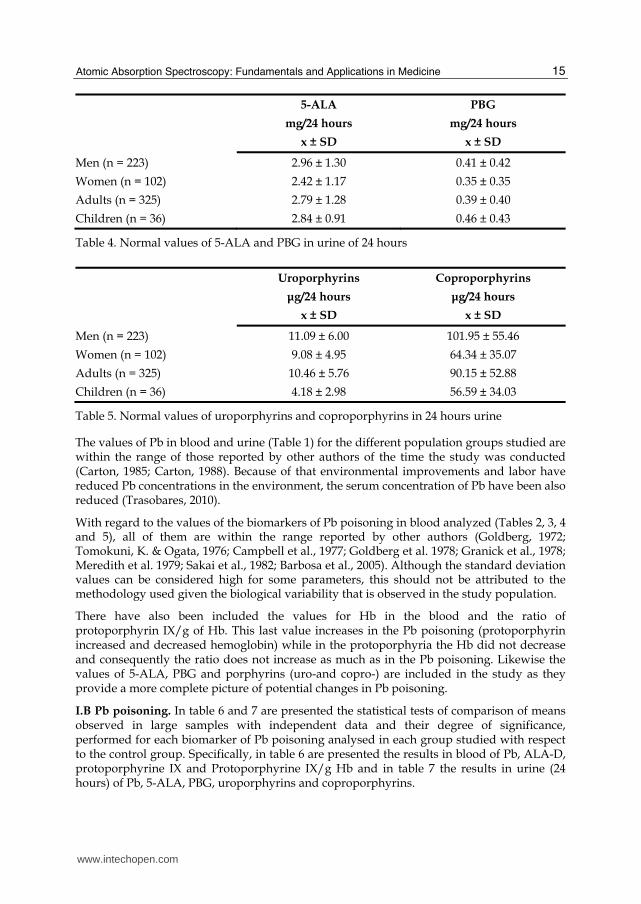
5-ALA PBG
mg/24 hours mg/24 hours
x ± SD x ± SD
Men (n = 223) 2.96 ± 1.30 0.41 ± 0.42
Women (n = 102) 2.42 ± 1.17 0.35 ± 0.35
Adults (n = 325) 2.79 ± 1.28 0.39 ± 0.40
Children (n = 36) 2.84 ± 0.91 0.46 ± 0.43
Table 4. Normal values of 5-ALA and PBG in urine of 24 hours
Uroporphyrins Coproporphyrins
μg/24 hours μg/24 hours
x ± SD x ± SD
Men (n = 223) 11.09 ± 6.00 101.95 ± 55.46
Women (n = 102) 9.08 ± 4.95 64.34 ± 35.07
Adults (n = 325) 10.46 ± 5.76 90.15 ± 52.88
Children (n = 36) 4.18 ± 2.98 56.59 ± 34.03
Table 5. Normal values of uroporphyrins and coproporphyrins in 24 hours urine
The values of Pb in blood and urine (Table 1) for the different population groups studied are within the range of those reported by other authors of the time the study was conducted (Carton, 1985; Carton, 1988). Because of that environmental improvements and labor have reduced Pb concentrations in the environment, the serum concentration of Pb have been also reduced (Trasobares, 2010).
With regard to the values of the biomarkers of Pb poisoning in blood analyzed (Tables 2, 3, 4 and 5), all of them are within the range reported by other authors (Goldberg, 1972; Tomokuni, K. & Ogata, 1976; Campbell et al., 1977; Goldberg et al. 1978; Granick et al., 1978; Meredith et al. 1979; Sakai et al., 1982; Barbosa et al., 2005). Although the standard deviation values can be considered high for some parameters, this should not be attributed to the methodology used given the biological variability that is observed in the study population.
There have also been included the values for Hb in the blood and the ratio of protoporphyrin IX/g of Hb. This last value increases in the Pb poisoning (protoporphyrin increased and decreased hemoglobin) while in the protoporphyria the Hb did not decrease and consequently the ratio does not increase as much as in the Pb poisoning. Likewise the values of 5-ALA, PBG and porphyrins (uro-and copro-) are included in the study as they provide a more complete picture of potential changes in Pb poisoning.
I.B Pb poisoning. In table 6 and 7 are presented the statistical tests of comparison of means observed in large samples with independent data and their degree of significance, performed for each biomarker of Pb poisoning analysed in each group studied with respect to the control group. Specifically, in table 6 are presented the results in blood of Pb, ALA-D, protoporphyrine IX and Protoporphyrine IX/g Hb and in table 7 the results in urine (24 hours) of Pb, 5-ALA, PBG, uroporphyrins and coproporphyrins.
www.intechopen.com
Macro to Nano Spectroscopy
16
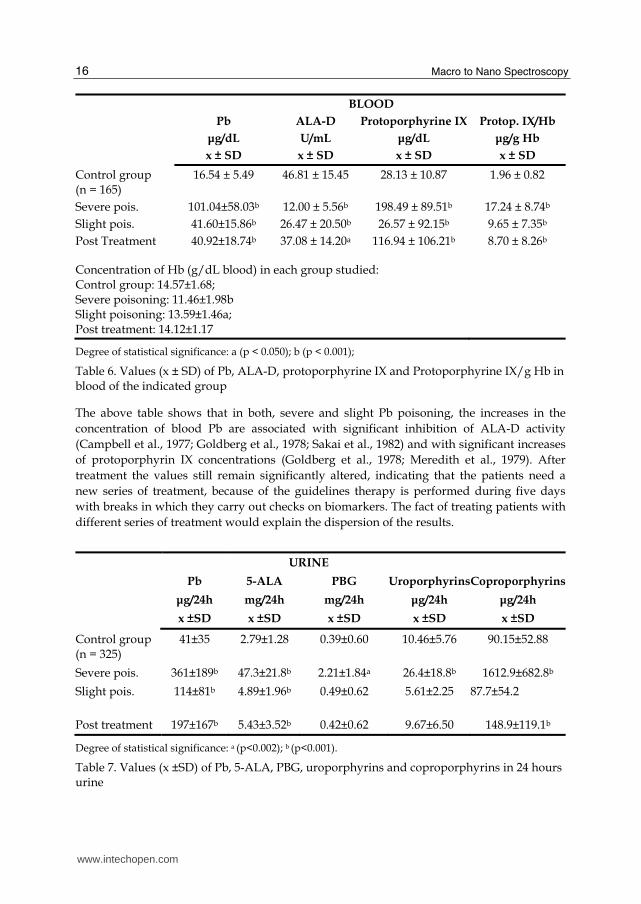
BLOOD
Pb ALA-D Protoporphyrine IX Protop. IX/Hb
μg/dL U/mL μg/dL μg/g Hb
x ± SD x ± SD x ± SD x ± SD
Control group (n = 165)
16.54 ± 5.49 46.81 ± 15.45 28.13 ± 10.87 1.96 ± 0.82
Severe pois. 101.04±58.03b 12.00 ± 5.56b 198.49 ± 89.51b 17.24 ± 8.74b Slight pois. 41.60±15.86b 26.47 ± 20.50b 26.57 ± 92.15b 9.65 ± 7.35b Post Treatment 40.92±18.74b 37.08 ± 14.20a 116.94 ± 106.21b 8.70 ± 8.26b
Concentration of Hb (g/dL blood) in each group studied: Control group: 14.57±1.68; Severe poisoning: 11.46±1.98b Slight poisoning: 13.59±1.46a; Post treatment: 14.12±1.17
Degree of statistical significance: a (p < 0.050); b (p < 0.001);
Table 6. Values (x ± SD) of Pb, ALA-D, protoporphyrine IX and Protoporphyrine IX/g Hb in blood of the indicated group
The above table shows that in both, severe and slight Pb poisoning, the increases in the concentration of blood Pb are associated with significant inhibition of ALA-D activity (Campbell et al., 1977; Goldberg et al., 1978; Sakai et al., 1982) and with significant increases of protoporphyrin IX concentrations (Goldberg et al., 1978; Meredith et al., 1979). After treatment the values still remain significantly altered, indicating that the patients need a new series of treatment, because of the guidelines therapy is performed during five days with breaks in which they carry out checks on biomarkers. The fact of treating patients with different series of treatment would explain the dispersion of the results.
URINE
Pb 5-ALA PBG UroporphyrinsCoproporphyrins
μg/24h mg/24h mg/24h μg/24h μg/24h
x ±SD x ±SD x ±SD x ±SD x ±SD
Control group (n = 325)
41±35 2.79±1.28 0.39±0.60 10.46±5.76 90.15±52.88
Severe pois. 361±189b 47.3±21.8b 2.21±1.84a 26.4±18.8b 1612.9±682.8b
Slight pois. 114±81b 4.89±1.96b 0.49±0.62 5.61±2.25 87.7±54.2
Post treatment 197±167b 5.43±3.52b 0.42±0.62 9.67±6.50 148.9±119.1b
Degree of statistical significance: a (p<0.002); b (p<0.001).
Table 7. Values (x ±SD) of Pb, 5-ALA, PBG, uroporphyrins and coproporphyrins in 24 hours urine
www.intechopen.com
Atomic Absorption Spectroscopy: Fundamentals and Applications in Medicine
17
The identification and quantification of high levels of porphyrins in erythrocytes, mainly protoporphyrin IX and its chelated form, Zn-protoporphyrin, are essentials in the diagnosis of Pb poisoning and in erythropoietic porphyrias (Meyer et al., 1980b).
The results of the above table present significant differences in the Pb urinary elimination in Pb poisoning both severe as slight in relation to the control group. Moreover, increases in the elimination of all parameters (biomarkers) analyzed in severe poisoning, being the most important those of the 5-ALA and coproporphyrins. In contrast, in slight poisoning has only significantly increased the elimination of 5-ALA. After treatment of severe cases there is a significant decrease in excretion of 5-ALA and coproporphyrins, keeping the levels still increased. Of the above comments it can be seen that the most effective urinary biomarkers are the urinary elimination of 5-ALA and coproporphyrins (type isomeric III).
These results agree, in the literature review performed, with the studies published by numerous authors and refered in the Doctoral Thesis of González-López (1992) and others (Sakai, 2000; Gurer-Orhan et al., 2004). All of them showed the influence of Pb on the heme biosynthesis pathway and the effects produced in some of the enzymes which take part in the biosynthesis of porphyrins, phenomena demonstrated in clinical research, in vitro studies and in experiments on animals.
In the diagnosis and evolutionary control of Pb poisoning, the study of the biomarkers of the hem biosynthesis pathway is very efficient, even more so than that demonstrated by the concentration of Pb in blood and urine due to the susceptibility of these to hormonal influences as well as metabolic ones such as the pH of the internal medium and the activity of bone turnover. According to this, Pb in blood means the degree of uptake; Pb in urine, the degree of elimination; Pb in urine provoked by EDTA or some other chelating agent, the degree of accumulation; ALA-D, the degree of exposure and is directly related to Pb in blood; erythrocyte free protoporphyrin IX, especially Zn-protoporphyrin IX, the degree of intake and chronic evolution; and the coproporphyrins (coproporphyrin III) the severity of the poisoning.
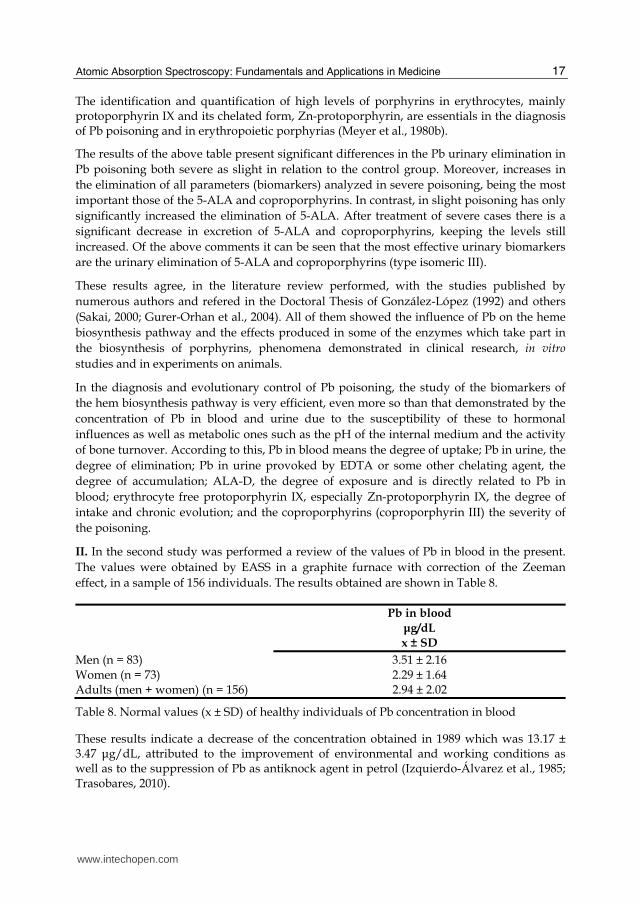
II. In the second study was performed a review of the values of Pb in blood in the present. The values were obtained by EASS in a graphite furnace with correction of the Zeeman effect, in a sample of 156 individuals. The results obtained are shown in Table 8.
Pb in blood
μg/dL
x ± SD
Men (n = 83) 3.51 ± 2.16 Women (n = 73) 2.29 ± 1.64 Adults (men + women) (n = 156) 2.94 ± 2.02
Table 8. Normal values (x ± SD) of healthy individuals of Pb concentration in blood
These results indicate a decrease of the concentration obtained in 1989 which was 13.17 ± 3.47 ┤g/dL, attributed to the improvement of environmental and working conditions as well as to the suppression of Pb as antiknock agent in petrol (Izquierdo-Álvarez et al., 1985; Trasobares, 2010).
www.intechopen.com
Macro to Nano Spectroscopy
18
In the review of results for 2008 (results not published), the values for ALA-D in the adult sample were 60.59 ± 16.49 (x ± SD), higher than those obtained in 1990: 46.81 ± 15.45 (x ± SD), which is logical if we take into account the fact that the activity of ALA-D in erythrocytes has a negative or inverse correlation with respect to the concentration of Pb in blood. In the 1990 study, Pearson’s coefficient of linear correlation obtained was: r = -0.568 (p<0.001).
2.3 Study of some elements in cerebrospinal fluid: physiopathological evaluation
This study, still in progress, can serve as an example of using the atomic absorption spectrometry technique for the assistance, together with other techniques, in the clinical diagnosis of some diseases.
2.3.1 Introduction
The cerebrospinal fluid (CSF) fills the subarachnoid space between the arachnoid membranes and the pia mater called leptomeninges which protect the Central Nervous System -CNS- (encephalon and spinal cord). Seventy percent of the CSF is formed in secretory structures called choroid plexi and the remaining 30% is produced from the cerebral capillaries (Carpenter, 1985).
Although the composition of CSF is similar to a plasma filtrate, there are differences which indicate that the CSF formed is produced both by a process of filtration and by active secretion, an osmotic balance being observed between CSF and plasma. A similarity can be seen in the composition of CSF and the extracellular liquid of the nervous system, indicating an easy interchange between both compartments. The CSF and in the cerebral interstice are separated from the blood circulation by the hematoencephalic and hematocephalorachideal barriers which prevent the free passing of substances. This is why they are considered to be functional elements of protection of the nerve cells (Nolte, 1994). In comparison with plasma, the CSF contains a greater concentration of Na, Cl and Mg and a lower one of glucose, proteins, amino acids, uric acid, K, bicarbonate, Ca and phosphate (Guyton, 1990). These differences indicate that the CSF is produced by a mechanism of active secretion and varies according to the location of CSF extraction with regard to the structures it bathes.
Water passes from the stroma to the CSF following the concentration gradient produced by the ATPase-dependent carrier proteins, Cl, Ca and Mg (Nolte, 1994). Cellular metabolytes also enter the extracellular liquid from neurones and glial cells.
The CSF maintains an appropriate chemical environment for neurotransmission and removes metabolic products and substances which are harmful for the CNS.
2.3.2 Development
In this research, it has been studied the concentration of Ca, Mg, Zn, Cu, Fe and Mn in CSF in order to analyze their influence on the pathogeny of some neuropathies (González-Romarís et al., 2011).
The mineral chemical elements and the trace elements were analysed in the CSF extracted from 37 people (17 men and 20 women, between 27 and 73 years of age) who were considered to be healthy after performing a clinical and analytical study. They made up the control group.
www.intechopen.com
Atomic Absorption Spectroscopy: Fundamentals and Applications in Medicine
19
In addition, analysis was made of the CSF of 136 individuals from the Services of Neurology, Neurosurgery and Emergency. The CSF was extracted by lumbar puncture in all cases.
The analysis of Ca, Mg, Zn, Cu, Fe and Mn was performed by flame atomic absorption using the corresponding hollow cathode for each metal. The wavelengths for the reading of the absorbance corresponding to each cation analysed were the indicated by the manufacturer.
The values (mean and standard deviation) obtained in the control group for each metal analysed were as follows: Ca (mg/dL), 4.95 ± 0.70; Mg (mg/dL), 2.74 ± 0.10; Zn (µg/dL), 17.40 ± 7.50; Cu (µg/dL), 15.70 ± 4.50; Fe (µg/dL), 13.10 ± 3.60; and Mn (µg/dL), 2.50 ± 0.70. These values agree with the findings published by other authors (Hazell, 1997; Kapaki et al., 1997; Levine et al., 1996).
With regard to the results obtained in the pathological CSF, significant increases were found (p<0.05) in the concentrations of Ca, Cu, Fe, Zn and Mn in the groups classified with cell and protein increase in CSF in comparison to the control group. It was also see that the significant increase of the Ca, Zn and Cu concentrations is greater in those groups which present a higher concentration of proteins, while the increase of Mn corresponds to the increase of cell count. With regard to magnesium, it was seen that the significant reduction of its concentration in relation to the control group corresponds equally both if the cell count or the protein concentration was increased.
Interest in analysing these metals in CSF is directed to explaining the pathogenesis of some dysfunctions of the CNS. Clinical and experimental studies reviewed in the literature confirm the influence that these metals have on the pathogeny of some CNS dysfunctions and diverse neuropathies.
In this way the Ca and Mg ions play an important role in the action of glutamate, which is one of the most important neurotransmitter of vertebrates in the brain. The receptor of glutamate N-methyl-D-aspartate (NMDA) can only be activated in certain conditions of depolarisation of the membrane (Johnson & Ascher, 1988). The Mg ion blocks the channel, not being permeable to the Ca ions. When the receptor of glutamate are activated, the receptor reduces its affinity for Mg and the channel becomes permeable, permitting the entry of Ca ions to the neurone, a phenomenon which has been related to memory and the learning process (Hammond & Tritsch, 1990; Thomson, 1986). A reduction has been found in the glutamate and Mg concentration in the CSF in schizophrenic patients (Levine et al., 1996).
Some studies have found an increase of Cu in serum and CSF and an increase of Mn in the spinal cord in Amyotrophic Lateral Sclerosis (ALS), which suggests that this metal plays a role in the pathogeny of this disease (Kapaki et al., 1997).
The clinical association of Pb poisoning and ALS with an increase of Pb in blood and bone has been reported (Kamel et al., 2006). It has been suggested that patients with polymorphism in the gene of the ALA-D enzyme might be more at risk of presenting ALS in exposure to Pb (Kamel et al., 2003). Other studies have found no association between exposure to metals and ALS (McGuire et al., 1997; Bergomi et al., 2002).
It has been suggested that, regarding Mn, the binding of this metal in the basal ganglions of the brain may contribute in the pathogeny of the symptomatology of hepatic encephalopathy (Kuliseusky & Puyols, 1992; Weissenborn, 1995; Noremberg, 1998).
www.intechopen.com
Macro to Nano Spectroscopy
20
Moreover, it has been demonstrated that Mn reduces the uptake of glutamate in cultivated astrocytes. The great capacity of astrocytes to accumulate Mn suggests that its uptake by these cells may play an important role in the development of Alzheimer’s type II astrocytosis (Hazell, 1997; Aschner & Gannon, 1992).
In conclusion, this research line, still in progress, can be highly promising to clarify the pathogenesis of some brain conditions.
3. Conclusions
After incorporating the atomic absorption spectrophotometry (spectroscopy) to the hospital laboratories has been observed that the medical research has improved in these laboratories. In this chapter the highlighted technique has been presented through a few research examples with different metals.
The conclusions from the research with the metal studies have been the following:
a. Strontium: - The intestinal absorption discrimination between Ca and Sr takes place in the
passive transport mechanism and not in the active one or of vitamin D dependent mechanism.
- With respect to the hormonal regulation of the plasmatic Sr, the CT is the only hormone that caused consistent changes in the concentrations of this element.
- The addition of Sr in vitro to equimolar concentrations with Ca to bovine serum forces the binding of this last element with the total serum proteins. An opposite phenomenon takes place when the experience is conducted with albumin bovine as a single protein.
b. Zinc and Copper: - The Zn bound to albumin varies more consistently than Zn bound to globulins
after acute and chronic overload. This fact allows suggesting that the albumin could act as a buffer.
- In the myocardial infarction, Cu in serum increases significantly after the 5th day after the heart attack, while the Zn in serum decreases from the 1st day; being the lowest values of Zn found on the 3rd day after the attack. The total Cu in serum showed an excellent correlation with the Cu bonded to the albumin and to the globulins (ceruloplasmin), while, the total Zn in serum only presents a positive correlation with the Zn bonded to the albumin.
c. Lead: - In the diagnosis and the control of the Pb poisoning, the study of the biomarkers of
the hem biosynthesis pathway is very efficient, even more so than its concentration of Pb in blood and urine.
- According to this, the Pb concentration in blood means the degree of Pb intake; the Pb concentration in urine, the degree of its elimination; the Pb concentration in urine after the administration of EDTA or some other chelating agent (Dimercaprol –BAL, British Anti-Lewisite- and penicilamine), the degree of its accumulation; the ALA-D activity, the degree of exposure and these ones are directly related to the levels of Pb in blood; the Zn-protoporphyrin IX concentration, the degree of intake and chronic poisoning evolution; and finally the coproporphyrins (coproporphyrin III) gives an indication of the severity of the poisoning.
www.intechopen.com
Atomic Absorption Spectroscopy: Fundamentals and Applications in Medicine
21
- In recent years the concentration of Pb in blood has decreased significantly in the aragonese population.
d. Metals in cerebrospinal fluid (Ca, Mg, Zn, Cu, Fe and Mn): - The concentration of different metals jointly with the rates of cellular and protein
concentration has been proved to be a useful tool for the understanding of the pathogenesis of some brain conditions.
4. References
Alda, JO. & Escanero, JF. Transport of calcium, magnesium and strontium by human serum proteins. Rev. Esp. Fisiol. 1985; 41: 145-150.
Aschner, M. & Gannon, M. Manganese uptake and efflux in cultured rat astrocytes. J. Neurochem. 1992; 58: 730-735.
Barbosa, F.; Tanus-Santos, JE.; Gerlach, RF. & Parsons, PJ. A Critical Review of Biomarkers Used for Monitoring Human Exposure to Lead: Advantages, Limitations, and Future Needs. Environ. Health Perspect. 2005; 113(12): 1669–1674.
Bergomi, M.; Vinceti, M.; Nacci, G.; Pietrini, V. & Bratter, P. Environmental exposure to trace elements and risk of amyotrophic lateral sclerosis: a population-based control study. Environ. Res. 2002; 89: 116-23.
Berlin, A. & Schaller, KH. European Standardized Method for the determination of delta-amino-levulinic acid dehydratase activity in blood. Z. Klin. Chem. Klin. Biochem. 1974; 12: 389-390.
Berlin, A.; Schaller, KH.; Grimes, H.; Langevin, M. & Trotter J. Environmental exposure to lead: analytical and epidemiological investigations using the European Standardized Method for blood delta-amino-levulinic acid dehydratase activity determination. Int. Arch. Occup. Environ. Health 1977; 39: 135-141.
Campbell, BC.; Brodie, MJ.; Thompson, GG.; Meredith, PA.; Moore, R. & Goldberg, A. Alterations in the activity of the enzymes of haem biosynthesis in lead poisoning and acute hepatic porphyria. Clin. Sci. Mol. Med. 1977; 53: 335-340.
Carpenter, MB. Neuroanatomía Humana de Strong y Edwin (5ª Edición, 2ª reimpresión). Buenos Aires: El Ateneo, 1985, 1-19.
Cartón, JA. Saturnismo: epidemiología y diagnóstico. Med. Clin. (Barc) 1985; 84: 492-499. Cartón, JA. Saturnismo. Med. Clin. (Barc) 1988; 91: 538-540. Castellano, MaC.; Soteras, F.; Córdova, A.; Elósegui, LMa. & Escanero, JF. Zinc distribution
between protein serum ligands in rats: acute and chronic overload of zinc. Med. Sci. Res. 1988; 16: 1229-1230.
Córdova, A.; Soteras, V.; del Villar, V.; Elósegui, LMa. & Escanero, JF. Efecto de la tiroparatiroidectomía, la parathormona y la calcitonina sobre el estroncio plasmático en rata. Rev. Esp. Fisiol. 1990; 46(2): 139- 146.
Chausmer, AB.; Weiss, P. & Wallach, S. Effect of thyrocalcitonin on calcium exchange in rat tissues. Endocrinology 1965; 77: 1151-1154.
Comar, CL. In: “Strontium metabolism”, Leniham, JMA; Loutit, JF; Martin, JH. Eds. New York: Academic Press, 1967; 17-31.
Comar, CL.; Wasserman, RH.; & Nold, MM. Strontium-Calcium Discrimination Factors in the Rat. Proc. Soc. Exp. Biol., N.Y., 1956; 92(4): 859-863.
Escanero, JF. Inferencia del estroncio en el metabolismo del calcio. Tesis Doctoral. Departamento de Fisiología. Facultad de Medicina. Universidad de Zaragoza, 1974.
www.intechopen.com
Macro to Nano Spectroscopy
22
Escanero, JF.; Carre, M. & Miravet, L. Effets des différents métabolites de la vit. D3 et de la concentration calcique sur l´absorption intestinale de strontium. C. R. Soc. Biol. 1976; 170: 47-53.
Escanero, JF. & Córdova, A. Effects of glucagon on serum calcium, magnesium and strontium levels in rats. Miner. Electrolyte Metab. 1991; 17: 190-193.
Elwell, WT. & Gidley, JAF. Atomic-Absorption Spectrophotometry (2nd edition). International Series of Monographs in Analytical Chemistry (vol. 6). Oxford : Pergamon Press, 1966.
Gálvez, M.; Elósegui, LMa.; Guerra, M.; Moreno, JA. & Escanero, JF. Zinc Exchange between erythrocytes and médium with and without albumin at different temperaturas. In: “Metal Ions in Biology and Medicine”, Anastassoupoulos, J; Collery, P; Theophanides, T; Etienne, JC, eds. Paris: John Libbey Eurotext, 1992, 2: 89-90.
Gálvez, M.; Moreno, JA.; Elósegui, LMa. & Escanero, JF. Zinc uptake by human erythrocytes with and without serum albumin in the medium. Biol. Trace Elem. Res. 2001; 84: 45-56.
Gálvez, M.; Moreno, JA.; Elósegui, LMa. & Escanero, JF. Zinc uptake by human erythrocytes. 1. Effect of Na and K in medium at different and a medium at different temperatures. In: “Metal Ions in Biology and Medicine”, Anastassoupoulos, J; Collery, P; Theophanides, T; Etienne, eds. Paris: John Libbey Eurotext, 1996a, 4: 218-221.
Gálvez, M.; Moreno, JA.; Elósegui, LMa. & Escanero, JF. Zinc uptake by human erythrocytes. 2. Effetc of the temperature on Zn-uptake sensitive to the stilbenes. In: “Metal Ions in Biology and Medicine”, Anastassoupoulos, J; Collery, P; Thephanides, T; Etienne, JC, eds. Paris: John Libbey Eurotext,1996b, 4: 222-224.
Giroux, EL. & Henkin, RI. Competition for zinc among serum albumin and amino acids. Biochim. Biophys. Acta 1972; 273: 64-72.
Goldberg, A. Lead poisoning and haem biosynthesis. Br. J. Haematol, 1972, 23: 521-524. Goldberg, A., Meredith, PA., Miller, S., Moore, MR. & Thomson, GG. Hepatic drug
metabolism and haem biosynthesis in lead poisoned rats. Br. J. Pharmacol. 1978, 62: 529-536.
Gómez, E.; de Diego, C.; Orden, I.; Elósegui, LMa.; Borque, L. & Escanero, JF. Longitudinal study of serum cooper and zinc levels and their distribution in blood proteins alter acute myocardial infarction. J. Trace Elements Med. Biol. 2000; 14: 65-70.
González López, JM. Influencias del plomo en el metabolismo de las porfirinas. Tesis Doctoral. Resúmenes De Tesis Doctorales, Curso 1989-1990. Universidad de Zaragoza (España), Comisión de Doctorado, 1992, 65. I.S.B.N.: 84-7733-314-9.
González-Romarís, EMa.; Idoate-Cervantes, I.; González-López, JM. & Escanero-Marcén, JF. Concentration of calcium and magnesium and trace elements (zinc, cooper, iron and manganeso) in cerebrospinal fluid: A try of a pathophysiological classification. J. Trace Elements Med. Biol. 2011; 25 Supl.: S45-S49.
Granick, JL., Sassa, S. & Kappas, A. Some Biochemical and clinical aspects of lead intoxication. Advan. Clin. Chem. 1978, 20: 287-339.
Gurer-Orhan, H.; Sabır, HU. & Özgüneş, H. Correlation between clinical indicators of lead poisoning and oxidative stress parameters in controls and lead-exposed workers. Toxicology, 2004; 195(2–3): 147-154.
Guyton, AC. Anatomía y fisiología del sistema nervioso. Neurociencia básica, 2a reimpresión. Buenos Aires: Editorial Médica Panamericana S.A., 1990, 75-84, 21-36 y 129-149. Edición original: Guyton, AC. Basic Neuroscience. Anatomy and Physiology. Philadelphia: W.B. Saunders, 1987.
Hammond, C. & Tritsch, D. Neurobiologie cellulaire. Paris: Doin Éditeurs, 1990, 439-462.
www.intechopen.com
Atomic Absorption Spectroscopy: Fundamentals and Applications in Medicine
23
Hazell, AS. Manganese decreses glutamate uptake in cultured astrocytes. Neurochem. Res. 1997; 22: 1443-1447.
Hernberg, S. & Nikkanen, J. Effect of lead on delta-amino-levulinic acid dehydrase – A selective review - . Pravoc Lék. 1972; 24: 2-3.
Hessel, DW. A simple and rapid quantitative determination of lead in blood. At. Absorpt. Newsletter 1968; 7: 55.
Izquierdo-Álvarez, S.; Calvo-Ruata, MaL.; González-López, JM.; García de Jalón-Comet, A. & Escanero-Marcén, JF. The Need to Update Reference Values for Lead in Zaragoza, Spain. Biol. Trace Elem. Res. 2008; 123: 277-280.
Jacob, K.; Sommer, W.; Meyer, HD. & Vogt, W. Ion-pair high-performance liquid chromatographic separation of porphyrin isomers. J. Chromatogr. 1985; 349: 283-293.
Johnson, JW. & Ascher, P. The NMDA receptor and its channel modulation by magnesium and by glicine. In: Lodge, D, ed. Excitatory amino acids in health and disease. New York: John Wiley and Sons 1988: 143-64.
Kamel, F.; Umbach, DM.; Hu, H.; Munsat, TL.; Shefner, JM.; Taylor, JA. et al. Lead exposure as a risk factor For amyotrophiv lateral sclerosis. Neurodegener. Dis. 2006; 2: 195-201.
Kamel, F.; Umbach, DM.; Lehman, TA.; Park, LP.; Munsat, TL.; Shefner, JM. et al. Amyotrophic lateral sclerosis, lead, and genetic susceptibility: polymorphism in in test delta-aminolevulinic acid dehydratase and vitamin D receptor genes. Environ. Health Perspect. 2003; 111: 1335-9.
Kapaki, E.; Zournas, C.; Kanias, G.; Zambelis, T.; Kakami, A. & Papageorgiou, C. Essential trace elements Alterations in amyotrophic lateral sclerosis. J. Neurol. Sci. 1997; 147: 171-5.
Kuliseusky, J. & Puyols, J. Pallidal hyperintensity on magnetic resonance imaging in cirrotic patiens: Clinical correlation. Hepatology 1992; 16: 1382.
Levine, J.; Rapoport, A.; Mashiah, M. & Dolev, E. Serum and cerebrospinal levels of calcium and magnesium in acute versus remitted schizophrenic patiens. Neuropsychobiology 1996; 33(4): 169-72.
McGuire, V.; Logstreth, WT. Jr; Nelson, LM.; Koepsell, TD.; Checkoway, H.; Morgan, MS. et al. Occupational exposure and amyotrophic lateral esclerosis: a population-based control study. Am. J. Epidemiol. 1997; 145: 1076-88.
Mauzerall, D. & Granik, S. The occurrence and determination of ├-aminolevulinic acid and porphobilinogen in urine. J. Biol. Chem. 1956; 219: 435-446.
Meredith, PA.; Moore, MR. & Goldberg, A. Erythrocyte ├-aminolevulinic acid dehydratase activity and blood Protoporphyrin concentrations as indices of lead exposure and altered haem biosynthesis. Clin. Sci. 1979; 56: 61-69.
Meyer, HD. Porphyrins. In: Henschen, A; Hupe, KP; Lottspeich, F; Voelter, W, eds. High Performance Liquid Chromatography in Biochemistry. Weinheim (FRG): VCH Verlagsgessellschaft GmbH 1985; 445-479.
Meyer, HD.; Jacob, K. & Vogt, W. Rapid and Simple Direct Determination of Porphyrins in Urine by Ion-Pair Reversed-Phase High Performance Liquid Chromatography. Journal of HRC & CC 1980a; 85-86.
Meyer, HD.; Jacob, K. & Vogt, W. Ion-Pair-Reversed-Phase High-Performance Liquid Chromatographic Determination of Porphyrins from Red Blood Cells. Chromatographia 1982; 16: 190-191.
Meyer, HD.; Jacob, K.; Vogt, W. & Knedel, K. Diagnosis of porphyries by ion-pair high-performance liquid Chromatography. J. Chomatogr. 1980b; 199: 339-343.
www.intechopen.com
Macro to Nano Spectroscopy
24
Nolte, J. El Cerebro Humano. Introducción a la anatomía funcional. Primera Edición española. Madrid: Mosby/Doyma libros, 1994, pp. 33-75. Edición original: Nolte, J. The Human Brain. Third edition. Mosby – Year Book, Inc, MCMXCIII.
Norenberg, MD. Astroglial dysfunction in hepatic encephalopathy. Metab. Brain Dis. 1998; 13: 319-35.
Pearson, PJ. & Slavin, W. A rapid Zeeman graphite furnace atomic absorption spectrophotometric method for the determination of lead in blood. Spectrochem. Acta 1993; 48: 925-939.
Piomelli, S. Free erythrocyte porphyrins in the detection of undue absorption of Pb and Fe deficiency. Clin. Chem. 1977; 23(2): 264-269.
Sakai, T. Biomarkers of Lead Exposure. Ind. Health 2000; 38: 127–142. Sakai, T., Yanagihara, S., Kunugi, Y. & Ushio, K. relationships between distribution of lead
in erythrocytes in vivo and in vitro and inhibition of ALA-D. Br. J. Ind. Med. 1982, 39: 382-387.
Schaller, KH. & Berlin, A. Δ-Aminolaevulinate Dehydratase. In: Methods of Enzymatic Analysis (Volume IV, Third Edition). Bergmeyer, HU, Editor-in-Chief; Bergmeyer, J; Gra┚l, M; eds. Weinheim: Verlag Chemie GmbH, 1984; 363-368.
Schwartz, S.; Berg, MH.; Bossenmaier, I. & Dinsmore, H. Determination of porphyrins in biological materials. In: Methods of Biochemical Analysis, Glick, D., ed. New York: Interscience, 1960, Vol. 8, 221-293.
Skoog, DA. & West, DM. Análisis Instrumental (2ª Edición). México, D.F.: Nueva Editorial Interamericana, S.A. de C.V., 1984, 158-177 y 317-369.
Skoog, DA.; Holler, FJ. & Nieman, TA. Principios de Análisis Instrumental (5ª Edición). Madrid: McGraw-Hill/Interamericana de España, S.A.U., 2001, pp. 122-150 y 219-244.
Skoog, DA.; West, DM.; Holler, FJ. & Crouch, SR: Fundamentos de Química Analítica (8ª Edición, 2a reimpresión). Madrid: Paraninfo, 2008, 719-723 y 870-880.
Taylor, A.; Branco, S.; Halls, D.; Patriarca, M.; & White, M. Atomic spectrometry update. Clinical and biological materials, foods and beverages. J. Anal. Atom. Spectr. 2002; 17: 414- 455.
Thomson, AM. A magnesium-sensitive post-synaptic potential in rat cerebral cortex resembles neuronal responses to N-methylaspartate. J. Physiol. 1986; 370: 531-49.
Tomokuni, K. & Ogata, M. Relationship between lead concentration in blood and biological response for porphyrin metabolism in Workers occupationally exposed to lead. Arch. Toxicol. 1976, 35: 239-246.
Trasobares, EM. Plomo y mercurio en sangre en una población laboral hospitalaria y su relación con factores de exposición. Tesis Doctoral. Madrid: Universidad Complutense, 2010. ISBN: 978-84-693-6339-3.
Vercruysse, A., ed. Techniques and Instrumentation in Analytical Chemistry, Volume 4. Evaluation of Analytical Methods in Biological Systems, Part B: Hazardous Metals in Human Toxicology. Amsterdam, The Netherlands: Elsevier Science Publishers, B.V. 1984.
Weissenborn, K. Pallidal lesion in patiens with liver cirrosis: Clinical and MRI evaluation. Metab. Brain Dis. 1995; 10: 219-231.
Willard, HH.; Merritt, LL.; Dean, JA. & Settle, FA. Jr. Métodos Instrumentales de Análisis. México, D.F.: Grupo Editorial Iberoamérica, 1991, 95-100 y 219-252.
www.intechopen.com
Macro To Nano SpectroscopyEdited by Dr. Jamal Uddin
ISBN 978-953-51-0664-7Hard cover, 448 pagesPublisher InTechPublished online 29, June, 2012Published in print edition June, 2012
InTech EuropeUniversity Campus STeP Ri Slavka Krautzeka 83/A 51000 Rijeka, Croatia Phone: +385 (51) 770 447 Fax: +385 (51) 686 166www.intechopen.com
InTech ChinaUnit 405, Office Block, Hotel Equatorial Shanghai No.65, Yan An Road (West), Shanghai, 200040, China
Phone: +86-21-62489820 Fax: +86-21-62489821
In the last few decades, Spectroscopy and its application dramatically diverted science in the direction of brandnew era. This book reports on recent progress in spectroscopic technologies, theory and applications ofadvanced spectroscopy. In this book, we (INTECH publisher, editor and authors) have invested a lot of effortto include 20 most advanced spectroscopy chapters. We would like to invite all spectroscopy scientists to readand share the knowledge and contents of this book. The textbook is written by international scientists withexpertise in Chemistry, Biochemistry, Physics, Biology and Nanotechnology many of which are active inresearch. We hope that the textbook will enhance the knowledge of scientists in the complexities of somespectroscopic approaches; it will stimulate both professionals and students to dedicate part of their futureresearch in understanding relevant mechanisms and applications of chemistry, physics and material sciences.
How to referenceIn order to correctly reference this scholarly work, feel free to copy and paste the following:
José Manuel González-López, Elena María González-Romarís, Isabel Idoate-Cervantes and Jesús FernandoEscanero (2012). Atomic Absorption Spectroscopy: Fundamentals and Applications in Medicine, Macro ToNano Spectroscopy, Dr. Jamal Uddin (Ed.), ISBN: 978-953-51-0664-7, InTech, Available from:http://www.intechopen.com/books/macro-to-nano-spectroscopy/atomic-absorption-spectroscopy-fundamentals-and-applications-in-medicine

© 2012 The Author(s). Licensee IntechOpen. This is an open access articledistributed under the terms of the Creative Commons Attribution 3.0License, which permits unrestricted use, distribution, and reproduction inany medium, provided the original work is properly cited.