Atmospheric Methane: Trends and Impacts 2002.pdfAtmospheric Methane: Trends and Impacts ... CH4...
43
Atmospheric Methane: Trends and Impacts Donald J. Wuebbles and Katharine Hayhoe Department of Atmospheric Sciences, University of Illinois, Urbana, IL Key words: methane, greenhouse gas, atmospheric chemistry, global change Abstract: The concentration of methane (CH 4 ), the most abundant organic trace gas in the atmosphere, has increased dramatically over the last few centuries, more than doubling its concentration. The increasing concentrations of methane are of special concern because of its effects on climate and atmospheric chemistry. On a per molecule basis, additional methane is much more effective as a greenhouse gas than additional CO 2 . Methane is also important to both tropospheric and stratospheric chemistry. Here, we examine past trends in the concentration of methane, the sources and sinks affecting its growth rate, and the factors that could affect its growth rate in the future. This study also examines the current understanding of the effects of methane on atmospheric chemistry and climate. 1. INTRODUCTION Methane (CH 4 ) is the most abundant organic trace gas in the atmosphere. Concentrations of CH 4 have more than doubled since pre-industrial times. Currently CH 4 has a globally averaged mixing ratio of about 1750 ppbv 1 (NOAA CMDL data, Dlugokencky, pers. comm.). The effects of CH 4 on climate and atmospheric chemistry raise concern over its high growth rate. Following water vapor and carbon dioxide (CO 2 ), methane is the most abundant greenhouse gas in the troposphere. On a per molecule basis, 1 J. van Ham et al. (eds.), Non-CO 2 Greenhouse Gases: Scientific Understanding, Control and Implementation, 425-432. 2000 Kluwer Academic Publishers. Printed in the Netherlands. 1 ppbv = parts per billion (10 9 ) by volume
Transcript of Atmospheric Methane: Trends and Impacts 2002.pdfAtmospheric Methane: Trends and Impacts ... CH4...
Atmospheric Methane: Trends and Impacts
Donald J. Wuebbles and Katharine Hayhoe Department of Atmospheric Sciences, University of Illinois, Urbana, IL
Key words: methane, greenhouse gas, atmospheric chemistry, global change
Abstract: The concentration of methane (CH4), the most abundant organic trace gas in the atmosphere, has increased dramatically over the last few centuries, more than doubling its concentration. The increasing concentrations of methane are of special concern because of its effects on climate and atmospheric chemistry. On a per molecule basis, additional methane is much more effective as a greenhouse gas than additional CO2. Methane is also important to both tropospheric and stratospheric chemistry. Here, we examine past trends in the concentration of methane, the sources and sinks affecting its growth rate, and the factors that could affect its growth rate in the future. This study also examines the current understanding of the effects of methane on atmospheric chemistry and climate.
1. INTRODUCTION
Methane (CH4) is the most abundant organic trace gas in the atmosphere. Concentrations of CH4 have more than doubled since pre-industrial times. Currently CH4 has a globally averaged mixing ratio of about 1750 ppbv1 (NOAA CMDL data, Dlugokencky, pers. comm.). The effects of CH4 on climate and atmospheric chemistry raise concern over its high growth rate. Following water vapor and carbon dioxide (CO2), methane is the most abundant greenhouse gas in the troposphere. On a per molecule basis,
1 J. van Ham et al. (eds.), Non-CO2 Greenhouse Gases: Scientific Understanding, Control and Implementation, 425-432. 2000 Kluwer Academic Publishers. Printed in the Netherlands.
1 ppbv = parts per billion (109) by volume
2 Donald J. Wuebbles and Katharine Hayhoe additional methane is actually much more effective as a greenhouse gas than additional CO2. Methane is also the most abundant reactive trace gas in the troposphere and its reactivity is important to both tropospheric and stratospheric chemistry. The oxidation of CH4 by hydroxyl (OH) in the troposphere leads to the formation of formaldehyde (CH2O), carbon monoxide (CO), and, with sufficient nitrogen oxides (NOx), to ozone (O3). Along with CO, methane helps control the amount of OH in the troposphere. Methane also affects the concentrations of water vapor and ozone in the stratosphere and plays a key role in the conversion of reactive chlorine to less reactive HCl in the stratosphere.
The purpose of this paper is to examine the past trends in the concentration of methane, the sources and sinks affecting its growth rate, and the factors that could affect its future growth rate. This study also examines the current understanding of the effects of methane on atmospheric chemistry and on climate.
2. RECORD & BUDGET OF ATMOSPHERIC METHANE
Distribution and Trend
1.1.1 Atmospheric CH4 in the distant past
Air bubbles trapped in polar ice provide a continuous record of the atmospheric concentration of methane (e.g., Brook et al., 1996; Raynaud et al., 1993; Jouzel et al, 1993; Chappellaz et al., 1990; Legrand et al., 1988). Ice cores from Greenland and Antarctica now extend the record of atmospheric CH4, CO2 and temperature back to 420,000 years BP (Petit et al., 1999), covering four glacial-interglacial cycles.
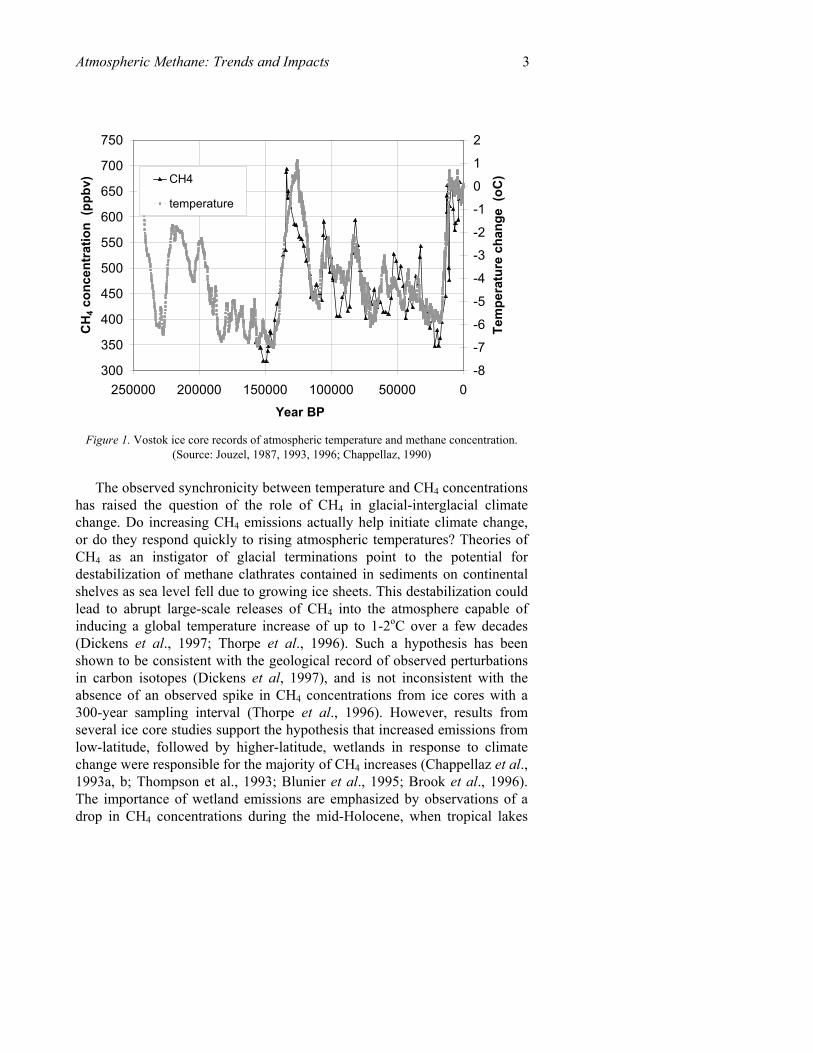
The record shown in Figure 1 reveals two important characteristics of past CH4 concentrations with implications for future climate. First, present-day CH4 levels appear to be unprecedented during any time in the past. Ice core records show glacial-interglacial transitions rising from 320-350 ppbv up to a maximum of 650-780 ppbv (Petit et al., 1999), corresponding to a source increase of up to 50 TgCH4 (Brook et al., 1996). This is less than half of present-day concentrations, which are currently rising past 1700 ppbv. Secondly, CH4 is closely tied to atmospheric temperature records, decreasing and rising in phase with temperature at the inception and termination of glacial episodes (e.g., Petit et al., 1999; Chappellaz et al., 1993; Raynaud et al., 1988).
Atmospheric Methane: Trends and Impacts 3
300
350
400
450
500
550
600
650
700
750
050000100000150000200000250000 Year BP
CH 4
con
cent
ratio
n (p
pbv)
-8
-7
-6
-5
-4
-3
-2
-1
0
1
2
Tem
pera
ture
cha
nge
(oC
)CH4
temperature
Figure 1. Vostok ice core records of atmospheric temperature and methane concentration. (Source: Jouzel, 1987, 1993, 1996; Chappellaz, 1990)
The observed synchronicity between temperature and CH4 concentrations has raised the question of the role of CH4 in glacial-interglacial climate change. Do increasing CH4 emissions actually help initiate climate change, or do they respond quickly to rising atmospheric temperatures? Theories of CH4 as an instigator of glacial terminations point to the potential for destabilization of methane clathrates contained in sediments on continental shelves as sea level fell due to growing ice sheets. This destabilization could lead to abrupt large-scale releases of CH4 into the atmosphere capable of inducing a global temperature increase of up to 1-2oC over a few decades (Dickens et al., 1997; Thorpe et al., 1996). Such a hypothesis has been shown to be consistent with the geological record of observed perturbations in carbon isotopes (Dickens et al, 1997), and is not inconsistent with the absence of an observed spike in CH4 concentrations from ice cores with a 300-year sampling interval (Thorpe et al., 1996). However, results from several ice core studies support the hypothesis that increased emissions from low-latitude, followed by higher-latitude, wetlands in response to climate change were responsible for the majority of CH4 increases (Chappellaz et al., 1993a, b; Thompson et al., 1993; Blunier et al., 1995; Brook et al., 1996). The importance of wetland emissions are emphasized by observations of a drop in CH4 concentrations during the mid-Holocene, when tropical lakes
4 Donald J. Wuebbles and Katharine Hayhoe may have dried (Blunier et al., 1995), and interactions between climatic influences and ecosystem dynamics would have reduced wetland emissions (Velichko et al., 1998). A high-resolution technique for sampling ice cores has shown that CH4 increases at the end of the Younger Dryas cold period began somewhere between 0-30 years after an abrupt temperature increase. The majority of CH4 increase comes after the warming - thus ruling out the causal role of CH4 in glacial-interglacial climate change (Severinghaus et al., 1998).
Comparison of CH4 concentrations in Greenland and Antarctica over the Holocene, including the last century, shows a hemispherical gradient of 30-60 ppbv. This indicates consistently larger emissions in the Northern Hemisphere, with the contrasting influences of anthropogenic emissions in the NH and tropical wetland emissions acting to balance out the gradient (Etheridge et al., 1998; Nakazawa et al., 1993; Chappellaz et al., 1997).
1.1.2 Pre-industrial to present
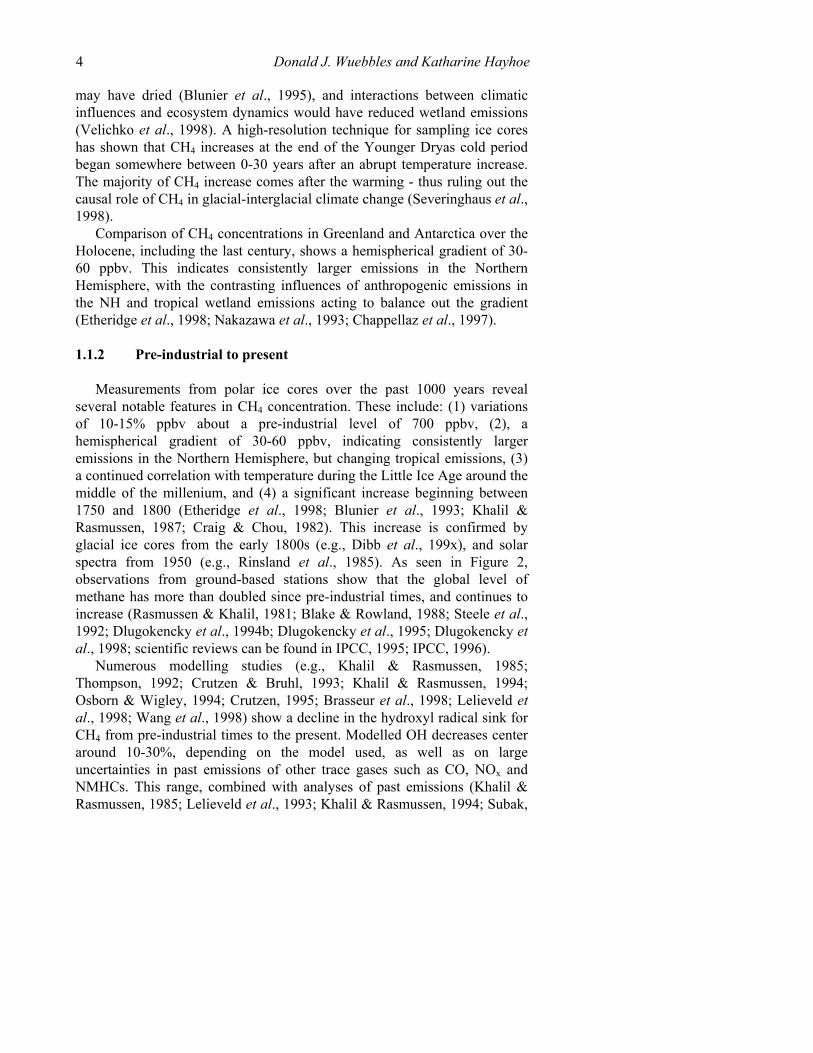
Measurements from polar ice cores over the past 1000 years reveal several notable features in CH4 concentration. These include: (1) variations of 10-15% ppbv about a pre-industrial level of 700 ppbv, (2), a hemispherical gradient of 30-60 ppbv, indicating consistently larger emissions in the Northern Hemisphere, but changing tropical emissions, (3) a continued correlation with temperature during the Little Ice Age around the middle of the millenium, and (4) a significant increase beginning between 1750 and 1800 (Etheridge et al., 1998; Blunier et al., 1993; Khalil & Rasmussen, 1987; Craig & Chou, 1982). This increase is confirmed by glacial ice cores from the early 1800s (e.g., Dibb et al., 199x), and solar spectra from 1950 (e.g., Rinsland et al., 1985). As seen in Figure 2, observations from ground-based stations show that the global level of methane has more than doubled since pre-industrial times, and continues to increase (Rasmussen & Khalil, 1981; Blake & Rowland, 1988; Steele et al., 1992; Dlugokencky et al., 1994b; Dlugokencky et al., 1995; Dlugokencky et al., 1998; scientific reviews can be found in IPCC, 1995; IPCC, 1996).
Numerous modelling studies (e.g., Khalil & Rasmussen, 1985; Thompson, 1992; Crutzen & Bruhl, 1993; Khalil & Rasmussen, 1994; Osborn & Wigley, 1994; Crutzen, 1995; Brasseur et al., 1998; Lelieveld et al., 1998; Wang et al., 1998) show a decline in the hydroxyl radical sink for CH4 from pre-industrial times to the present. Modelled OH decreases center around 10-30%, depending on the model used, as well as on large uncertainties in past emissions of other trace gases such as CO, NOx and NMHCs. This range, combined with analyses of past emissions (Khalil & Rasmussen, 1985; Lelieveld et al., 1993; Khalil & Rasmussen, 1994; Subak,
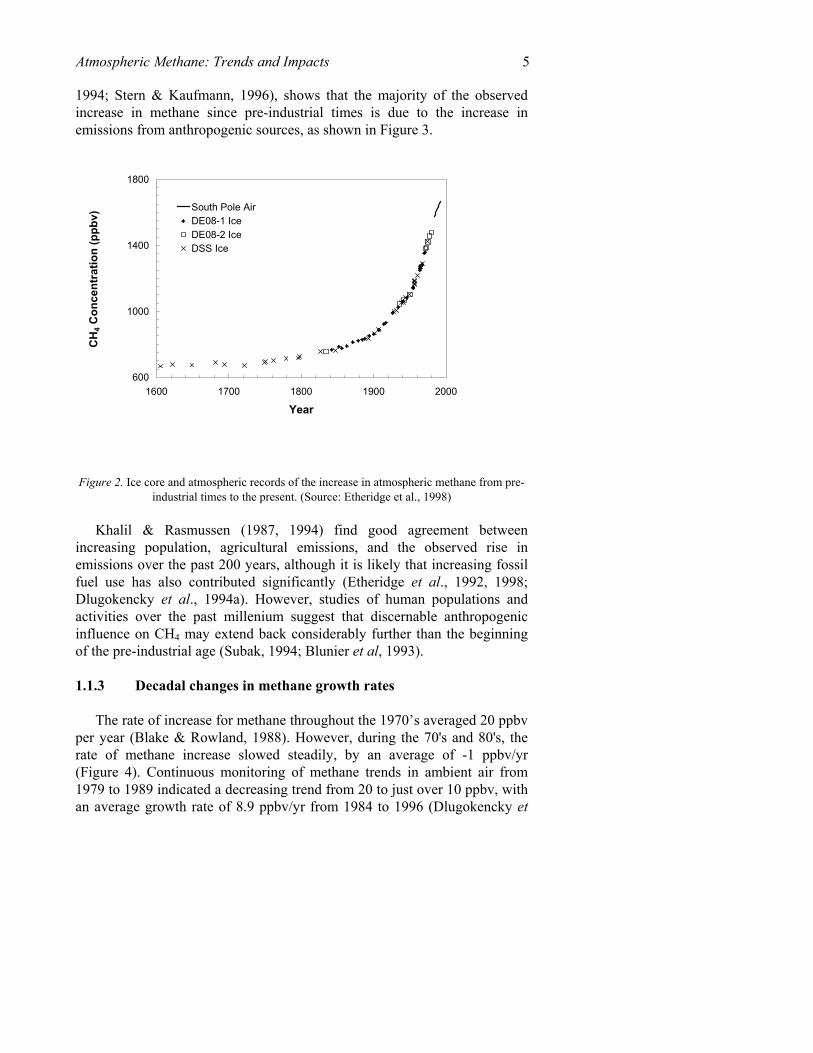
Atmospheric Methane: Trends and Impacts 5 1994; Stern & Kaufmann, 1996), shows that the majority of the observed increase in methane since pre-industrial times is due to the increase in emissions from anthropogenic sources, as shown in Figure 3.
600
1000
1400
1800
1600 1700 1800 1900 2000
Year
CH 4
Con
cent
ratio
n (p
pbv)
South Pole AirDE08-1 IceDE08-2 IceDSS Ice
Figure 2. Ice core and atmospheric records of the increase in atmospheric methane from pre-industrial times to the present. (Source: Etheridge et al., 1998)
Khalil & Rasmussen (1987, 1994) find good agreement between increasing population, agricultural emissions, and the observed rise in emissions over the past 200 years, although it is likely that increasing fossil fuel use has also contributed significantly (Etheridge et al., 1992, 1998; Dlugokencky et al., 1994a). However, studies of human populations and activities over the past millenium suggest that discernable anthropogenic influence on CH4 may extend back considerably further than the beginning of the pre-industrial age (Subak, 1994; Blunier et al, 1993).
1.1.3 Decadal changes in methane growth rates
The rate of increase for methane throughout the 1970’s averaged 20 ppbv per year (Blake & Rowland, 1988). However, during the 70's and 80's, the rate of methane increase slowed steadily, by an average of -1 ppbv/yr (Figure 4). Continuous monitoring of methane trends in ambient air from 1979 to 1989 indicated a decreasing trend from 20 to just over 10 ppbv, with an average growth rate of 8.9 ppbv/yr from 1984 to 1996 (Dlugokencky et
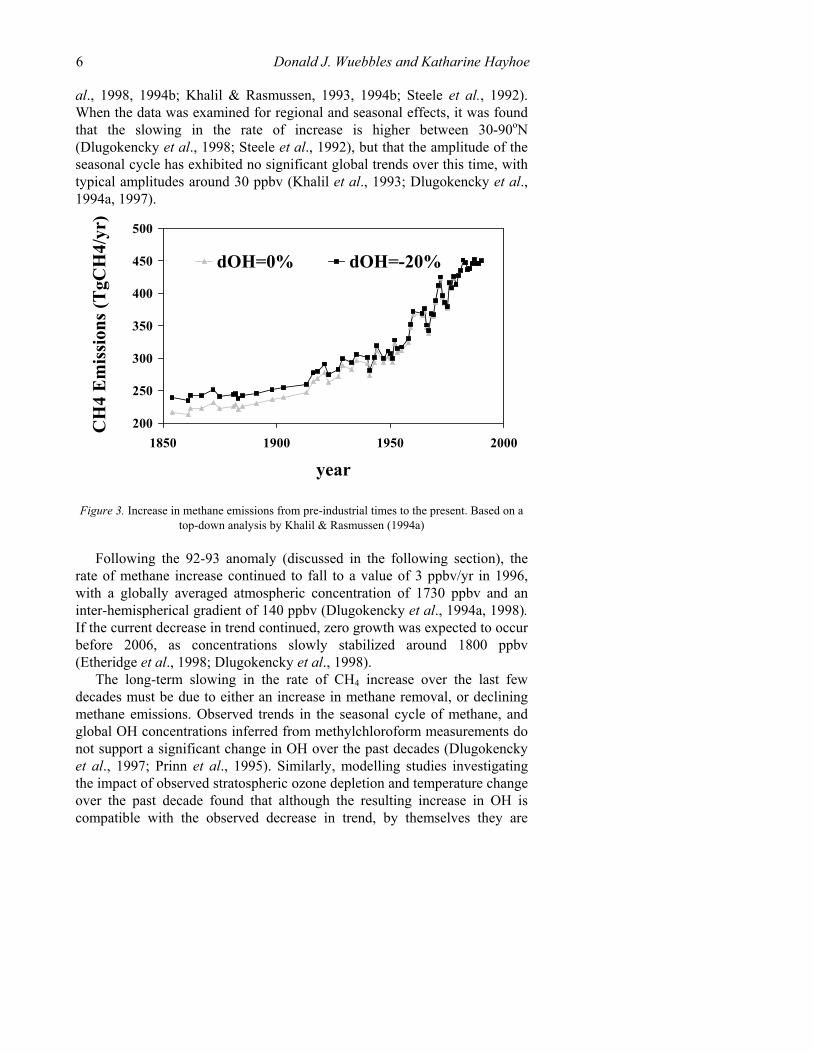
6 Donald J. Wuebbles and Katharine Hayhoe al., 1998, 1994b; Khalil & Rasmussen, 1993, 1994b; Steele et al., 1992). When the data was examined for regional and seasonal effects, it was found that the slowing in the rate of increase is higher between 30-90oN (Dlugokencky et al., 1998; Steele et al., 1992), but that the amplitude of the seasonal cycle has exhibited no significant global trends over this time, with typical amplitudes around 30 ppbv (Khalil et al., 1993; Dlugokencky et al., 1994a, 1997).
200
250
300
350
400
450
500
1850 1900 1950 2000
year
CH
4 E
mis
sion
s (T
gCH
4/yr
)
dOH=0% dOH=-20%
Figure 3. Increase in methane emissions from pre-industrial times to the present. Based on a
top-down analysis by Khalil & Rasmussen (1994a)
Following the 92-93 anomaly (discussed in the following section), the rate of methane increase continued to fall to a value of 3 ppbv/yr in 1996, with a globally averaged atmospheric concentration of 1730 ppbv and an inter-hemispherical gradient of 140 ppbv (Dlugokencky et al., 1994a, 1998). If the current decrease in trend continued, zero growth was expected to occur before 2006, as concentrations slowly stabilized around 1800 ppbv (Etheridge et al., 1998; Dlugokencky et al., 1998).
The long-term slowing in the rate of CH4 increase over the last few decades must be due to either an increase in methane removal, or declining methane emissions. Observed trends in the seasonal cycle of methane, and global OH concentrations inferred from methylchloroform measurements do not support a significant change in OH over the past decades (Dlugokencky et al., 1997; Prinn et al., 1995). Similarly, modelling studies investigating the impact of observed stratospheric ozone depletion and temperature change over the past decade found that although the resulting increase in OH is compatible with the observed decrease in trend, by themselves they are
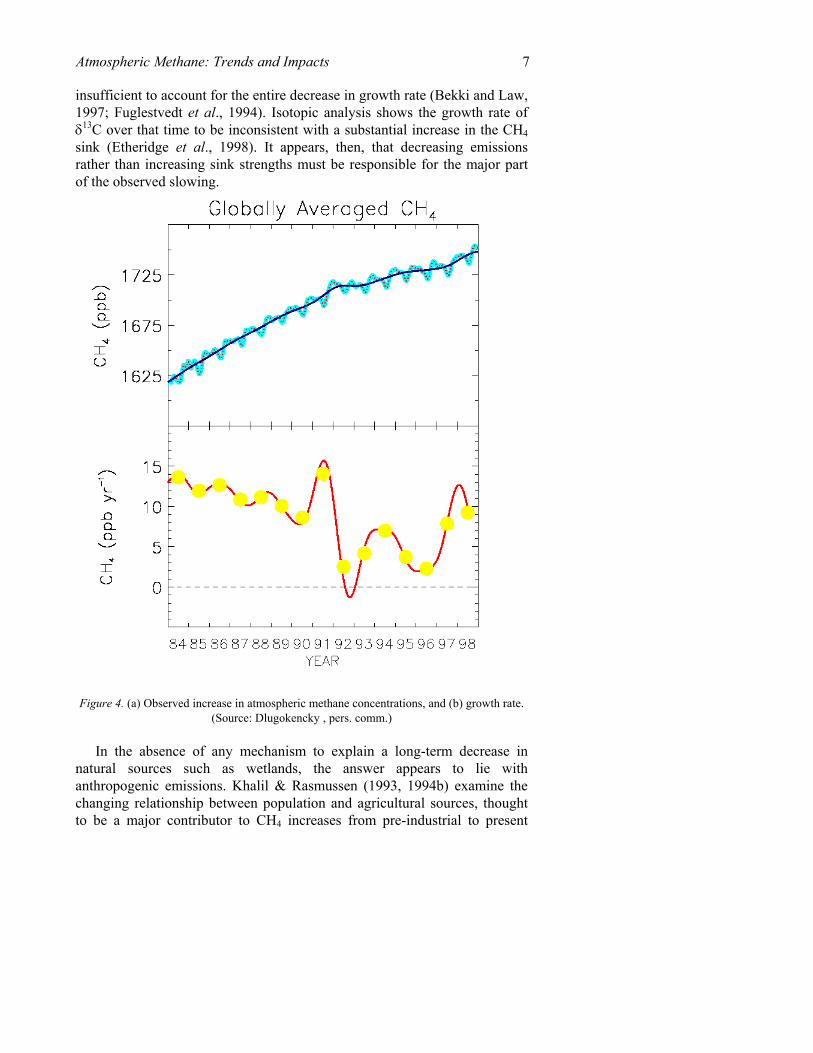
Atmospheric Methane: Trends and Impacts 7 insufficient to account for the entire decrease in growth rate (Bekki and Law, 1997; Fuglestvedt et al., 1994). Isotopic analysis shows the growth rate of δ13C over that time to be inconsistent with a substantial increase in the CH4 sink (Etheridge et al., 1998). It appears, then, that decreasing emissions rather than increasing sink strengths must be responsible for the major part of the observed slowing.
Figure 4. (a) Observed increase in atmospheric methane concentrations, and (b) growth rate.
(Source: Dlugokencky , pers. comm.)
In the absence of any mechanism to explain a long-term decrease in natural sources such as wetlands, the answer appears to lie with anthropogenic emissions. Khalil & Rasmussen (1993, 1994b) examine the changing relationship between population and agricultural sources, thought to be a major contributor to CH4 increases from pre-industrial to present
8 Donald J. Wuebbles and Katharine Hayhoe times, to show that these sources may be slowing. Steele et al. (1992) suggest that human sources, particularly those sources which can be reduced quickly, may be the cause of the observed rapid deceleration of the growth rate in the Northern relative to the Southern Hemisphere. Although the exact cause of this long-term decline in the global methane rate is still unresolved, Dlugokencky et al. (1998) suggest that what has been observed was in fact an approach to steady state, as CH4 net emissions and sinks were nearly constant over the past decade.
Further complicating the picture are the latest measurements of CH4 growth rates that show a jump back up to growth rates of 8-12 ppbv/yr in 1997 and 1998 (Figure 4, Dlugokencky, pers. comm.). Although net methane sources may have been relatively constant over the past two decades, it is likely that changes in the distribution of methane sources were occurring during that time, with increases in some sources equaling decreases in others (Dlugokencky et al., 1998). What may be occurring now is an increase in emissions from CH4 source(s) that is larger than can be balanced by concurrent decrease in other source(s). It has been speculated, supported by 13C isotope observations, that the recently observed increase could in fact be the first sign of a biospheric feedback to climate change, as wetland emissions increase in response to the climate warming (Manning, pers. comm.). Observations of anonymously high temperatures and the lack of an obvious reason for a decrease in the OH sink of methane over this time provide indirect evidence in support of this hypothesis. Whatever the true cause of this increase, however, it serves at this time to emphasize our limited understanding of the factors that influence methane sources and sinks, and the large uncertainty this introduces in projections of future concentrations.
1.1.4 1991-1994 drop in growth rates
In 1991, the growth rate of methane increased sharply over a period of 6 months to a year following the eruption of Mt. Pinatubo in June. The growth rate then dropped abruptly to very low values and even zero in some locations from 1992 to 1993. Average growth rate in 1992 was only 1.8 ppbv/yr in the Northern Hemisphere, and 7.7 ppbv/yr in the Southern (Dlugokencky et al., 1994a, b; 1998), a drop that has recently been observed in lower stratospheric CH4 concentrations, with a 4-year time lag (Randel et al., 1999). In 1994, global methane growth rates recovered back up to about 8 ppbv per year, before continuing the previously observed long-term decrease (Dlugokencky et al., 1998). A number of theories suggesting reductions in emissions from anthropogenic or natural sources or a slowing in the rate of CH4 removal have been proposed.
Atmospheric Methane: Trends and Impacts 9
Aerosols released by the Pinatubo eruption blocked UV radiation to the troposphere, which may have led to a drop in OH levels and a consequent sharp increase in the methane growth rate. Dlugokencky et al. (1996) show the initial short-lived increased growth rate to be consistent with this theory; however, the causes for the subsequent decrease in the growth rate have not been resolved.
Increases in tropospheric OH have been proposed as causes for the short-term drop, through mechanisms such as El Niño-induced increases in tropospheric water vapor, an important source of OH (Khalil & Rasmussen, 1993), or aerosol-induced stratospheric ozone depletion, which would cause an increase in tropospheric UV radiation and a subsequent rise in OH formation (Bekki et al., 1994). Enhanced mixing of stratospheric air, with its lower CH4 levels, has also been proposed to result from increased stratospheric temperatures following the Pinatubo eruption (Schauffler & Daniel, 1994). Reductions in emissions from tropical biomass burning, Northern Hemisphere fossil fuel sources, or wetlands have also been put forward as possible contributors to the brief but abrupt slowing (Lowe et al., 1994, 1997; Dlugokencky et al., 1994b; Law & Nisbet, 1996; Hogan & Harriss, 1994).
The ability of these theories to match the observed drop have been constrained by a number of observational and modelling studies comparing source strengths, mixing ratios, and isotopic abundances. Comparison of regional mixing ratios with δ13C isotopic measurements minimize the role of atmospheric chemistry or changes in wetland emissions. Instead, they support a decrease in δ13C-enriched sources such as biomass burning in the Southern Hemisphere or fossil fuel use in the Southern Hemisphere (Lowe et al., 1994, 1997; Gupta et al., 1996). However, using isotopic measurements from six sites, Quay et al. (1999) were unable to distinguish between the possible impacts of changes in biogenic sources, fossil sources, or OH concentration over this time. In addition, it has been shown that a change in the atmospheric CH4 sink may not be detectable in the δ13C ratio for some time (Tans, 1997; Lassey et al., 1999).
Both modelling studies and recent isotopic analyses therefore conclude that several of these mechanisms may have combined to produce the observed drop in growth rates. Estimated changes in individual sources or sinks, with moderate assumptions of their sensitivity to Pinatubo-induced chemistry & temperature changes and human activities, are individually insufficient to account for the entire decrease (Bekki & Law, 1997; Lelieveld et al., 1998).

10 Donald J. Wuebbles and Katharine Hayhoe Sources and Sinks
1.1.5 Sources
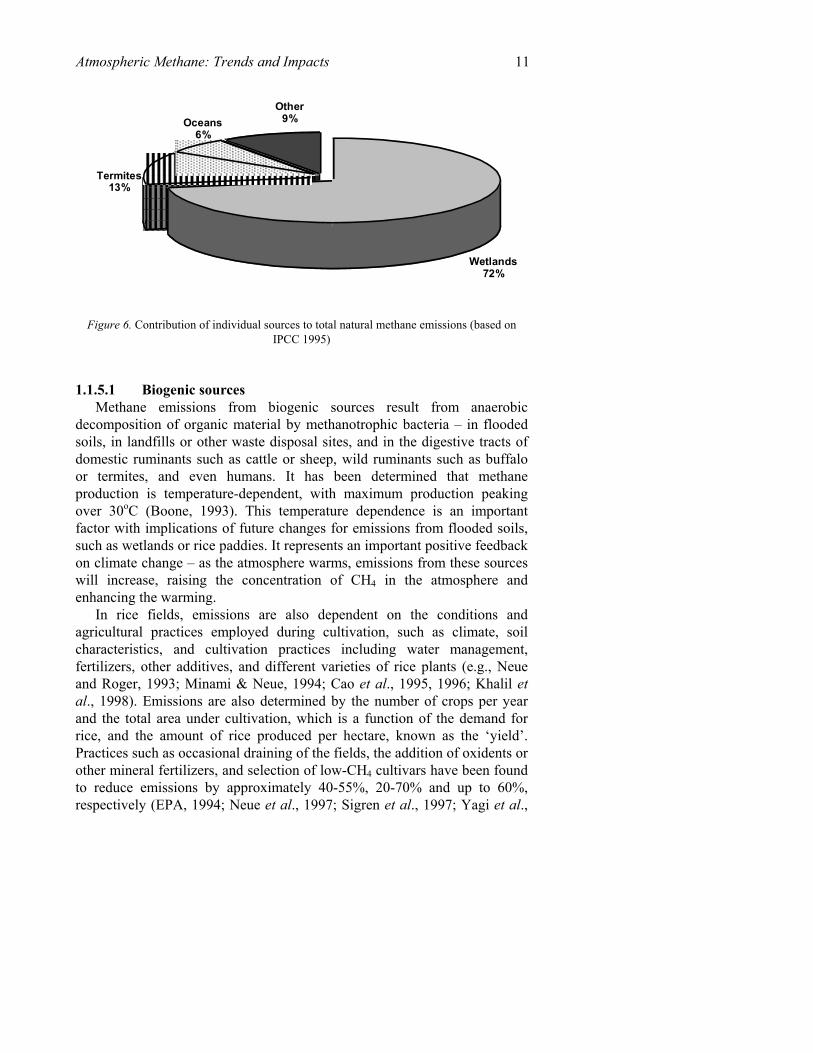
Methane differs from carbon dioxide in that it is released into the atmosphere by a number of sources, both natural and anthropogenic. Anthropogenic emissions arise from biogenic sources related to agriculture and waste disposal, including enteric fermentation, animal and human wastes, rice paddies, biomass burning, and landfills (Figure 5). Methane is also emitted by the extraction of fossil fuels such as natural gas, coal mining, and petroleum. Methane is emitted naturally by wetlands, termites, other wild ruminants, oceans, and hydrates (Figure 6). Based on recent estimates, current human-related biogenic and fossil fuel-related sources for methane are approximately 275 and 100 TgCH4/yr, while total natural sources are around 160 TgCH4/yr (IPCC, 1996a).
biomass burning11%
rice cultivation16%
ruminants23%
waste24%
fossil fuels26%
Figure 5. Contribution of individual sources to total anthropogenic methane emissions (based
on IPCC 1995)
Due to the variety of methane sources, emissions are affected by numerous factors, including energy use, human population distributions, agricultural practices, and climate. Here, we briefly describe the main factors influencing the magnitude of emissions from each major source.
Atmospheric Methane: Trends and Impacts 11
Wetlands72%
Other9%
Termites13%
Oceans6%
Figure 6. Contribution of individual sources to total natural methane emissions (based on
IPCC 1995)
1.1.5.1 Biogenic sources Methane emissions from biogenic sources result from anaerobic
decomposition of organic material by methanotrophic bacteria – in flooded soils, in landfills or other waste disposal sites, and in the digestive tracts of domestic ruminants such as cattle or sheep, wild ruminants such as buffalo or termites, and even humans. It has been determined that methane production is temperature-dependent, with maximum production peaking over 30oC (Boone, 1993). This temperature dependence is an important factor with implications of future changes for emissions from flooded soils, such as wetlands or rice paddies. It represents an important positive feedback on climate change – as the atmosphere warms, emissions from these sources will increase, raising the concentration of CH4 in the atmosphere and enhancing the warming.
In rice fields, emissions are also dependent on the conditions and agricultural practices employed during cultivation, such as climate, soil characteristics, and cultivation practices including water management, fertilizers, other additives, and different varieties of rice plants (e.g., Neue and Roger, 1993; Minami & Neue, 1994; Cao et al., 1995, 1996; Khalil et al., 1998). Emissions are also determined by the number of crops per year and the total area under cultivation, which is a function of the demand for rice, and the amount of rice produced per hectare, known as the ‘yield’. Practices such as occasional draining of the fields, the addition of oxidents or other mineral fertilizers, and selection of low-CH4 cultivars have been found to reduce emissions by approximately 40-55%, 20-70% and up to 60%, respectively (EPA, 1994; Neue et al., 1997; Sigren et al., 1997; Yagi et al.,
12 Donald J. Wuebbles and Katharine Hayhoe 1997; Butterbachbahl et al., 1997; Cole et al., 1997; Mitra et al., 1999). Alternatively, the addition of organic fertilizers has the potential to increase emissions by over 50% relative to non-organic fertilizers (e.g., Buendia et al., 1997; Denier van der Gon & Neue, 1995; Yagi et al., 1997).
Direct emissions from ruminants, including cattle, sheep, buffalo, goats, and other domestic animals, are affected by diet (Johnson et al., 1993; EPA, 1994; Cole et al., 1997). Methane emissions are a by-product of incomplete digestion. In general, higher quality diets will allow animals to digest their food more completely, improving protein uptake while reducing CH4 emissions. This is particularly true of ruminant diets in developing countries, where improving the relatively poor food quality could lead to emission reductions per kg of milk produced of up to 75% (Ward et al., 1993; Crutzen et al., 1986). The addition of production-enhancing supplements to cattle diet has also been suggested as a means to improve digestion and reduce emissions by up to 40% (EPA, 1994; Cole et al., 1997 and references therein). Animal manure is an additional source of methane. If animal waste is allowed to remain in the field, the manure dries quickly and methane emissions are minimal. However, if the waste is pooled and stored, methane emissions can rise by a factor of 10 (Bogner et al., 1993).
Methane is also emitted by the decay of biogenic waste in the anaerobic environments provided by landfills and wastewater pools. Emissions from landfills are affected by numerous environmental and technical variables, including temperature, soil moisture, and CH4 concentration within the landfill, the amount, organic composition, and age of the waste, the thickness of the overlying layer, etc. (Bogner & Spokas, 1993; Peer et al., 1993; Czepiel et al., 1996). Emissions from landfills, wastewater, and manure collection lagoons can be reduced by trapping the methane before it is released to the atmosphere, and either flaring it or using it as an energy source. Depending on the capture efficiency, this method can reduce emissions by over 90% (e.g., Bogner et al., 1993; Borjesson & Svensson, 1997).
Biomass burning releases numerous pollutants into the atmosphere. When combustion is complete, most of the emissions consist of carbon. However, if the fires smolder and combustion is incomplete, large amounts of CH4 and other higher-order hydrocarbons can be produced. Methane emissions from biomass burning depend on the stage of combustion reached, as well as on the carbon content of the biomass, and the amount of biomass burned (Levine et al., 1993).
1.1.5.2 Non-biogenic sources The main source of fossil-fuel related methane emissions are the leaks
that occur during natural gas processing, transmission, and distribution, since
Atmospheric Methane: Trends and Impacts 13 natural gas is over 90% methane (e.g., Beck et al, 1993; EPA, 1993a). The magnitude of this source directly depends on the loss rate, which have been estimated to average between 1 to 2% of natural gas production (GRI, 1997; Beck et al, 1993; EPA, 1993b; Barns and Edmonds, 1990). Uncertainty remains substantial, however, as these values are based mainly on the analysis of gas systems in developed countries where transportation is likely to be more tightly controlled than in less developed nations. Regional leakage percentages have been estimated to range from 1% to 15% of total natural gas production, depending on the quality of the pipelines, the extraction process, leakage control, the method used to estimate gas losses, and other factors (e.g., Mitchell, 1996; Matthews, 1994; Bazhin, 1994; Beck et al, 1993).
Methane is also emitted from coal mines, where gas that has been trapped between layers of coal during its formation is released when the coal is mined. Global and even regional estimates of CH4 emissions from coal and mines depend on many assumptions regarding the type of coal, the depth of the mine, mining practices, the methane content of the coal seam, and whether methane is flared or released (Beck et al., 1993, and references therein).
Methane emissions from coal mining and natural gas use may be more effectively reduced by altering mining practices and improving gas leakage controls than by avoiding coal or gas use. If methane emitted from these sources can be trapped, it can be used as an energy source, providing additional benefits.
1.1.6 CH4 sinks
In contrast to the numerous sources of methane, there are only one major and two minor sinks for tropospheric methane. Reaction with the hydroxyl radical (OH) is responsible for the removal of approximately 500 TgCH4/yr (almost 90% of the total sink), making the concentration of OH the most important determinant of the rate at which methane is destroyed. The remainder of the CH4 is removed through dry soil oxidation, 30 TgCH4/yr (~5%), or transport to the stratosphere, 40 TgCH4/yr (~7%) (IPCC, 1996). However, Gettelman et al. estimated the flux to the stratosphere to be 27 Tg based on data from the Upper Atmosphere Research Satellite.
OH is formed from the photodissociation of tropospheric ozone and water vapour. It is the primary oxidant for most tropospheric pollutants, including carbon monoxide, NOx species, and organic compounds (e.g, Crutzen, 1995). As the most abundant organic species in the atmosphere, methane plays an influential role in determining the tropospheric oxidizing capacity, initiating an important series of chemical reactions (see discussion

14 Donald J. Wuebbles and Katharine Hayhoe in Wuebbles et al., 1999). Methane oxidation by OH is so effective that almost 90% of methane destruction occurs in the troposphere, due to these reactions (e.g., IPCC, 1996). The amount of methane removed is constrained by OH levels and the rate constant of the reaction.
With sharp spatial and temporal gradients, and average concentrations of one part per 50 trillion, the actual concentration of OH is difficult to determine, much less its rate of formation or destruction, which depends non-linearly on the other factors mentioned above (e.g., Thompson, 1992; Crutzen, 1995). A few measurements of OH have been made at certain locations using long-path absorption spectroscopy (e.g., Hofzumahaus et al., 1991; Poppe et al., 1995), and confidence in the accuracy of direct measurements is growing (Brune, 1992). However, most estimates of OH concentration have been obtained through measuring the concentration of a tracer molecule such as methylchloroform (CH3CCl3) that can be used to infer the OH concentration with a chemical transport model. Using CH3CCl3 data from 1978 to 1994 obtained at five ALE/GAGE stations around the globe, modelling studies deduced the average globally-integrated concentration of OH to be 9.7 x 10⁵ (Prinn et al., 1995) and 1.07 x 10⁶ molecules/cm3 (Krol et al., 1998). Over the same time period, the studies by Prinn and Krol obtained a change in OH concentration of 0.0±0.2%/yr and 0.46±0.5%/yr, respectively.
OH concentrations are affected not only by direct emissions of methane but by its oxidation products, especially carbon monoxide. Methane has an atmospheric lifetime of 8.9±0.6 based on analyses of methyl chloroform and good knowledge of the loss rate with OH (Prinn et al., 1995). This is lower than the previous estimate of 10 years (WMO, 1991, 1995). Although most trace gases have a turnover time which describes the length of time they are present in the atmosphere, methane is removed by OH on an ‘adjustment’ time scale that exceeds the atmospheric lifetime by approximately three years (e.g., Prather, 1994; IPCC, 1996). The feedback factor that describes this relationship, which is the ratio of the adjustment time of methane to its atmospheric lifetime, varies from 1.2 to 1.7, depending on which model is used in the evaluation.. Comparisons of 2D and 3D models suggest that the factor does not depend strongly on the background atmospheric OH levels (IPCC, 1996).
This discrepancy between adjustment time and chemical lifetime is due to the fact that the hydroxyl radical is removed not only by interactions with CH4, but also with its product, CO. Methane, carbon monoxide, and hydroxyl are involved in a chemical feedback cycle whereby even a small rise in the background level of methane—due to growing emissions—will reduce hydroxyl and produce CO. The carbon monoxide produced by CH4 oxidation will in turn be oxidized by OH, causing a further drop in hydroxyl
Atmospheric Methane: Trends and Impacts 15 levels. This extra decrease in OH results in an increase in the lifetime of methane, thereby enhancing the original perturbation. The result is a positive feedback, whereby increasing methane emissions can lead to an overall decrease in the oxidizing capacity of the troposphere, a slowdown in the removal of methane, and a consequent buildup of methane concentrations.
1.1.7 Budget modelling
Uncertainties in sources and sinks of methane are constrained by direct estimates of the individual magnitudes of each source and sink. However, the methane budget is also constrained by spatial and temporal changes in atmospheric CH4 mixing ratios and isotopes. Although other isotopic signatures exist (Conny and Currie, 1996), 13C is the main isotope used to differentiate between atmospheric methane originating from biogenic sources that is 13C-depleted relative to atmospheric methane (Tyler, 1986), as opposed to the 13C-enriched methane resulting from fossil fuel or biomass burning. Observed 13C abundances are therefore indicative of the relative strength of biogenic vs. fossil sources of CH4, and have been used to infer the causes behind observed changes in atmospheric methane, as well as to constrain the global budget (e.g., Lassey et al., 1993, 1999; Lowe et al., 1994, 1997, 1999; Gupta et al., 1996; Quay et al., 1999).
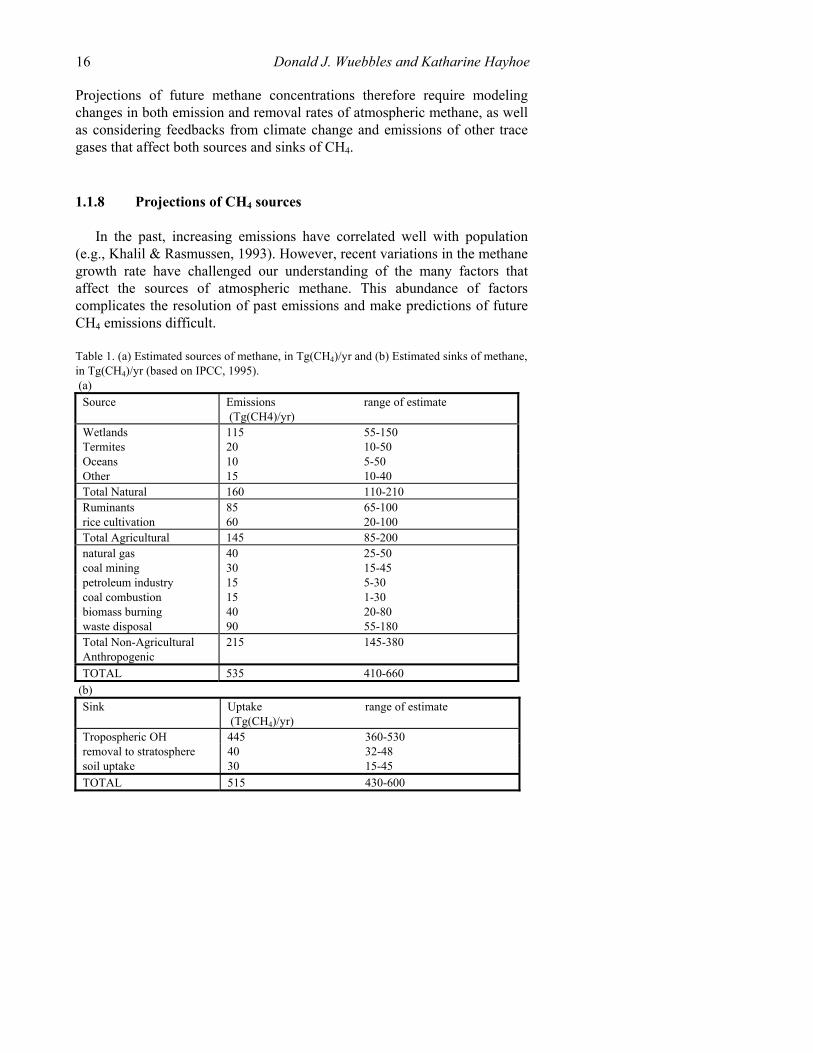
Two- and three-dimensional chemical transport models are used to perform calculations that match modelled emissions, concentrations, and 13C isotopes with observed abundances. In this way, uncertainties in sources and sinks can be reduced, relations between methane emissions, atmospheric chemistry, and the climate system better quantified. A number of studies (Fung et al., 1991; Dlugokencky et al., 1994a; Brown, 1995; Hein et al., 1997) have used this approach, while others have developed new inversion methods (Kandlikar and McRae, 1995; Kandlikar, 1997). These analyses, combined with source-specific studies, produce comprehensive budgets of CH4 sources and sinks such as those shown in Table 1 (IPCC, 1995).
Projections of Future Concentrations
Atmospheric methane concentrations have doubled since pre-industrial times. Increases in methane emissions from human sources such as rice cultivation, domestic ruminants, and increased fossil fuel use are thought to be the primary contributors to the rapid rise that has been observed through records preserved in ice cores, solar spectra, and direct atmospheric measurements.
It is likely that future methane concentrations, however, will be strongly affected by changes in both sources and sinks of atmospheric methane.
16 Donald J. Wuebbles and Katharine Hayhoe Projections of future methane concentrations therefore require modeling changes in both emission and removal rates of atmospheric methane, as well as considering feedbacks from climate change and emissions of other trace gases that affect both sources and sinks of CH4.
1.1.8 Projections of CH4 sources
In the past, increasing emissions have correlated well with population (e.g., Khalil & Rasmussen, 1993). However, recent variations in the methane growth rate have challenged our understanding of the many factors that affect the sources of atmospheric methane. This abundance of factors complicates the resolution of past emissions and make predictions of future CH4 emissions difficult.
Table 1. (a) Estimated sources of methane, in Tg(CH4)/yr and (b) Estimated sinks of methane, in Tg(CH4)/yr (based on IPCC, 1995). (a)
Source Emissions (Tg(CH4)/yr)
range of estimate
Wetlands 115 55-150 Termites 20 10-50 Oceans 10 5-50 Other 15 10-40 Total Natural 160 110-210 Ruminants 85 65-100 rice cultivation 60 20-100 Total Agricultural 145 85-200 natural gas 40 25-50 coal mining 30 15-45 petroleum industry 15 5-30 coal combustion 15 1-30 biomass burning 40 20-80 waste disposal 90 55-180 Total Non-Agricultural Anthropogenic
215 145-380
TOTAL 535 410-660 (b)
Sink Uptake (Tg(CH4)/yr)
range of estimate
Tropospheric OH 445 360-530 removal to stratosphere 40 32-48 soil uptake 30 15-45 TOTAL 515 430-600
Atmospheric Methane: Trends and Impacts 17
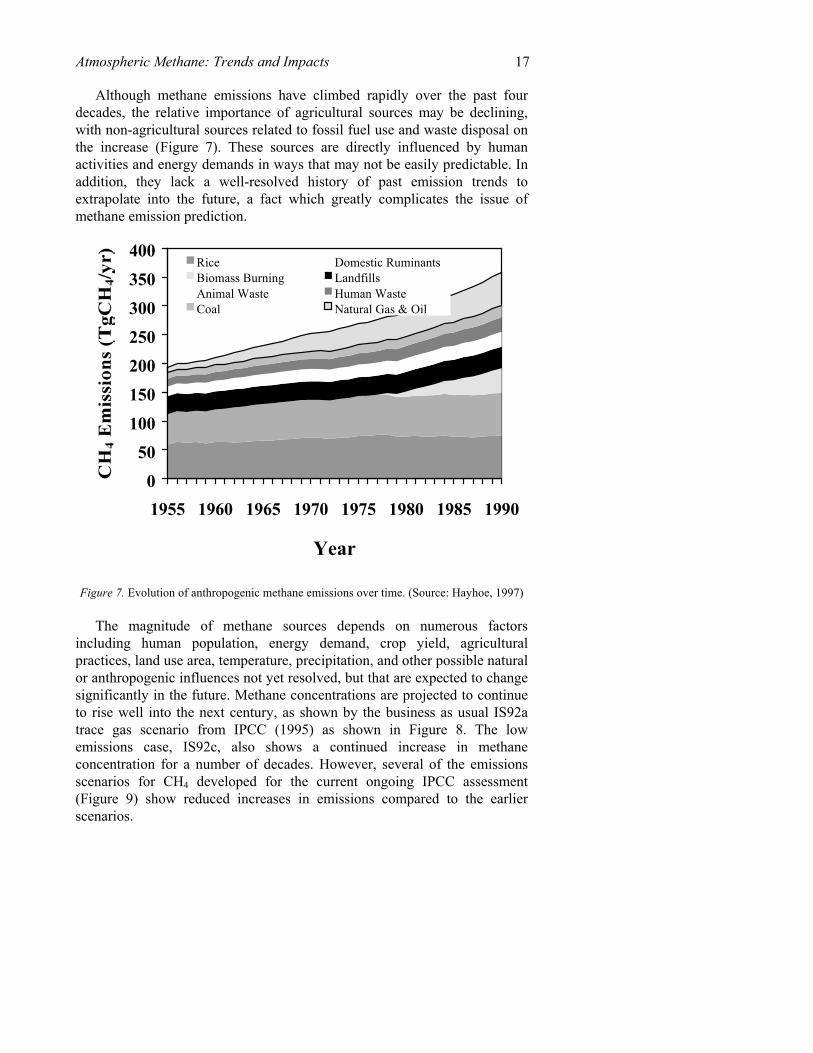
Although methane emissions have climbed rapidly over the past four decades, the relative importance of agricultural sources may be declining, with non-agricultural sources related to fossil fuel use and waste disposal on the increase (Figure 7). These sources are directly influenced by human activities and energy demands in ways that may not be easily predictable. In addition, they lack a well-resolved history of past emission trends to extrapolate into the future, a fact which greatly complicates the issue of methane emission prediction.
050
100
150200250300350400
1955 1960 1965 1970 1975 1980 1985 1990
Year
RiceLandfills
Coal
Domestic RuminantsBiomass BurningAnimal Waste Human Waste
Natural Gas & Oil
Figure 7. Evolution of anthropogenic methane emissions over time. (Source: Hayhoe, 1997)
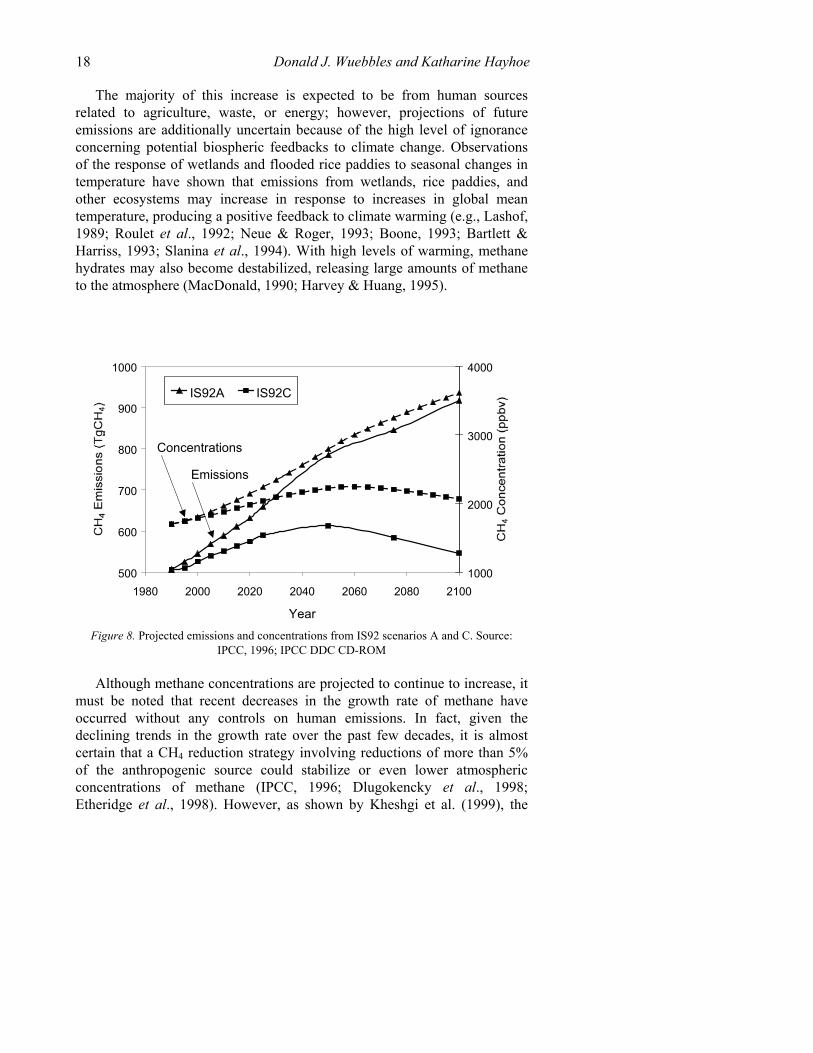
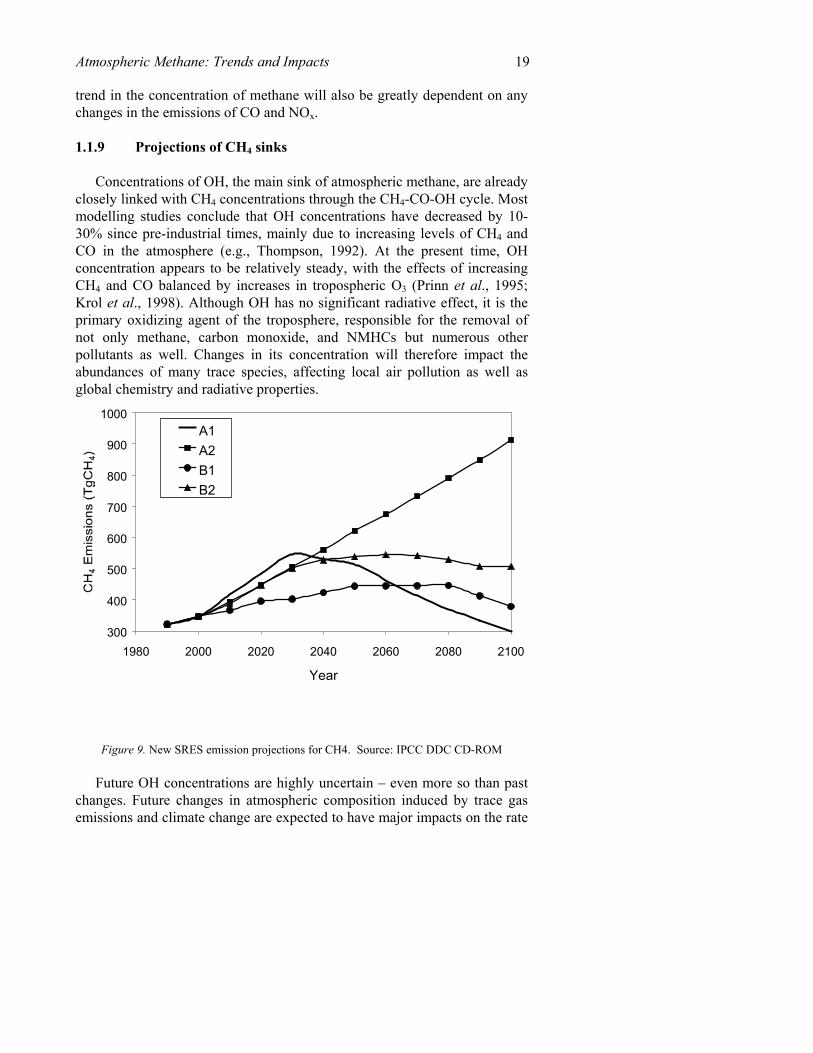
The magnitude of methane sources depends on numerous factors including human population, energy demand, crop yield, agricultural practices, land use area, temperature, precipitation, and other possible natural or anthropogenic influences not yet resolved, but that are expected to change significantly in the future. Methane concentrations are projected to continue to rise well into the next century, as shown by the business as usual IS92a trace gas scenario from IPCC (1995) as shown in Figure 8. The low emissions case, IS92c, also shows a continued increase in methane concentration for a number of decades. However, several of the emissions scenarios for CH4 developed for the current ongoing IPCC assessment (Figure 9) show reduced increases in emissions compared to the earlier scenarios.
18 Donald J. Wuebbles and Katharine Hayhoe
The majority of this increase is expected to be from human sources related to agriculture, waste, or energy; however, projections of future emissions are additionally uncertain because of the high level of ignorance concerning potential biospheric feedbacks to climate change. Observations of the response of wetlands and flooded rice paddies to seasonal changes in temperature have shown that emissions from wetlands, rice paddies, and other ecosystems may increase in response to increases in global mean temperature, producing a positive feedback to climate warming (e.g., Lashof, 1989; Roulet et al., 1992; Neue & Roger, 1993; Boone, 1993; Bartlett & Harriss, 1993; Slanina et al., 1994). With high levels of warming, methane hydrates may also become destabilized, releasing large amounts of methane to the atmosphere (MacDonald, 1990; Harvey & Huang, 1995).
500
600
700
800
900
1000
1980 2000 2020 2040 2060 2080 2100
Year
1000
2000
3000
4000
IS92A IS92C
Concentrations
Emissions
Figure 8. Projected emissions and concentrations from IS92 scenarios A and C. Source: IPCC, 1996; IPCC DDC CD-ROM
Although methane concentrations are projected to continue to increase, it must be noted that recent decreases in the growth rate of methane have occurred without any controls on human emissions. In fact, given the declining trends in the growth rate over the past few decades, it is almost certain that a CH4 reduction strategy involving reductions of more than 5% of the anthropogenic source could stabilize or even lower atmospheric concentrations of methane (IPCC, 1996; Dlugokencky et al., 1998; Etheridge et al., 1998). However, as shown by Kheshgi et al. (1999), the
Atmospheric Methane: Trends and Impacts 19 trend in the concentration of methane will also be greatly dependent on any changes in the emissions of CO and NOx.
1.1.9 Projections of CH4 sinks
Concentrations of OH, the main sink of atmospheric methane, are already closely linked with CH4 concentrations through the CH4-CO-OH cycle. Most modelling studies conclude that OH concentrations have decreased by 10-30% since pre-industrial times, mainly due to increasing levels of CH4 and CO in the atmosphere (e.g., Thompson, 1992). At the present time, OH concentration appears to be relatively steady, with the effects of increasing CH4 and CO balanced by increases in tropospheric O3 (Prinn et al., 1995; Krol et al., 1998). Although OH has no significant radiative effect, it is the primary oxidizing agent of the troposphere, responsible for the removal of not only methane, carbon monoxide, and NMHCs but numerous other pollutants as well. Changes in its concentration will therefore impact the abundances of many trace species, affecting local air pollution as well as global chemistry and radiative properties.
300
400
500
600
700
800
900
1000
1980 2000 2020 2040 2060 2080 2100
Year
A1A2B1B2
Figure 9. New SRES emission projections for CH4. Source: IPCC DDC CD-ROM
Future OH concentrations are highly uncertain – even more so than past changes. Future changes in atmospheric composition induced by trace gas emissions and climate change are expected to have major impacts on the rate
20 Donald J. Wuebbles and Katharine Hayhoe of OH production and destruction. A number of modelling studies predict a range from zero to a 25% decrease in OH concentrations by 2050 (e.g., Thompson et al., 1990; Pinto & Khalil, 1991; Lu & Khalil, 1991; Osborn & Wigley, 1994; Brasseur et al., 1998; Lelieveld et al., 1998; Wang et al., 1998). This small range belies the major changes in OH production and destruction that are projected to occur. These changes balance each other out to a certain extent, particularly in the studies that predict little or no change in net OH levels.
OH destruction is projected to increase in the future due to rising anthropogenic emissions of CH4, CO, NMHCs, and other gases that are oxidized by OH. However, there are a number of additional factors that are projected to balance net OH concentrations by increasing OH production. OH is formed when O3 is photo-dissociated into O(1D), which in turn combines with water vapor to form two OH radicals, as shown by the following equations:
O3 + hν → O(1D) + O2 (1)
O(1D) + H2O → OH + OH (2)
Emissions of NOx, an important component of local air pollution in urban areas, result in O3 formation which in turn increases OH production (Eqn. 1). Stratospheric ozone pollution increases the flux of photons penetrating down to the troposphere, also promoting OH formation (Eqn. 1). As climate warms, rising temperatures will enhance global evaporation rates, causing tropospheric water vapor levels to rise. This will also increase OH production (Eqn. 2). On the other hand, increases in tropospheric water vapor could also increase global mean cloud cover, which would decrease uv flux to the troposphere and decrease OH formation rates.
Although global average OH levels determine the average lifetime of CH4, several studies emphasize the importance of tropical OH levels in determining future changes in OH (Thompson et al., 1989; Crutzen & Zimmermann, 1991; Lelieveld et al., 1998). OH levels are highest in the tropics, with abundant water vapor and UV radiation ensuring high production rates. CH4 emissions from important sources such as rice cultivation, biomass burning, and domestic ruminants are also highest in the tropics. However, the tropics is also the region where the greatest changes in land use and industrialization are expected to occur in the future. What happens in this area will to a large part determine the future of OH concentrations in the atmosphere.
Atmospheric Methane: Trends and Impacts 21
The soil sink for methane, although substantially smaller than the OH sink, is also expected to change in the future. Methane oxidation in soil is sensitive to temperature and soil water content (Mancinelli, 1995; King, 1997), both of which may be altered by climate change. Perhaps more importantly, arable land has a much smaller CH4 uptake rate than untreated soils, particularly when treated with certain fertilizers (e.g., Boeckx et al., 1997; Mosier et al., 1997b, Powlson et al., 1997). Land use change, as forests and grasslands are converted to agriculture, has already decreased the soil sink, and are likely to continue to do so in the future (King, 1997; Mosier et al., 1997a). Even when converted back to its natural state, previously cultivated land continue to have a lower oxidation rate than untouched areas (e.g., Dobbie & Smith, 1996; Hudgens & Yavitt, 1997; Prieme et al., 1997). This apparent irreversibility of human impact on the CH4 oxidation rates has important implications for the future of land management strategies, as growing populations continue to exert pressure on natural ecosystems.
2. ROLE OF METHANE IN THE GLOBAL ENVIRONMENT
Effects on Tropospheric and Stratospheric Chemistry
2.1.1 Methane and tropospheric chemistry
On a global scale, methane oxidation is one of the major reaction pathways affecting atmospheric concentrations of hydroxyl. Depending on nitric oxide levels, methane oxidation can be either a production or destruction process for odd-hydrogen (OH + HO2). Thus, different chemically coherent (Thompson et al., 1989) regions can be distinguished on the basis of concentrations of nitrogen oxides. Polluted (high NOx) environments where odd hydrogen is produced include the temperate zone of the Northern Hemisphere and planetary boundary layer of the tropics during the dry season. Unpolluted (low NOx) environments where odd hydrogen is destroyed include marine areas, the free troposphere over the tropics, and most of the Southern Hemisphere (e.g., Fishman et al., 1979; Crutzen, 1988; Cicerone and Oremland, 1988; WMO, 1991, 1995). Under warm, humid conditions, nitrogen oxide levels must be substantially higher. In general, these conclusions apply to the boundary layer. Most current modeling
22 Donald J. Wuebbles and Katharine Hayhoe studies suggest an increase in methane will increase ozone throughout most of rest of the troposphere.
The methane oxidation cycle is an important source of carbon monoxide, accounting for roughly a quarter of the carbon monoxide in the troposphere. Carbon monoxide concentrations are a great deal more variable than methane, due to its relatively short atmospheric lifetime (approximately 1-3 months) and because of the variety of natural and anthropogenic sources that contribute to its budget. These sources include fossil fuel combustion, biomass burning in the tropics, and the oxidation of natural hydrocarbons (those emitted by vegetation, e.g. isoprene). As in the case of methane, the carbon monoxide oxidation cycle also depends on the levels of nitric oxide present in the atmosphere.
Based on the reaction sequences for methane, formaldehyde, and carbon monoxide in polluted as well as unpolluted environments, the effect of the complete oxidation of one mole of methane on odd hydrogen is +0.4 to 0.5 moles in the high NOx case and -3.5 to -3.9 in the low NOx case. Correspondingly the change in ozone for complete oxidation of methane is +3.6 to 3.8 moles for the high NOx case and -1.7 to -1.8 moles for the low NOx case. According to our calculations, the catalytic subcycle involving methylperoxyl (CH3O2) reaction with hydroperoxyl (HO2) and methyl peroxide (CH3O2H) reaction with OH has a sizeable impact on the amount of odd hydrogen loss in the low NOx case. Crutzen (1989) included this cycle in his results whereas lower effects determined by Cicerone and Oremland (1988) did not include its effect. Our analyses of the resulting changes in odd-hydrogen and ozone are substantially in agreement with Crutzen (1989) for both cases. The resultant destruction of odd hydrogen depends on the hydroxyl concentration, the methyl peroxide chemical reaction pathways, and the heterogeneous removal rates of important intermediate species.
Formaldehyde is an important intermediate in the removal processes of methane and other hydrocarbons as well as being important in the general chemical reactivity of the troposphere. Regardless of the nitric oxide levels, methane oxidation is responsible for much of the formaldehyde in the atmosphere. Based on the estimate of Lowe and Schmidt (1983), the formaldehyde production rate is on the order of 1014 grams per year. The other major photochemical precursors of formaldehyde consist of nonmethane hydrocarbons and higher aldehydes. The non-methane hydrocarbons are emitted from natural and anthropogenic sources while the higher aldehydes are produced by in situ photochemistry. There are appreciable anthropogenic sources of formaldehyde as well (e.g. automobile exhaust).
In order to analyze the photochemical mechanisms that produce formaldehyde, we must distinguish between different regions on the basis of
Atmospheric Methane: Trends and Impacts 23 nitrogen oxide levels. In the methane oxidation mechanism under low nitrogen oxide conditions, methyl peroxide reacts with hydroxyl to produce formaldehyde. Since methyl peroxide has a long lifetime against photolysis, heterogeneous processes (which occur on aerosols) can serve as a loss mechanism for this species in unpolluted environments. This implies that formaldehyde production is controlled by aerosol concentrations in remote regions. However, in polluted environments formaldehyde formation does not involve methyl peroxide. In this case, it would be regulated by nitric oxide concentrations because methylperoxyl is reduced to methoxyl. Methoxyl then reacts with oxygen to produce formaldehyde.
Once it is generated, formaldehyde is destroyed rather quickly under direct insolation. During the daytime, photolysis is the dominant loss process for formaldehyde in the remote troposphere while in polluted atmospheres reaction with hydroxyl and hydroperoxyl will be comparable to photolytic degradation. At night, the only appreciable formaldehyde consumption is by reaction with nitrate radical (NO3) but this is slow in comparison to the daytime reactions with hydroxyl and hydroperoxyl.
Approximately 10% of the ozone in the atmosphere is located in the troposphere. The downward transport of ozone from the stratosphere traditionally was thought to be the major source of tropospheric ozone (Crutzen, 1988 and references therein). It is now generally regarded that the net tropospheric photochemical production of ozone is of similar magnitude to the downward transport source (e.g., Fishman et al., 1979; Fishman, 1985; WMO, 1985; Isaksen, 1988; Penkett, 1988; Hough and Derwent, 1990, WMO, 1995).
Nitrogen dioxide photolysis is by far the primary photochemical mechanism for producing ozone in the troposphere. This implies that the generation rate is roughly proportional to the concentration of nitric oxide. High concentrations of nitrogen oxides over the continental boundary layer signify that this region is likely a net source of ozone. Increases in nitric oxide emissions may lead to further ozone increases, especially in the tropics. However, the magnitude of odd oxygen (O + O(1D) + O3 ) production is ultimately limited by the supply of carbon monoxide, methane, and nonmethane hydrocarbons. The oxidation of one mole of carbon monoxide molecule can form one mole of ozone. In contrast, the complete oxidation of a mole of methane can produce 3 to 4 moles of ozone. Because there are insufficient nitrogen oxides present in the background troposphere, only about 10% of the potential tropospheric ozone production is being realized.
24 Donald J. Wuebbles and Katharine Hayhoe 2.1.2 Methane and stratospheric chemistry
Although about 85 % of the total emissions of methane is consumed by reaction with tropospheric hydroxyl (Cicerone and Oremland, 1988), the remaining methane flux, on average about 60 teragrams of methane per year (Tg CH4 / year), enters the stratosphere. In the stratosphere and above, the reaction with OH continues to be the dominant sink, but reactions with chlorine atoms and excited oxygen atoms are also important. Reaction with chlorine atoms account for about 9 % of the methane loss (Brenninkmeijer et al., 1995). Measurements (e.g., Burnett and Burnett, 1995) also suggest that the increased oxidation of methane resulting from increasing concentrations of chlorine in the stratosphere has led to enhanced production of stratospheric OH.
In order to put the role of methane in stratospheric chemistry into context, it is useful to first discuss the importance of ozone and the changes occurring in its distribution. Changes in the distribution and amount of ozone in the global troposphere and stratosphere have received much attention. Much of the concern about ozone has centered on the importance of ozone as an absorber of ultraviolet radiation; its concentrations determine the amount of ultraviolet radiation reaching the Earth's surface. Ozone is also a greenhouse gas and can influence climate.
Approximately 90 % of the ozone in the atmosphere is contained in the stratosphere. In the stratosphere, the production of ozone begins with the photodissociation of oxygen (O2) at ultraviolet wavelengths less than 242 nm. This reaction produces two ground-state oxygen atoms that can react with oxygen to produce ozone. Since an oxygen atom is essentially the same as having an ozone, it is common to refer to the sum of the concentrations of ozone and oxygen atoms (both ground state and excited state) as odd-oxygen. The primary destruction of odd-oxygen in the stratosphere comes from catalytic mechanisms involving various free radical species. Nitrogen oxides, chlorine oxides, and hydrogen oxides participate in catalytic reactions that destroy odd-oxygen.
The chlorine and bromine catalytic mechanisms are particularly efficient. Because of the growing levels of reactive chlorine in the stratosphere resulting from emissions of trichlorofluoromethane (CFCl3), difluorodichloromethane (CF2Cl2), along with bromine-containing halons and other halocarbons, these mechanisms have been the subject of much study due to their effects on concentrations of stratospheric ozone over recent decades. The chlorine- and bromine-catalytic cycles can turn over thousands of times before the catalyst is converted to a less reactive form. Because of this cycling, relatively small concentrations of reactive chlorine or bromine can have a significant impact on the amount and distribution of
Atmospheric Methane: Trends and Impacts 25 ozone in the stratosphere. The total amount of chlorine in the current stratosphere is about 3 parts per billion by volume (ppbv), much of which is in the form of less reactive compounds like hydrochloric acid (HCl).
Methane plays an important role in the chlorine chemistry of the stratosphere, serving both as a source and a sink in key reactions affecting reactive chlorine. The direct reaction of methane with a chlorine atom is the primary source of hydrochloric acid, the primary chlorine reservoir species. However, hydroxyl produced through the oxidation of methane in the stratosphere can react with the hydrochloric acid to return the chlorine atom, thus reinitiating the chlorine catalytic mechanism. Increasing methane thus can increase the conversion rate of reactive chlorine to HCl. Conversely, controls on methane could exacerbate the effects of chlorine on ozone by slowing down the conversion to HCl.
In addition to being involved in the reaction taking reactive chlorine to the less reactive hydrochloric acid, methane has several other effects on stratospheric ozone. Hydrogen oxides produced from the dissociation of methane can react catalytically with ozone, particularly in the upper stratosphere. In the lower stratosphere, the primary effect of these hydrogen oxides is to react with nitrogen oxides and reactive chlorine, reducing the effectiveness of the ozone destruction catalytic cycles involving nitrogen oxides and chlorine oxides. The hydrogen oxides at these altitudes can also react catalytically to destroy ozone.
2.1.3 Model calculated effects on ozone
Changing atmospheric concentrations of a number of compounds, including methane, are currently affecting the distribution of ozone in the troposphere and stratosphere. There have been a number of research studies using numerical models to examine the combined effects on ozone from the increases occurring in concentrations of methane and the other gases listed above (e.g., see Wuebbles et al., 1983; Stordal and Isaksen, 1987; WMO, 1985, 1988, 1989, 1995, 1999). When combined with the effects of the other trace gas emissions, it is difficult to evaluate the role of methane in the observed and projected ozone trends. For this reason, it is useful to examine studies that have only considered the effects of increasing methane on ozone.
Numerical models of atmospheric chemical and physical processes generally calculate that increasing methane concentrations result in a net ozone production in the troposphere and lower stratosphere and net ozone destruction in the upper stratosphere (Owens et al., 1982, 1985; WMO, 1985, 1991, 1995; Isaksen and Stordal, 1986). The net effect from these calculations has been that methane by itself causes a net increase in ozone. For a doubling of the methane concentration (early papers went from 1.6 to
26 Donald J. Wuebbles and Katharine Hayhoe 3.2 ppmv, while recent analyses assume a globally-averaged change from 1.7 to 3.4 ppmv), published effects on the calculated change in total ozone range from +0.3 % (Prather, in WMO, 1985) to +4.3 % (Owens et al., 1985). With radiative feedback effects included (allowing temperature changes in the stratosphere), the published model results tend to be in the upper end of this range (Owens et al., 1985; WMO, 1985; Isaksen and Stordal, 1986).
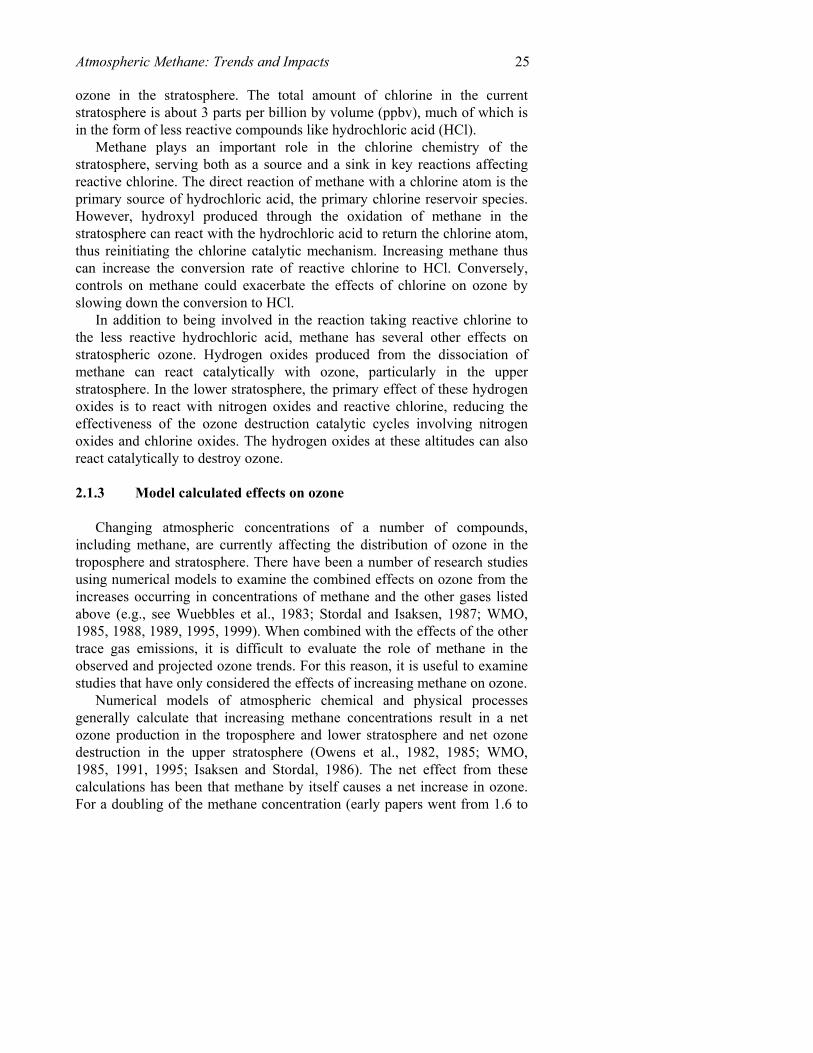
The effects on tropospheric and stratospheric ozone for a doubling of the methane surface concentrations from the University of Illinois zonally-averaged model are given in Figures 10 (change in total ozone as a function of latitude and season) and Figure 11 (change in ozone distribution with altitude and latitude for July). This two-dimensional model analysis, which includes radiative feedbacks, gives a 3.4% increase in globally averaged total ozone from a doubling of methane surface concentrations.
Figure 10. Calculated percentage change of total ozone for a doubling in the concentration of atmospheric methane from 1.7 to 3.4 ppmv. Based on University of Illinois two-dimensional
chemical-transport model

Atmospheric Methane: Trends and Impacts 27
The calculations of increasing methane give a small percentage increase in the lower stratospheric ozone, a larger increase near 40 km altitude, and a decrease in ozone above 45 km. As mentioned earlier, the hydrogen oxides produced by methane oxidation affect the efficiency of the nitrogen oxide and chlorine oxide catalytic ozone destruction mechanisms. However, the effect of methane in the lower stratosphere will depend on the efficiency of the nitrogen oxide catalytic cycle; if the amount of reactive odd nitrogen is reduced, then the additional hydrogen oxides from methane could destroy ozone in this region. With the additional heterogeneous reactions involving, N2O5, BrONO2 and ClONO2 reduce the efficiency of the nitrogen oxide catalytic cycle and the increased HOx from double methane has a larger effect on the lower stratosphere than compared to previous calculations (Wuebbles and Tamaresis, 1991). In the upper stratosphere, the additional hydrogen oxides react catalytically with ozone, leading to the decrease in ozone determined at these altitudes in the model calculations.
Figure 11. Calculated percentage change of local ozone in July for a doubling in the concentration of atmospheric methane as in Figure 10
28 Donald J. Wuebbles and Katharine Hayhoe
The version of the model used here includes convective mixing processes in the troposphere and also includes a number of non-methane hydrocarbons. The change in column ozone resulting from a no NMHC calculation and doubling CH4 to that compared to a simulation with hydrocarbons is an increased response ranging from 3-8 % over that of case including NMHCs in the calculated change in column ozone. The effect on the Southern Hemisphere is negligible as there are no significant non-NMHC emissions from this region. Thus, the model response is damped for a doubling of methane surface concentration when non-methane hydrocarbons are included in the model. This damping results from the additional sources of reactive oxides available in the lower troposphere from hydrocarbons sources. The current model gives a feedback factor, defined as the % change in OH for a 1% change in CH4 of 0.32%, which is well within the range of those calculated in WMO (1995).
2.1.4 Upper atmospheric water vapor
The spatial distribution of water vapor in the troposphere is primarily determined by evaporation, condensation and transport processes. Very little of the tropospheric water vapor penetrates into the stratosphere. The mechanisms limiting the transport of tropospheric water vapor into the stratosphere is still not well understood. Concentrations of water vapor increase with altitude in the stratosphere, from 3 ppmv in the lower stratosphere to about 6 ppmv in the upper stratosphere. This increase in concentration with altitude occurs as a result of the oxidation of methane.
The methane oxidation reactions roughly produce two moles of water vapor for each mole of methane that is destroyed. Stratospheric water vapor concentrations should increase as concentrations of methane increase. Since methane concentrations have increased from about 0.7 ppmv in the pre-industrial atmosphere to the current concentration of 1.7 ppmv, this implies that upper stratospheric water vapor concentrations have increased by roughly 2 ppmv over this time period. Actually the increase in water vapor should be somewhat less than this due to methane reactivity with chlorine and oxygen atoms. Both modeling and data analysis studies (e.g., Le Texier et al., 1988; Hansen and Robinson, 1989; Randel et al., 1998; Zoger et al., 1999) are in agreement with this conclusion, indicating that the overall stratospheric water vapor yield from methane is slightly less than two.
A doubling of methane surface concentration in the University of Illinois two-dimensional model of the global atmosphere gives an increase in the amount of water vapor at the stratopause, near 50 km, of approximately 40% or about 3 ppmv.

Atmospheric Methane: Trends and Impacts 29
Increasing methane concentrations should also be leading to increasing concentrations of water vapor in the mesosphere. Increasing concentrations of methane and carbon dioxide should also lead to cooler temperatures in the stratosphere, mesosphere, and thermosphere (WMO, 1985, 1989; Brasseur and Hitchman, 1988; Roble and Dickinson, 1989). With the increase in water vapor and the cooler temperatures, there is the potential for increased occurrences of noctilucent clouds near the mesopause (Thomas et al., 1989). Roble and Dickinson (1989) also point out that other changes in mesospheric and thermospheric composition should occur due to both the cooler temperatures and direct chemical effects from increased concentrations of methane and carbon dioxide. In addition, exospheric hydrogen will increase with increasing methane (Ehhalt, 1986).
Effects on Climate
2.1.5 Direct effects
The concern that human activities may be affecting global climate has largely centered around carbon dioxide because of its importance as a greenhouse gas and also because of the rapid rate at which its atmospheric concentration has been increasing. However, it is well recognized that there are many additional factors affecting climate including other greenhouse gases such as methane. The combined effect of methane and the other greenhouse gases has been to approximately double the overall increase in the greenhouse radiative forcing on climate relative to that from CO2. The increasing concentration of methane is a major contributor to this increase in the greenhouse effect. In addition to its direct radiative forcing effect on climate, methane can also influence climate indirectly through chemical interactions affecting other radiatively important gases such as ozone.
Like other greenhouse gases, methane absorbs infrared radiation (also called longwave or terrestrial radiation) emitted by the relatively warm planetary surface and emits radiation to space at the colder atmospheric temperatures, leading to a net trapping of infrared radiation within the atmosphere. This is called the greenhouse effect. The balance between the absorbed solar radiation and the emitted infrared radiation determines the net radiative forcing on climate.
Although its atmospheric abundance is less than 0.5 % that of carbon dioxide, methane is an important greenhouse gas. Donner and Ramanathan (1980) calculated that the presence of methane at current levels causes the globally averaged surface temperature to be about 1.3 K higher than it would be without methane. On a molar basis, an additional mole of methane in the
30 Donald J. Wuebbles and Katharine Hayhoe current atmosphere is about 21 times more effective at affecting climate than an additional mole of carbon dioxide (Ramanathan et al., 1985, 1987; IPCC, 1990). Correspondingly, on a mass basis, an additional kilogram of methane is about 58 times more effective as a greenhouse gas than a kilogram of carbon dioxide. It should be noted, however, that the actual lifetime of carbon dioxide in the atmosphere is much longer than the atmospheric lifetime of methane (IPCC, 1990, 1996). But it should also be recognized that the dissociation of methane eventually produces carbon dioxide, leading to additional climatic forcing from the original emission of methane.
The strongest bands for absorption by methane in the infrared are in the short wavelength edge of the window region. The most important infrared spectral feature of methane is the 7.66 mm (1306 cm-1) absorption band. Due to saturation of the line cores for methane and emission from the pressure-broadened Lorentz line wings, radiative forcing from methane increases approximately as the square root of its concentration (IPCC, 1990; Wigley, 1987). Overlap with absorption by water vapor and other species (particularly nitrous oxide) also affects the efficiency of methane absorption.
Wang et al. (1991) show that the greenhouse radiative forcing for methane has different effects on climate than carbon dioxide, and that methane needs to be accounted for explicitly when attempting to predict the climate response to increasing concentrations of greenhouse gases. Calculations with three-dimensional global climate models (GCMs) are beginning to consider the explicit effects of methane on climate. Hansen et al. (1988) and Wang et al. (1991) have explicitly considered the effects of methane in GCM studies, while many other studies have included methane only through accounting for its radiative forcing through use of an increase in carbon dioxide as a proxy.
Increasing concentrations of methane are thought to be a significant fraction of the increase in radiative forcing from greenhouse gases over the last two centuries. IPCC (1996) calculated that the direct radiative effect of the increase in methane since the mid-1700s has accounted for an increase in radiative forcing of 0.47 Wm-2 (climate models indicate that the 4 Wm-2 associated with a doubling of CO2 from 300 to 600 ppmv would give approximately a 1.5 to 4.5 K increase in surface temperature). This is about 19 % of the total change in radiative due to CO2 and other greenhouse gases over this time period (other research studies have found similar percentages for the effect of methane over this period: e.g., Rodhe (1990) derived 15 %, while Hansen et al. (1989) and MacKay and Khalil (1991) got about 22 %). Inclusion of indirect effects on stratospheric water vapor, ozone, and carbon dioxide (see below) could increase this percentage appreciably; inclusion of the stratospheric water vapor effect in IPCC(1990) increases this percentage to 23 %.

Atmospheric Methane: Trends and Impacts 31
A new analysis (A. Jain, pers. comm.) of the radiative for methane accounting for the latitudinal and seasonal variations in methane calculates a larger radiative forcing contribution from methane than earlier studies. The global and annually averaged radiative forcing based on the new calculations was 4.43 x10⁻³ Wm-2 for a 1 ppbv change in methane compared to 3.7 x10⁻³ Wm-2 in IPCC (1996). The estimated change in radiative forcing from pre-industrial times to 1992 was 0.55 Wm-2 compared to 0.47 in IPCC (1996). Minschwaner et al. (1998) also determined a radiative forcing for methane from 1750 to 1992 of 0.55 Wm-2 based on the observed distribution of methane from the Upper Atmosphere Research Satellite.
Over the last decade, the change in atmospheric methane concentration is calculated to increase the radiative forcing by about 0.06 Wm-2, about 11 % of the total increase in radiative forcing from greenhouse gases over this time period. Hansen et al. (1988) determined that methane was 12.2 % of the total change in radiative forcing over this period (note that these estimates ignore effects on radiative forcing due to changes in global ozone and aerosols over this time period).
Various studies have evaluated the potential effects on radiative forcing and surface temperature from a doubling of methane concentrations using radiative-convective models. For a doubling of methane concentration from 1.6 to 3.2 ppmv, effects on surface temperature range from 0.2 K to 0.3 K (Wang et al., 1976; Donner and Ramanathan, 1980; Lacis et al., 1981; Owens et al., 1985; Ramanathan et al., 1987; MacKay and Khalil, 1991), with the differences in model results primarily relating to uncertainties in the band strengths for methane infrared absorption. For a doubling from 1.7 to 3.4 ppmv, Owens et al. (1985) calculate a direct 0.34 K increase in surface temperature, along with an additional 0.26 K due to indirect effects from methane-induced effects on carbon dioxide and ozone. For a 25 % increase in methane concentrations, Ramanathan et al. (1985) determine a 0.08 K increase in surface temperature when overlap with the radiative absorption with other greenhouse gases is included, and a 0.19 K increase in surface temperature without overlap.
Other modeling studies have included increasing methane concentrations in studies evaluating scenarios for potential future changes in radiative forcing and global temperatures (Wang and Molnar, 1985; Ramanathan et al., 1985, 1987; WMO, 1985; Dickinson and Cicerone, 1986; Wang et al., 1986; Wigley, 1987; Hansen et al., 1988, 1989; IPCC, 1990.) Table 2 the change in radiative forcing (Wm-2) due to increasing methane compared to total change due to all greenhouse gases as derived by IPCC (1996) for their high (IS92e), medium (IS92a), and low (IS92c) scenarios. These more recent scenarios generally show a somewhat increased role for methane in determining future radiative forcing. These studies do not consider the
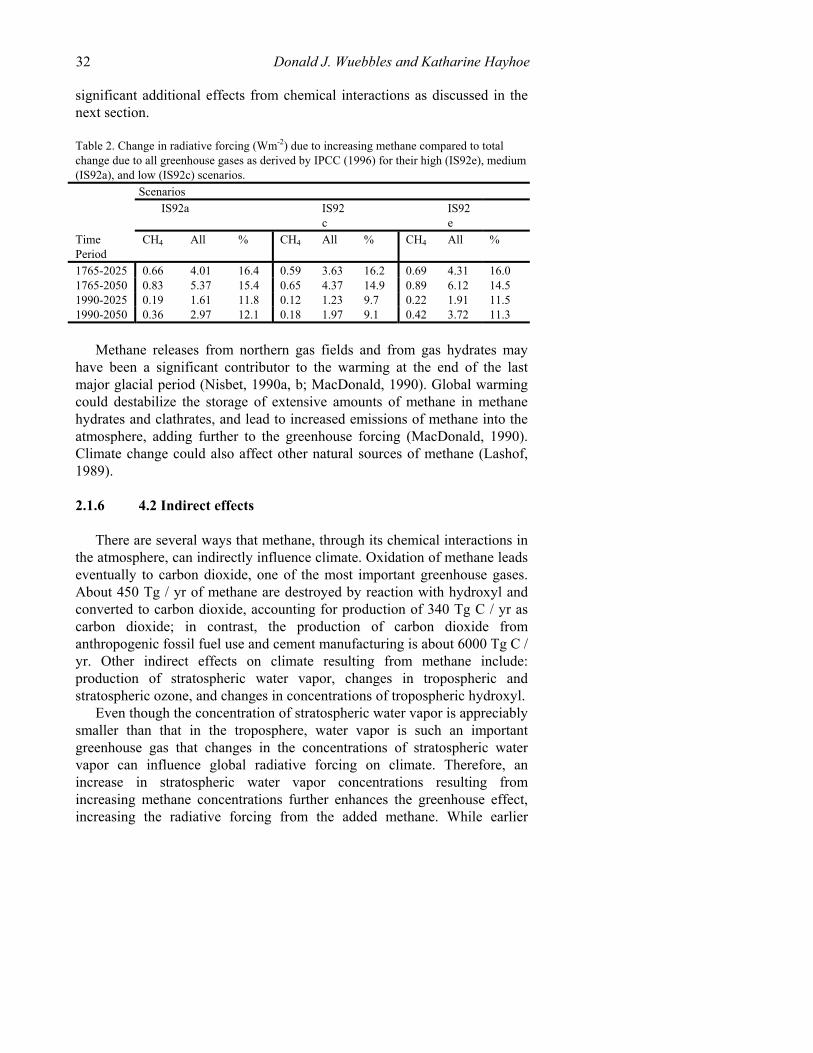
32 Donald J. Wuebbles and Katharine Hayhoe significant additional effects from chemical interactions as discussed in the next section.
Table 2. Change in radiative forcing (Wm-2) due to increasing methane compared to total change due to all greenhouse gases as derived by IPCC (1996) for their high (IS92e), medium (IS92a), and low (IS92c) scenarios. Scenarios IS92a IS92
c IS92
e
Time Period
CH4 All % CH4 All % CH4 All %
1765-2025 0.66 4.01 16.4 0.59 3.63 16.2 0.69 4.31 16.0 1765-2050 0.83 5.37 15.4 0.65 4.37 14.9 0.89 6.12 14.5 1990-2025 0.19 1.61 11.8 0.12 1.23 9.7 0.22 1.91 11.5 1990-2050 0.36 2.97 12.1 0.18 1.97 9.1 0.42 3.72 11.3
Methane releases from northern gas fields and from gas hydrates may
have been a significant contributor to the warming at the end of the last major glacial period (Nisbet, 1990a, b; MacDonald, 1990). Global warming could destabilize the storage of extensive amounts of methane in methane hydrates and clathrates, and lead to increased emissions of methane into the atmosphere, adding further to the greenhouse forcing (MacDonald, 1990). Climate change could also affect other natural sources of methane (Lashof, 1989).
2.1.6 4.2 Indirect effects
There are several ways that methane, through its chemical interactions in the atmosphere, can indirectly influence climate. Oxidation of methane leads eventually to carbon dioxide, one of the most important greenhouse gases. About 450 Tg / yr of methane are destroyed by reaction with hydroxyl and converted to carbon dioxide, accounting for production of 340 Tg C / yr as carbon dioxide; in contrast, the production of carbon dioxide from anthropogenic fossil fuel use and cement manufacturing is about 6000 Tg C / yr. Other indirect effects on climate resulting from methane include: production of stratospheric water vapor, changes in tropospheric and stratospheric ozone, and changes in concentrations of tropospheric hydroxyl.
Even though the concentration of stratospheric water vapor is appreciably smaller than that in the troposphere, water vapor is such an important greenhouse gas that changes in the concentrations of stratospheric water vapor can influence global radiative forcing on climate. Therefore, an increase in stratospheric water vapor concentrations resulting from increasing methane concentrations further enhances the greenhouse effect, increasing the radiative forcing from the added methane. While earlier

Atmospheric Methane: Trends and Impacts 33 studies assuming a mixing ratio increase in methane suggested that the increase in water vapor could enhance the radiative forcing by as much as 30 % (IPCC, 1990), more recent studies (Lelieveld and Crutzen, 1991, 1992; Bruhl, 1993; Lelieveld et al., 1993; Hauglustaine et al., 1994; IPCC, 1995) using flux boundary condition changes in methane have shown the effect of the water vapor increase to be much smaller, 4-5% of the total direct and indirect radiative forcing from methane.
As discussed earlier, increasing water vapor from methane could be leading to an increased amount of polar stratospheric clouds. Ramanathan (1988) notes that both water and ice clouds, when formed at cold lower stratospheric temperatures, are extremely efficient in enhancing the atmospheric greenhouse effect. He also notes that there is a distinct possibility that large increases in future methane may lead to a surface warming that increases nonlinearly with the methane concentration.
Changes in ozone associated with increasing methane can add 19 ± 12 % to the total radiative forcing from methane (IPCC, 1995; based on ours and other two-dimensional model studies). Determination of the effect due to OH changes is more difficult because of uncertainties associated with modeling the CH4-CO-OH nonlinear relationships. The effect on the response time of methane to a perturbation can result in a much larger apparent lifetime for the perturbed methane than the overall atmospheric lifetime of methane (Prather, 1994; IPCC, 1995, 1996).
2.1.7 Global Warming Potentials
Global Warming Potentials (GWPs) have been developed as an analysis tool for policy makers in their evaluations of possible policy actions related to emissions of greenhouse gases. The GWP of a greenhouse gas is defined as the time-integrated commitment to climatic forcing from the instantaneous release of a kilogram of the gas relative to the climatic forcing from the release of 1 kg of carbon dioxide. Under this measure, the GWP for methane after a 100-year integration for the direct plus indirect methane effects is a value of 24.5 ± 7.5 (compared to 1.0 for carbon dioxide). As shown in IPCC (1990, 1995), indirect effects can more than double the direct methane GWP value (also see Fuglestvedt et al., 1996). Published GWPs are derived for integration periods from 20 to 500 years, with the 100-year values generally thought to provide a balanced representation of the various time horizons for climatic response. The GWPs from IPCC (1996) for direct plus indirect effects from methane for the 20- and 500-year integrations are 62 ± 20 (64 in WMO, 1999) and 7.5 ± 2.5, respectively.

34 Donald J. Wuebbles and Katharine Hayhoe 3. SUMMARY AND CONCLUSIONS
The atmospheric concentration of methane has increased dramatically over the last century and continues to increase. While budget and isotopic analyses have confirmed the important role being played by human activities in largely causing this increase, there remain significant uncertainties in understanding the emissions from various sources and their changes over time. The uncertainties in the changes occurring in the sources and sinks of methane limit the ability to determine meaningful policy relating to methane with respect to concerns about climate change.
The recent increase in the rate of increase in methane has renewed the debate about future levels of methane. If it is indeed found that the increase in the trend of methane concentrations over the last few years is due to a response of wetlands to the increases in global temperatures, this leads to further questions about how much methane, and, in turn climate, will respond to the further increases in global temperatures projected for the next century by climate modelling studies.
ACKNOWLEDGEMENT
This study was supported in part by the U. S. Environmental Protection Agency and by the National Aeronautics and Space Administration’s Atmospheric Chemistry Modeling and Analysis Program.
REFERENCES
Barns, D.W. and Edmonds, J. A. (1990). An Evaluation of the Relationship Between the Production and Use of Energy and Atmospheric Methane Emissions. U.S. Dept. of Energy, Carbon Dioxide Research Program, TR047, 223 pp.
Bartlett, K. and Harriss, R. (1993). Review and assessment of methane emissions from wetlands. Chemosphere. 26, 261-320.
Bazhin, N. (1994). Sources and sinks of methane on the territory of the former USSR. Pure & Applied Chemistry 66, 188-191.
Beck, L.L., Piccot, S.D. and. Kirchgessner, D.A (1993). Industrial sources. In 'Atmospheric Methane: Sources. Sinks and Role in Global Change.' (Eds. M. Khalil) pp. 399-341. (Springer-Verlag, New York, NY).
Bekki, S., Law, K.S. and Pyle, J.A. (1994). Effects of ozone depletion on atmospheric CH4 and CO concentrations. Nature. 371, 595-599.
Bekki, S., and Law, K. (1997). Sensitivity of the atmospheric CH4 growth rate to global temperature changes observed from 1980 to 1992. Tellus. 49B, 409-416.
Blake, D.R. and Rowland, F.S. (1988). Continuing worldwide increase in tropospheric methane, 1978 to 1987. Science. 239, 1129-1131.
Atmospheric Methane: Trends and Impacts 35 Blunier, T., Chappellaz, J., Schwander, J., Barnola, J., Desperts, T., Stauffer, B. and Raynaud,
D. (1993). Atmospheric methane, record from a Greenland ice core over the last 1000 years. Geophysical Research Letters. 20, 2219-2222.
Blunier, T., Chapellaz, J. Schwander, J. Stauffer, B. and Raynaud, D. (1995). Variations in atmospheric methane concentration during the Holocene Epoch. Nature. 374, 46-49.
Boeckx, P., VanCleemput, O. and Villaralvo, I. (1997). Methane oxidation in soils with different textures and land use. Nutrient Cycling in Agroecosystems. 49, 91-95.
Bogner, J. and Spokas, K. (1993). Landfill CH4: Rates, fates and role in global carbon cycle. Chemosphere. 26, 369-386.
Bogner, J., Spokas, K., Burton, E. Sweeney, R. and Corona, V. (1995). Landfills as atmospheric methane sources and sinks. Chemosphere. 31, 4119-4130.
Boone, D. (1993). Biological formation and consumption of methane. In 'Atmospheric Methane: Sources, Sinks and Role in Global Change.' (Eds. M. Khalil). pp. 102-127. (Springer-Verlag, New York, NY).
Borjesson, G. and Svensson, B. (1997). Effects of a gas extraction interruption on emissions of methane and carbon dioxide from a landfill, and on methane oxidation in the cover soil. Journal Environmental Quality. 26, 1182-1190.
Brasseur, G. and Hitchman, M.H. (1988). Stratospheric response to trace gas perturbations: Changes in ozone and temperature distribution. Science. 240, 634-637.
Brasseur, G., Kiehl, J., Muller, J-F, Schneider, T., Granier, C., Tie, X. and Hauglustaine, D. (1998). Past and future changes in global tropospheric ozone: Impact on radiative forcing. Geophysical Research Letters. 25, 3807-3810.
Brenninkmeijer, C.A.M., Lowe, D.C., Manning, M.R., Sparks, R.J. and van Velthoven, P.F.J. (1995). The 13C, 14C, and 18O isotopic composition of CO, CH4, and CO2 in the higher southern latitudes lower stratosphere. Journal of Geophysical Research. 100, 26,163-26,172.
Brook, E., Sowers, T. and Orchardo, J. (1996). Rapid variations in atmospheric methane concentration during the past 110,000 years. Science. 273, 1087-1091.
Bruhl, C. (1993). The impact of the future scenarios for methane and other chemically active gases on the GWP of methane. Chemosphere. 26, 731-738.
Brune, W. (1992). Stalking the elusive atmospheric hydroxyl radical. Science. 256, 1154-1155.
Buendia, L., Neue, H., Wassmann, R., Lantin, R. and Javellana, A. (1997). Understanding the nature of methane emission from rice ecosystems as basis of mitigation strategies. Applied Energy. 56, 433-444.
Burnett, E.B. and Burnett, C. R. (1995). Enhanced production of stratospheric OH from methane oxidation at elevated reactive chlorine levels in northern midlatitudes. J. Atmospheric Chemistry. 21, 13-41.
ButterbachBahl, K., Papen, H. and Rennenberg, H. (1997). Impact of gas transport through rice cultivars on methane emission from rice paddy fields. Plant Cell & Environment. 20, 1175-1183.
Cao, M., Dent, J. and Heal, O. (1995). Modeling methane emissions from rice paddies. Global Biogeochemical Cycles. 9, 183-195.
Cao, M., Gregson, K., Marshall, S., Dent, J. and Heal, O. (1996). Global methane emissions from rice paddies. Chemosphere. 33, 879-897.
Chameides, W., Liu, S. and Cicerone, R. (1977). Possible variations in atmospheric methane. Journal of Geophysical Research. 82, 1795-1798.
Chappellaz, J., Barnola, J., Raynaud, D., Korotkevich, Y., and Lorius, C. (1990). Ice-core record of atmospheric methane over the past 160,000 years. Nature. 345, 127-131.
36 Donald J. Wuebbles and Katharine Hayhoe Chappellaz, J., Blunier, T., Raynaud, D., Barnola, J., Schwander, J., and Stauffer, B. (1993).
Synchronous changes in atmospheric CH4 and Greenland climate between 40-kyr and 8-kyr BP. Nature. 366, 443-445.
Chappellaz, J., Fung, I.Y., and Thompson, A.M., (1993). The atmospheric CH4 increase since the Last Glacial Maximum. Tellus, 45B, 228-241.
Chappellaz, J., Blunier, T., Kints, S., Dallenbach, A., Barnola, J., Schwander, J., Raynaud, D. and Stauffer, B. (1997). Changes in the atmospheric CH4 gradient between Greenland and Antarctica during the Holocene. Journal of Geophysical Research. 102, 15987-15997.
Cicerone, R.J. and Oremland, R.S. (1988). Biogeochemical aspects of atmospheric methane. Global Biogeochemical Cycles. 2, 299-327.
Cole, C., Duxbury, J., Freney, J., Heinemeyer, O., Minami, K., Mosier, A., Paustian, K., Rosenberg, N., Sampson, N, Sauerbeck, D. and Zhao, Q. (1997). Global estimates of potential mitigation of greenhouse gas emissions by agriculture. Nutrient Cycling in Agroecosystems. 49, 221-228.
Craig, H., and Chou, C.C. (1982). Methane: The record in polar ice cores. Geophysical Research Letters. 9, 1221-1224.
Crosley, D. R. (1995). The measurement of OH and HO2 in the atmosphere. Journal of the Atmospheric Sciences. 52, 3299-3314.
Crutzen, P. (1988). Tropospheric ozone: An overview. In 'Tropospheric Ozone: Regional and Global Scale Interactions. (Eds. I.S.A. Isaksen). pp. 3-11. (Reidel Publishing, Boston, MA).
Crutzen, P. (1995). Overview of tropospheric chemistry: Developments during the past quarter century and a look ahead. Faraday Discussion. 100, 1-21.
Crutzen, P., and Zimmermann, P. (1991). The changing photochemistry of the troposphere. Tellus. 43AB, 136-151.
Crutzen, P., and Bruhl, C. (1993). A model study of the atmospheric temperatures and concentrations of ozone, hydroxyl, and some other photochemically active gases during the glacial, the pre-industrial Holocene and the present. Geophysical Research Letters. 20, 1047-1050.
Czepiel, P., Mosher, B., Crill, P. and Harriss, R. (1996). Quantifying the effect of oxidation on landfill methane emissions. Journal of Geophysical Research. 101, 16721-16729.
Denier van der Gon, H. and Neue, H.U. (1995). Influence of organic matter incorporation on the methane emission from a wetland rice field. Global Biogeochemical Cycles .9, 11-22.
Dibb, J., Rasmussen, R., Mayewski, P. and Holdsworth, G. (1993). Northern hemisphere concentrations of methane and nitrous oxide since 1800: Results from the Mt. Logan and 20D ice cores. Chemosphere. 27, 2413-2423.
Dickens, G., Castillo, M. and Walker, J. (1997). A blast of gas in the latest Paleocene: Simulating first-order effects of massive dissociation of oceanic methane hydrate. Geology. 25, 259-262.
Dickinson, R.E. and Cicerone, R.J. (1986). Future global warming from atmospheric trace gases. Nature. 319, 109-115.
Dlugokencky, E., Steele, L., Lang, P. and Masarie, K. (1994a). The growth rate and distribution of atmospheric methane. Journal of Geophysical Research. 99, 17021-17043.
Dlugokencky, E., Masaire, K., Lang, P., Tans, P., Steele, L. and Nisbet, E. (1994b). A dramatic decrease in the growth rate of atmospheric methane in the northern hemisphere during 1992. Geophysical Research Letters. 21, 45-48.
Dlugokencky, E., Steele, L.P., Lang, P. and Masarie, K. (1995). Atmospheric methane at Mauna Loa and Barrow observatories: Presentation and analysis of in situ measurements. Journal of Geophysical Research. 100, 23103-23113.
Atmospheric Methane: Trends and Impacts 37 Dlugokencky, E., Dutton, E., Novelli, P., Tans, P., Masarie, K., Lantz, K. and Madronich, S.
(1996). Changes in CH4 and CO growth rates after the eruption of Mt. Pinatubo and their link with changes in tropical tropospheric UV flux. Geophysical Research Letters. 23, 2761-2764.
Dlugokencky, E., Masarie, K., Tans, P., Conway, T. and Xiong, X. (1997). Is the amplitude of the methane seasonal cycle changing? Atmospheric Environment. 31, 21-26.
Dlugokencky, E., Masarie, K., Lang, P. and Tans, P. (1998). Continuing decline in the growth rate of the atmospheric methane burden. Nature. 393, 447-450.
Dobbie, K. and Smith, K. (1996). Comparison of CH4oxidation rates in woodland, arable and set aside soils. Soil Biology & Biochemistry. 28, 1357-1365.
Donner, L. and Ramanathan, V. (1980). Methane and nitrous oxide: Their effects on the terrestrial climate. Journal of the Atmospheric Sciences. 37, 119-124.
Ehhalt. D.H. (1986). On the consequences of a tropospheric CH4 increase to the exospheric density. Journal of Geophysical Research. 91, 2843.
Environmental Protection Agency, (1993a): Opportunities to Reduce Anthropogenic Methane Emissions in the United States. (Eds. K. Hogan). U.S. EPA, Office of Air & Radiation, EPA 430-R-93-012, 420 pp.
Environmental Protection Agency, (1993b): Options for Reducing Methane Emissions Internationally. (Eds. K. Hogan). U.S. EPA , Office of Air & Radiation, EPA 430-R-93-006B, 350 pp.
Etheridge, D., Pearman, G. and Fraser, P. (1992). Changes in tropospheric methane between 1841 and 1978 from a high accumulation-rate Antarctic ice core. Tellus. 44B, 282-294.
Etheridge, D., Steele, L., Francey, R. and Langenfelds, R. (1998). Atmospheric methane between 1000 A.D. and present: Evidence of anthropogenic emissions and climatic variability. Journal of Geophysical Research. 103, 15979-15993.
Fishman, J. (1985). Ozone in the troposphere. In 'Ozone in the Free Atmosphere.' (Eds. R.C. Whitten and S.S. Prasad). pp 161-194 (Van Nostrand Reinhold, New York, NY).
Fishman, J., Solomon, S. and Crutzen, P.J. (1979). Observational and theoretical evidence in support of a significant in-situ photochemical source of tropospheric ozone. Tellus. 31, 432-446.
Fuglestvedt, J., Jonson, J. and Isaksen, I. (1994). Effects of reductions in stratospheric ozone on tropospheric chemistry through changes in photolysis rates. Tellus. 46B, 172-192.
Fuglestvedt, J.S., Isaksen, I.S.A. and Wang. W.-C. (1996). Estimates of indirect Global Warming Potentials for Ch4, CO and NOx. Climatic Change. 34, 405-437.
Fung, I., John, J., Lerner, J., Matthews, E., Prather, M., Steele, L. and Fraser, P. (1991). Three-dimensional model synthesis of the global methane cycle. Journal of Geophysical Research. 96, 13033-13065.
Gettelman, A., Holton, J.R., and Rosenlof, K.H., (1997). Mass fluxes of O3, CH4, N2O and CF2Cl2 in the lower atmosphere calculated from observational data. Journal of Geophysical Research, 102, 19149-19159.
Gupta, M., Tyler, S. and Cicerone, R. (1996). Modeling atmospheric �13CH4 and the causes of recent changes in atmospheric CH4 amounts. Journal of Geophysical Research. 101, 22923-22932.
Haan, D., and Raynaud, D. (1998). Ice core record of CO variations during the last two millennia: atmospheric implications and chemical interactions within the Greenland ice. Tellus. 50B, 253-262.
Hansen, A.R. and Robinson, G.D. (1989). Water vapor and methane in the upper stratosphere: An examination of some of the Nimbus 7 measurements. Journal of Geophysical Research. 94, 8474-8484.
38 Donald J. Wuebbles and Katharine Hayhoe Harvey, L.D.D. and Huang, Z. (1995). Evaluation of the potential impact of methane clathrate
destabilization on future global warming. Journal of Geophysical Research. 100, 2905-2926.
Hauglustaine, D., Granier, C., Brasseur, G. and Megie, G. (1994). The importance of atmospheric chemistry in the calculation of radiative forcing on the climate system. Journal of Geophysical Research. 99, 1173-1186.
Hein, R., Crutzen, P.J., and Heinman, R. (1997). An inverse modeling approach to investigate the global atmospheric methane cycle. Global Biogeochemcial Cycles, 11, 43-76.
Hofzumahaus, A., Dorn, H.P., Callies, J., Platt, U. and Ehhalt, D. (1991). Tropospheric OH concentration measurements by laser long-path absorption spectroscopy. Atmospheric Environment. 25A, 2017-2022.
Hough, A.M. and Derwent, R.G. (1990). Changes in the global concentration of tropospheric ozone due to human activities. Nature. 344, 645-648.
Hudgens, D. and Yavitt, J. (1997). Land-use effects on soil methane and carbon dioxide fluxes in forests near Ithaca, New York. Ecoscience. 4, 214-222.
Intergovernmental Panel on Climate Change. (1990). Climate Change: The IPCC Scientific Assessment. . (Eds. J. T. Houghton, G.J. Jenkins and J.J. Ephraums). ? pp. (Cambridge University Press, Cambridge, U.K).
Intergovernmental Panel on Climate Change. (1995). Climate Change 1994. (Eds. J. T. Houghton, L. Meira Filho, J. Bruce, H. Lee, B. Callander, E. Haites, N. Harris and K. Maskell.). 339 pp. (Cambridge University Press, Cambridge, U.K).
Intergovernmental Panel on Climate Change. (1996). Climate Change 1995: the Science of Climate Change. (Eds. J. T. Houghton, L. G. Meira Filho, B. A. Callander, N. Harris, A. Kattenberg, and K. Maskell). 572 pp. (Cambridge University Press, Cambridge, U.K.).
Isaksen, I.S.A. (1988). Is the oxidizing capacity of the atmosphere changing. In 'The Changing Atmosphere.' (Eds. F.S. Rowland and I.S.A. Isaksen). pp. 141-157. (John Wiley and Sons, New York, NY).
Isaksen, I.S.A. and Stordal, F. (1986). Ozone perturbations by enhanced levels of CFCs, N2O, and CH4: A two-dimensional diabatic circulation study including uncertainty estimates. Journal of Geophysical Research. 91, 5249-5263.
Johnson, D., Hill, T., Ward, G., Johnson, K., Branine, M., Carmean, B. and Lodman, D. (1993). Ruminants and other animals. In 'Atmospheric Methane: Sources, Sinks and Role in Global Change.' (Eds. M. Khalil). 199-229. (Springer-Verlag, New York, NY).
Jouzel, J., Jouzel, N.I., Barkov, J.M., Barnola, M., Bender, J., Chappellaz, C., Genthon, V.M., Kotlyakov, V., Lipenkov, C., Lorius, J.R., Petit, D., Raynaud, G., Raisbeck, C., Ritz, T., Sowers, M., Stievenard, F., Yiou, F., and Yiou, P. (1993). Extending the Vostok ice-core record of palaeoclimate to the penultimate glacial period. Nature. 364, 407-412.
Khalil, M.A.K. and Rasmussen, R.A. (1985). Causes of increasing atmospheric methane: Depletion of hydroxyl radicals and the rise of emissions. Atmospheric Environment. 13, 397-407.
Khalil, M. and Rasmussen, R. (1987). Atmospheric methane: trends over the last 10,000 years. Atmospheric Environment. 21, 2445-2452.
Khalil, M., Rasmussen, R. and Moraes, F. (1993). Atmospheric methane at Cape Meares: Analysis of a high-resolution data base and its environmental implications. Journal of Geophysical Research. 98, 14753-14770.
Khalil, M. and Rasmussen, R. (1994a). Global emissions of methane during the last several centuries. Chemosphere. 29, 833-842.
Khalil, M. and Rasmussen, R. (1994b). Trends in atmospheric methane. Pure & Applied Chemistry. 66, Special Report: Methane in the Atmosphere, Commission on Atmospheric Chemistry.
Atmospheric Methane: Trends and Impacts 39 Khalil, M.A.K., Shearer, M. J. and Rasmussen, R.A. (1993). Methane sinks and distribution.
In 'Atmospheric Methane: Sources, Sinks and Role in Global Change.' (Eds. M. Khalil). Springer-Verlag, 168-179. (New York, NY).
Khalil, M. and Rasmussen, R. (1993). Decreasing trend of methane: Unpredictability of future concentrations. Chemosphere. 26, 803-814.
Khalil, M., Rasmussen, R., Shearer, M., Dalluge, R., Ren, L. and Duan, C. (1998). Factors affecting methane emissions from rice fields. Journal of Geophysical Research. 103, 25219-25231.
Kheshgi, H.S., Jain, A.K., Kotamarthi, V.R., and Wuebbles, D.J. (1999). Future atmospheric methane concentrations in the context of the stabilization of greenhouse gas concentrations. Journal of Geophysical Research, 104, 19183-19190.
King, G. (1997). Responses of atmospheric methane consumption by soils to global climate change. Global Change Biology. 3, 351-362.
Lashof, D. (1989). The dynamic greenhouse: Feedback processes that may influence future concentrations of atmospheric trace gases and climatic change. Climatic Change. 14, 213-242.
Lassey, K.R., Lowe, D.C., Brenninkmeijer, C.A.M., and Gomez (1993). Atmospheric methane and its carbon isotopes in the southern hemisphere: their time series and an instructive model. Chemosphere, 26, 95-109.
Lassey, K.R., Lowe, D.C., and Manning, M.R. (1999). The trend in atmospheric methane δ13C and implications for isotopic contraints on the global methane budget. Global Biogeochemical Cycles, in press.
Law, K.S. and Nisbet, E.G. (1996). Sensitivity of the CH4 growth rate to changes in CH4 emissions from natural gas and coal. Journal of Geophysical Research. 101, 14387-14397.
Legrand, M., Lorius, C., Barkov, N. and Petrov, V. (1988). Vostok (Antarctic ice core): atmospheric chemistry changes over the last climatic cycle (160,000 years). Atmospheric Environment. 22, 317-331.
Lelieveld, J. and Crutzen, P.J. (1991). The role of clouds in tropospheric photochemistry. Journal of Atmospheric Chemistry. 12, 229-267.
Lelieveld, J. and Crutzen, P.J. (1992). Indirect chemical effects of methane on global warming. Nature. 355, 339-342.
Lelieveld, J., Crutzen, P. and Bruhl, C. (1993). Climate effects of atmospheric methane. Chemosphere. 26, 739-767.
Lelieveld, J., Crutzen, P. and Dentener, F. (1998). Changing concentration, lifetime and climate forcing of atmospheric methane. Tellus. 50B, 128-150.
Le Texier, L., Solomon, S. and Garcia, R.R. (1988). The role of molecular hydrogen and methane oxidation in the water vapor budget of the stratosphere. Quarterly Journal of the Royal Meteorological Society. 114, 281-296.
Levine, J.S., Cofer III, W.R . and Pinto, J.P. (1993). Biomass burning. In 'Atmospheric Methane: Sources, Sinks and Role in Global Change.' (Eds. M. Khalil), 299-313. (Springer-Verlag, New York, NY).
Lowe, D.C. and Schmidt, U. (1983). Formaldehyde (HCHO) measurements in the nonurban atmosphere. Journal of Geophysical Research. 88, 10844-10858.
Lowe, D.C., Brenninkmeijer, C.A.M., Brailsford, G.W., Lassey, K.R. and Gomez, A.J. (1994). Concentration and 13C records of atmospheric methane in New Zealand and Antarctica: Evidence for changes in methane sources. Journal Geophysical Research. 99, 16913-16925.
Lowe, D., Manning, M., Brailsford, G. and Bromley, A. (1997). The 1991-1992 atmospheric methane anomaly: Southern Hemisphere 13C increase and growth rate fluctuations. Geophysical Research Letters. 24, 857-860.
40 Donald J. Wuebbles and Katharine Hayhoe Lowe, D.C., Allen, W., Manning, M.R., Bromley, T., Brailsford, G., Ferretti, D., Gomez, A.,
Knobben, R., Martin, R., Mei, Z., Moss, R., Koshy, K., and Maata, M. (1999). Shipboard determinations of the distribution of 13δC in atmospheric methane in the Pacific. Journal of Geophysical Research, in press.
Krol, M., van Leeuwen, P. and Lelieveld, J. (1998). Global OH trend inferred from methylchloroform measurements. Journal of Geophysical Research. 103, 10697-10711.
Lu, Y. and Khalil, M. 1991. Tropospheric OH: Model calculations of spatial, temporal, and secular variations. Chemosphere. 23, 397-444.
MacDonald, G.J. (1990). Role of methane clathrates in past and future climates, Climatic Change. 16, 247-281.
MacKay, R.M. and Khalil, M.A.K. (1991). Theory and development of a one dimensional time dependent radiative convective climate model. Chemosphere. 22, 383-417.
Mancinelli, R. (1995). The regulation of methane oxidation in soil. Annual Reviews of Microbiology. 49, 581-605.
Martinerie, P., Brasseur, G. and Granier, C. (1995). The chemical composition of ancient atmospheres: A model study constrained by ice core data. Journal Geophysical Research. 100, 14291-14304.
Matthews, E. (1994). Assessment of methane sources and their uncertainties. Pure & Applied Chemistry. 66, 154-161.
Minami, K. and Neue, H.U. (1994). Rice paddies as a methane source. Climatic Change. 27, 13-26.
Minschwaner, K., Carver, R.W., Briegleb, B.P., and Roche, A.E. (1998). Infrared radiative forcing and atmospheric lifetimes of trace species based on observations from UARS. Journal of Geophysical Research, 103, 23243-23253.
Mitchell, C. (1993). Methane emissions from the coal and natural gas industries in the UK. Chemosphere. 26, 441-446.
Mitra, S., Jain, M., Kumar, S., Bandyopadhyay, S. and Kalra, N. (1999). Effect of rice cultivars on methane emission. Agriculture, Ecosystems & Environment. 73, 177-183.
Mosier, A., Delgado, J., Cochran, V., Valentine, D. and Parton, W. (1997a). Impact of agriculture on soil consumption of atmospheric CH4 and a comparison of CH4 and N2O flux in subarctic, temperature and tropical grasslands. Nutrient Cycling in Agroecosystems. 49, 71-83.
Mosier, A., Parton, W., Valentine, D., Ojima, D., Schimel, D. and Heinemeyer, O. (1997). CH4 and N2O fluxes in the Colorado shortgrass steppe. 2. Long-term impact of land use change. Global Biogeochemical Cycle. 11, 29-42.
Nakazawa, T., Machida, T., Tanaka, M., Fujii, Y., Aoki, S. and Watanabe, O. (1993). Differences of the atmospheric CH4 concentration between the Arctic and Antarctic regions in pre-industrial/pre-agricultural era. Geophysical Research Letters. 20, 943-946.
Neue, H.-U., and Roger, P.A. (1993). Rice agriculture: Factors controlling emissions. In ' Methane: Sources, Sinks and Role in Global Change.' (Eds. M. Khalil). pp. 254-298. (Springer-Verlag, New York, NY).
Neue, H.-U., Wassmann, R., Kludze, H., Bujun, W. and Lantin, R. (1997). Factors and processes controlling methane emissions from rice fields. Nutrient Cycling in Agroecosystems. 49, 111-117.
Nisbet. E. (1990a). Did the release of methane from hydrates accelerate the end of the last ice age? Canadian Journal of Earth Science. 27, 148-157.
Nisbet, E. (1990b). Climate change and methane. Nature. 347, 23. Osborn, T. and Wigley, T. (1994). A simple model for estimating methane concentration and
lifetime variations. Climate Dynamics. 9, 181-193.
Atmospheric Methane: Trends and Impacts 41 Owens, A.J., Steed, J.M., Filkin, D.L., Miller, C. and Jesson, J.P. (1982). The potential effects
of increased methane on atmospheric ozone. Geophysical Research Letters. 9, 1105-1108. Owens, A.J., Hales, C.H., Filkin, D.L., Miller, C., Steed, J.M. and Jesson, J.P. (1985). A
coupled one-dimensional radiative-convective, chemistry-transport model of the atmosphere: 1. Model structure and steady state perturbation calculations. Journal of Geophysical Research. 90, 2283-2311.
Peer, R., Thorneloe, S. and Epperson, D. (1993). A comparison of methods for estimating global methane emissions from landfills. Chemosphere. 26, 387-400.
Petit, J., Jouzel, J., Raynaud, D., Barkov, N., Barnola, J.-M., Basile, I., Bender, M., Chappellaz, J., Davis, M., Delaygue, G., Delmotte, M., Kotlyakov, V., Legrand, M., Lipenkov, V., Lorius, C., Pepin, L., Ritz, C., Saltzman, E. and Stievenard, M. (1999). Climate and atmospheric history of the past 420,000 years from the Vostok ice core, Antarctica. Nature. 399, 429-436.
Penkett, S.A. (1988). Indications and causes of ozone increase in the troposphere. In 'The Changing Atmosphere.' (Eds. F.S. Rowland and I.S.A. Isaksen) pp. 91-103. (John Wiley and Sons, New York, NY).
Pinto, J. and Khalil, M. (1991). The stability of tropospheric OH during ice ages, inter-glacial epochs and modern times. Tellus. 43B, 347-352.
Poppe, D., Zimmerman, J. and Dorn, H. (1995). Field data and model calculations for the hydroxyl radical. Journal of the Atmospheric Sciences. 52, 3402-3407.
Powlson, D., Goulding, K., Willison, T. Webster, C. and Hutsch, B. (1997). The effect of agriculture on methane oxidation in soil. Nutrient Cycling in Agroecosystems. 49, 59-70.
Prather, M. (1994). Lifetimes and eigenstates in atmospheric chemistry. Geophysical Research Letters. 21, 801-804.
Prieme, A., Christensen, S., Dobbie, K. and Smith, K. (1997). Slow increase in rate of methane oxidation in soils with time following land use change from arable agriculture to woodland. Soil Biology & Biochemistry. 29, 1269-1273.
Prinn, R.G., Weiss, R.F., Miller, B.R., Huang, J., Alyea, F.N., Cunnold, D.M., Fraser, P.J., Hartley, D.E. and Simmonds, P. G. (1995). Atmospheric trends and lifetime of CH3CCl3 and global OH concentrations. Science. 269, 187-198.
Quay, P., Stutsman, J., Wilbur, D., Snover, A., Dlugokencky, E. and Brown, T. (1999). The isotopic composition of atmospheric methane. Global Biogeochemcial Cycles. 13, 445-461.
Ramanathan, V. (1988). The radiative and climatic consequences of the changing atmospheric composition of trace gases. In 'The Changing Atmosphere.' (Eds. F. S. Rowland and I.S.A. Isaksen). pp. 159-186. (John Wiley and Sons, New York, NY).
Ramanathan, V., Callis, L, Cess, R., Hansen, J., Isaksen, I., Kuhn, W., Lacis, A., Luther, F., Mahlman, J., Reck, R. and Schlesinger, M. (1987). Climate-chemical interactions and effects of changing atmospheric trace gases. Reviews of Geophysics. 25, 1441-1482.
Ramanathan, V., Cicerone, R.J., Singh, H.B. and Kiehl, J.T. (1985). Trace gas trends and their potential role in climate change. Journal of Geophysical Research. 90, 5547-5566.
Randel, W.J., Wu, F., Russell III, J.M., Roche, A., and Waters, J.W. (1998). Seasonal cycles and QBO variations in stratospheric CH4 and H2O observed in UARS HALOE data. Journal of the Atmospheric Sciences, 55, 163-185.
Randel, W., Wu, F., Russell III, J. and Waters, J. (1999). Space-time patterns of trends in stratospheric constituents derived from UARS measurements. Journal of Geophysical Research. 104, 3711-3727.
Rasmussen, R. A. and Khalil, M.A.K. (1981). Atmospheric methane (CH4): Trends and seasonal cycles. Journal of Geophysical Research. 86, 9826-9832.
42 Donald J. Wuebbles and Katharine Hayhoe Raynaud, D., Chappellaz, J., Barnola, J., Korotkevich, Y. and Lorius, C. (1988). Climatic and
CH4 cycle implications of glacial-interglacial CH4 change in the Vostok ice core. Nature. 333, 655-657.
Raynaud, D., Jouzel, J., Barnola, J., Chapellaz, J., Delmas, R. and Lorius, C. (1993). The ice record of greenhouse gases. Science. 259, 926-934.
Rinsland, C., Levine, J. and Miles, T. (1985). Concentration of methane in the troposphere deduced from 1951 infrared solar spectra. Nature. 318, 245-249.
Roble, R.G. and Dickinson, R.E. (1989). How will changes in carbon dioxide and methane modify the mean structure of the mesosphere and thermosphere? Geophysical Research Letters. 16, 1441-1444.
Roulet, N., Moore, T., Bubier, J. and Lafleur, P. (1992) Northern fens: Methane flux and climatic change. Tellus. 44B, 100-105.
Schauffler, S. and Daniel, J. (1994). On the effect of stratospheric circulation changes on trace gas trends. Journal of Geophysical Research. 99, 25747-25754.
Severinghaus, J., Sowers, T., Brook, E., Aley, R. and Bender, M. (1998). Timing of abrupt climate change at the end of the Younger Dryas interval from thermally fractionated gases in polar ice. Nature. 391, 141-146.
Sigren, L., Lewis, S., Fisher, F. and Sass, R. (1997). Effects of field drainage on soil parameters related to methane production and emission from rice paddies. Global Biogeochemical Cycles. 11, 151-162.
Slanina, J., Warneck, P., Bazhin, N., Akimoto, H., Kieskamp, W., Khalil, M., Calvert, J., Matthews, E., Barrie, L., Wahlen, M., Schwartz, S., Tang, X. and Singh, O. (1994). Assessment of uncertainties in the projected concentrations of methane in the atmosphere. Pure & Applied Chemistry. 66, 137-140.
Steele, L., Dlugokencky, E, Lang, P., Tans, P., Martin, R. and Masarie, K. (1992). Slowing down of the global accumulation of atmospheric methane during the 1980s. Nature. 358, 313-316.
Stern, D. and Kaufmann, R. (1996). Estimates of global anthropogenic methane emissions 1860-1993. Chemosphere. 33, 159-176.
Stordal, F. and Isaksen, I.S.A. (1987). Ozone perturbations due to increases in N2O, CH4, and chlorocarbons: two-dimensional time-dependent calculations. Tellus. 39B, 333-353.
Subak, S. (1994). Methane from the House of Tudor and the Ming Dynasty: Anthropogenic emissions in the sixteenth century. Chemosphere. 29, 843-854.
Thompson, A. and Cicerone, R. (1986). Atmospheric CH4, Co and OH from 1860 to 1985. Nature. 321, 148-150.
Thompson, A. and Cicerone, R. (1986). Possible perturbations to atmospheric CO, CH4, and OH. Journal of Geophysical Research. 91, 10853-10864.
Thompson, A., Stewart, R., Owens, M. and Herwehe, J. (1989). Sensitivity of tropospheric oxidants to global chemical and climate change. Atmospheric Environment. 23, 519-532.
Thompson, A., Huntley, M. and Stewart, R. (1990). Perturbations to tropospheric oxidants, 1985-2035: Calculations of ozone and OH in chemically coherent regions. Journal of Geophysical Research. 95, 9829-9844.
Thompson, A. (1992). The oxidizing capacity of the Earth’s atmosphere: Probable past and future changes. Science, 256, 1157-1165.
Thompson, A., Chappellaz J., Fung, I. and Kucsera, T. (1993). The atmospheric CH4 increase since the Last Glacial Maximum: (2) Interactions with oxidants. Tellus. 45B, 242-257.
Thorpe, R., Law, K., Bekki, S., Pyle, J. and Nisbet, E. (1996). Is methane-driven deglaciation consistent with the ice core record? Journal of Geophysical Research. 101, 28627-28635.

Atmospheric Methane: Trends and Impacts 43 Van Dop, H. and Krol, M. (1996). Changing trends in tropospheric methane and carbon
monoxide: A sensitivity analysis of the OH radical. Journal Atmospheric Chemistry. 25, 271-288.
Velichko, A., Kremenetski, C., Borisova, O., Zelikson E., Nechaev, V. and Faure, H. (1998). Estimates of methane emission during the last 125,000 years in Northern Eurasia. Global & Planetary Change. 16-17, 159-180.
Wang, C., Prinn, R. and Sokolov, A. (1998). A global interactive chemistry and climate model: Formulation and testing. Journal of Geophysical Research. 103, 3399-3417.
Wang, W.C. and Molnar, G. (1985). A model study of the greenhouse effects due to increasing atmospheric CH4, N2O, CF2C12 and CFC13. Journal of Geophysical Research. 90, 12971-12980.
Wang, W.C., Wuebbles, D.J., Washington, W.M., Isaacs, R.G. and Molnar, G. (1986). Trace gases and other potential perturbations to global climate. Reviews of Geophysics. 24, 110-140.
Wang, W.C., Dudek, M.P., Liang, X.Z. and Kiehl, J.T. (1991). Inadequacy of effective CO2 as a proxy in simulating the greenhouse effect of other radiatively active gases. Nature. 350. 573-577.
Ward, G., Doxtader, K., Miller, W. and Johnson, D. (1993). Effects of intensification of agricultural practices on emission of greenhouse gases. Chemosphere. 26, 87-93.
Wigley, T.M.L. (1987). Relative contributions of different trace gases to the greenhouse effect. Climate Monitor. 16, 14-28.
World Meteorological Organization. (1985). Scientific Assessment of Ozone Depletion: 1985. Global Ozone and Research and Monitoring Project Report 16, Geneva.
World Meteorological Organization. (1989). Scientific Assessment of Ozone Depletion: 1989. Global Ozone and Research and Monitoring Project Report 20, Geneva.
World Meteorological Organization. (1991). Scientific Assessment of Ozone Depletion: 1991. Global Ozone and Research and Monitoring Project Report 25, Geneva.
World Meteorological Organization. (1995). Scientific Assessment of Ozone Depletion: 1994. Global Ozone and Research And Monitoring Project Report 37, Geneva.
World Meteorological Organization. (1999). Scientific Assessment of Ozone Depletion: 1998. Global Ozone and Research And Monitoring Project Report 44, Geneva.
Wuebbles, D.J., Luther, F.M. and Penner, J.E. (1983). Effect of coupled anthropogenic perturbations on stratospheric ozone. Journal of Geophysical Research. 88, 1444-1456.
Wuebbles, D., Hayhoe, K. and Kotamarthi, R. (1999). Atmospheric Methane in the Global Environment. In 'Atmospheric Methane: Sources, Sinks, and Role in Global Change.' (Eds. M. Khalil), (Springer-Verlag, New York, NY).
Yagi, K., Tsuruta, H. and Minami, K. (1997). Possible options for mitigating methane emission from rice cultivation. Nutrient Cycling in Agroecosystem. 49, 213-220.
Zoger, M., Engel, A., McKenna, D.S., Schiller, C., Schmidt, U., and Woyke, T. (1999). Balloon-borne in situ measurements of stratospheric H2O, CH4 and H2 at midlatitudes. Journal of Geophysical Research, 104, 1817-1825.


![The combustion mitigation of methane as a non-CO2 ... · significant contributor to anthropogenic methane emissions, . The main at around 30% [7] activities causing methane emissions](https://static.fdocuments.in/doc/165x107/5fb2384183d05b18f61f7684/the-combustion-mitigation-of-methane-as-a-non-co2-significant-contributor-to.jpg)