Atlas Copco Internship Report
129
Hamsini GopalakrishnaAtlas Copco, Nanjing, China Summer Internship – 2012 ATLAS COPCO, Nanjing, China Report of Summer Internship 28 th May to 26 th July 2012 Page 1 of 129
-
Upload
hamsini-gopalakrishna -
Category
Documents
-
view
594 -
download
7
Transcript of Atlas Copco Internship Report

Hamsini Gopalakrishna Atlas Copco, Nanjing, China Summer Internship – 2012
ATLAS COPCO, Nanjing, China
Report of
Summer Internship28th May to 26th July 2012
By
Hamsini Gopalakrishna
Purdue University
Purdue ID: 0024012407
Page 1 of 95
Hamsini Gopalakrishna Atlas Copco, Nanjing, China Summer Internship – 2012
West Lafayette, IN – 47906, USA
CONTENTS
Certificate . . . . . . . . . . . . . . 3
About Atlas Copco . . . . . . . . . . . . 4
Summary . . . . . . . . . . . . . . 5
Detailed report . . . . . . . . . . . . . 6
Summary of samples analyzed . . . . . . . . . 8
Details of samples analyzed . . . . . . . . . . 10
Thoughts and future work . . . . . . . . . . 25
Acknowledgement . . . . . . . . . . . . 26
Travel report – Xu Zhou BUT company . . . . . . . 27
Appendix I – Manuals . . . . . . . . . . . 29
Appendix II – Photographs . . . . . . . . . . 65
Xu Zhou trip . . . . . . . . . . . . 73
Wuxi visit . . . . . . . . . . . . . 77
Appendix III – Presentation . . . . . . . . . . 81
Page 2 of 95
Hamsini Gopalakrishna Atlas Copco, Nanjing, China Summer Internship – 2012
CERTIFICATEThis is to confirm that Hamsini Gopalakrishna has successfully completed
her industrial internship at Atlas Copco, Nanjing, China. This 8 week internship
lasted from the 28th of May till the 26th of July 2012. She worked in the
Materials and Metallurgical Group in Rocktec and was assigned the following
tasks –
1) Familiarizing, using and writing the quick reference manuals for a
microscope, a stereoscope, hardness testers, sample making machines and
the SEM. The Ultrasonic tester and the Magnetic Particle tester were also
included.
2) Measurements using all of the above equipment with samples (where
applicable).
3) Non Destructive Testing (NDT) at supplier’s factory. (Xu Zhou BUT
Construction Machinery Holding Co.Ltd.)
4) Study tour of Atlas Copco assembly plant of Nanjing and Wuxi.
5) Familiarization of welding, casting, ultrasonic testing and magnetic particle
testing standards as well as other industrial procedures.
She has completed the above tasks successfully and on time. We found
Hamsini Gopalakrishna to be efficient, industrious and to have a hunger to
learn new techniques. She is very cooperative and has good team spirit. She
will be an asset to any organization she would work with. We wish her success
in her future endeavors.
Dr. Johnny Huang Mr. Suresh Shyamsundar
Page 3 of 95

Hamsini Gopalakrishna Atlas Copco, Nanjing, China Summer Internship – 2012
Materials and Metallurgical group leader Head of R&D center (Rocktec)
About Atlas Copco
Atlas Copco is a Swedish industrial conglomerate which manufactures
compressors, generators and industrial tools in addition to construction and
mining equipment. It was founded in the year 1873. Its headquarters is in
Stockholm, Sweden. It has production sites in 20 countries. Their single largest
market is in mainland China. It has 18 facilities in China. The plants at Wuxi,
Nanjing and Tianjin are R&D centers with state of art laboratories in addition
to having production facilities.
Atlas Copco, Nanjing is a research facility that has various divisions like
Rocktec, Surface Drilling Equipment (SDE), Underground Rock Excavation
(URE), Geotechnical Drilling Equipment (GDE) and Atlas Copco Drilling
Solutions (ADS). It also has a full assembly line on site. Approximately 400
people work in the plant at Nanjing. Rocktec supports the other divisions in the
technical aspects. Rocktec has six divisions namely Applied Mechanics,
Materials and Metallurgical group, Measurement group, Patent group, Product
Lifecycle Management (PLM) Solutions and Industrial design. The PLM
division focuses on Product Design (CAx) and Product Data Management.
Atlas Copco, Wuxi is a research facility in addition to being an assembly
plant. Approximately 600 personnel work in the plant. They produce screw
compressors. Their staff averages 110 hours of technical training per person on
the job.
Page 4 of 95

Hamsini Gopalakrishna Atlas Copco, Nanjing, China Summer Internship – 2012
Summary
It was a very educative and hands-on experience overall. During the internship (28th May – 26th July 2012), Hamsini successfully completed the tasks outlines below.
i) Hamsini independently used the lab equipment. The lab equipment consisted of an SEM, hardness testers, microscope, stereoscope, sample making equipment and Non Destructive Testing (NDT) equipment.
ii) She prepared quick reference guides for all of the above equipmentiii) She helped write the lab regulations for safety in the labsiv)She used the Analyzed samples including
a) Failed crank shaftb) ADS shaftc) Comparison between two pistonsd) Fractured bolte) Deformed bushingf) Aluminum feed beamg) Steel exhaust pipe
v) She familiarized herself with various standards likea) EN ISO 5817:2007 – Welding – Fusion-welded joints in steel, nickel,
titanium and their alloys (beam welding excluded) – Quality levels for imperfections
b) BS EN 1290:1998 – Magnetic particle testing of weldsc) BS EN ISO 17640:2010 – Ultrasonic testingd) BS EN ISO 377:1997 – Steel and steel products – Location and
preparation of samples and test pieces for mechanical testinge) BS EN ISO 3651-2:1998 – Determination of resistance of inter-granular
corrosion of stainless steelsf) ISO 21610:2009(E) – Accelerated corrosion test for inter-granular
corrosion susceptibility of austenitic stainless steels g) en 10 9001 K – Atlas Copco Standard for Delivery requirements for Steels
and iron productsh) en 6134 K – Atlas Copco Specifications for Steel and Iron casting
requirementsvi) She studied and familiarized with case studies and reports by other engineers.vii) She accompanied the NDT Engineer, Mr. Allen Zhang and the Sourcing
Quality Engineer (SQE) Mr. Zhengzheng Xu to the BUT Construction Machinery Holding Co. Ltd. in Xu Zhou. (21st June, 2012). Welds in the frames for B-282 were to be tested for surface and sub-surface flaws using the Ultrasonic testing methods.
Page 5 of 95
Hamsini Gopalakrishna Atlas Copco, Nanjing, China Summer Internship – 2012
viii) She toured the Wuxi Atlas Copco plant to better understand the working of the industry. Accompanied Mr. Alex Xie and Mr Charles Fu (19th July, 2012).
Detailed report
On my first day, May 26th, 2012, Hamsini Gopalakrishna was assigned to the Materials and Metallurgy team. She was introduced to the members; Dr. Johnny Huang (Dr. Huang Xing), the team leader, Mr. Allen Zhang (Mr. Zhang Guoqiang) and Mr. Charles Fu (Mr. Fu Pei). Mr. Allen is the Welding and Non Destructive Testing (NDT) engineer. Mr. Charles is the Materials Science engineer. she was able to get a clear idea of the scope and nature of work after a tour of the lab and the production facility. The materials analysis lab has been functional since March, 2012.
The equipment in the labs consisted of
a. Microscopesi. Optical Microscope
ii. Optical Stereoscopeiii. Scanning Electron Microscope (SEM)
b. Sample making equipmenti. Cutting machine
ii. Mounting machineiii. Grinding and polishing machineiv. Precision weighing scale
c. Hardness testersi. Vickers microhardness tester
ii. Universal testeriii. Brinell tester
d. Non Destructive Testing Equipment (NDT)i. Ultrasonic tester
ii. Magnetic particle tester.
Over the next few weeks, she was trained on using the above equipment by Mr. Charles and Mr. Allen. She got familiar with their usage and settings. She also used these machines with several samples and took readings (where applicable). My first task was to write short user manuals or quick reference guides for the equipment. This was because most of the manuals provided by the supplying companies were in Chinese and/or were too long. When the
Page 6 of 95

Hamsini Gopalakrishna Atlas Copco, Nanjing, China Summer Internship – 2012
manuals were finalized, they were laminated and displayed next to the machines. She highlighted various precautions to be taken for safe usage of the lab equipment. The manuals can be found in Appendix I.
Her second task was to create a presentation. The design engineers, mechanical engineers and engineers from the sourcing department were to be given a presentation about the equipment in our labs by the Materials and Metallurgical group. The main idea was to inform the engineers about how the equipment in the labs can help analyze samples to provide useable information. She made the presentation illustrating the main uses and features of the equipment in the labs. This can be found in Manual III.
Hamsini visited the BUT Construction Machinery Holding Co. Ltd. in Xu Zhou (21st June 2012). She accompanied Mr. Allen Zhang and Mr. Zhengzheng Xu from sourcing. Some machine frames were to be tested using the Ultrasonic tester for surface and sub-surface flaws in the welds.
Mr. Alex Xie (Mr. Xie Xiaogang), a measurement engineer, and Mr. Charles Fu and Hamsini visited the Atlas Copco R&D center in Wuxi, China. It had a full product assembly line as well. We met Mr. Koen Lemmens, the R&D center Product Development Support Manager and Mr. Cheng Xiao Bo, the Materials Engineer. They also met Mr. Lin Zhi Min, the Noise and Vibration Engineer and Xu Bin Jie, the Infrastructure, Calibration and Computer Aided Testing (CAT) engineer. They took a tour around the facility. They saw various types of compressors, generators and testing equipment. After lunch, they had a discussion with the materials engineer on a broken aluminum oil separator. They were trying to find out the probable cause of failure.
There were often samples that came from the factory to be analyzed. Microstructure analysis, failure analysis and hardness test were some of the tests run on the samples. The details of the samples included the following
a. A crank shaft used in automobiles. Atlas Copco was testing the reason for failure. The pipe was induction welded. This failed during testing.
b. A comparison between an Atlas Copco and a competitor’s pistons. The Atlas Copco piston cracked while operating.
c. A fractured bolt from ADS.d. An analysis of a failed bushing from the SDE department (from the
CDM 75). The bushing had deformed.e. An aluminum feed beam from the drilling machines. The beams
supplied by a local company were being compared to imported beams.f. Drilling shaft that Atlas Copco was buying from a supplier. This failed
during testing. (ADS)
Page 7 of 95

Hamsini Gopalakrishna Atlas Copco, Nanjing, China Summer Internship – 2012
g. A steel pipe had to be tested for corrosion resistance. She helped prepare a sample for chemical analysis. She read up on standards for a corrosion test.
Page 8 of 95

Hamsini Gopalakrishna Atlas Copco, Nanjing, China Summer Internship – 2012
Summary of samples analyzedTable 1: Samples analyzed during the internship
Sl. No
Item Failure Details Processes Equipment used Conclusion
1 Crank shaft A crack was noticed during inspection. It was induction
welded. In induction welding, electromagnetic induction is
used to heat the piece.
Microstructure analysis
Sample making equipment (Cutting,
Mounting, Grinding
machines),Microscope
The welding was flawed. The probable cause of the crack in the weld is incorrect weld
temperature. The microstructure around the weld – ferrite and pearlite indicate that the pre-welding
pressure was up to standards.
2 Comparison between Atlas
Copco and competitor 4”
pistons
The Atlas Copco piston failed in operation. It cracked at the
striking surface.
Hardness testing and
Microstructure analysis
Sample making equipment,
microscope and Vickers hardness
tester
The raw materials were different. The competitor core is more tempered. This increased
toughness. In their carburization layer, the microstructure is finer. Their surface is less harder
than Atlas Copco’s pistons.
3 Bolt from ADS
The bolt cracked half way during assembly. This bolt and
three others in the same structural position were
analyzed for causes of failure.
Surface and failure analysis
Stereoscope The surface was harder* than the core as per requirement. Both the core and the surface
hardnesses were above the required standards. This caused the surface to be brittle and prone to
cracking. The hardness of the other bolts used in the same functional position was too low (sourced from
the warehouse). This led to fracture
* The hardness tests, microstructure analysis and chemical composition analysis were done prior to my internship.The most probable cause of failure has been bolded. In some cases the cause of failure is not evident.Table summarizing the samples analyzed during the internship – Continued
Page 9 of 95

Hamsini Gopalakrishna Atlas Copco, Nanjing, China Summer Internship – 2012
Sl. No
Item Failure Details Processes Equipment used Conclusion
4 Deformed bushing
The bushing deformed when the feed beam moved. The assembly technician was adding oil to the cylinder when the beam moved. The pin roll had detached.
Microstructure analysis andHardness testing
Sample making equipment, microscope and Vickers hardness tester
The chemical composition, microstructure, hardness and its tensile strength meet the requirements. The microstructure around the deformed area suggests ductile failure. Material cause of failure may be ruled out
5 ADS Shaft A shaft circle welded with plates was broken at/near the Heat Affected Zone (HAZ).
Element analysis, tensile test, micro-hardness test and analysis
Tensile tester, Vickers hardness tester, sample making equipment and microscope
The high internal stress concentration near the welding area caused it to break. High weld area hardness also caused failure. Application of an external force tends to break it. It was found that the welders were not sticking to the welding protocol.
6 Aluminum feed beam for the drilling machines.
This was not a case of failure. The aluminum beams from local companies were being compared to the imported beams being used.
Hardness test Brinell hardness tester
The average hardness value was 104.36. HB. The imported feed beams are being used in the machines. Due to lack of a portable hardness tester, testing the imported beams will be postponed. This was an ongoing analysis at the time of the internship.
Page 10 of 95

Hamsini Gopalakrishna Atlas Copco, Nanjing, China Summer Internship – 2012
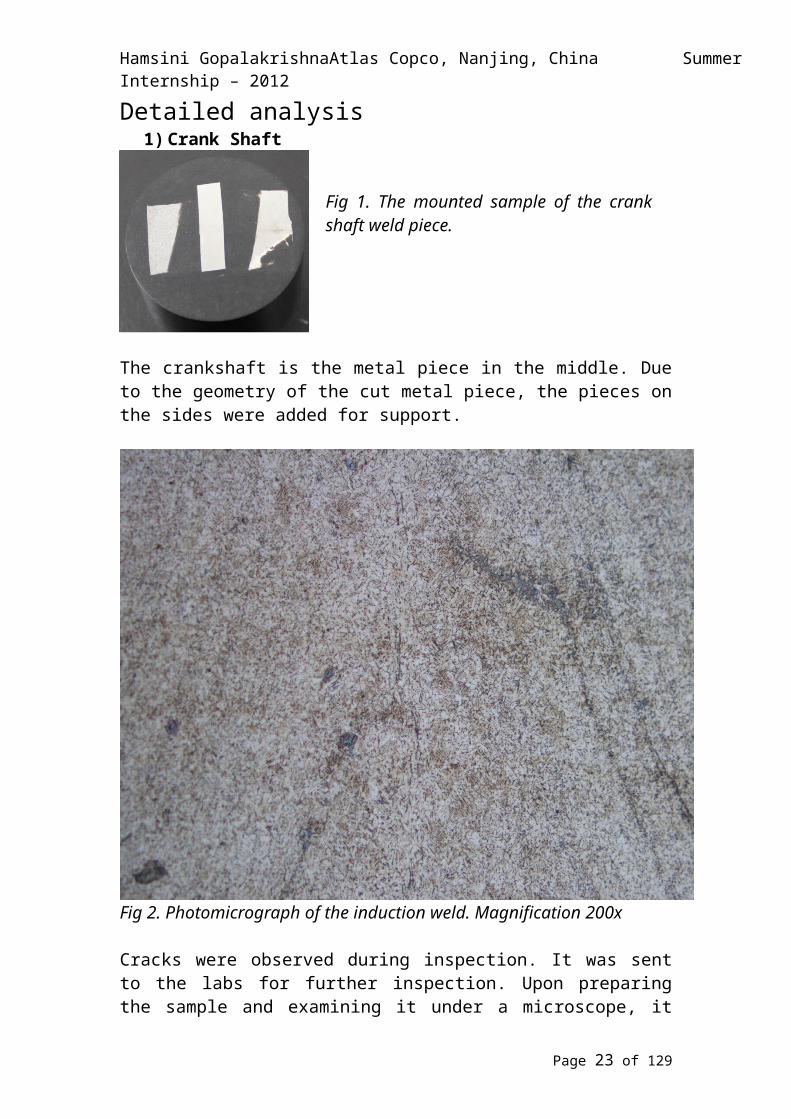
Detailed analysis1) Crank Shaft
The crankshaft is the metal piece in the middle. Due to the geometry of the cut metal piece, the pieces on the sides were added for support.
Fig 2. Photomicrograph of the induction weld. Magnification 200x
Cracks were observed during inspection. It was sent to the labs for further inspection. Upon preparing the sample and examining it under a microscope, it was found that improper welding was the cause. There was a crack in the welding. The probable cause is improper weld temperature. This can be known by the fact that the microstructure around the weld is typical of proper pressure parameters.
Page 11 of 95
Fig 1. The mounted sample of the crank shaft weld piece.
Hamsini Gopalakrishna Atlas Copco, Nanjing, China Summer Internship – 2012
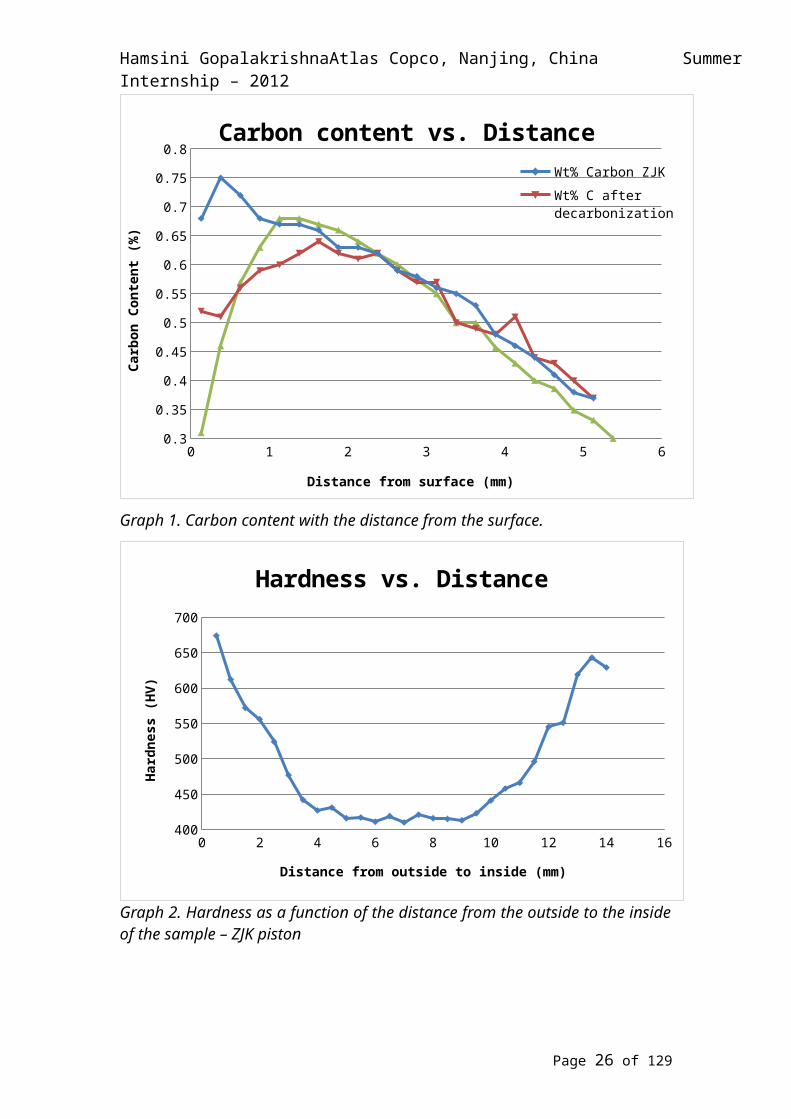
2) 4” pistons – Atlas Copco vs. CompetitorThe starting material was different. The Atlas Copco piston was made of 18CrMnNi2MoA while the competitor’s piston is made of 20Cr2Ni4A.
The direction of the hardness gradient is shown
Page 12 of 95
Fig 5. AC ZJK piston
Fig 6. HJG piston
Fig 3. The ZJK (Atlas Copco) piston
Fig 4. The HJG (competitor) piston
Hamsini Gopalakrishna Atlas Copco, Nanjing, China Summer Internship – 2012
Fig 7. ZJK2 piston surface structure, Fig 8. ZJK2 piston, core carburized case. 500x structure 500x
0 1 2 3 4 5 60.3
0.35
0.4
0.45
0.5
0.55
0.6
0.65
0.7
0.75
0.8Carbon content vs. Distance
Wt% Carbon ZJKWt% C after decarbonizationWt % Carbon HJG piston
Distance from surface (mm)
Carb
on C
onte
nt (%
)
Graph 1. Carbon content with the distance from the surface.
Page 13 of 95
Fig 9. HJG piston, surface structure, carburized case×500
Fig 10. The surface defect on sample 1, the center. 500x

Hamsini Gopalakrishna Atlas Copco, Nanjing, China Summer Internship – 2012
0 2 4 6 8 10 12 14 16400
450
500
550
600
650
700
Hardness vs. Distance
Distance from outside to inside (mm)
Hard
ness
(HV)
Graph 2. Hardness as a function of the distance from the outside to the inside of the sample – ZJK piston
0 2 4 6 8 10 12 14 16 18 20400
450
500
550
600
650
Hardness vs. Distance
Distance from inner surfaceto outer surface (mm)
Hard
ness
(HV)
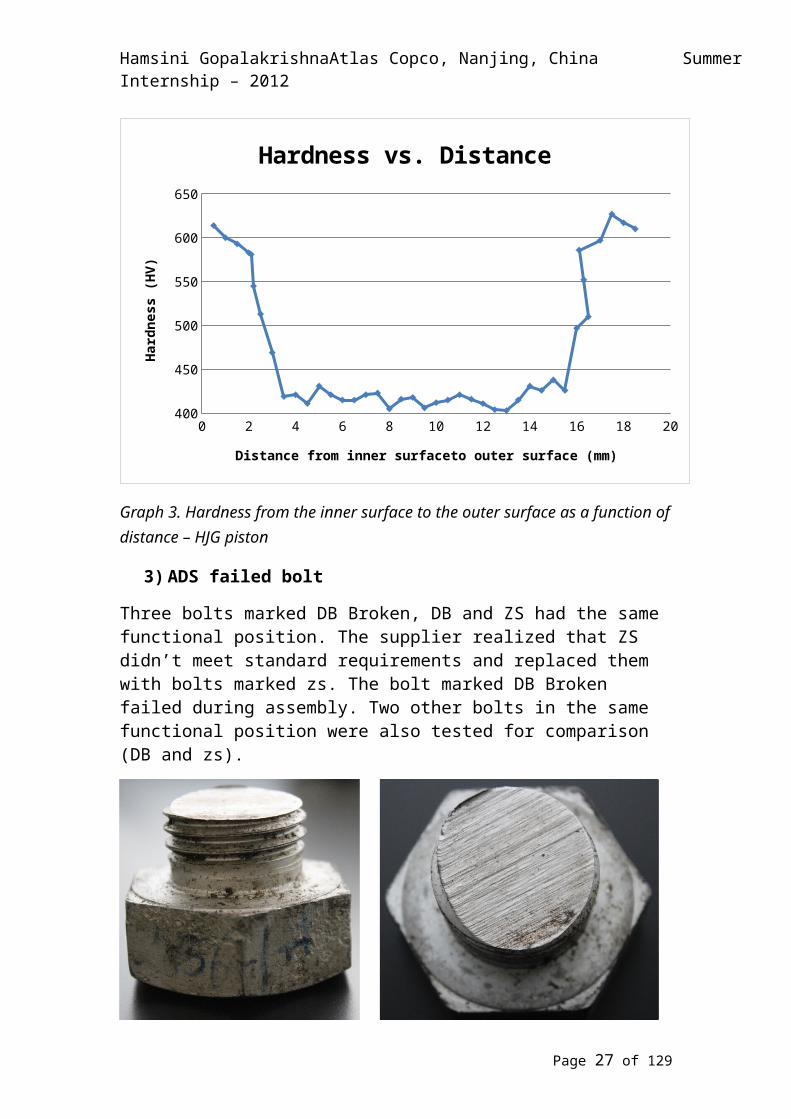
Graph 3. Hardness from the inner surface to the outer surface as a function of distance – HJG piston
Page 14 of 95

Hamsini Gopalakrishna Atlas Copco, Nanjing, China Summer Internship – 2012
3) ADS failed bolt
Three bolts marked DB Broken, DB and ZS had the same functional position. The supplier realized that ZS didn’t meet standard requirements and replaced them with bolts marked zs. The bolt marked DB Broken failed during assembly. Two other bolts in the same functional position were also tested for comparison (DB and zs).
Fig 11. Side view – DB Broken Fig 12. Top view of the cut part DB Broken
Table 2. Bolts analyzed for their composition.
Mark C Si Mn P S Cr Mo
DB Broken 0.43 0.24 0.84 0.015 0.007 0.99 0.2
DB 0.39 0.23 0.61 0.014 0.007 0.99 0.16
zs 0.33 0.2 0.55 0.016 0.006 0.91 0.16
Hardness testing: The four bolts were tested for hardness in the core region and on the surface. Representative graphs are given below the table
Table 3. Hardness values for core and surface of the different bolts
Mark Core Hardness (HV 0.3) Surface Hardness (HV 0.3)DB Broken 448, 440, 445 430, 440, 437
DB 437, 430, 422, 412, 410, 417 448, 432, 441, 420, 438, 421ZS 369, 353, 357 229, 233, 239zs 361, 347, 333, 367, 374,
378, 299, 300, 309, 337, 328, 338, 288, 282, 287
396, 393, 391, 415, 412, 403, 469, 487, 472, 408, 405, 420, 407, 415, 422
Standard Requirements
GB/T 3098.1-2000
Minimum: 385, Maximum: 435Surface hardness shall not be more than 30 Vickers points above the measured core hardnesses. This is for HV 0.3
Page 15 of 95

Hamsini Gopalakrishna Atlas Copco, Nanjing, China Summer Internship – 2012
1 2 3 4 5 6 7 8 9 10 11 12 13 14 15250
270
290
310
330
350
370
390
410
430
450
261
347 333
367374 378
299
300309
337328
338
288282 287
369 353 357
437 430422
412 410417
448440 445
385
435
Hardness values - Corezs
ZS
DB
DB Broken
Standard
Hard
ness
(HV
0.3)
Graph 4. Hardness of the core.
1 2 3 4 5 6 7 8 9 10 11 12 13 14200
250
300
350
400
450
500
369
393 391
415 412403
469487
472
408 405420 415 422
229 233 239
448
432
441420
438421430
440
437
385
435
Hardness Values - Surface
zs
ZS
DB
DB Broken
Standard
HArd
ness
(HV
0.3)
Graph 5. Hardness of the surface
Page 16 of 95

Hamsini Gopalakrishna Atlas Copco, Nanjing, China Summer Internship – 2012
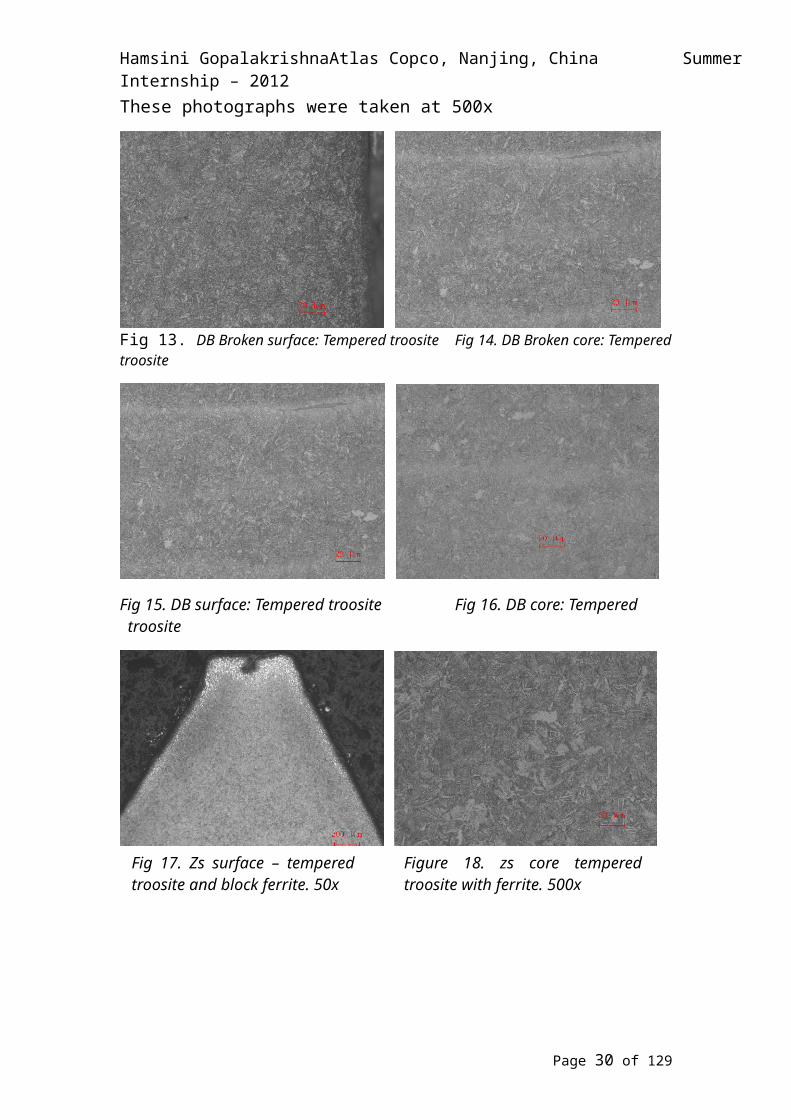
These photographs were taken at 500x
Fig 13. DB Broken surface: Tempered troosite Fig 14. DB Broken core: Tempered troosite
Fig 15. DB surface: Tempered troosite Fig 16. DB core: Tempered troosite
The above analysis was completed by the Materials group before I started my internship. The data has been included for the sake of completeness.
Page 17 of 95
Fig 17. Zs surface – tempered troosite and block ferrite. 50x
Figure 18. zs core tempered troosite with ferrite. 500x
Hamsini Gopalakrishna Atlas Copco, Nanjing, China Summer Internship – 2012
Fig 19. Top view of the broken bolt Fig. 20 Side view of the broken bolt
The surface of the bolt was analysed. Along with the data from the hardness
tests, it was found that the bolt was brittle due to high hardness. This was the
cause of failure.
The hardness of the bolt exceeded the requirement of 435 HV 0.3 in the GB/T
3098.1-2000 standard.
Hardness of the zs bolt was too low.
The carbon and Mn content in the broken bolt was higher than the other bolts
tested. This is a cause for high hardness.
Ferrite observed in zs and low core hardness indicates that the heat treatment
process isn’t well controlled. The part isn’t thoroughly hardened.
Page 18 of 95

Hamsini Gopalakrishna Atlas Copco, Nanjing, China Summer Internship – 2012
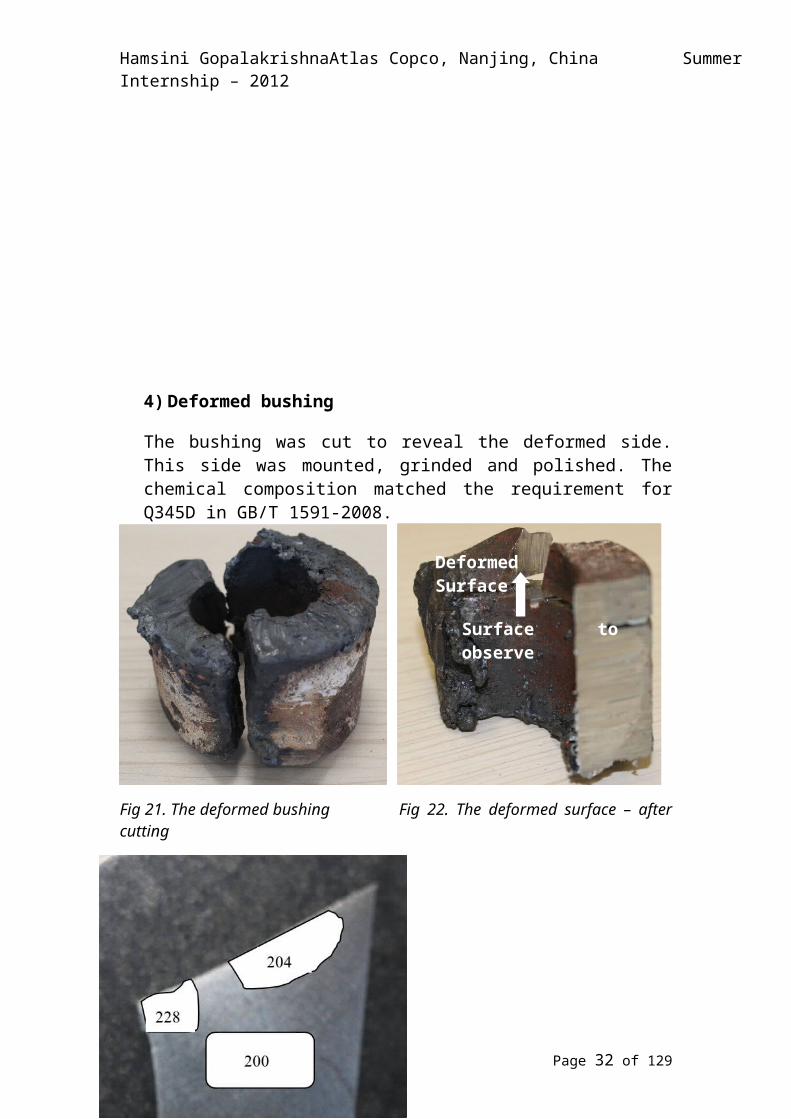
4) Deformed bushing
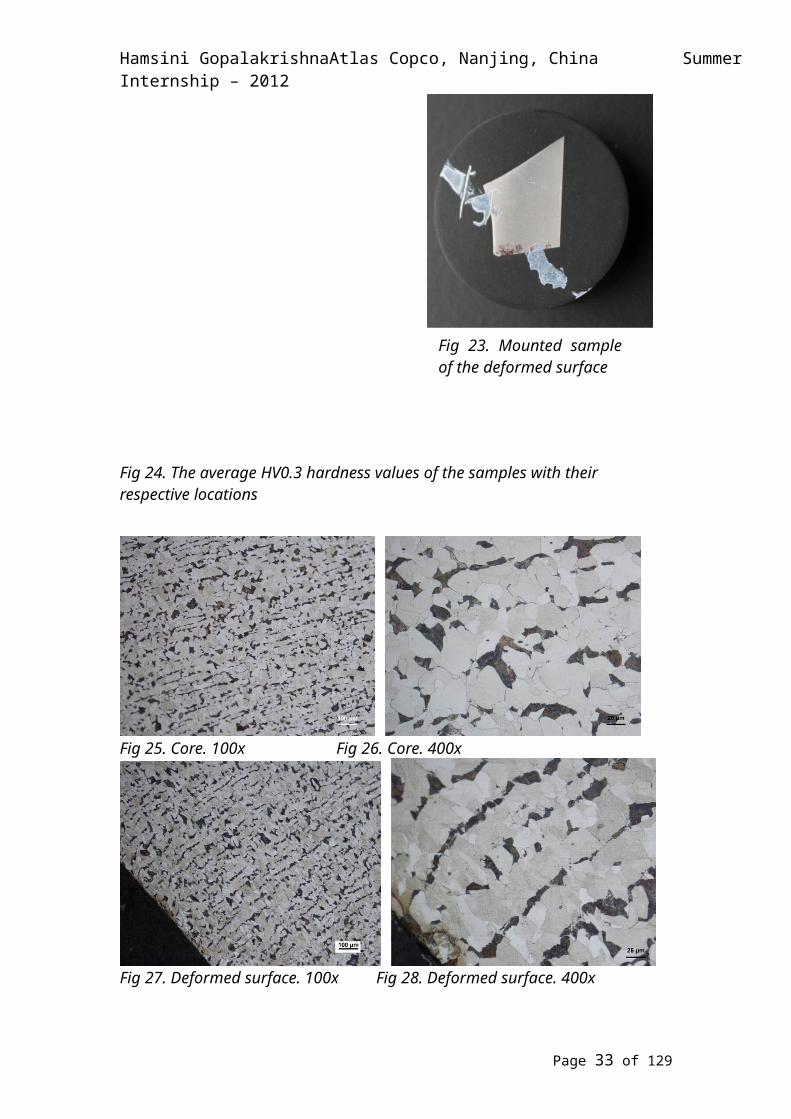
The bushing was cut to reveal the deformed side. This side was mounted, grinded and polished. The chemical composition matched the requirement for Q345D in GB/T 1591-2008.
Fig 21. The deformed bushing Fig 22. The deformed surface – after cutting
Fig 24. The average HV0.3 hardness values of the samples with their respective locations
Page 19 of 95
Surface to observe microstructure
DeformedSurface
Fig 23. Mounted sample of the deformed surface

Hamsini Gopalakrishna Atlas Copco, Nanjing, China Summer Internship – 2012
Fig 25. Core. 100x Fig 26. Core. 400x
Fig 27. Deformed surface. 100x Fig 28. Deformed surface. 400x
Fig. 29. Non deformed surface. 100x Fig 30. Non deformed surface. 400x
Table 4: Chemical composition of the sample and Q345D requirement.Element C Si Mn P S
Bushing sample,% 0.15 0.21 1.06 0.013 0.007Q345D requirement,% >0.18 >0.50 >1.70 >0.030 >0.025
Page 20 of 95

Hamsini Gopalakrishna Atlas Copco, Nanjing, China Summer Internship – 2012
Fig 31. Deformed Corner: 50x Fig 32. Deformed surface corner 400x
Table 5: Hardness values of the various surfaces
Location Core Deformed Surface
Non deformed surface
Deformed Corner
Trial 1 212 218 168 230
Trial 2 199 209 176 224
Trial 3 199 198 176 231
Trial 4 189 191 184 -
Average 200 204 176 228
Due to lack of information about heat treatment process, it is impossible to judge whether the part’s mechanical properties are suitable. The ductile nature of the deformation indicates that the failure may not be entirely due to material causes. The chemical composition matches the requirements. The ferrite and pearlite microstructure is typical. The sample hardness is around 176 – 204 HV 0.3 and the tensile strength is 560 – 625 MPa The tensile strength was obtained using a conversion chart DIN 50150: Conversion of hardness values for metallic materials.
Page 21 of 95
Hamsini Gopalakrishna Atlas Copco, Nanjing, China Summer Internship – 2012
5) ADS Shaft
The shaft circle welded with plates was broken. Element inspection, tensile testing, micro-hardness test and microstructure analysis were done on the shaft base metal. A micro-hardness test was run on the weld.
The chemical composition matches grade 45 steel. The matrix consists of pearlite and ferrite which is typical for normalized grade 45 steel. Weld area microstructure consists of sorbite with ferrite in the grain boundaries.
Fig 33. The ADS shaftFig 34. Mounted sample of the shaft
Page 22 of 95
Hamsini Gopalakrishna Atlas Copco, Nanjing, China Summer Internship – 2012
Fig 35. Base metal 100× Fig 36. Base metal 500×The white phase is ferrite, and the dark phase is pearlite.
Fig 37. Weld area 100× Fig 38. Weld area 500×
The dark phase is sorbite, and white phase in grain boundary is ferrite.
Table 6: Chemical composition of the shaft
Element C (%) Si Mn P S Cr Ni
Grade 45 Steel
0.42-0.50 0.17-0.37 0.50-0.80 <0.035 <0.035 <0.25 <0.3
Sample 0.43 0.22 0.58 0.025 0.017 0.05 0.02
Table 7: Mechanical properties of the shaft
Page 23 of 95

Hamsini Gopalakrishna Atlas Copco, Nanjing, China Summer Internship – 2012
Tensile Strength (MPa) Yield Strength (MPa) % Elongation
650 259 23
The average hardness for the base metal is 198.6 HV 0.3. The average hardness value for the weld area is 360 HV 0.3.
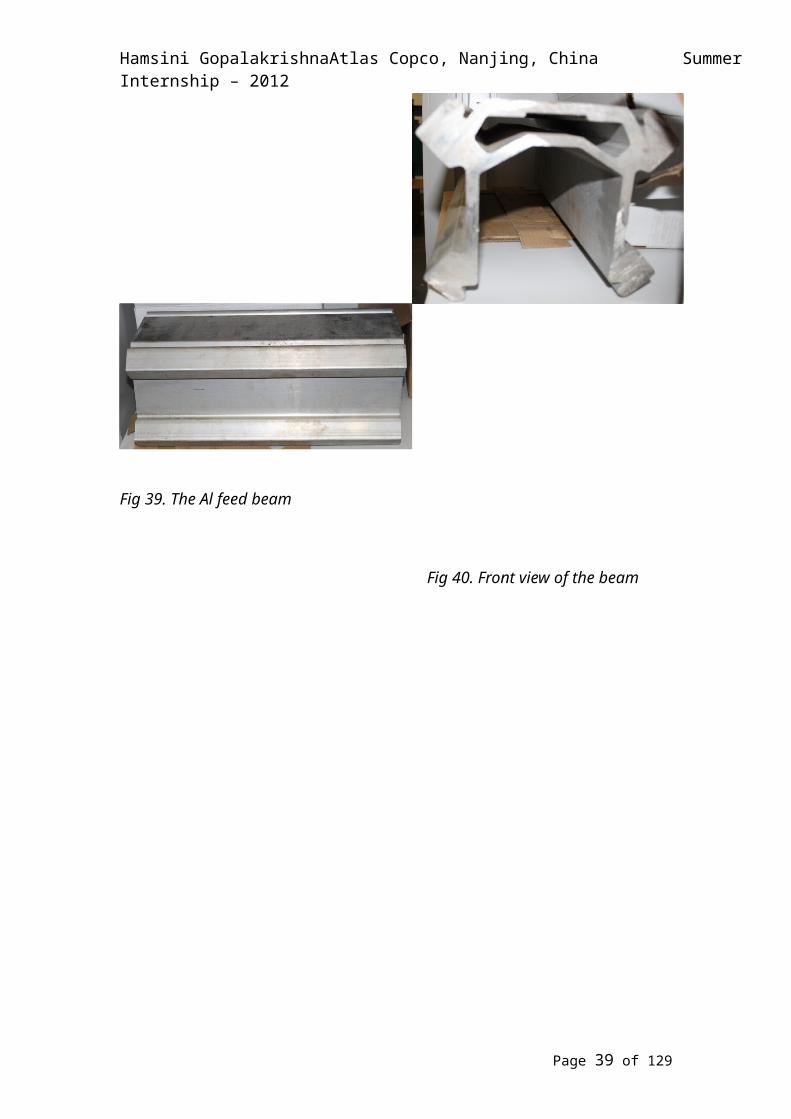
6) Aluminum Beam
The local and imported beams were to be compared. The local beams are cheaper. If they meet the standard requirements, they would replace the imported beams. Hardness test was run on the local beam (pictured below). The imported beams are being used in the machines. The lab is not equipped with a portable hardness tester. Bringing the whole beam to the lab would be a problem as the beams are over 20 feet in height. One of the ways the imported beams can be tested is when a machine beam fails; a part of it can be cut and tested. Another way is if a beam is bought solely for testing purposes. This was an ongoing project when the internship ended.
Page 24 of 95

Hamsini Gopalakrishna Atlas Copco, Nanjing, China Summer Internship – 2012
Fig 39. The Al feed beam
Fig 40. Front view of the beam
Page 25 of 95
Hamsini Gopalakrishna Atlas Copco, Nanjing, China Summer Internship – 2012
Fig 41. Mounted sample Fig 42. Piece used for hardness testing
Table 8: Composition of the beam
Element Si Fe Cu Mn Mg Zn Ti Zr
Amount (%) 0.14 0.20 0.08 0.24 1.2 4.80 0.04 0.12
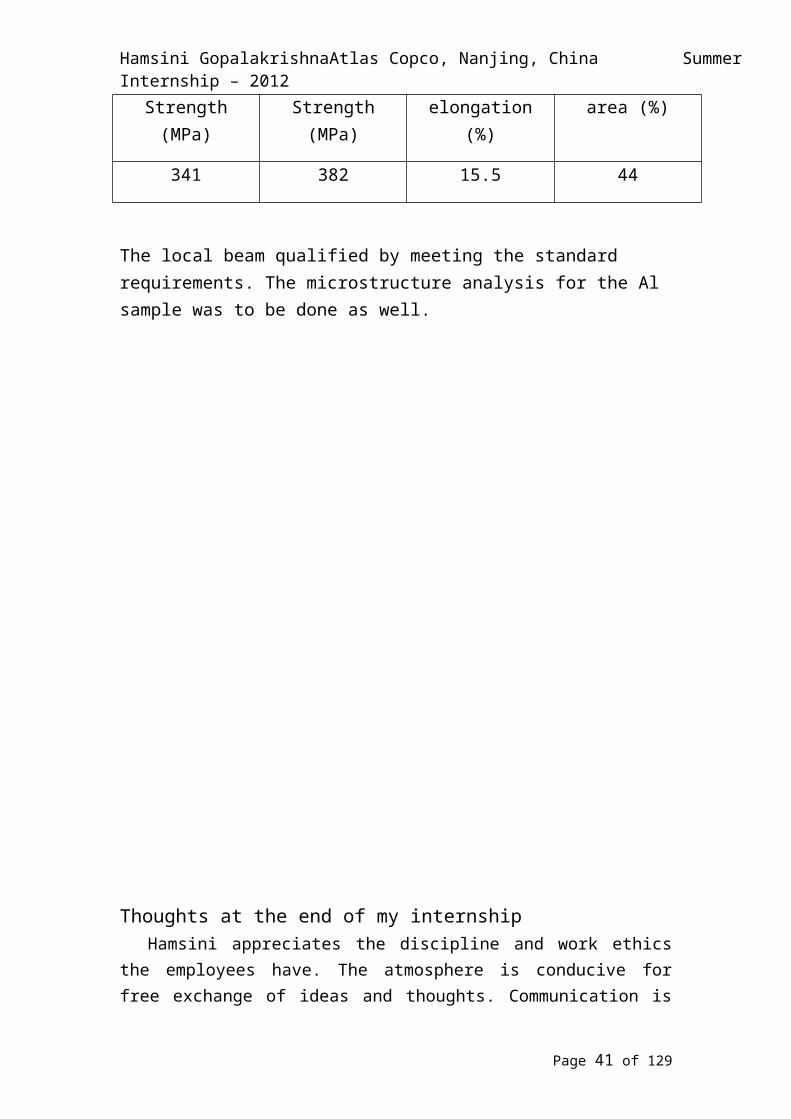
Table 9: Mechanical properties of the local Al beam
Tensile Strength (MPa)
Yield Strength (MPa)
Percentage elongation (%)
Reduction in area (%)
341 382 15.5 44
Page 26 of 95
Hamsini Gopalakrishna Atlas Copco, Nanjing, China Summer Internship – 2012
The local beam qualified by meeting the standard requirements. The microstructure analysis for the Al sample was to be done as well.
Thoughts at the end of my internshipHamsini appreciates the discipline and work ethics the employees have. The
atmosphere is conducive for free exchange of ideas and thoughts. Communication is free and easy. The people are very nice and supportive. Safety is always a top concern in the labs. Some of the suggestions she has arei) The company can join hands with a local/international university for research
in to better, more efficient futuristic materials and other aspects like cutting down on environmental impacts. The venture can be like a think tank for both research and production.
ii) The team can look into alternative methods, processes and materials to enhance efficiency and cut costs.
iii) Implement methods to reduce the company’s carbon footprint on the environment.
iv) A lot of good suggestions come from the work floor. A small reward can be
Page 27 of 95

Hamsini Gopalakrishna Atlas Copco, Nanjing, China Summer Internship – 2012
given to anyone who suggests a positive change in work methods or in any process involved in production. This was implemented in a factory she visited earlier and they had spectacular results.
v) Make the team building sessions in to an activity oriented event. Employees can be divided into groups. They will be given some tasks that they have to finish as a group.
vi) A prominent personality or an inspirational icon can be invited to give a short talk regularly.
vii) A creativity corner – room can be set where the employees can go de-stress and fuel thoughts on for improvements. It will also help employees think better. Sitting in a chair all day long is not good for one’s health. Rules can be made about how often and how long an employee can be in the creativity corner. Games like chess, Chinese checkers, etc. can be placed there.
viii)A white board can be placed near the doors. A new English word everyday can be written on it with its Chinese word and the English word’s usage in a sentence and its meaning in Chinese
ix) A technical term with its definition and Chinese term can also be written on the same board. Including the pronunciation will help a lot in the long run.
x) The company management can consider diversifying into aerospace, hydraulic systems, transportation and locomotive industries where the current knowledge of Atlas Copco is partly used.
Future workI would like to continue adding to my industrial experience by working on
failure analysis and usage of modern materials to replace existing materials. I would like to work on modern materials that involve composites. The hands on experience obtained while analyzing various samples has helped me understand the theory learnt at Purdue University. It has enhanced my knowledge.Acknowledgement
I am grateful to the management of Atlas Copco and in particular, Mr.
David Lou, the CEO of Atlas Copco, Nanjing for considering my application
for the internship and for providing me with this opportunity and financial
support.
I am thankful to Dr. Johnny Huang, PhD and head of the Metallurgical
lab for the support and guidance during the internship. I was allowed full
access to sophisticated instruments like the SEM, Hardness testers, etc which
made the learning a great experience. I would also like to thank Mr. Charles Fu,
the Materials Engineer, and Mr. Allen Zhang, the Welding and NDT Engineer,
Page 28 of 95

Hamsini Gopalakrishna Atlas Copco, Nanjing, China Summer Internship – 2012
who supported me in the learning. I was able to work as if I was a regular staff
of Atlas Copco due to their support and words of encouragement. I would like
to thank all my colleagues who helped me.
I am thankful to Mr. Suresh Shyamsundar, the head of R&D center
(Rocktec) at Nanjing, for his assistance during the internship.
I wish to thank the heads of the production facilities at Nanjing and
Wuxi for permitting a detailed tour of the facility and interaction with the
production engineers. The staff of HR, administrative and support departments
were of great help and I acknowledge their assistance. The visit to Atlas Copco
has been a truly rich working experience in a professional organization that will
be cherished for a long time. I will be delighted at the prospect of a second
internship next summer at Atlas Copco if there is an opportunity.
Last but not least, I would like to thank the Office of Professional
Practice and in particular Dr. Yating Haller. The Office of Professional Practice,
Purdue University provided me with a travel grant to cover travel expenses for
the trip to China. It supported me in obtaining professional experience which
will go a long way in understanding the theory leaning at Purdue University.
Travel Report – Xu Zhou BUT Company visit
On June 21st, we visited BUT to perform the UT inspection on two URE ST2D frames of, as shown in Figure 1.The inspectors from BUT and SGS detected the frames separately, and they will submit an inspection report.Result:Inspectors from SGS tested 2 products and measured the length and location of the defects.We also invited the inspectors of BUT to perform the site operation of UT inspection. We also took photographs of the products.Conclusion: Basically after comparing the test reports of SGS and BUT, we found that the
Page 29 of 95
Hamsini Gopalakrishna Atlas Copco, Nanjing, China Summer Internship – 2012
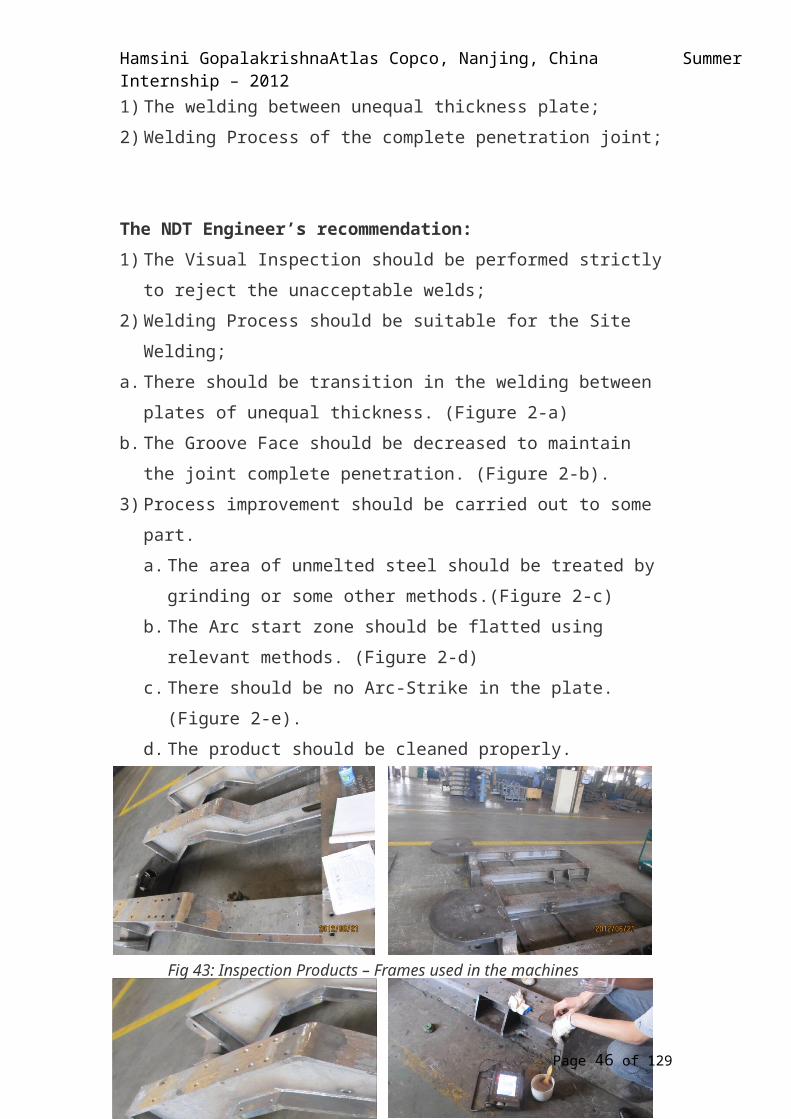
test results were similar.The inspectors’ operation skills and their attitude of responsibility were acceptable.But there are several problems affecting the welding quality and the inspection results, (Figure 2). Some improvements in the following areas should be made:1) The welding between unequal thickness plate;2) Welding Process of the complete penetration joint;
The NDT Engineer’s recommendation:1) The Visual Inspection should be performed strictly to reject the
unacceptable welds;2) Welding Process should be suitable for the Site Welding;a. There should be transition in the welding between plates of unequal
thickness. (Figure 2-a)b. The Groove Face should be decreased to maintain the joint complete
penetration. (Figure 2-b).3) Process improvement should be carried out to some part.
a. The area of unmelted steel should be treated by grinding or some other methods.(Figure 2-c)
b. The Arc start zone should be flatted using relevant methods. (Figure 2-d)c. There should be no Arc-Strike in the plate. (Figure 2-e).d. The product should be cleaned properly.
Fig 43: Inspection Products – Frames used in the machines
Page 30 of 95

Hamsini Gopalakrishna Atlas Copco, Nanjing, China Summer Internship – 2012
Fig 44. Transition in the welding Fig 45.The groove face
Fig 46. Unmelted steel Fig 47. Arc Start Zone
Fig 48. Arc Strike
Appendix I – ManualsBelow are the manuals Hamsini drafted out for Atlas Copco after using the equipment in the lab thoroughly. The manuals are in the following order:
a. Microscopes
i. Optical Microscope
ii. Optical Stereoscope
iii. Scanning Electron Microscope (SEM)
iv. EDX. This is a program which allows for qualitative analysis of
materials in conjunction with the SEM.
b. Sample making equipment
Page 31 of 95
Hamsini Gopalakrishna Atlas Copco, Nanjing, China Summer Internship – 2012
i. Cutting machine
ii. Mounting machine
iii. Grinding and polishing machine
iv. Precision weighing scale
c. Hardness testers
i. Vickers microhardness tester
ii. Universal tester
iii. Brinell tester
d. Non Destructive Testing Equipment (NDT)
i. Ultrasonic tester
ii. Magnetic particle tester.
MANUAL: OPTICAL MICROSCOPEThis manual illustrates how to use the optical microscope. There are two
parts – Part A and Part B. This is based on the frequency of use of the particular
tool and its operational complexity. Functions in Part A are more commonly
used.
Part A contains instructions using the microscope, adding a scale bar,
measuring lengths, areas, and angles and using the Extended Focus Integration
and merging functions.
Part B contains information on finer analysis of the specimen. This
includes grain size classification, inclusion classification, spheroidal graphite
classification (only in cast irons) and phase percentage calculation. To use
functions from part B, help from the Materials and Metallurgical group must
Page 32 of 95
Hamsini Gopalakrishna Atlas Copco, Nanjing, China Summer Internship – 2012
be sought.
Index
Using the microscope
. . . . . . . . . . . . . . . . . . . . . . . . . . . .
. . . . 30
Adding a scale bar
. . . . . . . . . . . . . . . . . . . . . . . . . . . .
. . . . . . 31
Measuring lengths, areas and angles . . . . . . . . . . . . . . . . . . . . . . .32
Extended Focus Integration (EFI) . . . . . . . . . . . . . . . . . . . . . . . . .33
Merging . . . . . . . . . . . . . . . . . . . . . . . . . . . . . . . . . . . . . . . . . . . . .34
Percentage phase fraction calculation . . . . . . . . . . . . . . . . . . . . . .35
Inclusion, grain size and spheroidal graphite classification . . . . . 36
Using the microscope – General instructions1) Take off cover and ensure the light intensity is at the lowest setting.
2) Ensure the stage is lowered and place the sample. Choose lens with the
desired magnification.
3) Raise the stage until the sample almost touches the lens. Doing this ensures
that the stage always moves away from the lens while focusing. The sample
should never come in contact with the lens. This minimizes damage to the
lens.
Page 33 of 95Focus
Stage control

Hamsini Gopalakrishna Atlas Copco, Nanjing, China Summer Internship – 2012
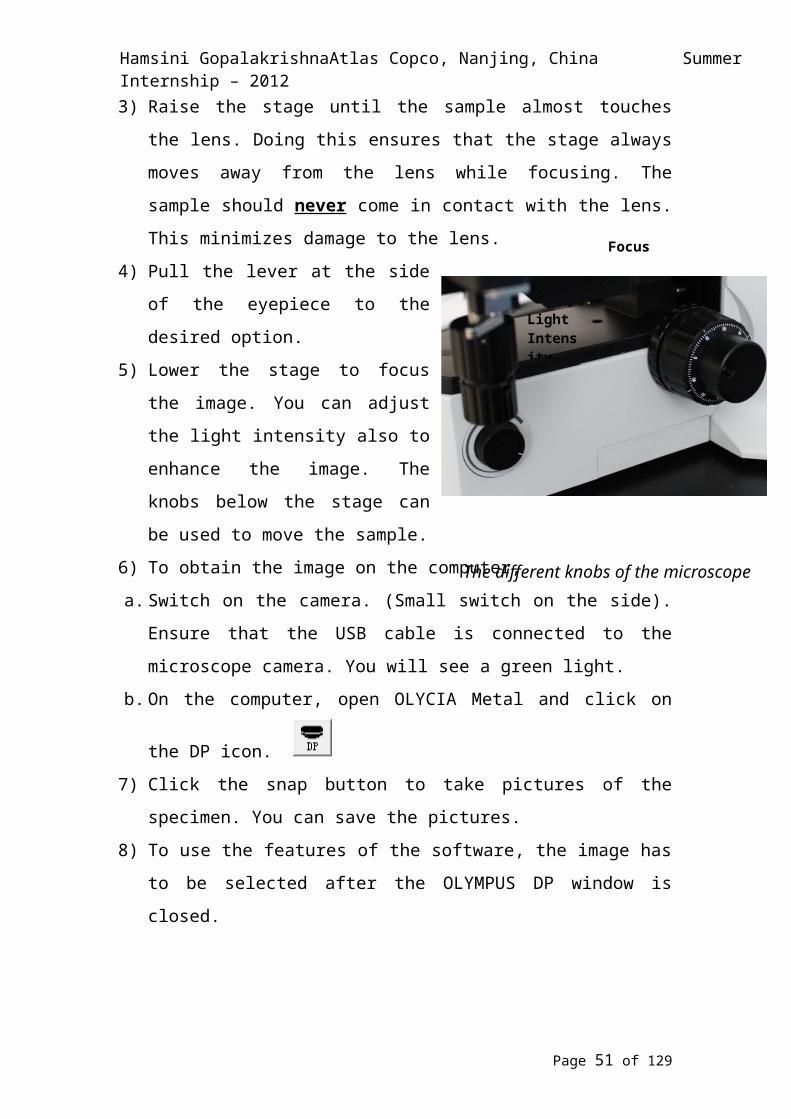
4) Pull the lever at the side of the eyepiece to the desired option.
5) Lower the stage to focus the image. You can adjust the light intensity also
to enhance the image. The knobs below the stage can be used to move the
sample.
6) To obtain the image on the computer,
a. Switch on the camera. (Small switch on the side). Ensure that the USB
cable is connected to the microscope camera. You will see a green light.
b. On the computer, open OLYCIA Metal and click on the DP icon.
7) Click the snap button to take pictures of the specimen. You can save the
pictures.
8) To use the features of the software, the image has to be selected after the
OLYMPUS DP window is closed.
9) Turn down the light to the lowest intensity and switch off the camera and
the microscope. Lower the stage.
10) When closing the software, it will first ask you if you are sure you want to
quit. When you say yes (left button), it asks if you want to save any of the
images. Say yes (Y) or no (N). Turn off the computer.
11) Cover the microscope after the light box in the back has been cooled to
room temperature.
PART AIt is important that the magnification of the lens matches the
magnification selected in the program for all the below functions.
1) Add a scale bar
i. Open the desired picture.
Page 34 of 95
Light Intensity
The different knobs of the microscope

Hamsini Gopalakrishna Atlas Copco, Nanjing, China Summer Internship – 2012
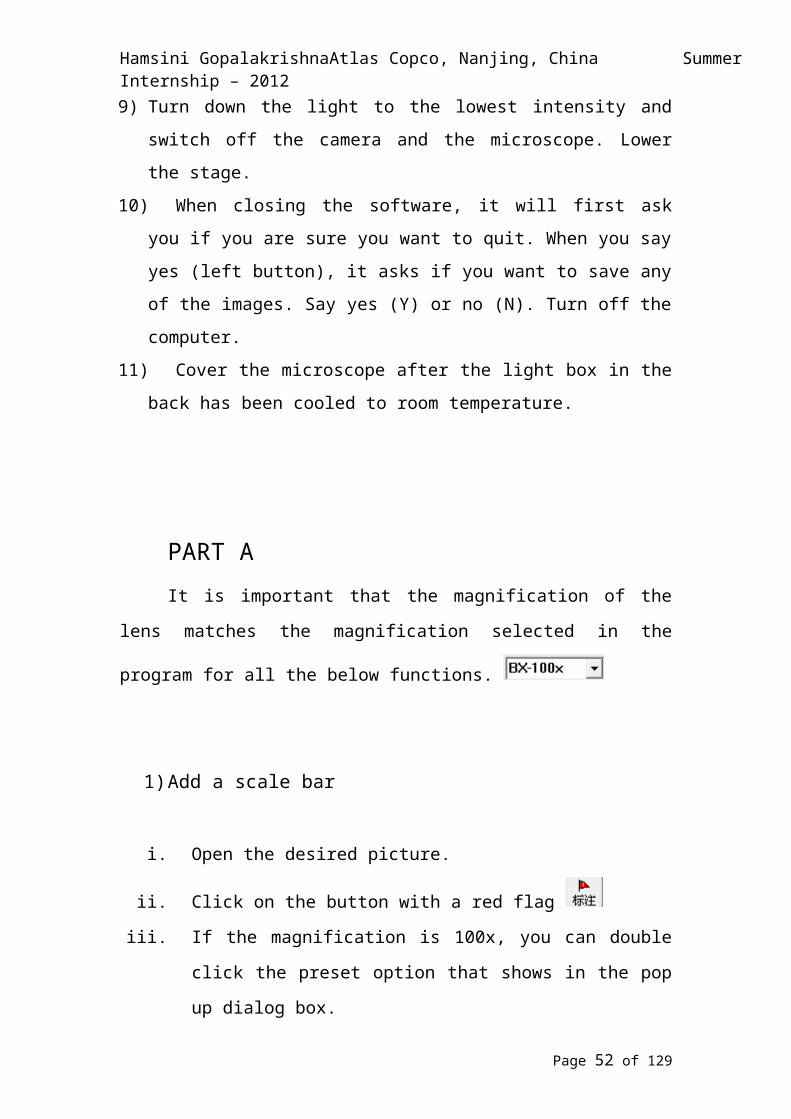
ii. Click on the button with a red flag
iii. If the magnification is 100x, you can double click the preset option
that shows in the pop up dialog box.
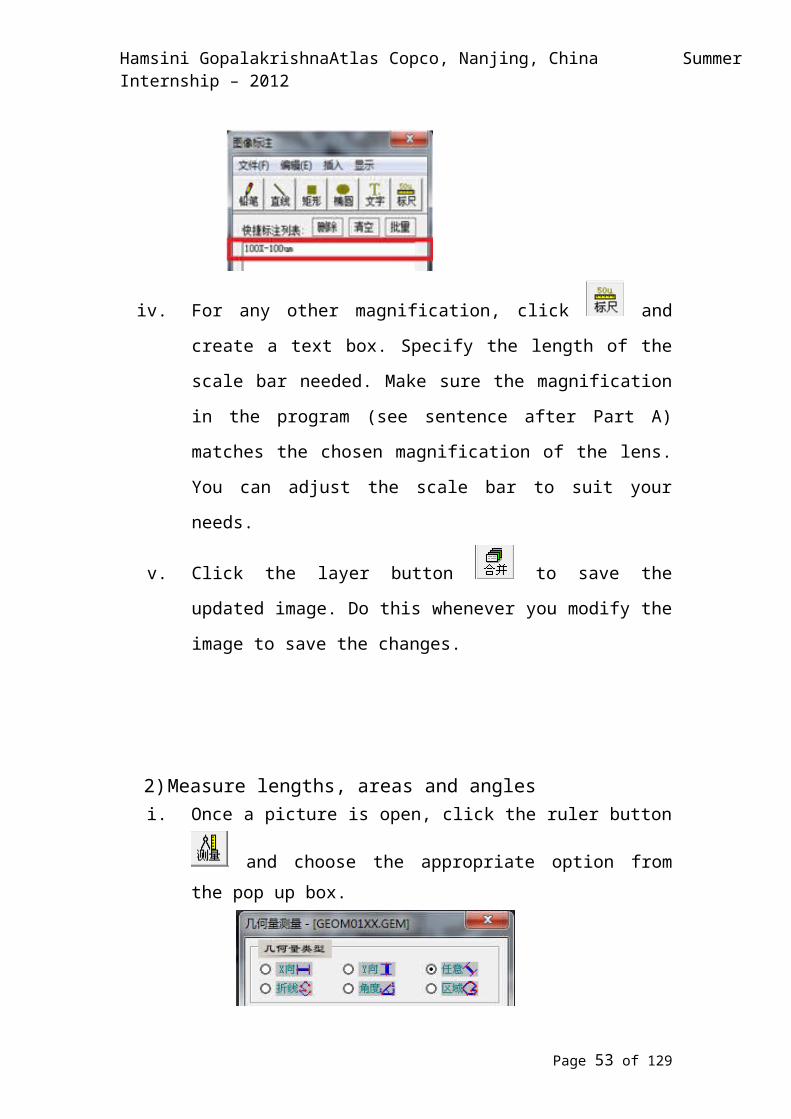
iv. For any other magnification, click and create a text box.
Specify the length of the scale bar needed. Make sure the
magnification in the program (see sentence after Part A) matches the
chosen magnification of the lens. You can adjust the scale bar to suit
your needs.
v. Click the layer button to save the updated image. Do this
whenever you modify the image to save the changes.
2) Measure lengths, areas and angles
i. Once a picture is open, click the ruler button and choose the appropriate option from the pop up box.
From left to right,TOP: Horizontal, Vertical, Oblique. These are all linear lengths.BOTTOM: Nonlinear length, Angle between two lines, Area of
selected polygon
Page 35 of 95

Hamsini Gopalakrishna Atlas Copco, Nanjing, China Summer Internship – 2012
ii. For lengths, select the length by clicking and dragging across the picture. Right click outside the selected area. The length will be displayed. It can also be seen on the table in the dialog box.
and , andiii. For calculating angles between two features on the picture, select the
angle option. Click and drag a line. Draw a second line from the end of the first line. Once done, right click. The angle will be displayed both on the picture and in the table.
iv. For calculating an area, click and draw around the desired area. Once
the polygon is complete, right clicking will show the area covered by the selected part. When the start point and the end point are not closed, right clicking will result in them joining. Right clicking again shows the area both on the picture and in the table
v. Click the layer button to save the updated image. Do this whenever you modify the image to save the changes.
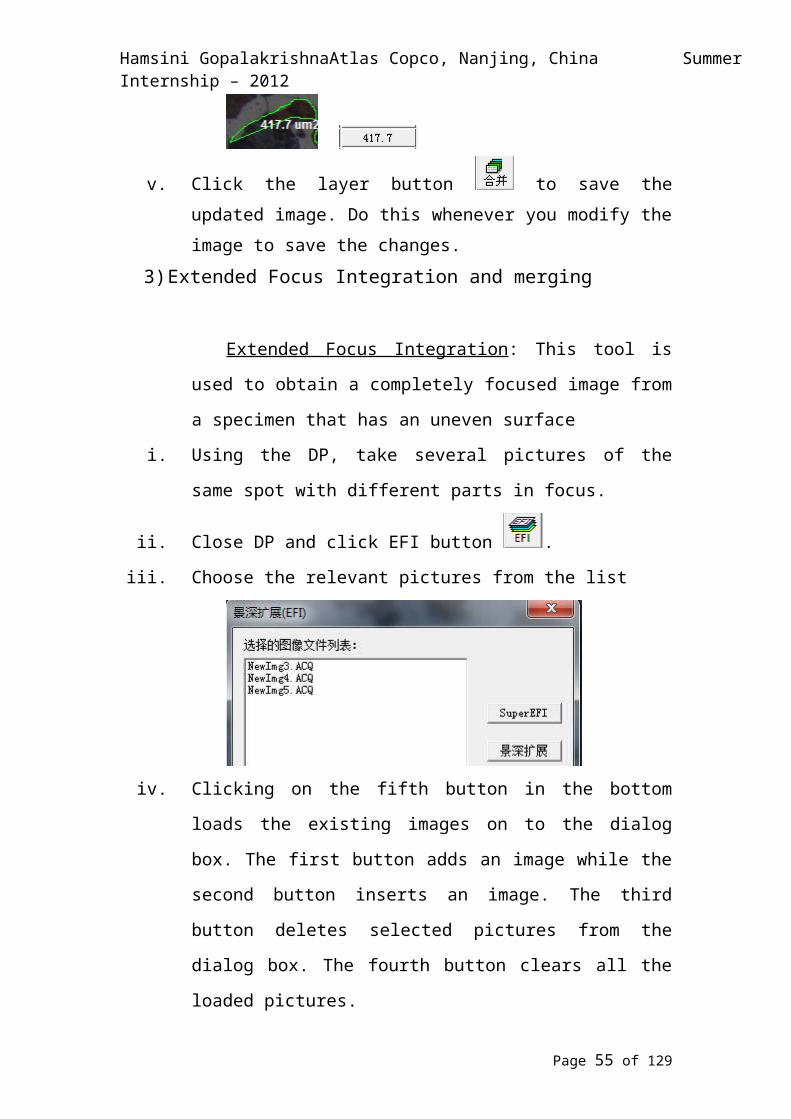
3) Extended Focus Integration and merging
Extended Focus Integration: This tool is used to obtain a
completely focused image from a specimen that has an uneven
surface
i. Using the DP, take several pictures of the same spot with different
parts in focus.
ii. Close DP and click EFI button .
iii. Choose the relevant pictures from the list
Page 36 of 95

Hamsini Gopalakrishna Atlas Copco, Nanjing, China Summer Internship – 2012
iv. Clicking on the fifth button in the bottom loads the existing images
on to the dialog box. The first button adds an image while the second
button inserts an image. The third button deletes selected pictures
from the dialog box. The fourth button clears all the loaded pictures.
v. Click the EFI button (One below SuperEFI). The SuperEFI button is
more precise and takes longer. For a small number of pictures, using
the EFI or the SuperEFI gives the same image.
vi. Once the images are collated, the new fully focused image will pop
up. Save the image.
vii. All parts of the image should be focused in at least one picture.
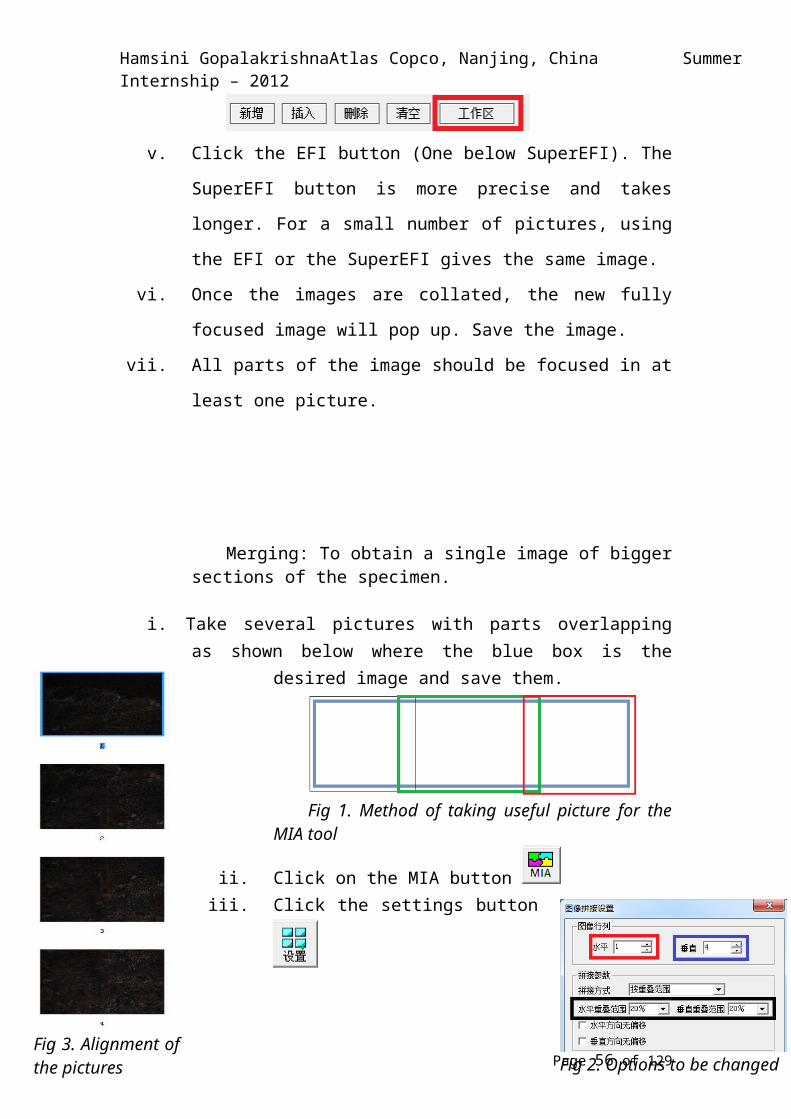
Merging: To obtain a single image of bigger sections of the specimen.
i. Take several pictures with parts overlapping as shown below where the blue box is the desired image and save them.
Fig 1. Method of taking useful picture for the MIA tool
ii. Click on the MIA button
Page 37 of 95

Fig 2. Options to be changed
Fig 3. Alignment of the pictures
Hamsini Gopalakrishna Atlas Copco, Nanjing, China Summer Internship – 2012
iii. Click the settings button
iv. A window will pop up. Change the number of columns (red) and rows (blue). You can select the horizontal and vertical overlap respectively (black)
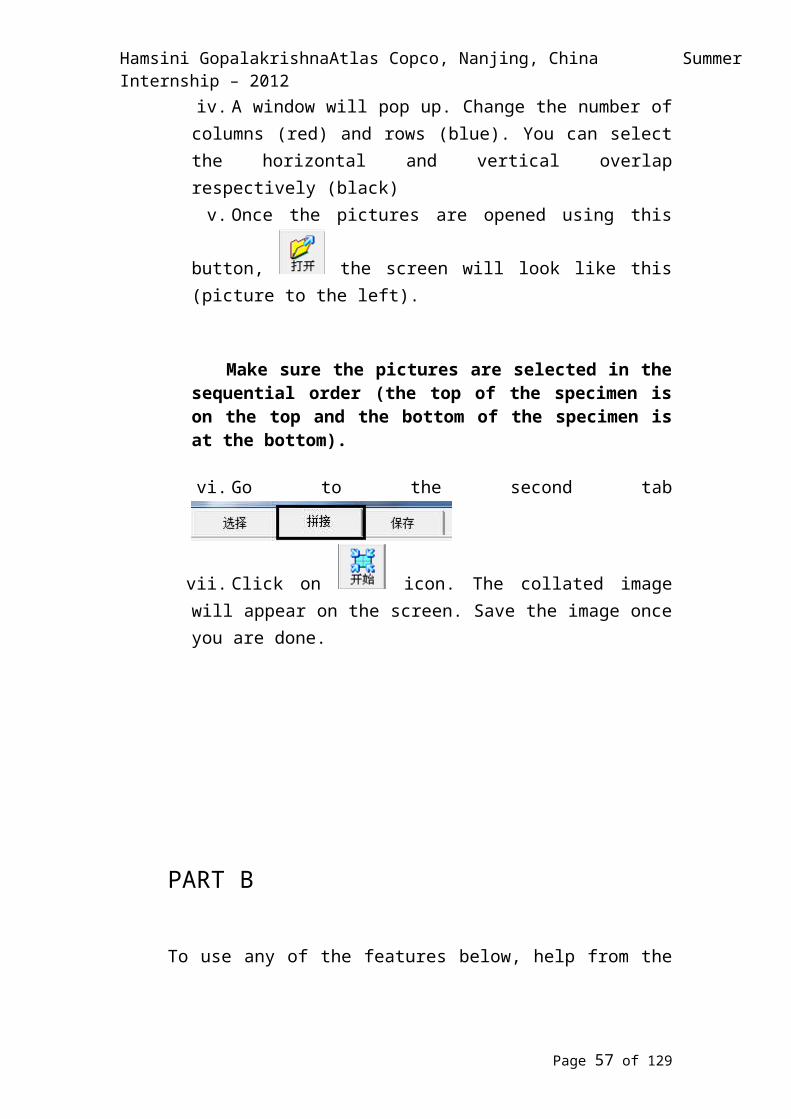
v. Once the pictures are opened
using this button, the screen will look like this (picture to the left).
Make sure the pictures are selected in the sequential order (the top of the specimen is on the top and the bottom of the specimen is at the bottom).
vi. Go to the second tab
vii. Click on icon. The collated image will appear on the screen. Save the image once you are done.
PART B
To use any of the features below, help from the Materials and
Metallurgical group MUST be sought.
Page 38 of 95
Hamsini Gopalakrishna Atlas Copco, Nanjing, China Summer Internship – 2012
1) Percentage phase fraction
a. Click the Phase percentage button . There will be three options
that pop up.
b. The options are automatic and manual. The third option is irrelevant.
c. A dialog box pops up once the automatic mode is selected.
d. This box is preset. There is an unchecked box in the top right part of
the dialog box. Check it and click OK.
e. Make sure all the light coloured spaces turn green once you click OK.
f. You can manually fill the unchanged parts using the paint pop up.
Once this is done, click the OK button.
g. The percentage phase fraction will show up on a report. You can use
this number.
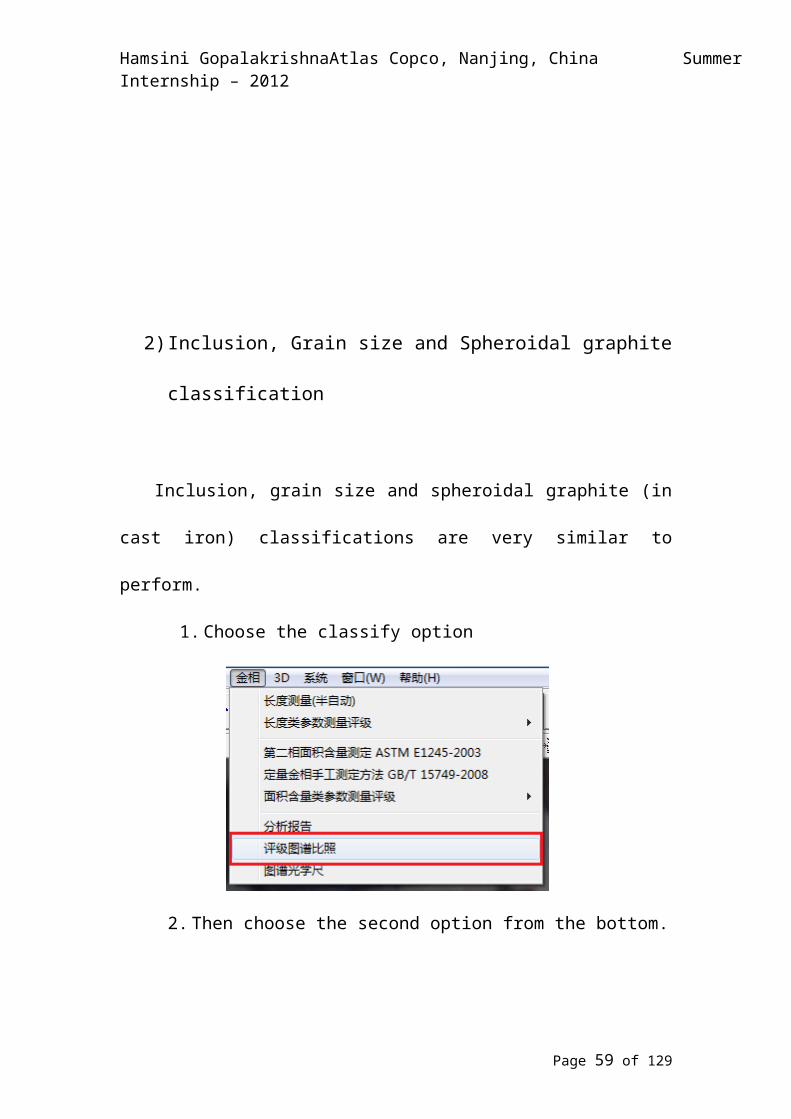
2) Inclusion, Grain size and Spheroidal graphite
classification
Inclusion, grain size and spheroidal graphite (in cast iron) classifications
are very similar to perform.
Page 39 of 95

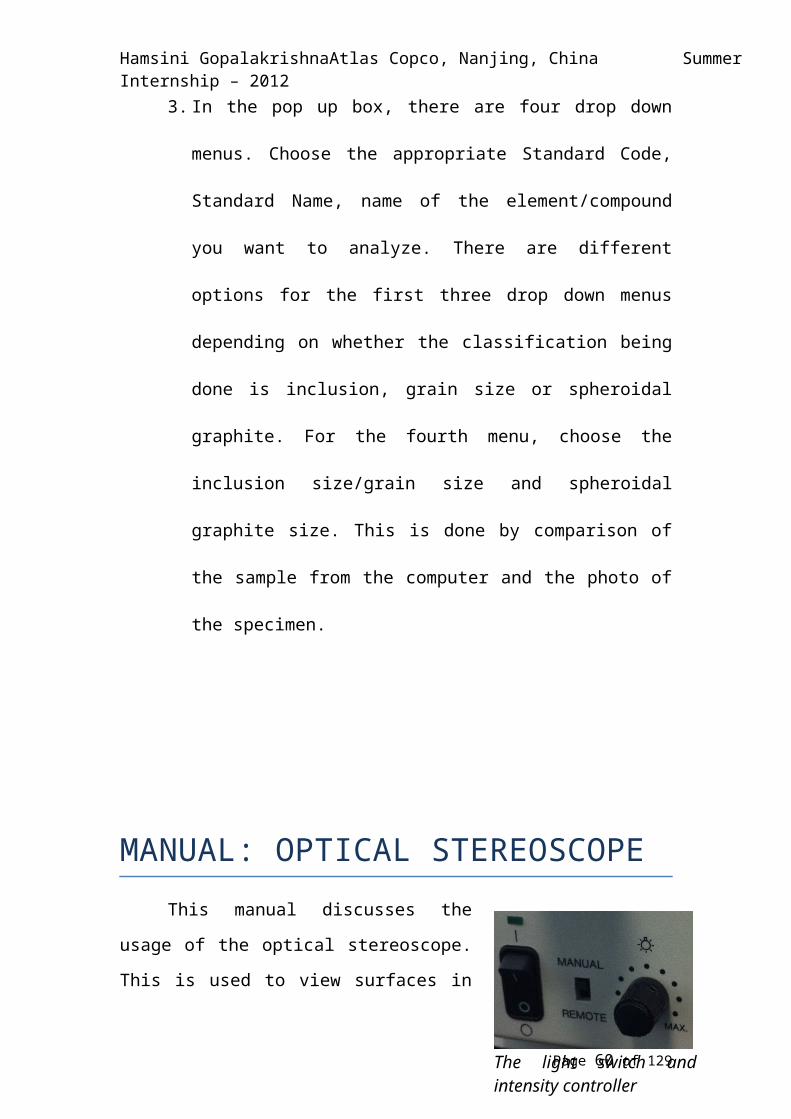
The light switch and intensity controller
Hamsini Gopalakrishna Atlas Copco, Nanjing, China Summer Internship – 2012
1. Choose the classify option
2. Then choose the second option from the bottom.
3. In the pop up box, there are four drop down menus. Choose the
appropriate Standard Code, Standard Name, name of the
element/compound you want to analyze. There are different options
for the first three drop down menus depending on whether the
classification being done is inclusion, grain size or spheroidal
graphite. For the fourth menu, choose the inclusion size/grain size
and spheroidal graphite size. This is done by comparison of the
sample from the computer and the photo of the specimen.
MANUAL: OPTICAL STEREOSCOPE
This manual discusses the usage of the
Page 40 of 95
Hamsini Gopalakrishna Atlas Copco, Nanjing, China Summer Internship – 2012
optical stereoscope. This is used to view surfaces in detail. This also helps in
determining the source and direction of propagation of fracture. More
information on its working principle and sample measurements can be found in
the library.
Using the stereoscope1) Take off the cover and lens covering.
2) Switch on the stereoscope.
3) Set the light to the lowest intensity
and switch on the light source.
4) Place the sample on the stage and focus the lights on the sample
5) There are two viewing modes that can be used: eyepiece only and eyepiece
with camera. Choose the appropriate one.
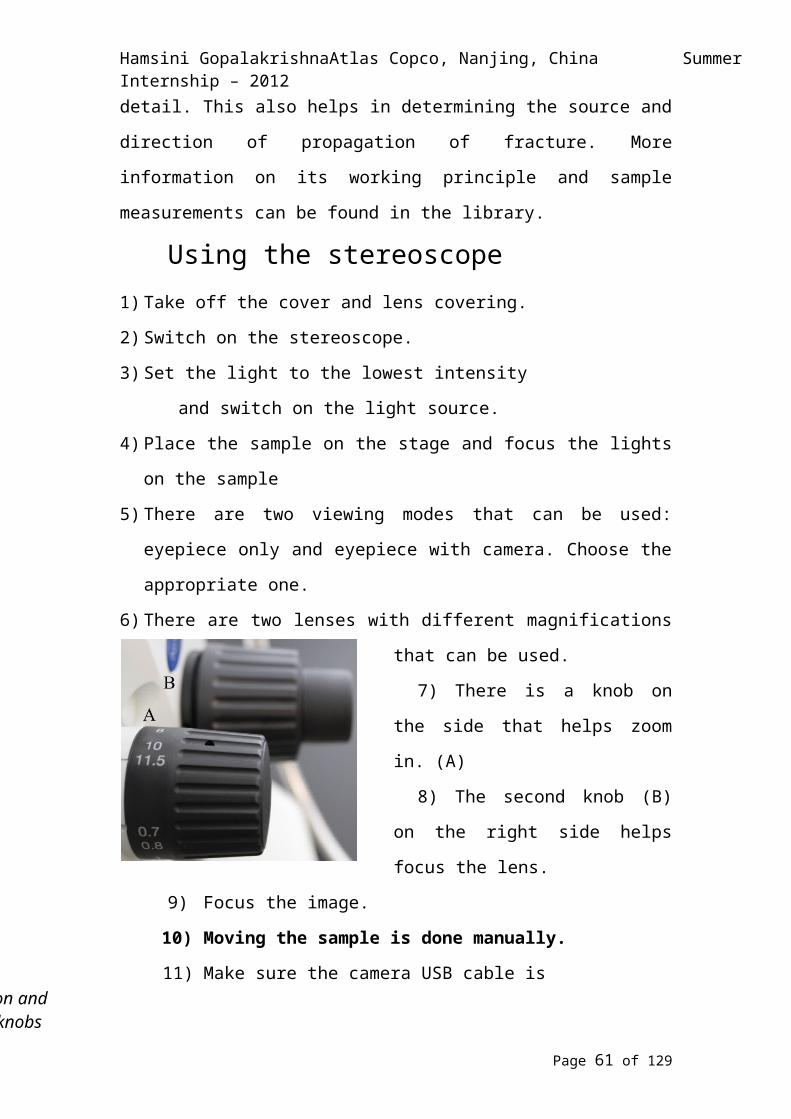
6) There are two lenses with different magnifications that can be used.
7) There is a knob on the side that
helps zoom in. (A) 8) The second knob (B) on the
right side helps focus the lens.
9) Focus the image.
10) Moving the sample is done
manually.
11) Make sure the camera USB
cable is
plugged in. The microscope and the
stereoscope share the same cable. Switch on
the camera.
The camera switch
12) To take pictures,
Page 41 of 95
The magnification and focus adjusting knobs
Hamsini Gopalakrishna Atlas Copco, Nanjing, China Summer Internship – 2012
a. Switch on the computer and open the OLYCIA Metal software
b. Click the DP icon
c. Click the snap button once the image has been focused.
13) You can add a scale bar, measure lengths, areas and angles, use the
Extended Focus Integration and merging tools.
14) To do this, please refer to Part A of the user manual of the
microscope.
15) Once you are done examining the sample, turn off the lights and
remove the sample.
16) Cover the lens and the eyepieces.
17) Turn the stereoscope and the camera off. Switch off the computer.
MANUAL: Scanning Electron Microscope
When an optical microscope fails to show finer details, a scanning
electron microscope (SEM) is used. A scanning electron microscope (SEM)
uses back scattered electrons to provide a very precise and highly magnified
picture of the samples. The surface need not be polished or etched but it must
Page 42 of 95

Hamsini Gopalakrishna Atlas Copco, Nanjing, China Summer Internship – 2012
be conductive. A thin metallic surface coating must be present while viewing
nonconductive materials. SEM’s are useful in the range of 10-7m and 10-3m.
The minimum magnification with this SEM is 65x and the maximum is
300,000x.
Using the SEM
1) Turn on the power switch at the back.
2) Turn the key in the front to START and then back to ON. The computer
switches on automatically.
3) Neither the computer nor the software has a password. The software
starts automatically. Wait till the system initializes.
4) Click AIR on the screen to introduce air into the chamber. You can press
the button in control panel too. Wait until the * asterisks in the message
‘The chamber is processing AIR ****** have disappeared.
5) Place sample to be viewed on the stand and measure the height of the
sample with the help of the Height gauge. Note the diameter of the
stand.
6) Slide the compartment open slowly. Place the stand with the sample on
the stage.
7) Click Specimen setting and then click OK. Input the sample height and
the stand diameter. Click the Stage Move button. This lifts the stage into
position. (picture on the next page)
The sample height and stage size input box.
Page 43 of 95
Power Switch
Hamsini Gopalakrishna Atlas Copco, Nanjing, China Summer Internship – 2012
8) Slide the compartment in until the sample is just below the roof guard.
The ideal position of the sample on the stage9) Ensure that the sample is lower than the roof guard. Click OK.10)Slowly close and hold the compartment, press the EVAC button and
release the compartment after 10 seconds.
The control panel in the front11)Ensure the lowest magnification is chosen.
12)Wait until you see the message ‘HV is ready’ (at the bottom left corner),
click the ON button in the top left corner.
13)An image of the sample will appear. Once you select the area of interest,
you can focus and auto-adjust the brightness and contrast. To take a
picture, click Capture and save it.
14)The Save button works like a screen shot of the image panel. This can be
used for sensitive samples.
Page 44 of 95
Stage
Roof GuardSample

Hamsini Gopalakrishna Atlas Copco, Nanjing, China Summer Internship – 2012
15)You can choose the type of scan (F, S1, S3 or S5) depending on the
detail you want in the picture. Click Run to go to the viewing mode.
16)The High voltage (HV) needs to be switched off when switching
between VP – SEM and SEM
17)Once you’re done with taking pictures, turn off the HV and click on
HOMEZ65 in the top right corner. This brings the stage to its original
position. This may take a while.
The HV ON button. The HOME Z65 button.
18)Click AIR and wait for air to be introduced into the chamber. As before,
wait for the asterisks to disappear
19)Take out the sample if you are done or change it.
20)Slowly push the compartment back in and press the EVAC button. Press
and hold the compartment before pressing the EVAC button for 10
seconds.
21)Wait till the button glows a steady green, close the program. Shut down
the computer.
22)Turn the key in the front to OFF.
23)Wait for 5 minutes and switch off the power button at the back
MANUAL: Energy Dispersive X-ray Spectrum – EDX
The EDX software uses backscatter to qualitatively and quantitatively
analyze samples seen in the SEM. It is most often used to analyze qualitatively.
Page 45 of 95
Hamsini Gopalakrishna Atlas Copco, Nanjing, China Summer Internship – 2012
Using the EDX1) Follow steps 1-13 from MANUAL: SEM.
2) The SEM can be in the viewing mode.
3) Power on the extension board.
4) Switch on the computer
5) Open the EMAX software
6) A screen with a flow chart will appear in Chinese. The English
translations are provided
7) You can skip steps 1 and 2. In step 3: SEM Settings, higher accuracy is
obtained if the collection rate is between 1-3 kcps. This is the ideal
collection rate. The ideal working distance (SEM Program) is 10mm.
Click on Step 4
8) Step 4: Area of interest. You can choose the specific area of interest you
want to analyze by clicking the button. Click on Step 5
9) Step 5: X ray electron collection. Choose a more specific part of the
picture. It can be an area, a point, a random shape or all parts with the
same colour in the picture. The analysis will run immediately after you
choose the area. Click on Step 6
10)Step 6: Element confirmation. Once the elements have been identified,
the noise peak has to be deleted. This is usually a peak without any label
on it.
Page 46 of 95

Hamsini Gopalakrishna Atlas Copco, Nanjing, China Summer Internship – 2012
11)Once this is done, delete all the elements you know for sure don’t exist
in the sample being analyzed using this button. . Select the
element and click the button. Click on Step 7
12)Step 7: Quantitative Analysis. A screen will appear showing the w% and
the a% of the various components. Click on Step 8.
w% a%
13)Step 8: Report. This is an optional step. This produces a report that can
be printed out or saved.
Page 47 of 95
Project name1
23 1

Hamsini Gopalakrishna Atlas Copco, Nanjing, China Summer Internship – 2012
The boxes in blue can be skipped. The boxes in green are very important steps and have to be followed in order.
MANUAL: CUTTING MACHINEThe rotating abrasive disk can cut through hard and soft steels and a
variety of other metals and alloys. More information on its working principle can be found in the library.
Page 48 of 95
Sample nameSEM Settings
Area of Interest
X-ray electron collection
Element Confirmation
Quantitative Analysis
Image settings
Comparison
Optimization of quantitative analysis
Quantitative Analysis settings
Power Switch
The mounts
Hamsini Gopalakrishna Atlas Copco, Nanjing, China Summer Internship – 2012
Using the cutting machine14)Choose the right cutting disk based on the material to be
cut.15)A light will turn on when the machine has been switched
on.(power switch on the side)
16)Set the coolant outlet to Blade. Carefully fix the piece in place using the levers on the mounts so that it doesn’t move.
17)Tighten the mounts using two levers, close the cover and press the start button. The disk won’t start rotating if the cover is open.
18)Wait until the coolant (white-ish fluid) starts running. Now push down the lever on the side gently. Make sure you blade touches the material very slowly. If the blade comes in contact with the material too fast, it will result in deep scratches.
19)Maintain a small consistent pressure on the lever. The blade moves with the lever. The rate of cutting must be slow so as to keep the sample from
getting too hot.20)When you will feel a lack of resistance, it means the blade has gone
through all the material. Press the stop button. Raise the blade (lever) up and open the covering lid of the cutter.
21)Take out the cut piece carefully after loosening the mounts. 22)Rarely, material towards the rear of the machine may not get cut. This is
usually a very small part of the material. In this case, you can the clamp and a hacksaw blade to separate the pieces.
23)You can clean up the machine by setting the water outlet as Nozzle.24) Leave the lid open. Turn the power switch off.
MANUAL: MOUNTING MACHINEThe mounting machine sets the sample to be analyzed in a polymer resin
Page 49 of 95

Hamsini Gopalakrishna Atlas Copco, Nanjing, China Summer Internship – 2012
base. This makes it easier to polish, etch and study. More information on its working principle can be found in the library.
Using the mounting machine1) Switch on the machine2) Make sure the water tap is on. (Tap near the wall)3) Turn the handle on the top and twist the top away from the machine.
The handle. The lift and lower buttons. The stage.
4) Press and hold the ^ button to lift the stage.5) Dust the stage and surrounding areas to get rid of any dirt.6) Place the sample on the stage with the side of interest facing down.7) Lower the stage and add an appropriate amount of the mounting resin.
Make sure to cover your sample with the resin.8) Press and hold the lower button to ensure that the stage is lowered all the
way. You will hear a different sound when the stage is totally lowered.9) Place the top over the stage. Secure it by pressing it down and turning it
clockwise until the machine locks it. Then turn it a little in the anti-clockwise direction.
10)Press the start cycle button11)The parameters are preset.12)The entire cycle takes about 7 minutes.13)Once done, open the top handle. Press the ^ button. The mounted sample
will rise. It will be hot.14)Use the brush and the scraper to clean any unused powder or resin
pieces on the stage and the surrounding areas.15)Switch off the machine and the water tap.
MANUAL: GRINDER AND POLISHER
Page 50 of 95
The green button on the side of the rotating arm
The settings
Hamsini Gopalakrishna Atlas Copco, Nanjing, China Summer Internship – 2012
The grinding and polishing machine is used to smoothen the surface of a
mounted sample. This helps study the microstructure of the sample better. More
information on its working principle can be found in the library.
General instructions 1) Make sure both the air compressor and the water tap are on. Pull the
red button on the air compressor (below the bench) up to start it. Take
off the top of the grinder.
2) Switch on the machine. (switch at the back)
3) Press the On button near the settings panel.
4) Adjust the settings as needed. Move arm and place the appropriate
grinding/polishing disk on the plate.
5) To stop the grinding process midway, press the button
6) Fix the rotating arm on the disk area with the lever on the left.
7) Press and hold both the green buttons on the side of the arm to lower it.
8) Once it touches the plate, release the buttons. The arm will
come up slightly.
9) Place the sample face down in the slots on the rotating arm.
10)Press and release both the green buttons to start the grinding
process.
11) To change the disk, the arm needs to be moved away from the
grinding disk. Do this with the help of the lever.
12) Lift the existing disk off the plate and place the next
grinding/polishing disk on the plate.
GrindingIn grinding, you start off with the disk with the lowest number. As you
Page 51 of 95
Hamsini Gopalakrishna Atlas Copco, Nanjing, China Summer Internship – 2012
go along, disks with higher numbers will be used. Same goes for polishing. Use
the disks in the proper sequence. Once grinding is done, polishing can be
started.
Polishing1) Place the polishing disk on the plate and lubricate it.2) Make sure the water is turned off.3) Repeat steps 4 to 10 from the general instructions.4) Spray the abrasive suspension once the disk starts rotating. Use enough
abrasive suspension to have foam near the sample.
4) When done, place the polishing disk back. Turn off the power button (near the settings panel) and the switch at the back.
5) Close the lid of the grinder. Turn off the water supply and the air compressor.
MANUAL: WEIGHING SCALE
Page 52 of 95
The lubricant used to polish
The 3µm diamond abrasive used to polish.
Hamsini Gopalakrishna Atlas Copco, Nanjing, China Summer Internship – 2012
The weighing scale is an important tool while measuring out chemicals.
This precision weighing scale can measure solids accurately up to four decimal
places. There are two parts to this manual. Part A contains the easy to use
functions like weighing, formulation, piece counting, percentage weighing and
differential weighing. Part B contains more complicated functions like
Statistics and Density calculation. More information on its working principle
and sample measurements can be found in the library.
These are the functions of the weighing scale.
a. Weighing: Weighs up to four decimal places.
b. Formulation: Stores formulae and weights of individual
components.
c. Piece Counting: Counts the number of pieces by using the current
weight and the weight of each unit.
d. Percentage weighing: Tells the percentage of a set weight the
object being weighed is.
e. Differential Weighing: The Differential Weighing application is
used to analyze changes in the weight of one or more samples.
The first step is to determine the initial weight of the sample
(weighing in). After the sample has been processed, it is re-
weighed (residual weight). The balance then determines the
difference between the two weighed values. Procedures can be
drying, centrifugation, filtering, incineration, vaporization,
coating, etc.
f. Statistics: Shows statistics for up to 1000 samples.
g. Density: Enables you to determine the density of solid bodies,
liquids, and pasty substances.
Using the weighing scale – General Instructions
Page 53 of 95

Hamsini Gopalakrishna Atlas Copco, Nanjing, China Summer Internship – 2012
1) Plug in the weighing scale
2) Wait till it shows 0.0000g (initializes). If a weight is displayed, press the
0 button.
3) Use the button or wave your hand over the sensor to open or close
the door
4) Open the door, place material on the scale and close the door.
5) If using a container,
a. Place the container on the pan and wait for the weight to show in black.
b. Press the tare (T) button. This means that the weight of the container
will be ignored. Only the weight of the chemicals added will be shown.
Close the door.
6) Add the chemical and wait till the weight shows in black. When the
weight is shown in blue, the scale is still weighing
7) Note down the weight of the material.
8) When done, press and hold the OFF button to switch off.
9) Clean up any chemicals that may have been spilt on the pan.
IMPORTANT: Ensure there are no chemicals on the pan while
measuring. This can affect the weights recorded.
FormulationThis is used for weighing in components that are to be combined in a
Page 54 of 95
Hamsini Gopalakrishna Atlas Copco, Nanjing, China Summer Internship – 2012
specific ratio1) Switch on the weighing scale
2) Press this button (Options button) to choose the Formulation option.
3) Press this button (Application settings button) to define a formula.
4) There are two types of formulas you can define: Fix Component and % Component. Define the formula.
Fix Component: Absolute nominal weights are defined for the individual components.
% Component: Relative (percentage) nominal values are defined for the individual components, either in relation to the final weight or the first component.
5) The formula database can hold a maximum of 8 formulae with up to 12 components for each formula.
6) When using a particular stored formula, you can weigh out all the components.
Piece countingThis application allows you to count pieces. The application provides
several different methods for determining the reference piece weight.1) Select Piece Counting after pressing the Options button.2) Place the reference piece on the weighing pan. 3) Once the weight has stabilized, press the PcsWgt option.4) After the reference has been determined, place the pieces you wish to
count on the weighing pan. The result will be displayed.
Percentage WeighingThis enables you to weigh to a specified value (100 %) and detect
deviations from this target value.1) Choose percentage weighing from the options.2) Set your reference on the pan and press Set100%. This weight will
now be treated as 100%3) Now remove the reference and place another sample on the pan.4) The weighing scale will display what percentage of the reference the
new sample weighs.
Differential Weighing1) Choose Differential Weighing from the options.
Page 55 of 95
Hamsini Gopalakrishna Atlas Copco, Nanjing, China Summer Internship – 2012
2) Place the first container without the sample on the pan and press T & wgh. in. The initial weight has been recorded.
3) You can now treat or process the sample.4) Once again place the sample in the container on the pan and press
Residual…5) This will give the weight difference.
PART B
Statistics1) Choose the Statistics option from the main menu2) Place the first sample on the pan and press M+. This transfers the weight
to the statistics.3) You can choose to Weight Transfer automatically from the application
settings instead. Choose Additive mode to tare automatically after each sample is weighed. You need not remove each sample after weighing it.
4) Once all the samples have been weighed, press the Result button to have the results displayed.
Density1) Choose the Density option from the main menu2) Choose an appropriate method depending on the type of substance
whose density is being calculated.a. Solid body: Density determination of non-porous solid using an
auxiliary liquidi. If using ethanol or water as the auxiliary liquid, enter the
temperature. Otherwise, enter the density of the alternative liquid.
ii. Press the Start button. Place the sample on the pan when prompted. Its weight will be displayed.
iii. When prompted, immerse the body in the auxiliary liquid and press OK.
iv. The density will be displayed on the screen.
b. Liquid: Density determination of liquids using a sinkeri. Select Liquid as the method in the application settings.
ii. Input the volume of the sinker and press OK.iii. Weigh the sinker with the container and when prompted, press
OK to Tare it.iv. Pour the liquid into a container. The sinker will experience a
buoyant force.v. Press OK to accept the value and the density will be displayed.
c. Pasty substances: Density determination of pasty substances using a gamma sphere
Page 56 of 95
Hamsini Gopalakrishna Atlas Copco, Nanjing, China Summer Internship – 2012
i. Select Pasty Substances as the method in the application settings.
ii. Enter the volume of the gamma sphere being usediii. Press Start and when prompted, place the sample on the balance
without the gamma sphere.iv. When the weight is displayed, press OK to Tare it.v. Immerse the sphere in the substance when prompted.
vi. Press OK when the weight of the substance and the sphere is displayed.
vii. The result is displayed on the screen.
d. Pycnometer: For determining the density of liquids using a pycnometeri. Select Pycnometer as the method in the application settings.
ii. Enter the weight and the volume of the pycnometer and press Start.
iii. Place the pycnometer with the liquid on the pan when prompted.
iv. Press OK when the weight is displayed. The density will show up.
e. Solid porous: For determining the density of porous solid bodies by using a supplementary oil bathi. Select Solid Porous as the method in the application settings.
ii. Enter the temperature of the ethanol or water that is being used as the auxiliary liquid.
iii. To use other auxiliary liquids, enter the density of the liquid.iv. Press Start and when prompted, place the solid on the weighing
pan.v. Press OK when the weight is displayed.
vi. Immerse the sample in an oil bath and weigh it out again. Press OK.
vii. Immerse the oil coated solid in the auxiliary liquid. When the weight is displayed, press OK.
viii. The density will be displayed on the screen.
Page 57 of 95

Hamsini Gopalakrishna Atlas Copco, Nanjing, China Summer Internship – 2012
MANUAL: MICRO HARDNESS TESTERThis manual talks about how to use the Vickers micro hardness tester.
There are two main usage methods of this indenter: simple mode (manual and
automatic) and test program (multiple indentations). In the simple mode, one
indent is made and the hardness is measured. In the test program, once the
number of indents is set, it will automatically indent and shift positions. More
information on its working principle and sample measurements can be found in
the library.
NOTE: A dialog box will pop up when the button is
clicked. You can choose Manual Measure, Auto Measure A or Auto Measure B.
The Manual Measure is chosen for the Manual mode. The Auto Measure A is
chosen for clean and flat surfaces. The Auto Measure B is chosen for unclean
and uneven surfaces. For the Auto measures, ensure the Do Manual Measure
on Fail box is checked. The selected option will apply to both manners of
usage (simple and test program)
Using the micro hardness tester – Simple mode
1) Switch on the computer and the microhardness tester. The switch for the
tester is on the back near the bottom.
2) Lower the stage and place the sample. There is a knob on the side near the
bottom that adjusts the focus.
3) Open the Minuteman software.
4) Click on LOG ON and choose either TMS 1 or TMS 2. They are the same.
5) For a new measurement, click on File and choose New Measurement
6) Click on New Sample and fill in the required details. You can change the
sample name here. Click New Sample once you are done.
Page 58 of 95
Test Force knob
Hamsini Gopalakrishna Atlas Copco, Nanjing, China Summer Internship – 2012
7) Throughout the process, to exit the viewing mode, press Esc
8) Click the Vickers mode. . The three options are manual measure,
Auto A or Auto B. If the program can’t detect the edges of the indent
automatically, it will ask the user to manually place the boundaries on the
indent. For Auto Measures, ensure the Do Manual Measure on Fail box is
checked.
9) Go to the viewing mode
10)After selecting the desired magnification (10x or 40x; right click: objective
selection), focus on the sample. You can move the sample by
clicking and dragging across the screen.
11)Make sure the Test Force value chosen in the side panel matches
the value set on the knob to the right of the eyepiece. This is a
very important step!
12) Focus on the targeted area for the indent and press Enter. Click
the indent button. Once the indent is done, you will hear a
beep.
13)Click on and focus the microscope.
14) The orientation of the indent with respect to the axes must be as shown.
15)Place the red lines that appear on left clicking at the boundaries of the
indent.
16)The hardness will show on the bottom left of the screen once you left click.
17)Left click again to view the hardness on the excel sheet in the background.
18)Click on TMS1 and then on LOG OFF. Switch off the computer
Page 59 of 95
Hamsini Gopalakrishna Atlas Copco, Nanjing, China Summer Internship – 2012
TEST PROGRAM: This runs several indents in one trial. You can decide
the number of points, their respective distances etc. This is used if the
hardness gradient (hardness across a sample) through different
phases/materials is needed. This is more useful if hardness varies across the
material.
1) Log on, click on View and select Test Program.
2) Double click the 3 C Setting of measurement row to edit it.
3) Change the parameters in the pop up box as required.
4) Select New Sample in the Auto box. This ensures that the blue arrow shows.
5) Click the blue arrow next to AUTO. Focus the image.
6) Choose the area of the first indentation. This can be at the boundary
between the two phases/areas being studied.
7) Position the sample and press Enter.
8) A start line along with a direction pointer will show. Once the start point
and direction is set, the indenter will start automatically. Again, ensure that
the Test Force selected on the screen matches the values of the knob.
9) When the indents are done, they will be measured. This will be done
automatically if the indent is clear. This will have to be done manually if the
indent is blurred. Even if the redlines appear by themselves, you can focus it
to maximize the green number.
10)The results will be displayed in the excel worksheet.
11)Remember to LOG OFF before closing the software.
12)Switch off the computer once you’re done.
Page 60 of 95
The wheel controlling the load setting
Hamsini Gopalakrishna Atlas Copco, Nanjing, China Summer Internship – 2012
MANUAL: UNIVERSAL HARDNESS TESTER
This manual discusses the usage of the universal hardness tester. This
tester is mainly used for measuring hardness on the Rockwell scale. This is a
mechanical device. You will need to calibrate the machine before every test.
The calibration process is the same as the testing process. For calibration,
make sure that the indent size and the indenter match. More information on
its working principle and sample measurements can be found in the library.
Using the universal hardness tester1) Switch on the hardness tester. Ensure that the lever to the side
(near the top) is pointing towards you. 2) Lower the stage. Using the wheel below the stage. Turning it
clockwise raises it and anticlockwise lowers it3) Remember to choose Rockwell in the knob at the side.
The universal hardness tester with knob with the options – Brinell, Rockwell and Vickers.
The first symbol and the last symbols mean Off. The second
symbol from the left means Brinell. The third symbol means Rockwell. The fourth means it is in the Vickers mode.
4) Place the sample (or calibration block) on the stage. Ensure that the wheel (on the side) points to the proper load setting (according to A, B and C).
Table 1: Indenter size and load setting for different modes.Mode Indenter Size Load setting (N)
Page 61 of 95
The lever
The

Hamsini Gopalakrishna Atlas Copco, Nanjing, China Summer Internship – 2012
A 0.2 mm 588.4C 0.2 mm 1471B 1.5875 mm 908.7
5) Raise the stage till the lines on the screen coincide at 100. The steel knob in the front helps fine tune the line.
The lines coincide at 100. The line alignment fine tuning knob.
6) Once the lines coincide, gently push the lever away from you.7) Wait for 5 seconds for it to stabilize. Then pull it back.8) You can now see the result on the screen. (Ensure that you are looking at
the value from the proper scale).9) Lower the stage and remove the sample.10) Turn off the hardness tester.
Page 62 of 95

Hamsini Gopalakrishna Atlas Copco, Nanjing, China Summer Internship – 2012
MANUAL: BRINELL HARDNESS TESTERIn the Brinell hardness test, a hard spherical indenter is forced onto the
surface being tested. The load varies from 500kg – 3000kg in 500 kg
increments. The Brinell hardness number is a function of the load applied and
the diameter of the resultant indentation. More information on its working
principle and sample measurements can be found in the library.
Using the Brinell hardness tester1) Turn the power on.
2) Calibrate the machine by using the respective calibration blocks and
indenter sizes. To calibrate, follow the steps 3 to 14.
3) Lower the stage and place the sample. Ensure the indenter is in the
front (chosen).
4) Press TAB A to select the appropriate test load and indenter size.
Press OK
5) Ensure the load setting matches the load chosen. Same goes for the
indenter (for calibration only).
6) Press CLR – F to set the load to zero.
Page 63 of 95
Hamsini Gopalakrishna Atlas Copco, Nanjing, China Summer Internship – 2012
The control panel of the tester
7) Raise the stage till the screen reads around 100 kg force. After this
point, the tester will automatically increase the load till the set limit.
8) Lower the stage and change the indenter to the microscope. The lens
has to click into place.
9) Be very careful not to move the sample. Focus the microscope.
10)In the eyepiece, you will see two lines. There is one knob on each
side of the eye piece.
11)Adjusting the left knob results in both the line moving. Adjusting the
right knob results in the right line moving.
12)Make sure the lines coincide. Press CLR – D to set the distance
between the two lines to zero on the screen.
13)Then shift the lines so that they are on the outer edge of the
indentation. Once in position, press the black button next to the
eyepiece.
14) Rotate the eyepiece 900 and do the same horizontally. Press the
black button again once this is done.
15) The hardness will be displayed on the screen.
16) Lower the stage and remove the sample. Switch off the machine.
Page 64 of 95

Hamsini Gopalakrishna Atlas Copco, Nanjing, China Summer Internship – 2012
MANUAL: ULTRASONIC TESTERThe ultrasonic tester helps detect flaws that are inside of the material.
The tester needs to be calibrated at least once in six months. More information
on its working principle and sample measurements can be found in the library.
Using the ultrasonic tester
1) Ensure the surface is free from any dirt and foreign particles that may
affect the surface roughness.
2) Lubricate the surface of the piece to be tested with oil.
3) Plug in the ultrasonic tester and turn it on.
4) Choose from the angled probe or the normal probe. The angled probe
helps detect flaws in welds while the normal probe helps detect flaws in
steels, forged steels and cast irons and steels.
5) Connect the probe to the tester and place the probe on the intended test
site.
6) Choose a standard for testing. Each standard will result in a graph with
different a baseline.
7) Calibration is typically done once in three months or depending on the
usage. The CSK I A is used to find the front length and calibrate the K
value for the angled probe. The front length is the distance between the
source of the ultrasonic waves and the edge of the calibration block. The
K value is the tan of the angle of refraction.
8) For the normal probe, the CS–1–5 block is used to draw the baseline
(AVG curve )
Page 65 of 95

Hamsini Gopalakrishna Atlas Copco, Nanjing, China Summer Internship – 2012
9) There are three baseline curves on a graph for the angled probe. These
are drawn during calibration with the CSK III A block (DAC curve).
10) The baselines are drawn according to values given by the standards. The
standards may also specify different blocks to be used for calibration.
11) The pink line can be adjusted based on user specific standards.
A sample baseline curveI: Any peak below this is acceptable.
II: The acceptance of any peak below I and above III depends on the flaw
size and the permitted flaw sizes according to the chosen standards.
III: Anything with a peak above this line is rejected
Cracks of any size are not acceptable.
12) Move the probe around to detect the highest peak. The highest peak will
turn pink once it crosses the pink line in the graph. The pink line on the
graph can be adjusted to any percentage desired.
13) Once flaws have been detected, the acceptance of the metal part is
based on the standards chosen and the values of acceptance of the user.
Page 66 of 95
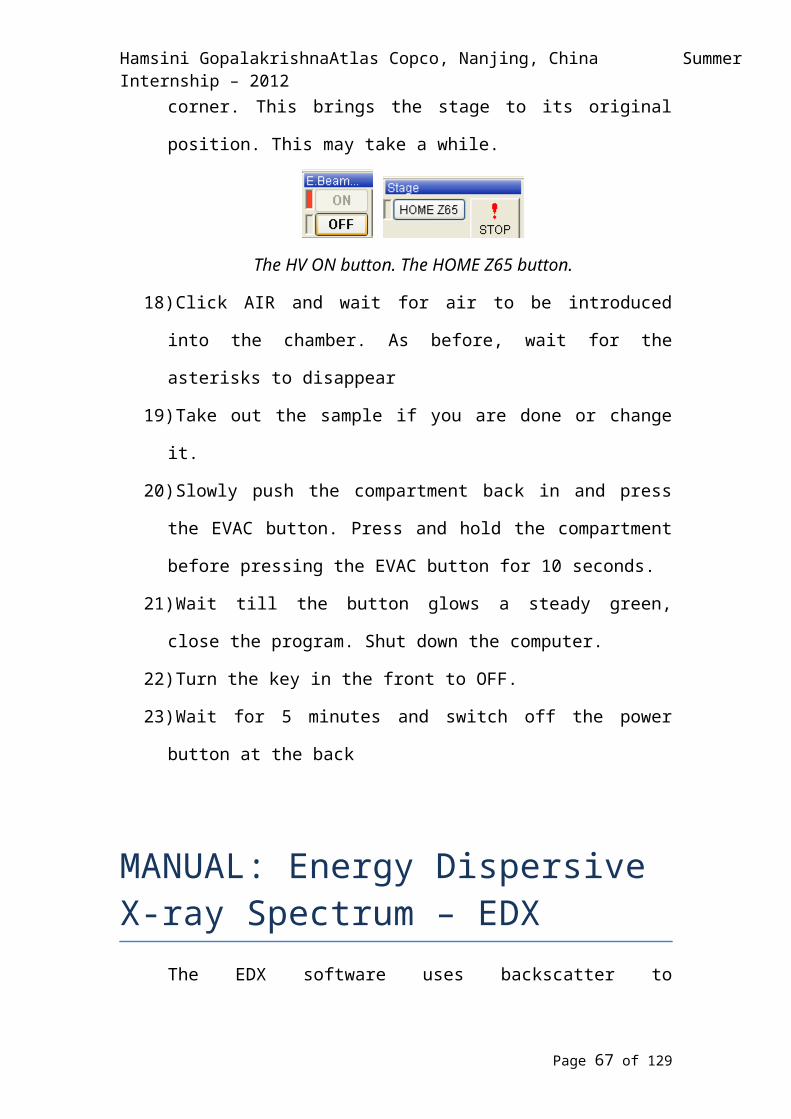
Hamsini Gopalakrishna Atlas Copco, Nanjing, China Summer Internship – 2012
MANUAL: MAGNETIC PARTICLE TESTERThis manual discusses the operation of the Magnetic Particle (MT)
tester. The magnetic particle is used to detect surface and slight subsurface
flaws in a metallic piece. More information on its working principle and sample
measurements can be found in the library.
Using the Magnetic Particle (MT) tester1) To run a trial, place the test patch face down and follow steps 2 - 6.
2) Prepare the area to be tested by cleaning it. Make sure it is free from
dust, dirt, lint and any foreign material that may interfere with the
working of the MT.
3) Spray the inspection area/test patch with the magnetic suspension. If the
surface needs contrast, you can spray white paint first.
4) Plug in the MT tester and turn it on.
5) Switch the tester to the AC or DC mode and hold it across the spot being
examined with the current on. In the AC mode detects flaws on the
surface while in the DC mode, surface and subsurface (3-5mm) flaws
can be detected.
6) Now hold it across the spot in another direction (900 from the initial
direction) with the current on.
7) Once done, there will be an impression of the flaw on the surface.
8) Turn off the current and unplug the MT. You can wipe the area clean and
mark it.
9) You can use black light instead of using the white paint for contrast.
Page 67 of 95

Hamsini Gopalakrishna Atlas Copco, Nanjing, China Summer Internship – 2012
Appendix II – Photographs
Fig 49. Optical Microscope
Fig 50. Optical Stereoscope
Page 68 of 95
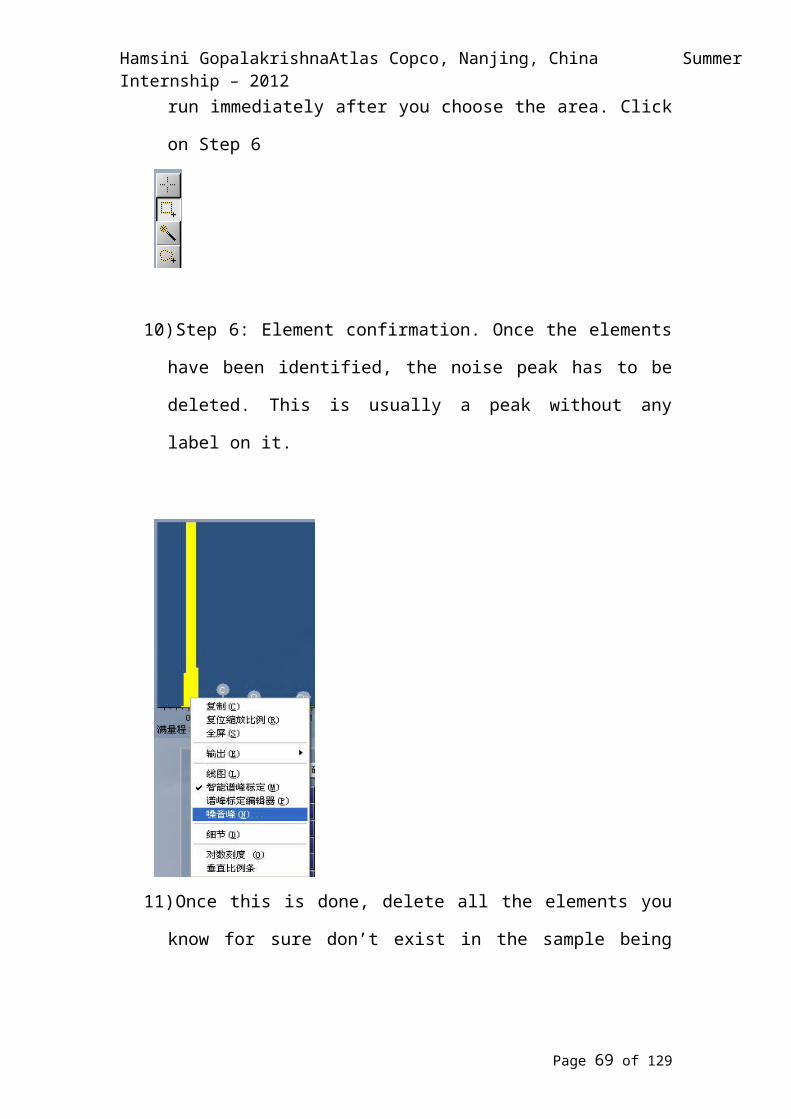
Hamsini Gopalakrishna Atlas Copco, Nanjing, China Summer Internship – 2012
Fig 51. A photograph of the SEM at the Atlas Copco, Nanjing lab
Fig 52. A close up the SEM
Page 69 of 95
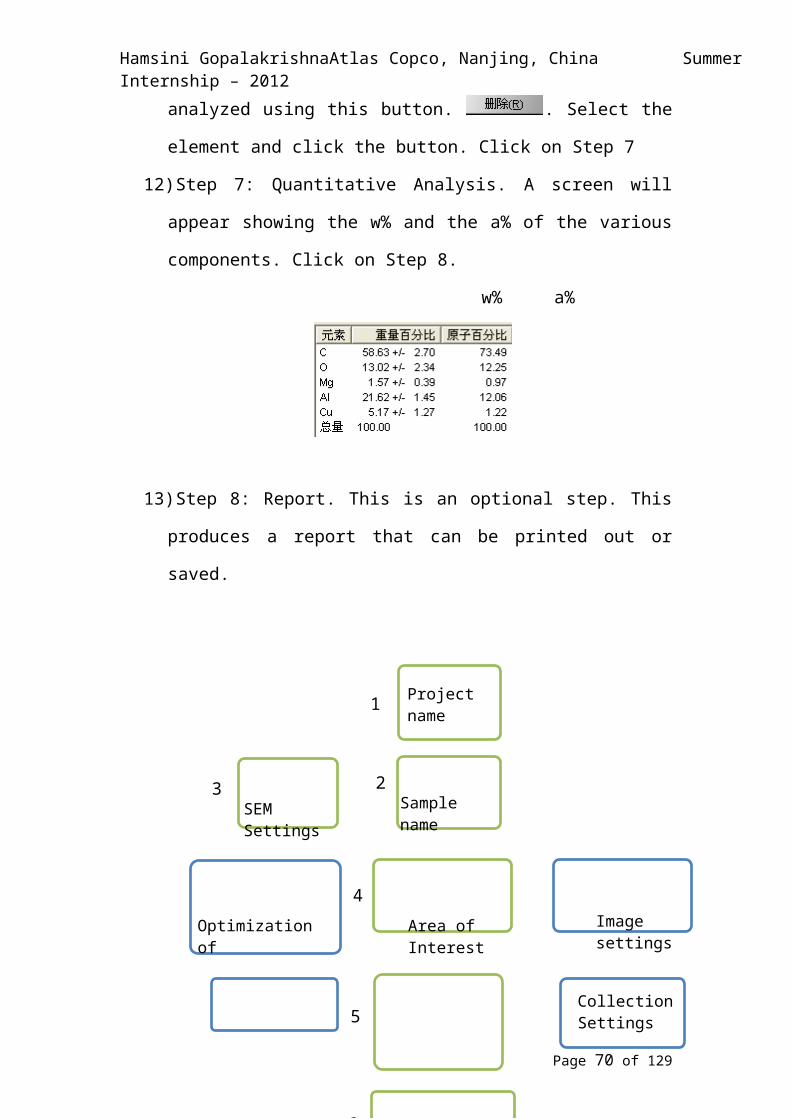
Hamsini Gopalakrishna Atlas Copco, Nanjing, China Summer Internship – 2012
Fig 53. A photograph of the inside of the SEM. The sample is placed on a stage.
Fig 54. Side view of the inside of the SEM
Page 70 of 95
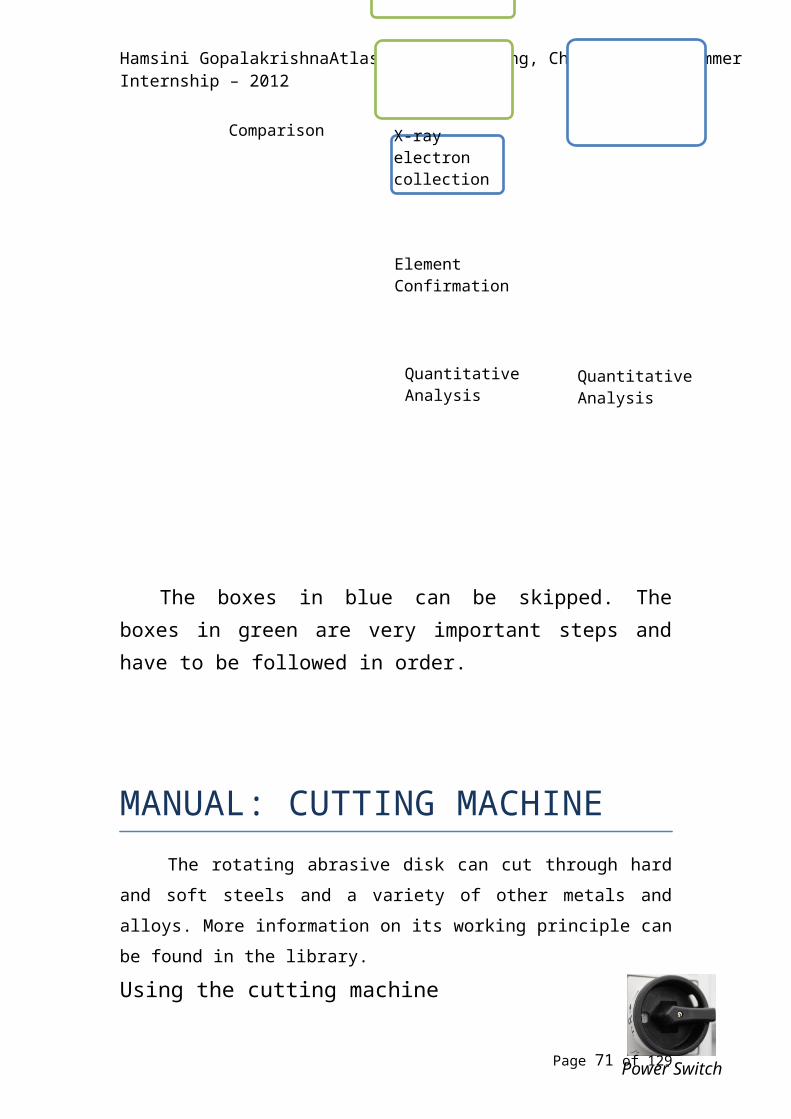
Hamsini Gopalakrishna Atlas Copco, Nanjing, China Summer Internship – 2012
Fig 55. A picture of gold particles taken with the SEM. Magnification 30,000x
Fig 56. A picture of gold particles. Magnification 60,000x
Page 71 of 95
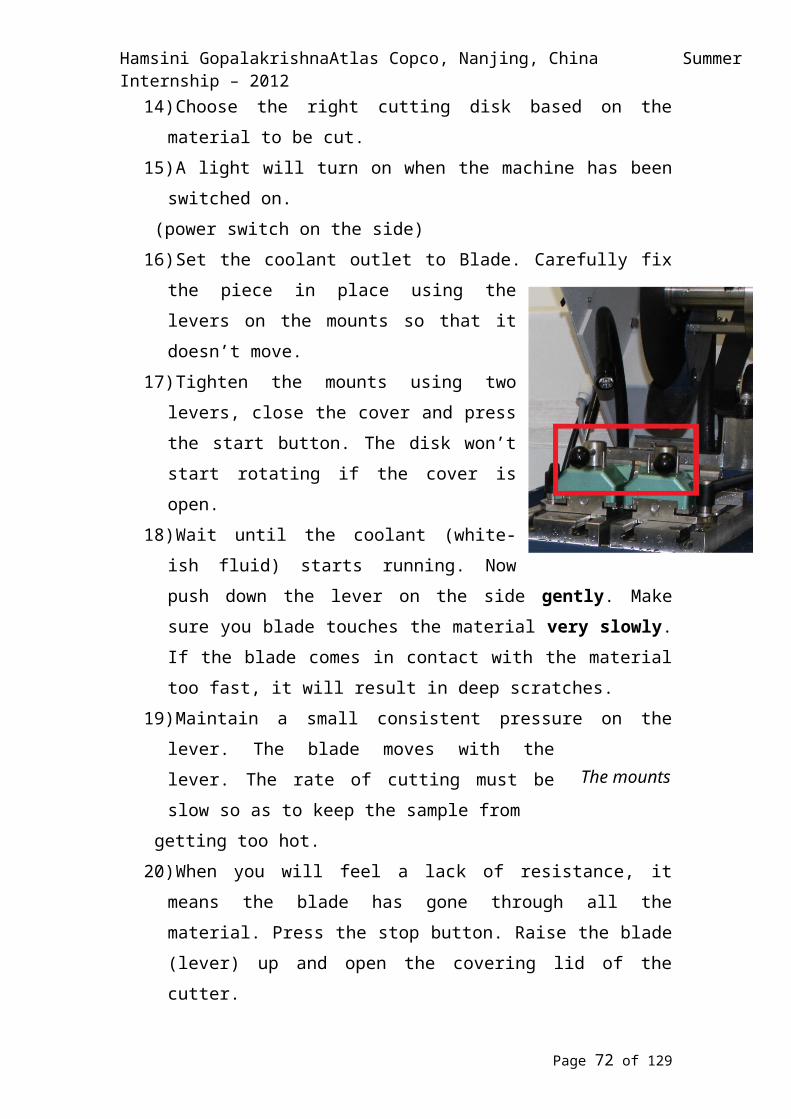
Hamsini Gopalakrishna Atlas Copco, Nanjing, China Summer Internship – 2012
Fig 57. The cutting machine
Fig 58. The mounting machine
Fig 59. The grinder and polisher
Page 72 of 95
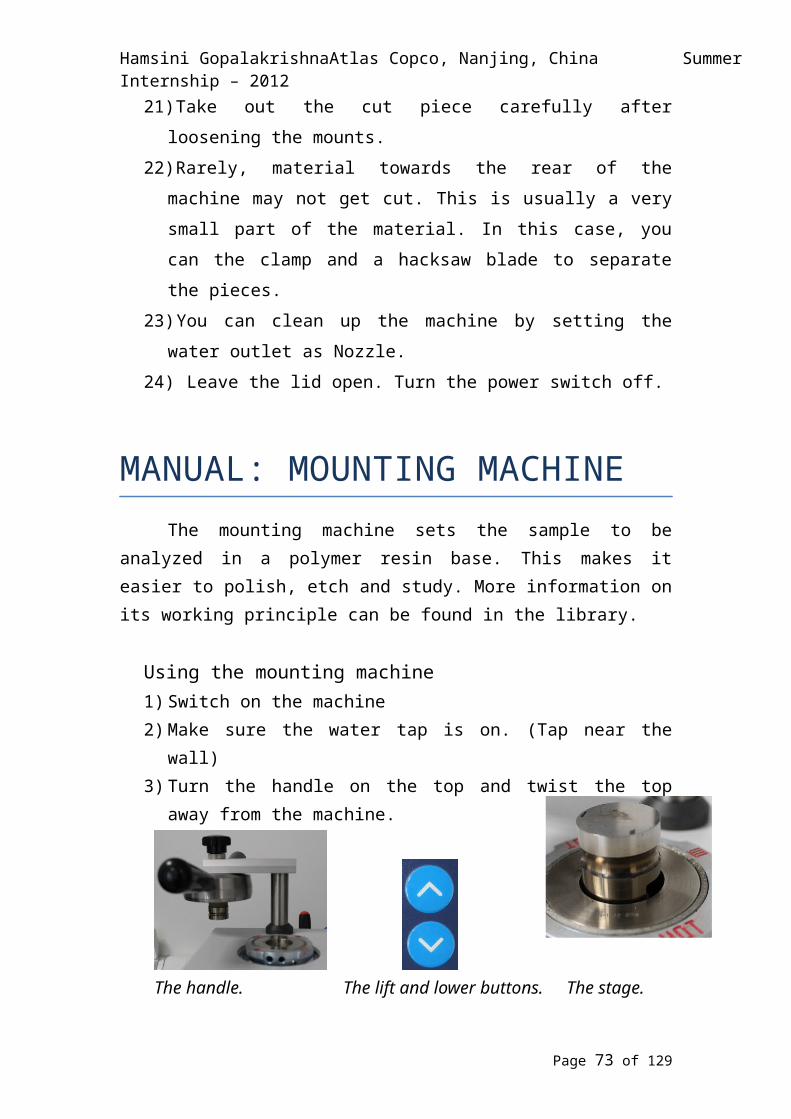
Hamsini Gopalakrishna Atlas Copco, Nanjing, China Summer Internship – 2012
Page 73 of 95
Fig 60. The precision weighing scale
Fig 61. The Vickers microhardness tester
Hamsini Gopalakrishna Atlas Copco, Nanjing, China Summer Internship – 2012
Page 74 of 95
Fig 63. The digital Brinell hardness tester
Fig 62. The Universal hardness tester
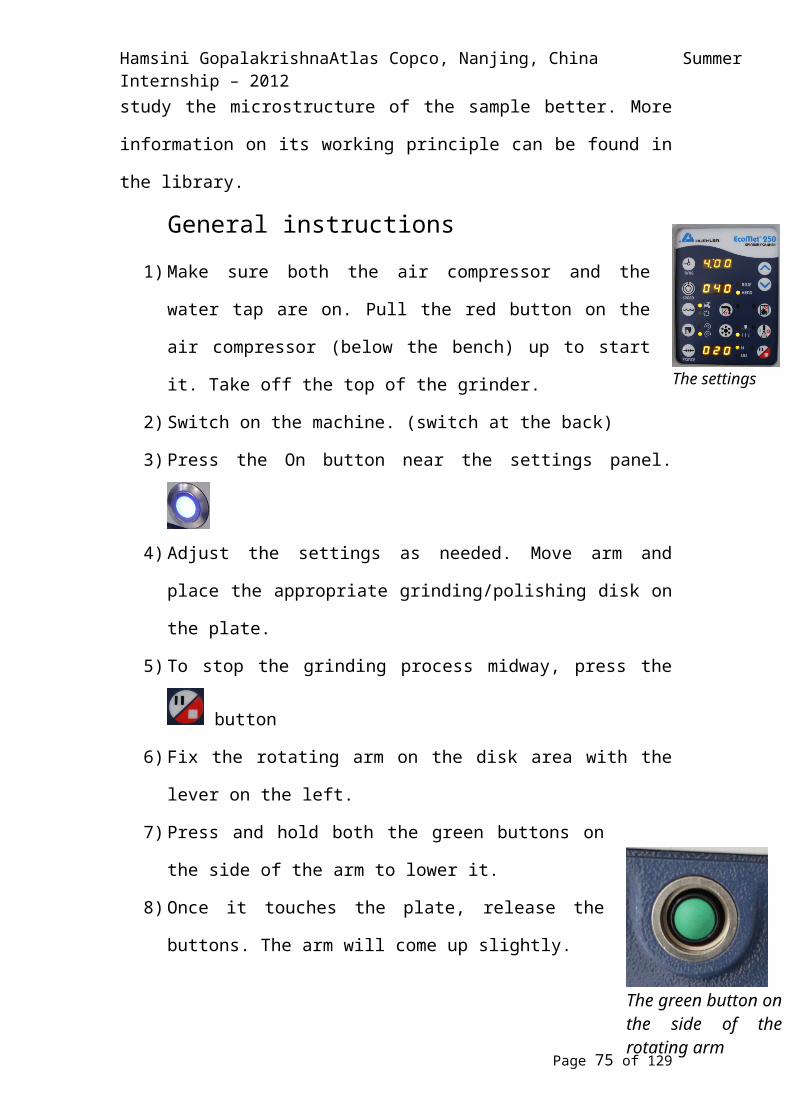
Hamsini Gopalakrishna Atlas Copco, Nanjing, China Summer Internship – 2012
Fig 65. The Magnetic Particle tester
Page 75 of 95
Fig 64. The Ultrasonic tester

Hamsini Gopalakrishna Atlas Copco, Nanjing, China Summer Internship – 2012
Xu Zhou visit photographs
Fig 66. The Xu Zhou BUT company
Fig 67. The frames that were to be tested
Page 76 of 95
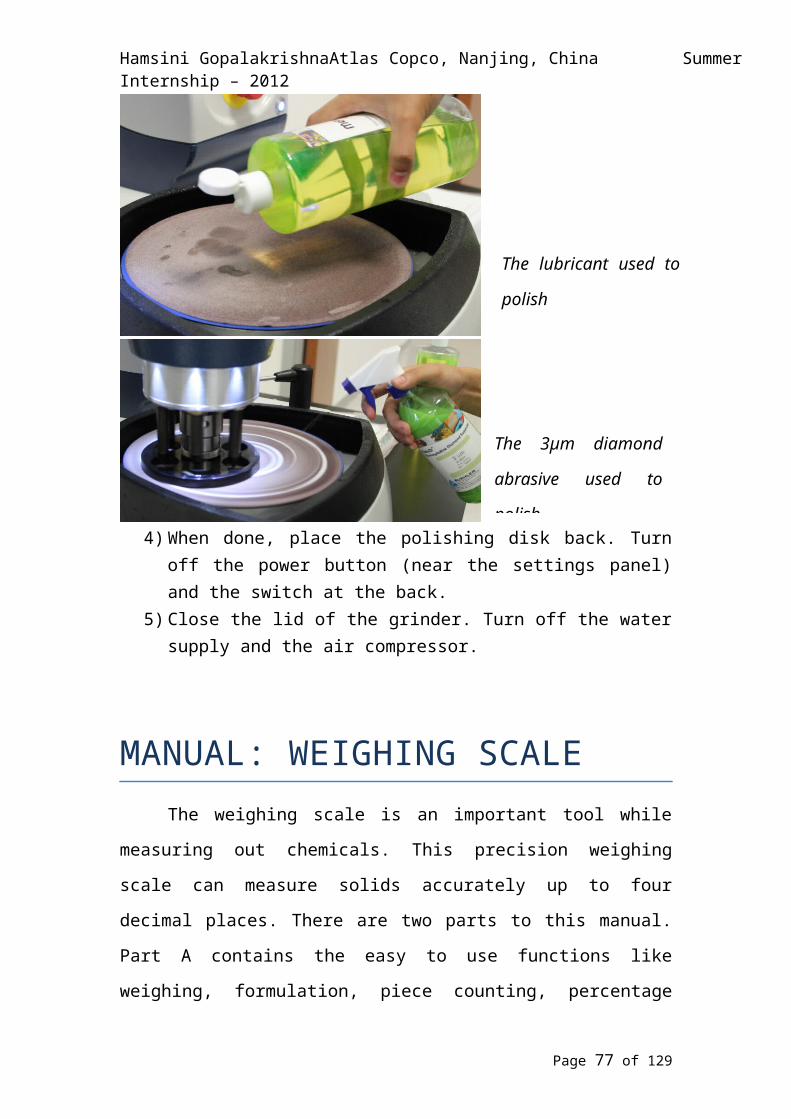
Hamsini Gopalakrishna Atlas Copco, Nanjing, China Summer Internship – 2012
Fig 68. The frames that were to be tested
Fig 69. The weld to be tested prepared by applying oil/grease
Page 77 of 95
Hamsini Gopalakrishna Atlas Copco, Nanjing, China Summer Internship – 2012
Fig 70. One of the six flaws detected by the engineers
Fig 71. Another flaw detected by the engineer.
Page 78 of 95

Hamsini Gopalakrishna Atlas Copco, Nanjing, China Summer Internship – 2012
Fig 72. Hamsini Gopalakrishna using the UT machine
Fig 73. The BUT engineer, SGS engineer and Atlas Copco engineer examining the frame
Page 79 of 95

Hamsini Gopalakrishna Atlas Copco, Nanjing, China Summer Internship – 2012
Atlas Copco, Wuxi visit photographs
Fig 74. Staff from Atlas Copco, Wuxi From L-R Lin Zhi Min, Xu Bin Jie, Charles Fu and Alex Xie.
Fig 75. From L-R Charles Fu, Hamsini Gopalakrishna and Alex Xie in front of the silent generator
Page 80 of 95
Hamsini Gopalakrishna Atlas Copco, Nanjing, China Summer Internship – 2012
Fig 76. Hamsini Gopalakrishna in front of the silent generator
Fig 77. Oil carrying equipment used for testing
Page 81 of 95

Hamsini Gopalakrishna Atlas Copco, Nanjing, China Summer Internship – 2012
Fig 78. A compressor testing rig
Fig 79. The failed aluminum part whose cause of failure was being discussed
Page 82 of 95
Hamsini Gopalakrishna Atlas Copco, Nanjing, China Summer Internship – 2012
Fig 81. Side view of the oil separator
Fig 82. Side view of the separator
Page 83 of 95

Hamsini Gopalakrishna Atlas Copco, Nanjing, China Summer Internship – 2012
Appendix III – Presentation of lab equipment and their uses
Page 84 of 95

Hamsini Gopalakrishna Atlas Copco, Nanjing, China Summer Internship – 2012
Page 85 of 95
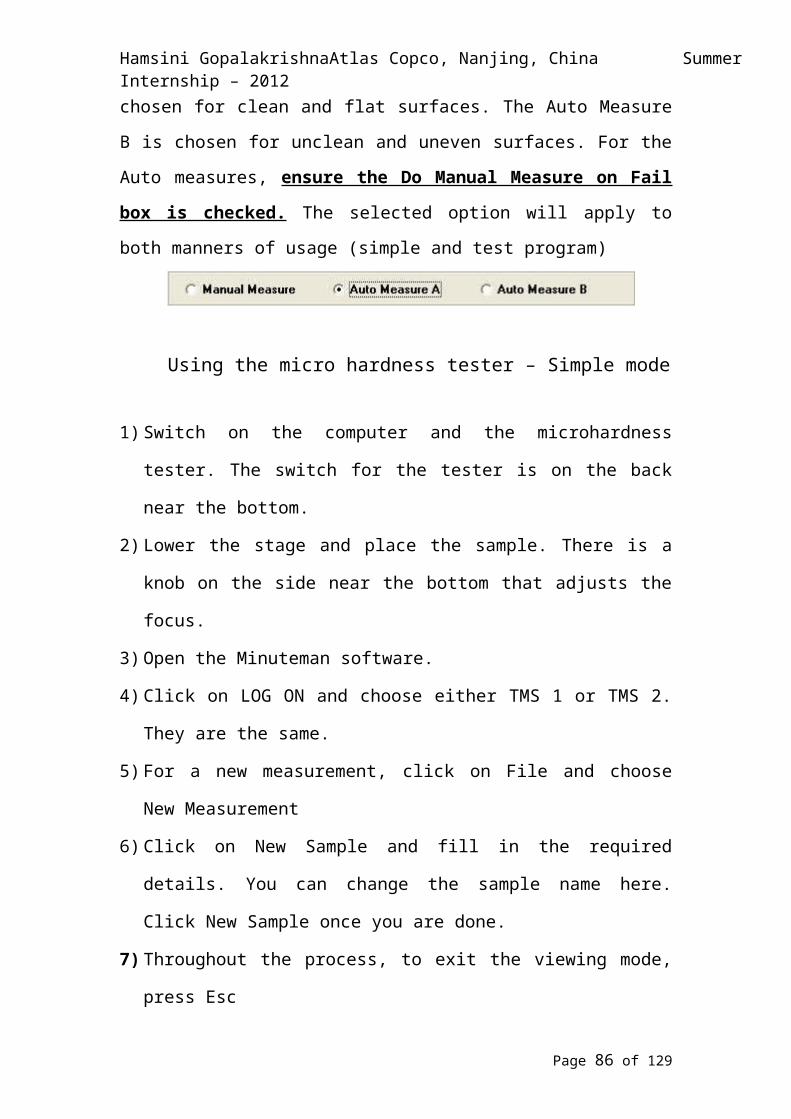
Hamsini Gopalakrishna Atlas Copco, Nanjing, China Summer Internship – 2012
Page 86 of 95
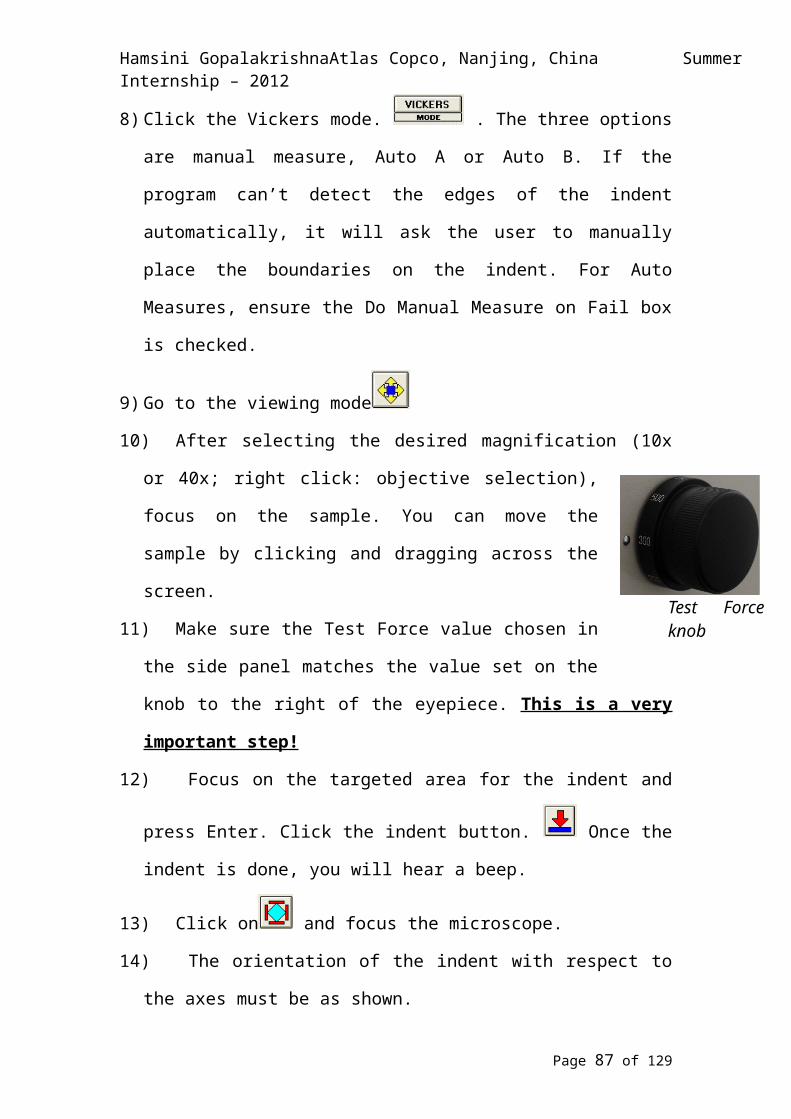
Hamsini Gopalakrishna Atlas Copco, Nanjing, China Summer Internship – 2012
Page 87 of 95

Hamsini Gopalakrishna Atlas Copco, Nanjing, China Summer Internship – 2012
Page 88 of 95

Hamsini Gopalakrishna Atlas Copco, Nanjing, China Summer Internship – 2012
Page 89 of 95

Hamsini Gopalakrishna Atlas Copco, Nanjing, China Summer Internship – 2012
Page 90 of 95
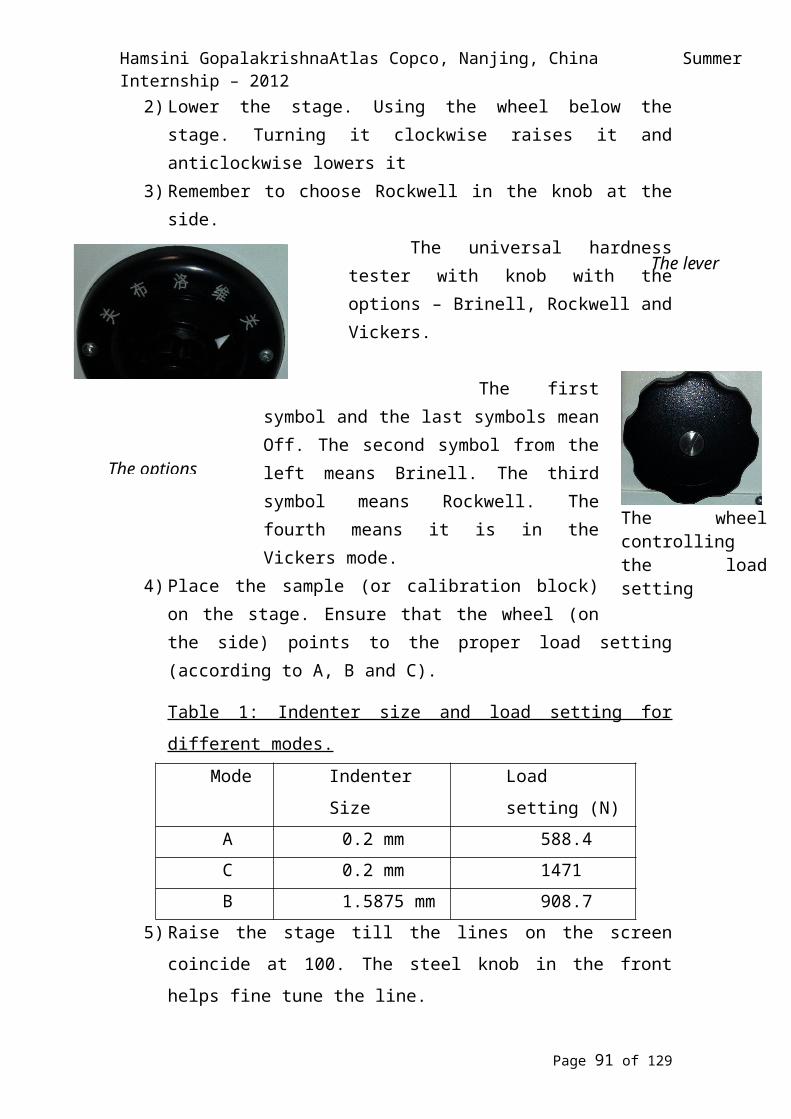
Hamsini Gopalakrishna Atlas Copco, Nanjing, China Summer Internship – 2012
Page 91 of 95

Hamsini Gopalakrishna Atlas Copco, Nanjing, China Summer Internship – 2012
Page 92 of 95

Hamsini Gopalakrishna Atlas Copco, Nanjing, China Summer Internship – 2012
Page 93 of 95

Hamsini Gopalakrishna Atlas Copco, Nanjing, China Summer Internship – 2012
Page 94 of 95

Hamsini Gopalakrishna Atlas Copco, Nanjing, China Summer Internship – 2012
***************************THE END****************************
Page 95 of 95


![Atlas Copco (India) Limited · 3. Atlas Copco International B.V. ACO0101339 4. Atlas Copco AB ACO0101595, ACO0101097, A 0005191 and 10177354 5. Atlas Copco [I] Ltd Charitable Foundation](https://static.fdocuments.in/doc/165x107/5ec4197bfe534e04f779e397/atlas-copco-india-limited-3-atlas-copco-international-bv-aco0101339-4-atlas.jpg)