Atlantic Salmon - Seafood Watch - Official Site of the...
118
Atlantic Salmon Salmo salar © Monterey Bay Aquarium British Columbia, Canada Marine Net Pens September 18, 2017 Seafood Watch Consulting Researcher Disclaimer Seafood Watch® strives to have all Seafood Reports reviewed for accuracy and completeness by external scientists with expertise in ecology, fisheries science and aquaculture. Scientific review, however, does not constitute an endorsement of the Seafood Watch® program or its recommendations on the part of the reviewing scientists. Seafood Watch® is solely responsible for the conclusions reached in this report.
Transcript of Atlantic Salmon - Seafood Watch - Official Site of the...

Atlantic Salmon Salmo salar
© Monterey Bay Aquarium
British Columbia, Canada Marine Net Pens
September 18, 2017 Seafood Watch Consulting Researcher
Disclaimer Seafood Watch® strives to have all Seafood Reports reviewed for accuracy and completeness by external scientists with expertise in ecology, fisheries science and aquaculture. Scientific review, however, does not constitute an endorsement of the Seafood Watch® program or its recommendations on the part of the reviewing scientists. Seafood Watch® is solely responsible for the conclusions reached in this report.
2
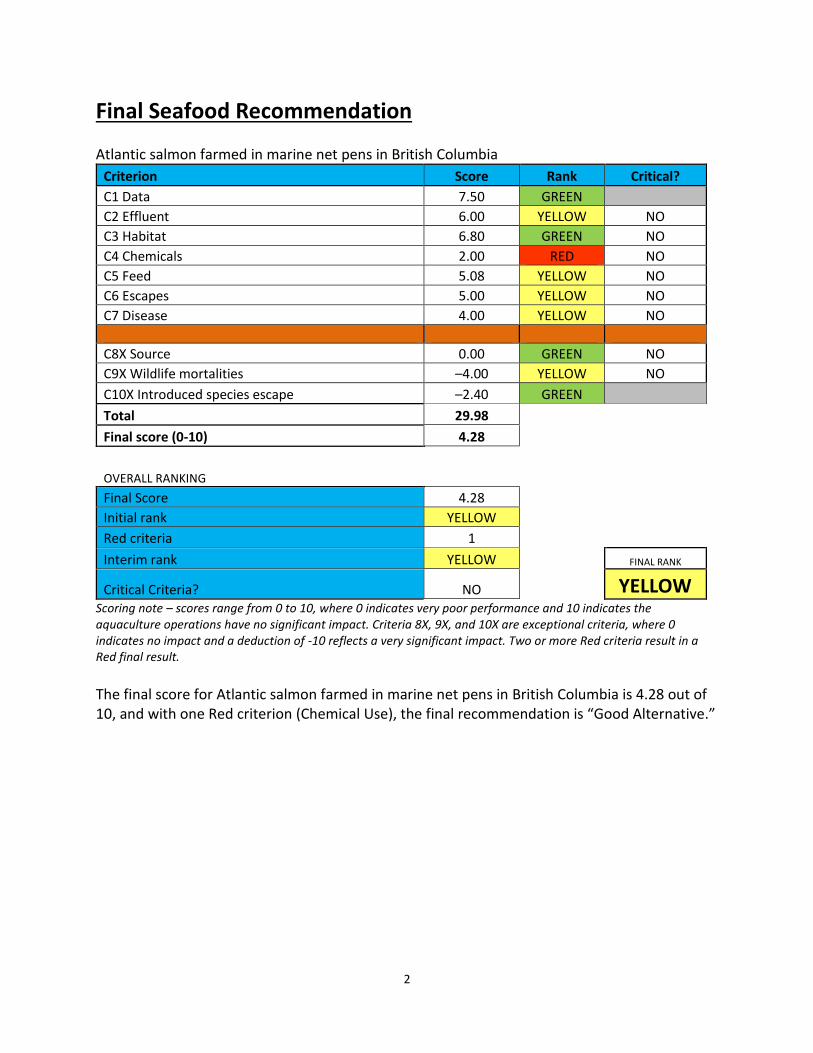
Final Seafood Recommendation Atlantic salmon farmed in marine net pens in British Columbia
Criterion Score Rank Critical?
C1 Data 7.50 GREEN
C2 Effluent 6.00 YELLOW NO
C3 Habitat 6.80 GREEN NO
C4 Chemicals 2.00 RED NO
C5 Feed 5.08 YELLOW NO
C6 Escapes 5.00 YELLOW NO
C7 Disease 4.00 YELLOW NO
C8X Source 0.00 GREEN NO
C9X Wildlife mortalities –4.00 YELLOW NO
C10X Introduced species escape –2.40 GREEN
Total 29.98
Final score (0-10) 4.28
OVERALL RANKING
Final Score 4.28
Initial rank YELLOW
Red criteria 1
Interim rank YELLOW FINAL RANK
Critical Criteria? NO YELLOW Scoring note – scores range from 0 to 10, where 0 indicates very poor performance and 10 indicates the aquaculture operations have no significant impact. Criteria 8X, 9X, and 10X are exceptional criteria, where 0 indicates no impact and a deduction of -10 reflects a very significant impact. Two or more Red criteria result in a Red final result.
The final score for Atlantic salmon farmed in marine net pens in British Columbia is 4.28 out of 10, and with one Red criterion (Chemical Use), the final recommendation is “Good Alternative.”
3
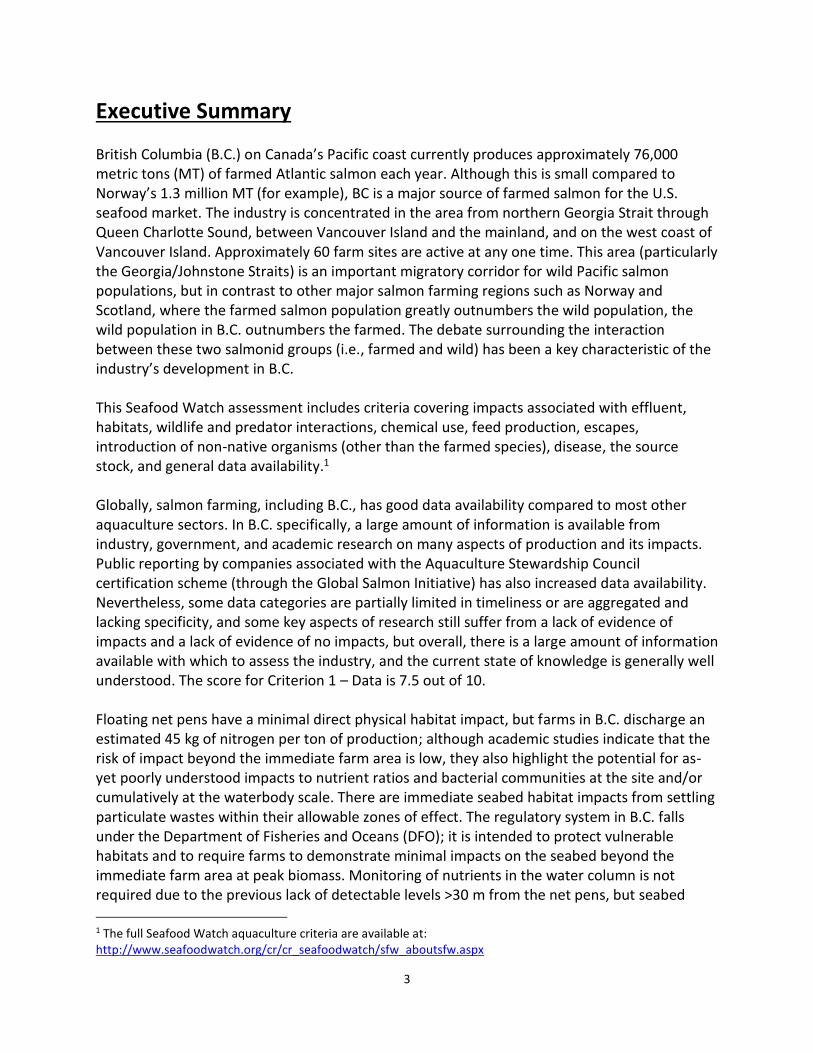
Executive Summary British Columbia (B.C.) on Canada’s Pacific coast currently produces approximately 76,000 metric tons (MT) of farmed Atlantic salmon each year. Although this is small compared to Norway’s 1.3 million MT (for example), BC is a major source of farmed salmon for the U.S. seafood market. The industry is concentrated in the area from northern Georgia Strait through Queen Charlotte Sound, between Vancouver Island and the mainland, and on the west coast of Vancouver Island. Approximately 60 farm sites are active at any one time. This area (particularly the Georgia/Johnstone Straits) is an important migratory corridor for wild Pacific salmon populations, but in contrast to other major salmon farming regions such as Norway and Scotland, where the farmed salmon population greatly outnumbers the wild population, the wild population in B.C. outnumbers the farmed. The debate surrounding the interaction between these two salmonid groups (i.e., farmed and wild) has been a key characteristic of the industry’s development in B.C. This Seafood Watch assessment includes criteria covering impacts associated with effluent, habitats, wildlife and predator interactions, chemical use, feed production, escapes, introduction of non-native organisms (other than the farmed species), disease, the source stock, and general data availability.1 Globally, salmon farming, including B.C., has good data availability compared to most other aquaculture sectors. In B.C. specifically, a large amount of information is available from industry, government, and academic research on many aspects of production and its impacts. Public reporting by companies associated with the Aquaculture Stewardship Council certification scheme (through the Global Salmon Initiative) has also increased data availability. Nevertheless, some data categories are partially limited in timeliness or are aggregated and lacking specificity, and some key aspects of research still suffer from a lack of evidence of impacts and a lack of evidence of no impacts, but overall, there is a large amount of information available with which to assess the industry, and the current state of knowledge is generally well understood. The score for Criterion 1 – Data is 7.5 out of 10. Floating net pens have a minimal direct physical habitat impact, but farms in B.C. discharge an estimated 45 kg of nitrogen per ton of production; although academic studies indicate that the risk of impact beyond the immediate farm area is low, they also highlight the potential for as-yet poorly understood impacts to nutrient ratios and bacterial communities at the site and/or cumulatively at the waterbody scale. There are immediate seabed habitat impacts from settling particulate wastes within their allowable zones of effect. The regulatory system in B.C. falls under the Department of Fisheries and Oceans (DFO); it is intended to protect vulnerable habitats and to require farms to demonstrate minimal impacts on the seabed beyond the immediate farm area at peak biomass. Monitoring of nutrients in the water column is not required due to the previous lack of detectable levels >30 m from the net pens, but seabed
1 The full Seafood Watch aquaculture criteria are available at: http://www.seafoodwatch.org/cr/cr_seafoodwatch/sfw_aboutsfw.aspx

4
monitoring (which is typically conducted by third-party companies) is subjected to enforcement audits by DFO at approximately 50% of active farms each year. The results in 2015 showed that 79% of sites were fully compliant at every sampling location, and 21% of sites had at least one sample of sulfide levels at 30 m that would be considered sufficient to decrease species diversity, or benthic habitats that were not considered normal at 125 m. At the site level, these impacts are considered (relatively) rapidly reversible by fallowing or by breaks in production, and the total area of salmon farms in B.C. is small compared to the total coastal resource. Potential cumulative impacts are primarily addressed by each Canadian province with minimum site separation distances of 3 km (in most cases), and B.C. also now has two separate ecosystem-based management plans in place covering the majority of the salmon farming sector: the Pacific North Coast Integrated Management Area (PNCIMA) and the Marine Planning Partnership for the North Pacific Coast (MaPP). The practical outcomes of these plans are not yet known, but overall, regulatory content and enforcement, with regard to potential cumulative impacts, indicates that cumulative impacts are unlikely. The final score for Criterion 2 – Effluent is 6 out of 10, and for Criterion 3 – Habitat is 6.8 out of 10. Antibiotic use in B.C. has declined substantially since the peaks of the late 1990s, but a significant increase in 2015 due to outbreaks of salmon rickettsial septicemia (caused by unusually warm water temperatures) highlighted the industry’s vulnerability to environmental variability. The total antibiotic use in 2016 dropped substantially after the 2015 spike, but the use of the most dominant treatment, florfenicol, still increased. Current use (over the last four years) varies by treatment, year, and company, but the total in 2016 was 5.1 MT. On average, antibiotics were used 1.65 times per cycle in 2016 with an average relative use of 68.7 g/MT. Although evidence of resistance has been demonstrated in bacterial salmon pathogens in B.C., there is currently no evidence with which to link it to antibiotic use in salmon farms, and there is no current evidence of clinical treatment failures or decreased efficacy; however, multiple treatments (i.e., >1) continue per production cycle with antibiotics that are listed as highly important for human medicine by the World Health Organization. Pesticide use in B.C. is low (compared to other salmon farming regions), at approximately 22 kg of active ingredient per year, but treatments are used on average more than once per production cycle (1.4 in 2015). Although there is the potential for impacts at the site level, for development of resistance, and for the licensing and increased use of alternative chemicals (e.g., azamethiphos), the industry is also actively conducting trials of non-chemical alternatives for the physical removal of lice that could reduce pesticide use. Overall, the open nature of the net pen production system provides no barrier to infection from environmental pathogens, and in B.C., there is regular treatment (i.e., more than once per production cycle) with antibiotics that are highly important for human medicine. Thus, antibiotic usage remains a fundamental challenge of net pen salmon farming and is a high concern according to the Seafood Watch Standard. As a result, the final score for Criterion 4 – Chemical Use is 2 out of 10. Fishmeal and fish oil in B.C. salmon feeds continue to be replaced by increasing levels of alternative crop protein and oil ingredients, and by land animal by-products. Data provided by
5
one of three major feed companies supplying B.C. farms, supported by data from salmon farming company annual reports and reference values from GSI and BCSFA, show the feed conversion ratio (dry weight of feed to wet weight of fish) is 1.25. Thus, from first principles, 2.07 MT of wild fish would need to be caught to produce 1 metric ton of farmed salmon. Information on the sustainability of source fisheries for fishmeal and fish oil results in a Wild Fish Use score of 3.17 out of 10. There is a net edible protein loss of 12.1% and a moderate total feed footprint of 12 ha per MT of production. Overall, the final feed score is 5.08 out of 10. The elimination of a small number of large escape events that occurred prior to 2010 means that the annual number of reported escapes since then has been low, with a maximum of 22 fish reported in one year (2016). Significant undetected or unreported trickle escapes are likely to occur; although dedicated monitoring is limited, there is no evidence for the presence of significant numbers of escaped farmed salmon in the wild in B.C. Large-scale escape events have not occurred in recent years in B.C.; nonetheless, they continue to occur globally from similar production systems, and the potential remains for escapes due to human error or bad weather. Atlantic salmon is non-native in B.C., but evidence increasingly shows the species is a poor colonizer outside of its native range. Despite repeated, intentional efforts over more than a century to establish Atlantic salmon for sport fishing, plus the large numbers of escapes in decades past, there is no evidence of ecological establishment in the Pacific. Although accepting that the impacts could be severe if Atlantic salmon were to become established in B.C., the available evidence indicates this is highly unlikely. Overall, the final score for Criterion 6 – Escapes is 5 out of 10. There is a growing body of research on the potential impacts of pathogens and parasites on wild salmon survival in B.C. and elsewhere, though gaps in understanding still exist. Mortality rates due to bacterial and viral pathogens on salmon farms in B.C. are low (at most, approximately half of the total monthly mortality rate from all causes of 1 to 1.5%), but the chronic presence of pathogens on farms, even without significant mortalities, can act as a reservoir of potential infection for wild fish. The most recent publication from key research under the Strategic Salmon Health Initiative (SSHI) on the identification of heart and skeletal muscle inflammation disease (HSMI) on a farm specifically states that the results cannot be used to infer the spatial extent of this disease or potential impacts on wild Pacific salmon, or with regard to bacterial and viral pathogens more broadly. Although a level of concern is warranted, there is currently no evidence that there is any impact from salmon farms to wild salmon. Importantly, there is also no evidence that there is no impact. Although direct cause and effect relationships between sea lice on farms and mortality of wild salmon have not been made due to the practical scientific challenges of demonstrating it, there is substantial modeling evidence that correlates the two. Uncertainty remains, though the salmon farming industry’s improved management since approximately 2003 has generally been considered successful in mitigating the risk of impact to wild salmon; however, the higher lice levels in 2015 (associated with anomalous higher water temperatures and poorly coordinated farm treatments) highlighted the fact that sea lice on farms are not fully under control. Although louse transfer from farms appears to have returned to pre-2015 levels in 2016 and to

6
date in 2017, the 2015 event demonstrated that the industry is still vulnerable to environmental variability. Understanding the impact of sea lice to individual fish and cumulatively to populations is challenging; the population dynamics of wild salmon in B.C. are extremely complex, and large stochastic fluctuations in abundance are associated with multifaceted oceanographic and biological conditions and inter-salmonid species interactions (in addition to direct human impacts including commercial fishing and habitat damage). Numerous complex factors relate to the mortality signature (e.g., salmon species, size, condition, lice stage, resistance to infection, predation, and competition). Though studies on direct mortality of wild fish due to sea lice indicate that this may be relatively low, the results of modeling studies that assess the overall mortality signature due to sea lice on farms (i.e., including increased predation and all other factors listed above) project a notable loss of returning fish (e.g., 23% of pink salmon in the Broughton Archipelago due to sea lice levels in 2015) as a result of high sea lice infection years. Nevertheless, the impact of these outbreak years on the longer-term population dynamics is uncertain. Considering the enormous stochastic variability in annual wild salmon returns, the apparently anomalous impact in 2015 (compared to the last decade) does not appear to directly affect the longer-term population size or its ability to recover. Overall, there is clearly a pathogen and parasite concern with regard to the location of salmon farms along migration routes of wild salmon, and this concern is highlighted by the importance of wild salmon. But after detailed consideration of the available data, they indicate that, although sea lice levels in particular are not fully under control and projected mortality in anomalous years can be substantial, there is currently insufficient evidence to conclude that population-level impacts to wild salmon are occurring due to pathogen and/or parasite transfer from salmon farms. The final score for Criterion 7 – Disease is 4 out of 10. Due to the industry-wide use of domesticated broodstock, the B.C. salmon farming industry is considered independent of wild salmon fisheries for the supply of adult or juvenile fish or eggs. The final score for Criterion 8X – Source of Stock is 0 out of –10. Harbor seal and sea lion mortalities have declined from a peak in the mid- to late 1990s of several hundred per year to six in 2016. The majority result from accidental entanglement, but lethal control (i.e., shooting) is licensed by DFO, and 15 California sea lions were killed at 1 site in 2015. Although distasteful, the current numbers are not considered to significantly affect the population size of these species. In 2016, three humpback whales became entangled in salmon farm equipment in B.C.; two of the whales died, and the third was released injured. The number of humpback whales has increased dramatically in B.C. waters, and the population has been increasing and recovering steadily since the end of commercial whaling, but is still listed as “Threatened” under Canada’s Species at Risk Act (SARA). Though undoubtedly a serious concern, and further entanglements are possible, the two recent mortalities are not considered to cause or contribute to further declines, or significantly affect the population size or its ability to recover. The final score for Criterion 10X – Wildlife and Predator Mortalities is an intermediate –4 out of –10.
7
Although there are no longer any salmon egg imports into B.C., the industry is considered dependent on the movements of live smolts between hatcheries and seawater growout sites. These movements take place at least partially between Salmonid Transfer Zones under transfer licenses, and though the open nature of net pen destinations sites has inherently low biosecurity, the tank-based hatcheries that represent the source of movements have higher biosecurity potential. Nevertheless, pathogens (e.g., PRV) are known to be transferred during these smolt movements, thus highlighting the limits of the biosecurity system. Therefore, even though introducing a novel secondary species into B.C. is considered a low risk, there is moderate concern about the movement of pathogens within B.C., and the final score for Criterion 10X (a combination of Factors 10Xa and 10Xb) is a deduction of –3.6 out of –10 (see the Seafood Watch Aquaculture Standard for further details on all scoring tables and calculations). Overall, the final numerical score is 4.28 out of 10 with one Red criterion score for Criterion 4 – Chemical Use. The final recommendation is therefore a yellow “Good Alternative.” All data points are available in Appendix 1, and all scoring tables and calculations are available in the Seafood Watch Aquaculture Standard.

8
Table of Contents Final Seafood Recommendation ..................................................................................................... 2
Executive Summary ......................................................................................................................... 3
Introduction .................................................................................................................................... 9
Scope of the Analysis and Ensuing Recommendation ........................................................... 9
Analysis ......................................................................................................................................... 12
Scoring Guide ....................................................................................................................... 12
Criterion 1: Data Quality and Availability ............................................................................ 13
Criterion 2: Effluent ............................................................................................................. 18
Criterion 3: Habitat .............................................................................................................. 26
Criterion 4: Evidence or Risk of Chemical Use ..................................................................... 30
Criterion 5: Feed .................................................................................................................. 43
Criterion 6: Escapes ............................................................................................................. 48
Criterion 7. Disease; Pathogen and Parasite Interactions ................................................... 56
Criterion 8X: Source of Stock – independence from wild fisheries ..................................... 85
Criterion 9X: Wildlife and Predator Mortalities ................................................................... 86
Criterion 10X: Escape of Secondary Species ........................................................................ 90
Overall Recommendation ............................................................................................................. 94
Acknowledgements ....................................................................................................................... 95
References .................................................................................................................................... 96
About Seafood Watch® ............................................................................................................... 111
Guiding Principles ....................................................................................................................... 112
Data Points And All Scoring Calculations .................................................................................... 114

9
Introduction
Scope of the Analysis and Ensuing Recommendation Species Atlantic salmon (Salmo salar) Geographic Coverage British Columbia (B.C.), Canada. Production Methods Marine net pens
Species Overview Brief overview of the species Atlantic salmon is native to the North Atlantic Ocean with high numbers of discrete genetic sub-populations through Western Europe in the NE Atlantic and the North America landmass in the NW Atlantic. It is non-native in British Columbia. Atlantic salmon is an anadromous species; birth and early life stages occur in freshwater rivers and streams, followed by a migration downstream and over long oceanic distances, where the bulk of feeding and growth takes place. After one or more years in the ocean, they return upriver to their original spawning ground to complete the cycle. Production system The majority of farmed salmon in B.C. are produced in floating net pens in coastal inshore environments, typical to the industry worldwide. The hatchery phase is conducted primarily in tank-based systems on land. According to the BCSFA (2016), there are 109 licensed sites in B.C. with approximately 60 active2 at any one time. Figure 1, copied from BCSFA (2016), shows the active sites in 2015.
2 Active sites are those with fish currently in the water.

10
Figure 1: Map of the production region in British Columbia showing Vancouver Island, and the mainland. Map
copied from BCSFA (2016).
Production statistics The B.C. Salmon Farmers Association’s (BCSFA) Sustainability Progress Report (BCSFA 2016) states that production of Atlantic salmon in 2015 was 76,000 metric tons (MT). Three companies (Marine Harvest, Cermaq/Mainstream, and Grieg) dominate in the region and provide production statistics in their annual reports that support the value above. A time series of B.C. production data collected from different sources up to 2016 is shown in Figure 2. The estimated production for 2016 is the same as 2015: approximately 76,000 MT (pers. comm., Jeremy Dunn, BCSFA 2017).

11
Figure 2: Approximate annual production of farmed salmon (all species) in B.C. Data to 2011 provided by the B.C.
Ministry of Agriculture and subsequently by DFO and BCSFA.
Import and export sources and statistics Farmed salmon is B.C.’s highest value agricultural export. Acccording to NOAA’s National Marine Fisheries Service import data, 81,3233 MT of Atlantic salmon were imported into the United States from Canada as a whole (i.e., including the East Coast production). The BCSFA reports 52,150 MT of farmed Atlantic salmon were exported to the United States by B.C. in 2015 (BCSFA 2016).
Common and Market Names
Scientific Name Salmo salar
Common Name Atlantic salmon
United States Atlantic salmon
Spanish Salmón del Atlántico
French Saumon de l'Atlantique
Japanese Taiseiyō sake
Product forms Atlantic salmon is available in all common fish presentations, particularly fillets, whole, and smoked.
3 The NMFS data include small quantities of “Salmon Atlantic fillet fresh wild” category, of which the true identity or source is uncertain. Therefore, there is a minor error in this total import figure.

12
Analysis Scoring Guide
With the exception of the exceptional criteria (8X, 9X and 10X), all scores result in a zero to ten final score for the criterion and the overall final rating. A zero score indicates poor performance, while a score of ten indicates high performance. In contrast, the three exceptional criteria result in negative scores from zero to minus ten, and in these cases zero indicates no negative impact.
The full Seafood Watch Aquaculture Standard that the following scores relate to are available on the Seafood Watch website. http://www.seafoodwatch.org/-/m/sfw/pdf/standard%20revision%20reference/mba_seafoodwatch_aquaculture%20criteria_finaldraft_tomsg.pdf?la=en
13
Criterion 1: Data Quality and Availability Impact, unit of sustainability and principle Impact: poor data quality and availability limits the ability to assess and understand the
impacts of aquaculture production. It also does not enable informed choices for seafood purchasers, nor enable businesses to be held accountable for their impacts.
Sustainability unit: the ability to make a robust sustainability assessment Principle: robust and up-to-date information on production practices and their impacts is
available to relevant stakeholders.
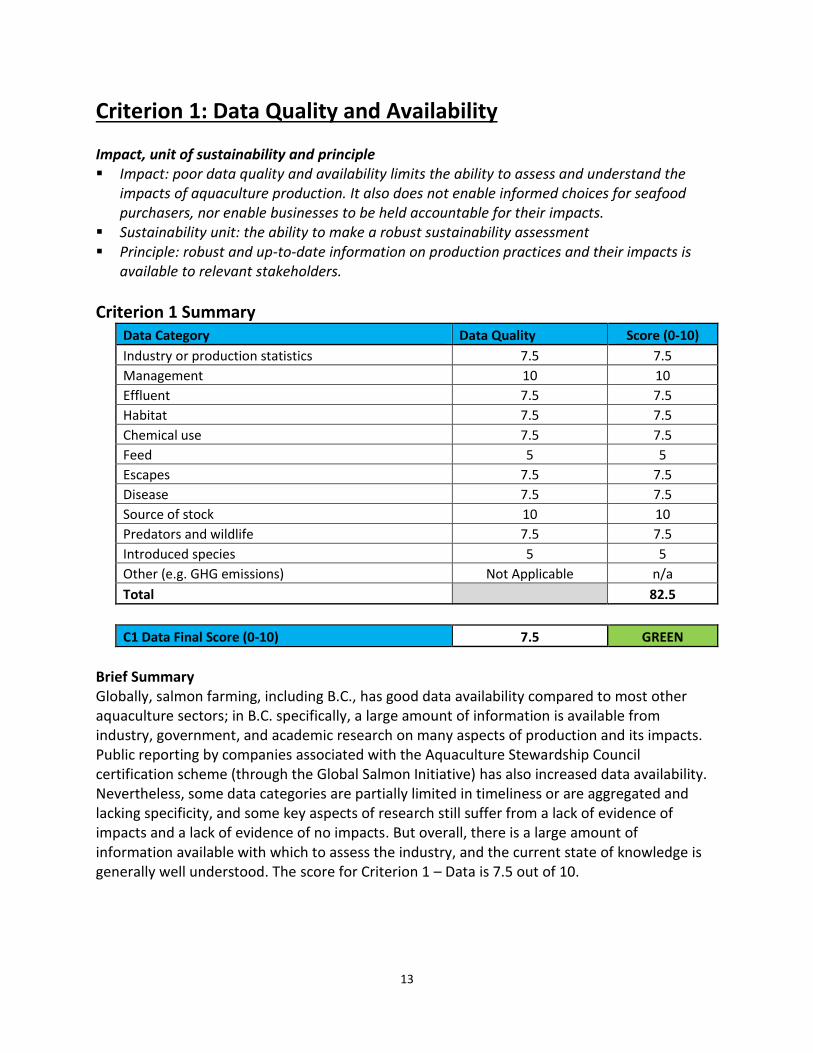
Criterion 1 Summary Data Category Data Quality Score (0-10)
Industry or production statistics 7.5 7.5
Management 10 10
Effluent 7.5 7.5
Habitat 7.5 7.5
Chemical use 7.5 7.5
Feed 5 5
Escapes 7.5 7.5
Disease 7.5 7.5
Source of stock 10 10
Predators and wildlife 7.5 7.5
Introduced species 5 5
Other (e.g. GHG emissions) Not Applicable n/a
Total 82.5
C1 Data Final Score (0-10) 7.5 GREEN
Brief Summary Globally, salmon farming, including B.C., has good data availability compared to most other aquaculture sectors; in B.C. specifically, a large amount of information is available from industry, government, and academic research on many aspects of production and its impacts. Public reporting by companies associated with the Aquaculture Stewardship Council certification scheme (through the Global Salmon Initiative) has also increased data availability. Nevertheless, some data categories are partially limited in timeliness or are aggregated and lacking specificity, and some key aspects of research still suffer from a lack of evidence of impacts and a lack of evidence of no impacts. But overall, there is a large amount of information available with which to assess the industry, and the current state of knowledge is generally well understood. The score for Criterion 1 – Data is 7.5 out of 10.

14
Justification of Ranking See the Seafood Watch Aquaculture Standard for further details on all scoring tables and calculations. Industry and Production Statistics Information on annual total production and the number of sites and their locations is available in the B.C. Salmon Farmers Association’s annual Sustainability Progress Report (BCSFA 2016a). More specific information from the three major companies in B.C. is available in annual reports and/or sustainability reports, which, in addition to their websites, include specific data on production volumes, site locations and maps, and a variety of other data included below. Canada’s Department of Fisheries and Oceans (DFO)4 has a Pacific region website covering aquaculture in B.C.,5 which also has production statistics and maps of sites, although these are not updated as regularly as the website. Although production statistics are typically aggregated by year (or by company), maps of active sites during the March–June wild salmon outmigration period are available from BCSFA.6 The data score for the industry and production statistics is 7.5 out of 10. Management and Regulations A large amount of information on aquaculture regulation in Canada and specifically in B.C. is available from DFO and the Pacific region7 websites, with evidence of enforcement in the form of monitoring and/or audit data.8 The BCSFA website has further information about farm-level management practices. Overall, general production and management are well understood, and complete information on the regulatory system is available. The data score for management and regulations is 10 out of 10. Effluent and Habitat There is no regulatory requirement for monitoring soluble effluent in B.C. (historical evidence behind that decision is available, e.g., (Brooks and Mahnken 2003). DFO’s website has industry-reported benthic monitoring results (typically conducted by third-party companies9) and the results of DFO’s audit. DFO has information on the regulatory management of effluent, including site separation, and there is a substantial body of academic literature on salmon net pen nutrient wastes, e.g., (Price et al. 2015) (Keeley et al. 2015). Key studies from other regions, e.g., (Husa et al. 2014) from Norway, can be carefully used to make comparisons to B.C.’s scale of production. In B.C., references such as Backman et al. (2009) provide context, and recent papers such as Foreman et al. (2015) provide useful information about the models used in siting farms. Overall, there is both useful background information on effluents and specific site data for benthic impacts in B.C. The data scores for the Effluent and Habitat criteria are both 7.5 out of 10.
4 www.dfo-mpo.gc.ca 5 http://www.pac.dfo-mpo.gc.ca/aquaculture/index-eng.html 6 http://bcsalmonfarmers.ca/wp-content/uploads/2015/01/Out-Migration-Sites-2007-15-.pdf 7 http://laws-lois.justice.gc.ca/eng/regulations/SOR-2010-270/ 8 http://www.pac.dfo-mpo.gc.ca/aquaculture/reporting-rapports/index-eng.html 9 http://www.pac.dfo-mpo.gc.ca/aquaculture/index-eng.html

15
Chemical Use Publicly available data on the DFO website10 were last updated in 2014. The BCSFA has antibiotic data to 2015 in its 2016 Sustainability Progress Report,11 but in a graphical format that requires some estimation of specific values. For the purposes of this Seafood Watch assessment, the B.C. Ministry of Agriculture provided a time series of antibiotic data for all species from 2003 to 2016, and specifically for Atlantic salmon in 2016. In addition, aggregated data on annual antibiotic use by B.C.’s three main companies, in terms of average use of active ingredient per ton of production (g/MT), are available in company reports for recent years, but the type of antibiotics used are typically not specified. Data on the frequency of use of antibiotics by the three main companies are available from the Global Salmon Initiative website for the years 2013–2016.12 Similarly, pesticide use data are also dated and non-specific on the DFO website; the BCSFA has data for 2015, and the Global Salmon Initiative (GSI) has data for 2013–2015, but the B.C. Ministry of Agriculture provided a time-series of pesticide use (emamectin benzoate) from 2003 to 2016. A few data points on pesticide use are also available in company reports. Regarding the ecological impacts of such chemical use, some scientific literature from other regions is relevant, e.g., (SARF098 2016) from Scotland, but must be used carefully in the context of B.C., and a single study on the emamectin dynamic in B.C. was conducted by DFO. Overall, total chemical use can be reasonably and accurately determined up to 2015, and in some cases 2016, although there is limited specificity or understanding of the potential impacts from the current scale of use. The data score for Chemical Use is 7.5 out of 10. Feed Data requests were made to three major feed companies in B.C. and provided by one. BCSFA provides some aggregated parameters, and GSI also has forage fish efficiency ratio (FFER) values for comparison. Specific data points on fishmeal and fish oil inclusion levels were available in one company annual report,13 and general information on the sources of marine ingredients. A feed conversion ratio (FCR) was provided by the feed company and by BCSFA (2016). With complete data from only one company, there is a risk that the data are not fully representative of the national industry, but comparable values from BCSFA and GSI can be used for some validation or averaged where appropriate. The data score for Feed is 5 out of 10. Escapes DFO provides data on escapes since 2011,14 and company annual reports provide similar information.15 Previous years can be extracted from various publications, particularly Piccolo and Orlikowska (2012). The potential for undetected or unreported trickle losses can be inferred from peer-reviewed literature, particularly Skilbrei and Wennevik (2006) and Skilbrei et
10 http://www.pac.dfo-mpo.gc.ca/aquaculture/reporting-rapports/health-sante/therapeut-eng.html 11 www.bcsalmonfarmers.ca. 12 http://globalsalmoninitiative.org/sustainability-report/sustainability-indicators/ 13 http://marineharvest.com/investor/annual-reports/ 14 http://www.pac.dfo-mpo.gc.ca/aquaculture/reporting-rapports/escape-evasion-eng.html 15 E.g., https://www.cermaq.com/wps/wcm/connect/cermaq-ca/cermaq-canada/our-promise/public-reporting

16
al. (2015). There is no information available on recaptures because these fishing efforts are not permitted by DFO. There is a substantial amount of information available on the potential establishment of Atlantic salmon in B.C., but little concrete evidence. Results of earlier sampling periods reported in Volpe et al. (2000, 2001) and Fischer et al. (2014) are now dated, yet remain valid examples. More recent surveys are available in Andres (2015), and various studies on feeding success of Atlantic salmon can be used to assess the likelihood of post-escape impacts through predation and/or competition for resources. Despite not looking at Atlantic salmon juveniles, studies on juvenile wild salmon in B.C. for various aspects, such as sea lice, have not reported any. Although the available information does not give full confidence that the impact of escapes is understood, the data score for Escapes is 7.5 out of 10. Disease DFO16 provides average monthly mortality rates by Fish Health Zone and carcass classification according to a number of categories, from which potential disease-related mortality can be estimated. The Canadian Food Inspection Agency (CFIA) provides information and data on reportable diseases and the results of reported events and health plan audits. The BCSFA website contains information on diseases affecting farmed salmon on farms, links to reported data, and selected background papers for reference. Information on potential impacts of bacterial and viral pathogens to wild fish in B.C. is limited, but research on pathogens in both wild and farmed fish is developing, including projects such as the Strategic Salmon Health Initiative.17 DFO provides data on sea lice monitoring in farms, including audit counts, with monthly average levels provided for every site and by different categories of lice. The three main farming companies in B.C. also provide similar sea lice monitoring data at varying levels of detail, mostly at the site level, with monthly averages of motile and adult females; some with limited coverage of sites or time periods (e.g., less coverage outside the March–June migration periods). There is also a continuously evolving body of research on the pathogen and parasite dynamics of salmon farms in B.C. and their potential impacts to wild salmon individuals and populations. This includes annual monitoring of sea lice levels on wild juvenile salmon in multiple regions of B.C. In addition, there are many equivalent bodies of literature on the multitude of other factors known to play a role in the complex population dynamics of B.C.’s wild salmon populations. Despite the continuing unknowns, and though some research continues to be directly contradictory, the volume of research is impressive and the conclusions regarding potential impacts of salmon farms can now be more robustly made than was possible in preceding years. The data score for Disease is 7.5 out of 10. Source of Stock From a global perspective, it is now understood that farmed Atlantic salmon eggs and smolts are produced by domesticated broodstocks, and are therefore independent of wild salmon
16 http://www.pac.dfo-mpo.gc.ca/aquaculture/reporting-rapports/health-sante/mort-eng.html 17 https://www.psf.ca/what-we-do/strategic-salmon-health-initiative
17
populations. There is also literature available detailing selective breeding strategies and programs. The data score for Source of Stock is 10 out of 10. Wildlife and Predator Mortalities DFO18 provides data on deliberate and accidental mortalities of marine mammals, including harbor seals, California sea lions, Steller sea lions, and cetaceans. The data are updated quarterly with a time lag of approximately 1 year. Additional information on licensing and management policies are also available from the same website. Detailed mortality data for all types of wildlife are available from some farming companies, particularly for sites involved with Aquaculture Stewardship Council certification (for example, Cermaq19). More recent events, prior to publication by DFO, can also be identified through media news reports from the region (for example, whale entanglements in B.C. in 2016 were reported in the news prior to updates to the DFO website). Information on population numbers and potential population impacts are available from a variety of sources, such as the Committee on the Status of Endangered Wildlife in Canada (COSEWIC). Although it is possible that some mortalities are unreported, the data score for Wildlife and Predator Mortalities is 7.5 out of 10. Unintentionally Introduced Species DFO published data on egg imports until 2012. BCSFA reports on their website (accessed January 2016) that there have been no egg imports since 2009. Fish movements between freshwater hatcheries and marine sites are also considered, and information on fish health zones and fish transfer zones is available from CFIA20 and on transfer activities from DFO21 (most recent data are from 2015). In addition, DFO’s classification of Atlantic salmon as a “low risk” species is available.22 Information on movements between marine nursery and growout sites is not available. The data score is 5 out of 10. Conclusions and Final Score A large amount of information is available from industry, government, and academic research on many aspects of production and its impacts. Public reporting by companies associated with the Aquaculture Stewardship Council certification scheme has also increased data availability. Nevertheless, some data categories are partially limited in timeliness or are aggregated and lacking specificity, and some key aspects of research still suffer from a lack of evidence of impacts and a lack of evidence of no impacts. But overall, a large amount of information is available with which to assess the industry, and the current state of knowledge is generally well understood. The score for Criterion 1 – Data is 7.5 out of 10.
18 http://www.pac.dfo-mpo.gc.ca/aquaculture/reporting-rapports/mar_mamm-eng.htm 19 https://www.cermaq.com/wps/wcm/connect/cermaq-ca/cermaq-canada/our-promise/public-reporting 20 http://www.inspection.gc.ca/animals/aquatic-animals/domestic-movements/eng/1450122972517/1450122973466 21 http://www.pac.dfo-mpo.gc.ca/aquaculture/reporting-rapports/intro-trans-eng.html 22 http://webcache.googleusercontent.com/search?q=cache:http://www.pac.dfo-mpo.gc.ca/aquaculture/licence-permis/intro-trans/species-especes-eng.html&gws_rd=cr&ei=4pCbWL7FCojVgAbtnJXACQ

18
Criterion 2: Effluent Impact, unit of sustainability and principle Impact: aquaculture species, production systems and management methods vary in the
amount of waste produced and discharged per unit of production. The combined discharge of farms, groups of farms or industries contributes to local and regional nutrient loads.
Sustainability unit: the carrying or assimilative capacity of the local and regional receiving waters beyond the farm or its allowable zone of effect
Principle: aquaculture operations minimize or avoid the production and discharge of wastes at the farm level in combination with an effective management or regulatory system to control the location, scale and cumulative impacts of the industry’s waste discharges beyond the immediate vicinity of the farm.
Criterion 2 Summary Effluent Risk-Based Assessment
Effluent parameters Value Score
F2.1a Waste (nitrogen) production per of fish (kg N ton-1) 56.4
F2.1b Waste discharged from farm (%) 80
F2 .1 Waste discharge score (0-10) 5
F2.2a Content of regulations (0-5) 4
F2.2b Enforcement of regulations (0-5) 4
F2.2 Regulatory or management effectiveness score (0-10) 6.4
C2 Effluent Final Score (0-10) 6.0
Critical? NO YELLOW
Brief Summary Salmon farms in B.C. discharge an estimated 45 kg of nitrogen per ton of production, and though academic studies indicate that the risk of impact beyond the immediate farm area is low, they also highlight the potential for as-yet poorly understood impacts to nutrient ratios and bacterial communities at the site and/or cumulatively at the waterbody scale. The regulatory system in B.C. falls under the Department of Fisheries and Oceans (DFO) and is intended to protect vulnerable habitats, and to require farms to demonstrate minimal impacts on the seabed beyond the immediate farm area at peak biomass. Monitoring of nutrients in the water column is not required due to the previous lack of detectable levels >30 m from the net pens, but seabed monitoring (which is typically conducted by third-party companies) is subjected to enforcement audits by DFO at approximately 50% of active farms each year. Overall, the results in 2015 showed that 79% of sites were fully compliant at every sampling location, and 21% of sites had at least one sample of sulfide levels at 30 m that would be considered sufficient to decrease species diversity, or benthic habitats that were not considered normal at 125 m. These sites must be sampled again and shown to be compliant before restocking is permitted. Potential cumulative impacts are primarily addressed by each Canadian province with minimum site separation distances of 3 km (in most cases). and B.C.

19
now has two ecosystem-based management plans in place covering the majority of the salmon farming sector: the Pacific North Coast Integrated Management Area (PNCIMA) and the Marine Planning Partnership for the North Pacific Coast (MaPP). The practical outcomes of these plans are not yet known, but the regulatory content and enforcement indicate that cumulative impacts are unlikely. The final score for the Criterion 2 – Effluent is 6 out of 10.
Justification of Ranking The Effluent Criterion considers impacts of farm wastes beyond the immediate farm area or outside a regulatory allowable zone of effect, and the subsequent Habitat Criterion considers impacts within the immediate farm area. Although the two criteria cover different impact locations, some overlap is inevitable between them in terms of monitoring data and scientific studies on soluble and particulate wastes. The majority of this information will be presented in this Effluent Criterion, with the intent of minimizing (but not entirely avoiding) replication in the Habitat Criterion. See the Seafood Watch Aquaculture Standard for further details on all scoring tables and calculations. There is a substantial body of literature on the fate and impact of nutrient wastes from net pen fish farms, including salmon farms, and key recent reviews such as Price et al. (2015) provide a useful summary. Price et al. (2015) conclude that modern operating conditions have minimized impacts of individual fish farms on marine water quality; effects on dissolved oxygen and turbidity have been largely eliminated through better management, and near-field nutrient enrichment of the water column is usually not detectable beyond 100 m from the farm (when formulated feeds are used, feed waste is minimized, and farms are properly sited in deep waters with flushing currents). However, when sited near shore, extra care should be taken to manage farm location, size, biomass, feeding protocols, orientation with respect to prevailing currents, and water depth to minimize near- and far-field impacts. Price et al. caution that, regardless of location, other environmental risks may still face this industry; for example, significant questions remain about the additive (i.e., cumulative) impacts of discharge from proximal farms, potentially leading to increased primary production and eutrophication. In B.C., Backman et al. (2009) note that introduced soluble wastes do not normally cause environmental impact concerns where naturally high levels of dissolved inorganic nitrogen occur (as a result of upwelling), or where primary production is generally light to limited, and/or where the receiving water volume is capable of assimilating these nutrients. Brooks and Mahnken (2003) showed “in no case was dissolved inorganic nitrogen significantly increased at >30 m downcurrent when compared to upcurrent reference,” and concluded that outside of shallow, poorly flushed environments (which are poor locations for growing fish and therefore no longer used by B.C. farmers), the potential for net pen enhancement of phytoplankton populations is remote or nonexistent. Brooks (2007) calculated that 15.8 t/day of dissolved inorganic nutrients are released from salmon farms in B.C., which was considered negligible in comparison to ≈2,000 t/day delivered via upwelling. The same study concluded: “primary production in the Northeast Pacific is generally light and not nutrient limited and salmon aquaculture has minimal potential to affect phytoplankton production in much of this region.”
20
Although some studies such as Husa et al. (2014), in much more densely farmed regions, also show little direct impacts (for example, the Hardangerfjord in Norway, where a single fjord produces more salmon than the B.C. region combined—approximately 80,000 MT), others emphasize the importance of less well-studied impacts of salmon farm effluent, including changes to the natural nutrient ratios and the effects on microbial communities and food webs, e.g., in Chile (Elizondo-Patrone et al. 2015) (Niklitschek et al. 2013) (Mayr et al. 2014). It must be noted that studies in Chile or Norway must be used with caution in comparison to B.C., due to different densities of production and other geographic and hydrographic conditions. Recent research in B.C., using novel methods to detect changes in the fatty acid composition of resident (wild) marine organisms consuming aquaculture feed waste and fecal particles, shows the expected pattern of decreasing effects with increasing distance from the farms, with a limit of detection at a maximum of approximately 750 m (Colombo et al. 2016). Though benthic impacts in the immediate farm area are monitored (see Factor 2.2), and the results can be used to give an indication of likely impacts beyond the allowable zone of effect, there are no available data on nutrient levels in the water column. Therefore, the Risk-Based Assessment option is used for Criterion 2 – Effluent, which incorporates the effectiveness of the regulatory and management systems. Factor 2.1ac. Waste discharged per ton of fish production Factor 2.1 assesses the amount of nitrogenous waste produced by the fish (Factor 2.1a) and then the amount of that waste that is discharged from the immediate vicinity of the farm (Factor 2.1b). Factor 2.1a – Biological waste production per ton of fish Using a feed protein content of 43%, and an economic Feed Conversion Ratio (eFCR) of 1.25 (see Feed Criterion for further information on these values), the total protein input in feed per ton of fish harvested is 537.5 kg. Because protein is 16% nitrogen, the total nitrogen input in feed is 86.0 kg N per ton of production. The protein content of whole farmed salmon is 18.5% (Boyd 2007), or 185 kg per ton. Considering the aforementioned nitrogen content of protein, the nitrogen recovered in harvested fish is 29.6 kg N per ton of production. The net loss of nitrogen in soluble and particulate wastes is therefore 56.4 kg N per ton of production. Factor 2.1b – Production system discharge In net pen production systems, the Seafood Watch Aquaculture Standard considers 80% of discharged waste (i.e., 45.12 kg N) to have the potential to impact beyond the immediate farm area (in both soluble and particulate forms). Factor 2.1a and 2.1b combine to result in a Waste Discharge Score for Factor 2.1 of 5 out of 10.

21
Factor 2.2. Management of farm-level and cumulative impacts Factor 2.2a assesses the content of the farm-level and regulatory management measures, and Factor 2.2b assesses the enforcement of those management measures. Combined, they give an indication of the effectiveness of the management system overall to control cumulative impacts from the total tonnage of production of individual sites, and from multiple sites that share one receiving water body, area, or region. Factor 2.2a: Content of effluent management measures The Department of Fisheries and Oceans Canada (DFO) is responsible for regulating and managing the aquaculture industry in B.C. These responsibilities include the licensing of aquaculture sites and the conditions of licensure. In addition to the conditions set out in subsection 22(1) of the Fishery (General) Regulations, the Minister may specify additional conditions in an aquaculture license, including the waters in which aquaculture is permitted (siting), and measures that must be taken to minimize the impact of the operations on fish and fish habitat (Foreman et al. 2015). For DFO, the Fishery (General) Regulations (FGR), Pacific Aquaculture Regulations, and Aquaculture Activities Regulations (AAR) are the principal Fisheries Act regulations governing the activity of marine finfish aquaculture in British Columbia. In addition to the requirements of the Species at Risk Act (SARA) and the principles of the Oceans Act, these regulations frame the management and regulation of aquaculture activities on the Pacific coast of Canada. Although more specific hydrodynamic modeling systems are under development for key farming regions in B.C. (Kyuquot Sound, Broughton Archipelago, and Discovery Islands regions), the current siting criteria are a set of generic considerations that are applied on a coast-wide basis (Foreman et al. 2015). For new sites, recent revisions to the siting guidelines23 (June 2015) now include broad provisions for impact minimization, including:
Require the proponent of each application to conduct surveys, undertake analyses, and
submit a set of comprehensive reports detailing the physical and biological characteristics of
the ecosystem beneath and around the proposed site location.
Aquaculture facilities should be capable of meeting performance measures for benthic
conditions, as identified in the Aquaculture Activities Regulations, to mitigate impact to the
ecosystem below the facility.
The predicted footprint of increased deposition should be located in water depth of greater
than 30 m to mitigate potential impacts to shallow water habitats.
Placement and operation of the proposed aquaculture facility should not impact Species at
Risk Act (SARA) listed species.
23 DFO Siting Guidelines for Marine Finfish Aquaculture in British Columbia http://www.pac.dfo-mpo.gc.ca/aquaculture/licence-permis/site-guide-direct-eng.html

22
Aquaculture facilities should be located at least three kilometres from an existing marine
finfish facility or operate under co-ordinated Health Management Plans.
Regarding the last of those guidelines, the separation can be less than 3 km in some cases where there are coordinated Health Management Plans, and the previous guidelines permitted a minimum separation of 1 km between sites if they were owned by the same company. Provincial guidelines still specify the 3-km separation, but in practical terms, a visual assessment and measurement of farm site separation in the main farming areas of B.C. using Google Earth (as evidenced by visible net pen structures) indicated few examples where operational farms were less than 3 km apart. For existing operational sites in B.C., there are no requirements for the monitoring of dissolved nutrients in the water column or their impacts (Day et al. 2015). After studies in B.C. and Washington State (e.g., Brooks and Mahnken 2003) did not detect significant nutrient levels more than 30 m downstream of the net pens, the requirements for water column monitoring were dropped from the regulations. Benthic monitoring is required, and such requirements are detailed in the “Program Protocols for Marine Finfish Environmental Monitoring in British Columbia,” available in DFO’s Aquaculture Activities Regulations (AAR) guidance document.24 Sampling is required once every production cycle within 30 days of peak feeding rates. Specific sampling details apply to both direct sediment sampling on soft substrates and visual (video) surveys of harder erosional substrates; sampling transects and distances from the net pens are specified in detail. In brief, the direct sampling is based primarily on the measurement of free sulfides with regulatory thresholds at 30 m and 125 m, designed so that benthic recovery can occur when fish are removed and the site fallowed. Visual surveys operate on at least two transects extending from the edge of the net pens, and focus on the presence of Beggiatoa bacterial mats and marine worms (opportunistic polychaete complexes, OPC), both of which are indicative of organic enrichment, in a compliance zone between 100 and 125 m. If any single sample exceeds the threshold levels, the site is required to undertake an additional survey prior to restocking the site in the subsequent production cycle. In regard to potential impacts beyond the immediate farm area considered in the Effluent Criterion, the results at 30 m and at 125 m provide useful information on the likely impacts. Regarding potential cumulative impacts, the primary tool in B.C. is the separation distance between sites; at 3 km, this is more than twice the distance that any nutrients from farms in B.C. have been detected (two farms 3 km apart have the potential to overlap at 1.5 km from each). Quoted above, Colombo et al. (2016) showed a limit of detection at a maximum of approximately 750 m using novel methods to detect changes in the fatty acid composition of resident marine organisms consuming aquaculture feed waste and fecal particles.
24 http://www.dfo-mpo.gc.ca/aquaculture/management-gestion/aar-raa-gd-eng.htm#annex8.2
23
In addition, B.C. now has two separate ecosystem-based management plans in place covering the majority of the salmon farming sector—the Pacific North Coast Integrated Management Area (PNCIMA25) and the Marine Planning Partnership for the North Pacific Coast (MaPP26). The MaPP initiative is a partnership between the Province of British Columbia, 17 member First Nations, and the “North Coast Vancouver Island Marine Plan” (one of four area plans), which covers a large part of the B.C. salmon industry. The plan’s purpose is to “provide spatial and non-spatial recommendations for achieving ecosystem-based marine management that maintains social and cultural well-being and economic development based on healthy ecosystems within the plan area over the long term.” Aquaculture is considered, among other relevant industries, as part of area management of pollution, and as a stand-alone industry with environmental needs of its own. The MaPP initiative was formalized in November 2011, and the Marine Plan was published in 2015. The PNCIMA project is a collaborative governance framework between federal, provincial, and First Nations governments, and the plan is “high level and strategic in nature, providing direction on and commitment to integrated, ecosystem-based and adaptive management of marine activities and resources in the planning area.” The intended role of the plan is to provide an overarching EBM framework that is available to guide planning and management at these scales. The outcomes of these projects are not yet clear, but they are an encouraging development. Overall, B.C.’s regulatory content is focused on benthic impacts, and though water column monitoring is not required, its absence appears to be appropriately based on the primary risks identified in scientific studies. Although there is inevitably some potential for impacts that are not yet fully understood, including potential cumulative impacts, the regulatory systems mostly seem to address the scale and density of production in B.C. Until more is known about the activities of MaPP and PNCIMA, a score of 5 out of 5 is not justified, and the score for Factor 2.2a is therefore 4 out of 5. Factor 2.2b Enforcement of effluent management measures “Aquaculture Regulation and Enforcement Activities” are described on DFO’s website27 with annual enforcement activities including “Benthic (seabed) site assessments.” The most recent publicly available data for 2014 show (of approximately 60 active sites) that DFO audited 26 marine finfish sites. Self-reported monitoring results (typically conducted by contracted third-party specialists) are available quarterly from DFO28; Figure 3 shows data compiled from 2011 to 2015, with an average of approximately 80% of sites fully compliant with the threshold limits at every sampling location. The results from 2015 (48 sites sampled at peak biomass) show 10 sites (21%) where sulfide levels at one or more of the sampling points at a distance of 30 m from the net pen array would be considered sufficient to decrease species diversity, or where benthic
25 www.pncima.org 26 www.mappocean.org 27 http://www.pac.dfo-mpo.gc.ca/aquaculture/enforcement-application-eng.html#activities 28 DFO Benthic impacts from aquaculture sites http://www.pac.dfo-mpo.gc.ca/aquaculture/reporting-rapports/benth-eng.htm

24
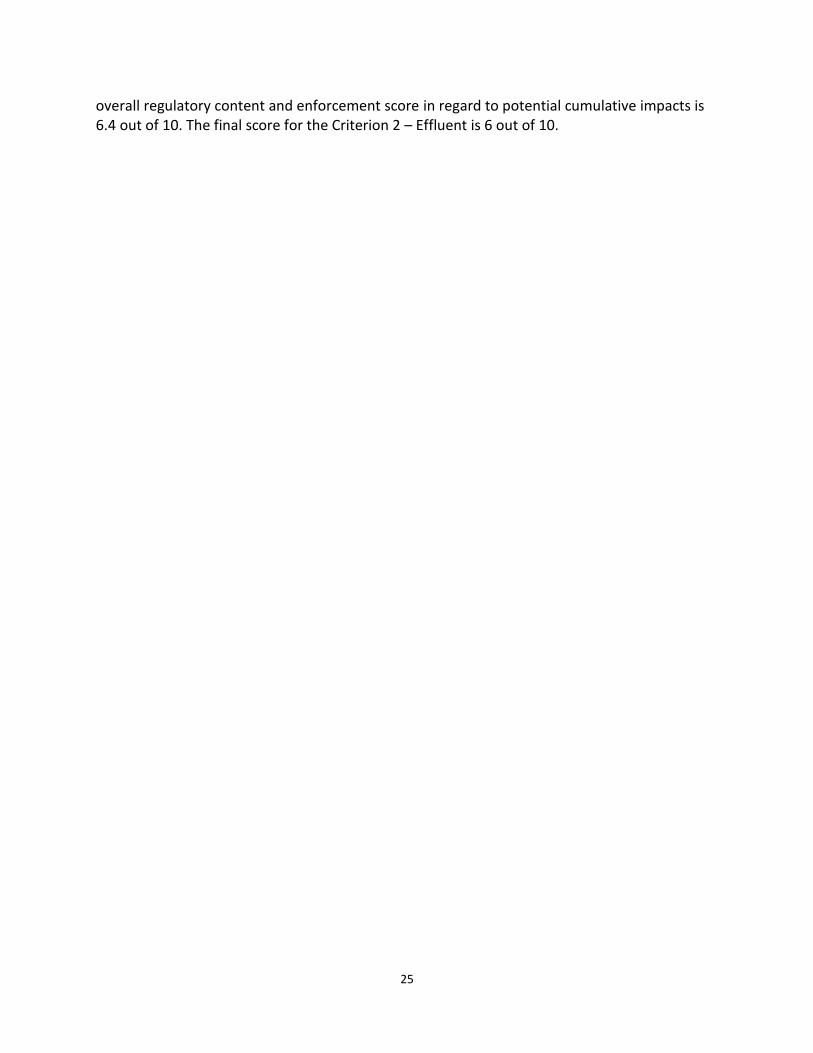
habitats were not considered normal at one or more of the sampling points at 125 m (according to DFO thresholds). Over the 5-year period (2011 to 2015), this percentage of sites with one failed sample varied between 7.5% and 21% (see Figure 3). Additional surveys are required at these sites to demonstrate recovery and compliance before restocking the site is permitted. Considering the 48 sites that reached peak biomass in 2015, DFO’s audit of 26 sites (in 2014) indicates approximately half of the benthic monitoring samples were audited.
Figure 3: Percentage of B.C. salmon sites fully compliant at all sampling points with the regulatory threshold for
free sulfides. Data from DFO.
Overall, these results show active enforcement at the site level with effective control of benthic impacts at peak production and prior to restocking. With limited area-based regulation other than site separation distances, enforcement does not appear to be fully active at an area or regional cumulative impact level at present. The score for Factor 2.2b is 4 out of 5. Factor 2.2 Conclusion The final score for Factor 2.2 combines the scores for the regulatory content (Factor 2.2a) with the effectiveness of the enforcement (Factor 2.2b). In B.C. salmon farming, the score reflects the substantial regulatory requirements at the site level, but also the limited coverage of potential cumulative impacts from multiple sites at the waterbody or regional level. Ultimately, the score for Factor 2.2 is 6.4 out of 10. Conclusions and Final Score Based on the protein content of salmon feed, the protein recovery in harvested fish, and the percentage of wastes that leave the farm boundary, there is an estimated discharge of 45.1 kg of nitrogen per ton of production in B.C. The regulatory system does not require monitoring of nutrients in the water column due to the lack of detectable levels, but benthic impacts must be monitored and enforcement is apparent in publicly available data. Although the results of incorporating aquaculture into two ecosystem-based management plans are not yet clear, the
0
10
20
30
40
50
60
70
80
90
100
2011 2012 2013 2014 2015
Per
cen
tage
of
site
s
Percentage of sites fully compliant at all sampling points
25
overall regulatory content and enforcement score in regard to potential cumulative impacts is 6.4 out of 10. The final score for the Criterion 2 – Effluent is 6 out of 10.

26
Criterion 3: Habitat Impact, unit of sustainability and principle Impact: Aquaculture farms can be located in a wide variety of aquatic and terrestrial habitat
types and have greatly varying levels of impact to both pristine and previously modified habitats and to the critical “ecosystem services” they provide.
Sustainability unit: The ability to maintain the critical ecosystem services relevant to the habitat type.
Principle: Aquaculture operations are located at sites, scales and intensities that cumulatively maintain the functionality of ecologically valuable habitats.
Criterion 3 Summary Habitat parameters Value Score
F3.1 Habitat conversion and function 7.00
F3.2a Content of habitat regulations 4
F3.2b Enforcement of habitat regulations 4
F3.2 Regulatory or management effectiveness score 6.4
C3 Habitat Final Score 6.8 GREEN
Critical? NO
Brief Summary Floating net pens have a minimal direct physical habitat impact, but farm sites in B.C. are often closely associated with important migratory corridors for juvenile salmon (see Criterion 7 – Disease). There are immediate seabed habitat impacts from settling particulate wastes within their allowable zones of effect, and benthic monitoring is required at peak biomass in every production cycle. Each site must meet regulatory thresholds at that time, or before restocking is permitted. The benthic impacts are considered relatively quickly reversible by fallowing or by breaks in production, and the total area of salmon farms in B.C. is small compared to the total coastal resource. Site separation distances indicate that the potential for cumulative impacts are low, whether from adjacent sites or from the industry’s total impact area. The reversibility of benthic impacts combined with the regulatory system result in a final score for Criterion 3 – Habitat of 6.8 out of 10. Justification of Ranking The floating net pens used in salmon farming have relatively few direct impacts on the habitats in which they are sited, but there are operational impacts on the benthic habitats below the farm and/or within an allowable zone of effect (AZE). There is inevitably some overlap in the information used between the Effluent and Habitat Criteria because the source of the impact in both cases is the same (i.e., uneaten feed and fish waste). This Habitat Criterion assesses impacts within an area directly under the farm and within a regulatory AZE. See the Seafood Watch Aquaculture Standard for further details on all scoring tables and calculations.

27
Factor 3.1. Habitat conversion and function Intensive fish farming activities generate a localized gradient of organic enrichment in the underlying and adjacent sediments as a result of settling particulate wastes (primarily feces), and strongly influence the abundance and diversity of infaunal communities. In the area under the net pens or within the regulatory AZE, the impacts may be profound, but are now relatively well understood (Black et al. 2008) (Backman et al. 2009) (Keeley et al. 2013) (Keeley et al. 2015). Primarily, changes can be anticipated in total volatile solids, redox potential, and sulfur chemistry in the sediments in the immediate vicinity of operational net pens, along with changes to the species composition, total taxa, abundance, and total biomass (Keeley et al. 2013). Significant decreases in both the abundance and diversity of macrofauna are sometimes seen under farms located in depositional areas, characterized by slow currents and fine-grained sediments, while net pens located in erosional environments with fast currents and sediments dominated by rock, cobble, gravel, and shell hash can dramatically increase macrobenthic production (Keeley et al. 2013). According to DFO (2012a), B.C.’s total lease area (for 174 marine finfish site tenures at that time, of which only 60 to 80 were actively producing salmon) covered 4,575 ha of coastal area in 2010/2011. Without performing a specific calculation, this area can be considered relatively small compared to the total area of B.C.’s inshore waters; however, it must also be emphasized that the farms occupy areas highlighted as being particularly important habitats for the confined migration routes of wild salmon. As described in the Effluent Criterion above, industry self-conducted and self-reported benthic monitoring data (audited by DFO at a most-recent site frequency of approximately 50%) show a low number of sites (approximately 20%) where one or more of the sampling points indicated pollution sufficient to decrease species diversity at a distance of 30 m, or indicated non-normal conditions at 125 m from the net pens’ edges. It is a requirement of the benthic sampling program to take samples at the edge of the net pens (i.e., at 0 m) and to provide these data to DFO for information (they are not part of the compliance requirements). But these assessments appear to accept that the area within 30 m, and particularly the area directly below the net pens, may be more heavily impacted as an AZE. It is now a globally common practice for farm sites to be fallowed between production cycles for a variety of reasons (e.g., breaking parasite life cycles in addition to benthic recovery). The Aquaculture Activities Regulations guidance document29 does not mandate a fallow period in B.C.; instead, all sites must be shown to be compliant with the thresholds before restocking. According to Brooks and Mahnken (2003), chemical and biological remediation in B.C. has been shown to occur naturally during fallow periods at every salmon farm studied, but Keeley et al. (2015) showed that, although significant recovery was evident at the fallowed site in the first six months, full recovery is often not completed before restocking occurs. This can create a complex “boom and bust” cycle of opportunistic taxa as one production cycle ceases (at harvest) and is then reestablished (at restocking). For full recovery, Keeley et al. (2015) and
29 http://www.dfo-mpo.gc.ca/aquaculture/management-gestion/aar-raa-gd-eng.htm#monitoring

28
references show that estimates vary between 6 months and 5 years or more, and are highly specific to the environment and the situation. Whether fallow periods are used or not, the regulatory system in B.C. is still intended to prevent unacceptable impacts to benthic habitats over long periods (multiple production cycles) by ensuring that all sites either meet the thresholds at peak biomass or before restocking, if necessary. Though this may maintain an ongoing impact, Keeley et al. (2015) show these impacts are not irreversible and relatively quickly reversible by reducing the load, fallowing, and/or removing the farm. Although it is clear that sites in B.C. are located in habitats important for wild salmon, it is not considered likely that habitat impacts at the sites themselves (i.e., nutrient enrichment of the seabed and immediate water column) would affect these species; for example, according to Noakes (2011), “There is no obvious plausible link or evidence to support a link between the deposit of waste on the sea bed or into the water column and sockeye salmon survival. The impact of waste appears to be limited to the immediate vicinity of the farms (within 30 m).” Indeed, in the years since this publication (Noakes 2011), there remains a lack of evidence that the deposition of farm wastes on the benthos results in a loss of functionality of the ecosystems in which farms are sited. Though discussed further in Criterion 4 – Chemical Use, the number of sites using copper antifoulants on net pens is currently uncertain; for example, Marine Harvest Canada eliminated copper-treated nets in 2012.30 In addition, the biochemistry of copper availability in fish farm sediments is complex; any copper accumulation beneath salmon farms occurs in conjunction with high organic loading, and it becomes difficult to confirm that changes in populations or communities are related to concentrations of copper and zinc (Burridge et al. 2011) rather than confounding factors. Monitoring of metal residues in the benthos is no longer required in B.C., but is likely to be continued on some sites where copper is used, as part of commitments of major companies to the Aquaculture Stewardship Council standards. The potential deposition of copper is not considered a high concern in this assessment. Overall, although localized benthic impacts under the net pens may be substantial, due to the relatively rapid reversibility (i.e., a lack of irreversible impacts) and localized nature (i.e., largely within an AZE) there is considered to be only a moderate habitat impact on the provision of ecosystem services at any one farm site; thus, the score is 7 (out of 10). Factor 3.2. Habitat and farm siting management effectiveness (appropriate to the scale of the industry) Factor 3.2a: Content of habitat management measures As discussed in Criterion 2 – Effluent, DFO is responsible for siting licenses and the subsequent monitoring of benthic habitat impacts to minimize the effects of fish farms on the environment within the Aquaculture Activities Regulations (AAR). Full details of the siting and monitoring requirements can be found in DFO’s Siting Guidelines for Marine Finfish Aquaculture in British
30 http://www.marineharvest.ca/about/news-and-media/container2012/october-1-2012/

29
Columbia,31 and the “Program Protocols for Marine Finfish Environmental Monitoring in British Columbia.”32 In terms of regulatory control of cumulative impacts, as noted in the Effluent Criterion, sites in B.C. are typically a minimum of 3 km apart, but there are some exceptions. The range of benthic impacts described above indicate that direct cumulative overlap between sites is unlikely. Husa et al. (2014) noted that the cumulative effect of numerous impacted areas of an industry’s multiple farms must be taken into consideration when further evaluating the total impact from fish farming on ecosystem functioning. However, it is important to note that this study was based on one large fjord in Norway, the Hardangerfjord, which contains salmon farm production equivalent to the entire B.C. industry (70,000 to 80,000 tons in Hardangerfjord compared to 76,000 MT in B.C.). There are no specific regulations relating to habitat connectivity and cumulative impacts to ecosystem services from multiple sites except in B.C., and these are addressed primarily by the site separation distances. B.C. now has two separate ecosystem-based management plans in place that cover the majority of the salmon farming sector, described in Criterion 2 – Effluent; however, the practical outcomes of these plans are not yet clear. More specifically, the small total area of the impact of salmon farm sites in B.C. (specifically, or in comparison to the total inshore area) indicate that the potential for cumulative direct habitat impacts from the industry as a whole are currently limited. Overall, the regulatory systems require specific monitoring of the primary benthic habitat impacts at net pen salmon sites, and though cumulative impacts appear unlikely, there is at least some evidence of ecosystem-based management developing in B.C. The score for Factor 3.1a is 4 out of 5. Factor 3.2b Enforcement of habitat management measures Again, with great similarity to Criterion 2 – Effluent, the benthic monitoring results and evidence of DFO auditing show active enforcement at the site level, and the score for Factor 3.2b is 4 out of 5. The final score for Factor 3.2 combines the scores for the regulatory content (Factor 3.2a) with the effectiveness of the enforcement (Factor 3.2b), and with the similarity between the Effluent and Habitat criteria for net pen production systems, the score Factor 3.2 is also 6.4 out of 10. Habitat Criterion—Conclusions and Final Score The final score for the Habitat Criterion is a combination of the habitat conversion score (Factor 3.1) and the effectiveness of the regulatory system in managing potential cumulative impacts (Factor 3.2), and is 6.8 out of 10.
31 http://www.pac.dfo-mpo.gc.ca/aquaculture/licence-permis/site-guide-direct-eng.html 32 Annex 8 in http://www.dfo-mpo.gc.ca/aquaculture/management-gestion/aar-raa-gd-eng.htm#annex8.2

30
Criterion 4: Evidence or Risk of Chemical Use Impact, unit of sustainability and principle Impact: Improper use of chemical treatments impacts non-target organisms and leads to
production losses and human health concerns due to the development of chemical-resistant organisms.
Sustainability unit: Non-target organisms in the local or regional environment, presence of pathogens or parasites resistant to important treatments
Principle: Aquaculture operations by design, management or regulation avoid the discharge of chemicals toxic to aquatic life, and/or effectively control the frequency, risk of environmental impact and risk to human health of their use.
Criterion 4 Summary
Chemical Use parameters Score
C4 Chemical Use Score 2.00
C4 Chemical Use Final Score 2.00 RED
Critical? NO
Brief Summary Antibiotic use in B.C. has declined substantially since the peaks of the late 1990s, but a significant increase in 2015 due to outbreaks of salmon rickettsial septicemia (caused by unusually warm water temperatures) highlighted the industry’s vulnerability to environmental variability. The total antibiotic use in 2016 dropped substantially after the 2015 spike, but the use of the most dominant treatment, florfenicol, still increased. Current use (over the last four years) varies by treatment, year, and company, but the total in 2016 was 5.1 MT, and on average, antibiotics were used 1.65 times per cycle in 2016, with an average relative use of 68.7 g/MT. Evidence of resistance has been demonstrated in bacterial salmon pathogens in B.C., but there is currently no evidence with which to link it to antibiotic use in salmon farms, and there is no current evidence of clinical treatment failures or decreased efficacy; however, there continue to be multiple treatments (i.e., >1) per production cycle of antibiotics listed as highly important for human medicine by the World Health Organization. Pesticide use in B.C. is low (compared to other salmon farming regions) at approximately 22 kg of active ingredient per year, but treatments are used, on average, more than once per production cycle (1.4 in 2015). Although there is the potential for impacts at the site level, the potential for development of resistance, and for the licensing and increased use of alternative chemicals (e.g., azamethiphos), the industry is also actively conducting trials of non-chemical alternatives for the physical removal of lice that could reduce pesticide use. Overall, the open nature of the net pen production system provides no barrier to infection from environmental pathogens, and in B.C., there is regular treatment (i.e., more frequently than once per production cycle) with antibiotics that are highly important for human medicine. Thus, antibiotic usage remains a fundamental challenge of net pen salmon farming and is a high

31
concern according to the Seafood Watch Standard. As a result, the final score for Criterion 4 – Chemical Use is 2 out of 10. Justification of Ranking The expansion of commercial aquaculture has necessitated the routine use of veterinary medicines to prevent and treat disease outbreaks, assure healthy stocks, and maximize production (FAO 2012); however, the characteristics of chemical use in this regard are highly variable according to the species produced and the management characteristics. This Seafood Watch assessment focuses on antibiotics and sea lice pesticides as the dominant veterinary chemicals applied to salmon farming. Although other types of chemicals may be used in salmon aquaculture (e.g., antifoulants, anesthetics), the risk of impact to the ecosystems that receive them is widely acknowledged to be less than that for antibiotics and pesticides. See the Seafood Watch Aquaculture Standard for further details on all scoring tables and calculations. Antibiotic Use Detailed data on antibiotic use are no longer readily available from British Columbia. DFO’s website, “Use of therapeutants,”33 graphically represents annual antibiotic use to 2014 in grams per ton of production, but provides no details on the types of drug used or specific values. For this Seafood Watch assessment, the B.C. Ministry of Agriculture provided antibiotic data from 2003 to 2016 (pers. comm., de With 2017); these data were for all species, but the majority are considered to be for Atlantic salmon (for example, in 2016, only 2.9% of antibiotics were used for other species). In addition, some specific data points on relative antibiotic use (i.e., in g/ton) are available from the three major farming companies in B.C. in their annual or sustainability reports, from which total use can be calculated from their production figures. In addition, the Global Salmon Initiative (GSI) has data from three companies on the treatment frequency. It is important to note that, due to varying levels of potency and therefore dosing regimens between different types of antibiotic treatments, averaged figures on relative or total use must be made with caution, although they are useful as a general measure. It is also important to note that antibiotics are used under veterinary supervision, and are not used prophylactically in salmon farming (Morrison and Saksida 2013). A time series of relative antibiotic use in B.C. (in grams of antibiotic per ton of salmon production) has been constructed from different data sources for 1995 to 2016 and is plotted alongside the annual farmed salmon production in Figure 4. Comparing Figure 4 to the treatment-specific data in Table 1 shows that the total use has been dominated by oxytetracycline, due in part to the frequency of use, but primarily to the lower potency and therefore much higher therapeutic dose. Overall, there was a long-term decline in both relative use and total use from 1995 to 2011, but there has been an increase in use since then, particularly in 2015 when the average relative use was approximately 180 g/ton of production (reasons discussed below), resulting in a total use of approximately 13.7 MT. In 2016, the total use decreased markedly again to a total of 5.2 MT for all species, with the specific use by Atlantic salmon being 5.1 MT (68.7 g/MT). Despite this overall decrease, the use
33 http://www.pac.dfo-mpo.gc.ca/aquaculture/reporting-rapports/health-sante/therapeut-eng.html

32
of florfenicol continued to increase in 2016 (see Table 1, although company-specific data in later graphs (Figure 6) show this is primarily due to a large increase at one company).
Figure 4: Antibiotic use per ton of production (blue solid line) and total farmed salmon production (all farmed
salmon species—dashed red line) in B.C. from 1995 to 2016. Data from 2005 to 2008 from BCMAL (2009). Data from 2009 to 2015 from BCSFA (2016). Data for 2016 from B.C. Ministry of Agriculture.
Table 1: Chemical use in B.C. aquaculture, 2003 to 2016. Data from B.C. Ministry of Agriculture (pers. comm., de With 2017). Other than emamectin benzoate (a treatment for sea lice discussed later in this criterion), all
chemicals are antibiotics. Data are for all species, but detailed data for 2016 show only 2.9% of antibiotics were used for species other than Atlantic salmon.

33
As noted in the Table 1 title, these figures include treatments for species other than Atlantic salmon, and though minor in 2016, this use was significant in the past; for example, between 2003 and 2006 (see peak in Figure 4), oxytetracycline accounted for over 90% of Marine Harvest’s total antibiotic use and was used to treat bacterial kidney disease (BKD) in Chinook salmon, not Atlantic salmon (Morrison and Saksida 2013). The company-specific data available in annual reports show high variability; Figure 5 shows data from 2013 to 2016 for the three dominant farming companies in B.C. One company, Grieg, has much higher use overall, and in combination with Cermaq, dominated the higher antibiotic use in 2013 (Grieg) and in 2015 (Cermaq and Grieg) seen in Figure 4 above. In contrast, Marine Harvest Canada’s antibiotic use has been consistently low over this period. According to the BCSFA (2016), the majority of current treatments are for yellow mouth (Tenacibaculum maritimum), and the increase in use in 2015 and 2016 is due to an increased frequency of the bacterial pathogen Piscirickettsia salmonis (the causative agent of salmon rickettsial septicemia, SRS) in association with the exceptionally high water temperatures (Milligan 2016). Some of these treatments continued into early 2016 (pers. comm., Gary Marty 2017). In terms of frequency of use, the average number of treatments per cycle is available from the Global Salmon Initiative (GSI) for three large companies in B.C. and shows that the annual averages for 2013, 2014, 2015, and 2016 were 1.0, 1.54, 1.4, and 1.65, respectively (cumulative average of 1.4). Similar to the total use data, the values for frequency of use vary by company, and the difference between these two graphs (Figures 5 and 6) is likely due to the treatment of small fish for diseases that occur early in the production cycle (which are counted in GSI frequency, but make a relatively small contribution to total antibiotic use).
Figure 5: Relative antibiotic use in g/ton of production for three major companies in B.C. between 2013 and 2016.
Data collated from company annual reports, some of which are not yet available for 2016.
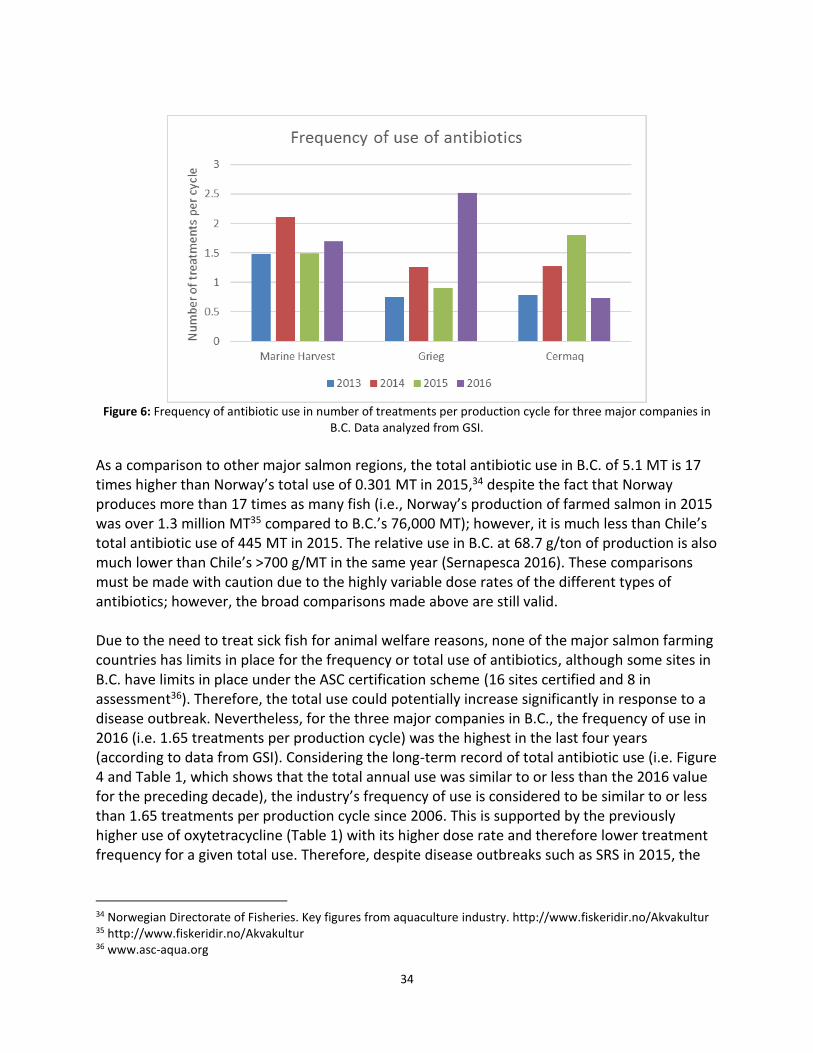
34
Figure 6: Frequency of antibiotic use in number of treatments per production cycle for three major companies in
B.C. Data analyzed from GSI.
As a comparison to other major salmon regions, the total antibiotic use in B.C. of 5.1 MT is 17 times higher than Norway’s total use of 0.301 MT in 2015,34 despite the fact that Norway produces more than 17 times as many fish (i.e., Norway’s production of farmed salmon in 2015 was over 1.3 million MT35 compared to B.C.’s 76,000 MT); however, it is much less than Chile’s total antibiotic use of 445 MT in 2015. The relative use in B.C. at 68.7 g/ton of production is also much lower than Chile’s >700 g/MT in the same year (Sernapesca 2016). These comparisons must be made with caution due to the highly variable dose rates of the different types of antibiotics; however, the broad comparisons made above are still valid. Due to the need to treat sick fish for animal welfare reasons, none of the major salmon farming countries has limits in place for the frequency or total use of antibiotics, although some sites in B.C. have limits in place under the ASC certification scheme (16 sites certified and 8 in assessment36). Therefore, the total use could potentially increase significantly in response to a disease outbreak. Nevertheless, for the three major companies in B.C., the frequency of use in 2016 (i.e. 1.65 treatments per production cycle) was the highest in the last four years (according to data from GSI). Considering the long-term record of total antibiotic use (i.e. Figure 4 and Table 1, which shows that the total annual use was similar to or less than the 2016 value for the preceding decade), the industry’s frequency of use is considered to be similar to or less than 1.65 treatments per production cycle since 2006. This is supported by the previously higher use of oxytetracycline (Table 1) with its higher dose rate and therefore lower treatment frequency for a given total use. Therefore, despite disease outbreaks such as SRS in 2015, the
34 Norwegian Directorate of Fisheries. Key figures from aquaculture industry. http://www.fiskeridir.no/Akvakultur 35 http://www.fiskeridir.no/Akvakultur 36 www.asc-aqua.org

35
frequency of use of antibiotics has likely remained (on average) at less than two treatments per production cycle for the last decade. Four antibiotic products containing six active compounds are approved for use in B.C.: florfenicol, oxytetracycline, Romet-30 (a 5:1 combination of sulphadimethoxine and ormetoprim), and Tribrissen (sulphadiazine and trimethoprim; 5:1). Table 1 shows that oxytetracycline and florfenicol are dominant, and approximately equal by weight, but due to the much higher therapeutic dose of oxytetracycline, the frequency of use of florfenicol will be highest and is increasing (although Figure 6 indicates that this is company-specific). The use of oxytetracycline has declined compared to florfenicol, primarily due to a vaccine becoming available for bacterial kidney disease (BKD), and oxytetracycline is typically now only used in broodstock fish (pers. comm., Dolmage 2017). Additional approved drug products are available at the discretion of prescribing veterinarians, but the use of alternative drugs is reported to be uncommon (BCSFA 2016). Of the six antibiotics that make up the four registered products used in B.C. (see Table 1), all are listed as highly important37 for human medicine by the World Health Organization (WHO 2016). For veterinary applications, the World Organisation for Animal Health (OIE) has also prepared a “List of Antimicrobial Agents of Veterinary Importance,” within which both florfenicol and oxytetracycline are listed as “Veterinary Critically Important Antimicrobial Agents” (OIE 2014). The OIE (2014) states: “The wide range of applications and the nature of the diseases treated make phenicols [and tetracyclines] extremely important for veterinary medicine. This class is of particular importance in treating some fish diseases, in which there are currently no or very few treatment alternatives.” This emphasizes the need for responsible and prudent use (OIE 2014). Antibiotic Resistance The use of appropriate antimicrobial treatments is one of the most effective management responses to emergencies associated with infectious disease epizootics; however, their inappropriate use can lead to problems related to increased frequency of bacterial resistance and the potential transfer of resistance genes in bacteria from the aquatic environment to other bacteria (FAO 2012). The subject of antibiotic resistance is extremely complex and the subject of a voluminous and rapidly growing body of literature. In technical complexity, the details of this subject are beyond the scope of this Seafood Watch assessment, yet the appropriate level of concern is important to this Chemical Use criterion. The recent scientific literature has therefore been relied upon, particularly a number of comprehensive review articles referenced below. Put simply, Done and Halden (2015) state that the use of antibiotics in open net pen aquaculture can lead to:
37 Note there is also a “critically important” category.

36
The spread of antibiotics into the environment38
Residual concentrations left in seafood (below any regulatory residue limits)
High exposure by aquaculture facility personnel39
Antibiotic resistance development
In addition, Tomova et al. (2015) state: Emerging antimicrobial resistance genes (ARG) in human pathogens have been identified as
potentially of aquatic origin
ARG and mobile genetic elements have also been shown to be shared between aquatic bacteria
and terrestrial animal and human pathogens
Although a number of previous reviews such as (Cabello et al. 2013) (Miranda 2012) (Buschmann et al. 2012) (Smith 2008) remain useful, a more recent review of 650 papers by Done et al. (2015) provides a useful summary of the general concern. Done et al. (2015) state:
Several publications have linked antibiotic resistance development and spread with animal
production. Aquaculture, the newest and fastest growing food production sector, may promote
similar or new resistance mechanisms
The usage of antibiotics provides selective pressure that can accelerate the development and
spread of antibiotic resistant genes
Various zoonotic40 pathogens isolated from meat and seafood were observed to feature
resistance to multiple antibiotics on the WHO list, irrespective of their origin in either agriculture
or aquaculture
The data show that resistant bacteria isolated from both aquaculture and agriculture share the
same resistance mechanisms, indicating that aquaculture is contributing to the same resistance
issues established by terrestrial agriculture
Co-resistance to multiple antibiotics is increasingly becoming a major concern.
As water provides a constant and facile mechanism for dispersal of drug residues, microbial
pathogens, and resistance genes, aquaculture will continue to pose a threat that may increase
as the demand for seafood increases.
There is evidence that antibiotic resistance has occurred previously in B.C. For example, Sheppard (1992) documented Aeromonas salmonicida antibiotic resistance to oxytetracycline in B.C. prior to the successful adoption of vaccination. Morrison and Saksida (2013) expressed concern with recent occurrences (in 2011) of a need to repeat antibiotic treatment for stomatitis (treated with florfenicol); however, it is important to note that though these repeated treatments could lead to resistance, they indicate that the antibiotic is less suitable to
38 As an aside, Fortt et al. (2007) report the presence of antibiotics administered to cultured salmon in commonly eaten wild fish in Chile (Eleginops maclovinus, known as the Patagonian blenny, rock cod, or seabass, and the red rockfish, Sebastes capensis), providing what Gonzalez et al. (2011) consider unequivocal evidence of the interaction between farmed fish and free-living organisms. 39 Note antibiotics are now applied primarily by feed mills. 40 Zoonotic: a disease that can be transmitted from animals to humans or, more specifically, a disease that normally exists in animals but that can infect humans (Medicinenet.com)

37
treat the disease rather than indicating an already developed resistance. B.C.’s Ministry of Agriculture’s Animal Health Centre (AHC) assessed bacterial resistance in diagnostic salmon samples submitted between 2007 and 2015 and presented data on resistance to three antibiotics: florfenicol, oxytetracycline, and trimethoprim-sulfadiazine, in two key bacteria (Aeromonas salmonicida, which causes furunculosis in salmon, and Yersinia ruckeri, which causes enteric redmouth disease) (AHC 2016). Though noting the data limitations expressed in the study (small sample sizes, passively collected samples likely to be of sick fish), the data showed that antibiotic resistance in Y. ruckeri was very uncommon, with only one isolate showing resistance to one antibiotic in the 9-year sample history. For A. salmonicida, Figure 7 shows that, although there were no trends of increasing or decreasing resistance to any antimicrobial over time, multiple isolates in some years showed resistance to one or more antibiotics and frequently appeared to be resistant to multiple antibiotics.
Figure 7: Proportion of A. salmonicida isolated from Atlantic salmon submissions to the Animal Health Centre
resistant to florfenicol (FLOR), oxytetracycline (OXY) and sulfa-trimethoprim (SMT) by year. Error bars represent 95% confidence intervals for the proportion. Graph copied from AHC (2016). Note only two samples were taken in
2007 and zero in 2008.
Florfenicol is currently the most commonly used antibiotic in B.C., and despite not being used in human medicine, it is listed as highly important for human medicine by the World Health Organization. This is due to the presence of a mobile gene of resistance, the FloR gene; also, because of horizontal gene transfer (HGT) between species, florfenicol has the potential to co-select for a diversity of resistances (Fernandez-Alarcon et al. 2010). For this reason, human health as well as animal health can potentially be impacted by the use of antibiotics in aquaculture. In Chile, Henriquez-Nunez et al. (2012) implied that the developed antibiotic resistance is likely to be due to the high amounts of florfenicol used, the repetitive use, and the use of much higher doses than those recommended; nevertheless, the detection of the FloR gene in this region cannot be attributed to antibiotic use on salmon farms, but Tomova et al.

38
(2015) also strongly suggest that aquaculture areas in Chile may constitute hotspots of evolution towards antimicrobial resistance. As noted above, the total use of antibiotics in B.C. is a fraction of that in Chile, and the AHC (2016) cautioned that inferences about antimicrobial resistance in the source population of animals in B.C. must be made cautiously. By comparing the patterns of resistance in Figure 7 with the specific data on antimicrobial use in salmon farming in B.C. over a similar time period in Table 1, it is clear that there is no correlation between increasing or decreasing antibiotic use in salmon farms and increasing or decreasing resistance for any of the antibiotics tested by AHC. The development of clinical resistance to antibiotics listed as highly important to human medicine is a critical concern in the Seafood Watch standard. Although these data are a cause for concern, a cause-and-effect conclusion is not justified and there is no evidence of clinical resistance and the loss of efficacy of treatments. Pesticides The primary use for pesticide compounds in salmon farming is the treatment of parasitic sea lice, with a lesser use (of hydrogen peroxide) to treat amoebic gill disease (AGD) (Aaen et al. 2015). Their use in B.C. is primarily aimed at protecting wild fish during their outmigration period (March–July) rather than concerns for the health of farmed fish (Saksida et al. 2015), and (noting the apparent exception of 2015 discussed below) Rogers et al. (2013) suggest that treatment of farmed salmon conducted in January or early February minimizes average louse abundance at the time of outmigration. DFO provides a graphical representation of annual pesticide use (not including hydrogen peroxide) from 1996 to 2014, and the B.C. Ministry of Agriculture provided data on emamectin benzoate from 2003 to 2016 (pers. comm., de With 2017). Emamectin benzoate (EB—trade name SLICE®) had been the only pesticide used in B.C. since the year 2000, but in January 2014, Marine Harvest Canada was granted permission to use hydrogen peroxide (trade name Interox® Paramove™ 50) as an alternative treatment for sea lice,41 and the treatment is now available industry-wide. EB is administered in the feed, whereas hydrogen peroxide is a bath treatment. The relative use of SLICE (in grams of active ingredient per ton of salmon production) and total annual use (kg) are shown in Figures 8 and 9. Data from GSI42 for 2013 to 2015 match this pattern of use. These time series of data from different sources show annual variability but a broadly stable relative and absolute use of SLICE in B.C. since 2005. The increase in use in 2016 is considered likely to be in response to apparently poorly timed treatments in 2015 that contributed to increased lice loads in that year; e.g., (Bateman et al. 2016), discussed below. According to the BCSFA (2016), the average number of treatments per production cycle in 2015 was 1.4, although the treatment type was not specified. According to Saksida (2016), hydrogen peroxide was used four times total in the 2-year period 2014–2015, and is likely to increase, but is considered to dissociate rapidly in the immediate farm area into environmentally benign
41 www.intrafish.com Jan 17, 2014 Marine Harvest gets OK for new lice treatment. 42 http://globalsalmoninitiative.org/sustainability-report/sustainability-indicators/

39
hydrogen and oxygen (Lillicrap et al. 2015). More recent data on hydrogen peroxide use are not currently available.
Figure 8: Use of emamectin benzoate (SLICE®) in grams per ton of production in B.C. between 1996 and 2016 (blue
solid line). Red dashed line shows total salmon production. Data for 1996–2014 from DFO, for 2015 from BCSFA, and for 2016 from B.C. Ministry of Agriculture.
Figure 9: Total emamectin benzoate (SLICE®) use in kg of active ingredient from 1996 to 2016. Data for 1996–2014
from DFO, for 2015 from BCSFA, and 2016 from B.C. Ministry of Agriculture.

40
According to Saksida (2016) there is “evidence of tolerance” to EB in B.C., and hydrogen peroxide provides an alternative treatment. In addition, at the time of writing, Health Canada’s Pest Management Regulatory Agency (PMRA) is proposing registration for the sale and use of azamethiphos (trade name Salmosan Vet®) to control sea lice on Atlantic salmon43; however, it is not currently known how much, if any, will be used in B.C. Although resistance to EB is a concern to multiple stakeholders, evidence to date is limited; for example, the testing by Bateman et al. (2016) showed full efficacy in the Broughton region. The increasing options for chemical and non-chemical alternatives are encouraging. Major companies in B.C. are actively developing the use of cleaner fish, thermolicers (warm water), hydrolicers, and freshwater baths (pers. comm., Dolmage 2017). Total pesticide use in B.C. (22.15 kg of EB in 2016 and an apparently limited amount of hydrogen peroxide based on 2015 data) is very low compared to other salmon farming regions; for example, the total pesticide use in Norway (across several different chemical treatments) was more than 15 MT in 2015,44 in addition to over 30 MT of hydrogen peroxide (note that different treatments have different therapeutic doses, and therefore direct comparison must be made with caution). The relative use in grams of pesticide per ton of production is 47 times higher in Norway than B.C. (11.74 g/ton versus 0.25 g/ton in 2015). The apparently unique situation in B.C. has been partially attributed to differences within the dominant sea lice species (Lepeoptheirus salmonis) between Atlantic and Pacific populations (Yazawa et al. 2008) and an annual influx of sea lice that have never experienced pesticides accompanying the return of wild salmon (BCMAL 2009); however, the long‐term stability of this situation is uncertain (Peacock et al. 2013). With regard to direct ecological impacts of the pesticide EB, in-feed treatments tend to be dispersed in uneaten feed and fecal particles that settle to the seabed (Burridge et al. 2010), and Samuelsen et al. (2015) and references therein showed that residues in settling feces can be more concentrated than in the feeds. Persistence in the sediment ultimately depends on the chemical nature of the product used and the chemical properties of the sediment, and toxicity to non-target organisms of in-feed sea lice treatments tends to be of a chronic nature at low concentrations (Macken et al. 2015) (Lillicrap et al. 2015). Samuelsen et al. (2015) showed that, although pesticide residue levels in the sediments are low, particles containing residues have been found as far as 1,100 m from the treatment site. The detailed “Program Protocols for Marine Finfish Environmental Monitoring in British Columbia,” available in DFO’s Aquaculture Activities Regulations (AAR) guidance document,45 specify that sediment residue testing is required at sites in B.C., but no data appear to be available publicly to verify this. In 2011, a Canadian Science Advisory Process was held to assess the impact of EB near aquaculture facilities in British Columbia and its effect on the native spot prawn Pandalus platyceros (DFO 2012). The DFO study detected substantial levels of EB under the farm and a
43 November 2016. http://www.hc-sc.gc.ca/cps-spc/pest/part/consultations/_prd2016-25/prd2016-25-eng.php 44 http://www.fiskeridir.no/Akvakultur 45 http://www.dfo-mpo.gc.ca/aquaculture/management-gestion/aar-raa-gd-eng.htm#annex8.2

41
low level at the limit of detection up to 150 m from the farm. The study indicated the potential for EB to remain in sediments close to the farm for 1.5 years after treatment and therefore to accumulate over multiple treatments. It concluded, “(i) EB can remain and so potentially buildup in benthic sediments close to salmon farms, depending on the frequency and extent of SLICE® usage and the local site conditions; and (ii) EB is bioavailable and can be measured in the muscle tissues of spot prawns collected near salmon farms treated with SLICE.®” Similarly, Iknomou and Surridge (2013) reported a distinct concentration gradient within 50 to 100 m where EB was detected at low ng/g levels in shrimp tissue and sediments. With impacts restricted to the immediate farm area, significant impacts to spot prawn populations seem unlikely. Detailed data from Scotland, where the relative use of EB is approximately double that of B.C. (and the total use approximately 3.7 times higher), show that in 2016, 5% of benthic samples at the net pen edge exceed the local environmental quality standard limit, and 24.6% of samples at 100 m exceed it.46 A recent study in Scotland (SARF098 2016) assessing the highest use of EB in terms of per production cycle (3 kg) and per site (10 kg in repeated treatments) showed strong evidence of a substantial decline in crustacean richness and abundance, even at reference sites 150 m away from cages. This peak use may not be representative of many sites in Scotland, but the study has prompted a review of site licenses by the Scottish Environmental Protection Agency, and inevitably implies an increased level of concern regarding EB use in salmon farms, but it is important to note that the quantity and pattern of EB use represented in this study in Scotland is considered very different to B.C. Overall, the use of pesticides in B.C. is currently low, and used in response to the need to control sea lice numbers during important periods for wild salmon migration. Although the impacts of their use in B.C. are not yet fully understood, the available evidence indicates that significant impacts are likely to be constrained to an area commonly accepted as an “allowable zone of effect,” similar to that impacted by organic enrichment. There may be impacts to organisms within this area, but there is little evidence for concern beyond 100 m from the net pens. Metals The number of sites using copper antifoulants on net pens in B.C. is uncertain; for example, Marine Harvest Canada eliminated copper-treated nets in 2012.47 In Scotland, Russell et al. (2011) showed sediment samples with concentrations of copper, which might cause adverse effects in the environment if all samples were from within 25 m of the net pens. In addition, the biochemistry of copper availability in fish farm sediments is complex; any copper accumulation beneath salmon farms occurs in conjunction with high organic loading and it becomes difficult to confirm that changes in populations or communities are related to concentrations of copper and zinc (Burridge et al. 2011) rather than confounding factors. Although monitoring of metal
46 Data analyzed from Data from “Scotland’s Aquaculture” database. http://aquaculture.scotland.gov.uk/ 47 http://www.marineharvest.ca/about/news-and-media/container2012/october-1-2012/
42
residues is no longer required in B.C., the potential deposition of copper is not considered a high concern. Conclusions and Final Score Antibiotic use overall has declined substantially since the peaks of the late 1990s; however, a significant increase in 2015 due to treatment of SRS outbreaks (caused by unusually warm water temperatures) highlighted the industry’s vulnerability to environmental variability. The total antibiotic use in 2016 dropped substantially after the 2015 spike, but the use of florfenicol still increased. Current use (over the last four years) varies by treatment, year, and company, but on average, antibiotics were used 1.65 times per production cycle in 2016, with an average relative use of 68.7 g/MT. Although there are no regulatory limits in place on the frequency of use, it appears the industry’s use has remained below the current level of 1.65 for at least the last decade; however, there continue to be multiple treatments (i.e., >1) per production cycle of antibiotics listed as highly important for human medicine by the World Health Organization. Pesticide use in B.C. is low (compared to other salmon farming regions) at approximately 22 kg of active ingredient per year, but treatments are used, on average, more than once per production cycle (1.4 in 2015). Although there is the potential for impacts at the site level for the development of resistance, and for the licensing and increased use of alternative chemicals (e.g., azamethiphos), the industry is also actively conducting trials of non-chemical alternatives for the physical removal of lice that could reduce pesticide use. Overall, the open nature of the net pen production system provides no barrier to infection from environmental pathogens, and in B.C., there is subsequent regular treatment (i.e., used more frequently than once per production cycle) with antibiotics that are highly important for human medicine. Thus, antibiotic usage remains a fundamental challenge of net pen salmon farming and is a high concern according to the Seafood Watch Standard. As a result, the final score for Criterion 4 – Chemical Use is 2 out of 10.

43
Criterion 5: Feed Impact, unit of sustainability and principle Impact: Feed consumption, feed type, ingredients used and the net nutritional gains or
losses vary dramatically between farmed species and production systems. Producing feeds and their ingredients has complex global ecological impacts, and their efficiency of conversion can result in net food gains, or dramatic net losses of nutrients. Feed use is considered to be one of the defining factors of aquaculture sustainability.
Sustainability unit: This is the amount and sustainability of wild fish caught for feeding to farmed fish, the global impacts of harvesting or cultivating feed ingredients, and the net nutritional gains or losses from the farming operation.
Principle: Aquaculture operations source only sustainable feed ingredients, convert them efficiently and responsibly, and minimize and utilize the nonedible portion of farmed fish.
Criterion 5 Summary Feed parameters Value Score
C5.1a Forage Fish Efficiency Ratio (FFER) 2.07 4.83
F5.1b Source fishery sustainability score –4.00
F5.1: Wild Fish Use 3.17
C5.2a Protein IN (kg per ton production) 267.5
C5.2b Protein OUT (kg per ton production) 235.1
F5.2: Net Protein Gain or Loss (%) –12.1 8
F5.3: Feed Footprint (hectares) 11.98 6
C5 Feed Final Score 5.08 YELLOW
Critical? NO
Brief Summary Fishmeal and fish oil inclusion in B.C. salmon feed continues to be replaced by increasing levels of alternative crop protein and oil ingredients, and by land animal by-products. Data provided by one of three major feed companies supplying B.C. farms, supported by data from salmon farming company annual reports and reference values from GSI and BCSFA, show the feed conversion ratio (dry weight of feed to wet weight of fish) is 1.25; from first principles, 2.07 MT of wild fish would need to be caught to produce 1 metric ton of farmed salmon. Information on the sustainability of source fisheries for fishmeal and fish oil results in a Wild Fish Use score of 3.17 out of 10. There is a net edible protein loss of 12.1% and a moderate total feed footprint of 12 hectares per MT of production. Overall, the final feed score is 5.08 out of 10.
Justification of Ranking Only one feed company in B.C. provided data for this report (the other major companies were contacted but did not respond). Partial data is available from salmon producer annual reports. Some basic, aggregated feed values are provided by the BCSFA (2016), and values for Forage

44
Fish Efficiency Ratios (FFER)48 from 2013 to 2015 are provided by GSI. Feed companies have different feed formulations and use different ingredient sources, and the limited number of feed companies supplying the salmon industry in B.C. means that there is a risk that one company’s data are not representative of the industry in general. Therefore, values from other sources, such as GSI or BCSFA, are used as well as checks, or averaged where possible to provide more robust data points. The Seafood Watch Feed Criterion assesses three factors: wild fish use (including the sustainability of the source), net protein gain or loss, and the feed “footprint” or global area required to supply the ingredients. See the Seafood Watch Aquaculture Standard for further details on all scoring tables and calculations. Factor 5.1. Wild Fish Use Factor 5.1a – Feed Fish Efficiency Ratio (FFER) According to the feed manufacturer data, total fishmeal and fish oil inclusion levels are 23% and 12%, respectively, with 16% of fishmeal and 60% of fish oil coming from by-product sources. Data from BCSFA (2016) show approximate fishmeal and fish oil inclusion levels of 12.5% and 10%, respectively, but provide no further information on the use of by-product sources. Data from Marine Harvest show fishmeal inclusion (not including by-products) reducing from 9% to 6% and fish oil similarly reducing from 10% to 8% from 2011 to 2016. Given the range of values, the BCSFA value (in theory incorporating all feeds used in B.C.) is used as the most representative value, and assumed to not include by-product sources.49 Regional-specific economic feed conversion ratio (eFCR) data were not readily available from company reports, but the feed company provided a value of 1.3, and the BCSFA (2016) claims 1.2. An average of 1.25 is used. These figures generate initial FFER values for fishmeal and fish oil of 0.56 and 2.5, respectively. Figure 10 plots the FFER values from GSI for three major salmon farming companies in B.C. from 2012 to 2015. The average 2015 value for fishmeal (0.65) is similar to that calculated above, but the average value for fish oil (2.07) is somewhat lower. Because the fishmeal and oil values provided to the BCSFA (12% and 10%, respectively) came from the same companies, the direct calculations reflected in the GSI data are considered the most robust, and the highest 2015 FFDR value (2.07 for fish oil) has been used to generate the scores. This value means that, from first principles, 2.07 tons of wild fish must be caught to supply the fish oil required to produce 1 ton of farmed salmon in B.C., and results in a numerical score of 4.83 out of 10 for Factor 5.1a.
48 FFER is the same as FFDR presented in GSI, where “D” = “Dependency”. 49 For the purposes of the subsequent calculations in Factors 5.2 and 5.3, the total fishmeal and oil level will be assumed to be those of the feed company, i.e., 23% and 12%, and the percentage of byproducts will be adjusted to accommodate the 12.5% and 10% values used for the FFER calculations in 5.1 (i.e., 56.5% fishmeal by-products and 16.7% fish oil by-products).

45
Figure 10: Average annual FFER values from three salmon companies in B.C. for 2013-2015.
Table 2: The parameters used and their calculated values to determine the use of wild fish in feeding farmed B.C. salmon.
Parameter Data
Fishmeal inclusion level 23.0%
Percentage of fishmeal from by-products 49%50
Fishmeal yield (from wild fish) 22.5%51
Fish oil inclusion level 12%
Percentage of fish oil from by-products 31%52
Fish oil yield 5.0%53
Economic Feed Conversion Ratio (eFCR) 1.25
Calculated Values
Feed Fish Efficiency Ratio (FFER) (fishmeal) 0.65
Feed Fish Efficiency Ratio (FFER) (fish oil) 2.07
Seafood Watch FFER Score (0-10) 4.83
Factor 5.1b –Sustainability of the Source of Wild Fish
50 Value calculated to meet GSI average value. 51 22.5% is a fixed value from the Seafood Watch Aquaculture Standard based on global values of the yield of fishmeal from typical forage fisheries. Yield estimated by Tacon and Metian (2008). 52 Value calculated to meet GSI average value. 53 5% is a fixed value from the Seafood Watch Aquaculture Standard based on global values of the yield of fish oil from typical forage fisheries. Yield estimated by Tacon and Metian (2008).

46
The FFER score is adjusted by a factor determined by the sustainability of the fisheries sourced to provide marine ingredients. The default adjustment value of 0 is based on the assumption that aquaculture should use sustainable feed ingredients, and an increasingly negative penalty is generated by increasingly unsustainable sources. According to the feed company, the primary fisheries supplying the fishmeal and fish oil are Chilean anchoveta, menhaden from the Gulf of Mexico, and blue whiting from the NE Atlantic, with the first two being dominant for fishmeal and fish oil, respectively. The company actively sources fishmeal and oil from fisheries certified to the IFFO RS54 responsible sourcing scheme, and an analysis of FishSource scores shows mixed results that overall justify a Sustainability Score of –4 out of –10. With limited region-specific data available elsewhere, this value is used, and the adjustment to the FFER score is therefore –1.66, giving a final score for Factor 5.1 – Wild Fish Use of 3.17 out of 10. Factor 5.2. Net Protein Gain or Loss According to the feed company data provided, protein is supplied by fishmeal, terrestrial crop sources, and land animal by-products. The average feed protein content is 43%; 27% comes from fishmeal, of which 16% comes from non-edible by-product sources. For the remainder, 36% of total protein comes from terrestrial crop sources (considered to fall within the “edible” protein inputs) and 37% comes from land animal by-products (considered not suitable for human consumption). Without further data from other sources, the single feed company example is used. Considering the eFCR of 1.25, the edible protein input is 267.5 kg per ton of salmon produced. Table 3: The parameters used and their calculated values to determine the protein gain or loss in the production of farmed BC salmon.
Parameter Feed company data
Protein content of feed 43.0%
Percentage of total protein from non-edible sources (by-products, etc.) 50.2%
Percentage of protein from edible sources 49.77%
Percentage of protein from crop sources 36.0%
Feed conversion ratio 1.25
Protein INPUT per ton of farmed salmon 267.5 kg
Protein content of whole harvested salmon 18.5%
Percentage of farmed salmon by-products utilized 100%
Utilized protein OUTPUT per ton of farmed salmon 235.1 kg
Net protein loss 12.12%
Seafood Watch score (0-10) 8
The whole-fish protein content is 18.5% (Boyd, 2007), and although Ramirez (2007) did not provide data specific to British Columbia, the study of salmon by-product processing indicates that all by-products from harvested salmon are considered to be utilized. After the adjustment
54 http://www.iffo.net/iffo-rs
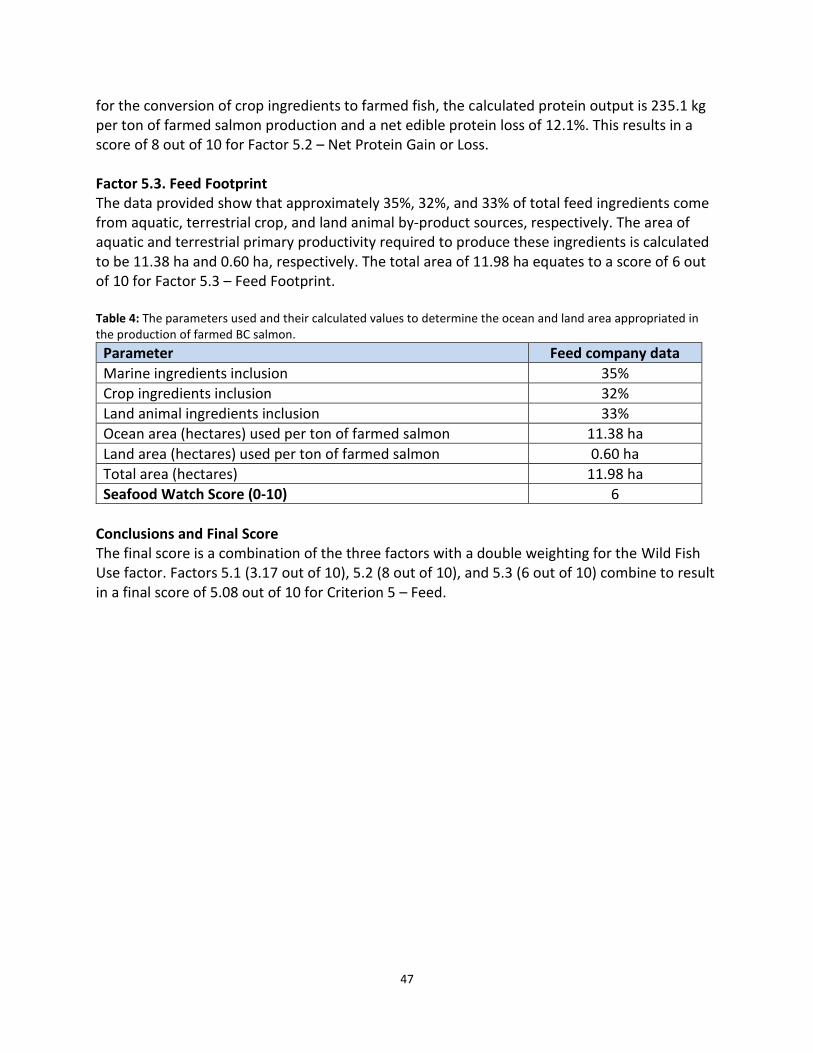
47
for the conversion of crop ingredients to farmed fish, the calculated protein output is 235.1 kg per ton of farmed salmon production and a net edible protein loss of 12.1%. This results in a score of 8 out of 10 for Factor 5.2 – Net Protein Gain or Loss. Factor 5.3. Feed Footprint The data provided show that approximately 35%, 32%, and 33% of total feed ingredients come from aquatic, terrestrial crop, and land animal by-product sources, respectively. The area of aquatic and terrestrial primary productivity required to produce these ingredients is calculated to be 11.38 ha and 0.60 ha, respectively. The total area of 11.98 ha equates to a score of 6 out of 10 for Factor 5.3 – Feed Footprint. Table 4: The parameters used and their calculated values to determine the ocean and land area appropriated in the production of farmed BC salmon.
Parameter Feed company data
Marine ingredients inclusion 35%
Crop ingredients inclusion 32%
Land animal ingredients inclusion 33%
Ocean area (hectares) used per ton of farmed salmon 11.38 ha
Land area (hectares) used per ton of farmed salmon 0.60 ha
Total area (hectares) 11.98 ha
Seafood Watch Score (0-10) 6
Conclusions and Final Score The final score is a combination of the three factors with a double weighting for the Wild Fish Use factor. Factors 5.1 (3.17 out of 10), 5.2 (8 out of 10), and 5.3 (6 out of 10) combine to result in a final score of 5.08 out of 10 for Criterion 5 – Feed.

48
Criterion 6: Escapes Impact, unit of sustainability and principle Impact: competition, genetic loss, predation, habitat damage, spawning disruption, and
other impacts on wild fish and ecosystems resulting from the escape of native, non-native and/or genetically distinct fish or other unintended species from aquaculture operations
Sustainability unit: affected ecosystems and/or associated wild populations Principle: aquaculture operations pose no substantial risk of deleterious effects to wild
populations associated with the escape of farmed fish or other unintentionally introduced species
Criterion 6 Summary Escape parameters Value Score
F6.1 System escape risk 5
F6.1 Recapture adjustment 0
F6.1 Final escape risk score 5
F6.2 Invasiveness 6
C6 Escape Final Score (0-10) 5
Critical? NO YELLOW
Brief Summary The elimination of a small number of large escape events that occurred prior to 2010 means that the annual number of reported escapes in B.C. since then has been low, with an annual maximum of 22 fish reported in 2016. Undetected or unreported trickle escapes are likely to occur, and though dedicated monitoring is limited, there is no evidence for the presence of significant numbers of escaped farmed salmon in the wild in B.C. Although large-scale escape events have not occurred in recent years in B.C., they continue to occur from similar production systems globally; and, despite the low recent escapes in B.C., the potential for escapes due to human error or bad weather remains. Atlantic salmon is non-native in B.C., but evidence increasingly shows the species is a poor colonizer outside of its native range. Despite repeated, intentional efforts over more than a century to establish Atlantic salmon for sport fishing, plus the large numbers of escapes in decades past, there is no evidence of ecological establishment in the Pacific. While accepting that the impacts could be severe if Atlantic salmon were to become established in B.C., the available evidence indicates this is highly unlikely. Overall, the final score for Criterion 6 – Escapes is 5 out of 10. Justification of Ranking This criterion assesses the risk of escape (Factor 6.1) with the potential for impacts according to the nature of the species being farmed (Factor 6.2). The potential for recaptures is a component of Factor 6.1. See the Seafood Watch Aquaculture Standard for further details on all scoring tables and calculations.

49
Factor 6.1. Escape Risk As long as facilities are not fully contained, the escape of farmed fish into the wild is considered inevitable, and the net pens used in salmon farming offer the greatest opportunity for escapes because there is only a net barrier between the fish and the wild (Glover et al. 2017). In B.C., when there is evidence that an escape has occurred (even of only one fish), salmon farms are required to report the incident to DFO within 24 hours, detailing the cause, time, and location of the event and the species, size, number of fish involved, and recent therapeutant treatments; then, a more detailed written report must be submitted to DFO within seven days.55 DFO has published (industry-reported) escape data56 since 2011, and Figure 11 shows a longer-term data set collected from various sources. The number of industry-wide reported escapes since 2010 has been very low, with total reported escapes of 12, 8, 0, 20, 2, and 22 reported escapes annually from 2011 to 2016, respectively.
Figure 11: Industry-reported escape figures in British Columbia. Data: 1987–2009 from Piccolo and Orlikowska
(2012); 2010 from pers. comm., John Werring, David Suzuki Foundation; 2012–2016 from DFO.
The reason for the rapid drop in total escapes after 2010 is not immediately apparent, but considering the number of escape events involved, the large total escapes in the years 2007–2010 are dominated by single incidents. In 2007, an escape of 19,168 fish dominated the total of 19,223; in 2009, an escape of 47,000 fish dominated the total of 48,858; and in 2010, an escape of 15,000 fish represented the entire total (more escape events happened in 2008, but
55 Public Reports on Aquaculture—Escapes http://www.pac.dfo-mpo.gc.ca/aquaculture/reporting-rapports/escape-evasion-eng.html 56 http://www.pac.dfo-mpo.gc.ca/aquaculture/reporting-rapports/escape-evasion-eng.htm

50
were still dominated by a small number of large events) (Gillespie 2013) (Anderson 2008). Therefore, preventing a very small number of large escape events leads to low numbers of reported escapes overall in recent years, and the vast majority of sites in B.C. have not had any reported escape events for many years. Given the challenges to accurately count and account for the tens of thousands of fish per pen, Skilbrei and Wennevik (2006) noted that small-scale, undetected, or unreported escape events (so-called “trickle” losses) in Norway may make up a large portion of the total number of escapees. Escape statistics are usually based on reports by the farmers themselves and are likely to underestimate, significantly in some circumstances, the actual number of fish escaping from farms (Glover et al. 2017). Though escape prevention practices have improved on farms since then, a more recent modeling analysis by Skilbrei et al. (2015) suggests that the total numbers of post-smolt and adult escapees (in Norway) have been two- to four-fold higher than the numbers reported to the authorities by farmers. ICES (2016) also supports the notion that the true number of escapees is likely to be significantly higher than reported figures. In B.C., Leggatt et al. (2010), also note there is minimal knowledge of the extent of “trickle” escapes from net pens. The challenge to accurately count the large numbers of fish in any one cage is shown in the concept of “unexplained loss”; Table 5 from one company (Cermaq) in B.C. shows that the realistic counting accuracy available to salmon farming companies (e.g., < 2%) allows large differences in inventory counts (note these are both positive and negative differences). A notable example is shown in Table 5, where an inventory difference of 1.3% represented over 8,000 fish. It cannot be known if this “unexplained loss” is a true loss, or simply due to the inherent inaccuracy of the counting system. Similarly, the positive increases in fish counts cannot be attributed to an actual increase in the number of fish in the net pen. Thus, these figures provide no indication of actual escapes, unless the Inventory Difference exceeds the counting accuracy of the equipment (which is not evident at any site in Table 5).
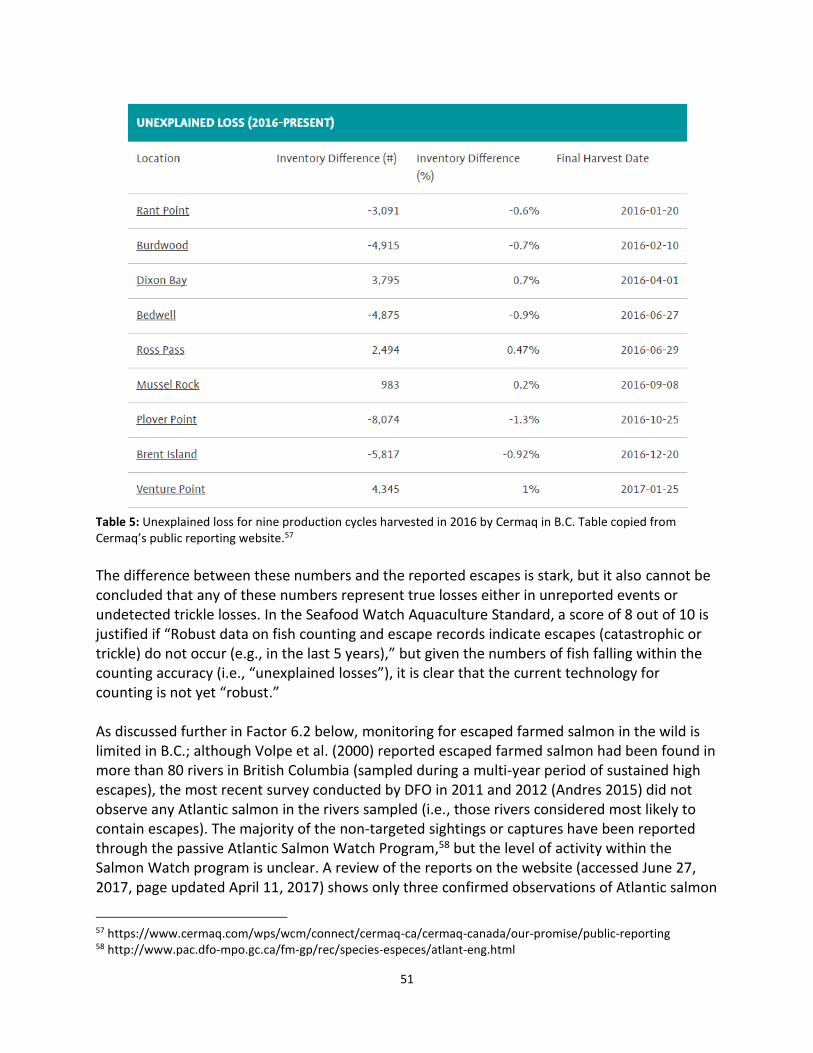
51
Table 5: Unexplained loss for nine production cycles harvested in 2016 by Cermaq in B.C. Table copied from Cermaq’s public reporting website.57
The difference between these numbers and the reported escapes is stark, but it also cannot be concluded that any of these numbers represent true losses either in unreported events or undetected trickle losses. In the Seafood Watch Aquaculture Standard, a score of 8 out of 10 is justified if “Robust data on fish counting and escape records indicate escapes (catastrophic or trickle) do not occur (e.g., in the last 5 years),” but given the numbers of fish falling within the counting accuracy (i.e., “unexplained losses”), it is clear that the current technology for counting is not yet “robust.” As discussed further in Factor 6.2 below, monitoring for escaped farmed salmon in the wild is limited in B.C.; although Volpe et al. (2000) reported escaped farmed salmon had been found in more than 80 rivers in British Columbia (sampled during a multi-year period of sustained high escapes), the most recent survey conducted by DFO in 2011 and 2012 (Andres 2015) did not observe any Atlantic salmon in the rivers sampled (i.e., those rivers considered most likely to contain escapes). The majority of the non-targeted sightings or captures have been reported through the passive Atlantic Salmon Watch Program,58 but the level of activity within the Salmon Watch program is unclear. A review of the reports on the website (accessed June 27, 2017, page updated April 11, 2017) shows only three confirmed observations of Atlantic salmon
57 https://www.cermaq.com/wps/wcm/connect/cermaq-ca/cermaq-canada/our-promise/public-reporting 58 http://www.pac.dfo-mpo.gc.ca/fm-gp/rec/species-especes/atlant-eng.html

52
since 2011 and three unconfirmed reports. The latest entry was August 2014. In the Seafood Watch standard, a score of 6 out of 10 is justified if “Monitoring data indicate only occasional detection of low numbers of escapees in the wild,” or 8 out of 10 if “Independent monitoring data show that escapees are not present in the wild.” The efforts made by the industry to mitigate the risk of escape are commendable, and recent success is evidenced by the last 6 years without significant reported escape events. Yet, the likelihood of unreported “trickle” escapes, the very high number of fish held in any one net pen, and the inherent vulnerability of net pen production systems mean that there continues to be a high risk of significant escapes from B.C. salmon farms (score 2 out of 10 in the Seafood Watch standard). In contrast, the available monitoring data (although limited) show low numbers of Atlantic salmon escapees present in the wild. Ultimately, the initial score for Factor 6.1 – Escape Risk is 5 out of 10. Recaptures Noakes (2011) reported a small percentage (less than 5% on average) of the escaped Atlantic salmon observed or reported caught in ocean fisheries or in freshwater in B.C., while largely incomplete data in Piccolo and Orlikowska (2012) show highly sporadic recaptures of Atlantic salmon in Washington State, B.C., and Alaska. Although recaptures are most substantial in B.C. (for example, 7,834 fish in the year 2000), the last figures included were from 2002. Previous references to recapture efforts as a condition of license were complicated by the requirements for fishing permits in B.C., and Pacific aquaculture licenses now no longer require recapture efforts. This is because of a reduced number of escapes, and reduced concern for potential impacts from competition or establishment (pers. comm., Dolmage, 2017). Regardless of the reason, there is no justification for a recapture adjustment, and the final score for Factor 6.1 – Escape Risk is 5 out of 10. Factor 6.2. Competitive and Genetic Interactions Atlantic salmon are a non-native species on the Pacific coast of Canada. Thus, they have the theoretical potential to cause considerable harm to ecosystems in B.C. and further afield. Atlantic salmon (presumed to be from B.C. or Washington State farms) have in the past been caught in southeast and even northern Alaska (Piccolo and Orlikowska 2012), and adult Atlantic salmon have also been caught or observed in streams in B.C. and Puget Sound (Bisson 2006) (Korman 2011) (Fisher et al. 2014). Leggatt et al. (2010) provide a useful review. Noakes (2011) presented data on the number of Atlantic salmon sightings or recoveries in B.C. rivers from 1987 to 2007. In this 20-year period, there were 1,099 recordings of Atlantic salmon in 80 rivers in B.C. The data over this period appear to show that increased numbers of observed Atlantic salmon are linked to periods of higher escapes, and this appears to also be the case in other studies; for example, Fisher et al. (2014) estimated that over half of the streams in their study area (Vancouver Island) were occupied by Atlantic salmon, though their surveys were conducted in 1997 to 1999, and Figure 11 shows these years followed and included years of high escape numbers (e.g., over 110,000 reported escapes in 1998). More recent surveys, conducted in 2011 and 2012 (Andres 2015), did not detect any Atlantic salmon
53
in 11 high priority stream systems (i.e., in those streams considered most likely to include Atlantic salmon). Juvenile Atlantic salmon have been captured in freshwater habitats in B.C., but of 668 farm-origin fish reported between 1996 and 2008 by Noakes (2011), the majority were escapes from freshwater hatcheries. Nevertheless, the successful natural spawning of Atlantic salmon has been reported in the Tsitika River on Vancouver Island in 1997 and 1998 (Volpe et al. 2000), and three river systems in B.C. have been reported to support wild-spawned juvenile Atlantic salmon (Volpe et al. 2001). Yet, whether escaped Atlantic salmon have established breeding populations in B.C. streams remains uncertain (Bisson 2006, in Thorstad et al. 2008) and this cannot be assumed to be evidence of establishment. According to Noakes (2011), although some streams have been actively surveyed for Atlantic salmon, the majority of the sightings or captures were reported through the passive Atlantic Salmon Watch Program.59 As noted above, these results show only three confirmed observations of Atlantic salmon since 2011 and three unconfirmed reports. The latest entry was August 2014. Also, though not looking specifically for Atlantic salmon, observers have not reported juvenile Atlantic salmon being caught in the extensive annual sampling of juvenile Pacific salmon in various locations in B.C.; e.g., (Bateman et al. 2016) (Peacock 2016) (BCAHS 2015). Despite at least 170 deliberate historic attempts to establish Atlantic salmon in 34 states in North America, Waknitz et al. (2002) reported that none had succeeded. Although Atlantic salmon have occurred in B.C. rivers and been caught in Alaska, the numbers are generally sparse and, in the case of Piccolo and Orlikowski (2012), include no data since 2002. The situation in the southern Pacific Ocean appears similar, and recent research indicates that previous concerns with the impact of “salmonids” (as a species group) in Chile have primarily been driven by species other than Atlantic salmon (e.g., brown and rainbow trout) and that Atlantic salmon shows little evidence of establishing self-sustaining populations (Arismendi 2012). Yet a concern for establishment remains, and in contrast to the historically unsuccessful establishment efforts, farmed Atlantic salmon may escape at multiple life stages and are likely to be increasingly acclimated to the Pacific environment with increasing generations of Pacific-raised farm stocks. Bisson (2006) states: “Despite a long history of failure to establish Atlantic salmon from single or a few deliberate introductions, it seems possible that continuous recruitment of fish escaping from farming operations may eventually lead to locally-adapted stocks. At that point, the species may rapidly become a dangerous invasive—a pattern that is often seen in other aquatic plants and animals where a prolonged early colonization period is followed by a rapid phase of exponential growth.” Alternatively, it could be argued that the continuing domestication of farmed salmon would make them less likely to establish in the wild; Jonsson and Jonsson (2006) list a number of genetic, morphological, and physiological characteristics of farmed salmon (also quoting Gross
59 http://www.pac.dfo-mpo.gc.ca/fm-gp/rec/species-especes/atlant-eng.html

54
et al. [1998]) that result in less competitive and reproductive potential. One likely demonstration of this phenomenon was when Noakes (2011) reported that, of 1,584 recaptured salmon in B.C., 80% had empty stomachs, leading the author to conclude that “most escaped Atlantic salmon do not successfully feed and survive for any extended period of time.” In addition, the ongoing need to control seals and sea lions in B.C. (see Criterion 9X) indicates it is likely that predation of escaped salmon will be significant. After a comprehensive review of the available information in Europe and the Pacific (including B.C.), Leggatt et al. (2010) conclude that poor survival, forage acclimation, dispersal, and reproduction may limit the effects of farmed organisms in some circumstances, but it cannot be assumed to limit effects in all circumstances; they also conclude that wild populations with strong numbers exposed to few escaped fish (e.g., Pacific salmon populations) would not be expected to be as susceptible to the effects of escaped fish. This assessment, therefore, needs to address the conflicting realities of the ongoing potential for establishment and the to-date lack of evidence of establishment in the north (or south) Pacific. The key aspects appear to be:
The lack of apparent establishment despite historic introduction efforts
The lack of apparent establishment despite repeated escapes of tens of thousands of fish of varying ages, at varying times of year, and in various locations over the last 20 years
The limited potential for competition, predation, hybridization, or reproductive interference (in Leggatt et al. 2010)
A similar circumstance in Chile, where Atlantic salmon have not established despite the establishment success of various other salmonids.
Even if Atlantic salmon does not establish, its repeated introduction into the wild through farm escapes can have similar or additional impacts to those that would occur if the species did become established. It is likely that fish that do not leave the farm site after escape will continue to feed on pellets that pass through pens uneaten, but those fish that disperse successfully from the site are assumed to feed on items other than farm pellets (i.e., on wild fish) (Olsen and Skilbrei 2010). As noted above, though a small number of recaptured escapes in B.C. had stomach contents identifiable as fish (3.5% of recaptures sampled), the vast majority had empty stomachs (Noakes 2011). In addition, although the timing of escapes may introduce salmon into the wild when they would not normally be present in B.C. inshore waters, the numbers of escaping Atlantic salmon are considered small compared to the significant wild populations of wild Pacific salmon; therefore, additional predation pressure or competition is not considered a high concern. It is possible that any breeding attempts made by Atlantic salmon could disturb Pacific salmon eggs, but currently this is largely hypothetical and there are not considered to be any other habitat effects beyond this. It now seems clear that Atlantic salmon, unlike many other salmonid species, is a poor colonizer beyond its native range. Although one study reported the presence of juvenile Atlantic salmon in B.C. to be the result of natural spawning in a river in 1999, this observation has not been repeated since (although it must be noted that the Atlantic Salmon Watch was not active

55
between 2003 and 2011, and dedicated observation effort may have been limited since then to Andres, 2015). Despite the release of millions of Atlantic salmon in B.C. over more than a century in deliberate attempts to establish the species for sport fishing, plus the large numbers of escapes over more recent decades, there has not been any evidence of Atlantic salmon establishing in B.C. over more than a decade since the 1999 study. Although occasionally present in the wild—a result of farm escapement—Atlantic salmon are now considered highly unlikely to establish in B.C., and currently there is no evidence of any significant, ecological impacts of escaping Atlantic salmon in B.C. The score for Factor 6.2 – Invasiveness is 6 out of 10. Conclusions and Final Score The annual number of reported escapes since 2010 has been low, with a maximum of 22 fish reported in one year (2016). Significant undetected or unreported trickle escapes may occur, but though dedicated monitoring is limited, there is no evidence for the presence of significant numbers of escaped farmed salmon in the wild in B.C. Large-scale escape events, numbering thousands of fish each, have not occurred in recent years in B.C., but continue to occur from similar productions systems globally. Despite the low recent escapes in B.C., the potential for escapes due to human error or bad weather is somewhat inherent to the system. Atlantic salmon are non-native in B.C., yet evidence increasingly shows the species to be a poor colonizer outside of its native range. Despite repeated efforts over more than a century to establish the species for sport fishing, plus the large numbers of escapes over more recent decades, there is no evidence of establishment, and Atlantic salmon is considered highly unlikely to become established in B.C. Overall, the final score for Criterion 6 – Escapes is a combination of the risk of escape (Factor 6.1) and the invasiveness (Factor 6.2), and is 5 out of 10.

56
Criterion 7. Disease; Pathogen and Parasite Interactions Impact, unit of sustainability and principle Impact: amplification of local pathogens and parasites on fish farms and their
retransmission to local wild species that share the same water body Sustainability unit: wild populations susceptible to elevated levels of pathogens and
parasites Principle: Aquaculture operations pose no substantial risk of deleterious effects to wild
populations through the amplification and retransmission of pathogens or parasites.
Criterion 7 Summary Pathogen and parasite parameters Score
C7 Biosecurity 4.00
C7 Disease; pathogen and parasite Final Score 4.00 YELLOW
Critical? NO
Brief Summary There is a growing body of research on the potential impacts of pathogens and parasites on wild salmon survival in B.C. and elsewhere, though gaps in understanding still exist. Mortality rates due to bacterial and viral pathogens on salmon farms in B.C. are low (at most, approximately half of the total monthly mortality rate from all causes of 1% to 1.5%), but the chronic presence of pathogens on farms, even without significant mortalities, can act as a reservoir of potential infection for wild fish. The most recent publication from key research under the Strategic Salmon Health Initiative (SSHI) on the identification of heart and skeletal muscle inflammation disease (HSMI) on a farm specifically states that the results cannot be used to infer the spatial extent of this disease or potential impacts on wild Pacific salmon. Regarding bacterial and viral pathogens more broadly, although a level of concern is warranted, there is currently no evidence that there is any impact from salmon farms to wild salmon. Importantly, there is also no evidence that there is no impact. Although direct cause-and-effect relationships between sea lice on farms and mortality of wild salmon have not been made due to the practical scientific challenges of demonstrating it, substantial modeling evidence correlates the two. Uncertainty remains, yet the salmon farming industry’s improved management since approximately 2003 has broadly been considered successful in mitigating the risk of impact to wild salmon; however, the higher lice levels in 2015 (associated with anomalous higher water temperatures and poorly coordinated farm treatments) highlighted the fact that sea lice on farms are not fully under control. Although louse transfer from farms appears to have returned to pre-2015 levels in 2016 and to date in 2017, the 2015 event demonstrated that the industry is still vulnerable to environmental variability. Understanding the impact of sea lice to individual fish, and cumulatively to populations, is challenging; the population dynamics of wild salmon in B.C. are extremely complex, and large

57
stochastic fluctuations in abundance are associated with multifaceted oceanographic and biological conditions and inter-salmonid species interactions (in addition to direct human impacts including commercial fishing and habitat damage). Numerous complex factors relate to the mortality signature, such as salmon species, size, condition, lice stage, resistance to infection, predation, and competition. Although studies on direct mortality of wild fish due to sea lice indicate that this may be relatively low, the results of modeling studies that assess the overall mortality signature due to sea lice on farms (i.e., including increased predation and all other factors listed above) project a notable loss of returning fish (e.g., 23% of pink salmon in the Broughton Archipelago due to the sea lice levels in 2015) as a result of high sea lice infection years. Nevertheless, the impact of these outbreak years on the longer-term population dynamics is uncertain, and considering the enormous stochastic variability in annual wild salmon returns, the apparently anomalous (in the last decade) impact in 2015 does not appear to directly affect the longer-term population size or its ability to recover. Overall, there is clearly a pathogen and parasite concern in regard to the location of salmon farms along migration routes of wild salmon, and this concern is highlighted by the importance of wild salmon. But after detailed consideration, the available data indicate that, although sea lice levels in particular are not fully under control and mortality in anomalous years might be substantial, there is currently insufficient evidence to conclude that population-level impacts to wild salmon are occurring due to pathogen and/or parasite transfer from salmon farms. The final score for Criterion 7 – Disease is therefore 4 out of 10 (see the Seafood Watch Aquaculture Standard for more details of the scoring framework).
Justification of Ranking Introduction The open nature of net pen salmon farms means the fish are vulnerable to infection by pathogens from the surrounding waterbody, from wild fish, or from other natural infection routes, and can act as a temporally unnatural reservoir for a variety of pathogens and parasites that have the potential to be transmitted or re-transmitted to wild resident organisms, including native salmon species (Hammell et al. 2009). Thus, the expansion of salmon aquaculture has brought conservation concerns into regions such as in B.C. where the areas occupied by salmon farms are important migratory corridors for wild salmon (Peacock et al. 2014). In B.C., these concerns were highlighted when high sea lice levels in 2001 and 2002, and the increasing scale of salmon farming in the region, appeared to initiate a multiyear decline in wild salmon production. Many peer-reviewed studies attributed severe impacts on wild populations to salmon farms; Krkosek et al. (2007), for example, predicted “the recurrent louse infestations of wild juvenile pink salmon (Oncorhynchus gorbuscha), all associated with salmon farms, have depressed wild pink salmon populations and placed them on a trajectory toward rapid local extinction.” Although the predictions of such models have often been questioned (e.g., [Brooks and Jones 2008]), subsequent changes in management practices on farms and a reduction in
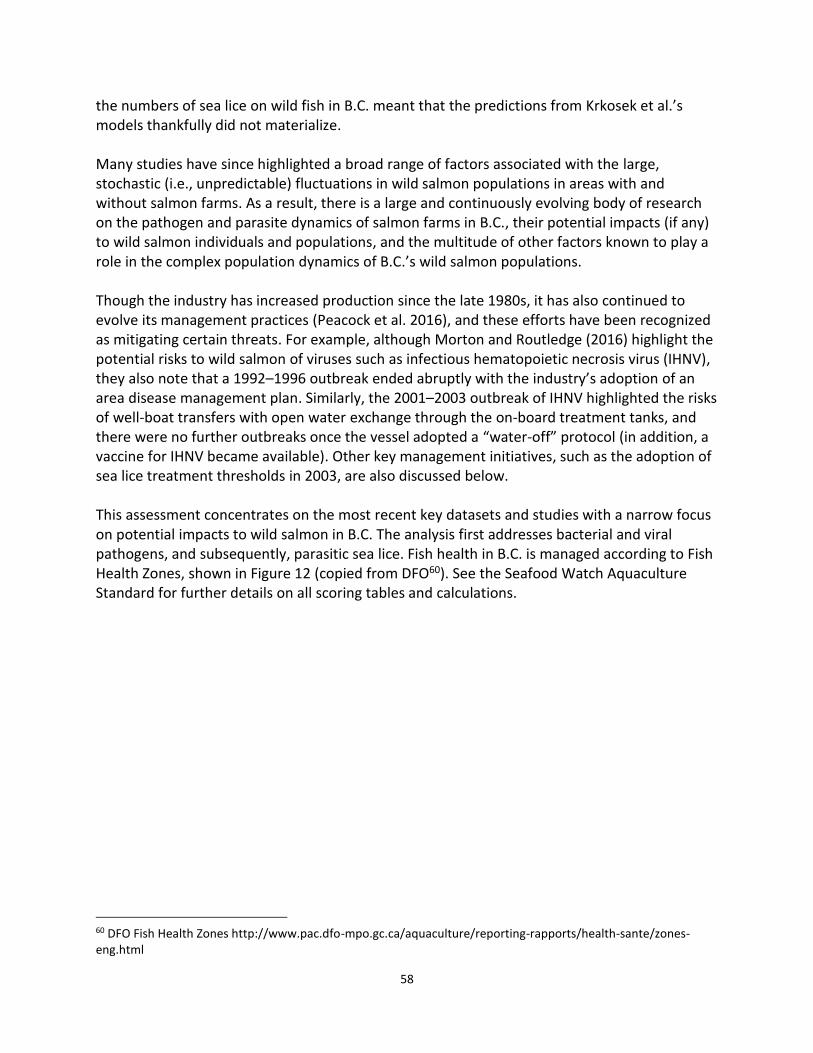
58
the numbers of sea lice on wild fish in B.C. meant that the predictions from Krkosek et al.’s models thankfully did not materialize. Many studies have since highlighted a broad range of factors associated with the large, stochastic (i.e., unpredictable) fluctuations in wild salmon populations in areas with and without salmon farms. As a result, there is a large and continuously evolving body of research on the pathogen and parasite dynamics of salmon farms in B.C., their potential impacts (if any) to wild salmon individuals and populations, and the multitude of other factors known to play a role in the complex population dynamics of B.C.’s wild salmon populations. Though the industry has increased production since the late 1980s, it has also continued to evolve its management practices (Peacock et al. 2016), and these efforts have been recognized as mitigating certain threats. For example, although Morton and Routledge (2016) highlight the potential risks to wild salmon of viruses such as infectious hematopoietic necrosis virus (IHNV), they also note that a 1992–1996 outbreak ended abruptly with the industry’s adoption of an area disease management plan. Similarly, the 2001–2003 outbreak of IHNV highlighted the risks of well-boat transfers with open water exchange through the on-board treatment tanks, and there were no further outbreaks once the vessel adopted a “water-off” protocol (in addition, a vaccine for IHNV became available). Other key management initiatives, such as the adoption of sea lice treatment thresholds in 2003, are also discussed below. This assessment concentrates on the most recent key datasets and studies with a narrow focus on potential impacts to wild salmon in B.C. The analysis first addresses bacterial and viral pathogens, and subsequently, parasitic sea lice. Fish health in B.C. is managed according to Fish Health Zones, shown in Figure 12 (copied from DFO60). See the Seafood Watch Aquaculture Standard for further details on all scoring tables and calculations.
60 DFO Fish Health Zones http://www.pac.dfo-mpo.gc.ca/aquaculture/reporting-rapports/health-sante/zones-eng.html

59
Figure 12: Map of Fish Health Zones in B.C. Image copied from DFO.
Bacterial and Viral Pathogens DFO provides average monthly mortality figures by health zone and a classification of mortalities from 2014 to 2016. Figure 13 shows that average monthly mortality is between 1% and 1.5% (average 1.32%) over the 3-year period (i.e., 12 to 18% per year). Figure 14 shows the mortality classification data for the last complete year (2015), of which 54% (25% “fresh silvers61” and 29% “decomposed62”) are potentially caused by bacterial or viral pathogens. Marty (2015), in a review of farmed–wild salmon interactions, states that less than 1% of B.C. farmed Atlantic salmon die of diseases that might be infectious to wild Pacific salmon. But it must be clarified that the pathogens reviewed were limited to those listed by the World Organisation for Animal Health (OIE) and therefore officially reportable in B.C., and this list does not include all pathogens of potential interest to farmed–wild salmon dynamics in B.C. Also, the methodology (requiring all sampled fish to be positive for any one pathogen to elicit a positive
61 The term “fresh silver” implies dead fish for which there are no immediately apparent causes of mortality. 62 Note: fish in the “decomposed” category are not tested to assess the cause of death, either due to environmental or pathogenic causes.

60
result) may underrepresent the true disease-related mortalities; that is, they are likely to be higher than the 1% over the production cycle stated in Marty (2015).
Figure 13: Average monthly mortality rates for all active salmon farms in B.C. from 2014 to 2016. Data for 2016 is
an average of the first three quarters. Data from DFO.
Figure 14: Classification of mortalities in 2015, averaged across all Health Zones in B.C. Data from DFO.
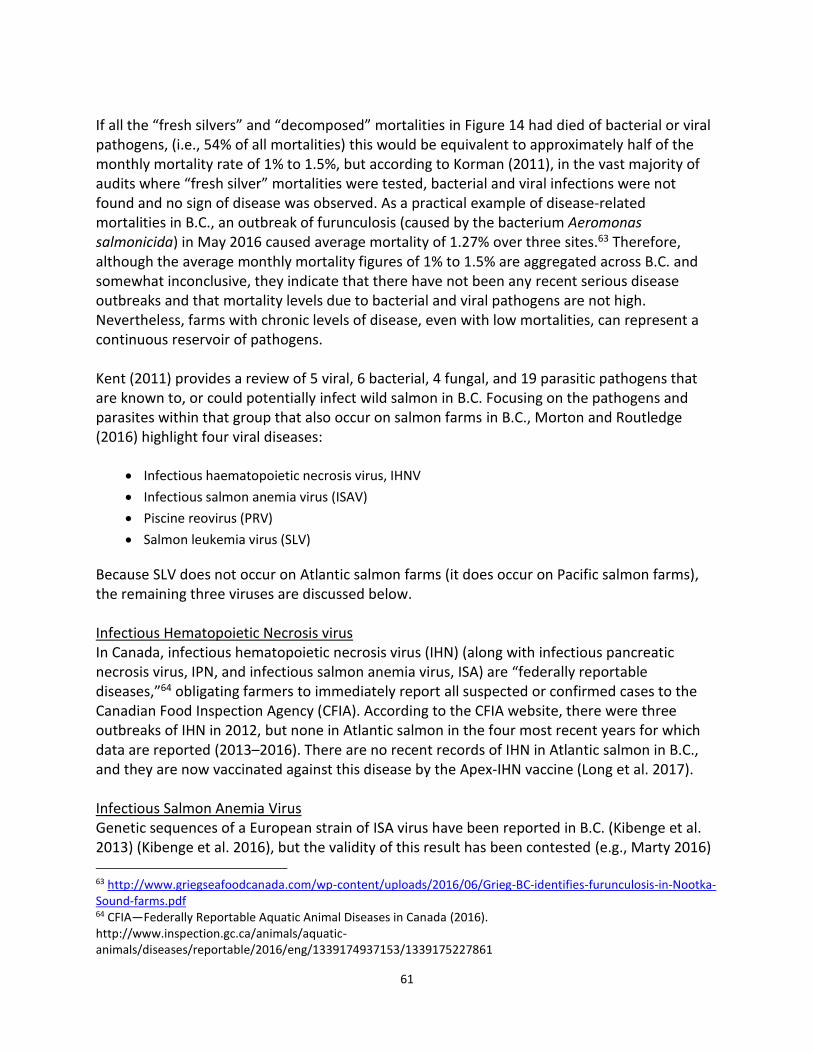
61
If all the “fresh silvers” and “decomposed” mortalities in Figure 14 had died of bacterial or viral pathogens, (i.e., 54% of all mortalities) this would be equivalent to approximately half of the monthly mortality rate of 1% to 1.5%, but according to Korman (2011), in the vast majority of audits where “fresh silver” mortalities were tested, bacterial and viral infections were not found and no sign of disease was observed. As a practical example of disease-related mortalities in B.C., an outbreak of furunculosis (caused by the bacterium Aeromonas salmonicida) in May 2016 caused average mortality of 1.27% over three sites.63 Therefore, although the average monthly mortality figures of 1% to 1.5% are aggregated across B.C. and somewhat inconclusive, they indicate that there have not been any recent serious disease outbreaks and that mortality levels due to bacterial and viral pathogens are not high. Nevertheless, farms with chronic levels of disease, even with low mortalities, can represent a continuous reservoir of pathogens. Kent (2011) provides a review of 5 viral, 6 bacterial, 4 fungal, and 19 parasitic pathogens that are known to, or could potentially infect wild salmon in B.C. Focusing on the pathogens and parasites within that group that also occur on salmon farms in B.C., Morton and Routledge (2016) highlight four viral diseases:
Infectious haematopoietic necrosis virus, IHNV
Infectious salmon anemia virus (ISAV)
Piscine reovirus (PRV)
Salmon leukemia virus (SLV)
Because SLV does not occur on Atlantic salmon farms (it does occur on Pacific salmon farms), the remaining three viruses are discussed below. Infectious Hematopoietic Necrosis virus In Canada, infectious hematopoietic necrosis virus (IHN) (along with infectious pancreatic necrosis virus, IPN, and infectious salmon anemia virus, ISA) are “federally reportable diseases,”64 obligating farmers to immediately report all suspected or confirmed cases to the Canadian Food Inspection Agency (CFIA). According to the CFIA website, there were three outbreaks of IHN in 2012, but none in Atlantic salmon in the four most recent years for which data are reported (2013–2016). There are no recent records of IHN in Atlantic salmon in B.C., and they are now vaccinated against this disease by the Apex-IHN vaccine (Long et al. 2017). Infectious Salmon Anemia Virus Genetic sequences of a European strain of ISA virus have been reported in B.C. (Kibenge et al. 2013) (Kibenge et al. 2016), but the validity of this result has been contested (e.g., Marty 2016) 63 http://www.griegseafoodcanada.com/wp-content/uploads/2016/06/Grieg-BC-identifies-furunculosis-in-Nootka-Sound-farms.pdf 64 CFIA—Federally Reportable Aquatic Animal Diseases in Canada (2016). http://www.inspection.gc.ca/animals/aquatic-animals/diseases/reportable/2016/eng/1339174937153/1339175227861

62
and the Canadian Food Inspection Agency (CFIA) states that “ISA has not been found in the Pacific Ocean watershed or the Pacific Ocean off British Columbia.” There have been no confirmed cases of pathogenic ISA in B.C. farms,65 and there have been no detections of ISA in wild fish samples in B.C. or elsewhere in the Pacific Northwest (CFIA 2014). ISA has not been documented to have caused mortality of any wild fish globally (APHIS 2016). Piscine Reovirus Morton and Routledge (2016) also highlight Piscine Reovirus (PRV) and the associated66 disease, heart and skeletal muscle inflammation (HSMI), as a risk to wild salmon in B.C. DiCicco et al. (2017), in the first publication from the Strategic Salmon Health Initiative (SSHI), reported HSMI associated with PRV in farmed salmon in B.C., and noted PRV has been detected in most Pacific salmon species that have been tested in B.C., Washington, and Alaska (although at lower prevalence than on farms). The source of PRV in B.C. is uncertain; it may have always been there, it could have come from historic introductions of Atlantic salmon into B.C., or it could have been introduced with more recent introductions of European fish as salmon farming expanded in B.C. Marty et al. (2015) showed that PRV was detected among wild and farmed salmonids in B.C. from 1987 onward, with the earliest potentially PRV-positive sample from a wild steelhead trout in 1977 (before salmon farming began in B.C.). Although Kibenge et al. (2013) reported that the strain of PRV in B.C. had recently diverged from a Norwegian strain (and therefore was considered to have been introduced into B.C. with movements of salmon into the country from Norway), Siah et al. (2016a and 2016b) also note that PRV has been present in B.C. for a long time, and did not recently diverge from a Norwegian strain as proposed by Kibenge et al. (2013). In regard to the disease HSMI, the study by DiCicco et al. (2017) in B.C. represents the third country (after Norway and Chile) in which PRV has been associated with HSMI lesions in farmed Atlantic salmon, providing supporting evidence that PRV appears to be a component for HSMI development, but falling short of demonstrating that PRV alone is sufficient to cause HSMI. The same study shows it is likely that HSMI could have been detected in earlier farmed Atlantic salmon samples from 2011 to 2015 if different methodologies had been used (for example, two fish in 1,013 farmed salmon samples taken in 2014 and 2015 showed lesions characteristic of HSMI, and a confirmed diagnosis was not made at that time, as reported by Marty et al. 2015). The presence of the PRV virus in wild Pacific salmon in B.C. is clearly a potential concern in regard to the associated HSMI disease, but according to DFO (2015), there have been no reported occurrences of HSMI in wild fish in B.C. or in wild salmon anywhere globally. Garver et al. (2016a, b) show that PRV can be transmitted from farmed salmon to wild salmon, but they concluded the Pacific coast strain of PRV, though transmissible, was of low pathogenicity for Chinook and sockeye salmon, and did not cause HSMI. Although the methodologies and results of these studies (e.g., Garver et al.) are not yet definitive, DiCicco et al. (2017) advance the
65 CFIA Disease reporting 2016. http://www.inspection.gc.ca/animals/aquatic-animals/diseases/reportable/isa/eng/1327197013896/1327197115891 66 The clinical association between PRV and HSMI continues to be debated. See DFO (2015) for a review.

63
knowledge on PRV and HSMI, yet still warn that it is important to put their most recent data into perspective with regard to the role that PRV has on HSMI in B.C. salmon. They conclude that the results cannot be used to infer the spatial extent of this disease or potential impacts on other species, such as wild Pacific salmon. An earlier study by Miller et al. (2014) reported that PRV-infected sockeye salmon were 2.3 times less likely to reach their spawning grounds than uninfected fish, and although the result was not statistically significant, they inevitably imply some level of concern. Nevertheless, the ongoing research in the SSHI is clearly advancing the knowledge base, and in a DFO media update conference call on B.C. salmon health research in May 2016,67 Miller and Riddel (lead scientists in the SSHI project) made it clear that HSMI has never been found in wild salmon, and there is no evidence that Pacific salmon are susceptible to that disease. Piscirickettsia salmonis A bacterial pathogen not covered by Morton and Routledge (2016) is Piscirickettsia salmonis, which causes the disease salmon rickettsial septicemia (SRS). With highly anomalous temperatures in the winter of 2014 and through 2015, there was a substantial increase in cases of SRS in Atlantic salmon in farms in 2015 detected under DFO’s Fish Health Audit and Surveillance Program (Figure 15). In Fish Health Zone 2.4 on the west coast of Vancouver Island, 100% of sites sampled positive for SRS in the first quarter of 2016.
67 Transcript provided by BCSFA.
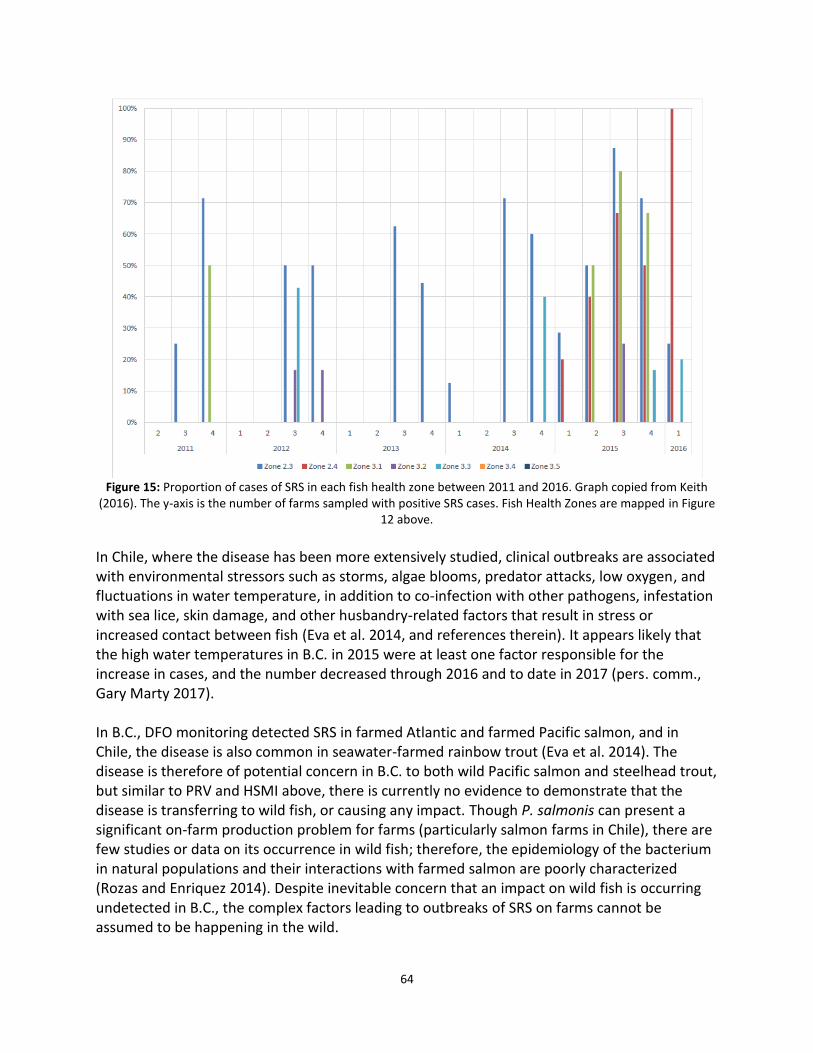
64
Figure 15: Proportion of cases of SRS in each fish health zone between 2011 and 2016. Graph copied from Keith
(2016). The y-axis is the number of farms sampled with positive SRS cases. Fish Health Zones are mapped in Figure 12 above.
In Chile, where the disease has been more extensively studied, clinical outbreaks are associated with environmental stressors such as storms, algae blooms, predator attacks, low oxygen, and fluctuations in water temperature, in addition to co-infection with other pathogens, infestation with sea lice, skin damage, and other husbandry-related factors that result in stress or increased contact between fish (Eva et al. 2014, and references therein). It appears likely that the high water temperatures in B.C. in 2015 were at least one factor responsible for the increase in cases, and the number decreased through 2016 and to date in 2017 (pers. comm., Gary Marty 2017). In B.C., DFO monitoring detected SRS in farmed Atlantic and farmed Pacific salmon, and in Chile, the disease is also common in seawater-farmed rainbow trout (Eva et al. 2014). The disease is therefore of potential concern in B.C. to both wild Pacific salmon and steelhead trout, but similar to PRV and HSMI above, there is currently no evidence to demonstrate that the disease is transferring to wild fish, or causing any impact. Though P. salmonis can present a significant on-farm production problem for farms (particularly salmon farms in Chile), there are few studies or data on its occurrence in wild fish; therefore, the epidemiology of the bacterium in natural populations and their interactions with farmed salmon are poorly characterized (Rozas and Enriquez 2014). Despite inevitable concern that an impact on wild fish is occurring undetected in B.C., the complex factors leading to outbreaks of SRS on farms cannot be assumed to be happening in the wild.

65
Parasitic Sea Lice The dominant focus of research on the interactions between farmed and wild salmon in B.C. has been the parasitic sea lice Lepeoptheirus salmonis and (to a lesser extent) Caligus clemensi. For an overview of sea lice population ecology and epidemiology in B.C., see Saksida et al. (2015). Peacock et al. (2014) outline the broader concern, stating: “Outwardly migrating juvenile salmon are relatively free of sea lice, which cannot survive in freshwater. [In natural ecosystems] Juvenile salmon are not exposed to substantial numbers of sea lice until several months into their migration when they encounter returning adult salmon. However, in recent decades, salmon farms have provided a host reservoir population for sea lice that persists year-round in close proximity to salmon-bearing rivers. The high density of hosts on salmon farms can amplify natural infestations and sea lice can spill back from farmed salmon to infest juvenile wild salmon very early in the juvenile salmon migration.” It has been demonstrated that salmon farms can be a source of lice infection for wild salmon; e.g., (Marty et al. 2010) (Price et al. 2012). But quantifying the impact of that transmission to wild salmon individuals and populations has been debated, particularly given the existence of confounding factors, such as multiple sources of mortality, complex wild salmon population dynamics, environmental stochasticity, and observation errors in both salmon and sea lice data (Peacock et al. 2013). A characteristic of the scientific debate has been the use of mathematical models to help identify patterns in sea lice data and wild salmon populations, and a rich modeling literature devoted to sea louse and salmon epidemiology has been developed (Groner et al. 2016). With the enormous complexity of the ecosystem being modeled and the necessary simplifications and assumptions, it is somewhat inevitable that the models and their conclusions can be questioned (and have been in the scientific literature), but at the same time, the industry has continued to evolve its management practices (Peacock et al. 2013). Sea lice numbers on salmon farms In 2003, sea lice monitoring on farms became mandatory as part of a provincial sea lice management strategy, and a limit on sea lice numbers above which the fish must be treated (three motile L. salmonis sea lice per fish) was established for farmed fish between March and the end of June, when juvenile salmon outmigrate (Saksida et al. 2015). Peacock et al. (2013) showed that the threshold, in combination with winter pesticide treatments, was effective at reducing sea lice epizootics,68 and Figure 16 shows an example (copied from Bateman et al. 2016) of an October treatment that reduced lice levels through the winter, with another treatment required in April because the threshold was exceeded during the wild salmon outmigration period. Nevertheless, further examples below show that the industry’s management remains vulnerable to environmental variability and is not always successful.
68 Epizootic: an outbreak of disease affecting many animals of one kind at the same time (analogous to “epidemic” in humans).

66
Figure 16: Example progression of sea lice numbers at a salmon farm in the Broughton Archipelago in 2015 (in
motile L. salmonis per farmed salmon) showing counts below the treatment threshold (open circles) and above it (black circles) in addition to chemical treatments (red arrows) prior to, and during the March–June outmigration
period (grey). The “x” marks show lice levels in previous years (2005–2014). Graph copied (and edited) from Bateman et al. (2016).
Although the aggregated data do not fully represent local peak lice numbers (or local absences of lice), they provide a convenient initial overview of the industry. Figure 16, copied from BCSFA (2016), shows that the number of motile L. salmonis lice (in green) has been consistently below the treatment threshold of three motile lice per fish (horizontal bars) during the March to June wild salmon outmigration period (highlighted in pink) from 2006 to 2012, but has approached or exceeded it for short periods from 2013 to 2015. Figure 17 shows that the lice burden was higher throughout 2015 compared to previous years, and as discussed in further detail below, these averaged values hide much higher levels of lice in some regions.
Figure 17: On-farm L. salmonis sea lice numbers from 2006 to December 2015. Graph copied from BCSFA (2016).

67
Considering the lice levels after 2015, Figure 18 shows an analysis of industry sea lice counts for the month of March69 (i.e., at the start of the wild salmon outmigration season) from 2014 to 2017 (data from DFO70) and, though not conclusive or robustly indicative of the later periods in the wild salmon outmigration, they demonstrate that 2016 and 201771 had lower sea lice levels on farms in this period compared to 2015.
Figure 18: Average March motile sea lice numbers on farms from 2014 to 2017. Data from DFO.
An analysis of DFO’s sea lice audit data (Figure 19) shows there was some disagreement between the industry’s reported figures and the audit checks in 2015 and 2016, but in general, the industry-reported figures are largely in statistical agreement with the audits. The lowest level of consistency was in 2015 when sea lice numbers were higher for a large part of the year.
69 At the time of writing (June 2017) DFO has data up to the end of March 2017. Therefore, the March data were compared to the same period in previous years to give an indication of the early-season lice loads. 70 http://www.pac.dfo-mpo.gc.ca/aquaculture/reporting-rapports/index-eng.html 71 Note the average for all B.C. sites in 2017 excludes two outlier counts that had extreme lice levels (39.82 and 33.27 lice per fish). Excluding these sites is valid in order to correctly identify the overall lice situation across all farms in B.C. No such extreme outliers were seen during March in the previous years analyzed.

68
Figure 19: Analysis of DFO sea lice audit data showing the percentage of audit lice counts that agree with the
industry’s counts. Data from DFO “Public Reporting on Aquaculture—Sea Lice.”
The numbers of Caligus lice (commonly referred to as the herring louse) are also of importance regarding their potential transmission to outmigrating wild salmon (e.g., Godwin et al. 2017; discussed further below), and are not shown by BCSFA (2016) in Figure 18. The treatment threshold of three motile lice per fish in B.C. also does not apply to Caligus lice, but an analysis of detailed lice counts available from DFO shows that in the 6 years from 2011 to 2016 (i.e., the period of detailed data availability), Caligus levels on salmon farms in B.C. have generally been low, with a maximum of 6.5% of counts in any single year (and a minimum of 0.7%) showing greater than three Caligus lice per fish (Figure 20). Even so, the total number of lice on farms can still be substantial due to the large number of fish present, even if the intensity (i.e., the total number of lice per total number of salmon with lice) is low. There are some notable exceptions of very high Caligus lice numbers, with a peak event of 47.3 lice per fish at one site in 2013; because Caligus lice are more generalist parasites (i.e., not salmonid-specific), these outbreaks are likely due to transmission from herring or other secondary hosts. There are no cases where audited Caligus counts are statistically different from the industry’s self-reported counts in this 6-year period.
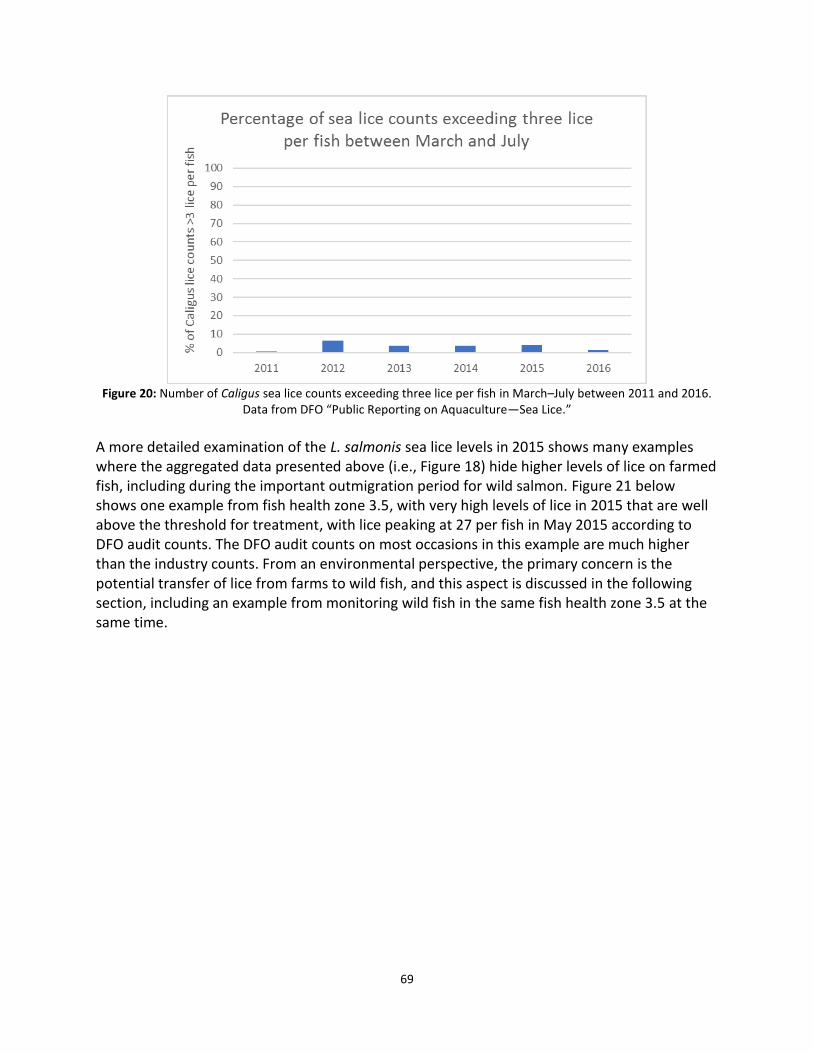
69
Figure 20: Number of Caligus sea lice counts exceeding three lice per fish in March–July between 2011 and 2016.
Data from DFO “Public Reporting on Aquaculture—Sea Lice.”
A more detailed examination of the L. salmonis sea lice levels in 2015 shows many examples where the aggregated data presented above (i.e., Figure 18) hide higher levels of lice on farmed fish, including during the important outmigration period for wild salmon. Figure 21 below shows one example from fish health zone 3.5, with very high levels of lice in 2015 that are well above the threshold for treatment, with lice peaking at 27 per fish in May 2015 according to DFO audit counts. The DFO audit counts on most occasions in this example are much higher than the industry counts. From an environmental perspective, the primary concern is the potential transfer of lice from farms to wild fish, and this aspect is discussed in the following section, including an example from monitoring wild fish in the same fish health zone 3.5 at the same time.
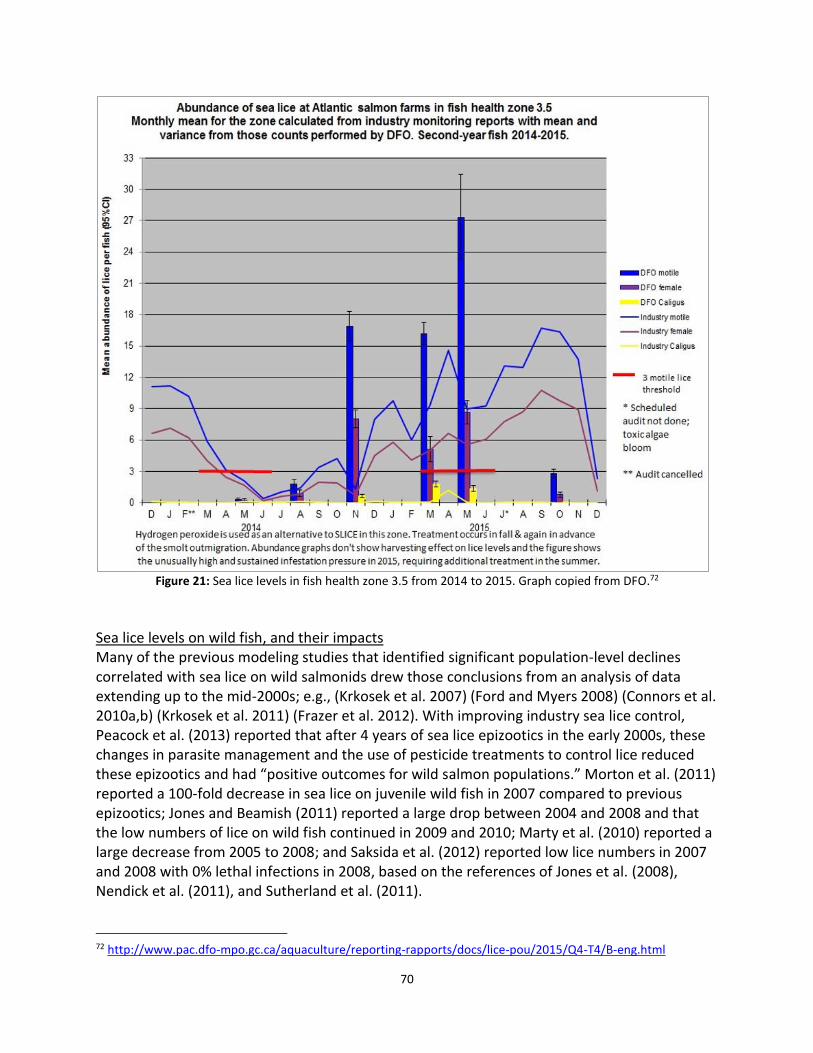
70
Figure 21: Sea lice levels in fish health zone 3.5 from 2014 to 2015. Graph copied from DFO.72
Sea lice levels on wild fish, and their impacts Many of the previous modeling studies that identified significant population-level declines correlated with sea lice on wild salmonids drew those conclusions from an analysis of data extending up to the mid-2000s; e.g., (Krkosek et al. 2007) (Ford and Myers 2008) (Connors et al. 2010a,b) (Krkosek et al. 2011) (Frazer et al. 2012). With improving industry sea lice control, Peacock et al. (2013) reported that after 4 years of sea lice epizootics in the early 2000s, these changes in parasite management and the use of pesticide treatments to control lice reduced these epizootics and had “positive outcomes for wild salmon populations.” Morton et al. (2011) reported a 100-fold decrease in sea lice on juvenile wild fish in 2007 compared to previous epizootics; Jones and Beamish (2011) reported a large drop between 2004 and 2008 and that the low numbers of lice on wild fish continued in 2009 and 2010; Marty et al. (2010) reported a large decrease from 2005 to 2008; and Saksida et al. (2012) reported low lice numbers in 2007 and 2008 with 0% lethal infections in 2008, based on the references of Jones et al. (2008), Nendick et al. (2011), and Sutherland et al. (2011).
72 http://www.pac.dfo-mpo.gc.ca/aquaculture/reporting-rapports/docs/lice-pou/2015/Q4-T4/B-eng.html

71
Figure 22 shows annual monitoring data from the well-studied Broughton Archipelago region, with a steep decline in lice prevalence (i.e., the number of wild fish with at least one louse) from the year 2001, and then lower prevalence (20% to 50%) between 2006 and 2014, with an increase in prevalence and the number of lice per fish in 2015 and 2016 (Peacock 201673). The higher lice levels in 2016 were associated with dramatic increases in Caligus lice coinciding with an increase in juvenile herring, which are common hosts of this parasite (e.g., Krkosek, 2007); this aspect is discussed in more detail later; e.g., Figure 26.
Figure 22: Sea lice prevalence and lice-per-fish on pink and chum salmon in the Broughton Archipelago from 2001
to 2016. Graph copied from Peacock (2016).
Studies in other regions of B.C. show similar results, with a high lice prevalence on wild fish in 2015 compared to previous years; for example, Figure 23 shows prevalence of wild pink salmon infected with lice in the Klemtu production area in fish health zone 3.5 (i.e., in the same region and at the same time as the high lice levels on farms noted in Figure 21 above), and notes the return to low prevalence in 2016 (BCAHS 2016).
73 A more thorough report on the sampling and results are available from Peacock et al. (2016).

72
Figure 23: Prevalence of L. salmonis sea lice on pink salmon in Klemtu area. Prevalence is the percentage of fish
with at least one louse (i.e., 1 = 100%). Graph copied from BCAH (2016).
Bateman et al. (2016) show similar data (Figure 24) for the number of motile L. salmonis sea lice (i.e., not including the Caligus lice associated with juvenile herring) on pink and chum salmon in the Broughton Archipelago, highlighting the drop in sea lice numbers after the large outbreaks in 2001 and subsequent changes to on-farm sea lice management. The low lice levels on wild fish in 2003 (Figure 24) were attributed by Bateman et al. (2016) to the fallowing of farms adjacent to sampling sites and along the studied migration route. The lice levels on juvenile fish in the years 2006 to 2007 and 2009 to 2014 are similar to those in 2003, and therefore appear to indicate that infection pressure in these years was similar to 2003 when there were fewer farmed salmon along the migration route. For reference, Marty et al. (2010) noted that lice levels in 2003 were low across the Broughton region in general, and therefore it is not clear that the lower lice levels discussed in Bateman et al. (2016) were simply correlated only with the number of farmed salmon along the migration route.

73
Figure 24: Numbers of motile lice (L. salmonis) on juvenile pink and chum salmon in the Broughton Archipelago.
Graph copied from Bateman et al. (2016). The authors’ asterisk: * “In 2003, the farms adjacent to juvenile salmon sampling sites and most farms along the migration route we sampled—11 in total—were fallowed.”
Figure 24 shows the levels of lice on wild fish increased substantially in 2015, and Bateman et al. (2016) estimated the mortality rate of pink salmon would be 23% (95% confidence limits of 9 to 39%); note this mortality rate is the projected reduction in the number of adult pink salmon returning to spawn 1 year later, not the direct mortality of juvenile fish due to lice. This projection reflects a substantial would-be reduction in the number of returning salmon, but analysis of the actual 2016 returns has not yet been done (i.e., the estimate was made before the return numbers of fish in 2016 were known, and the mortality factor in the model calculations was based on previous time series of mortality signatures in wild salmon populations (i.e., Peacock et al. 2013). In contrast, Saksida et al. (2012) reported that none of the 669 fish (i.e., zero percent) sampled in 2008, a year with similar lice intensity to 2015 (Figure 24), had lethal infections of sea lice. Although the number of copepodids and chalimus lice stages were higher in 2015 compared to 2008 (Figure 22), chalimus stages cause only mild and localized pathology (although even this may have adverse effects on fish health) and pre-adult motile sea lice tend to cause the most damage (Saksida et al. 2015). Both Figures 22 (from Peacock 2016) and 24 (Bateman et al. 2016) indicate the numbers of motile lice in 2015 and 2016 are similar to the “no lethal infection” levels of 2008 described by Saksida et al. (2012). Exploring these levels of sea lice infection further, Saksida (2015 and references therein) specify a “no-effect” threshold for sub-lethal disturbance of one chalimus stage 4 louse on a 0.5 g pink salmon, and Jones et al. (2009) reported the lethal level for pink salmon weighing less than 0.7 g to be 7.5 L. salmonis per gram of weight (i.e., 3.75 lice on a 0.5 g salmon). Braden et al. (2015) reported that above this weight (0.7 g), pink salmon are resistant to sea lice, and eventually reject them. With rapid growth rates, the period of vulnerability is short (although the exposure

74
period is long), and though Figure 22 shows that 70% of salmon had at least one louse per fish in 2015, the prevalence and average number of lice per fish is much lower in most years. The peak levels shown in Figures 22 and 24 in 2015 in the Broughton region appear to be at the threshold between “no-effect” and some level of impact to homeostasis in pink salmon. It should be noted that some of these mortality threshold values come from laboratory tests, which Vollset et al. (2017) caution may have a bias due to the use of hatchery-reared fish and the lack of synergistic effect of multiple factors affecting wild fish in the wild. Therefore, the potential for significant impacts to wild fish remains, in addition to a variety of secondary factors such as increased predation and/or decreased feeding ability and competitiveness (discussed in later sections below). It is important to note that correlative studies assessing the mortality signature of sea lice on wild salmon populations, such as Bateman et al. (2016), include these “noncompensatory” aspects in their mortality projections. Further examples of sea lice monitoring of wild salmon from the Klemtu region show (similar to the Broughton region) that the size of pink salmon juveniles in 2015 was larger than previous years; at the earliest sampling period in April, the average weight was 0.66 g, more than doubling to 1.61 g by June (BCAHS 2015). Figure 25 shows the percentage of fish with different numbers of lice in this region over the 3-month sampling period from April to June 2015. Although 15.6% of juvenile pink salmon had greater than six lice per fish in this period, the above data on lethal levels combined with the size of the fish indicates that, despite potential physiological impacts and increased predation, direct mortality was likely to be limited.
Figure 25: Percentage of fish with different numbers of lice in Klemtu region in April–June 2015. Data from BCAHS
(2015).

75
Data from both study areas showed the infection pressure on wild fish in 2016 returned to pre-2015 levels (Figure 23 showing prevalence of L. salmonis lice for Klemtu, and Figure 26 showing intensity for Broughton), but Figure 26b shows C. clemensi levels increased rapidly in June 2016, which coincided with increases in numbers of juvenile herring in the area (Peacock 2016). Provisional data from independent monitoring of wild fish in four regions of B.C. (Broughton, Quatsino, Port Hardy, and Campbell River), on behalf of Marine Harvest in April and May 2017, show low levels of lice on wild fish, with an average L. salmonis prevalence of 4.25% and intensity of 1.15 lice per fish across all species (pink, chum, and Coho). Slightly higher levels of C. clemensi lice were shown at a prevalence of 8.25% and intensity of 1.56 lice per fish (data supplied by Marine Harvest). These data indicate that the transfer of lice from farms to wild fish returned to low levels in 2016 and to date in 2017, and appear to be further evidence that 2015 was a peak sea lice year and an anomaly within the last decade. Also (as mentioned previously) the lice levels on farms appear to have reduced in 2016 and 2017 compared to 2015.
Figure 26: Comparing 2015 and 2016 in the Broughton Archipelago with the mean number of motile (a) L. salmonis and (b) C. clemensi (±95% bootstrapped confidence intervals) during 2015 (open grey points) and 2016 (solid black
points). Graph and caption copied from Peacock (2016).
It is important to note that these studies of the Broughton and Klemtu regions are on pink, chum, and coho salmon, and Saksida et al. (2015) and Braden et al. (2015) note that pink and coho salmon are relatively more resistant to L. salmonis while sockeye and chum are less so (Chinook salmon tolerance is intermediate). Peacock et al. (2014) did not show a significant

76
correlation between sea lice and reduced productivity for chum salmon, and Jakob et al. (2013) state that sea lice (L. salmonis) infection in sockeye salmon does not cause direct mortality, except at extreme abundances not seen in wild fish (note indirect mortality effects such as increased predation may still occur; discussed below). It is also essential to note that, based on correlations in numbers (i.e., not a confirmed cause-and-effect due to the scientific challenge of demonstrating it), there is an assumed but not directly proved association between the lice on wild fish and the farms as the source. Anecdotal evidence shows that sockeye salmon migrating out of the Fraser River are naturally exposed to large numbers of sea lice when they encounter schools of herring during their first weeks of migration before they encounter any salmon farms (pers. comm., Anonymous 2017). Godwin et al. (2016 and 2017) also highlight that Caligus sea lice are the primary species infecting juvenile sockeye salmon (>98% of lice during the outmigration in 2009 and 2010), and lice levels continue to be high in the Johnstone Strait (unlike L. salmonis sea lice, which have shown large reductions in levels on pink and chum salmon with the exception of 2015). Although previous studies have associated these lice levels on wild sockeye with salmon farms earlier on the migration route (Price et al. 2011), high Caligus lice levels on juvenile herring in the same areas have also been associated with increased infection pressure on wild salmon (Jones and Beamish 2011). Godwin et al. (2017) showed the most severe of these Caligus infections reduced the daily growth rate of juvenile sockeye salmon by 11.6% in the 10% of fish with the most sea lice, and though direct mortality was unlikely, secondary factors associated with reduced size-at-age, such as decreased competitiveness, were associated with the potential loss of “a few percent” of sockeye when the results were extrapolated to longer time frames (Godwin et al. 2017 referencing Farley et al. 2007). An analysis of sea lice levels on farms in the area and at the time sampled by Godwin et al. (2016) (May–June 2013 in Fish Health Zones 3.3 and the earlier migration route 3.2), show Caligus levels were generally very low, with 93% of 30 site counts during May–June showing less than one Caligus louse per fish and an average count of 0.27 lice per fish. Nevertheless, considering the large total number of farmed fish, the total number of Caligus lice on farms may at times still be substantial in total. Godwin et al. (2017) emphasize the concern given the “of concern” and “threatened” nature of some conservation units in the Fraser River (the source of most sockeye sampled by Godwin et al.); however, lice sources other than salmon farms (e.g., wild Pacific herring) must also be considered likely sources for the lice observed on wild sockeye. Much of the data presented above relates to potential direct mortality of wild salmon due to sea lice. The potential for indirect or “noncompensatory” impact and mortality are discussed in the following section; but for Pacific salmon, which naturally experience pe riods of extremely high mortality during their early life history, the available evidence suggests that direct mortality from sea lice may be considered to be a minor component; e.g., (Saksida et al. 2015).

77
Other impacts to wild fish from sea lice Many authors, such as Godwin et al. (2016 and 2017), Peacock et al. (2015), Krkosek et al. (2011), and Connors et al. (2010a,b), note that sea lice infections, rather than causing direct mortality, may primarily influence population dynamics and conservation through indirect effects on ecological processes such as reduced growth and competitive abilities and increased predation, particularly because predation is a key aspect of the early life history of these species. For example, in addition to direct mortality, Krkosek et al. (2011) and Connors et al. (2010a,b) considered predation by coho salmon of pink and chum salmon, and highlighted the potential for additional as-yet poorly studied impacts, particularly increased vulnerability to predation of lice-infected fish. Krkosek et al. (2011) concluded “the estimated mortality of wild juvenile salmon due to sea lice infestation is probably higher than previously thought” because of increased predation. More recently, experiments by Peacock et al. (2015) confirmed that coho salmon selectively prey on pink salmon and on parasitized prey, which supports the notion of additive mortality associated with sea lice for pink salmon, with unclear consequences for less-desirable prey species such as chum salmon. As discussed above, Godwin et al. (2017) highlight the potential effect of reduced growth on competitive and predatory vulnerability in sockeye salmon. Although infection did not result in mortality, Godwin et al. (2016) concluded that “heavily infected” juvenile Fraser River sockeye salmon were 20% less successful at consuming food than “lightly infected” fish, although the effect was size-dependent (i.e., larger fish were less affected). However, as noted previously, Fraser River sockeye is mainly parasitized by the generalist sea louse C. clemensi, which infects other species such as Pacific herring, and it is not possible to attribute the impacts observed by Godwin et al. (2016 and 2017) solely to salmon farms. Overall, due to the importance of high predation mortality and early marine growth in the natural life cycle of Pacific salmon, these studies indicate that the effects of sea lice on wild salmon survival, rather than causing direct mortality, are likely to be expressed indirectly via effects on competition and predation (pers. comm., Krkosek 2017). And, though it is scientifically challenging to demonstrate any direct population-level impacts as a result, it is important to note that correlative studies assessing the mortality signature of sea lice on wild salmon populations (such as Bateman et al. (2016) and their projected 23% mortality of pink salmon in 2015) include these aspects within their projections. Causes of the 2015 increase in lice levels Bateman et al. (2016) describe the elevated lice levels in 2015 as a departure from almost a decade of successful lice management on salmon farms in the area, and attribute the higher levels of lice to a combination of warm environmental conditions and poorly timed sea lice treatments on farms, in addition to a large natural influx of sea lice to the region with a healthy pink salmon return in the autumn of 2014 (according to Marty et al. [2010], the numbers of

78
pink salmon returning and bringing sea lice inshore have been associated with the numbers of sea lice on farmed and wild fish in the following spring). Rogers et al. (2012) specifically warned of the potential effects of climate change and associated ocean warming, including increased lice population growth, and according to DFO’s 2016 Environmental Conditions for Salmon report,74 exceptionally warm ocean conditions occurred due to “the Blob” and El Niño; record temperatures occurred offshore in 2014 and moved inshore in 2015 (Figure 27). With an abnormally low snow pack, higher than normal salinity was also seen throughout 2015 (BCSFA 2016)—a condition known to favor sea lice development (Brooks 2005).
Figure 27: Sea surface temperatures in the northeast Pacific in January 2014 (left) and January 2015 (right). British Columbia indicated by right-most point of the blue line. Images copied from DFO 2016 Environmental Conditions
for Salmon report.
According to Chandler et al. (2016), surface waters in 2015 were over 3 °C above normal at their peak in July, and these ocean conditions influenced the biological ecosystems on regional and local scales, including changes at the base of the food web such as exceptional blooms of phytoplankton, unusually high abundances of gelatinous zooplankton, and northward extension of the ranges of plankton and fish species more commonly found farther south. An example of the exceptionally high water temperatures in 2015 are provided by BCSFA (2016) from one salmon farm’s routine water temperature records kept since 2005 (Figure 28); in every month, the recorded temperature in 2015 (purple dots) was significantly above the mean, often by 2 °C or more, and outside the standard deviation (green lines) of the 2005 to 2014 period.
74 http://www.pac.dfo-mpo.gc.ca/fm-gp/species-especes/salmon-saumon/2016-enviro-conditions-eng.html

79
Figure 28: Sea surface temperatures at Clayoquot Sound in B.C., showing the 2015 recorded temperatures well
above the 2005–2014 average. Graph copied from BCSFA (2016).
Peacock et al. (2013) suggest that treating farmed fish for sea lice in winter and following the current threshold criteria lead to lower lice abundance on out-migrating juvenile wild pink and chum salmon, and this practice has apparently been working successfully. But Bateman et al. (2016) report that the timing of sea lice treatments in 2015 was not well coordinated among farms or matched to the salmon out-migration period. Further, the more rapid development of sea lice with warmer temperatures in 2015 resulted in faster progression of outbreaks on farms. The same authors note that adaptive management that considers area-wide coordination of treatments and factors such as elevated ocean temperatures is required to ensure effective timing of treatments. Sea surface temperatures were still elevated in 2016, but less so than 2015, and as noted above, sea lice numbers on wild fish in the well-studied Broughton Archipelago and Klemtu regions were lower in 2016, especially when accounting for the number of sea lice associated with wild herring juveniles (Peacock 2016). Population impacts of sea lice on wild salmon There has been considerable debate about the health implications attributable to sea lice on juvenile salmon. Although it is certain that sea lice can affect individual fish, at least at the physiological level, any discussion of potential population-level impacts is complicated by a complex array of variables associated with salmon species and size, predation, competition and other inter-species interactions, numbers of lice, species of lice, and stage of lice, in addition to complex and confounding environmental variables. For example, attempts to understand the peak of concern for pink salmon in the early 2000s have been conflicting; analysis by Marty et al. (2010) found that productivity of wild pink salmon is not negatively associated with sea lice, but Krkosek et al. (2011) challenged the statistical robustness of these results and instead
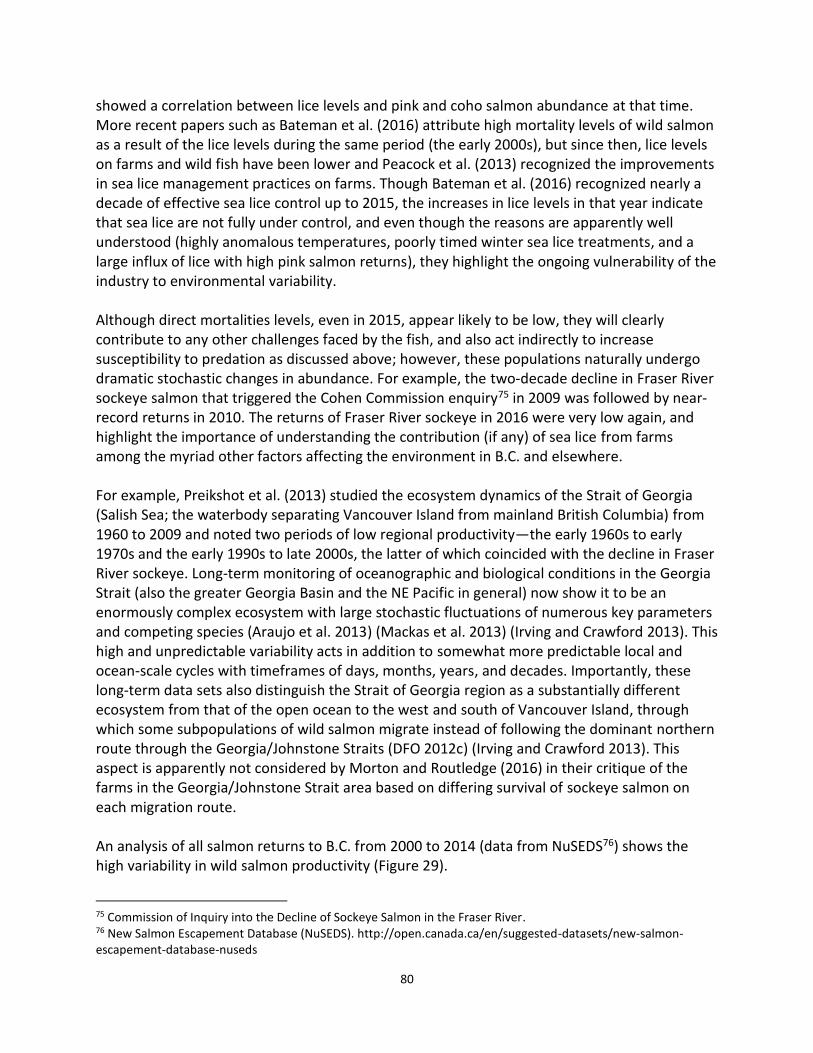
80
showed a correlation between lice levels and pink and coho salmon abundance at that time. More recent papers such as Bateman et al. (2016) attribute high mortality levels of wild salmon as a result of the lice levels during the same period (the early 2000s), but since then, lice levels on farms and wild fish have been lower and Peacock et al. (2013) recognized the improvements in sea lice management practices on farms. Though Bateman et al. (2016) recognized nearly a decade of effective sea lice control up to 2015, the increases in lice levels in that year indicate that sea lice are not fully under control, and even though the reasons are apparently well understood (highly anomalous temperatures, poorly timed winter sea lice treatments, and a large influx of lice with high pink salmon returns), they highlight the ongoing vulnerability of the industry to environmental variability. Although direct mortalities levels, even in 2015, appear likely to be low, they will clearly contribute to any other challenges faced by the fish, and also act indirectly to increase susceptibility to predation as discussed above; however, these populations naturally undergo dramatic stochastic changes in abundance. For example, the two-decade decline in Fraser River sockeye salmon that triggered the Cohen Commission enquiry75 in 2009 was followed by near-record returns in 2010. The returns of Fraser River sockeye in 2016 were very low again, and highlight the importance of understanding the contribution (if any) of sea lice from farms among the myriad other factors affecting the environment in B.C. and elsewhere. For example, Preikshot et al. (2013) studied the ecosystem dynamics of the Strait of Georgia (Salish Sea; the waterbody separating Vancouver Island from mainland British Columbia) from 1960 to 2009 and noted two periods of low regional productivity—the early 1960s to early 1970s and the early 1990s to late 2000s, the latter of which coincided with the decline in Fraser River sockeye. Long-term monitoring of oceanographic and biological conditions in the Georgia Strait (also the greater Georgia Basin and the NE Pacific in general) now show it to be an enormously complex ecosystem with large stochastic fluctuations of numerous key parameters and competing species (Araujo et al. 2013) (Mackas et al. 2013) (Irving and Crawford 2013). This high and unpredictable variability acts in addition to somewhat more predictable local and ocean-scale cycles with timeframes of days, months, years, and decades. Importantly, these long-term data sets also distinguish the Strait of Georgia region as a substantially different ecosystem from that of the open ocean to the west and south of Vancouver Island, through which some subpopulations of wild salmon migrate instead of following the dominant northern route through the Georgia/Johnstone Straits (DFO 2012c) (Irving and Crawford 2013). This aspect is apparently not considered by Morton and Routledge (2016) in their critique of the farms in the Georgia/Johnstone Strait area based on differing survival of sockeye salmon on each migration route. An analysis of all salmon returns to B.C. from 2000 to 2014 (data from NuSEDS76) shows the high variability in wild salmon productivity (Figure 29).
75 Commission of Inquiry into the Decline of Sockeye Salmon in the Fraser River. 76 New Salmon Escapement Database (NuSEDS). http://open.canada.ca/en/suggested-datasets/new-salmon-escapement-database-nuseds
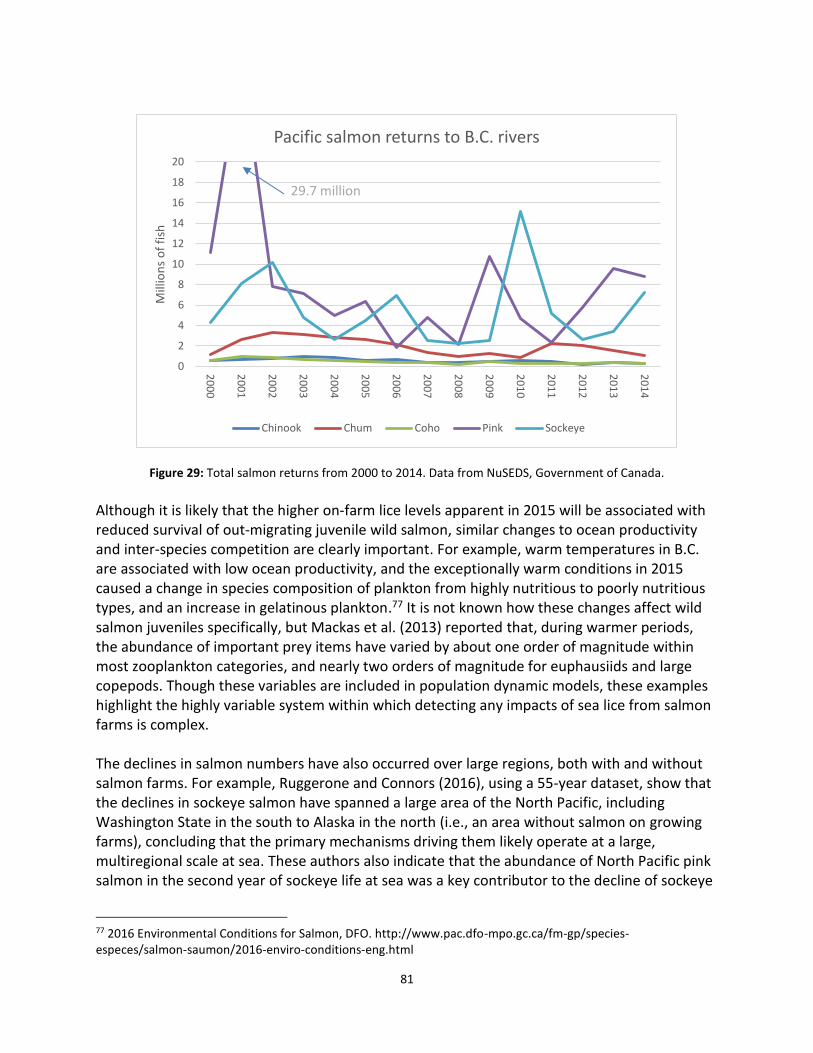
81
Figure 29: Total salmon returns from 2000 to 2014. Data from NuSEDS, Government of Canada.
Although it is likely that the higher on-farm lice levels apparent in 2015 will be associated with reduced survival of out-migrating juvenile wild salmon, similar changes to ocean productivity and inter-species competition are clearly important. For example, warm temperatures in B.C. are associated with low ocean productivity, and the exceptionally warm conditions in 2015 caused a change in species composition of plankton from highly nutritious to poorly nutritious types, and an increase in gelatinous plankton.77 It is not known how these changes affect wild salmon juveniles specifically, but Mackas et al. (2013) reported that, during warmer periods, the abundance of important prey items have varied by about one order of magnitude within most zooplankton categories, and nearly two orders of magnitude for euphausiids and large copepods. Though these variables are included in population dynamic models, these examples highlight the highly variable system within which detecting any impacts of sea lice from salmon farms is complex. The declines in salmon numbers have also occurred over large regions, both with and without salmon farms. For example, Ruggerone and Connors (2016), using a 55-year dataset, show that the declines in sockeye salmon have spanned a large area of the North Pacific, including Washington State in the south to Alaska in the north (i.e., an area without salmon on growing farms), concluding that the primary mechanisms driving them likely operate at a large, multiregional scale at sea. These authors also indicate that the abundance of North Pacific pink salmon in the second year of sockeye life at sea was a key contributor to the decline of sockeye
77 2016 Environmental Conditions for Salmon, DFO. http://www.pac.dfo-mpo.gc.ca/fm-gp/species-especes/salmon-saumon/2016-enviro-conditions-eng.html
0
2
4
6
8
10
12
14
16
18
20
20
00
20
01
20
02
20
03
20
04
20
05
20
06
20
07
20
08
20
09
20
10
20
11
20
12
20
13
20
14
Mill
ion
s o
f fi
sh
Pacific salmon returns to B.C. rivers
Chinook Chum Coho Pink Sockeye
29.7 million
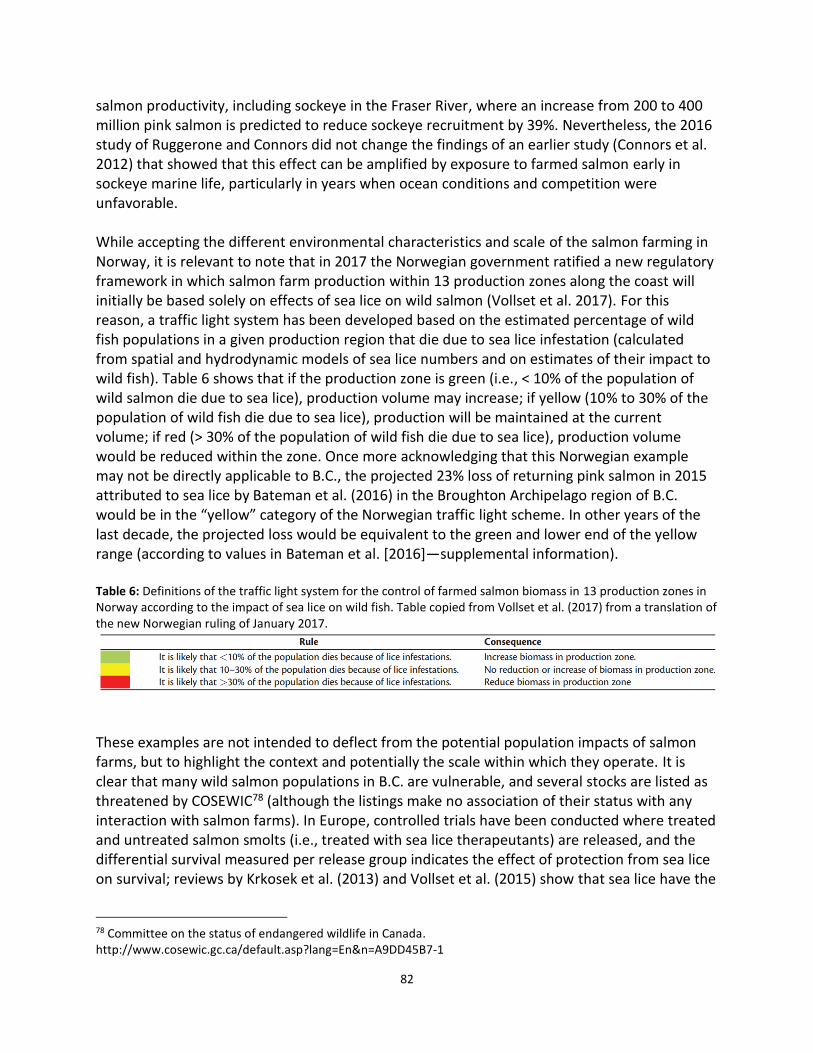
82
salmon productivity, including sockeye in the Fraser River, where an increase from 200 to 400 million pink salmon is predicted to reduce sockeye recruitment by 39%. Nevertheless, the 2016 study of Ruggerone and Connors did not change the findings of an earlier study (Connors et al. 2012) that showed that this effect can be amplified by exposure to farmed salmon early in sockeye marine life, particularly in years when ocean conditions and competition were unfavorable. While accepting the different environmental characteristics and scale of the salmon farming in Norway, it is relevant to note that in 2017 the Norwegian government ratified a new regulatory framework in which salmon farm production within 13 production zones along the coast will initially be based solely on effects of sea lice on wild salmon (Vollset et al. 2017). For this reason, a traffic light system has been developed based on the estimated percentage of wild fish populations in a given production region that die due to sea lice infestation (calculated from spatial and hydrodynamic models of sea lice numbers and on estimates of their impact to wild fish). Table 6 shows that if the production zone is green (i.e., < 10% of the population of wild salmon die due to sea lice), production volume may increase; if yellow (10% to 30% of the population of wild fish die due to sea lice), production will be maintained at the current volume; if red (> 30% of the population of wild fish die due to sea lice), production volume would be reduced within the zone. Once more acknowledging that this Norwegian example may not be directly applicable to B.C., the projected 23% loss of returning pink salmon in 2015 attributed to sea lice by Bateman et al. (2016) in the Broughton Archipelago region of B.C. would be in the “yellow” category of the Norwegian traffic light scheme. In other years of the last decade, the projected loss would be equivalent to the green and lower end of the yellow range (according to values in Bateman et al. [2016]—supplemental information). Table 6: Definitions of the traffic light system for the control of farmed salmon biomass in 13 production zones in Norway according to the impact of sea lice on wild fish. Table copied from Vollset et al. (2017) from a translation of the new Norwegian ruling of January 2017.
These examples are not intended to deflect from the potential population impacts of salmon farms, but to highlight the context and potentially the scale within which they operate. It is clear that many wild salmon populations in B.C. are vulnerable, and several stocks are listed as threatened by COSEWIC78 (although the listings make no association of their status with any interaction with salmon farms). In Europe, controlled trials have been conducted where treated and untreated salmon smolts (i.e., treated with sea lice therapeutants) are released, and the differential survival measured per release group indicates the effect of protection from sea lice on survival; reviews by Krkosek et al. (2013) and Vollset et al. (2015) show that sea lice have the
78 Committee on the status of endangered wildlife in Canada. http://www.cosewic.gc.ca/default.asp?lang=En&n=A9DD45B7-1
83
largest effect on salmon recruitment in years/locations in which natural survival rates are poor; i.e., when conditions for survival are poor, sea lice have a larger (synergistic) effect on salmon survival. These are important studies that have not yet been conducted in B.C., but it is important to note that farmed salmon in Norway’s 1.3 million MT industry greatly outnumber their wild counterparts, and are associated with impacts to wild salmon and significant population impacts to wild sea trout.79 In contrast, the number of farmed salmon in B.C.’s 76,000 MT industry are greatly outnumbered by wild salmon populations (estimated to be 1,000 times higher by Saksida et al. 2015, but this estimate or its method of calculation have not been verified and may be substantially lower in reality). Conclusions and Final Score Peacock et al. (2015) state there is an increasing realization of the diverse mechanisms by which parasites and pathogens influence the dynamics of host populations and communities. Also, a compelling body of evidence now shows that the enormous variation in wild salmon populations is driven by complex oceanographic and biological conditions and inter-salmon species interactions; however, they do not deflect from the evidence of direct impacts to individuals, and therefore potentially to populations, due to interactions with salmon farms in British Columbia. Initial conclusions: Bacterial and viral pathogens According to farm mortality rates, bacterial and viral pathogens cause approximately half, at most, of the 1% to 1.5% monthly mortality rates (i.e., if all “fresh silvers” and “decomposed” fish died because of these pathogens). Although the actual number is likely to be less, the presence of pathogens on farms (including a chronic presence that may not cause high mortalities) represents a reservoir of potential infection to wild fish. To date, this connection and potential impact have not been comprehensively studied, and the research of the SSHI and others is advancing this knowledge in B.C. At this stage, there is no evidence of bacterial or viral pathogens on Atlantic salmon farms having an impact on wild salmonids in B.C., but importantly, there is also no evidence that there is not an impact. There is therefore some level of concern, particularly in the context of the importance of wild salmonid populations in B.C. Initial conclusions: Parasitic sea lice Since the early 2000s, there has been substantial research correlating sea lice levels on farms with those on wild salmon, and subsequently with reduced abundance of wild fish in peak years. Although uncertainty remains (and a direct cause and effect has not been demonstrated), the salmon farming industry’s improved management since approximately 2003 has been considered successful in mitigating the risk to wild salmon. But the higher lice levels in 2015 (associated with unusually favorable conditions for sea lice and poorly coordinated farm treatments) highlighted the fact that sea lice on farms are not fully under control and the industry is still vulnerable to environmental variability.
79 Norwegian Environment Agency—Sea lice. http://www.miljodirektoratet.no/en/Areas-of-activity1/Species-and-ecosystems/Salmon-trout-and-Arctic-char/Pressures-on-salmonids/Sea-lice/

84
Understanding the impact to individual fish and cumulative population dynamics is challenging. Studies on direct mortality of wild fish due to sea lice indicate that this may be relatively low, yet there are many other aspects associated with the overall impact at the population or ecosystem level (particularly predation and competition). The results of modeling studies that include these aspects, such as Bateman et al. (2016), project substantial loss of returning fish (e.g., 23% of pink salmon) as a result of high infection years such as 2015, but the impact of these years on the longer term population dynamics is uncertain given the enormous stochastic variation of wild salmon numbers from year to year and contribution of dynamic environmental and ecological conditions to that variation. Conclusions: Overall The population dynamics of wild salmon in B.C. are extremely complex, and large stochastic fluctuations are associated with multifaceted oceanographic and biological conditions and inter-salmonid species interactions (in addition to direct human impacts from commercial fishing and habitat damage). Nevertheless, in addition to these aspects, there is clearly a concern regarding the location of salmon farms close to or within the migration routes of wild salmon. Although currently limited, the most recent studies on bacterial and viral pathogens imply that concern, but specifically state they cannot be used to infer any risk of impact to wild fish from farms. In regard to sea lice, the numerous factors relating to the mortality signature are also complex (e.g., species, size, condition, lice stage, resistance to infection, predation, competition, etc.), but studies have highlighted the correlation between parasite levels on farms and wild fish, and on poorer survival of some wild salmon populations in years when these levels are high. The increased sea lice numbers in 2015 highlighted the fact that the salmon farming industry’s pathogen and parasite control is still vulnerable to natural environmental variability, particularly in this case, in which sea lice levels are not fully under control. The projected loss of returning salmon due to the transfer of lice from farms to wild fish is substantial in outbreak years, but with consideration of the enormous variability in annual wild salmon returns, the apparently anomalous (in the last decade) impact in 2015 does not appear to affect the longer-term population size or its ability to recover. In regard to scoring in the Seafood Watch Aquaculture Standard, the large number of studies referenced above, although not directly conclusive, provide a large amount of information with which to consider the potential impacts. Thus, this information has been used directly to inform the Evidence-Based Assessment option in the Standard (as opposed to the Risk-Based option). After detailed consideration of the pathogen and parasite levels on salmon farms, particularly during key migration periods, it is concluded that there continues to be a notable level of concern, but there is currently insufficient evidence to state that population-level impacts to wild salmon are occurring due to pathogen and/or parasite transfer from salmon farms. The final score for Criterion 7 – Disease is therefore 4 out of 10 (see the Seafood Watch Aquaculture Standard for more details of the scoring framework).

85
Criterion 8X: Source of Stock – independence from wild fisheries
Impact, unit of sustainability and principle Impact: the removal of fish from wild populations for on-growing to harvest size in farms Sustainability unit: wild fish populations Principle: using eggs, larvae, or juvenile fish produced from farm-raised broodstocks
thereby avoiding the need for wild capture. This is an “exceptional” criterion that may not apply in many circumstances. It generates a negative score that is deducted from the overall final score. A score of zero means there is no impact. Criterion 8X Summary
Source of stock parameters Score C8X Independence from unsustainable wild fisheries (0-10) –0
Critical? NO GREEN
Brief Summary Due to the industry-wide use of domesticated broodstock, the B.C. salmon farming industry is considered to be independent of wild salmon fisheries for the supply of adult or juvenile fish or eggs. The final score for Criterion 8X – Source of Stock is 0 out of –10. Justification of Ranking Atlantic salmon aquaculture has seen a multi-decade establishment of breeding programs, aimed at selection for traits advantageous to farming (e.g., fast growth, disease resistance), which have been integral in the rapid growth of the industry (Asche et al. 2013) (Heino et al. 2015) (Gutierrez et al. 2016). Due to the industry-wide use of domesticated broodstocks globally, 100% of eggs, juveniles, and smolts are considered to be independent of wild salmon populations. The final score for Criterion 8X – Source of Stock is a deduction of 0 out of –10 (see the Seafood Watch Aquaculture Standard for further details on all scoring tables and calculations).

86
Criterion 9X: Wildlife and Predator Mortalities A measure of the effects of deliberate or accidental mortality on the populations of affected species of predators or other wildlife This is an “exceptional” factor that may not apply in many circumstances. It generates a negative score that is deducted from the overall final score. A score of zero means there is no impact.
Criterion 9X Summary Wildlife and predator mortality parameters Score
C9X Wildlife and predator mortality Final Score –4.00 YELLOW
Critical? NO
Brief Summary Harbor seal and sea lion mortalities have declined from a peak in the mid-1990s to late 1990s of several hundred per year to six in 2016. Although the majority result from accidental entanglement, lethal control (i.e., shooting) is licensed by DFO, and 15 California sea lions were killed at one site in 2015. Though distasteful, the current numbers are not considered to significantly affect the population size of these species. In 2016, three humpback whales became entangled in salmon farm equipment in B.C.; two of the whales died, and the third was released injured. The number of humpback whales has increased dramatically in B.C. waters, and the population has been increasing and recovering steadily since the end of commercial whaling, but it is still listed as “Threatened” under Canada’s Species at Risk Act (SARA). Though undoubtedly a serious concern, and further entanglements are possible, the two recent mortalities are not considered to cause or contribute to further declines, or significantly affect the population size or its ability to recover. The final score for Criterion 10X – Wildlife and Predator Mortalities is therefore –4 out of –10. Justification of Ranking The presence of farmed salmon in net pens at high density inevitably constitutes a powerful food attractant to opportunistic coastal marine mammals, seabirds, and fish that normally feed on native fish stocks (Sepulveda et al. 2015). These predators threaten production and have historically (and sometimes currently) been lethally controlled, and can also become entangled in nets and other farm infrastructure, resulting in mortality. See the Seafood Watch Aquaculture Standard for further details on all scoring tables and calculations. Seals and sea lions Though it is accepted that farms take active measures to deter predators (such as secondary predator nets above and below the water surface), lethal control of seals and sea lions is

87
permitted as a last resort under license by DFO80: “Fisheries and Oceans Canada (DFO) is the agency responsible for the management, including conservation and protection, of marine mammals in Canada. Provisions in the Pacific Aquaculture Regulations allow for the Department to license fish farms to undertake predator control of marine mammals that pose an imminent danger to the aquaculture facility or human life, should reasonable deterrent efforts fail.” Figure 30 shows mortality numbers of harbor seals (Phoca vitulina), California sea lions (Zalophus californianus), and Steller sea lions (Eumetopias jubatus) from 1990 to 2016, according to quarterly industry-reported data published by DFO.81 After a peak in mortalities in the mid-1990s to late 1990s of over 600 harbor seals and sea lions per year, and a recent increase in 2010 and 2011, results for 2012 to 2016 show lower total mortalities from shootings and accidental entanglements; most recently, in 2016, there was one reported accidentally drowned harbor seal, and 5 sea lions (of which 1 was shot). These regional figures hide site-specific variability, and it is of note that one site shot 15 sea lions in 2015.
Figure 30: Industry-reported predator mortalities from shooting and drowning from 1990 to 2016. Data source:
DFO.
The Steller sea lion was designated by the Committee on the Status of Endangered Wildlife in Canada (COSEWIC) as a “Species of Special Concern” in 2003, and it was no longer included as an allowable mortality under seal control licenses. Subsequently, aquaculture facility operators must apply for special permission to lethally remove any marine mammal species other than
80 DFO Public Reporting on Aquaculture - Marine Mammals http://www.pac.dfo-mpo.gc.ca/aquaculture/reporting-rapports/mar_mamm-eng.html 81 http://www.pac.dfo-mpo.gc.ca/aquaculture/reporting-rapports/mar_mamm-eng.htm

88
harbor seals or California sea lions. DFO data show that two Steller sea lions have been killed since 2003 (both in 2012). Having been depleted by overhunting prior to protection of the species in 1970, the B.C. harbor seal population has increased considerably from approximately 10,000 in 1970 to about 105,000 in 2009 (DFO, 2010). Surveys conducted in 2008 estimated Steller sea lion populations to be between 20,000 and 28,000 (DFO 2008). California sea lions in B.C. waters are migrants from more southerly breeding populations; the abundance of the U.S. stock, estimated to be 300,000, is considered to be at its carrying capacity (WDFW 201682). Though distasteful from an anthropomorphic perspective, from an ecological perspective, the apparently stable population gives confidence that the current low mortality numbers do not significantly impact the population size of these species. Humpback Whales DFO public reporting on marine mammals shows three humpback whales became entangled in fish farm equipment in B.C.; two of the whales died, and the third was released injured but alive. One dead whale was found at a salmon farm in 2013, but after investigation, its death was found not to be associated with the farm (DFO marine mammal data as above). A news report by Thomas (2016),83 quoting Jackie Hildering from the Marine Education and Research Society, notes that increased entanglements can be attributed to an unprecedented number of humpback whales in coastal B.C. waters. Humpback whales are listed as “Threatened” under Canada’s Species at Risk Act (SARA) and as “Special Concern” (i.e., lesser concern than “Threatened”) by COSEWIC.84 According to the SARA Species profile,85 the most recent population estimate (2011) for the North Pacific humpback whale was 18,302 individuals, suggesting the population is making a strong comeback, recovering at a rate of 4.9 to 6.8 percent annually since their commercial harvesting was banned by the International Whaling Commission in the North Pacific in 1965. Despite this increase, current numbers are low compared to pre-whaling population estimates. The mortality of a threatened species is a serious concern, but the growing population size indicates that the two mortalities in 2016 will not contribute to further declines, or prohibit recovery.86 It can be argued that these are exceptional cases, but the growing presence of humpbacks in B.C. indicates that further mortalities are possible. Given the very recent cluster
82 Washington Department of Fish & Wildlife; California Sea Lion Fact Sheet. http://wdfw.wa.gov/conservation/sealions/facts.html 83 Thomas 2016. CBC News. November 30, 2016. http://www.cbc.ca/news/canada/british-columbia/humback-whale-deaths-1.3874915 84 Species at risk public registry. http://www.registrelep-sararegistry.gc.ca/species/speciesDetails_e.cfm?sid=148 85 http://www.registrelep-sararegistry.gc.ca/species/speciesDetails_e.cfm?sid=148 86 See the Seafood Watch Aquaculture Standard, Criterion 10X.
89
of incidents, there is also the potential that, with time, the industry can make improvements to reduce the chances entanglement, and has already begun efforts to modify mooring systems.87 Conclusions and Final Score The recent numbers of seals and sea lions killed at salmon farms in B.C. are not considered to significantly affect the population size of these species. Additionally, although the number of humpback whales killed is also not considered to have a significant impact on the population size or its recovery, the threatened nature of the species indicates that special notice and vigilance should be taken, and deterrent and/or detanglement technologies and strategies should be continually reviewed and updated as necessary. The final score for Criterion 10X – Wildlife and Predators is therefore –4 out of –10 (see the Seafood Watch Aquaculture Standard for further details on all scoring tables and calculations).
87 (pers. comm., Dolmage 2017). Also, the BCSFA held a Marine Mammals Interaction Workshop in October 2016. http://bcsalmonfarmers.ca/agm/

90
Criterion 10X: Escape of Secondary Species A measure of the escape risk (introduction to the wild) of alien species other than the principle farmed species unintentionally transported during live animal shipments This is an “exceptional criterion that may not apply in many circumstances. It generates a negative score that is deducted from the overall final score.
Criterion 10X Summary
Escape of secondary species parameters Score
C10Xa International or trans-waterbody live animal shipments score 4
C10Xb Biosecurity of source/destination 6
C10X Escape of secondary species Final Score (deduction) –2.4 GREEN
Brief Summary Although there are no longer any salmon egg imports into B.C., the industry is considered to be dependent on the movements of live smolts between hatcheries and seawater growout sites. These movements take place at least partially between Salmonid Transfer Zones under transfer licenses, and though the open nature of net pen destination sites has inherently low biosecurity, the tank-based hatcheries that represent the source of movements have higher biosecurity potential. Nevertheless, pathogens (e.g., PRV) are known to be transferred during these smolt movements, highlighting the limits of the biosecurity system. Therefore, although introducing a novel secondary species into B.C. is considered to be low risk, there is a moderate concern regarding the movement of pathogens within B.C. Thus, the final score for Criterion 10X (a combination of Factors 10Xa and 10Xb) is a deduction of –2.4 out of –10 (see the Seafood Watch Aquaculture Standard for further details on all scoring tables and calculations). Justification of Ranking This criterion provides a measure of the escape risk (introduction to the wild) of secondary species (i.e., other than the principal farmed species) unintentionally transported during animal shipments. See the Seafood Watch Aquaculture Standard for further details on all scoring tables and calculations. According to the UN FAO (2012), the expanded and occasionally irresponsible global movements of live aquatic animals have been accompanied by the transboundary spread of a wide variety of pathogens. In some instances, these pathogens have caused serious damage to aquatic food productivity and resulted in serious pathogens becoming endemic in culture systems and the natural aquatic environment. The global salmon farming industry has suffered from the introduction of pathogens during the international movements of live animals, and the transfer of live material is regarded as one of the most serious risk factors for spreading disease within the industry (Hjeltnes et al. 2016—referring to the Norwegian industry). Although the impacts to production are well documented, the ecological impacts beyond the farm are less apparent.

91
Factor 10Xa. International or trans-waterbody live animal shipments DFO published data on egg imports from 1985 to 2012,88 but has since ceased reporting. The BCSFA reports eggs have not been imported since 2009 (BCSFA website accessed June 27, 2017). Figure 31 shows the time series of imports from both data sources.
Figure 31: Salmon egg import data from 1985 to 2016. Source: DFO and BCSFA.
Although the farming system involves the movement of live salmon smolts from freshwater hatcheries to seawater grow-out sites, and movement of fish from marine nursery sites to marine grow-out sites, these transfers are managed in Salmonid Transfer Zones; Figure 32. DFO reports data on fish introductions and transfers in B.C.,89 but do not distinguish between different farmed species. The latest data available are from 2015, in which 59% of transfers were across different transfer zones, but the data include 10 different species.
88 DFO Public Reporting on Aquaculture—Salmon Egg Imports http://www.pac.dfo-mpo.gc.ca/aquaculture/reporting-rapports/egg-oeuf-eng.html 89 http://www.pac.dfo-mpo.gc.ca/aquaculture/reporting-rapports/intro-trans-eng.html

92
Figure 32: Salmonid Transfer Zones in B.C. Map copied from DFO.90
Considering movements of fish within transfer zones to be equivalent to the same waterbody and those between different transfer zones as trans-waterbody, and without further information, the 59:41 movement ratio between zones in 2015 (although potentially not representative of current movements, but relevant as a worst-case scenario) is used as a scoring guide, and the score for Factor 10Xa is 4 out of 10. Factor 10Xb. Biosecurity of source/destination The sources of smolt movements are freshwater hatcheries, typically land-based tank facilities operating as recirculating systems (Marine Harvest 2016). All movements of fish in B.C. require
90 http://www.pac.dfo-mpo.gc.ca/aquaculture/maps-cartes-eng.html

93
an “Introduction and Transfer” license issued by the Introduction and Transfers Committee,91 and fish must be free of reportable diseases (the Canadian Food Inspection Agency requires licenses for movements of fish with reportable diseases92). Atlantic salmon has also been listed by the Introductions and Transfers Committee as a “Low Risk Species for Introduction and Transfer to Aquaculture Facilities” based on an assessment of disease risks (in addition to genetic and ecological risks)93; however, these aspects do not mean that hatchery fish are free of all diseases and there is no transfer of pathogens. For example, the transfer of PRV-infected fish from hatcheries to grow-out sites has been reported in B.C, 94 highlighting the limits of hatchery biosecurity. The open nature of net pens at the destination of smolt movements is considered to have inherently lower biosecurity, and the score is determined by the more biosecure hatchery origin. Overall, the biosecurity in the B.C. hatchery system is inherently considered to be low risk, but the uncertainties in its robustness result in a final score for Factor 10Xb of 6 out of 10. Conclusions and Final Score Although there are no longer any salmon egg imports into B.C., the industry is considered dependent on the movements of live smolts between hatcheries and seawater growout sites. These movements take place at least partially between Salmonid Transfer Zones under transfer licenses and, although the open nature of net pen destinations sites has inherently low biosecurity, the tank-based hatcheries that represent the source of movements have higher (but not perfect) biosecurity capabilities. Though pathogens are likely to be transferred during these movements (e.g., PRV), introducing a novel secondary species in B.C. is considered to be a low risk overall, and the final score for Criterion 10X (a combination of Factors 10Xa and 10Xb) is a deduction of –2.4 out of –10 (see the Seafood Watch Aquaculture Standard for further details on all scoring tables and calculations).
91 DFO British Columbia Introductions and Transfers. http://www.pac.dfo-mpo.gc.ca/aquaculture/licence-permis/intro-trans/licencereq-permisreq-eng.html 92 CFIA Aquatic Animal Domestic Movements. http://www.inspection.gc.ca/animals/aquatic-animals/domestic-movements/eng/1450122972517/1450122973466 93 DFO British Columbia Introductions and Transfers. http://www.pac.dfo-mpo.gc.ca/aquaculture/licence-permis/intro-trans/species-especes-eng.html 94 http://alexandramorton.typepad.com/

94
Overall Recommendation The overall final score is the average of the individual criterion scores (after the two exceptional scores have been deducted from the total). The overall ranking is decided according to the final score, the number of red criteria, and the number of critical scores as follows: – Best Choice/Green = Final score ≥6.6 AND no individual criteria are Red (i.e., <3.3) – Good Alternative/Yellow = Final score ≥3.3 AND <6.6, OR Final score ≥ 6.6 and there is one
individual “Red” criterion – Red/Avoid = Final score <3.3, OR there is more than one individual Red criterion, OR there
is one or more Critical score
Criterion Score Rank Critical?
C1 Data 7.50 GREEN
C2 Effluent 6.00 YELLOW NO
C3 Habitat 6.80 GREEN NO
C4 Chemicals 2.00 RED NO
C5 Feed 5.08 YELLOW NO
C6 Escapes 5.00 YELLOW NO
C7 Disease 4.00 YELLOW NO
C8X Source 0.00 GREEN NO
C9X Wildlife mortalities –4.00 YELLOW NO
C10X Introduced species escape –2.40 GREEN
Total 29.98
Final score (0–10) 4.28
OVERALL RANKING
Final Score 4.28
Initial rank YELLOW
Red criteria 1
Interim rank YELLOW FINAL RANK
Critical Criteria? NO YELLOW

95
Acknowledgements
Scientific review does not constitute an endorsement of the Seafood Watch® program, or its seafood recommendations, on the part of the reviewing scientists. Seafood Watch® is solely responsible for the conclusions reached in this report. Seafood Watch would like to thank the consulting researcher and author of this report, Peter Bridson of Seagreen Research, as well as Andrew Bateman of the University of Victoria, Anthony Farrell of the University of British Columbia, Cormac O’Sullivan of SGS, Emiliano DiCicco and Kristi Saunders of the Department of Fisheries and Oceans, Gary Marty of British Columbia’s Ministry of Agriculture, Jeremy Dunn of B.C. Salmon Farmers Association, Katherine Dolmage of Marine Harvest, Kelly Roebuck of Living Oceans, Laura Braden of the Atlantic Veterinary College, Martin Krkosek of the University of Toronto, Stephanie Peacock of the University of Calgary, and one anonymous reviewer for graciously reviewing this report for scientific accuracy.

96
References AHC. 2016. Untitled report produced by British Columbia Ministry of Agriculture’s Animal
Health Centre (AHC). Avalable at http://www2.gov.bc.ca/assets/gov/farming-natural-resources-and-industry/agriculture-and-seafood/animal-and-crops/agricultural-licenses-and-forms/amr_animalhealth_april_2016.pdf (accessed February 2 2017).
Allen, S., M. Wolfe, 2013. Hindcast of the timing of the spring phytoplankton bloom in the Strait of Georgia, 1968–2010. Progress in Oceanography Volume 115, Pages 6–13
Alvial, A., F. Kibenge et al. (2012). "The Recovery of the Chilean Salmon Industry - The ISA crisis and its consequences and lessons." Global Aquaculture Alliance, Puerto Montt, Chile, February 23, 2012.
Anderson, B. 2008. Fish farms mostly follow rules. Vancouver Sun Andres, B. 2015. Summary of reported Atlantic salmon (Salmon salar) catches and sightings in
British Columbia and results of field work conducted in 2011 and 2012. Can. Tech. Rep. Fish. Aquat. Sci. 3061: 19 p.
APHIS. 2016. Questions and Answers: Infectious Salmon Anemia. US Department of Agriculture, Animal And Plant Health Inspection Service. https://www.aphis.usda.gov/publications/animal_health/2013/faq_isa_pacific_nw.pdf
Araujoa, H.,Holta, C., Curtisa, J., Perrya, R., Irvinea, J., Michielsens,C.,2013 Building an ecosystem model using mismatched and fragmented data: A probabilistic network of early marine survival for coho salmon Oncorhynchus kisutch in the Strait of Georgia. Progress in Oceanography Volume 115, August 2013, Pages 41–52
Arismendi, L. (2012). "Differential Invasion Success of Atlantic and Pacific Salmon in Southern Chile: Patterns and Hypotheses " American Fisheries Society 142nd Annual meeting abstract M-10-19.
Ashander, J., M. Krkošek et al. (2011). "Aquaculture-induced changes to dynamics of a migratory host and specialist parasite: a case study of pink salmon and sea lice." Theoretical Ecology: 1-22.
Backman, D.C., DeDominicis, S.L. & Johnstone, R. 2009. Operational decisions in response to a performance-based regulation to reduce organic waste impacts near Atlantic salmon farms in British Columbia, Canada. Journal of Cleaner Production vol. 17 pp. 374-379.
Bateman, A.W., Peacock, S., Connors, B., Polk, Z., Berg, D., Krkošek, M., Morton, A. 2016. Recent failure to control sea louse outbreaks on salmon in the Broughton Archipelago, British Columbia. Canadian Journal of Fisheries and Aquatic Sciences, 2016, 73:1164-1172,
BCAHS. 2015. Kitasoo Fisheries Wild Juvenile Pacific Salmon Sea Lice Monitoring Program- 2015. BC Centre for Aquatic Health Sciences. November 2016.
BCAHS. 2016. Kitasoo Fisheries Wild Juvenile Pacific Salmon Sea Lice Monitoring Program- 2016. BC Centre for Aquatic Health Sciences. November 2016.
BCSFA. 2016a. Sustainability Progress Report. 2016. British Columbia Salmon Farmer’s Association. http://bcsalmonfarmers.ca/wp-content/uploads/2016/10/BCSFA_SuspReport_2016_WebVersion.pdf

97
BCSFA. 2016b. Sea Lice Report January 2016. British Columbia Salmon Farmer’s Association. http://bcsalmonfarmers.ca/wp-content/uploads/2015/02/BCSFA_SeaLice_Report_Jan20161.pdf
BCMAL (2009). "Annual Report Fish Health Program." British Columbia Ministry of Agriculture and Lands.
BCSAR. 1998. The Salmon Aquaculture Review, Final Report. Located at: http://www.eao.gov.bc.ca/PROJECT/AQUACULT/SALMON/report/toc.htm. Produced by the B.C. Environmental Assessment Office.
Beamish, R.J., K.L. Lange, C.M. Neville, R.M. Sweeting, T.D. Beacham and D. Preikshot. 2010. Late ocean entry of sea type sockeye salmon from the Harrison River in the Fraser River drainage results in improved productivity. NPAFC Doc. 1283. 30 pp.
Beamish, R.J., D.J. Noakes, G.A. McFarlane, W. Pinnix, R. Sweeting, and J. King. 2000. Trends in coho marine survival in relation to the regime concept. Fisheries Oceanography 9: 114-119.
Biering, E., Madhun, A., Isachsen, I., Omdal, L.,Einen, A., Garseth, A.,Bjorn, P.,Nilsen, R.,Karlsbakk, E. 2013. Annual report on health monitoring of wild anadromous salmonids in Norway. Institue of Marine Research, Annual Report 2012, No 6-2013.
Bisson, P. (2006). Assessment of the risk of invasion of national forest streams in the Pacific Northwest by farmed Atlantic salmon. . Portland, OR, U.S. Department of Agriculture, Forest Service, Pacific Northwest Research Station: 28.
Black, K., P. K. Hansen et al. (2008). Working Group Report on Benthic Impacts and Farm Siting, Salmon Aquaculture Dialogue, WWF.
Brauner, C. J., M. Sackville et al. (2012). "Physiological consequences of the salmon louse (Lepeophtheirus salmonis) on juvenile pink salmon (Oncorhynchus gorbuscha): implications for wild salmon ecology and management, and for salmon aquaculture." Philosophical Transactions of the Royal Society B: Biological Sciences 367(1596): 1770-1779.
Brooks KM (2001) Recommendations to the British Columbia farmed salmon waste management technicaladvisory group for biological and physicochemical performance standards applicable to marine Net-pens. For: the technical advisory group, BC MoE. pp 24.
Brooks, K.M. 2007. Assessing the environmental costs of Atlantic salmon cage culture in the Northeast Pacific in perspective with the costs associated with other forms of food production. In D.M. Bartley, C. Brugère, D. Soto, P. Gerber and B. Harvey (eds). Comparative assessment of the environmental costs of aquaculture and other food production sectors: methods for meaningful comparisons. FAO/WFT Expert Workshop. 24-28 April 2006, Vancouver, Canada. FAO Fisheries Proceedings. No. 10. Rome, FAO. 2007. pp. 137–182
Brooks, K. and C. Mahnken (2003). "Interactions of Atlantic salmon in the Pacific Northwest environment III Accumulation of zinc and copper." Fisheries Res 62: 295-305.
Bureau, D. P. and K. Hua (2010). "Towards effective nutritional management of waste outputs in aquaculture, with particular reference to salmonid aquaculture operations." Aquaculture Research 41(5): 777-792.
Burridge, L.E., Doe, K.G. and Ernst, W. 2011. Pathway of effects of chemical inputs from the

98
aquaculture activities in Canada. DFO Can. Sci. Advis. Sec. Res. Doc. Burridge L.E., J.L. Van Geest. 2014. A review of potential environmental risks associated with
the use of pesticides to treat Atlantic salmon against infestations of sea lice in Canada. DFO Can. Sci. Advis. Sec. Res. Doc. 2014/002. vi + 39 p.
Burridge, L., J. Weis et al. (2008). Chemical Use In Salmon Aquaculture: A Review Of Current Practices And Possible Environmental Effects, Salmon
Burridge, L., J. S. Weis et al. (2010). "Chemical use in salmon aquaculture: A review of current practices and possible environmental effects." Aquaculture 306(1–4): 7-23.
Buschmann, A., B. A. Costa-Pierce et al. (2007). Nutrient Impacts Of Farmed Atlantic Salmon (Salmo Salar) On Pelagic Ecosystems And Implications For Carrying Capacity, Salmon Aquaculture Dialogue, WWF.
Cabello, F.C. (2006). Heavy use of prophylactic antibiotics in aquaculture: A growing problem for human and animal health and for the environment. Environ Microbiol 8:1137–1144.
Cabello, F. C., H. P. Godfrey, et al. (2013). "Antimicrobial use in aquaculture re-examined: its relevance to antimicrobial resistance and to animal and human health." Environ Microbiol 15(7): 1917-1942.
CEAA (2012) Canadian Environmental Assessment Act http://laws-lois.justice.gc.ca/eng/acts/c-15.2/
Chandler, P.C., King, S.A., and Perry, R.I. (Eds.). 2016. State of the physical, biological and selected fishery resources of Pacific Canadian marine ecosystems in 2015. Can. Tech. Rep. Fish. Aquat. Sci. 3179: viii + 230 p.
Chang, B. D., F. H. Page et al. (2011). "Characterization of the spatial pattern of benthic sulfide concentrations at six salmon farms in southwestern New Brunswick, Bay of Fundy " Can.
Tech. Rep. Fish. Aquat. Sci. 2915. Chittenden, C., A. H. Rikardsen et al. (2011). "An effective method for the recapture of escaped
farmed salmon." Aquaculture Environment Interactions 1(3): 215-224. Colombo SM, Parrish CC, Whiticar MJ (2016) Fatty acid stable isotope signatures of molluscs
exposed to finfish farming outputs. Aquacult Environ Interact 8:611-617 Connors, B. M. (2011). "Examination of relationships between salmon aquaculture and sockeye
salmon population dynamics." Cohen Commission Tech. Rep. 5B. 115p. Vancouver, BC www.cohencommission.ca.
Connors, B. M., D. C. Braun et al. (2012). "Migration links ocean-scale competition and local ocean conditions with exposure to farmed salmon to shape wild salmon dynamics." Conservation Letters: no-no.
Connors, B. M., N. B. Hargreaves et al. (2010). "Predation intensifies parasite exposure in a salmonid food chain." Journal of Applied Ecology 47(6): 1365-1371.
Connors, B. M., M. Krkosek et al. (2010). "Coho salmon productivity in relation to salmon lice from infected prey and salmon farms." Journal of Applied Ecology 47(6): 1372-1377.
Covello, J. M., S. E. Friend et al. (2012). "Effects of Orally Administered Immunostimulants on Inflammatory Gene Expression and Sea Lice (Lepeophtheirus salmonis) burdens on Atlantic salmon (Salmo salar)." Aquaculture(0).
Cromey CJ, Nickell TD, Black KD (2002a) DEPOMOD—modelling the deposition and biological effects of waste solids from marine cage farms. Aquaculture 214: 211−239

99
Davies, J. and D. Davies (2010). "Origins and Evolution of Antibiotic Resistance." Microbiology and Molecular Biology Reviews 74(3): 417-433.
Day, J, Chopin, T., Cooper, J. 2015. Comparative study of the aquaculture environmental monitoring programs for marine finfish in Canada and other jurisdictions: time to go beyond sediment related impact monitoring and consider appropriate tools for water column and ecosystem related impact monitoring. Aquaculture Canada 2014 Proceedings of Contributed Papers. Bulletin of the Aquaculture Association of Canada (2015-1).
DFO (2008). "Population assessment: Steller sea lion (Eumetopias jubatus)." Fisheries and Oceans Canada, Science Advisory Report 2008/047.
DFO (2010). "Population assessment - Pacific harbour seal (Phoca vitulina richardsi)." Fisheries and Oceans Canada, Science Advisory Report 2009/011.
DFO (2012a). "Aquaculture in Canada 2012. A Report on Aquaculture Sustainability." Fisheries and Oceans Canada. http://www.dfo-mpo.gc.ca/aquaculture/lib-bib/asri-irda/asri-irda-2012-eng.htm
DFO (2012b). "Assessment of the Fate of Emamectin Benzoate, the Active Ingredient in SLICE®, near Aquaculture Facilities in British Columbia and its Effect on Spot Prawns (Pandalus platyceros)." DFO Can. Sci. Advis. Sec. Sci. Advis. Rep. 2011/082.
DFO (2012c). Developing a framework for science support of an ecosystem approach to managing the Strait of Georgia, British Columbia. Canadian Science Advisory Secretariat Science Advisory Report 2011/075.
DFO (2012d). Pre-season run size forecasts for Fraser River sockeye and pink salmon in 2013. Canadian Science Advisory Secretariat Pacific Region Science Advisory Report 2012/074
DFO, 2015. Assessment of The Occurrence, Distribution And Potential Impacts of Piscine Reovirus On The West Coast of North America. Department of Fisheries and Oceans. Canadian Science Advisory Secretariat. Science Response 2015/037. http://www.dfo-mpo.gc.ca/csas-sccs/publications/scr-rs/2015/2015_037-eng.pdf
DFO. 2016. Fish Health Audit & Surveillance Program. Piscirickettsia salmonis Distribution in farmed salmon in coastal British Columbia 2011-2016. Department of Fisheries and Oceans. http://www.cahs-bc.ca/sites/default/files/SRS_Workshop_Ian_Keith.pdf
Di Cicco E, Ferguson HW, Schulze AD, Kaukinen KH, Li S, Vanderstichel R, et al. (2017) Heart and skeletal muscle inflammation (HSMI) disease diagnosed on a British Columbia salmon farm through a longitudinal farm study. PLoS ONE 12(2): e0171471.
Dill, L. M. (2011). "Impacts of salmon farms on Fraser River sockeye salmon: results of the Dill investigation." Cohen Commission Tech. Rept. 5D. 81p. Vancouver, BC www.cohencommission.ca.
Dill, L. M., B. Finstad et al. (2009). Working Group Report on Sea Lice, Salmon Aquaculture Dialogue, WWF.
Done, H., Halden, R. 2015. Reconnaissance of 47 antibiotics and associated microbial risks in seafood sold in the United States. Journal of Hazardous Materials 282 (2015) 10–17.
Elizondo-Patrone, C., et al. 2015 The response of nitrifying microbial assemblages to ammonium (NH4+) enrichment from salmon farm activities in a northern Chilean Fjord. Estuarine, Coastal and Shelf Science. http://dx.doi.org/10.1016/j.ecss.2015.03.021
100
Eva, J., H. Stryhn, J. Yu, M. H. Medina, E. E. Rees, j Sanchez and S. St-Hilaire. 2014. Epidemiology of Piscirickettsiosis on selected Atlantic salmon (Salmo salar) and rainbow trout (Oncorhynchus mykiss) salt water aquaculture farms in Chile. In: Aquaculture 433:288–294 · September 2014
Farley, E. V., Murphy, J. M., Adkison, M. D., Eisner, L. B., Helle, J. H., Moss, J. H. & Nielsen, J. (2007). Early marine growth in relation to marine-stage survival rates for Alaska sockeye salmon (Oncorhynchus nerka).Fishery Bulletin105,121–130.
FAO. 2012. Improving biosecurity through prudent and responsible use of veterinary medicines in aquatic food production. FAO Fisheries And Aquaculture Technical Paper. 547.
FDA (2012). Guidance for Industry #209. The Judicious Use of Medically Important Antimicrobial Drugs in Food-Producing Animals F. a. D. A. U.S. Department of Health and Human Services, Center for Veterinary Medicine.
Fernandez-Alarcon et al. 2010. Detection of the floR gene in a diversity of florfenicol resistant Gram-negative bacilli from freshwater salmon farms in Chile. Zoonoses Public Health. 2010 May;57(3):181-8.
FHL (2011). "Environmental Report 2010." Norwegian Seafood Federation. Finstad, O., K. Falk et al. (2012). "Immunohistochemical detection of piscine reovirus (PRV) in
hearts of Atlantic salmon coincide with the course of heart and skeletal muscle inflammation (HSMI)." Veterinary Research 43: 27.
Fisher, A.C., Volpe, J.P. & Fisher, J.T. 2014. Occupancy dynamics of escaped farmed Atlantic salmon in Canadian Pacific coastal salmon streams: implications for sustained invasions Biol Invasions (2014) 16: 2137. doi:10.1007/s10530-014-0653-x
Foreman, M.G.G., Chandler, P.C., Stucchi, D.J., Garver, K.A., Guo, M., Morrison, J., Tuele, D. 2015. The ability of hydrodynamic models to inform decisions on the siting and management of aquaculture facilities in British Columbia. DFO Can. Sci. Advis. Sec. Res. Doc. 2015
Frazer, L. N., A. Morton et al. (2012). "Critical thresholds in sea lice epidemics: evidence, sensitivity and subcritical estimation." Proceedings of the Royal Society B: Biological Sciences.
Garseth, Å. H., C. Fritsvold et al. (2012). "Piscine reovirus (PRV) in wild Atlantic salmon, Salmo salar L., and sea-trout, Salmo trutta L., in Norway." Journal of Fish Diseases: n/a-n/a.
Garver K., Traxler G., Hawley L., Richard J., Ross J., Lovy J. (2013). Molecular epidemiology of viral haemorrhagic septicaemia virus (VHSV) in British Columbia, Canada, reveals transmission from wild to farmed fish. Diseases of aquatic organisms, 104, 2, 93-104.
Garseth, A., E. Biering et al. (2013). "Associations between piscine reovirus infection and life history traits in wild-caught Atlantic salmon Salmo salar L. in Norway." Preventive Veterinary Medicine 112(1–2): 138-146
Garver, K. A., Marty, G. D., Cockburn, S. N., Richard, J., Hawley, L. M., Müller, A., Thompson, R. L., Purcell, M. K. and Saksida, S. (2016), Piscine reovirus, but not Jaundice Syndrome, was transmissible to Chinook Salmon, Oncorhynchus tshawytscha (Walbaum), Sockeye Salmon, Oncorhynchus nerka (Walbaum), and Atlantic Salmon, Salmo salar L.. J Fish Dis, 39: 117–128. doi:10.1111/jfd.12329
Garver, K., S.C. Johnson, M.P. Polinski, J.C. Bradshaw, G.D. Marty, H.N. Snyman, D.B. Morrison, J. Richard. 2016. Piscine orthoreovirus from western north America is

101
transmissible to Atlantic salmon and sockeye salmon but fails to cause heart and skeletal muscle inflammation, PLoS One (2016). http://dx.doi.org/10.1371/journal. pone.0146229.
Gillespie 2013 Storm-tossed fish farms - escapes feared. South coast today. http://www.southcoasttoday.ca/content/storm-tossed-fish-farms-escapes-feared
Glover KA, Solberg MF, McGinnity P, et al. Half a century of genetic interaction between farmed and wild Atlantic salmon: Status of knowledge and unanswered questions. Fish Fish. 2017;00:1–38.
Glover, K., M. Quintela et al. (2012). "Three Decades of Farmed Escapees in the Wild: A Spatio-Temporal Analysis of Atlantic Salmon Population Genetic Structure throughout Norway." Plos One 7(8): e43129.
Godoy MG, Kibenge MJT, Suarez R, Lazo E, Heisinger A, Aguinaga J, Bravo D, Mendoza J, Llegues KO, Avendano-Herrera R, Vera C, Mardones F, Kibenge FSB. 2013. Infectious salmon anaemia virus (ISAV) in Chilean Atlantic salmon (Salmo salar) aquaculture: emergence of low pathogenic ISAV-HPR0 and re-emergence of virulent ISAV-HPRΔ: HPR3 and HPR14. Virology Journal, 10:334.
Godwin, S. C., Dill, L. M., Krkošek, M., Price, M. H. H. and Reynolds, J. D. (2017), Reduced growth in wild juvenile sockeye salmon Oncorhynchus nerka infected with sea lice. J Fish Biol. doi:10.1111/jfb.13325
Godwin, S., Dill, L., Reynolds, J., Krkošek, M. 2015. Sea lice, sockeye salmon, and foraging competition: lousy fish are lousy competitors. Canadian Journal of Fisheries and Aquatic Sciences, 2015, 72:1113-1120, 10.1139/cjfas-2014-0284
Gormican, S.J. 1989. Water circulation, dissolved oxygen and ammonia concentrations in fish net-cages. M.Sc. thesis, Univ. of B.C.
Gowen, R.J., Weston, D.P., Ervik, A., 1991. Aquaculture and the benthic environment: a review. In: Cowey, C.B., Cho, C.Y. (Eds.), Nutritional Strategies and Aquacultural Waste. Fish Nutrition Research Laboratory, Department of Nutritional Sciences, University of Guelph, Ontario, pp. 187–205.
Groner, M.L., Rogers, L.A., Bateman A.W., Connors, B.M., et al. 2016. Lessons from sea louse and salmon epidemiology. Philosophical Transactions of the Royal Society B – Biological Science. Available online first: DOI: 10.1098/rstb.2015.0203.
Gross, M. R. (1998). "One species with two biologies: Atlantic salmon (Salmo salar) in the wild and in aquaculture." Canadian Journal of Fisheries and Aquatic Science 55(1): 131-144.
Hammell, L., C. Stephen et al. (2009). Salmon Aquaculture Dialogue Working Group Report on Salmon Disease, Salmon Aquaculture Dialogue, WWF.
Hansen, L. P. and A. F. Youngson (2010). "Dispersal of large farmed Atlantic salmon, Salmo salar, from simulated escapes at fish farms in Norway and Scotland." Fisheries Management and Ecology 17(1): 28-32.
Heino, M., Svåsand, T. Wennevik, V., Glover, K. 2015. Genetic introgression of farmed salmon in native populations: quantifying the relative influence of population size and frequency of escapees. Aquacult Environ Interact. Vol. 6: 185–190, 2015
Henriquez-nunez, H., O. Evrard, G. Kronvall, and R. Avendano-Herrera. 2012. Antimicrobial susceptibility and plasmid profiles of Flavobacterium psychrophilum strains isolated in Chile. Aquaculture 354-355:38-44.

102
Heuer OE, Kruse H, Grave K, Collignon P, Karunasagar I, Angulo FJ (2009). Human health consequences of use of antimicrobial agents in aquaculture. Clin Infect Dis 49:1248–1253.
Husa, V., Kutti, T., Ervik, A., Sjøtun, K., Kupka, P., Aure, H. (2014) Regional impact from finfish farming in an intensive production area (Hardangerfjord, Norway), Marine Biology Research, 10:3, 241-252, DOI: 10.1080/17451000.2013.810754
IMR(2013). Annual report on health monitoring of wild anadromous salmonids in Norway. Norewigian Institute for Marine Research. Online http://www.imr.no/filarkiv/2013/03/annual_report_on_health_monitoring_of_wild_anadromous_salmonids_in_norway_rapport_fra_havforskningen_nr._6-2013_.pdf/en
Ikonomou, M. Surridge, B. 2013. Ultra-trace determination of aquaculture chemotherapeutants and degradation products in environmental matrices by LC-MS/MS
International Journal Of Environmental Analytical Chemistry Vol. 93 , Iss. 2,2013 Irvine, J.R. and Crawford, W.R. 2013. State of physical, biological, and selected fishery resources
of Pacific Canadian marine ecosystems in 2012. DFO Can. Sci. Advis. Sec. Res. Doc. 2013/032.
Jakob, E., Sweeten, T., Bennett, W., and Jones, S.R.M. 2013. Development of the salmon louse, Lepeophtheirus salmonis and its effects on juvenile sockeye salmon Oncorhynchus nerka. Dis.Aquat. Organ. 106: 217-227.
Jackson A (2009) Fish in–fish out ratios explained. Aquaculture Europe 34 (3): 5–10. Johansen, L. H., I. Jensen et al. (2011). "Disease interaction and pathogens exchange between
wild and farmed fish populations with special reference to Norway." Aquaculture 315(3–4): 167-186.
Jones, S., E. Kim et al. (2008). "Early development of resistance to the salmon louse, Lepeophtheirus salmonis (Kroyer), in juvenile pink salmon, Oncorhynchus gorbuscha (Walbaum)." Journal of Fish Diseases 31(8): 591-600.
Jones, S. R. M. and Richard J. Beamish (2012). "Comment on "Evidence of farm-induced parasite infestations on wild juvenile salmon in multiple regions of coastal British Columbia, Canada"•Original article appears in Can. J. Fish. Aquat. Sci. 67(12): 1925-1932." Canadian Journal of Fisheries and Aquatic Sciences 69(1): 201-203.
Jones, P. G., K. L. Hammell, et al. (2013). "Detection of emamectin benzoate tolerance emergence in different life stages of sea lice, Lepeophtheirus salmonis, on farmed Atlantic salmon, Salmo salar L." Journal of Fish Diseases 36(3): 209-220.
Jonsson, B. and N. Jonsson (2006). "Cultured Atlantic salmon in nature: a review of their ecology and interaction with wild fish." ICES Journal of Marine Science 63: 1162-1181.
Keeley NB, Forrest BM, Macleod CK 2015. Benthic recovery and re-impact responses from salmon farm enrichment: Implications for farm management. Aquaculture. Volume 435. Pages 412-423.
Keeley, N., Cromey, C., Goodwin, E., Gibbs, M., Macleod, C. 2013. Predictive depositional modelling (DEPOMOD) of the interactive effect of current flow and resuspension on ecological impacts beneath salmon farms. Aquaculture Environmet interactions. Vol. 3: 275–291, 2013
Keith, I. 2016. Piscirickettsia salmonis Distribution in farmed salmon in coastal British Columbia 2011-2016. BC Cenre for Aquatic Health Sciences. SRS Workshop May 31 2016.

103
Kibenge, M., T. Iwamato et al. (2013). "Whole-genome analysis of piscine reovirus (PRV) shows PRV represents a new genus in family Reoviridae and its genome segment S1 sequences group it into two separate sub-genotypes." Virology 10: 230.
Korman, J. (2011). "Summary of information for evaluating impacts of salmon farms on survival of Fraser River sockeye salmon." Cohen Commission Tech. Rep. 5A. 65p. Vancouver, BC www.cohencommission.ca.
Krkosek, M., B. M. Connors et al. (2011). "Effects of parasites from salmon farms on productivity of wild salmon." Proceedings of the National Academy of Sciences 108(35): 14700-14704.
Krkosek, M. and R. Hilborn (2011). "Sea lice (Lepeophtheirus salmonis) infestations and the productivity of pink salmon (Oncorhynchus gorbuscha) in the Broughton Archipelago, British Columbia, Canada." Canadian Journal of Fisheries & Aquatic Sciences 68(1): 17-29.
Krkosek, M., C. W. Revie et al. (2013). "Comment on Jackson et al. ‘Impact of Lepeophtheirus salmonis infestations on migrating Atlantic salmon, Salmo salar L., smolts at eight locations in Ireland with an analysis of lice-induced marine mortality’." Journal of Fish Diseases: Published online 14 Aug 2013.
Krkosek, M., C. W. Revie et al. (2013). "Impact of parasites on salmon recruitment in the Northeast Atlantic Ocean." Proceedings of the Royal Society B: Biological Sciences 280(1750).
Lalonde, B., W. Ernst et al. (2012). "Measurement of Oxytetracycline and Emamectin Benzoate in Freshwater Sediments Downstream of Land Based Aquaculture Facilities in the Atlantic Region of Canada." Bulletin of Environmental Contamination and Toxicology Online first: 1-4.
Lander, T. R., S. M. C. Robinson et al. (2013). "Characterization of the suspended organic particles released from salmon farms and their potential as a food supply for the suspension feeder, Mytilus edulis in integrated multi-trophic aquaculture (IMTA) systems." Aquaculture 406–407(0): 160-171.
Laxminarayan, R., A. Duse et al. (2013). "Antibiotic resistance - the need for global solutions." The Lancet Infectious Diseases 13(12): 1057-1098.
Lia, L., Mackas, D., Hunt, B., Schweigert, J., Pakhomov E., Perry, R., Galbraith, M., Pitcher, T. 2013. Zooplankton communities in the Strait of Georgia, British Columbia, track large-scale climate forcing over the Pacific Ocean. Progress in Oceanography. Volume 115, August 2013, Pages 90–102
Long A, Richard J, Hawley L, LaPatra SE, Garver KA (2017) Transmission potential of infectious hematopoietic necrosis virus in APEX-IHN®-vaccinated Atlantic salmon. Dis Aquat Org 122:213-221.
Lovya, J., P. Piesik et al. (2013). "Experimental infection studies demonstrating Atlantic salmon as a host and reservoir of viral hemorrhagic septicemia virus type IVa with insights into pathology and host immunity." Veterinary microbiology 166(1–2): 91-101.
Loucks, R. H., R. E. Smith et al. (2012). "Copper in the sediment and sea surface microlayer near a fallowed, open-net fish farm." Marine pollution bulletin 64(9): 1970-1973.

104
Lyngstad T., Kristoffersen A. et al. (2012). "Low virulent infectious salmon anaemia virus (ISAV-HPR0) is prevalent and geographically structured in Norwegian salmon farming." Diseases of aquatic organisms 101(3): 197-206.
Mackas, D., Galbraith, M., Faust, D, et al. 2013. Zooplankton time series from the Strait of Georgia: Results from year-round sampling at deep water locations, 1990–2010, Progress in Oceanography, Volume 115, 2013, Pages 129-159,
Macleod, C. K., N. A. Moltschaniwskyj et al. (2008). "Ecological and functional changes associated with long-term recovery from organic enrichment." Marine Ecology Progress Series 365(Journal Article): 17-24.
Marie George, E., Parrish, C. 2013. Invertebrate uptake of lipids in the vicinity of Atlantic salmon (Salmo salar) aquaculture sites in British Columbia. Aquaculture Research. Published online Aug 20 2013.
Marine Harvest. 2016. Reference Document: Salmon Farming in British Columbia. November 2016. http://www.marineharvest.ca/globalassets/canada/pdf/sf-reference-doc/salmon-farming-in-british-columbia_updated-november-2016_marine-harvest-canada.pdf
Marty, G. 2013. Piscine Reovirus Information Sheet. Animal Health Centre, BC Ministry of Agriculture.
Marty, G. D. 2015. Information Regarding Concerns about Farmed Salmon - Wild Salmon Interactions. BC Ministry of Agriculture, Animal Health Centre, Abbotsford. March 16, 2015.
Marty G.D. 2016. ISA claims rubbished. Fish farming Expert. January 1 2016. http://www.fishfarmingexpert.com/news/isa-claims-rubbished/
Marty, G. D., S. Saksida et al. (2010). "Relationship of farm salmon, sea lice, and wild salmon populations." Proceedings of the National Academy of Science USA 107(52).
Marty, G. D., Morrison, D. B., Bidulka, J., Joseph, T. and Siah, A. (2015), Piscine reovirus in wild and farmed salmonids in British Columbia, Canada: 1974–2013. J Fish Dis, 38: 713–728. doi:10.1111/jfd.12285
Mayor, D. J. and M. Solan (2011). "Complex interactions mediate the effects of fish farming on benthic chemistry within a region of Scotland." Environmental research 111(5): 635-642.
Mayor, D. J., A. F. Zuur et al. (2010). "Factors Affecting Benthic Impacts at Scottish Fish Farms." Environmental science & technology 44(6): 2079-2084.
McKinnell, S. (2013). Challenges for the Kasatoshi volcano hypothesis as the cause of a large return of sockeye salmon (Oncorhynchus nerka) to the Fraser River in 2010. Fisheries Oceanography 22(4): 337-344.
Millanao, A., M. Barrientos et al. (2011). "Injudicious and excessive use of antibiotics: Public health and salmon aquaculture in Chile." Revista médica de Chile 139: 107.
Miller, K.M., Li, S, Kaukinen, K.H., Ginther, N., Hammill, E., Curtis, J.M.R., Patterson, D.A., Sierocinski, T., Donnison, L., Pavlidis, P., Hinch, S.G., Hruska, K.A., Cooke, S.J., English, K.K., and Farrell, A.P. 2011. Genomic signatures predict migration and spawning failure in wild Canadian salmon.Science. Vol.331, pg.214-218
Miller, K. M., Teffer, A., Tucker, S., Li, S., Schulze, A. D., Trudel, M., Juanes, F., Tabata, A., Kaukinen, K. H., Ginther, N. G., Ming, T. J., Cooke, S. J., Hipfner, J. M., Patterson, D. A. and Hinch, S. G. (2014), Infectious disease, shifting climates, and opportunistic

105
predators: cumulative factors potentially impacting wild salmon declines. Evol Appl, 7: 812–855. doi:10.1111/eva.12164
Milligan B. 2016. Issues & challenges in the BC salmon farming industry. Piscirickettsia salmonis: SRS Workshop. Piscirickettsia salmonis: Salmonid rickettsial septicemia: SRS Current Knowledge & Future Directions. BC Centre for Aquatic Health Sciences. May 31 2916.
Miranda, C. 2012. Antimicrobial Resistance in the Environment, First Edition. Edited by Patricia L. Keen and Mark H.M.M. Montforts . John Wiley & Sons, Inc.
Morrison, D., Saksida, S. 2013. Trends in Antimicrobial Use in Marine Harvest Canada Farmed Salmon Production in British Columbia (2003-2011). Canadian Veterinary Journal, in press.
Morton, A., R. Routledge et al. (2011). "Sea lice dispersion and salmon survival in relation to salmon farm activity in the Broughton Archipelago." ICES Journal of Marine Science: Journal du Conseil 68(1): 144-156.
Morton, A., Routledge, R. 2016. Risk and precaution: Salmon farming, Marine Policy, Volume 74, December 2016, Pages 205-212
Murray, A. (2013). "Implications of leaky boundaries for compartmentalised control of pathogens: A modelling case study for bacterial kidney disease in Scottish salmon aquaculture." Ecological Modelling 250(0): 177-182.
Navarro, N., R. J. G. Leakey et al. (2008). "Effect of salmon cage aquaculture on the pelagic environment of temperate coastal waters: seasonal changes in nutrients and microbial community." Marine Ecology Progress Series 361(Journal Article): 47-58.
Nendick, L., M. Sackville et al. (2011). "Sea lice infection of juvenile pink salmon (Oncorhynchus gorbuscha): effects on swimming performance and postexercise ion balance." Canadian Journal of Fisheries and Aquatic Sciences 68(2): 241-249.
Noakes, D. (2011). "Impacts of salmon farms on Fraser River sockeye salmon: results of the Noakes investigation." Cohen Commission Tech. Rept. 5C. 113p. Vancouver, BC www.cohencommission.ca.
Nofima (2011). "Resource utilisation and eco-efficiency of Norwegian salmon farming in 2010." Report 53/2011,Published December 2011.
NOAA (2012). Informational Bulletin on the Status of Infectious Salmon Anemia Virus in the Pacific Northwest. Federal Aquatic Animal Health Task Force. February 14, 2012.
NORM/NORM-VET 2012. Usage of Antimicrobial Agents and Occurrence of Antimicrobial Resistance in Norway. Tromsø / Oslo 2013. ISSN:1502-2307 (print) / 1890-9965 (electronic).
Obee, N. (2009). "Chemical and Biological Remediation of Marine Sediments at a Fallowed Salmon Farm, Centre Cove, Kyuquot Sound, BC" Ministry of Environment, Province of British Columbia.
Olgun, N.,Duggen, S., Langmann, B., Hort, M., Waythomas, C,F., Hoffmann, L., Croot P. 2013. Geochemical evidence of oceanic iron fertilization by the Kasatochi volcanic eruption in 2008 and the potential impacts on Pacific sockeye salmon. Marine Ecology Progress Series 488:81-88.
Olsen, A. and O. Skilbrei (2010). "Feeding preference of recaptured Atlantic salmon Salmo salar following simulated escape from fish pens during autumn." Aquaculture Environment Interactions 1: 167-174.
106
Olsen, S. A., A. Ervik et al. (2012). "Tracing fish farm waste in the northern shrimp Pandalus borealis (Krøyer, 1838) using lipid biomarkers." Aquaculture Environment Interactions 2(2): 133-144.
Palacios, G., M. Lovoll et al. (2010). "Heart and Skeletal Muscle Inflammation of Farmed Salmon Is Associated with Infection with a Novel Reovirus." Plos One 5(7): e11487.
Patanasatienkul, T., Sanchez, J., Rees, E., Krkošek, M., Jones, S., Revie, C., Sea lice infestations on juvenile chum and pink salmon in the Broughton Archipelago, Canada, from 2003 to 2012. Dis Aquat Organ. 2013 Jul 22;105(2):149-61.
Citation: Peacock, S. J., M. Krkošek, A. W. Bateman, and M. A. Lewis. 2015. Parasitism and food web dynamics of juvenile Pacific salmon. Ecosphere 6(12):264. http://dx.doi.org/10.1890/ES15-00337.1
Peacock, S.J. 2016. Sea lice on juvenile wild salmon in the Broughton Archipelago, British Columbia. A report from the Salmon Coast Field Station Society. Available from www.salmoncoast.org.
Peacock, S. J., Bateman, A. W., Krkošek, M., Connors, B., Rogers, S., Portner, L., Polk, Z., Webb, C. and Morton, A. (2016), Sea-louse parasites on juvenile wild salmon in the Broughton Archipelago, British Columbia, Canada. Ecology, 97: 1887. doi:10.1002/ecy.1438
Peacock, S. J., M. Krkošek, A. W. Bateman, and M. A. Lewis. 2015. Parasitism and food web dynamics of juvenile Pacific salmon. Ecosphere 6(12):264. http://dx.doi.org/10.1890/ES15-00337.1
Peacock, S. J., B. M. Connors et al. 2014. "Can reduced predation offset negative effects of sea louse parasites on chum salmon?" Proc. R. Soc B 281.
Peacock, S., Krkošek, M., Proboszcz, S., Orr, C., Lewis, M. 2013. Cessation of a salmon decline with control of parasites. Ecol Appl. ;23(3):606-20.
Persson, G., 1988. Relationship between feed, productivity and pollution in the farming of large rainbow trout (Salmo gairdneri). Report No. 3534. National Swedish Environmental Protection Board, Stockholm
Piccolo, J. and E. Orlikowska (2012). "A bilogical risk assessment for an Atlantic salmon (Salmo salar) invasion in Alaskan waters." Aquatic Invasions 7(2): 259-270.
Price C., Black KD, Hargrave BT, Morris JA Jr (2015) Marine cage culture and the environment: effects on water quality and primary production. Aquacult Environ Interact 6:151-174. https://doi.org/10.3354/aei00122
Price, M., Glickman, B., Reynolds, J. 2013. Prey Selectivity of Fraser River Sockeye Salmon during Early Marine Migration in British Columbia. Transactions of the American Fisheries Society. Volume 142, Issue 4, 2013
Price, M. H. H., S. L. Proboszcz et al. (2011). "Sea Louse Infection of Juvenile Sockeye Salmon in Relation to Marine Salmon Farms on Canada's West Coast." Plos One 6(2): e16851.
Preikshot, D., Beamish, R., Neville, C. 2013. A dynamic model describing ecosystem-level changes in the Strait of Georgia from 1960 to 2010. Progress in Oceanography, Volume 115, Pages 28–40
Price, M. H. H. and J. D. Reynolds (2012). "Salmon farms as a source of sea lice on juvenile wild salmon; reply to the comment by Jones and Beamish Comment appears in Can. J. Fish. Aquat. Sci. 69." Canadian Journal of Fisheries and Aquatic Sciences 69(1): 204-207.
107
Ramírez, A. 2007. Salmon by-product proteins. FAO Fisheries Circular. No. 1027. Rome, FAO. 2007. 31p.
Roberts, N. (2010). Effect of salmon farms on element concentrations and stable isotopes in Manila clams and sediment in Clayoquot Sound, British Columbia. MSc MSc, University of Victoria.
Rogers LA, Peacock SJ, McKenzie P, DeDominicis S, Jones SRM, Chandler P, et al. (2013) Modeling Parasite Dynamics on Farmed Salmon for Precautionary Conservation Management of Wild Salmon. PLoS ONE 8(4): e60096. doi:10.1371/journal.pone.0060096
Rozas, M., Enriquez, R., 2014. Piscirickettsiosis and Piscirickettsia salmonis in fish: a review. J Fish Dis 37, 163-188.
Ruggerone, G, T., Connors, B. 2016. Productivity and life history of sockeye salmon in relation to competition with pink and sockeye salmon in the North Pacific Ocean. Canadian Journal of Fisheries and Aquatic Sciences, 2015, 72:818-833, 10.1139/cjfas-2014-0134
Russell, M., C. D. Robinson et al. (2011). "Persistent organic pollutants and trace metals in sediments close to Scottish marine fish farms." Aquaculture 319(1–2): 262-271.
Saksida, S., M. 2016. A Summary Of Sea Lice In Bc – Wild And Farmed Monitoring And Management. Submitted as part of Variance Request 141 to the Aquaculture Stewardship Council. www.asc-aqua.org
Saksida, S.M., Constantine, J. 2007. Evaluation of sea lice abundance levels on farmed Atlantic salmon (Salmo salar L.) located in the Broughton Archipelago of British Columbia from 2003 to 2005. Aquaculture Research. Volume 38, Issue 3, pages 219–231, March 2007
Saksida, S. M., G. D. Marty et al. (2012). "Parasites and hepatic lesions among pink salmon, Oncorhynchus gorbuscha (Walbaum), during early seawater residence." Journal of Fish Diseases 35(2): 137-151.
Saksida, S. M., D. Morrison et al. (2012). "Use of Atlantic salmon, Salmo salar L., farm treatment data and bioassays to assess for resistance of sea lice, Lepeophtheirus salmonis, to emamectin benzoate (SLICE®) in British Columbia, Canada." Journal of Fish Diseases Online October 2012: n/a-n/a.
Saksida, S. M., D. Morrison et al. (2010). "The efficacy of emamectin benzoate against infestations of sea lice, Lepeophtheirus salmonis, on farmed Atlantic salmon, Salmo salar L., in British Columbia." Journal of Fish Diseases 33(11): 913-917.
Samuelsen, O. B., Lunestad, B. T., Hannisdal, R., Bannister, R., Olsen, S., Tjensvoll, T., ... & Ervik, A. (2015). Distribution and persistence of the anti sea-lice drug teflubenzuron in wild fauna and sediments around a salmon farm, following a standard treatment. Science of the Total Environment 508: 115-121.
Sanderson, J.C., Cromey, C., Dring, M.J. and Kelly, M.S. (2008). “Distribution of nutrients for seaweed cultivation around salmon cages at farm sites in north-west Scotland”. Aquaculture, 278, 60-68.
Sanderson, J. C., M. J. Dring, et al. (2012). "Culture, yield and bioremediation potential of Palmaria palmata (Linnaeus) Weber & Mohr and Saccharina latissima (Linnaeus) C.E. Lane, C. Mayes, Druehl & G.W. Saunders adjacent to fish farm cages in northwest Scotland." Aquaculture 354-355(0): 128-135.

108
Sara, G. (2007). "A meta-analysis on the ecological effects of aquaculture on the water column: Dissolved nutrients." Marine Environmental Research 63(4): 390-408.
SARF098: Towards Understanding of the Environmental Impact of a Sea Lice Medicine – the PAMP Suite, 2016. A study commissioned by the Scottish Aquaculture Research Forum (SARF). http://www.sarf.org.uk/
SEPA (2011). "The Occurrence of Chemical Residues in Sediments in Loch Linnhe, Loch Ewe and Loch Nevis: 2009 Survey " Scottish Environmental Protection Agency JT000811_JT
Sernapesca 2016b. "Informe sobre uso de antimicrobianos en la salmonicultura nacional 2015." Unidad de Salud Animal, Valparaiso.
Sharma, R., VeLez-Espino, L., Wetheimer, A.,Mantu, N., Francis, R. 2013. Relating spatial and temporal scales of climate and ocean variability to survival of Pacific Northwest Chinook salmon (Oncorhynchus tshawytscha) Progress in Oceanography, Volume 115, August 2013, Pages 90–102
Sheppard, M., 1992. Clinical impressions of furunculosis in British Columbian waters. Bull. Aquacult. Assoc. Can. 92-1, p29-30.
Silvert, W., 1994. Modeling benthic deposition and impacts of organic matter loading. In: Hargrave, B.T. (Ed.), Modeling Benthic Impacts of Organic Enrichment from Marine Aquaculture. Can. Tech. Rep. Fish. Aquat. Sci. 1949, pp. 1–30.
Skilbrei, O. and T. Jorgensen (2010). "Reacpture of cultured salmon following a large-scale escape event." Aquaculture Environment Interactions 1: 107-115.
Skilbrei, O. and V. Wennevik (2006). "Survival and growth of sea-ranched Atlantic salmon treated against sea lice prior to release." ICES Journal of Marine Science 63: 1317-1325.
Strain, P. (2005). "Eutrophication Impacts of Marine Finfish Aquaculture." Canadian Science Advisory Secretariat, Fisheries and Oceans Canada Research Document 2005/034.
Sutherland, B. J. G., S. G. Jantzen, et al. (2011). "Differentiating size-dependent responses of juvenile pink salmon (Oncorhynchus gorbuscha) to sea lice (Lepeophtheirus salmonis) infections." Comparative Biochemistry and Physiology Part D: Genomics and Proteomics 6(2): 213-223.
Tanasichuk, R., Luedke, W. 2002. Euphausiid Availability Explains Marine Survival Variation for Barkley Sound Coho Salmon (Oncorhynchus kisutch) and Sockeye Salmon (O. nerka). NPAFC Technical Report No. 4.
Taranger, G. L., Karlsen, Ø., Bannister, R. J., Glover, K. A., Husa,V., Karlsbakk, E., Kvamme, B. O., Boxaspen, K. K., Bjørn, P. A., Finstad, B., Madhun, A. S., Morton, H. C., and Sva˚sand, T. 2015. Risk assessment of the environmental impact of Norwegian Atlantic salmon farming. – ICES Journal of Marine Science, 72: 997–1021.
Thomassen, P. E. and B. J. Leira (2012). "Assessment of Fatigue Damage of Floating Fish Cages Due to Wave Induced Response." Journal of Offshore Mechanics and Arctic Engineering 134(1): 011304.
Thompson, R., Beamish,R., Beacham, T., Trudel, M. 2012. Anomalous Ocean Conditions May Explain the Recent Extreme Variability in Fraser River Sockeye Salmon Production. Marine and Coastal Fisheries: Dynamics, Management, and Ecosystem Science 4:415–437, 2012
Thorstad, E. B., I. A. Fleming et al. (2008). "Incidence and impacts of escaped farmed Atlantic salmon Salmo salar in nature." NINA Special Report 36. 110 pp.

109
Torrissen, O., S. Jones et al. (2013). "Salmon lice – impact on wild salmonids and salmon aquaculture." Journal of Fish Diseases 36(3): 171-194.
Troell, M., C. Halling et al. (1997). "Integrated marine cultivation of Gracilaria chilensis (Gracilariales, Rhodophyta) and salmon cages for reduced environmental impact and increased economic out put." Aquaculture 156: 45-61.
Tusevljak, N., L. Dutil et al. (2012). "Antimicrobial Use and Resistance in Aquaculture: Findings of a Globally Administered Survey of Aquaculture-Allied Professionals." Zoonoses and Public Health: no-no.
Ugelvik, M. S., Skorping, A., Moberg, O. and Mennerat, A. (2017), Evolution of virulence under intensive farming: salmon lice increase skin lesions and reduce host growth in salmon farms. Journal of Evolutionary Biology. doi: 10.1111/jeb.13082
Uglem, I., F. Økland et al. (2012). "Early marine survival and movements of escaped Atlantic salmon Salmo salar L. juveniles from a land-based smolt farm during autumn." Aquaculture Research: n/a-n/a.
Venayagamoorthy, S., H. Ku et al. (2011). "Numerical modeling of aquaculture dissolved waste transport in a coastal embayment." Environmental Fluid Mechanics 11(4): 329-352.
Volpe, J., B. Glickman et al. (2001). "Reproduction of aquaculture Atlantic salmon in a controlled stream channel on Vancouver Island, British Columbia." Transactions of the American Fisheries Society 130: 489-494.
Volpe, J., E. Taylor, et al. (2000). "Evidence of natural reproduction of aquaculture-escaped Atlantic salmon in a coastal British Columbia river." Conservation Biology 14: 899-903.
Vollset, K. W., Dohoo, I., Karlsen, Ø., Halttunen, E., Kvamme, B. O., Finstad, B., Wennevik, V., Diserud, O. H., Bateman, A., Friedland, K. D., Mahlum, S., Jørgensen, C., Qviller, L., Krkosek, M., Atland, A., and Barlaup, B. T. 2017. Disentangling the role of sea lice on the marine survival of Atlantic salmon. – ICES Journal of Marine Science, doi:10.1093/icesjms/fsx104.
Waknitz FW, Tynan TJ, Nash CE, Iwamoto RN, Rutter LG. (2002) Review of potential impacts of Atlantic salmon culture on Puget Sound chinook salmon and Hood Canal summer-run chum salmon evolutionarily significant units. U.S. Department of Commerce. NOAA Techical Memo. NMFS–NWFSC–53, 83 pp
Wang, X., L. Olsen et al. (2013). "Discharge of nutrient wastes from salmon farms: environmental effects, and potential for integrated multi-trophic aquaculture." Aquaculture Environment Interactions 2(3): 267-283.
WHO (2011). "Critically important antimicrobials for human medicine. 3rd revision - 2011." World Health Organization.
WHO (2011). Tackling antibiotic resistance from a food safety perspective in Europe R. O. f. E. S. World Health Organization (WHO), DK-2100 Copenhagen Ø, Denmark. http://www.euro.who.int/__data/assets/pdf_file/0005/136454/e94889.pdf
Whoriskey, F., P. Brooking et al. (2006). "Movements and survival of sonically tagged farmed Atlantic salmon released in Cobscook Bay, Maine, USA." ICES Journal of Marine Science 63: 1218-1223.
Wilding, T. A. (2011). "A characterization and sensitivity analysis of the benthic biotopes around Scottish salmon farms with a focus on the sea pen Pennatula phosphorea L." Aquaculture Research 42: 35-40.

110
Yazawa, R., M. Yasuike et al. (2008). "EST and Mitochondrial DNA Sequences Support a Distinct Pacific Form of Salmon Louse, Lepeophtheirus salmonis." Marine Biotechnology 10(6): 741-749.

111
About Seafood Watch® Monterey Bay Aquarium’s Seafood Watch® program evaluates the ecological sustainability of wild-caught and farmed seafood commonly found in the North American marketplace. Seafood Watch® defines sustainable seafood as originating from sources, whether wild-caught or farmed, which can maintain or increase production in the long-term without jeopardizing the structure or function of affected ecosystems. Seafood Watch® makes its science-based recommendations available to the public on www.seafoodwatch.org. The program’s goals are to raise awareness of important ocean conservation issues and empower seafood consumers and businesses to make choices for healthy oceans. Each sustainability recommendation is supported by a Seafood Report. Each report synthesizes and analyzes the most current ecological, fisheries and ecosystem science on a species, then evaluates this information against the program’s conservation ethic to arrive at a recommendation of “Best Choices,” “Good Alternatives,” or “Avoid.” The detailed evaluation methodology is available on our website. In producing the Seafood Reports, Seafood Watch seeks out research published in academic, peer-reviewed journals whenever possible. Other sources of information include government technical publications, fishery management plans and supporting documents, and other scientific reviews of ecological sustainability. Seafood Watch Research Analysts also communicate regularly with ecologists, fisheries and aquaculture scientists, and members of industry and conservation organizations when evaluating fisheries and aquaculture practices. Capture fisheries and aquaculture practices are highly dynamic; as the scientific information on each species changes, Seafood Watch’s sustainability recommendations and the underlying Seafood Reports will be updated to reflect these changes. Parties interested in capture fisheries, aquaculture practices and the sustainability of ocean ecosystems are welcome to use Seafood Reports in any way they find useful. For more information about Seafood Watch and Seafood Reports, please contact the Seafood Watch program at Monterey Bay Aquarium by calling 1-877-229-9990. Disclaimer Seafood Watch® strives to ensure all our Seafood Reports and the recommendations contained therein are accurate and reflect the most up-to-date evidence available at time of publication. All our reports are peer reviewed for accuracy and completeness by external scientists with expertise in ecology, fisheries science or aquaculture. Scientific review, however, does not constitute an endorsement of the Seafood Watch program or its recommendations on the part of the reviewing scientists. Seafood Watch is solely responsible for the conclusions reached in this report. We always welcome additional or updated data that can be used for the next revision. Seafood Watch and Seafood Reports are made possible through a grant from the David and Lucile Packard Foundation.

112
Guiding Principles
Seafood Watch defines sustainable seafood as originating from sources, whether fished95 or farmed, that can maintain or increase production in the long-term without jeopardizing the structure or function of affected ecosystems. The following guiding principles illustrate the qualities that aquaculture must possess to be considered sustainable by the Seafood Watch program: Seafood Watch will:
Support data transparency and therefore aquaculture producers or industries that make
information and data on production practices and their impacts available to relevant
stakeholders
Promote aquaculture production that minimizes or avoids the discharge of wastes at the
farm level in combination with an effective management or regulatory system to control
the location, scale and cumulative impacts of the industry’s waste discharges beyond the
immediate vicinity of the farm
Promote aquaculture production at locations, scales and intensities that cumulatively
maintain the functionality of ecologically valuable habitats without unreasonably penalizing
historic habitat damage
Promote aquaculture production that by design, management or regulation avoids the use
and discharge of chemicals toxic to aquatic life, and/or effectively controls the frequency,
risk of environmental impact and risk to human health of their use
Within the typically limited data availability, use understandable quantitative and relative
indicators to recognize the global impacts of feed production and the efficiency of
conversion of feed ingredients to farmed seafood
Promote aquaculture operations that pose no substantial risk of deleterious effects to wild
fish or shellfish populations through competition, habitat damage, genetic introgression,
hybridization, spawning disruption, changes in trophic structure or other impacts associated
with the escape of farmed fish or other unintentionally introduced species
Promote aquaculture operations that pose no substantial risk of deleterious effects to wild
populations through the amplification and retransmission of pathogens or parasites
Promote the use of eggs, larvae, or juvenile fish produced in hatcheries using domesticated
broodstocks thereby avoiding the need for wild capture
Recognize that energy use varies greatly among different production systems and can be a
major impact category for some aquaculture operations, and also recognize that improving
95 “Fish” is used throughout this document to refer to finfish, shellfish and other invertebrates.

113
practices for some criteria may lead to more energy intensive production systems (e.g.,
promoting more energy-intensive closed recirculation systems)
Once a score and rank has been assigned to each criterion, an overall seafood recommendation is developed on additional evaluation guidelines. Criteria ranks and the overall recommendation are color-coded to correspond to the categories on the Seafood Watch pocket guide: Best Choices/Green: Are well managed and caught or farmed in environmentally friendly ways. Good Alternatives/Yellow: Buy, but be aware there are concerns with how they’re caught or farmed. Avoid/Red: Take a pass on these. These items are overfished or caught or farmed in ways that harm other marine life or the environment.

114
Data Points And All Scoring Calculations This is a condensed version of the criteria and scoring sheet to provide access to all data points and calculations. See the Seafood Watch Aquaculture Criteria document for a full explanation of the criteria, calculations and scores. Orange cells represent data entry points.
Criterion 1: Data quality and availability
Data Category Data Quality (0-10)
Industry or production statistics 7.5
Management 10 Effluent 7.5
Habitats 7.5
Chemical use 7.5
Feed 5
Escapes 7.5
Disease 7.5
Source of stock 10
Predators and wildlife 7.5
Unintentional introduction 5 Other – (e.g. GHG emissions) n/a
Total 82.5
C1 Data Final Score (0-10) 7.50 GREEN
Criterion 2: Effluents
Factor 2.1 - Biological waste production and discharge
Factor 2.1a - Biological waste production
Protein content of feed (%) 43
eFCR 1.25
Fertilizer N input (kg N/ton fish) 0
Protein content of harvested fish (%) 18.5
N content factor (fixed) 0.16
N input per ton of fish produced (kg) 86
N in each ton of fish harvested (kg) 29.6
Waste N produced per ton of fish (kg) 56.4
Factor 2.1b - Production System discharge
Basic production system score 0.8
Adjustment 1 (if applicable) 0
Adjustment 2 (if applicable) 0
Adjustment 3 (if applicable) 0

115
Discharge (Factor 2.1b) score (0-1) 0.8
# % of the waste produced by the fish is discharged from the farm
Factor 2.1 Score - Waste discharge score
Waste discharged per ton of production (kg N ton-1) 45.12
Waste discharge score (0-10) 5
Factor 2.2 – Management of farm-level and cumulative effluent impacts
2.2a Content of effluent management measure 4
2.2b Enforcement of effluent management measures 4
2.2 Effluent management effectiveness 6.4
C2 Effluent Final Score (0-10) 6.00 YELLOW
Critical? NO
Criterion 4: Evidence or Risk of Chemical Use Chemical Use parameters Score
C4 Chemical Use Score (0-10) 2
C4 Chemical Use Final Score (0-10) 2 RED
Critical? NO
Criterion 5: Feed
5.1. Wild Fish Use
Feed parameters Score
5.1a Fish In : Fish Out (FIFO)
Fishmeal inclusion level (%) 23
Fishmeal from by-products (%) 49
Criterion 3: HabitatFactor 3.1. Habitat conversion and function
F3.1 Score (0-10) 7
Factor 3.2 – Management of farm-level and cumulative habitat impacts
3.2a Content of habiat management measure 4
3.2b Enforcement of habitat management measures 4
3.2 Habitat management effectiveness 6.4
C3 Habitat Final Score (0-10) 7 GREEN
Critical? NO

116
% FM 11.73
Fish oil inclusion level (%) 12
Fish oil from by-products (%) 31
% FO 8.28
Fishmeal yield (%) 22.5
Fish oil yield (%) 5
eFCR 1.25
FIFO fishmeal 0.65
FIFO fish oil 2.07
FIFO Score (0-10) 4.83
Critical? NO
5.1b Sustainability of Source fisheries
Sustainability score -4
Calculated sustainability adjustment -1.66
Critical? NO
F5.1 Wild Fish Use Score (0-10) 3.17
Critical? NO
5.2 Net protein Gain or Loss
Protein INPUTS
Protein content of feed (%) 43
eFCR 1.25
Feed protein from fishmeal (%)
Feed protein from EDIBLE sources (%) 49.77
Feed protein from NON-EDIBLE sources (%) 50.23
Protein OUTPUTS
Protein content of whole harvested fish (%) 18.5
Edible yield of harvested fish (%) 55
Use of non-edible by-products from harvested fish (%) 100
Total protein input kg/100kg fish 53.75
Edible protein IN kg/100kg fish 26.75
Utilized protein OUT kg/100kg fish 23.51
Net protein gain or loss (%) -12.10
Critical? NO
F5.2 Net protein Score (0-10) 8

117
Criterion 6: Escapes 6.1a System escape Risk (0-10) 5
6.1a Adjustment for recaptures (0-10) 0
6.1a Escape Risk Score (0-10) 5
6.2. Invasiveness score (0-10) 6
C6 Escapes Final Score (0-10) 5 YELLOW
Critical? NO
Criterion 7: Diseases
Disease Evidence-based assessment (0-10) 4
Disease Risk-based assessment (0-10)
C7 Disease Final Score (0-10) 4 YELLOW
Critical? NO
Criterion 8X: Source of Stock
C8X Source of stock score (0-10) 0
C8 Source of stock Final Score (0-10) 0 GREEN
Critical? NO
5.3. Feed Footprint
35
1.25
69.7
Ocean productivity ( C) for continental shelf areas (ton C/ha) 2.68
11.38
32
33
2.88
1.25
2.64
0.60
11.98
6
Feed Final Score
C5 Feed Final Score (0-10) 5.08 YELLOW
Critical? NO
Inclusion level of crop feed ingredients (%)
Inclusion level of land animal products (%)
Conversion ratio of crop ingedients to land animal products
eFCR
Inclusion level of aquatic feed ingredients (%)
eFCR
5.3a Ocean Area appropriated per ton of seafood
5.3b Land area appropriated per ton of seafood
Ocean area appropriated (ha/ton fish)
Carbon required for aquatic feed ingredients (ton C/ton fish)
Total area (Ocean + Land Area) (ha)
F5.3 Feed Footprint Score (0-10)
Average yield of major feed ingredient crops (t/ha)
Land area appropriated (ha per ton of fish)

118
Criterion 9X: Wildlife and predator mortalities C9X Wildlife and Predator Score (0-10) -4
C9X Wildlife and Predator Final Score (0-10) -4 YELLOW
Critical? NO
Criterion 10X: Escape of unintentionally introduced species F10Xa live animal shipments score (0-10) 4.00
F10Xb Biosecurity of source/destination score (0-10) 6.00
C10X Escape of unintentionally introduced species Final Score (0-10) -2.40 GREEN
Critical? n/a