Atlantic meridional heat transports computed from … meridional heat transports computed from...
9
Atlantic meridional heat transports computed from balancing Earth’s energy locally Kevin E. Trenberth 1 and John T. Fasullo 1 1 National Center for Atmospheric Research, Boulder, Colorado, USA Abstract The Atlantic Meridional Overturning Circulation plays a major role in moving heat and carbon around in the ocean. A new estimate of ocean heat transports for 2000 through 2013 throughout the Atlantic is derived. Top-of-atmosphere radiation is combined with atmospheric reanalyses to estimate surface heat fluxes and combined with vertically integrated ocean heat content to estimate ocean heat transport divergence as a residual. Atlantic peak northward ocean heat transports average 1.18 ± 0.13 PW (1 sigma) at 15°N but vary considerably in latitude and time. Results agree well with observational estimates at 26.5°N from the RAPID array, but for 2004–2013 the meridional heat transport is 1.00 ± 0.11 PW versus 1.23 ± 0.11 PW for RAPID. In addition, these results have no hint of a trend, unlike the RAPID results. Strong westerlies north of a meridian drive ocean currents and an ocean heat loss into the atmosphere that is exacerbated by a decrease in ocean heat transport northward. 1. Introduction The Earth’s climate varies on multiple time scales in addition to long-term changes from human activities. Decadal variations are often conflated with the so-called “forced” climate change in the observational record. The primary source of decadal variability comes from the oceans, which can take up heat, move it around, and sequester it for long periods of time [Trenberth and Stepaniak, 2004]. However, when and where the heat is restored to the atmosphere it has profound influences on the surface climate. Accordingly, it is vital to better understand the climate and ocean variability and also how it may change as the climate changes. Moreover, this leads to prospects for improved decadal climate prediction. Of particular interest are changes in the North Atlantic Ocean, both because of their role in the climate system and their proximity to and impacts on the major populations in the Northern Hemisphere. Even though the Atlantic is a much smaller basin than the Pacific, the deeper ocean heat content (OHC) changes and the con- nections to the Arctic provide it with an important and unique role in climate variability, especially through changes in the Atlantic Meridional Overturning Circulation (AMOC) [Buckley and Marshall, 2016]. The AMOC is responsible for most of the meridional transport of heat and carbon by the midlatitude northern hemisphere ocean and is associated with the production of about half of the global ocean’s deep waters in the northern North Atlantic [Rhein et al., 2013]. The AMOC changes have been linked to abrupt climate change in the paleo-climate record, and freshwater flushing is especially suspected in contributing to rapid changes [Masson-Delmotte et al., 2013]. The AMOC is also a primary source of decadal climate predictability [Kirtman et al., 2013]. Moreover, future projections with global warming suggest a weakening of the AMOC circulation with consequential profound local climate effects [Collins et al., 2013]. However, there are substan- tial disagreements among models both in terms of how well they simulate the AMOC and the magnitude of future changes [Branstator and Teng, 2012; Kirtman et al., 2013; Danabasoglu et al., 2014]. Accordingly, there is considerable interest in how the AMOC is varying and whether the projected trends are evident or not. Since April 2004, variabilities in the full AMOC and meridional heat flux have been estimated on the basis of direct ocean observations at 26.5°N by the RAPID Climate Change Programme along with the Meridional Overturning Circulation and Heat Flux Array (henceforth the RAPID array) [Baringer and Larsen, 2001; Cunningham et al., 2007; Kanzow et al., 2007; Johns et al., 2011; McCarthy et al., 2012; Srokosz and Bryden, 2015]. The evolution of the array and methods of computation and assumptions are explored in McCarthy et al. [2015]. The variability in the Atlantic Ocean meridional heat transports (MHTs) arises mainly from changes in the AMOC volume transports (R 2 = 0.94, annual cycle included) [Johns et al., 2011]. However, the magnitude of the variability has surprised many [Srokosz and Bryden, 2015] and undermined detection of trends. The observed record exhibits a slight weakening between the first and second halves (see Figure 5 presented later). TRENBERTH AND FASULLO AMOC AND OCEAN MERIDIONAL HEAT TRANSPORT 1919 PUBLICATION S Geophysical Research Letters RESEARCH LETTER 10.1002/2016GL072475 Key Points: • Energy budget indirect estimates of ocean heat transports for 2000-2013 are much improved • Time series of the AMOC meridional heat transports throughout the Atlantic are computed for 2000-2013 • At 26.5°N results complement measurements from the RAPID array but feature less trend and an offset Supporting Information: • Supporting Information S1 Correspondence to: K. E. Trenberth, [email protected] Citation: Trenberth, K. E., and J. T. Fasullo (2017), Atlantic meridional heat transports computed from balancing Earth’s energy locally, Geophys. Res. Lett., 44, 1919–1927, doi:10.1002/2016GL072475. Received 28 DEC 2016 Accepted 7 FEB 2017 Accepted article online 8 FEB 2017 Published online 18 FEB 2017 ©2017. The Authors. This is an open access article under the terms of the Creative Commons Attribution-NonCommercial-NoDerivs License, which permits use and distri- bution in any medium, provided the original work is properly cited, the use is non-commercial and no modifications or adaptations are made.
Transcript of Atlantic meridional heat transports computed from … meridional heat transports computed from...
Atlantic meridional heat transports computedfrom balancing Earth’s energy locallyKevin E. Trenberth1 and John T. Fasullo1
1National Center for Atmospheric Research, Boulder, Colorado, USA
Abstract The Atlantic Meridional Overturning Circulation plays a major role in moving heat and carbonaround in the ocean. A new estimate of ocean heat transports for 2000 through 2013 throughout theAtlantic is derived. Top-of-atmosphere radiation is combined with atmospheric reanalyses to estimatesurface heat fluxes and combined with vertically integrated ocean heat content to estimate ocean heattransport divergence as a residual. Atlantic peak northward ocean heat transports average 1.18 ± 0.13 PW(1 sigma) at 15°N but vary considerably in latitude and time. Results agree well with observational estimatesat 26.5°N from the RAPID array, but for 2004–2013 the meridional heat transport is 1.00 ± 0.11 PW versus1.23 ± 0.11 PW for RAPID. In addition, these results have no hint of a trend, unlike the RAPID results. Strongwesterlies north of a meridian drive ocean currents and an ocean heat loss into the atmosphere that isexacerbated by a decrease in ocean heat transport northward.
1. Introduction
The Earth’s climate varies on multiple time scales in addition to long-term changes from human activities.Decadal variations are often conflated with the so-called “forced” climate change in the observational record.The primary source of decadal variability comes from the oceans, which can take up heat, move it around,and sequester it for long periods of time [Trenberth and Stepaniak, 2004]. However, when and where the heatis restored to the atmosphere it has profound influences on the surface climate. Accordingly, it is vital tobetter understand the climate and ocean variability and also how it may change as the climate changes.Moreover, this leads to prospects for improved decadal climate prediction.
Of particular interest are changes in the North Atlantic Ocean, both because of their role in the climate systemand their proximity to and impacts on the major populations in the Northern Hemisphere. Even though theAtlantic is a much smaller basin than the Pacific, the deeper ocean heat content (OHC) changes and the con-nections to the Arctic provide it with an important and unique role in climate variability, especially throughchanges in the Atlantic Meridional Overturning Circulation (AMOC) [Buckley and Marshall, 2016]. The AMOC isresponsible for most of the meridional transport of heat and carbon by the midlatitude northern hemisphereocean and is associated with the production of about half of the global ocean’s deep waters in the northernNorth Atlantic [Rhein et al., 2013]. The AMOC changes have been linked to abrupt climate change in thepaleo-climate record, and freshwater flushing is especially suspected in contributing to rapid changes[Masson-Delmotte et al., 2013]. The AMOC is also a primary source of decadal climate predictability[Kirtman et al., 2013]. Moreover, future projections with global warming suggest a weakening of the AMOCcirculation with consequential profound local climate effects [Collins et al., 2013]. However, there are substan-tial disagreements among models both in terms of how well they simulate the AMOC and the magnitude offuture changes [Branstator and Teng, 2012; Kirtman et al., 2013; Danabasoglu et al., 2014]. Accordingly, there isconsiderable interest in how the AMOC is varying and whether the projected trends are evident or not.
Since April 2004, variabilities in the full AMOC and meridional heat flux have been estimated on the basis ofdirect ocean observations at 26.5°N by the RAPID Climate Change Programme along with the MeridionalOverturning Circulation and Heat Flux Array (henceforth the RAPID array) [Baringer and Larsen, 2001;Cunningham et al., 2007; Kanzow et al., 2007; Johns et al., 2011; McCarthy et al., 2012; Srokosz and Bryden,2015]. The evolution of the array and methods of computation and assumptions are explored in McCarthyet al. [2015]. The variability in the Atlantic Oceanmeridional heat transports (MHTs) arisesmainly from changesin the AMOC volume transports (R2 = 0.94, annual cycle included) [Johns et al., 2011]. However, themagnitudeof the variability has surprised many [Srokosz and Bryden, 2015] and undermined detection of trends. Theobserved record exhibits a slightweakeningbetween the first and secondhalves (see Figure 5presented later).
TRENBERTH AND FASULLO AMOC AND OCEAN MERIDIONAL HEAT TRANSPORT 1919
PUBLICATIONSGeophysical Research Letters
RESEARCH LETTER10.1002/2016GL072475
Key Points:• Energy budget indirect estimates ofocean heat transports for 2000-2013are much improved
• Time series of the AMOC meridionalheat transports throughout theAtlantic are computed for 2000-2013
• At 26.5°N results complementmeasurements from the RAPID arraybut feature less trend and an offset
Supporting Information:• Supporting Information S1
Correspondence to:K. E. Trenberth,[email protected]
Citation:Trenberth, K. E., and J. T. Fasullo (2017),Atlantic meridional heat transportscomputed from balancing Earth’senergy locally, Geophys. Res. Lett., 44,1919–1927, doi:10.1002/2016GL072475.
Received 28 DEC 2016Accepted 7 FEB 2017Accepted article online 8 FEB 2017Published online 18 FEB 2017
©2017. The Authors.This is an open access article under theterms of the Creative CommonsAttribution-NonCommercial-NoDerivsLicense, which permits use and distri-bution in any medium, provided theoriginal work is properly cited, the use isnon-commercial and no modificationsor adaptations are made.

Here we explore the variability and possible trends in MHT in AMOC by using an entirely different but com-plementary approach based upon computing the MHT in the ocean as a residual of the total energy budget.This has an advantage of providing values not just at 26.5°N but throughout the Atlantic so that we can seedirectly how the AMOC peak transports fluctuate in latitude as well as time. We can also extend the recordback in time. The approach has been used in the past [Trenberth and Caron, 2001; Trenberth and Fasullo,2008], but results based upon new data and more recent higher-resolution atmospheric reanalyses arenow considered much more reliable. While they have some uncertainties, the nature of the approximationsand errors is quite different from ocean measurement techniques and the approach is complementary.
2. Earth’s Energy Budget
It is now possible to estimate most components of the Earth’s energy budget, including its major reservoirsand fluxes. All components, however, contain uncertainties, and these cannot be adequately assessed unlessexamined in a comprehensive framework. Since about 2000, many new and improved observations exist:top-of-atmosphere (TOA) radiation from Clouds and the Earth’s Radiant Energy System, temperatures fromthe increasing Argo array in the ocean, and the synthesis of all observations in reanalysis products fromfour-dimensional data assimilation in both the atmosphere and ocean (see methods in the supporting infor-mation). The absolute value of net downward radiation at TOA, RT, is established from an inventory of theenergy imbalance [Trenberth et al., 2016].
Given RT [Loeb et al., 2009, 2012; Allan et al., 2014] and the atmospheric energy transport and its divergence,we can estimate the net flux of energy into the surface [Trenberth et al., 2001; Trenberth and Stepaniak, 2003a,2003b; Trenberth and Caron, 2001; Trenberth and Fasullo, 2008; Fasullo and Trenberth, 2008; Trenberth, 2009;Liu et al., 2015]. The vertically integrated atmospheric energy transports and their divergence have been com-puted from several atmospheric reanalyses [Berrisford et al., 2011; Dee et al., 2011; Simmons et al., 2010, 2014],but we use only ERA-Interim here as they are superior in several assessments andmuch improved over earlierreanalyses [e.g., Trenberth et al., 2011; Trenberth and Fasullo, 2013]. Moreover, the surface heat flux estimatesare superior to estimates from current atmospheric reanalyses because the latter are model-derived and haveincomplete forcings (especially aerosol effects) and substantial TOA and surface imbalances [Mayer andHaimberger, 2012; Trenberth and Fasullo, 2013; Liu et al., 2015].
In turn, the ocean surface heat flux is balanced by changes in OHC and transports of energy within the oceanand their divergence locally. OHC is computed from the vertically integrated ocean reanalysis temperatures[von Schuckmann et al., 2014, 2016; Roemmich et al., 2015; Balmaseda et al., 2013a, 2013b; Tietsche et al., 2015;Zuo et al., 2015], and ORAP5 was assessed to be the best available [Trenberth et al., 2016]. However, we havebecome aware of a problem in ORAP5 OHC below 1000m in the North Atlantic in a region off theMediterranean Sea (30 to 45°N, 10 to 30°W) where spurious warming occurs at 1700m depth and spuriouscooling occurs near 1250m depth (see the supporting information). We have therefore also computed resultsby using ORAP5 down to only 1000m depth, and we use these for the more detailed analysis, while the full-depth result is preferred elsewhere.
The atmospheric energy budget is used to compute the divergence of the total transport of atmosphericenergy FA, which is balanced by the vertically integrated diabatic heating Q1, and the atmospheric moisturebudget is used to compute the column latent heating Q2 [Trenberth et al., 2001; Trenberth and Stepaniak,2003a, 2003b] (see the supporting information). Subtracting these two removes the dominating effects ofprecipitation and replaces it with the surface moistening (evaporation). Ignoring tendencies for the moment,
∇•FA ¼ Q1 � Q2 ¼ RT þ Fs (1)
where Fs is the upwards net surface energy flux. Within the ocean, the net surface heat flux Fs is balanced byeither changes in OHC or a divergence of ocean heat content;
Fs ¼ –dOHC=dt–∇•FO (2)
where FO is the transport of oceanic energy. Integrating the zonal integral [ ] of ocean variables from theNorth Pole southward gives the zonal mean MHT at any latitude ϕ
MHT ϕð Þ ¼ ∫90
ϕ Fs þ dOHT=dt½ �adϕ (3)
Geophysical Research Letters 10.1002/2016GL072475
TRENBERTH AND FASULLO AMOC AND OCEAN MERIDIONAL HEAT TRANSPORT 1920

where a is the Earth’s radius. We use the monthly means of analyses from 2000 through 2013 or 2014, as thedata permit. The data sets contain pronounced annual cycles, and some aspects, such as sea ice formationand melt in the Arctic and streamflow discharge from continents, influence our results, yet contain substan-tial uncertainties that are most likely systematic. Accordingly, the results are shown for 12month runningmeans (see the supporting information).
We have attempted to estimate error bars for all results. As well as temporal sampling issues, we assesspotential biases and structural uncertainties and possible errors in trends (e.g., associated from the changingobserving system and methods of analysis) (see the supporting information). The uncertainty analysis showsthat while there is room for improvement in the atmospheric analyses and hence the inferred net surfacefluxes, improving OHC analyses is most important in refining the results.
3. Annual Means
We first present new results for annual mean meridional ocean heat transports; earlier estimates are givenin Trenberth and Caron [2001]. The total vertically integrated diabatic heating in the atmosphere, Q1, andthe vertically integrated latent heating, Q2 = L (P-E) (Figure S1 the supporting information), show the dom-inance of the precipitation latent heating in the tropics [Trenberth and Stepaniak, 2003b]. The latent heat-ing also reveals the strong negative values in the subtropics associated with the evaporation of moistureover the oceans into the atmosphere (moistening of the atmosphere but cooling the ocean). The extratro-pical storm track precipitation is also evident in the Q2 field but is more than compensated for by radiativeeffects in Q1.
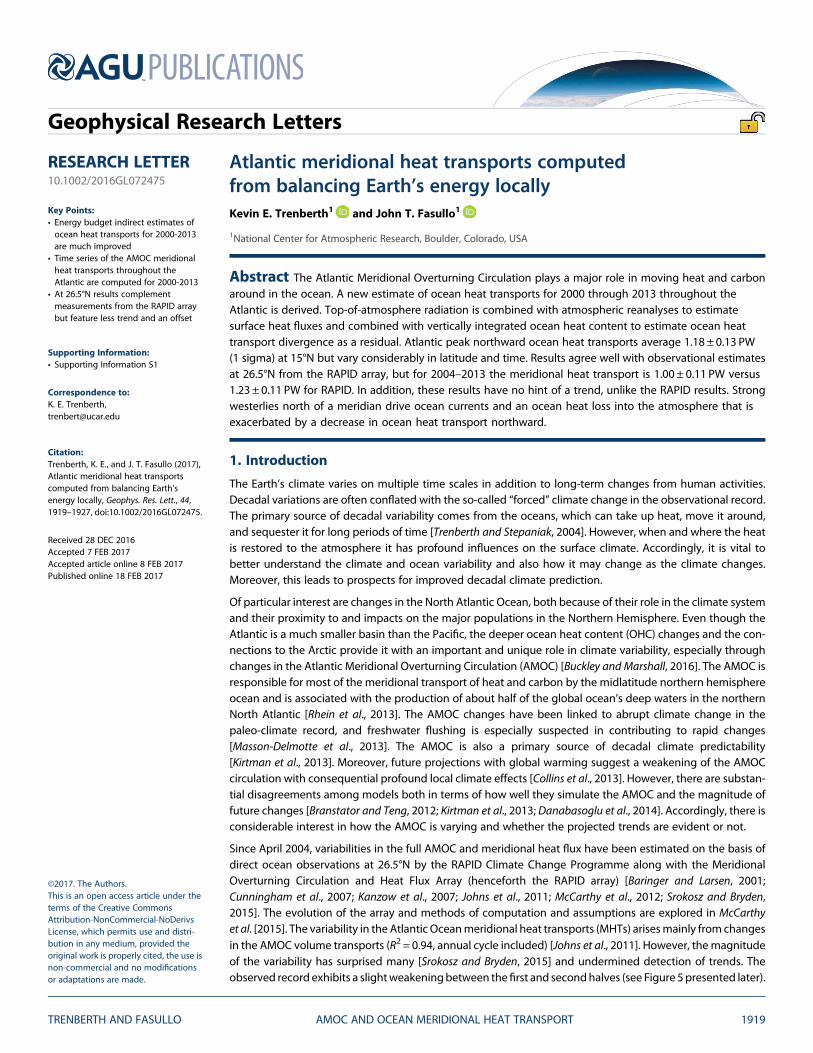
At TOA, RT (Figure 1) is much more zonally symmetric and reveals the excess of solar radiation in the tropics,while the outgoing longwave radiation dominates at higher latitudes. The total atmospheric energy gain,Q1-Q2 (Figure 1), removes the dominant effects of precipitation latent heating and replaces them with theevaporative moistening, so that the heating is more uniform with latitude over a broad swath of the tropicsand subtropics than RT.
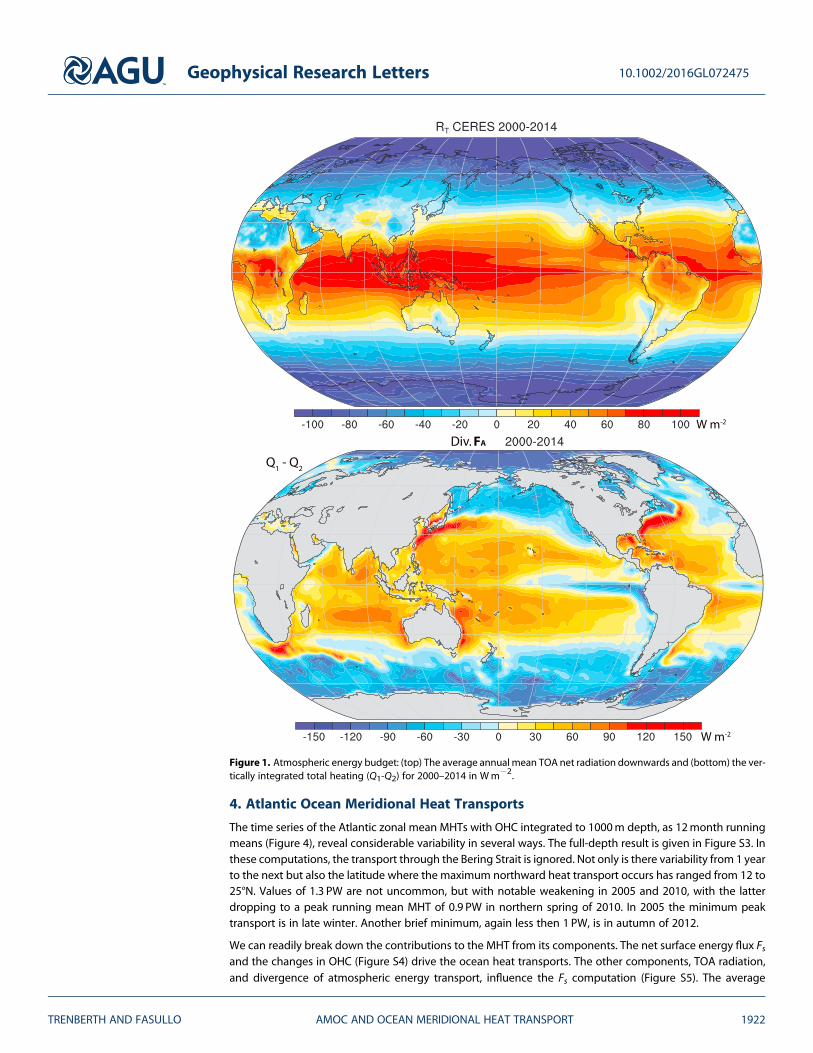
The net upward surface flux Fs (Figure 2), given by the difference in the two panels of Figure 1, shows thedownward heat fluxes throughout much of the tropics, strong upward fluxes especially off the east coastsof Asia and North America, and weaker upward fluxes in the southern oceans, North Atlantic and Arctic.There is a huge seasonality to these fluxes (Figure S2), with strong uptake by the ocean in summer, andrelease of energy in winter [Trenberth and Stepaniak, 2003b, 2004; Trenberth and Fasullo, 2008], so that theannual mean is a relatively small residual (Figure S2). What is new in these latest estimates is the appearanceof small-scale structures, such as the character of upward fluxes south and southeast of Africa that switch insign quite abruptly only a few hundred kilometers farther south. These structures appear to be real and arereplicated in the National Center for Atmospheric Research (NCAR) Community Earth System Model [Kayet al., 2015; Trenberth et al., 2015b] (Figure S2), for instance. Indeed, many small-scale features are replicatedbetween these observed fields and the model fields in spite of known shortcomings in the model.
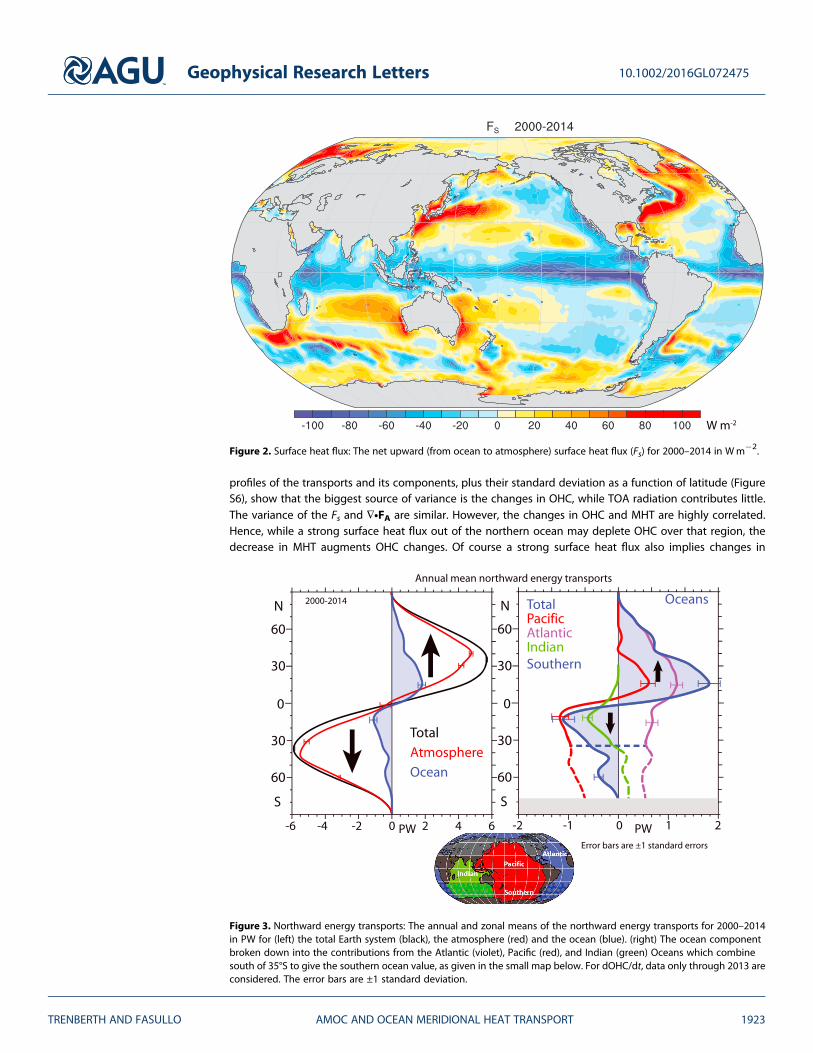
Accordingly, there has to be an ocean heat transport from the source (blue) regions of Figure 2 to the sink(red) regions. This is readily computed for the zonal mean as a residual of RT and atmospheric transports(Figure 3) or by integrating Figure 2 from the north southward while accounting for the changes in OHC(see equation (3)). It can be also allocated into the individual basin components (Figure 3).
The net northward heat flux by the ocean through the Bering Strait varies substantially from year to yearreaching a maximum in 2007 of 15 to 20 TW [Woodgate et al., 2006, 2012], but even then the values are afactor of 20 smaller than the mean transports (Figure 3) near 60°N. Accordingly, the ocean heat transportsare northward throughout the Atlantic into the Arctic Ocean. Consistent with previous findings [Trenberthand Caron, 2001], the maximum net poleward transports of 5.7 ± 0.1 PW (2 sigma) occur between 35 and40° latitude in both hemispheres, with by far the dominant contribution coming from the atmosphere. Theocean meridional heat transports are comparable in magnitude to those in the atmosphere in the tropicsand slightly stronger in the Northern Hemisphere. The maximum northward transport in the Atlantic is1.18 ± 0.26 PW (2 sigma) at 15°N in these results (Figure S5), and southward heat transport from the SouthPacific Ocean helps to feed the northward transport in the Atlantic (Figure 3). Uncertainties for the Atlanticare addressed mainly in the supporting information.
Geophysical Research Letters 10.1002/2016GL072475
TRENBERTH AND FASULLO AMOC AND OCEAN MERIDIONAL HEAT TRANSPORT 1921
4. Atlantic Ocean Meridional Heat Transports
The time series of the Atlantic zonal mean MHTs with OHC integrated to 1000m depth, as 12month runningmeans (Figure 4), reveal considerable variability in several ways. The full-depth result is given in Figure S3. Inthese computations, the transport through the Bering Strait is ignored. Not only is there variability from 1 yearto the next but also the latitude where the maximum northward heat transport occurs has ranged from 12 to25°N. Values of 1.3 PW are not uncommon, but with notable weakening in 2005 and 2010, with the latterdropping to a peak running mean MHT of 0.9 PW in northern spring of 2010. In 2005 the minimum peaktransport is in late winter. Another brief minimum, again less then 1 PW, is in autumn of 2012.
We can readily break down the contributions to the MHT from its components. The net surface energy flux Fsand the changes in OHC (Figure S4) drive the ocean heat transports. The other components, TOA radiation,and divergence of atmospheric energy transport, influence the Fs computation (Figure S5). The average
Figure 1. Atmospheric energy budget: (top) The average annual mean TOA net radiation downwards and (bottom) the ver-tically integrated total heating (Q1-Q2) for 2000–2014 in Wm�2.
Geophysical Research Letters 10.1002/2016GL072475
TRENBERTH AND FASULLO AMOC AND OCEAN MERIDIONAL HEAT TRANSPORT 1922
profiles of the transports and its components, plus their standard deviation as a function of latitude (FigureS6), show that the biggest source of variance is the changes in OHC, while TOA radiation contributes little.The variance of the Fs and ∇•FA are similar. However, the changes in OHC and MHT are highly correlated.Hence, while a strong surface heat flux out of the northern ocean may deplete OHC over that region, thedecrease in MHT augments OHC changes. Of course a strong surface heat flux also implies changes in
Figure 3. Northward energy transports: The annual and zonal means of the northward energy transports for 2000–2014in PW for (left) the total Earth system (black), the atmosphere (red) and the ocean (blue). (right) The ocean componentbroken down into the contributions from the Atlantic (violet), Pacific (red), and Indian (green) Oceans which combinesouth of 35°S to give the southern ocean value, as given in the small map below. For dOHC/dt, data only through 2013 areconsidered. The error bars are ±1 standard deviation.
Figure 2. Surface heat flux: The net upward (from ocean to atmosphere) surface heat flux (Fs) for 2000–2014 in Wm�2.
Geophysical Research Letters 10.1002/2016GL072475
TRENBERTH AND FASULLO AMOC AND OCEAN MERIDIONAL HEAT TRANSPORT 1923

surface winds and wind stress curl that drive ocean currents, both in the gyre and overturning components.Numerical studies suggest that the variability in the AMOC is primarily associated with basin-wide changes inwind stress [e.g., Buckley and Marshall, 2016; Yang, 2015]. Accordingly, a decrease in MHT, as occurred in2009–2010, results in a decrease in OHC, perhaps somewhat independently of the surface heat flux intothe atmosphere to the north.
Although these components add up, causality cannot be readily determined, because of the complex pro-cesses within the ocean and how they respond to changes in surface winds [Cunningham et al., 2013]. Forinstance, it is likely that RT is more a response to variations than a cause. One primary source of variabilityarises from largely internal atmospheric variability and especially changes in the North Atlantic Oscillation(NAO) [Eden and Jung, 2001; Danabasoglu et al., 2012; Delworth et al., 2016]. A case of a strong positive NAO(+2.0 standard deviation anomaly) in January 1989 [Trenberth et al., 2002], which led to cold outbreaks overthe northeast of Canada and Greenland and resulted in vertically integrated atmospheric energy divergenceof>250Wm�2 arising fromheat fluxes out of the ocean in the vicinity of the Labrador Sea, was comparedwithenergy convergence in the same region in January 1998, when theNAO indexwas close to zero. The anomaliesin both years exceeded ±105Wm�2 and were>1 standard deviation departures from the mean.
In northern winter 2010 the NAO was exceptionally low (for December-January-February-March the NAOindex was 2.5 standard deviations below normal) affecting the AMOC and its MHT and sea ice cover[Delworth et al., 2016]. ApositiveNAOfavors strongwesterlywindsacross theAtlanticmidlatitudes,whichbringcooler dryer air from North America leading to much greater surface heat and moisture fluxes into the atmo-sphere in winter. This cools the ocean, increases deepwater formation in the Labrador Sea area, and leads toa stronger AMOCseveral years later [Stepanov andHaines, 2014;Delworth et al., 2016]. In turn, the latter increaseMHT and warm the northern regions. The extreme cold in Europe in 2015 has been linked back to the oceanchanges [Duchezetal., 2016], and it isprimarilyduetoextremeoceanheat lossdrivenbyatmosphericcirculationchanges in the preceding two winters combined with the re-emergence of cold ocean water masses.
5. Meridional Heat Transports at the RAPID Array
The variability in the Atlantic Ocean MHTs arises mainly from changes in the AMOC volume transports [Johnset al., 2011], which are best known from direct ocean measurements near 26.5°N in the RAPID array. Althoughnominally at 26.5°N, the actual moorings across the Atlantic range from about 24°N to 28°N. Accordingly,results have been computed at 25, 26, and 27°N and agree quite well with observational estimates fromthe RAPID array (Figure S8), but with an offset and a somewhat different overall trend. To avoid the OHC
Figure 4. Atlantic meridional heat transport: The 12month running mean meridional heat transport northward in theAtlantic in PW computed by using OHC 0–1000m.
Geophysical Research Letters 10.1002/2016GL072475
TRENBERTH AND FASULLO AMOC AND OCEAN MERIDIONAL HEAT TRANSPORT 1924
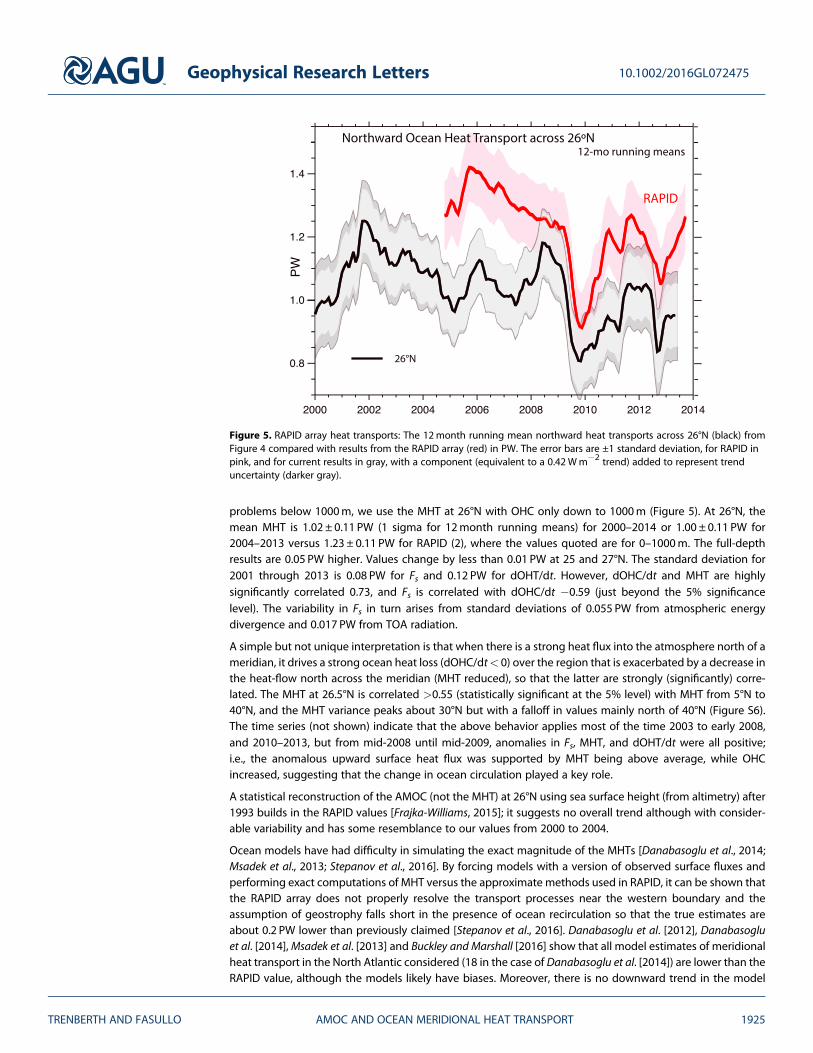
problems below 1000m, we use the MHT at 26°N with OHC only down to 1000m (Figure 5). At 26°N, themean MHT is 1.02 ± 0.11 PW (1 sigma for 12month running means) for 2000–2014 or 1.00 ± 0.11 PW for2004–2013 versus 1.23 ± 0.11 PW for RAPID (2), where the values quoted are for 0–1000m. The full-depthresults are 0.05 PW higher. Values change by less than 0.01 PW at 25 and 27°N. The standard deviation for2001 through 2013 is 0.08 PW for Fs and 0.12 PW for dOHT/dt. However, dOHC/dt and MHT are highlysignificantly correlated 0.73, and Fs is correlated with dOHC/dt �0.59 (just beyond the 5% significancelevel). The variability in Fs in turn arises from standard deviations of 0.055 PW from atmospheric energydivergence and 0.017 PW from TOA radiation.
A simple but not unique interpretation is that when there is a strong heat flux into the atmosphere north of ameridian, it drives a strong ocean heat loss (dOHC/dt< 0) over the region that is exacerbated by a decrease inthe heat-flow north across the meridian (MHT reduced), so that the latter are strongly (significantly) corre-lated. The MHT at 26.5°N is correlated >0.55 (statistically significant at the 5% level) with MHT from 5°N to40°N, and the MHT variance peaks about 30°N but with a falloff in values mainly north of 40°N (Figure S6).The time series (not shown) indicate that the above behavior applies most of the time 2003 to early 2008,and 2010–2013, but from mid-2008 until mid-2009, anomalies in Fs, MHT, and dOHT/dt were all positive;i.e., the anomalous upward surface heat flux was supported by MHT being above average, while OHCincreased, suggesting that the change in ocean circulation played a key role.
A statistical reconstruction of the AMOC (not the MHT) at 26°N using sea surface height (from altimetry) after1993 builds in the RAPID values [Frajka-Williams, 2015]; it suggests no overall trend although with consider-able variability and has some resemblance to our values from 2000 to 2004.
Ocean models have had difficulty in simulating the exact magnitude of the MHTs [Danabasoglu et al., 2014;Msadek et al., 2013; Stepanov et al., 2016]. By forcing models with a version of observed surface fluxes andperforming exact computations of MHT versus the approximate methods used in RAPID, it can be shown thatthe RAPID array does not properly resolve the transport processes near the western boundary and theassumption of geostrophy falls short in the presence of ocean recirculation so that the true estimates areabout 0.2 PW lower than previously claimed [Stepanov et al., 2016]. Danabasoglu et al. [2012], Danabasogluet al. [2014],Msadek et al. [2013] and Buckley and Marshall [2016] show that all model estimates of meridionalheat transport in the North Atlantic considered (18 in the case of Danabasoglu et al. [2014]) are lower than theRAPID value, although the models likely have biases. Moreover, there is no downward trend in the model
Figure 5. RAPID array heat transports: The 12month running mean northward heat transports across 26°N (black) fromFigure 4 compared with results from the RAPID array (red) in PW. The error bars are ±1 standard deviation, for RAPID inpink, and for current results in gray, with a component (equivalent to a 0.42Wm�2 trend) added to represent trenduncertainty (darker gray).
Geophysical Research Letters 10.1002/2016GL072475
TRENBERTH AND FASULLO AMOC AND OCEAN MERIDIONAL HEAT TRANSPORT 1925

results. However, a recent ocean reanalysis [Jackson et al., 2016] quite closely replicates the RAPID results,although their trend is closer to ours. Possibly, the trend is influenced in RAPID by missing data in 2004and 2006 [Cunningham et al., 2007; McCarthy et al., 2015]. These factors and mooring adjustments add inho-mogeneities to the RAPID results that have yet to be fully assessed. Consequently, model results provide sup-port for the observational estimates derived here in terms of the different trend and offset. Nevertheless,there are reasons to also be somewhat suspicious of the trends in our results because of changes in the obser-ving system and their influences on the atmospheric reanalyses notably in late 2009 [Trenberth et al., 2015a].The estimated impact is at most 0.2Wm�2 which is 0.03 PW in the MHT at 26°N (Figure 5). In addition, theocean reanalyses have OHC uncertainties whose effects can be seen by comparing Figure 5 with Figure S8at 26°N and which are reflected in the error bars.
The methods used here provide an independent framework for assessing ocean heat transports and particu-larly those associated with the main branches of its overturning circulation. The AMOC heat transport esti-mates allow for an extension of values back to 2000. Moreover, the method provides complementaryinformation about the oceans to that from in situ observations and models and can be implementedthroughout the global ocean to produce two-dimensional (vector) divergent ocean heat transports. Suchestimates are likely to be essential in distinguishing between forced and internal variations in the climate sys-tem as the oceans adjust to our changing climate.
ReferencesAllan, R. P., C. Liu, N. G. Loeb, M. D. Palmer, M. Roberts, D. Smith, and P.-L. Vidale (2014), Changes in global net radiative imbalance 1985–2012,
Geophys. Res. Lett., 41, 5588–5597, doi:10.1002/2014GL060962.
Balmaseda, M. A., K. Mogensen, and A. T. Weaver (2013a), Evaluation of the ECMWF Ocean Reanalysis ORAS4, Q. J. R. Meteorol. Soc., 139,1132–1161, doi:10.1002/qj.2063.
Balmaseda, M. A., K. E. Trenberth, and E. Källén (2013b), Distinctive climate signals in reanalysis of global ocean heat content, Geophys. Res.Lett., 40, 1754–1759, doi:10.1002/grl.50382.
Baringer, M. O., and J. C. Larsen (2001), Sixteen years of Florida Current transports at 27°N, Geophys. Res. Lett., 28, 3179–3182, doi:10.1029/2001GL013246.
Berrisford, P., P. Kållberg, S. Kobayashi, D. Dee, S. Uppala, A. J. Simmons, P. Poli, and H. Sato (2011), Atmospheric conservation properties inERA-Interim, Q. J. R. Meteorol. Soc., 137, 1381–1399, doi:10.1002/qj.864.
Branstator, G., and H. Y. Teng (2012), Potential impact of initialization on decadal predictions as assessed for CMIP5 models, Geophys. Res.Lett., 39, L12703, doi:10.1029/2012GL051974.
Buckley, M. W., and J. Marshall (2016), Observations, inferences, and mechanisms of Atlantic Meridional Overturning Circulation variability: Areview, Rev. Geophys., 54, 5–63, doi:10.1002/2015RG000493.
Collins, M., et al. (2013), Long-term climate change: Projections, commitments and irreversibility, in Climate Change 2013: The Physical ScienceBasis. Intergovernmental Panel on Climate Change, edited by T. F. Stocker et al., pp. 1029–1136, Cambridge Univ. Press, Cambridge, U. K.
Cunningham, S. A., et al. (2007), Temporal variability of the Atlantic meridional overturning circulation at 26.5°N, Science, 317, 935–938.Cunningham, S. A., C. D. Roberts, E. Frajka-Williams,W. E. Johns,W.Hobbs,M.D. Palmer, D. Rayner, D. A. Smeed, andG.McCarthy (2013), Atlantic
MeridionalOverturningCirculation slowdowncooled the subtropical ocean,Geophys. Res. Lett.,40, 6202–6207, doi:10.1002/2013GL058464.Danabasoglu, G., S. G. Yeager, Y. O. Kwon, J. J. Tribbia, A. S. Phillips, and J. W. Hurrell (2012), Variability of the Atlantic meridional overturning
circulation in CCSM4, J. Clim., 25, 5153–5172, doi:10.1175/JCLI-D-11-00463.1.Danabasoglu, G., et al. (2014), North Atlantic simulations in Coordinated Ocean-ice Reference Experiments phase II (CORE-II). Pt I: Mean
states, Ocean Modell., 73, 76–107, doi:10.1016/j.ocemod.2013.10.005.Dee, D. P., et al. (2011), The ERA-Interim reanalysis: Configuration and performance of the data assimilation system, Q. J. R. Meteorol. Soc., 137,
553–597.Delworth, T. L., F. Zeng, G. A. Vecchi, X. Yang, L. Zhang, and R. Zhang (2016), The North Atlantic oscillation as a driver of rapid climate change
in the Northern Hemisphere, Nat. Geosci., 9, 509–512, doi:10.1038/NGEO2738.Duchez, A., E. Frajka-Williams, S. A. Josey, D. G. Evans, J. P. Grist, R. Marsh, G. D. McCarthy, B. Sinha, D. I. Berry, and J. J. M. Hirschi (2016), Drivers
of exceptionally cold North Atlantic Ocean temperatures and their link to the 2015 European heat wave, Environ. Res. Lett., 11, 074004,doi:10.1088/1748-9326/11/7/074004.
Eden, C., and T. Jung (2001), North Atlantic interdecadal variability: Oceanic response to the North Atlantic Oscillation (1865_1997), J. Clim.,14, 676–691.
Fasullo, J. T., and K. E. Trenberth (2008), The annual cycle of the energy budget. Part II: Meridional structures and poleward transports, J. Clim.,21, 2313–2325, doi:10.1175/2007JCLI1936.1.
Frajka-Williams, E. (2015), Estimating the Atlantic overturning at 26°N using satellite altimetry and cable measurements, Geophys. Res. Lett.,42, 3458–3464, doi:10.1002/2015GL063220.
Jackson, L. C., K. A. Peterson, C. D. Roberts, and R. A. Wood (2016), Recent slowing of Atlantic overturning circulation as a recovery from earlierstrengthening, Nat. Geosci., 9, 518–522, doi:10.1038/NGEO2715.
Johns, W. E., et al. (2011), Continuous, array-based estimates of Atlantic Ocean heat transport at 26.5°N, J. Clim., 24, 2429–2449.Kanzow, T., S. A. Cunningham, D. Rayner, J. J.-M. Hirschi, W. E. Johns, M. O. Baringer, H. L. Bryden, L. M. Beal, C. S. Meinen, and J. Marotzke
(2007), Observed flow compensation associated with the MOC at 26.5°N in the Atlantic, Science, 317, 938–941.Kay, J. E., et al. (2015), The Community Earth System Model (CESM) Large Ensemble Project: A community resource for studying climate
change in the presence of climate variability, Bull. Am. Meteorol. Soc., 96, doi:10.1175/BAMS-D-13-00255.1.Kirtman, B., et al. (2013), Near-term climate change: Projections and predictability, in Climate Change 2013: The Physical Science Basis.
Intergovernmental Panel on Climate Change, edited by T. F. Stocker et al., pp. 953–1028, Cambridge Univ. Press, Cambridge, U. K.
Geophysical Research Letters 10.1002/2016GL072475
TRENBERTH AND FASULLO AMOC AND OCEAN MERIDIONAL HEAT TRANSPORT 1926
AcknowledgmentsMany thanks to Magdalena Balmasedaand ECMWF for providing the ORAP5data set and Gokhan Danabasoglu fordiscussions. This research is partiallysponsored by DOE grant DE-SC0012711.NCAR is sponsored by the NationalScience Foundation. K.E.T. led the for-mulation and writing of the paper. J.T.F.led the computations and both con-tributed to the generation of figures.There are no competing interests. Thedata reported in this paper are docu-mented in the supporting information.

Liu, C., R. P. Allan, P. Berrisford, M. Mayer, P. R. Hyder, N. Loeb, D. Smith, P.-L. Vidale, and J. M. Edwards (2015), Combining satellite obser-vations and reanalysis energy transports to estimate global net surface energy fluxes 1985–2012, J. Geophys. Res. Atmos., 120, 9374–9389,doi:10.1002/2015JD023264.
Loeb, N. G., B. A. Wielicki, D. R. Doelling, G. Louis Smith, D. F. Keyes, S. Kato, N. Manalo-Smith, and T. Wong (2009), Toward optimal closure ofthe Earth’s top-of-atmosphere radiation budget, J. Clim., 22, 748–766.
Loeb, N. G., J. M. Lyman, G. C. Johnson, R. P. Allan, D. R. Doelling, T. Wong, B. J. Soden, and G. L. Stephens (2012), Observed changes in top-of-the-atmosphere radiation and upper ocean heating consistent within uncertainty, Nat. Geosci., 5, 110–113, doi:10.1038/NGEO1375.
Masson-Delmotte, V., et al. (2013), Information from paleoclimate archives, in Climate Change 2013: The Physical Science Basis.Intergovernmental Panel on Climate Change, edited by T. F. Stocker et al., pp. 383–464, Cambridge Univ. Press, Cambridge, U. K.
Mayer, M., and L. Haimberger (2012), Poleward atmospheric energy transport and their variability as evaluated from ECMWF reanalysis data,J. Clim., 25, doi:10.1175/JCLI-D-11-00202.1.
McCarthy, G., E. Frajka-Williams, W. E. Johns, M. O. Baringer, C. S. Meinen, H. L. Bryden, D. Rayner, A. Duchez, C. D. Roberts, andS. A. Cunningham (2012), Observed interannual variability of the Atlantic meridional overturning circulation at 26.5°N, Geophys. Res. Lett.,39, L19609, doi:10.1029/2012GL052933.
McCarthy, G. D., et al. (2015), Measuring the Atlantic Meridional Overturning Circulation at 26°N, Prog. Oceanogr., 130, 91–111.Msadek, R., W. E. Johns, S. G. Yeager, G. Danabasoglu, T. L. Delworth, and A. Rosati (2013), The Atlantic meridional heat transport at 26.5°N and
its relationship with the MOC in the RAPID array and the GFDL and NCAR coupled models, J. Clim., 26, 4335–4356, doi:10.1175/JCLI-D-12-00081.1.
Rhein, M., et al. (2013), Observations: Ocean, in Climate Change 2013: The Physical Science Basis. Intergovernmental Panel on Climate Change,edited by T. F. Stocker et al., pp. 255–315, Cambridge Univ. Press, Cambridge, U. K.
Roemmich, D., J. Church, J. Gilson, D. Monselesan, P. Sutton, and S. Wijffels (2015), Unabated planetary warming and its ocean structure since2006, Nat. Clim. Change, 5, 240–245.
Simmons, A. J., K. M. Willett, P. D. Jones, P. W. Thorne, and D. P. Dee (2010), Low-frequency variations in surface atmospheric humidity,temperature, and precipitation: Inferences from reanalyses and monthly gridded observational data sets, J. Geophys. Res., 115, D01110,doi:10.1029/2009JD012442.
Simmons, A. J., P. Poli, D. P. Dee, P. Berrisford, H. Hersbach, S. Kobayashib, and C. Peubey (2014), Estimating low-frequency variability andtrends in atmospheric temperature using ERA-Interim, Q. J. R. Meteorol. Soc., 140, 329–353, doi:10.1002/qj.2317.
Srokosz, M. A., and H. L. Bryden (2015), Observing the Atlantic Meridional Overturning Circulation yields a decade of inevitable surprises,Science, 348(6241), 1255575. doi:10.1126/science.1255575.
Stepanov, V. N., and K. Haines (2014), Mechanisms of AMOC variability simulated by NEMO model, Ocean Sci., 10, 645–656.Stepanov, V. N., D. Iovino, S. Masina, A. Storto, and A. Cipollone (2016), Methods of calculation of the Atlantic meridional heat and volume
transports from ocean models at 26.5°N, J. Geophys. Res. Oceans, 121, 1459–1475, doi:10.1002/2015JC011007.Tietsche, S., M. Balmaseda, H. Zuo, and K. Mogensen (2015), Arctic sea ice in the global eddy-permitting ocean reanalysis ORAP5, Clim. Dyn.,
doi:10.1007/s00382-015-2673-3.Trenberth, K. E. (2009), An imperative for climate change planning: Tracking Earth’s global energy, Curr. Opin. Environ. Sustainability, 1, 19–27,
doi:10.1016/j.cosust.2009.06.001.Trenberth, K. E., and J. Fasullo (2008), An observational estimate of ocean energy divergence, J. Phys. Oceanogr., 38, 984–999, doi:10.1175/
2007JPO3833.1.Trenberth, K. E., and J. M. Caron (2001), Estimates of meridional atmosphere and ocean heat transports, J. Clim., 14, 3433–3443.Trenberth, K. E., and J. T. Fasullo (2013), Regional energy and water cycles: Transports from ocean to land, J. Clim., 26, 7837–7851, doi:10.1175/
JCLI-D-00008.1.Trenberth, K. E., and D. P. Stepaniak (2003a), Co-variability of components of poleward atmospheric energy transports on seasonal and
interannual timescales, J. Clim., 16, 3691–3705, doi:10.1175/1520-0442(2003)016%3C3691:COCOPA%3E2.0.CO;2.Trenberth, K. E., and D. P. Stepaniak (2003b), Seamless poleward atmospheric energy transports and implications for the Hadley circulation,
J. Clim., 16, 3706–3722, doi:10.1175/1520-0442(2003)016%3C3706:SPAETA%3E2.0.CO;2.Trenberth, K. E., and D. P. Stepaniak (2004), The flow of energy through the Earth’s climate system, Q. J. R. Meteorol. Soc., 130, 2677–2701,
doi:10.1256/qj.04.83.Trenberth, K. E., J. M. Caron, and D. P. Stepaniak (2001), The atmospheric energy budget and implications for surface fluxes and ocean heat
transports, Clim. Dyn., 17, 259–276, doi:10.1007/PL00007927.Trenberth, K. E., D. P. Stepaniak, and J. M. Caron (2002), Interannual variations in the atmospheric heat budget J. Geophys. Res., 107(D8), 4066,
10.1029/2000JD000297.Trenberth, K. E., J. T. Fasullo, and J. Mackaro (2011), Atmospheric moisture transports from ocean to land and global energy flows in rea-
nalyses, J. Clim., 24, 4907–4924, doi:10.1175/2011JCLI4171.1.Trenberth, K. E., Y. Zhang, J. T. Fasullo, and S. Taguchi (2015a), Climate variability and relationships between top-of-atmosphere radiation and
temperatures on Earth, J. Geophys. Res. Atmos., 120, 3642–3659, doi:10.1002/2014JD022887.Trenberth, K. E., Y. Zhang, and J. T. Fasullo (2015b), Relationships among top-of-atmosphere radiation and atmospheric state variables in
observations and CESM, J. Geophys. Res. Atmos., 120, 10,074–10,090, doi:10.1002/2015JD023381.Trenberth, K. E., J. T. Fasullo, K. von Schuckmann, and L. Cheng (2016), Insights into Earth’s energy imbalance from multiple sources, J. Clim.,
29, 7495–7505, doi:10.1175/JCLI-D-16-0339.von Schuckmann, K., J.-B. Sallée, D. Chambers, P.-Y. Le Traon, C. Cabanes, F. Gaillard, S. Speich, and M. Hamon (2014), Consistency of the
current global ocean observing systems from an Argo perspective, Ocean Sci., 10, 547–557, doi:10.5194/os-10-547-2014.von Schuckmann, K., et al. (2016), An imperative to monitor Earth’s energy imbalance, Nat. Clim. Change, 6, 138–144, doi:10.1038/NCLIM-
15030445C.Woodgate, R. A., K. Aagaard, and T. J. Weingartner (2006), Interannual changes in the Bering Strait fluxes of volume, heat and freshwater
between 1991 and 2004, Geophys. Res. Lett., 33, L15609, doi:10.1029/2006GL026931.Woodgate, R. A., T. J. Weingartner, and R. Lindsay (2012), Observed increases in Bering Strait oceanic fluxes from the Pacific to the Arctic from
2001 to 2011 and their impacts on the Arctic Ocean water column, Geophys. Res. Lett., 39, L24603, doi:10.1029/2012GL054092.Yang, J. (2015), Local and remote wind stress forcing of the seasonal variability of the Atlantic Meridional Overturning Circulation (AMOC)
transport at 26.5°N, J. Geophys. Res. Oceans, 120, 2488–2503, doi:10.1002/2014JC010317.Zuo, H., M. A. Balmaseda, and K. Mogensen (2015), The new eddy-permitting ORAP5 ocean reanalysis: Description, evaluation and uncer-
tainties in climate signals, Clim. Dyn., doi:10.1007/s00382-015-2675-1.
Geophysical Research Letters 10.1002/2016GL072475
TRENBERTH AND FASULLO AMOC AND OCEAN MERIDIONAL HEAT TRANSPORT 1927