Atlantic Fish + Seafood Processing Workforce Survey Report...Fish Processing Labourer Top key...
27
June 2018 Atlantic Fish + Seafood Processing Workforce Survey Report LABOUR MARKET INFORMATION REPORT SERIES
Transcript of Atlantic Fish + Seafood Processing Workforce Survey Report...Fish Processing Labourer Top key...

June 2018
Atlantic Fish + Seafood
Processing Workforce
Survey ReportLABOUR MARKET INFORMATION
REPORT SERIES
Atlantic Seafood Workforce Survey Findings | June 2018 ©Food Processing Skills Canada 2
This project was funded by the Government of Canada’s Sectoral Initiatives
Program.
The opinions and interpretations in this publication are those of the author
and do not necessarily reflect those of the Government of Canada.
ISBN 978-1-989541-01-2
Copyright © 2019 Food Processing Skills Canada
All rights reserved. The use of any part of this publication, whether it is
reproduced, stored in a retrieval system or transmitted in any form or by any
means (including electronic, mechanical, photographic, photocopying or
recording), without the prior written permission of the Food Processing Skills
Canada is an infringement of copyright law.
Food Processing Skills Canada 201 – 3030 Conroy Road Ottawa, Ontario K1G 6C2
Tel. (613) 237-7988
Toll Free: 1-877-963-7472
Fax: 613-237-9939
Atlantic Seafood Workforce Survey Findings | June 2018 ©Food Processing Skills Canada
Seafood Processors SurveyExecutive Summary
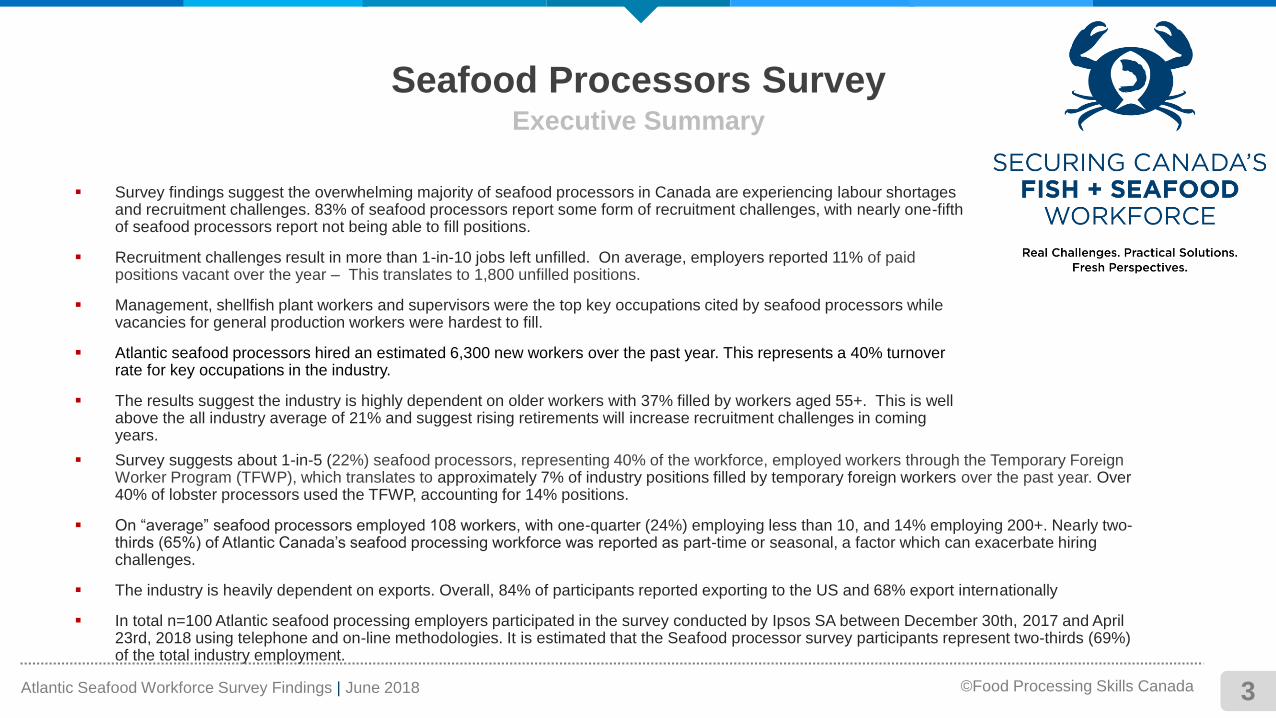
▪ Survey suggests about 1-in-5 (22%) seafood processors, representing 40% of the workforce, employed workers through the Temporary Foreign Worker Program (TFWP), which translates to approximately 7% of industry positions filled by temporary foreign workers over the past year. Over 40% of lobster processors used the TFWP, accounting for 14% positions.
▪ On “average” seafood processors employed 108 workers, with one-quarter (24%) employing less than 10, and 14% employing 200+. Nearly two-thirds (65%) of Atlantic Canada’s seafood processing workforce was reported as part-time or seasonal, a factor which can exacerbate hiring challenges.
▪ The industry is heavily dependent on exports. Overall, 84% of participants reported exporting to the US and 68% export internationally
▪ In total n=100 Atlantic seafood processing employers participated in the survey conducted by Ipsos SA between December 30th, 2017 and April 23rd, 2018 using telephone and on-line methodologies. It is estimated that the Seafood processor survey participants represent two-thirds (69%) of the total industry employment.
▪ Survey findings suggest the overwhelming majority of seafood processors in Canada are experiencing labour shortages and recruitment challenges. 83% of seafood processors report some form of recruitment challenges, with nearly one-fifth of seafood processors report not being able to fill positions.
▪ Recruitment challenges result in more than 1-in-10 jobs left unfilled. On average, employers reported 11% of paid positions vacant over the year – This translates to 1,800 unfilled positions.
▪ Management, shellfish plant workers and supervisors were the top key occupations cited by seafood processors while vacancies for general production workers were hardest to fill.
▪ Atlantic seafood processors hired an estimated 6,300 new workers over the past year. This represents a 40% turnover rate for key occupations in the industry.
▪ The results suggest the industry is highly dependent on older workers with 37% filled by workers aged 55+. This is well above the all industry average of 21% and suggest rising retirements will increase recruitment challenges in coming years.
3
Atlantic Seafood Workforce Survey Findings | June 2018 ©Food Processing Skills Canada
Seafood Processors SurveyOverview
▪ Seafood processor profile
▪ Activity and product
▪ Export markets
▪ Workforce profile
▪ Employment
▪ Vacancies
▪ Workforce availability and Recruitment
▪ Wages and Benefits
▪ Workforce recruitment
▪ Methodology
4
Atlantic Seafood Workforce Survey Findings | June 2018 ©Food Processing Skills Canada 5
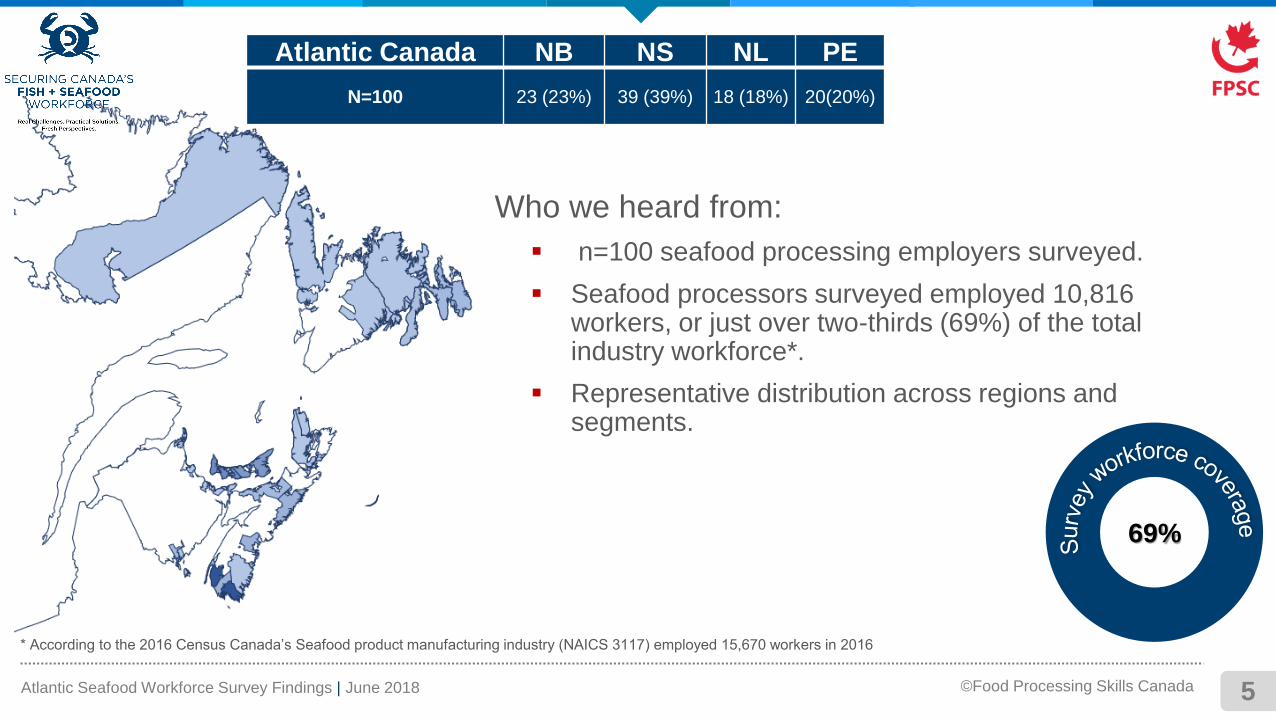
Atlantic Canada NB NS NL PE
N=100 23 (23%) 39 (39%) 18 (18%) 20(20%)
Who we heard from:
▪ n=100 seafood processing employers surveyed.
▪ Seafood processors surveyed employed 10,816 workers, or just over two-thirds (69%) of the total industry workforce*.
▪ Representative distribution across regions and segments.
* According to the 2016 Census Canada’s Seafood product manufacturing industry (NAICS 3117) employed 15,670 workers in 2016
69%
Atlantic Seafood Workforce Survey Findings | June 2018 ©Food Processing Skills Canada
Seafood Processor Profile
6
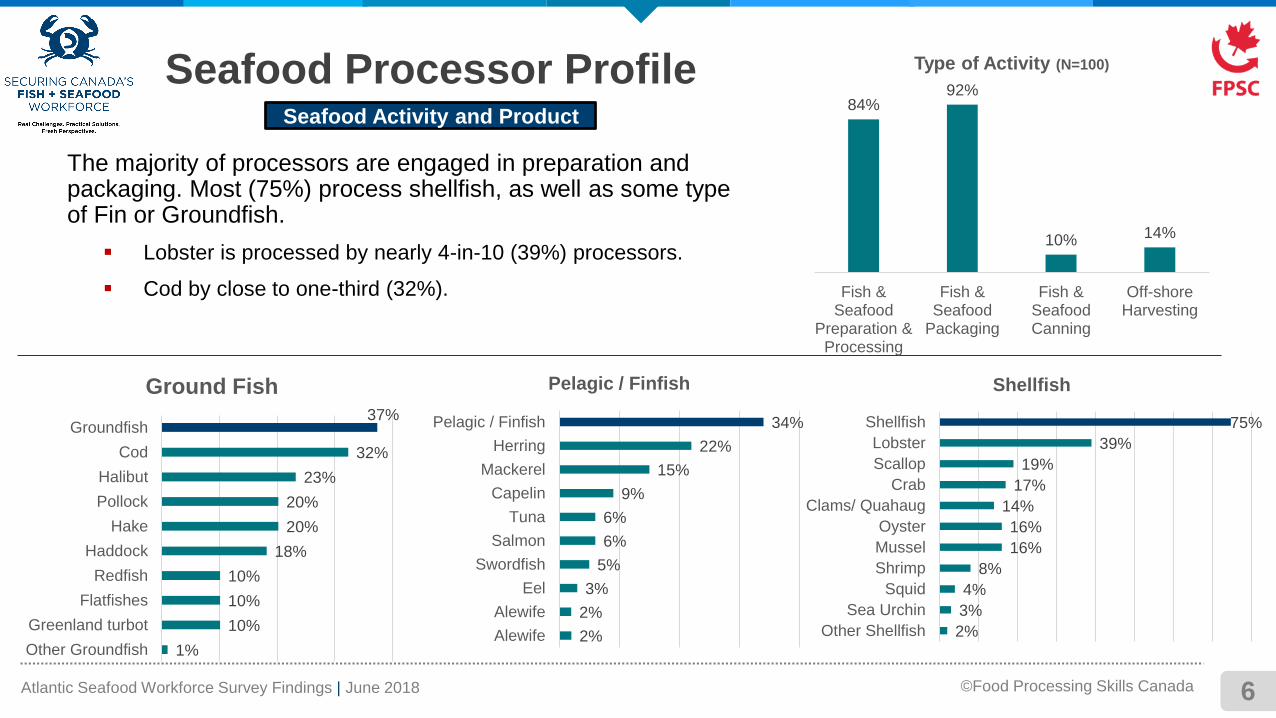
The majority of processors are engaged in preparation and packaging. Most (75%) process shellfish, as well as some type of Fin or Groundfish.
▪ Lobster is processed by nearly 4-in-10 (39%) processors.
▪ Cod by close to one-third (32%).
37%
32%
23%
20%
20%
18%
10%
10%
10%
1%
Groundfish
Cod
Halibut
Pollock
Hake
Haddock
Redfish
Flatfishes
Greenland turbot
Other Groundfish
Ground Fish
Seafood Activity and Product
34%
22%
15%
9%
6%
6%
5%
3%
2%
2%
Pelagic / Finfish
Herring
Mackerel
Capelin
Tuna
Salmon
Swordfish
Eel
Alewife
Alewife
Pelagic / Finfish
75%
39%
19%
17%
14%
16%
16%
8%
4%
3%
2%
Shellfish
Lobster
Scallop
Crab
Clams/ Quahaug
Oyster
Mussel
Shrimp
Squid
Sea Urchin
Other Shellfish
Shellfish
84%92%
10% 14%
Fish &Seafood
Preparation &Processing
Fish &Seafood
Packaging
Fish &SeafoodCanning
Off-shoreHarvesting
Type of Activity (N=100)
Atlantic Seafood Workforce Survey Findings | June 2018 ©Food Processing Skills Canada 7
Export Markets
Seafood Processing Industry Profile
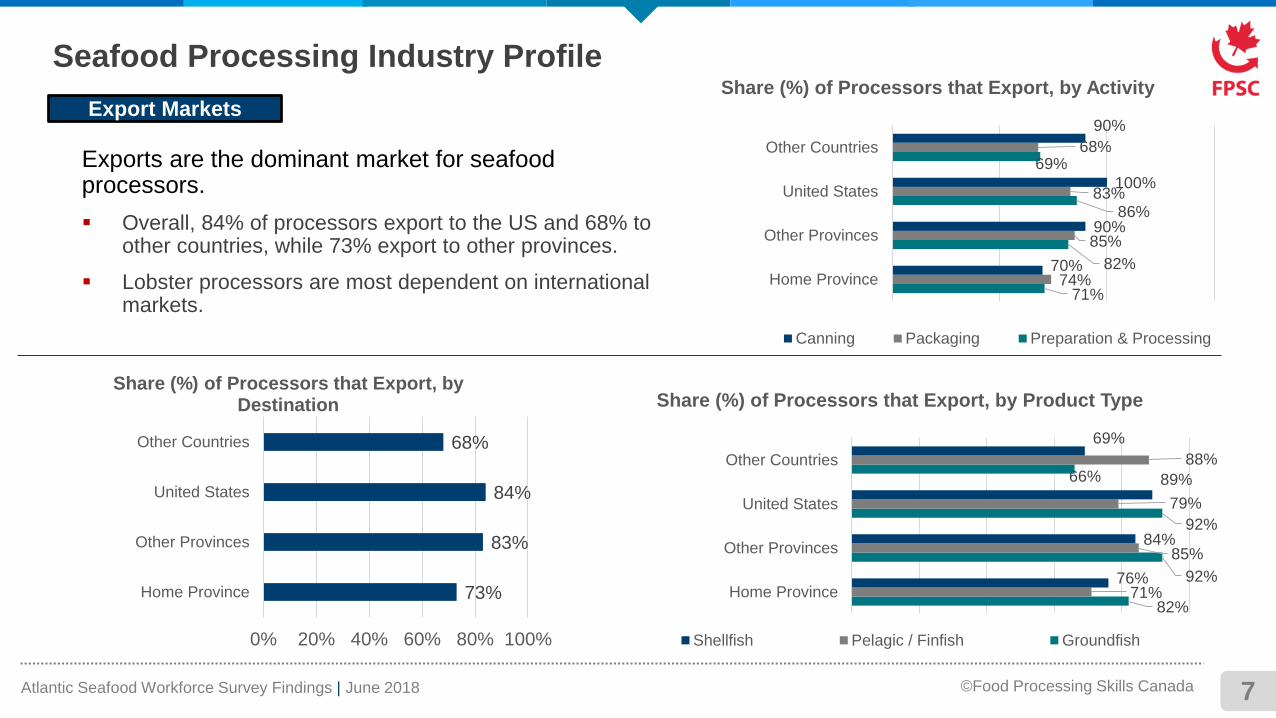
Exports are the dominant market for seafood processors.
▪ Overall, 84% of processors export to the US and 68% to other countries, while 73% export to other provinces.
▪ Lobster processors are most dependent on international markets.
73%
83%
84%
68%
0% 20% 40% 60% 80% 100%
Home Province
Other Provinces
United States
Other Countries
Share (%) of Processors that Export, by Destination
71%
82%
86%
69%
74%
85%
83%
68%
70%
90%
100%
90%
Home Province
Other Provinces
United States
Other Countries
Share (%) of Processors that Export, by Activity
Canning Packaging Preparation & Processing
82%
92%
92%
66%
71%
85%
79%
88%
76%
84%
89%
69%
Home Province
Other Provinces
United States
Other Countries
Share (%) of Processors that Export, by Product Type
Shellfish Pelagic / Finfish Groundfish
Atlantic Seafood Workforce Survey Findings | June 2018 ©Food Processing Skills Canada 8
Workforce –
Employment Size
Seafood Processing Industry Profile
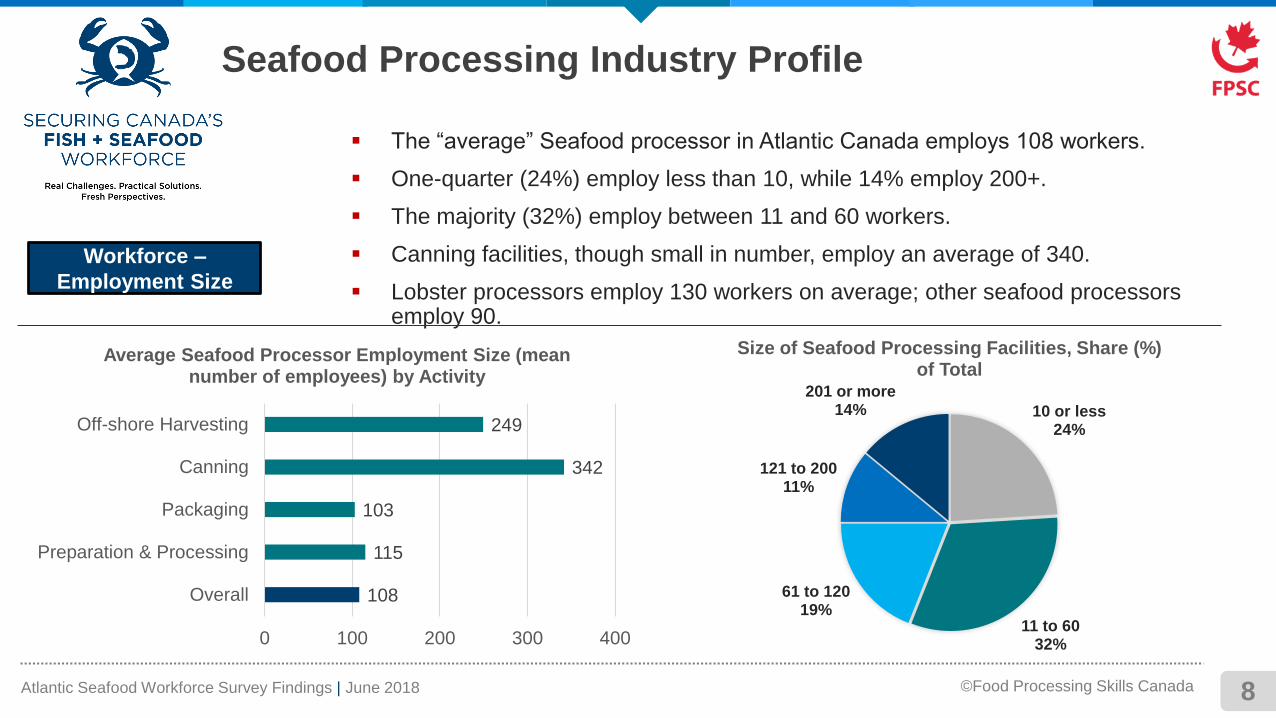
▪ The “average” Seafood processor in Atlantic Canada employs 108 workers.
▪ One-quarter (24%) employ less than 10, while 14% employ 200+.
▪ The majority (32%) employ between 11 and 60 workers.
▪ Canning facilities, though small in number, employ an average of 340.
▪ Lobster processors employ 130 workers on average; other seafood processors employ 90.
10 or less24%
11 to 6032%
61 to 12019%
121 to 20011%
201 or more14%
Size of Seafood Processing Facilities, Share (%) of Total
108
115
103
342
249
0 100 200 300 400
Overall
Preparation & Processing
Packaging
Canning
Off-shore Harvesting
Average Seafood Processor Employment Size (mean number of employees) by Activity
Atlantic Seafood Workforce Survey Findings | June 2018 ©Food Processing Skills Canada 9
Workforce – Employment Size
Seafood Processing Industry Profile
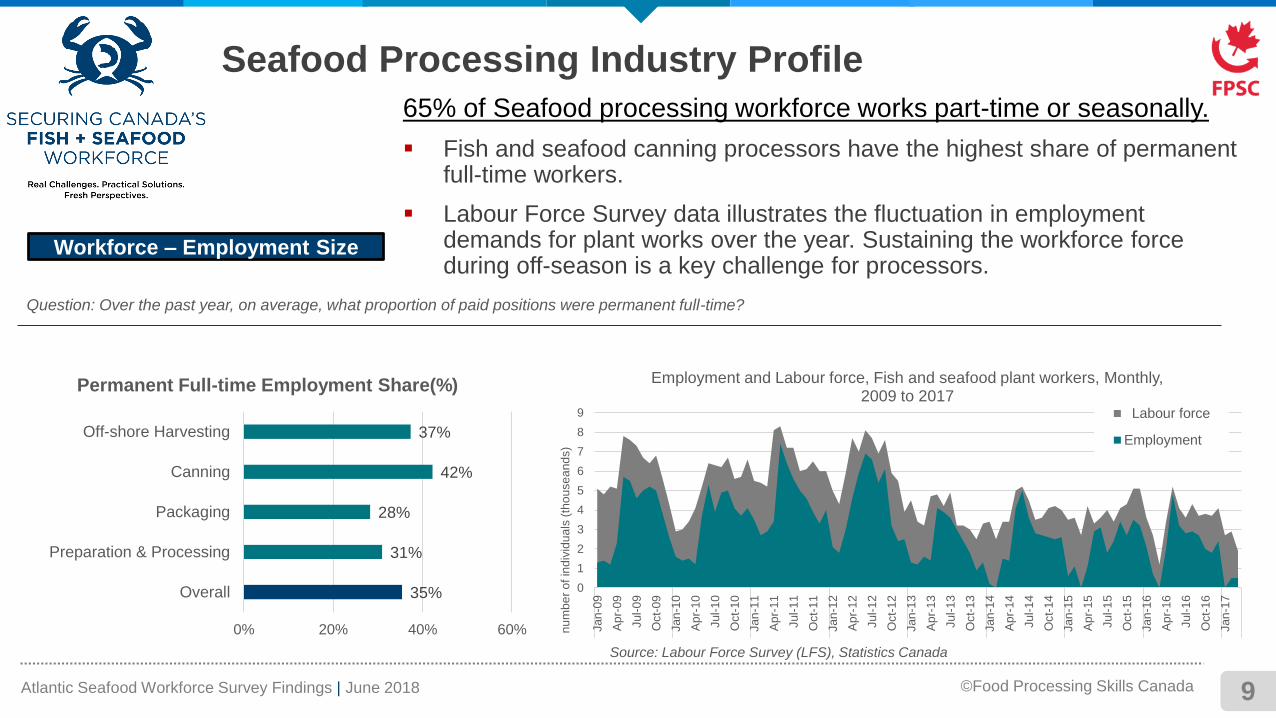
65% of Seafood processing workforce works part-time or seasonally.
▪ Fish and seafood canning processors have the highest share of permanent full-time workers.
▪ Labour Force Survey data illustrates the fluctuation in employment demands for plant works over the year. Sustaining the workforce force during off-season is a key challenge for processors.
0
1
2
3
4
5
6
7
8
9
Jan
-09
Ap
r-09
Jul-
09
Oct-
09
Jan
-10
Ap
r-10
Jul-
10
Oct-
10
Jan
-11
Ap
r-11
Jul-
11
Oct-
11
Jan
-12
Ap
r-12
Jul-
12
Oct-
12
Jan
-13
Ap
r-13
Jul-
13
Oct-
13
Jan
-14
Ap
r-14
Jul-
14
Oct-
14
Jan
-15
Ap
r-15
Jul-
15
Oct-
15
Jan
-16
Ap
r-16
Jul-
16
Oct-
16
Jan
-17
2009 2010 2011 2012 2013 2014 2015 2016 2017
nu
mb
er
of in
div
idu
als
(th
ou
se
an
ds)
Employment and Labour force, Fish and seafood plant workers, Monthly, 2009 to 2017
Labour force
Employment
Source: Labour Force Survey (LFS), Statistics Canada
35%
31%
28%
42%
37%
0% 20% 40% 60%
Overall
Preparation & Processing
Packaging
Canning
Off-shore Harvesting
Permanent Full-time Employment Share(%)
Question: Over the past year, on average, what proportion of paid positions were permanent full-time?
Atlantic Seafood Workforce Survey Findings | June 2018 ©Food Processing Skills Canada 10
Workforce – Key Occupation
Seafood Processing Industry Profile
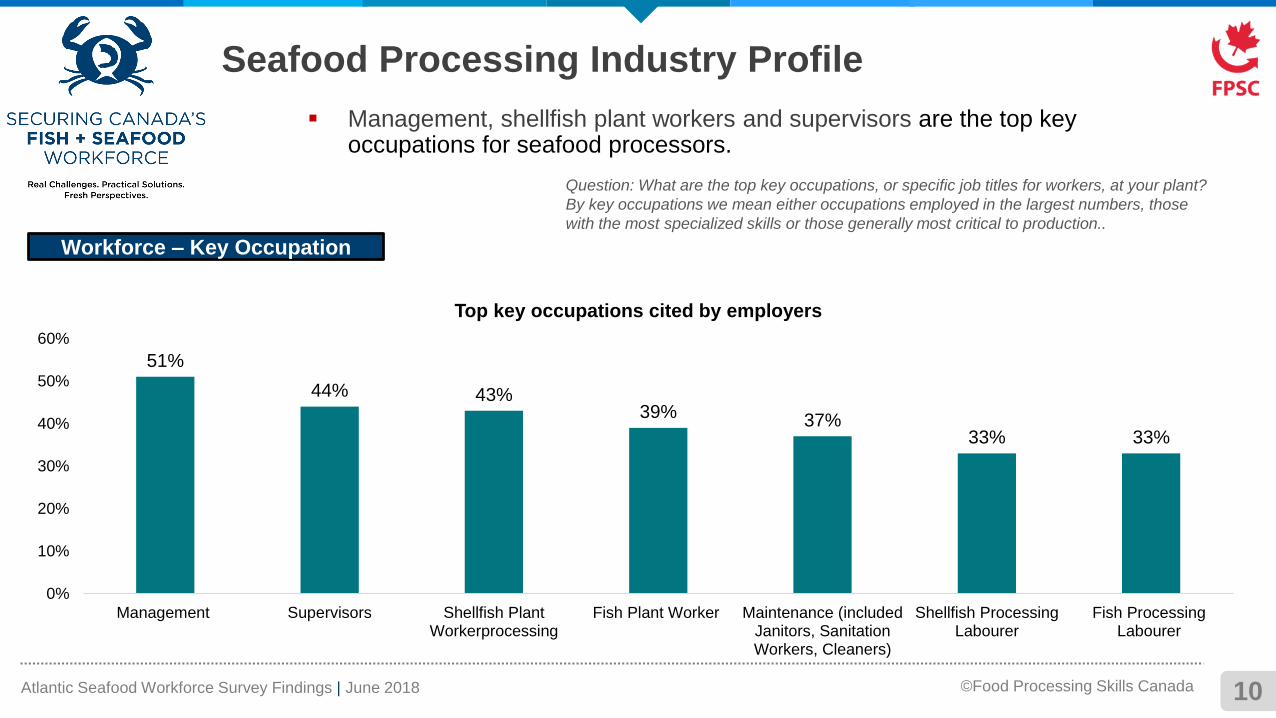
▪ Management, shellfish plant workers and supervisors are the top key occupations for seafood processors.
Question: What are the top key occupations, or specific job titles for workers, at your plant?
By key occupations we mean either occupations employed in the largest numbers, those
with the most specialized skills or those generally most critical to production..
51%
44% 43%39% 37%
33% 33%
0%
10%
20%
30%
40%
50%
60%
Management Supervisors Shellfish PlantWorkerprocessing
Fish Plant Worker Maintenance (includedJanitors, SanitationWorkers, Cleaners)
Shellfish ProcessingLabourer
Fish ProcessingLabourer
Top key occupations cited by employers
Atlantic Seafood Workforce Survey Findings | June 2018 ©Food Processing Skills Canada
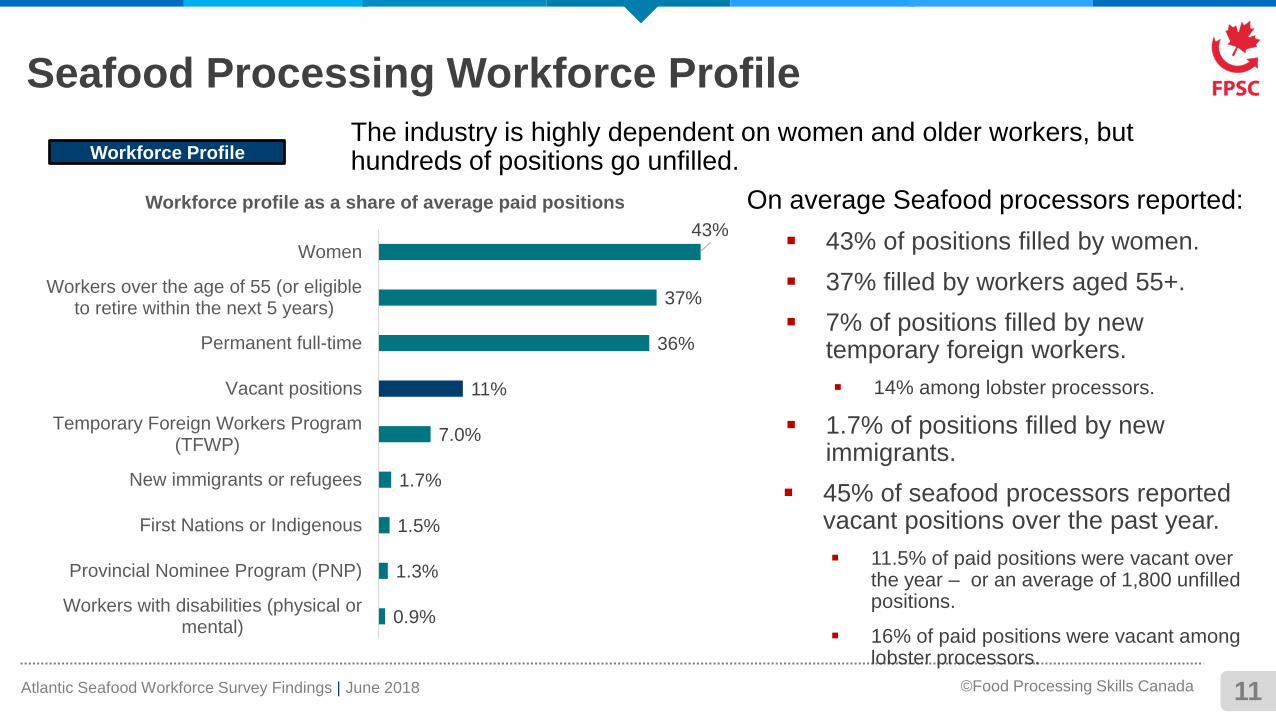
On average Seafood processors reported:
▪ 43% of positions filled by women.
▪ 37% filled by workers aged 55+.
▪ 7% of positions filled by new temporary foreign workers.
▪ 14% among lobster processors.
▪ 1.7% of positions filled by new immigrants.
▪ 45% of seafood processors reported vacant positions over the past year.
▪ 11.5% of paid positions were vacant over the year – or an average of 1,800 unfilled positions.
▪ 16% of paid positions were vacant among lobster processors.
11
Seafood Processing Workforce Profile
Workforce ProfileThe industry is highly dependent on women and older workers, but hundreds of positions go unfilled.
0.9%
1.3%
1.5%
1.7%
7.0%
11%
36%
37%
43%
Workers with disabilities (physical ormental)
Provincial Nominee Program (PNP)
First Nations or Indigenous
New immigrants or refugees
Temporary Foreign Workers Program(TFWP)
Vacant positions
Permanent full-time
Workers over the age of 55 (or eligibleto retire within the next 5 years)
Women
Workforce profile as a share of average paid positions
Atlantic Seafood Workforce Survey Findings | June 2018 ©Food Processing Skills Canada
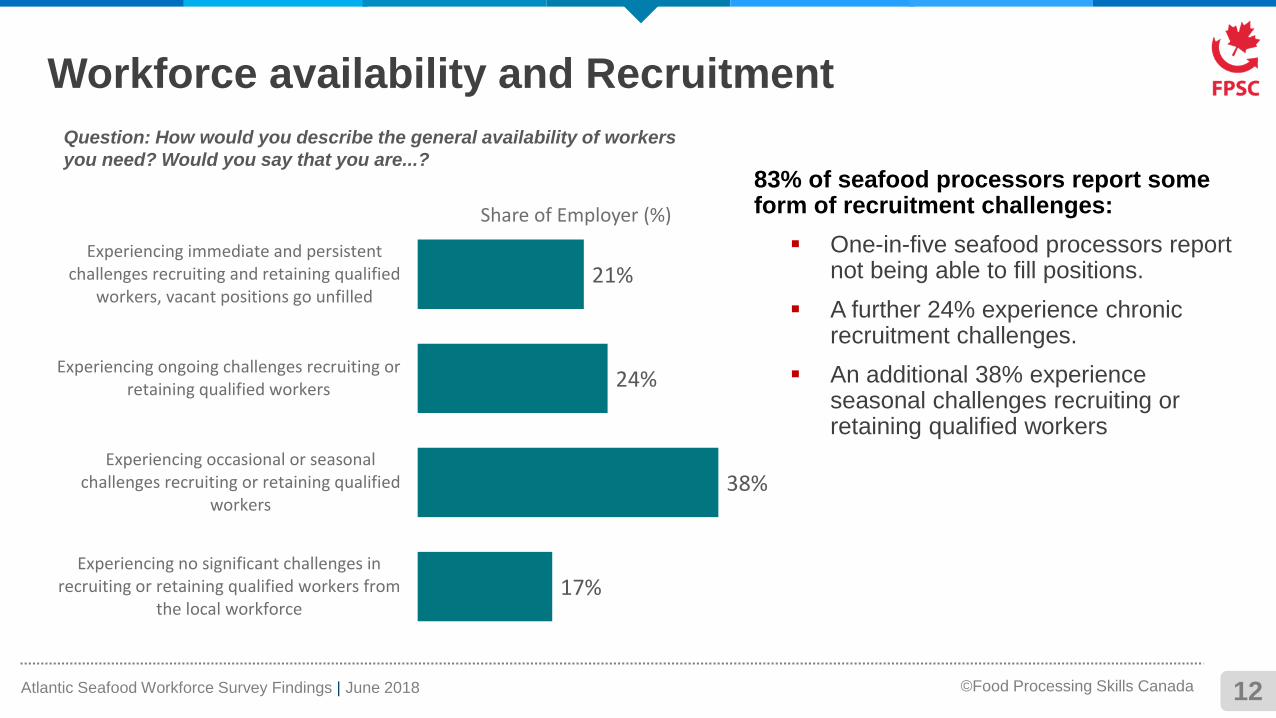
83% of seafood processors report some form of recruitment challenges:
▪ One-in-five seafood processors report not being able to fill positions.
▪ A further 24% experience chronic recruitment challenges.
▪ An additional 38% experience seasonal challenges recruiting or retaining qualified workers
12
Workforce availability and Recruitment
Question: How would you describe the general availability of workers
you need? Would you say that you are...?
21%
24%
38%
17%
Experiencing immediate and persistentchallenges recruiting and retaining qualified
workers, vacant positions go unfilled
Experiencing ongoing challenges recruiting orretaining qualified workers
Experiencing occasional or seasonalchallenges recruiting or retaining qualified
workers
Experiencing no significant challenges inrecruiting or retaining qualified workers from
the local workforce
Share of Employer (%)
Atlantic Seafood Workforce Survey Findings | June 2018 ©Food Processing Skills Canada
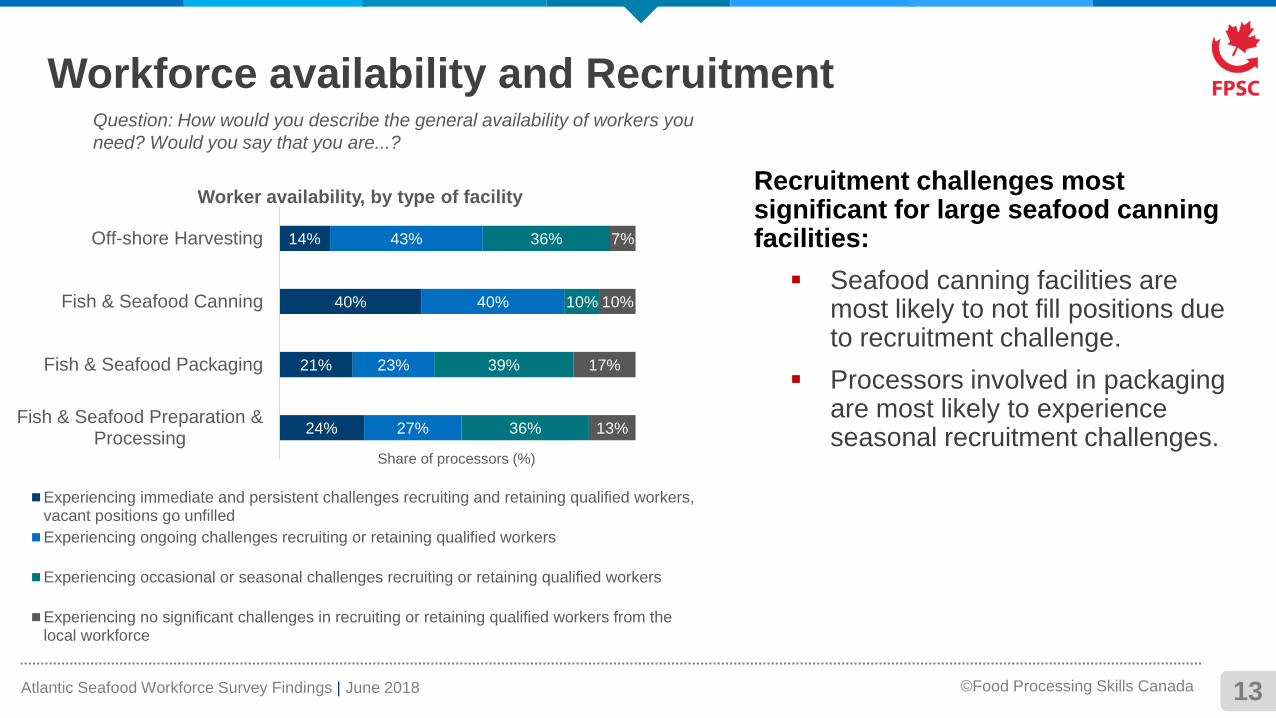
Recruitment challenges most significant for large seafood canning facilities:
▪ Seafood canning facilities are most likely to not fill positions due to recruitment challenge.
▪ Processors involved in packaging are most likely to experience seasonal recruitment challenges.
13
Workforce availability and RecruitmentQuestion: How would you describe the general availability of workers you
need? Would you say that you are...?
24%
21%
40%
14%
27%
23%
40%
43%
36%
39%
10%
36%
13%
17%
10%
7%
Fish & Seafood Preparation &Processing
Fish & Seafood Packaging
Fish & Seafood Canning
Off-shore Harvesting
Share of processors (%)
Worker availability, by type of facility
Experiencing immediate and persistent challenges recruiting and retaining qualified workers,vacant positions go unfilled
Experiencing ongoing challenges recruiting or retaining qualified workers
Experiencing occasional or seasonal challenges recruiting or retaining qualified workers
Experiencing no significant challenges in recruiting or retaining qualified workers from thelocal workforce
Atlantic Seafood Workforce Survey Findings | June 2018 ©Food Processing Skills Canada
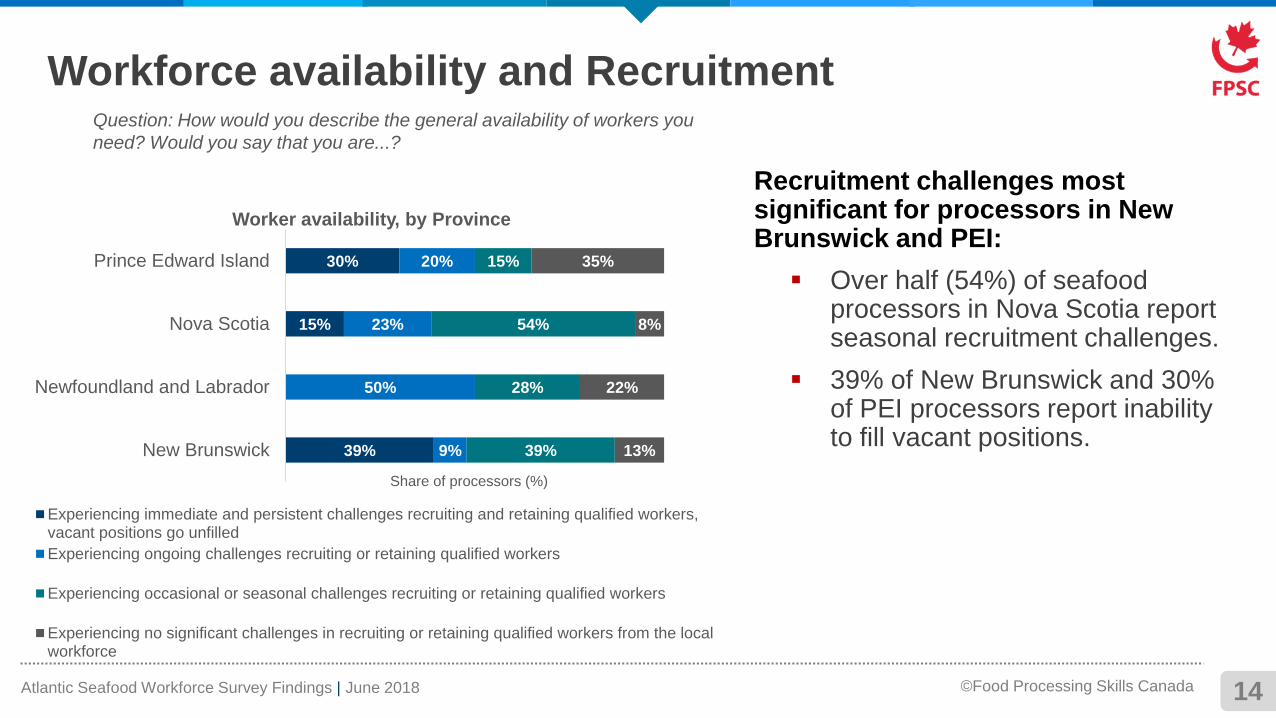
Recruitment challenges most significant for processors in New Brunswick and PEI:
▪ Over half (54%) of seafood processors in Nova Scotia report seasonal recruitment challenges.
▪ 39% of New Brunswick and 30% of PEI processors report inability to fill vacant positions.
14
Workforce availability and RecruitmentQuestion: How would you describe the general availability of workers you
need? Would you say that you are...?
39%
15%
30%
9%
50%
23%
20%
39%
28%
54%
15%
13%
22%
8%
35%
New Brunswick
Newfoundland and Labrador
Nova Scotia
Prince Edward Island
Share of processors (%)
Worker availability, by Province
Experiencing immediate and persistent challenges recruiting and retaining qualified workers,vacant positions go unfilled
Experiencing ongoing challenges recruiting or retaining qualified workers
Experiencing occasional or seasonal challenges recruiting or retaining qualified workers
Experiencing no significant challenges in recruiting or retaining qualified workers from the localworkforce
Atlantic Seafood Workforce Survey Findings | June 2018 ©Food Processing Skills Canada
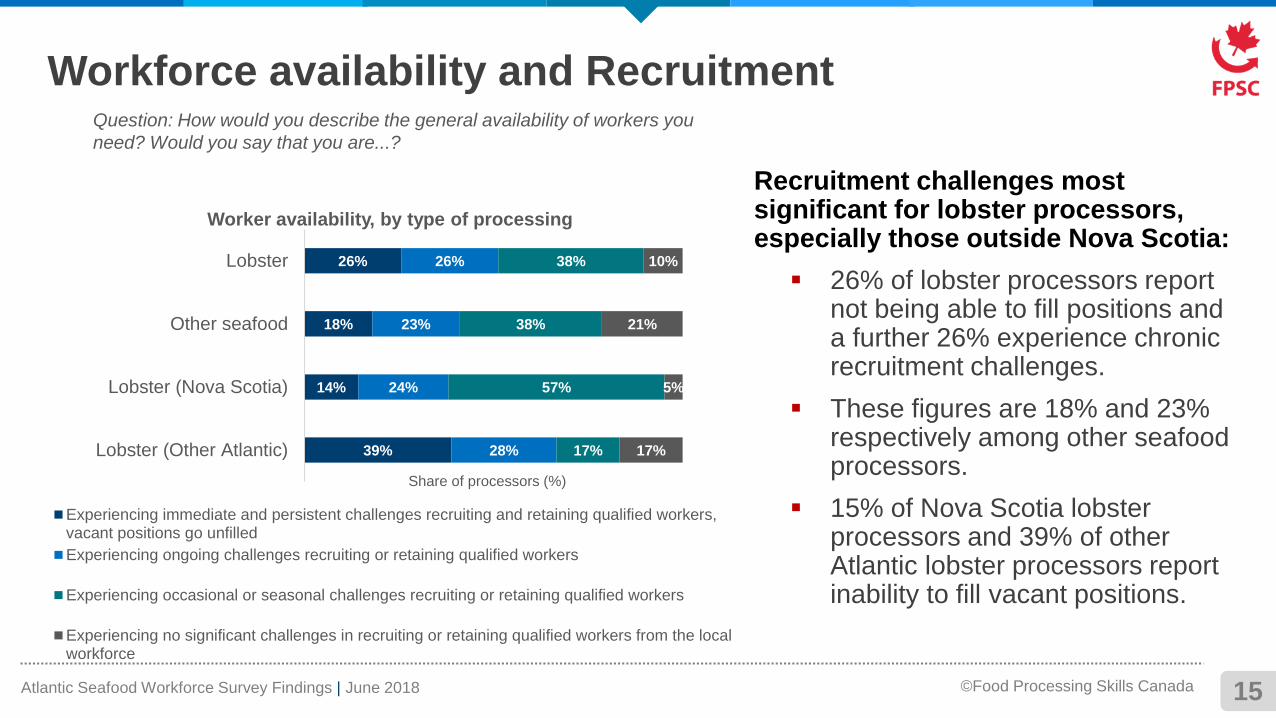
Recruitment challenges most significant for lobster processors, especially those outside Nova Scotia:
▪ 26% of lobster processors report not being able to fill positions and a further 26% experience chronic recruitment challenges.
▪ These figures are 18% and 23% respectively among other seafood processors.
▪ 15% of Nova Scotia lobster processors and 39% of other Atlantic lobster processors report inability to fill vacant positions.
15
Workforce availability and RecruitmentQuestion: How would you describe the general availability of workers you
need? Would you say that you are...?
26%
18%
14%
39%
26%
23%
24%
28%
38%
38%
57%
17%
10%
21%
5%
17%
Lobster
Other seafood
Lobster (Nova Scotia)
Lobster (Other Atlantic)
Share of processors (%)
Worker availability, by type of processing
Experiencing immediate and persistent challenges recruiting and retaining qualified workers,vacant positions go unfilled
Experiencing ongoing challenges recruiting or retaining qualified workers
Experiencing occasional or seasonal challenges recruiting or retaining qualified workers
Experiencing no significant challenges in recruiting or retaining qualified workers from the localworkforce
Atlantic Seafood Workforce Survey Findings | June 2018 ©Food Processing Skills Canada
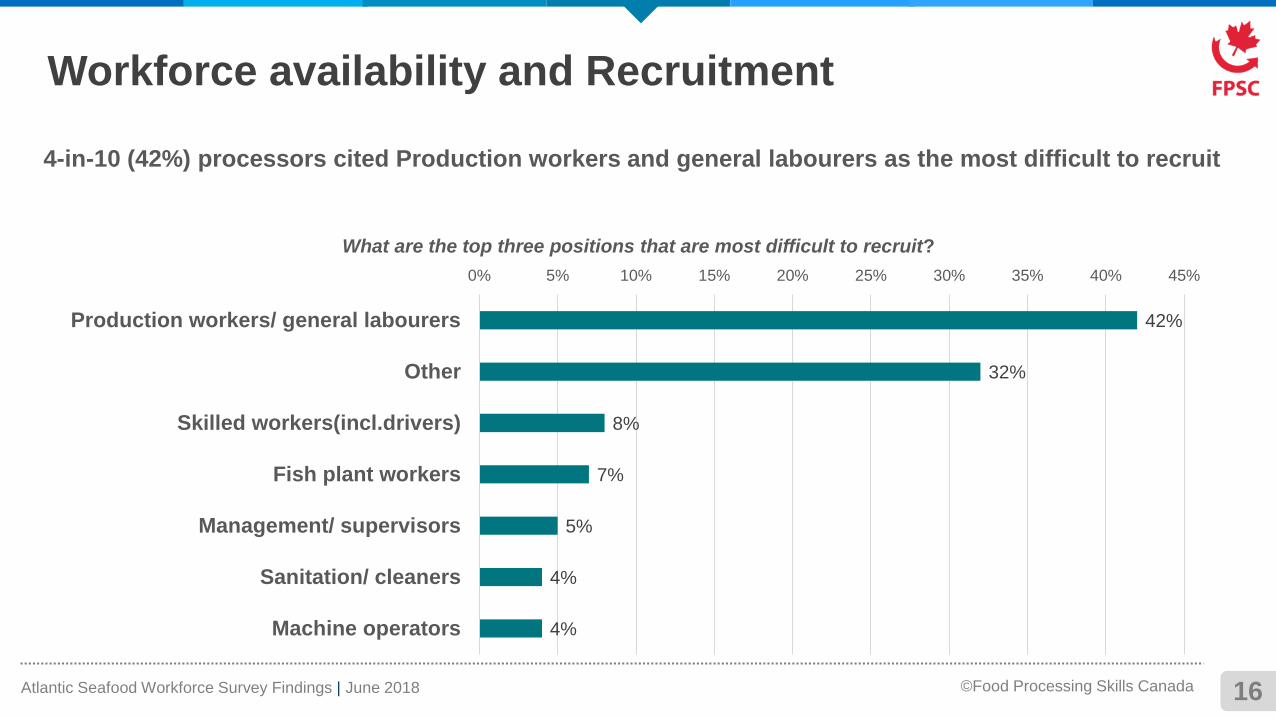
4-in-10 (42%) processors cited Production workers and general labourers as the most difficult to recruit
16
Workforce availability and Recruitment
42%
32%
8%
7%
5%
4%
4%
0% 5% 10% 15% 20% 25% 30% 35% 40% 45%
Production workers/ general labourers
Other
Skilled workers(incl.drivers)
Fish plant workers
Management/ supervisors
Sanitation/ cleaners
Machine operators
What are the top three positions that are most difficult to recruit?
Atlantic Seafood Workforce Survey Findings | June 2018 ©Food Processing Skills Canada
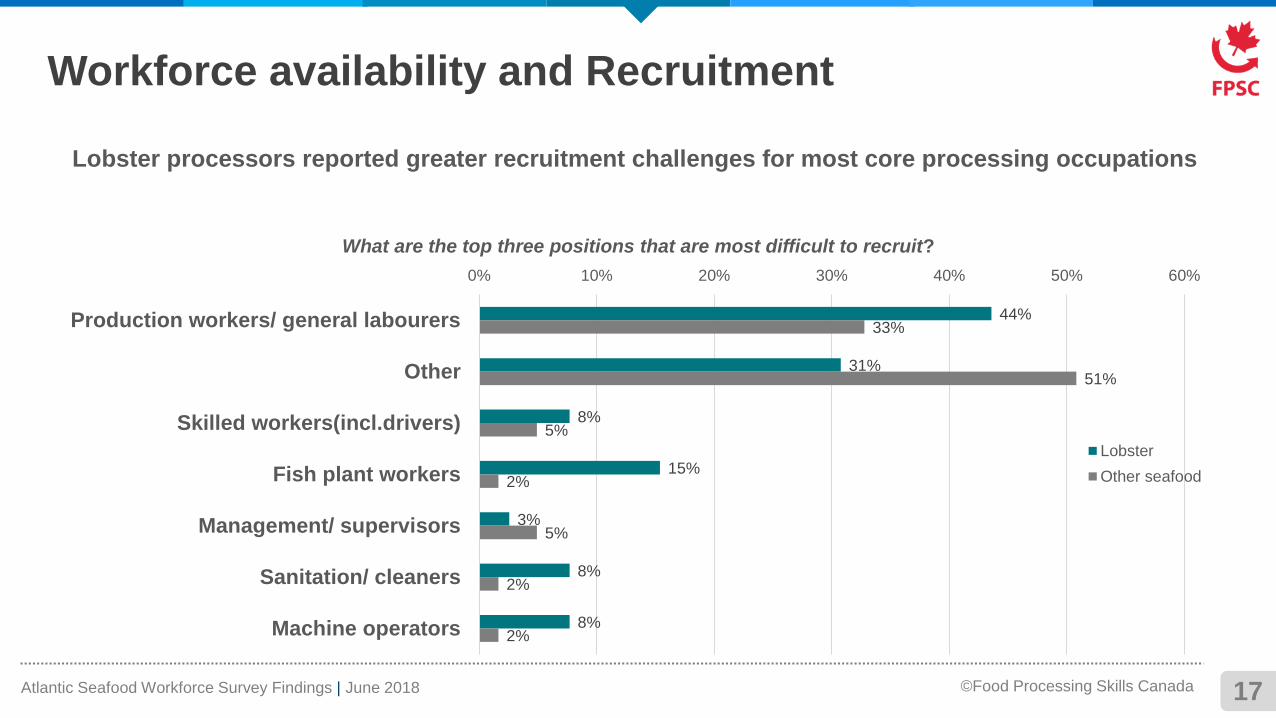
Lobster processors reported greater recruitment challenges for most core processing occupations
17
Workforce availability and Recruitment
44%
31%
8%
15%
3%
8%
8%
33%
51%
5%
2%
5%
2%
2%
0% 10% 20% 30% 40% 50% 60%
Production workers/ general labourers
Other
Skilled workers(incl.drivers)
Fish plant workers
Management/ supervisors
Sanitation/ cleaners
Machine operators
What are the top three positions that are most difficult to recruit?
Lobster
Other seafood
Atlantic Seafood Workforce Survey Findings | June 2018 ©Food Processing Skills Canada 18
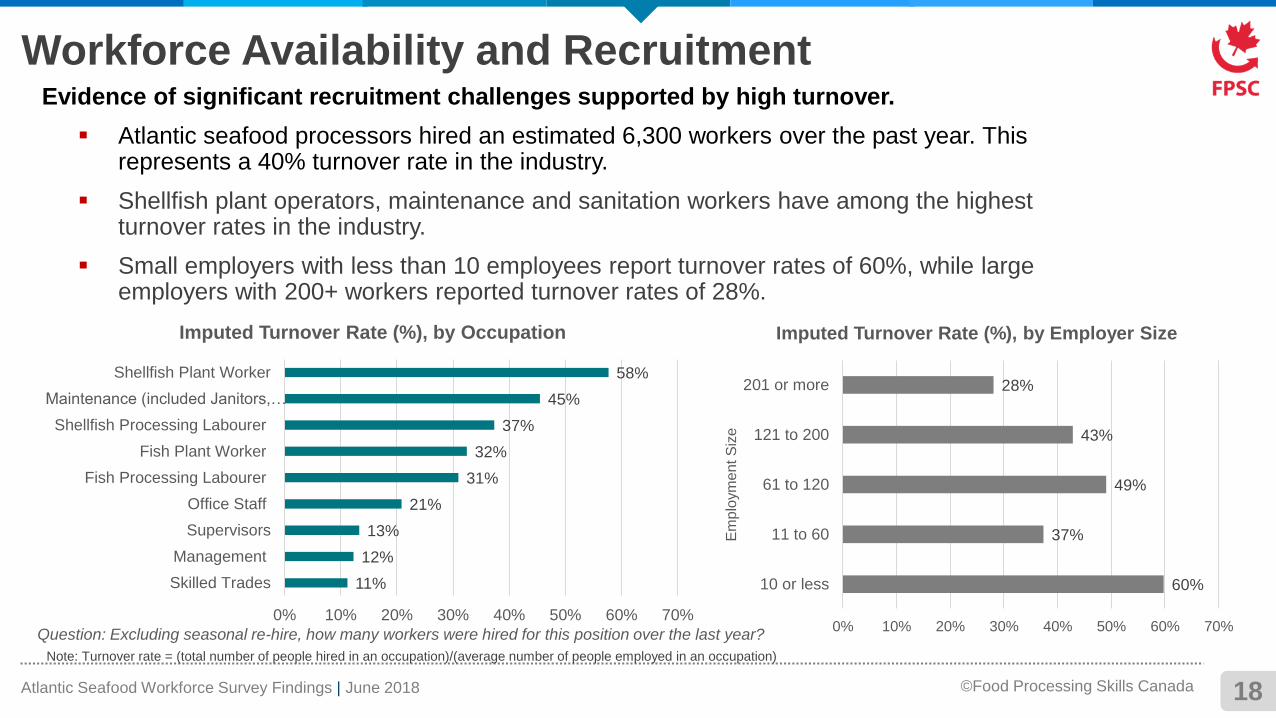
Evidence of significant recruitment challenges supported by high turnover.
▪ Atlantic seafood processors hired an estimated 6,300 workers over the past year. This represents a 40% turnover rate in the industry.
▪ Shellfish plant operators, maintenance and sanitation workers have among the highest turnover rates in the industry.
▪ Small employers with less than 10 employees report turnover rates of 60%, while large employers with 200+ workers reported turnover rates of 28%.
Workforce Availability and Recruitment
Question: Excluding seasonal re-hire, how many workers were hired for this position over the last year?
Note: Turnover rate = (total number of people hired in an occupation)/(average number of people employed in an occupation)
11%
12%
13%
21%
31%
32%
37%
45%
58%
0% 10% 20% 30% 40% 50% 60% 70%
Skilled Trades
Management
Supervisors
Office Staff
Fish Processing Labourer
Fish Plant Worker
Shellfish Processing Labourer
Maintenance (included Janitors,…
Shellfish Plant Worker
Imputed Turnover Rate (%), by Occupation
60%
37%
49%
43%
28%
0% 10% 20% 30% 40% 50% 60% 70%
10 or less
11 to 60
61 to 120
121 to 200
201 or more
Em
plo
ym
ent S
ize
Imputed Turnover Rate (%), by Employer Size
Atlantic Seafood Workforce Survey Findings | June 2018 ©Food Processing Skills Canada
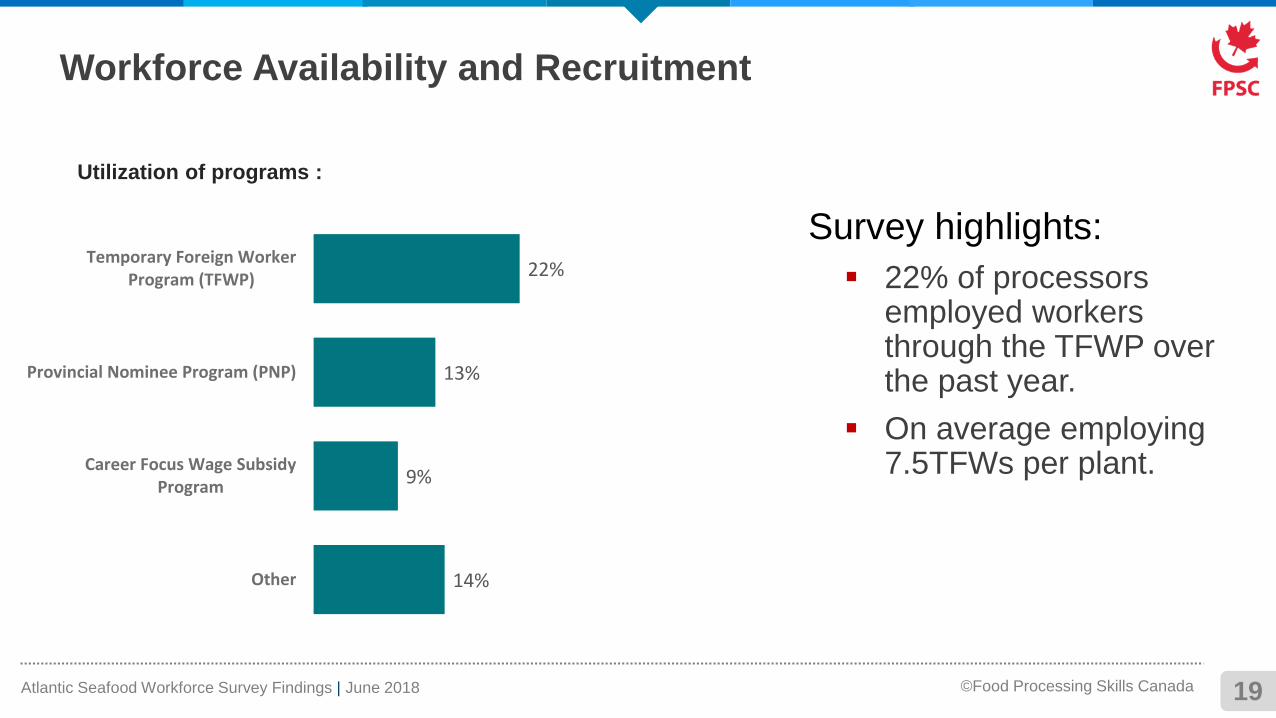
Survey highlights:
▪ 22% of processors employed workers through the TFWP over the past year.
▪ On average employing 7.5TFWs per plant.
19
Utilization of programs :
Workforce Availability and Recruitment
22%
13%
9%
14%
Temporary Foreign WorkerProgram (TFWP)
Provincial Nominee Program (PNP)
Career Focus Wage SubsidyProgram
Other
Atlantic Seafood Workforce Survey Findings | June 2018 ©Food Processing Skills Canada
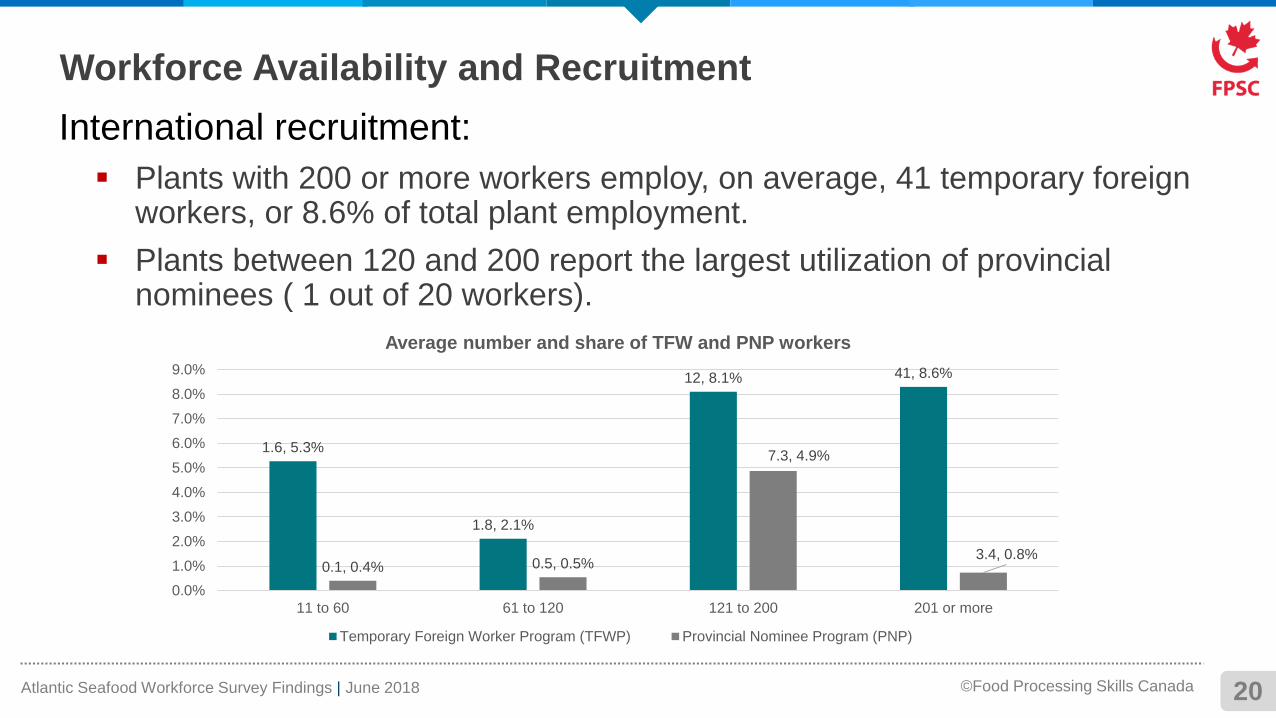
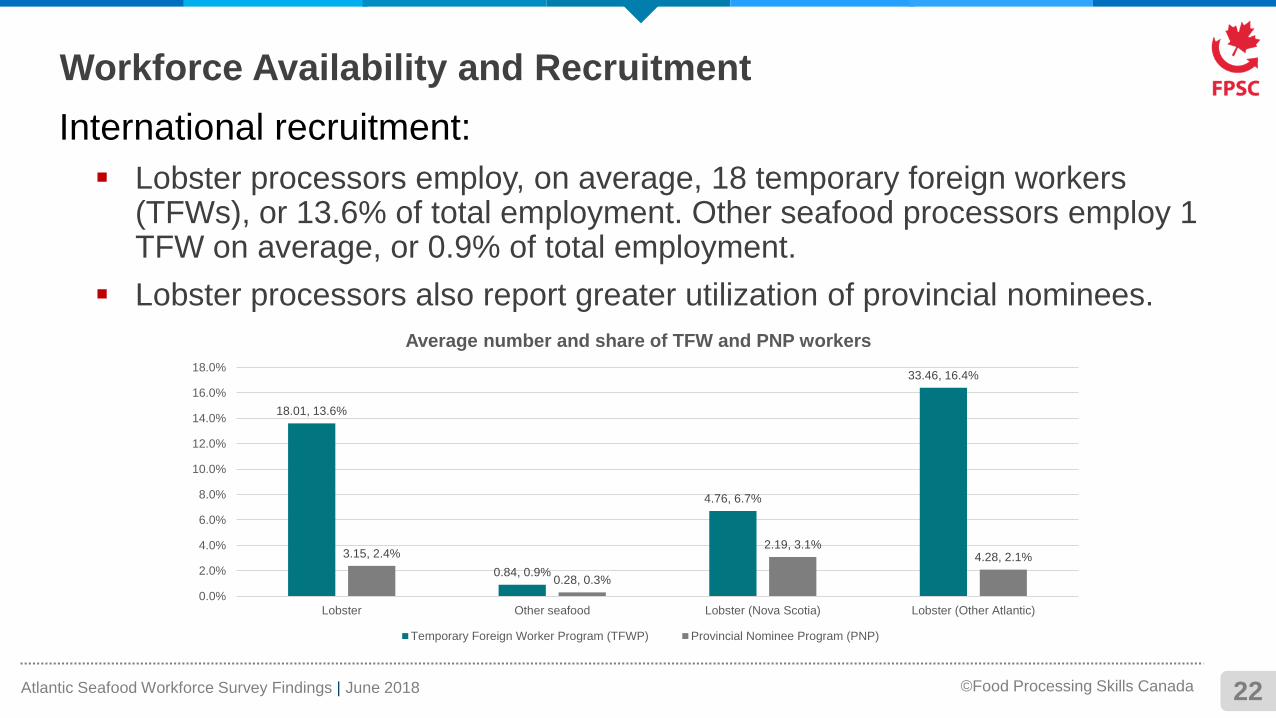
International recruitment:
▪ Plants with 200 or more workers employ, on average, 41 temporary foreign workers, or 8.6% of total plant employment.
▪ Plants between 120 and 200 report the largest utilization of provincial nominees ( 1 out of 20 workers).
20
Workforce Availability and Recruitment
1.6, 5.3%
1.8, 2.1%
12, 8.1% 41, 8.6%
0.1, 0.4% 0.5, 0.5%
7.3, 4.9%
3.4, 0.8%
0.0%
1.0%
2.0%
3.0%
4.0%
5.0%
6.0%
7.0%
8.0%
9.0%
11 to 60 61 to 120 121 to 200 201 or more
Average number and share of TFW and PNP workers
Temporary Foreign Worker Program (TFWP) Provincial Nominee Program (PNP)
Atlantic Seafood Workforce Survey Findings | June 2018 ©Food Processing Skills Canada
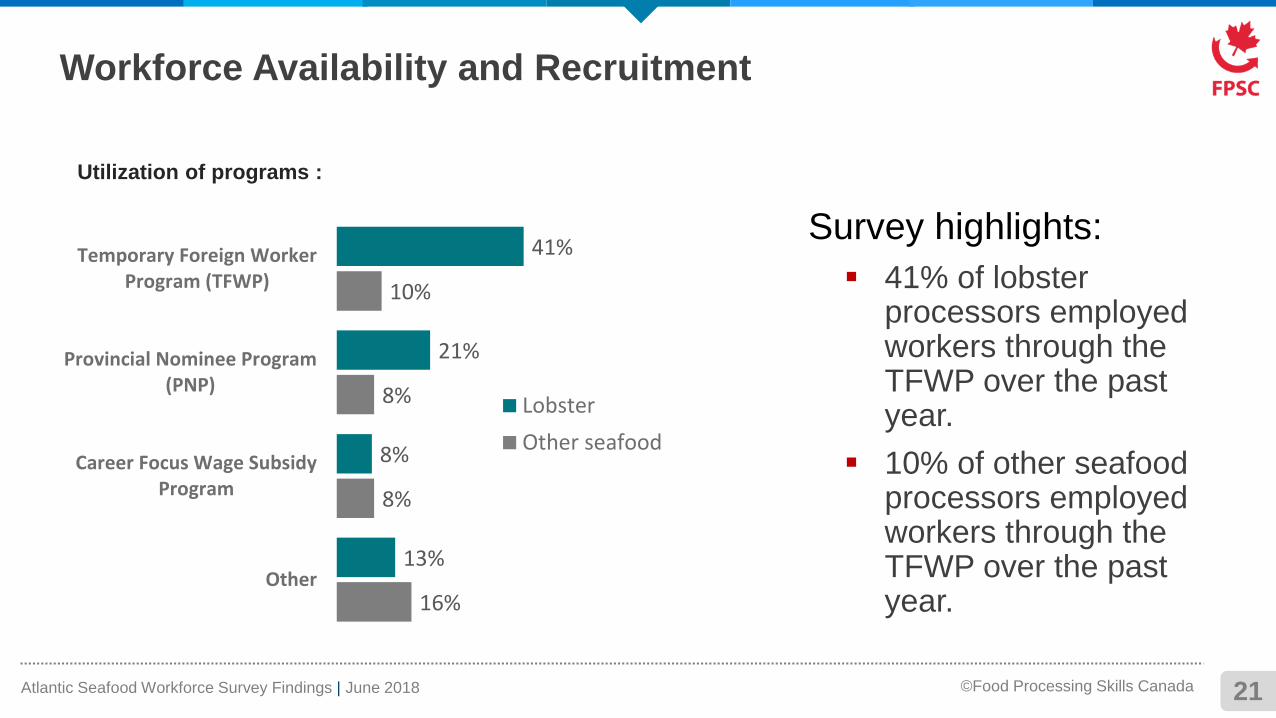
Survey highlights:
▪ 41% of lobster processors employed workers through the TFWP over the past year.
▪ 10% of other seafood processors employed workers through the TFWP over the past year.
21
Utilization of programs :
Workforce Availability and Recruitment
41%
21%
8%
13%
10%
8%
8%
16%
Temporary Foreign WorkerProgram (TFWP)
Provincial Nominee Program(PNP)
Career Focus Wage SubsidyProgram
Other
Lobster
Other seafood
Atlantic Seafood Workforce Survey Findings | June 2018 ©Food Processing Skills Canada
International recruitment:
▪ Lobster processors employ, on average, 18 temporary foreign workers (TFWs), or 13.6% of total employment. Other seafood processors employ 1 TFW on average, or 0.9% of total employment.
▪ Lobster processors also report greater utilization of provincial nominees.
22
Workforce Availability and Recruitment
18.01, 13.6%
0.84, 0.9%
4.76, 6.7%
33.46, 16.4%
3.15, 2.4%
0.28, 0.3%
2.19, 3.1%4.28, 2.1%
0.0%
2.0%
4.0%
6.0%
8.0%
10.0%
12.0%
14.0%
16.0%
18.0%
Lobster Other seafood Lobster (Nova Scotia) Lobster (Other Atlantic)
Average number and share of TFW and PNP workers
Temporary Foreign Worker Program (TFWP) Provincial Nominee Program (PNP)
Atlantic Seafood Workforce Survey Findings | June 2018 ©Food Processing Skills Canada 23
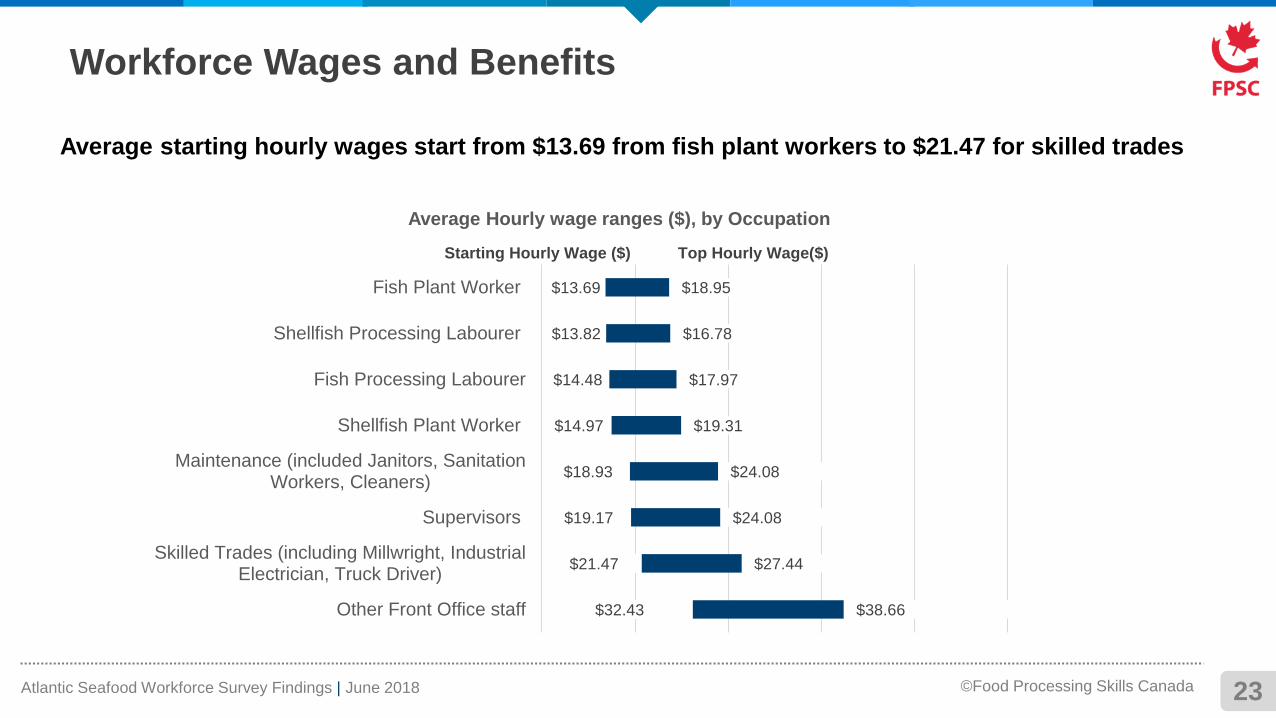
Workforce Wages and Benefits
$32.43
$21.47
$19.17
$18.93
$14.97
$14.48
$13.82
$13.69
$38.66
$27.44
$24.08
$24.08
$19.31
$17.97
$16.78
$18.95
Other Front Office staff
Skilled Trades (including Millwright, IndustrialElectrician, Truck Driver)
Supervisors
Maintenance (included Janitors, SanitationWorkers, Cleaners)
Shellfish Plant Worker
Fish Processing Labourer
Shellfish Processing Labourer
Fish Plant Worker
Average Hourly wage ranges ($), by Occupation
Starting Hourly Wage ($) Top Hourly Wage($)
Average starting hourly wages start from $13.69 from fish plant workers to $21.47 for skilled trades
Atlantic Seafood Workforce Survey Findings | June 2018 ©Food Processing Skills Canada 24
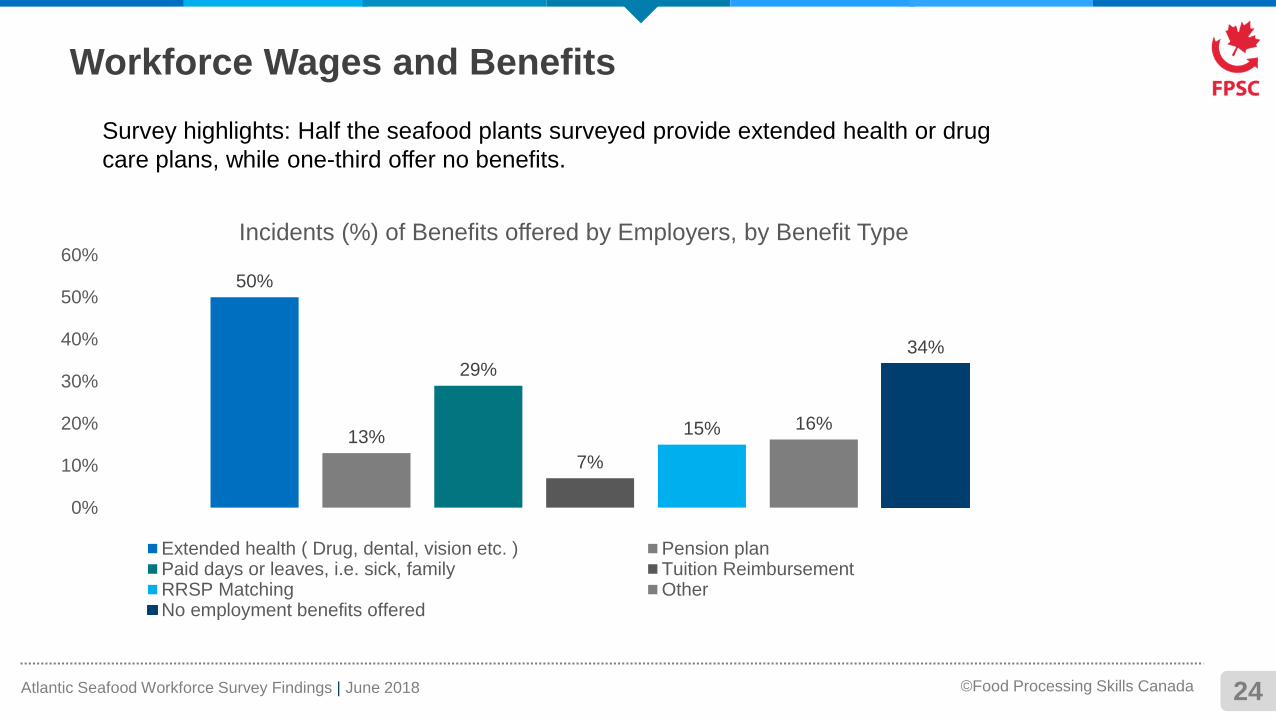
Survey highlights: Half the seafood plants surveyed provide extended health or drug
care plans, while one-third offer no benefits.
Workforce Wages and Benefits
50%
13%
29%
7%
15% 16%
34%
0%
10%
20%
30%
40%
50%
60%Incidents (%) of Benefits offered by Employers, by Benefit Type
Extended health ( Drug, dental, vision etc. ) Pension planPaid days or leaves, i.e. sick, family Tuition ReimbursementRRSP Matching OtherNo employment benefits offered
Atlantic Seafood Workforce Survey Findings | June 2018 ©Food Processing Skills Canada 25
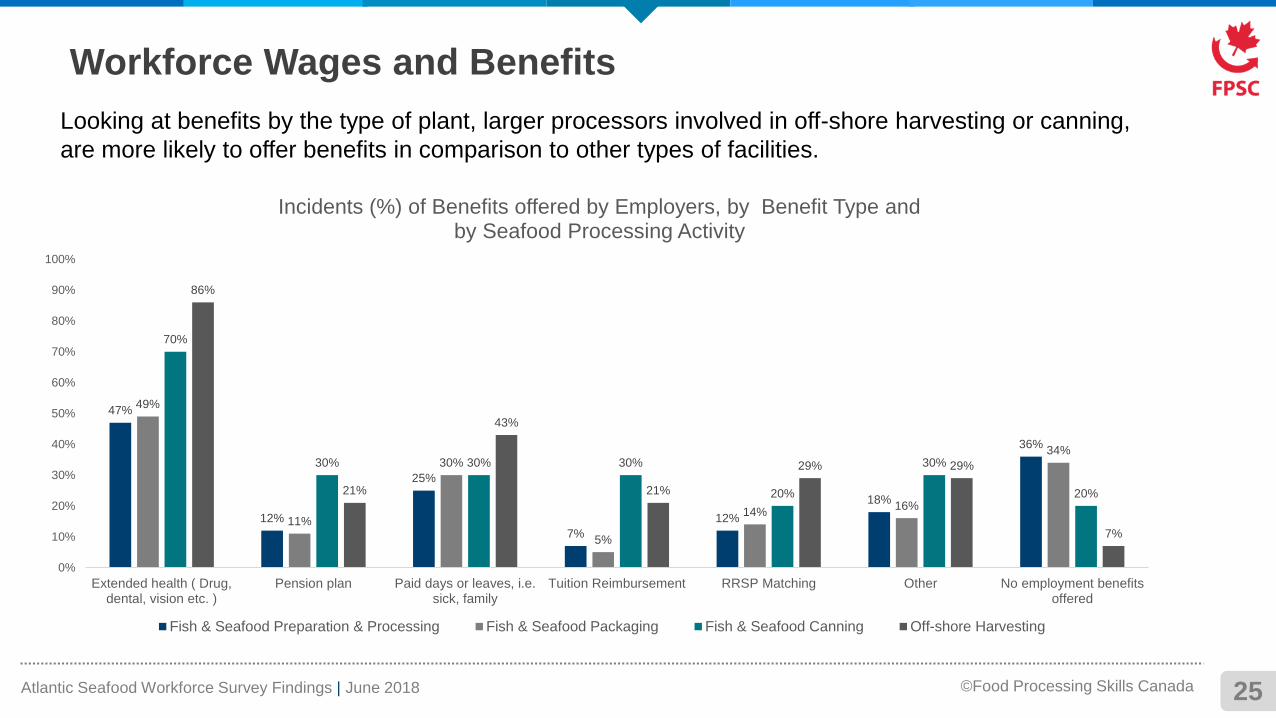
Looking at benefits by the type of plant, larger processors involved in off-shore harvesting or canning,
are more likely to offer benefits in comparison to other types of facilities.
Workforce Wages and Benefits
47%
12%
25%
7%
12%
18%
36%
49%
11%
30%
5%
14%16%
34%
70%
30% 30% 30%
20%
30%
20%
86%
21%
43%
21%
29% 29%
7%
0%
10%
20%
30%
40%
50%
60%
70%
80%
90%
100%
Extended health ( Drug,dental, vision etc. )
Pension plan Paid days or leaves, i.e.sick, family
Tuition Reimbursement RRSP Matching Other No employment benefitsoffered
Incidents (%) of Benefits offered by Employers, by Benefit Type andby Seafood Processing Activity
Fish & Seafood Preparation & Processing Fish & Seafood Packaging Fish & Seafood Canning Off-shore Harvesting
Atlantic Seafood Workforce Survey Findings | June 2018 ©Food Processing Skills Canada
Seafood Processors SurveyMethodology
▪ In total, n=100 Seafood processing employers participated in the survey administered by Ipsos.
▪ Data collection was conducted via a telephone (n=64) and online (n=36) surveys.
▪ The survey was fielded between December 30th, 2017 and April 23rd, 2018.
▪ The margin of error for a sample of n=100 is +/- 4.7%, nineteen times out of twenty. The margin of error will be greater for sub-groups depending on sample sizes.
▪ The average length of the survey was 21 minutes via telephone and 33 minutes via online.
▪ Respondents were screened to ensure that only those individuals who had detailed information about the people employed within the organization and the types of skills and qualifications required by the organization participated in the survey.
▪ The survey was conducted in both English and French, depending upon the preference of the respondent.
▪ Respondent contact information for the survey was provided by FPSC.
26