Atlantic County, NJ Substance Abuse Stats
11
New Jersey Drug and Alcohol Abuse Treatment Substance Abuse Overview 2014 Atlantic County Prepared by Limei Zhu Department of Human Services Division of Mental Health and Addiction Services Office of Planning, Research, Evaluation and Prevention Trenton, New Jersey May 2015
-
Upload
recoverycenternj -
Category
Health & Medicine
-
view
2 -
download
0
Transcript of Atlantic County, NJ Substance Abuse Stats

New Jersey Drug and Alcohol Abuse Treatment
Substance Abuse Overview 2014
Atlantic County
Prepared by Limei Zhu
Department of Human Services Division of Mental Health and Addiction Services
Office of Planning, Research, Evaluation and Prevention Trenton, New Jersey
May 2015

DEPARTMENT OF HUMAN SERVICES
DIVISION OF MENTAL HEALTH AND ADDICTION SERVICES 222 SOUTH WARREN STREET
PO BOX 700 TRENTON, NJ 08625 Elizabeth Connolly
Act Commissioner Chris Christie
Governor LYNN A. KOVICH
Assistant Commissioner May 2015
This statewide Substance Abuse Overview provides statistics on substance abuse treatment in New Jersey for calendar year 2014. In 2014 there were 65,553 treatment admissions and 62,525 discharges reported to the New Jersey Department of Human Services, Division of Mental Health and Addiction Services by substance abuse treatment providers. These reports were submitted through the web-based New Jersey Substance Abuse Monitoring System (NJ-SAMS). A few changes in this report now include on Fee-For-Services admissions, Federal Poverty Level and discharge continuing care.
Reports for individual counties include:
° Admissions for Substance Abuse Treatment by County of Residence ° Admissions for Substance Abuse Treatment by County of Treatment Provider ° Substance Abuse Admissions by Municipality and Primary Drug ° Substance Abuse Admissions by Primary Drug within Municipality ° Map for Number of Substance Abuse Admissions by Municipality of Residence ° Admissions by Municipality of Residence, Age Group and Primary Drug ° Admissions by Age Group, Gender and Primary Drug ° Discharges for Substance Abuse Treatment by County of Residence ° Discharges for Substance Abuse Treatment by County of Treatment Provider
If you have any questions about this report you may contact us by email at [email protected] or by telephone at (609) 292-8930. Sincerely,
Suzanne Borys, Ed. D., Assistant Division Director Office of Planning, Research, Evaluation and Prevention

New Jersey Substance Abuse Monitoring System (NJ-SAMS) Substance Abuse Treatment Admissions 1/1/2014-12/31/2014 Resident of Atlantic County Primary Drug** Highest School Grade Completed Alcohol 765 21% Completed High School 2,208 56% Heroin 1,759 48% Some College 522 13% Other Opiates 363 10% Cocaine 156 4% Employment Status Marijuana 554 15% Unemployed 1,411 36% Other Drugs 81 2% Student 96 2% Not in Labor Force 1,260 32% Intravenous Drug Users 1,637 42% Employed Full/Part Time 965 25% Not Assessed 189 5% Smoke Tobacco (Yes)** 2,890 79% Living Arrangement Level of Care Homeless 216 6% Outpatient Care (OP) 885 23% Dependent Living/Institution 352 9% Intensive Outpatient (IOP) 1,203 31% Independent Living 3,163 81% Partial Hospitalization 65 2% Opioid Maintenance OP 617 16% Marital Status Opioid Maintenance IOP 26 1% Single/Divorced 3,312 84% Extended Care 1 0% Married/Civil Union 396 10% Halfway House 91 2% Widowed 47 1% Long-Term Residential 255 7% Separated 166 4% Short-Term Residential 350 9% Hospital Based Residential 0 0% Legal Problem* Detox Residential 404 10% None 1,177 30% Detox Hospital 1 0% Case Pending 336 9% Detox Outpatient Non-Methadone 0 0% Probation/Parole 994 25% Detox Outpatient Methadone 0 0% DWI License Suspension 397 10% Non-traditional Program 0 0% Drug Court 451 12% Early Prevention 23 1% DCCP (DYFS)/Family Court 502 13% Other 114 3% Medication Assisted Therapy Planned in Treatment Methadone 768 20% Arrest in the Last 30 Days (Yes) 129 3% Suboxone 243 6% Special Population* Referral Source DCCP (DYFS)/CPSAI 578 15% Self-referral 1,050 27% DWI/DUI 707 18% Family/Friend 139 4% Developmental Disability 14 0% Addiction Services Program 480 12% Blind and Visually Impaired 6 0% Workforce NJ SAI 203 5% Deaf and Hard of Hearing 11 0% DCCP (formerly DYFS) 225 6% Mental Health 40 1% Federal Poverty Level (0-133%)** 3,007 90% Criminal Justice 1,027 26% IDRC 382 10% Health Insurance at Admission* Other/Not Assessed 361 9% No Insurance 2,361 60% Medicaid 1,110 28% Sex Medicare 63 2% Male 2,530 65% Private Insurance 439 11% Female 1,384 35% Other Insurance 89 2% Age at Admission Treated in County of Residence 2,915 74% Under 18 73 2% 18-21 274 7% County Where Patient Was Treated 22-24 493 13% Atlantic 2,915 74% Middlesex 8 0% 25-29 798 20% Bergen 25 1% Monmouth 123 3% 30-34 607 15% Burlington 5 0% Morris 2 0% 35-44 738 19% Camden 34 1% Ocean 9 0% 45-54 704 18% Cape May 18 0% Passaic 215 5% 55 and over 234 6% Cumberland 100 3% Salem 0 0% Essex 63 2% Somerset 11 0% Race/Ethnicity Gloucester 243 6% Sussex 69 2% White (non-Hispanic) 2,418 62% Hudson 40 1% Union 1 0% Black (non-Hispanic) 920 23% Hunterdon 8 0% Warren 0 0% Hispanic Origin 511 13% Mercer 32 1% Other 0 0% Other 72 2% Fee For Service Admissions 1,673 43% Total Admissions = 3,921 Fee For Service Unique Clients 1,126 41% Unduplicated Clients Admitted = 2,760 *Totals may be greater than 100% because of multiple responses. **Percentage calculations excluded missing values.

New Jersey Substance Abuse Monitoring System (NJ-SAMS) Substance Abuse Treatment Admissions 1/1/2014-12/31/2014 Treatment Site in Atlantic County Primary Drug** Highest School Grade Completed Alcohol 1,026 22% Completed High School 2,959 61% Heroin 2,212 48% Some College 535 11% Other Opiates 417 9% Cocaine 201 4% Employment Status Marijuana 592 13% Unemployed 1,493 31% Other Drugs 111 2% Student 162 3% Not in Labor Force 1,582 33% Intravenous Drug Users 1,894 39% Employed Full/Part Time 1,426 30% Not Assessed 155 3% Smoke Tobacco (Yes)** 3,561 78% Living Arrangement Level of Care Homeless 211 4% Outpatient Care (OP) 1,021 21% Dependent Living/Institution 563 12% Intensive Outpatient (IOP) 1,440 30% Independent Living 3,887 81% Partial Hospitalization 215 4% Opioid Maintenance OP 701 15% Marital Status Opioid Maintenance IOP 31 1% Single/Divorced 4,009 83% Extended Care 2 0% Married/Civil Union 582 12% Halfway House 188 4% Widowed 50 1% Long-Term Residential 539 11% Separated 177 4% Short-Term Residential 129 3% Hospital Based Residential 0 0% Legal Problem* Detox Residential 525 11% None 1,443 30% Detox Hospital 0 0% Case Pending 484 10% Detox Outpatient Non-Methadone 0 0% Probation/Parole 1,351 28% Detox Outpatient Methadone 1 0% DWI License Suspension 525 11% Non-traditional Program 0 0% Drug Court 758 16% Early Prevention 26 1% DCCP (DYFS)/Family Court 494 10% Other 123 3% Medication Assisted Therapy Planned in Treatment Methadone 931 19% Arrest in the Last 30 Days (Yes) 188 4% Suboxone 473 10% Special Population* Referral Source DCCP (DYFS)/CPSAI 585 12% Self-referral 1,340 28% DWI/DUI 817 17% Family/Friend 225 5% Developmental Disability 16 0% Addiction Services Program 497 10% Blind and Visually Impaired 7 0% Workforce NJ SAI 183 4% Deaf and Hard of Hearing 16 0% DCPP (formerly DYFS) 234 5% Mental Health 36 1% Federal Poverty Level (0-133%)** 3,097 90% Criminal Justice 1,335 28% IDRC 506 11% Health Insurance at Admission* Other/Not Assessed 448 9% No Insurance 2,774 58% Medicaid 1,008 21% Sex Medicare 57 1% Male 3,149 65% Private Insurance 1,028 21% Female 1,664 35% Other Insurance 125 3% Age at Admission Treated in County of Residence 2,915 61% Under 18 144 3% 18-21 454 9% County of Residence 22-24 692 14% Atlantic 2,915 61% Middlesex 31 1% 25-29 927 19% Bergen 49 1% Monmouth 79 2% 30-34 695 14% Burlington 104 2% Morris 32 1% 35-44 874 18% Camden 313 6% Ocean 385 8% 45-54 772 16% Cape May 201 4% Passaic 64 1% 55 and over 260 5% Cumberland 175 4% Salem 43 1% Essex 27 1% Somerset 10 0% Race/Ethnicity Gloucester 207 4% Sussex 13 0% White (non-Hispanic) 3,224 67% Hudson 17 0% Union 32 1% Black (non-Hispanic) 944 20% Hunterdon 5 0% Warren 8 0% Hispanic Origin 563 12% Mercer 33 1% Other 75 2% Other 87 2% Fee For Service Admissions 1,807 38% Total Admissions = 4,818 Fee For Service Unique Client 1,216 31% Unduplicated Clients Admitted = 3,927 *Totals may be greater than 100% because of multiple responses. **Percentage calculation excluded missing values.

Substance Abuse Admissions by Municipality and Primary Drug 2014 NJ Resident Admissions
Primary Drug Alcohol Cocaine/
Crack Heroin Other
Opiates Marijuana/ Hashish
Other Drugs
Unknown Total Atlantic County
N % N % N % N % N % N % N % N % Absecon City 29 4 12 8 102 6 25 7 14 3 5 6 7 3 194 5Atlantic City 140 18 65 42 557 32 66 18 249 45 27 33 60 25 1164 30Brigantine City 27 4 1 1 64 4 10 3 4 1 4 5 6 3 116 3Buena Boro 10 1 1 1 7 0 2 1 3 1 1 1 24 1Buena Vista Twp 4 1 3 2 9 1 2 1 1 0 2 2 2 1 23 1Corbin City 2 0 2 0Egg Harbor City 40 5 3 2 77 4 16 4 20 4 6 7 11 5 173 4Egg Harbor Twp 119 16 17 11 209 12 58 16 59 11 9 11 36 15 507 13Estelle Manor City 8 1 5 0 6 2 19 0Folsom Boro 3 0 1 1 6 0 1 0 2 2 13 0Galloway Twp 56 7 3 2 121 7 44 12 33 6 3 4 25 10 285 7Hamilton Twp 59 8 4 3 78 4 30 8 25 5 3 4 14 6 213 5Hammonton Town 51 7 5 3 76 4 17 5 16 3 4 5 7 3 176 4Linwood City 7 1 1 1 15 1 9 2 2 0 2 2 4 2 40 1Longport Boro 2 0 6 0 1 1 9 0Margate City 11 1 19 1 9 2 1 0 4 2 44 1Mullica Twp 5 1 1 1 5 0 1 0 12 0Northfield City 25 3 2 1 42 2 6 2 8 1 3 4 16 7 102 3Pleasantville City 44 6 11 7 91 5 12 3 67 12 1 1 8 3 234 6Port Republic City 4 1 15 1 2 1 1 0 22 1Somers Point City 40 5 9 6 79 4 17 5 22 4 3 4 13 5 183 5Ventnor City 39 5 13 8 77 4 12 3 14 3 1 1 10 4 166 4Weymouth Twp 3 0 1 0 1 0 5 0Not Stated 37 5 4 3 98 6 22 6 16 3 4 5 14 6 195 5Total 765 100 156 100 1759 100 366 100 554 100 81 100 240 100 3921 100

Substance Abuse Admissions by Primary Drug within Municipality 2014 NJ Resident Admissions
Primary Drug Alcohol Cocaine/
Crack Heroin Other
Opiates Marijuana/ Hashish
Other Drugs
Unknown Total Atlantic County
N % N % N % N % N % N % N % N % Absecon City 29 15 12 6 102 53 25 13 14 7 5 3 7 4 194 100Atlantic City 140 12 65 6 557 48 66 6 249 21 27 2 60 5 1164 100Brigantine City 27 23 1 1 64 55 10 9 4 3 4 3 6 5 116 100Buena Boro 10 42 1 4 7 29 2 8 3 13 1 4 24 100Buena Vista Twp 4 17 3 13 9 39 2 9 1 4 2 9 2 9 23 100Corbin City 2 100 2 100Egg Harbor City 40 23 3 2 77 45 16 9 20 12 6 3 11 6 173 100Egg Harbor Twp 119 23 17 3 209 41 58 11 59 12 9 2 36 7 507 100Estelle Manor City 8 42 5 26 6 32 19 100Folsom Boro 3 23 1 8 6 46 1 8 2 15 13 100Galloway Twp 56 20 3 1 121 42 44 15 33 12 3 1 25 9 285 100Hamilton Twp 59 28 4 2 78 37 30 14 25 12 3 1 14 7 213 100Hammonton Town 51 29 5 3 76 43 17 10 16 9 4 2 7 4 176 100Linwood City 7 18 1 3 15 38 9 23 2 5 2 5 4 10 40 100Longport Boro 2 22 6 67 1 11 9 100Margate City 11 25 19 43 9 20 1 2 4 9 44 100Mullica Twp 5 42 1 8 5 42 1 8 12 100Northfield City 25 25 2 2 42 41 6 6 8 8 3 3 16 16 102 100Pleasantville City 44 19 11 5 91 39 12 5 67 29 1 0 8 3 234 100Port Republic City 4 18 15 68 2 9 1 5 22 100Somers Point City 40 22 9 5 79 43 17 9 22 12 3 2 13 7 183 100Ventnor City 39 23 13 8 77 46 12 7 14 8 1 1 10 6 166 100Weymouth Twp 3 60 1 20 1 20 5 100Not Stated 37 19 4 2 98 50 22 11 16 8 4 2 14 7 195 100Total 765 20 156 4 1759 45 366 9 554 14 81 2 240 6 3921 100

HAMILTON TWPGALLOWAY TWP
EGG HARBOR TWP ATLANTIC CITY
EGG HARBOR TWP
PLEASANTVILLE CITY
EGG HARBOR TWP
2014 Atlantic County Substance Abuse Admissions by Municipality of Residence
LegendAtlCOUNT
2 - 4445 - 116117 - 285286 - 507508 - 1164
Top Five Municipalities1 Atlantic City 11642 Egg Harbor Township 5073 Galloway Township 2854 Pleasantville City 2345 Hamilton Township 213
Data: NJSAMS 2015 February DownloadReport Date: May, 2015
NJ Department of Human Services Division of Mental Health and Addiction Services Research, Planning and Evaluation Unit¹ 0 1 2 30.5
Miles

Admissions by Municipality of Residence, Age Group and Primary Drug 2014 NJ Resident Admissions
Alcohol Drugs Total 18 & Over Under
18 Total 18 & Over Under
18 Total 18 & Over Under
18 Total
Atlantic County
N % N % N % N % N % N % N % N % N % Absecon City 29 100 29 100 156 99 2 1 158 100 185 99 2 1 187 100Atlantic City 140 100 140 100 960 100 4 0 964 100 1100 100 4 0 1104 100Brigantine City 27 100 27 100 82 99 1 1 83 100 109 99 1 1 110 100Buena Boro 10 100 10 100 12 86 2 14 14 100 22 92 2 8 24 100Buena Vista Twp 4 100 4 100 17 100 17 100 21 100 21 100Corbin City 2 100 2 100 2 100 2 100Egg Harbor City 39 98 1 3 40 100 118 97 4 3 122 100 157 97 5 3 162 100Egg Harbor Twp 119 100 119 100 333 95 19 5 352 100 452 96 19 4 471 100Estelle Manor City 8 100 8 100 11 100 11 100 19 100 19 100
Folsom Boro 3 100 3 100 10 100 10 100 13 100 13 100Galloway Twp 55 98 1 2 56 100 203 100 1 0 204 100 258 99 2 1 260 100Hamilton Twp 59 100 59 100 137 98 3 2 140 100 196 98 3 2 199 100Hammonton Town 51 100 51 100 111 94 7 6 118 100 162 96 7 4 169 100
Linwood City 7 100 7 100 29 100 29 100 36 100 36 100Longport Boro 2 100 2 100 7 100 7 100 9 100 9 100Margate City 11 100 11 100 28 97 1 3 29 100 39 98 1 3 40 100Mullica Twp 5 100 5 100 6 100 6 100 11 100 11 100Northfield City 25 100 25 100 56 92 5 8 61 100 81 94 5 6 86 100Pleasantville City 44 100 44 100 173 95 9 5 182 100 217 96 9 4 226 100Port Republic City 4 100 4 100 17 100 17 100 21 100 21 100
Somers Point City 40 100 40 100 122 94 8 6 130 100 162 95 8 5 170 100Ventnor City 38 97 1 3 39 100 116 99 1 1 117 100 154 99 2 1 156 100Weymouth Twp 3 100 3 100 1 100 1 100 4 100 4 100 Not Stated 36 97 1 3 37 100 143 99 1 1 144 100 179 99 2 1 181 100Total 761 99 4 1 765 100 2848 98 68 2 2916 100 3609 98 72 2 3681 100* Missing primary drug or age admissions are not included.

Admissions by Age Group, Gender and Primary Drug 2014 NJ Resident Admissions
Gender Female Male
Total* Atlantic
N % N % N % Alcohol 3 75.0 1 25.0 4 100.0Heroin 1 25.0 3 75.0 4 100.0Other Opiates 3 75.0 1 25.0 4 100.0Marijuana/Hashish 6 10.2 53 89.8 59 100.0Other Drugs 1 100.0 1 100.0Unknown 1 100.0 1 100.0
0-17
Total* 14 19.2 59 80.8 73 100.0Alcohol 20 35.1 37 64.9 57 100.0Heroin 153 43.6 198 56.4 351 100.0Other Opiates 42 42.0 58 58.0 100 100.0Marijuana/Hashish 51 28.7 127 71.3 178 100.0Other Drugs 12 44.4 15 55.6 27 100.0Unknown 17 32.1 36 67.9 53 100.0
18-24
Total* 295 38.5 471 61.5 766 100.0Alcohol 204 31.5 444 68.5 648 100.0Heroin 486 35.2 893 64.8 1379 100.0Other Opiates 115 44.4 144 55.6 259 100.0Marijuana/Hashish 106 33.7 209 66.3 315 100.0Other Drugs 89 44.7 110 55.3 199 100.0Unknown 56 30.4 128 69.6 184 100.0
25-59
Total* 1056 35.4 1928 64.6 2984 100.0Alcohol 10 18.5 44 81.5 54 100.0Heroin 4 19.0 17 81.0 21 100.0Other Opiates 3 100.0 3 100.0Marijuana/Hashish 1 100.0 1 100.0Other Drugs 3 30.0 7 70.0 10 100.0Unknown 2 100.0 2 100.0
60&Over
Total* 19 20.9 72 79.1 91 100.0Alcohol 237 31.1 526 68.9 763 100.0Heroin 644 36.7 1111 63.3 1755 100.0Other Opiates 160 43.7 206 56.3 366 100.0Marijuana/Hashish 163 29.5 390 70.5 553 100.0Other Drugs 104 43.9 133 56.1 237 100.0Unknown 76 31.7 164 68.3 240 100.0
Total*
Total* 1384 35.4 2530 64.6 3914 100.0* Unknown age or gender admissions are not included.
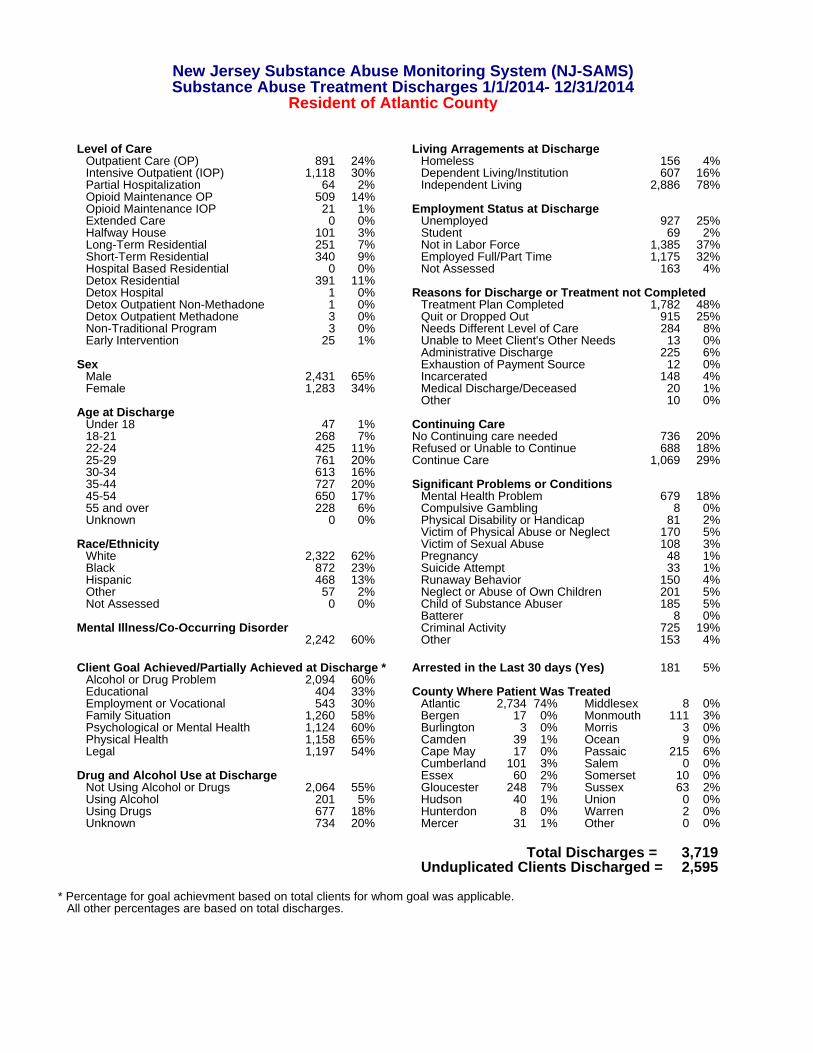
New Jersey Substance Abuse Monitoring System (NJ-SAMS) Substance Abuse Treatment Discharges 1/1/2014- 12/31/2014 Resident of Atlantic County Level of Care Living Arragements at Discharge Outpatient Care (OP) 891 24% Homeless 156 4% Intensive Outpatient (IOP) 1,118 30% Dependent Living/Institution 607 16% Partial Hospitalization 64 2% Independent Living 2,886 78% Opioid Maintenance OP 509 14% Opioid Maintenance IOP 21 1% Employment Status at Discharge Extended Care 0 0% Unemployed 927 25% Halfway House 101 3% Student 69 2% Long-Term Residential 251 7% Not in Labor Force 1,385 37% Short-Term Residential 340 9% Employed Full/Part Time 1,175 32% Hospital Based Residential 0 0% Not Assessed 163 4% Detox Residential 391 11% Detox Hospital 1 0% Reasons for Discharge or Treatment not Completed Detox Outpatient Non-Methadone 1 0% Treatment Plan Completed 1,782 48% Detox Outpatient Methadone 3 0% Quit or Dropped Out 915 25% Non-Traditional Program 3 0% Needs Different Level of Care 284 8% Early Intervention 25 1% Unable to Meet Client's Other Needs 13 0% Administrative Discharge 225 6% Sex Exhaustion of Payment Source 12 0% Male 2,431 65% Incarcerated 148 4% Female 1,283 34% Medical Discharge/Deceased 20 1% Other 10 0% Age at Discharge Under 18 47 1% Continuing Care 18-21 268 7% No Continuing care needed 736 20% 22-24 425 11% Refused or Unable to Continue 688 18% 25-29 761 20% Continue Care 1,069 29% 30-34 613 16% 35-44 727 20% Significant Problems or Conditions 45-54 650 17% Mental Health Problem 679 18% 55 and over 228 6% Compulsive Gambling 8 0% Unknown 0 0% Physical Disability or Handicap 81 2% Victim of Physical Abuse or Neglect 170 5% Race/Ethnicity Victim of Sexual Abuse 108 3% White 2,322 62% Pregnancy 48 1% Black 872 23% Suicide Attempt 33 1% Hispanic 468 13% Runaway Behavior 150 4% Other 57 2% Neglect or Abuse of Own Children 201 5% Not Assessed 0 0% Child of Substance Abuser 185 5% Batterer 8 0% Mental Illness/Co-Occurring Disorder Criminal Activity 725 19% 2,242 60% Other 153 4% Client Goal Achieved/Partially Achieved at Discharge * Arrested in the Last 30 days (Yes) 181 5% Alcohol or Drug Problem 2,094 60% Educational 404 33% County Where Patient Was Treated Employment or Vocational 543 30% Atlantic 2,734 74% Middlesex 8 0% Family Situation 1,260 58% Bergen 17 0% Monmouth 111 3% Psychological or Mental Health 1,124 60% Burlington 3 0% Morris 3 0% Physical Health 1,158 65% Camden 39 1% Ocean 9 0% Legal 1,197 54% Cape May 17 0% Passaic 215 6% Cumberland 101 3% Salem 0 0% Drug and Alcohol Use at Discharge Essex 60 2% Somerset 10 0% Not Using Alcohol or Drugs 2,064 55% Gloucester 248 7% Sussex 63 2% Using Alcohol 201 5% Hudson 40 1% Union 0 0% Using Drugs 677 18% Hunterdon 8 0% Warren 2 0% Unknown 734 20% Mercer 31 1% Other 0 0% Total Discharges = 3,719 Unduplicated Clients Discharged = 2,595 * Percentage for goal achievment based on total clients for whom goal was applicable. All other percentages are based on total discharges.
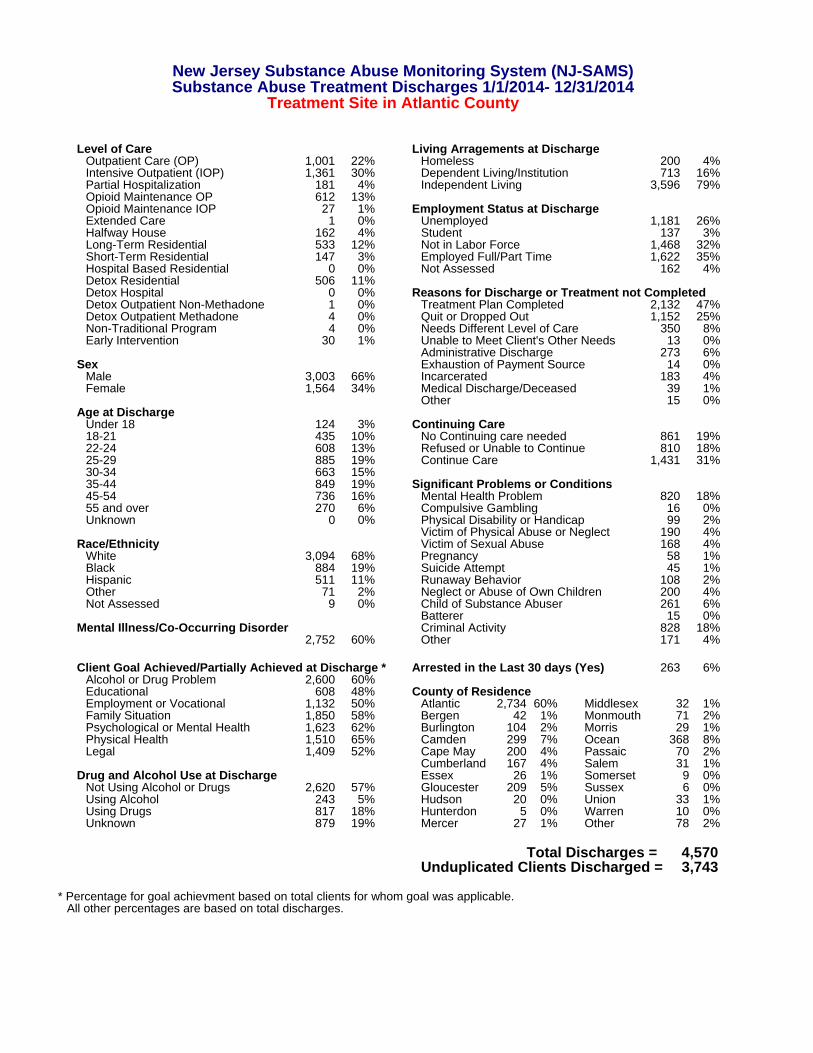
New Jersey Substance Abuse Monitoring System (NJ-SAMS) Substance Abuse Treatment Discharges 1/1/2014- 12/31/2014 Treatment Site in Atlantic County Level of Care Living Arragements at Discharge Outpatient Care (OP) 1,001 22% Homeless 200 4% Intensive Outpatient (IOP) 1,361 30% Dependent Living/Institution 713 16% Partial Hospitalization 181 4% Independent Living 3,596 79% Opioid Maintenance OP 612 13% Opioid Maintenance IOP 27 1% Employment Status at Discharge Extended Care 1 0% Unemployed 1,181 26% Halfway House 162 4% Student 137 3% Long-Term Residential 533 12% Not in Labor Force 1,468 32% Short-Term Residential 147 3% Employed Full/Part Time 1,622 35% Hospital Based Residential 0 0% Not Assessed 162 4% Detox Residential 506 11% Detox Hospital 0 0% Reasons for Discharge or Treatment not Completed Detox Outpatient Non-Methadone 1 0% Treatment Plan Completed 2,132 47% Detox Outpatient Methadone 4 0% Quit or Dropped Out 1,152 25% Non-Traditional Program 4 0% Needs Different Level of Care 350 8% Early Intervention 30 1% Unable to Meet Client's Other Needs 13 0% Administrative Discharge 273 6% Sex Exhaustion of Payment Source 14 0% Male 3,003 66% Incarcerated 183 4% Female 1,564 34% Medical Discharge/Deceased 39 1% Other 15 0% Age at Discharge Under 18 124 3% Continuing Care 18-21 435 10% No Continuing care needed 861 19% 22-24 608 13% Refused or Unable to Continue 810 18% 25-29 885 19% Continue Care 1,431 31% 30-34 663 15% 35-44 849 19% Significant Problems or Conditions 45-54 736 16% Mental Health Problem 820 18% 55 and over 270 6% Compulsive Gambling 16 0% Unknown 0 0% Physical Disability or Handicap 99 2% Victim of Physical Abuse or Neglect 190 4% Race/Ethnicity Victim of Sexual Abuse 168 4% White 3,094 68% Pregnancy 58 1% Black 884 19% Suicide Attempt 45 1% Hispanic 511 11% Runaway Behavior 108 2% Other 71 2% Neglect or Abuse of Own Children 200 4% Not Assessed 9 0% Child of Substance Abuser 261 6% Batterer 15 0% Mental Illness/Co-Occurring Disorder Criminal Activity 828 18% 2,752 60% Other 171 4% Client Goal Achieved/Partially Achieved at Discharge * Arrested in the Last 30 days (Yes) 263 6% Alcohol or Drug Problem 2,600 60% Educational 608 48% County of Residence Employment or Vocational 1,132 50% Atlantic 2,734 60% Middlesex 32 1% Family Situation 1,850 58% Bergen 42 1% Monmouth 71 2% Psychological or Mental Health 1,623 62% Burlington 104 2% Morris 29 1% Physical Health 1,510 65% Camden 299 7% Ocean 368 8% Legal 1,409 52% Cape May 200 4% Passaic 70 2% Cumberland 167 4% Salem 31 1% Drug and Alcohol Use at Discharge Essex 26 1% Somerset 9 0% Not Using Alcohol or Drugs 2,620 57% Gloucester 209 5% Sussex 6 0% Using Alcohol 243 5% Hudson 20 0% Union 33 1% Using Drugs 817 18% Hunterdon 5 0% Warren 10 0% Unknown 879 19% Mercer 27 1% Other 78 2% Total Discharges = 4,570 Unduplicated Clients Discharged = 3,743 * Percentage for goal achievment based on total clients for whom goal was applicable. All other percentages are based on total discharges.