
Atlanta Geological Society...
21
Atlanta Geological Society Newsletter ODDS AND ENDS Dear AGS members, I hope you have enjoyed the summer and the eclipse. It is rare that the totality is so close to where we live. As we march to fall, I would like to highlight a few activities for the Society. Sometimes a realization is just the recognition of the obvious. When we were working on the revamped website and saw the picture of the Atlanta skyline, I thought why don’t we focus a part of our time over the next several years on Atlanta, Atlanta area and Georgia geology. There is a new tunnel being drilled in town. Perhaps someone knows someone who has done the geotech work on these newer large structures, including the new stadium? As fascinating as I found the climate/geology talk by Dr. Cobb, we ought to focus part of our time on the geology of our home town and home state. For many years, as I composed the newsletter, I would notice that Earth Science Week was in two weeks and there wasn’t time to participate as an organization. This year, I can do something about that. Earth Science Week is October 8-14 and the theme this year is Earth and Human Activity. There is a fieldtrip from nearly 10 years ago that examines the geology and hydrogeology of Lawrenceville developed by the USGS. I propose we run that field trip October 14. Its relatively local, using local resources and ties us into the bigger national celebration. More in the coming months. https://www.earthsciweek.org/about-esw Also check out the coming speakers on Pg. 4. Ben Bentkowski AGS President August Meeting Join us Tuesday, August 29, 2017 at the Fernbank Museum of Natural History, 760 Clifton Road NE, Atlanta GA. The meeting/dinner starts at 6:30 pm and the meeting starts approximately 7 p.m. This month’s presentation is: “The Carolina Sandhills of the Southeastern United States: Eolian Sand Sheets and Dunes that Were Active During the Last Glaciation”presenterd by Dr. Chris Swezey. Please find more information about Dr. Swezey’s bio on page 4 of the newsletter. Please come out, enjoy a bite to eat, the camaraderie, an interesting presentation and perhaps some discussion on the importance of accurate mineral characterization. Also, the differences that can exist between mineralogical, industrial and regulatory definitions for minerals. Keep up todate with the AGS at: www.atlantageologicalsociety.org or at Facebook facebook.com/Atlanta-Geological- Society
Transcript of Atlanta Geological Society...
Atlanta Geological Society Newsletter
ODDS AND ENDS Dear AGS members,
I hope you have enjoyed the summer and the eclipse.
It is rare that the totality is so close to where we live.
As we march to fall, I would like to highlight a few
activities for the Society. Sometimes a realization is
just the recognition of the obvious. When we were
working on the revamped website and saw the
picture of the Atlanta skyline, I thought why don’t
we focus a part of our time over the next several
years on Atlanta, Atlanta area and Georgia geology.
There is a new tunnel being drilled in town. Perhaps
someone knows someone who has done the geotech
work on these newer large structures, including the
new stadium? As fascinating as I found the
climate/geology talk by Dr. Cobb, we ought to focus
part of our time on the geology of our home town
and home state.
For many years, as I composed the newsletter, I
would notice that Earth Science Week was in two
weeks and there wasn’t time to participate as an
organization. This year, I can do something about
that. Earth Science Week is October 8-14 and the
theme this year is Earth and Human Activity. There
is a fieldtrip from nearly 10 years ago that examines
the geology and hydrogeology of Lawrenceville
developed by the USGS. I propose we run that field
trip October 14. Its relatively local, using local
resources and ties us into the bigger national
celebration. More in the coming months.
https://www.earthsciweek.org/about-esw Also check
out the coming speakers on Pg. 4.
Ben Bentkowski AGS President
August Meeting
Join us Tuesday, August 29, 2017 at the
Fernbank Museum of Natural History, 760
Clifton Road NE, Atlanta GA. The
meeting/dinner starts at 6:30 pm and the
meeting starts approximately 7 p.m.
This month’s presentation is: “The
Carolina Sandhills of the Southeastern
United States: Eolian Sand Sheets and
Dunes that Were Active During the Last
Glaciation”presenterd by Dr. Chris
Swezey. Please find more information
about Dr. Swezey’s bio on page 4 of the
newsletter.
Please come out, enjoy a bite to eat, the
camaraderie, an interesting presentation and
perhaps some discussion on the importance
of accurate mineral characterization. Also,
the differences that can exist between
mineralogical, industrial and regulatory
definitions for minerals.
Keep up todate with the AGS at:
www.atlantageologicalsociety.org
or at Facebook
facebook.com/Atlanta-Geological-
Society
Page 2 AGS August 2017
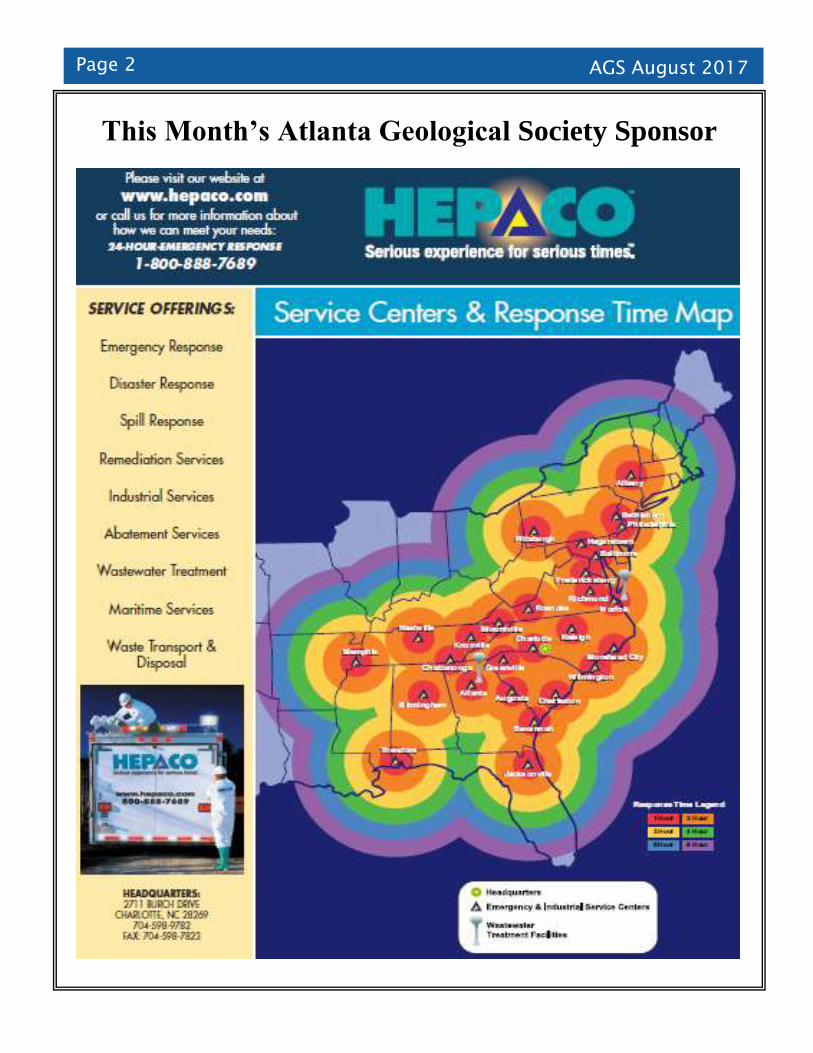
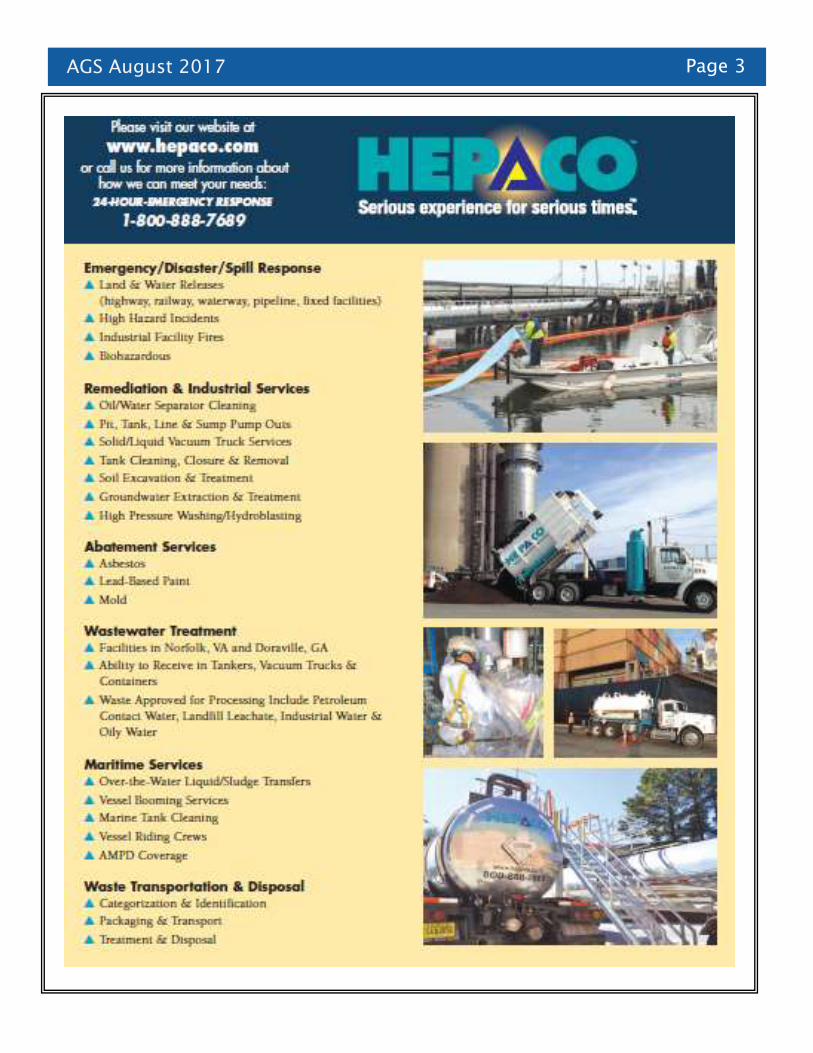
This Month’s Atlanta Geological Society Sponsor
AGS August 2017 Page 3
Page 4 AGS August 2017
This Month’s Atlanta Geological Society Speaker
Our Speaker for this coming Tuesday will be Dr. Chris Swezey of the USGS. His current research and presentation
will be on “The Carolina Sandhills of the Southeastern United States: Eolian Sand Sheets and Dunes that Were
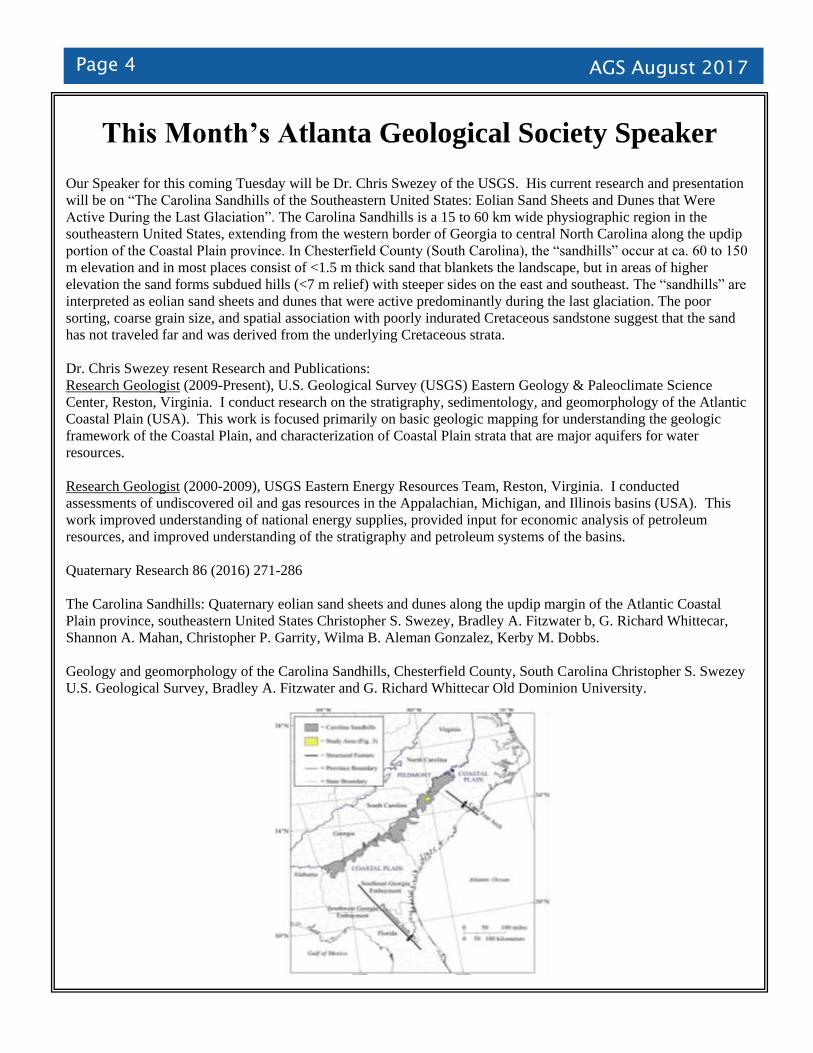
Active During the Last Glaciation”. The Carolina Sandhills is a 15 to 60 km wide physiographic region in the
southeastern United States, extending from the western border of Georgia to central North Carolina along the updip
portion of the Coastal Plain province. In Chesterfield County (South Carolina), the “sandhills” occur at ca. 60 to 150
m elevation and in most places consist of <1.5 m thick sand that blankets the landscape, but in areas of higher
elevation the sand forms subdued hills (<7 m relief) with steeper sides on the east and southeast. The “sandhills” are
interpreted as eolian sand sheets and dunes that were active predominantly during the last glaciation. The poor
sorting, coarse grain size, and spatial association with poorly indurated Cretaceous sandstone suggest that the sand
has not traveled far and was derived from the underlying Cretaceous strata.
Dr. Chris Swezey resent Research and Publications:
Research Geologist (2009-Present), U.S. Geological Survey (USGS) Eastern Geology & Paleoclimate Science
Center, Reston, Virginia. I conduct research on the stratigraphy, sedimentology, and geomorphology of the Atlantic
Coastal Plain (USA). This work is focused primarily on basic geologic mapping for understanding the geologic
framework of the Coastal Plain, and characterization of Coastal Plain strata that are major aquifers for water
resources.
Research Geologist (2000-2009), USGS Eastern Energy Resources Team, Reston, Virginia. I conducted
assessments of undiscovered oil and gas resources in the Appalachian, Michigan, and Illinois basins (USA). This
work improved understanding of national energy supplies, provided input for economic analysis of petroleum
resources, and improved understanding of the stratigraphy and petroleum systems of the basins.
Quaternary Research 86 (2016) 271-286
The Carolina Sandhills: Quaternary eolian sand sheets and dunes along the updip margin of the Atlantic Coastal
Plain province, southeastern United States Christopher S. Swezey, Bradley A. Fitzwater b, G. Richard Whittecar,
Shannon A. Mahan, Christopher P. Garrity, Wilma B. Aleman Gonzalez, Kerby M. Dobbs.
Geology and geomorphology of the Carolina Sandhills, Chesterfield County, South Carolina Christopher S. Swezey
U.S. Geological Survey, Bradley A. Fitzwater and G. Richard Whittecar Old Dominion University.
AGS August 2017 Page 5
Continental Patterns of Submarine Groundwater Discharge Reveal
Coastal Vulnerabilities
Abstract
Submarine groundwater discharge (SGD) delivers water and dissolved chemicals from continents to oceans, and its spatial
distribution affects coastal water quality. Unlike rivers, SGD is broadly distributed and relatively difficult to measure,
especially at continental scales. We present spatially resolved estimates of fresh (land-derived) SGD for the contiguous
United States based on historical climate records and high-resolution hydrographic data. Climate controls regional patterns
in fresh SGD, while coastal drainage geometry imparts strong local variability. Because the recharge zones that contribute
fresh SGD are densely populated, the quality and quantity of fresh SGD are both vulnerable to anthropogenic disturbance.
Our analysis unveils hot spots for contaminant discharge to marine waters and saltwater intrusion into coastal aquifers.
Submarine groundwater discharge (SGD) influences global geochemical cycles and coastal water quality by delivering
chemical compounds and dissolved ions from land to sea. SGD includes two primary components: fresh, land-derived
groundwater that infiltrates on land, and salty, ocean-derived groundwater that infiltrates offshore and returns to the sea.
Although small in volume, fresh SGD exports naturally derived elements such as calcium and silicate at rates that rival
those of rivers. Fresh SGD is sensitive to human disturbance, and mixtures of fresh and saline SGD transport nutrients and
other contaminants offshore. Therefore, the spatial distribution of fresh SGD has a direct impact on patterns of coastal
water quality. High rates of nutrient-rich SGD, for example, contribute to harmful algal blooms and hypoxia. SGD patterns
also influence ocean temperature and alkalinity, which are key controls on marine ecological and biogeochemical
processes.
To understand the influence of fresh SGD on biogeochemical cycles and coastal water quality, rate assessments are needed
at global and local scales. However, fresh SGD is difficult and costly to measure, and observations are scarce. Fresh SGD
is heterogeneous and diffuse, unlike river discharge, which is concentrated at discrete and readily measurable points along
the coast. Although many techniques exist to measure fresh SGD, most measurements are focused on a handful of well-
studied, easily accessible locations. The majority of these locations are on the Atlantic coast of the United States (Figure.
1). In the absence of measurements, water budgets have been used to map fresh SGD at high resolution over small coastal
regions and low resolution across the global oceans. These disparate scales of analysis leave critical gaps in our
understanding of SGD. High-resolution estimates are needed across large regions to reveal relationships among climate,
geology, and SGD and to identify where coastal water resources are vulnerable to degradation.
Here, we present high-resolution continental-scale estimates of fresh SGD across the contiguous United States. Our
estimates are based on a simple water budget analysis and state-of-the-art continental-scale hydrography and climate data
sets. Recharge zones, or contributing areas, for fresh SGD are defined with high-resolution hydrographic data. We assume
that recharge zones are the wedge-shaped land areas outside stream catchments where water flows directly to the coast
(Figure. 2, inset). We then assume that recharge across these coastal catchments is the component of precipitation that
infiltrates and would become base flow to a stream, if a stream were present, but instead flows to the coast. This recharge
rate is derived from three decades of reanalysis of climatic data.
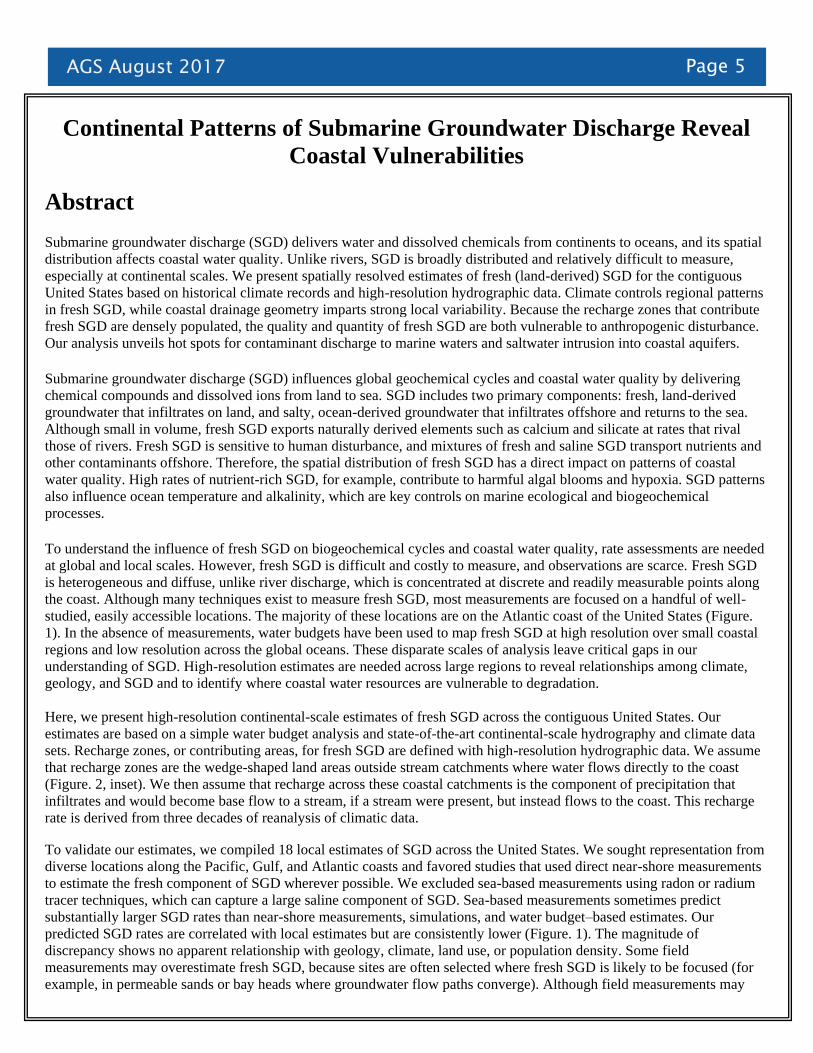
To validate our estimates, we compiled 18 local estimates of SGD across the United States. We sought representation from
diverse locations along the Pacific, Gulf, and Atlantic coasts and favored studies that used direct near-shore measurements
to estimate the fresh component of SGD wherever possible. We excluded sea-based measurements using radon or radium
tracer techniques, which can capture a large saline component of SGD. Sea-based measurements sometimes predict
substantially larger SGD rates than near-shore measurements, simulations, and water budget–based estimates. Our
predicted SGD rates are correlated with local estimates but are consistently lower (Figure. 1). The magnitude of
discrepancy shows no apparent relationship with geology, climate, land use, or population density. Some field
measurements may overestimate fresh SGD, because sites are often selected where fresh SGD is likely to be focused (for
example, in permeable sands or bay heads where groundwater flow paths converge). Although field measurements may
Page 6 AGS August 2017
Continental Patterns of Submarine Groundwater Discharge Reveal
Coastal Vulnerabilities (Continued)
overestimate fresh SGD, our approach likely underestimates them because coastal recharge zones could import
groundwater from upland catchments. These potential additional groundwater sources are not included in our analysis.
Furthermore, fresh SGD estimates from water balance approaches tend to decrease with increasing spatial resolution, and
our analysis uses high-resolution hydrography data. The approach nevertheless allows for unprecedented mapping of fresh
SGD.
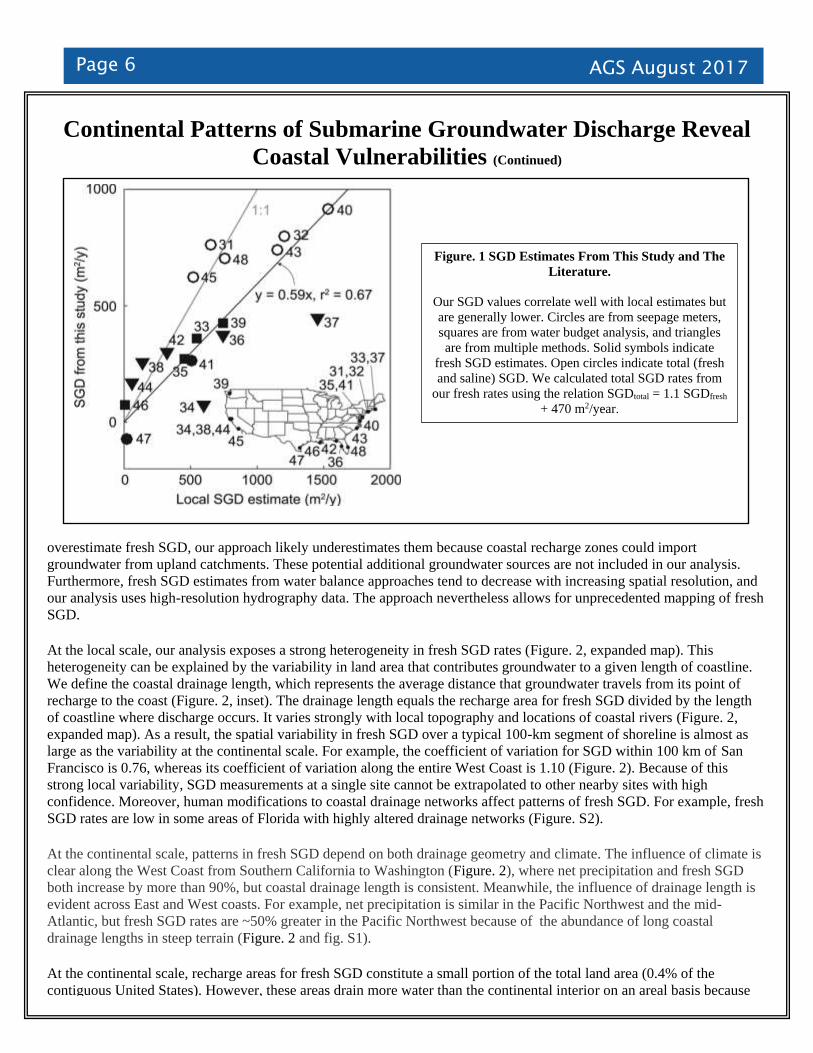
At the local scale, our analysis exposes a strong heterogeneity in fresh SGD rates (Figure. 2, expanded map). This
heterogeneity can be explained by the variability in land area that contributes groundwater to a given length of coastline.
We define the coastal drainage length, which represents the average distance that groundwater travels from its point of
recharge to the coast (Figure. 2, inset). The drainage length equals the recharge area for fresh SGD divided by the length
of coastline where discharge occurs. It varies strongly with local topography and locations of coastal rivers (Figure. 2,
expanded map). As a result, the spatial variability in fresh SGD over a typical 100-km segment of shoreline is almost as
large as the variability at the continental scale. For example, the coefficient of variation for SGD within 100 km of San
Francisco is 0.76, whereas its coefficient of variation along the entire West Coast is 1.10 (Figure. 2). Because of this
strong local variability, SGD measurements at a single site cannot be extrapolated to other nearby sites with high
confidence. Moreover, human modifications to coastal drainage networks affect patterns of fresh SGD. For example, fresh
SGD rates are low in some areas of Florida with highly altered drainage networks (Figure. S2).
At the continental scale, patterns in fresh SGD depend on both drainage geometry and climate. The influence of climate is
clear along the West Coast from Southern California to Washington (Figure. 2), where net precipitation and fresh SGD
both increase by more than 90%, but coastal drainage length is consistent. Meanwhile, the influence of drainage length is
evident across East and West coasts. For example, net precipitation is similar in the Pacific Northwest and the mid-
Atlantic, but fresh SGD rates are ~50% greater in the Pacific Northwest because of the abundance of long coastal
drainage lengths in steep terrain (Figure. 2 and fig. S1).
At the continental scale, recharge areas for fresh SGD constitute a small portion of the total land area (0.4% of the
contiguous United States). However, these areas drain more water than the continental interior on an areal basis because
Figure. 1 SGD Estimates From This Study and The
Literature.
Our SGD values correlate well with local estimates but
are generally lower. Circles are from seepage meters,
squares are from water budget analysis, and triangles
are from multiple methods. Solid symbols indicate
fresh SGD estimates. Open circles indicate total (fresh
and saline) SGD. We calculated total SGD rates from
our fresh rates using the relation SGDtotal = 1.1 SGDfresh
+ 470 m2/year.
AGS August 2017 Page 7
Continental Patterns of Submarine Groundwater Discharge Reveal
Coastal Vulnerabilities (Continued)
they receive more net precipitation. The total volumetric rate of fresh SGD from the contiguous United States to the
oceans is 15 ± 4 cubic km/year, or <1% of total land runoff. Because this simple water budget analysis may
underestimate fresh SGD by up to 40% (Figure. 1), rates may be as high as 25 ± 7 cubic km/year, or <2% of runoff.
These continental-scale estimates are in line with previous estimates for the contiguous United States [1 to 10% of
runoff] and the world [6% of runoff]. Note that saline SGD is substantially greater than the fresh component estimated
here and may be as large as 300 to 400% of global runoff, but the fresh component is most vulnerable to contamination
and other anthropogenic disturbances. Although volumetrically small, fresh SGD can carry large contaminant mass
loads. For example, in some parts of the world, fresh SGD delivers up to 30 times as much nitrogen to the coast as rivers.
The average volumetric flux of fresh SGD per unit length of coastline is 420 m2/year, but rates span orders of magnitude
(Figure. 3, inset). Although SGD is ubiquitous, concentrated discharge zones contribute the majority of fresh SGD to the
oceans: Half of all fresh SGD is focused along only 14% of the coast. Interestingly, rates of fresh SGD follow a log-
normal distribution (Figure. 3, inset), like permeability values for the shallow earth. Permeability is difficult to measure
because it ranges by orders of magnitude and is scale-dependent. A particular strength of our analysis is that it does not
require permeability data but relies instead on standardized topographic and climatic data sets.
Most of the global population lives near and depends on coastal water resources and fisheries. Thus, high-resolution data
sets are imperative for identifying coastal waters that may be vulnerable to “hidden” contaminant loads from fresh SGD.
Within the contiguous United States, 3% of the population inhabits recharge areas for fresh SGD, which represent only
0.4% of the total land area. Although 72% of recharge areas were undeveloped as of 2011, conversion to agricultural and
urban land use is ongoing. With coastal land development, nutrient loads to groundwater from septic tanks and fertilizers
are increasing. Making matters worse, wetland loss reduces coastal resilience to contaminant loading because wetlands
are efficient contaminant filters. Regions with above-average fresh SGD and land use development are particularly
vulnerable to groundwater-borne contamination, and these regions represent 12% of the coastline. Vulnerable regions
Figure. 2 Map of Fresh SGD Rates
Along the Contiguous United States
Coast.
On the West Coast, fresh SGD increases
from south to north (point A to point B)
with net precipitation (Net P) while
drainage length (DL) remains consistent.
The shape of recharge zones (inset in map)
dictates local variability; recharge zone a
has shorter DL, whereas zone b has longer
DL. Fresh SGD is calculated from the
product of infiltrating precipitation (I) and
DL (DL=A/L, where A is recharge zone
area and L is coastal length).
Noninfiltrating runoff (R) does not
contribute to fresh SGD. Expanded view of
Cape Cod, Massachusetts shows coastal
recharge zones colored by rate of fresh
SGD.
Page 8 AGS August 2017
Continental Patterns of Submarine Groundwater Discharge Reveal
Coastal Vulnerabilities (Continued)
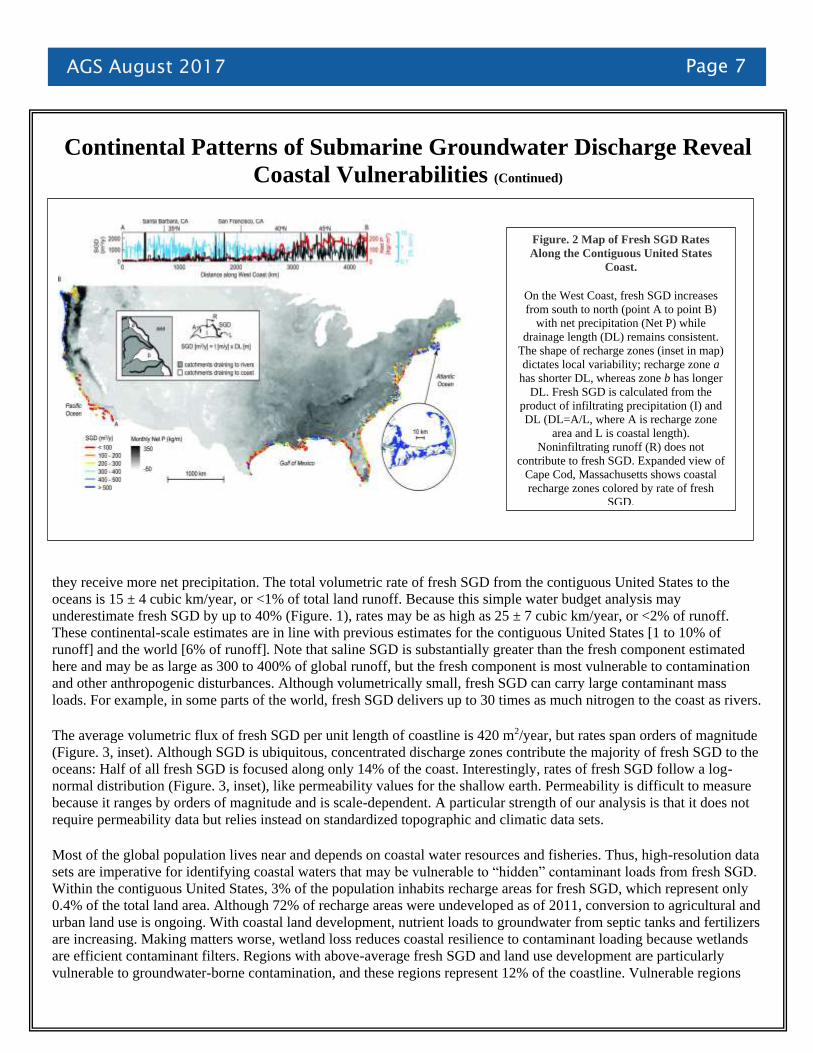
include the northern Gulf Coast from Mississippi to the Florida Panhandle, northern Atlantic Coast, and Pacific Northwest
(Figure. 3). These regions have previously been shown to have high potential nitrogen inputs from SGD to coastal waters.
Vulnerable regions should be monitored for direct nutrient inputs from fresh SGD.
High-resolution maps of SGD are also useful for assessing vulnerability of coastal aquifers to saltwater intrusion (Figure.
3). In populated areas, groundwater extraction subtracts from the recharge available for fresh SGD and can lead to
saltwater intrusion. Most coastal aquifers are more sensitive to groundwater extraction than sea level rise. We predicted
vulnerability to saltwater intrusion using an analytical solution for the position of the freshwater-saltwater interface,
assuming a population-dependent groundwater extraction rate that directly subtracts from the rate of fresh SGD.
Coastlines are considered vulnerable where the toe of the freshwater-saltwater interface reaches the groundwater divide of
the coastal aquifer, which implies imminent and full saltwater intrusion. These regions represent 9% of the coastline and
include confirmed locations of saltwater intrusion such as Long Island, New York and Los Angeles, California (Figure.
3).
Because of the highly heterogeneous nature of fresh SGD, neighboring coastal zones can be vulnerable to saltwater
intrusion and discharge of groundwater-borne contaminants to the ocean. Regions of mixed vulnerability include
southeastern Florida and New Jersey, among many others. Only a small fraction of coastline (<1%) is dually vulnerable to
both saltwater intrusion and offshore contamination, including the heavily developed and populated areas of San
Francisco, Los Angeles, and Long Island (Figure. 3). If these urban areas rely primarily on groundwater to meet their
resource demands, the resulting deductions to fresh SGD may cause full saltwater intrusion. Conversely, effective
groundwater management may sustain fresh SGD rates, but contaminant loads to the coast may be high.
As the resolution of global hydrographic data improves, this same approach can be used to predict global distributions of
fresh SGD and vulnerabilities in coastal water quality. Vulnerable regions will shift and likely grow with coastal land use
change, population growth, climate change, and sea level rise. In many areas, rates of fresh SGD will decrease as
impervious pavement expands and groundwater withdrawals increase. Regions with high rates of fresh SGD that are
currently vulnerable to offshore contamination may instead become vulnerable to saltwater intrusion. Because rates of
fresh SGD are highly heterogeneous, spatial estimates are imperative for identifying monitoring needs and assessing
threats to coastal water quality on both sides of the land-sea boundary, in onshore aquifers and marine surface waters.
http://science.sciencemag.org/content/353/6300/705.full
Figure. 3 Coastal Vulnerability Map.
Vulnerability to offshore contamination (dark
blue) is identified where the rate of fresh SGD is
above average (420 m2/year) and developed or
agricultural land use is above average (27.7%).
Vulnerability to saltwater intrusion (magenta) is
identified where low fresh SGD or high
groundwater extraction may cause complete
saltwater invasion. Light blue areas of coastlines
are vulnerable to both offshore contamination and
saltwater intrusion. Inset shows histogram of fresh
SGD rates for the contiguous United States.
AGS August 2017 Page 9
Much of U.S. Coastline Vulnerable to Hidden Contamination
Most raindrops find their way to the oceans via streams and rivers. But some of them also wind up as a part of a hidden
underground flow that seeps into the ocean through seafloor fissures. When this water, called submarine groundwater
discharge (SGD), trickles through contaminated soil and rock, it can pick up and transport a variety of ions, nutrients, and
chemicals to the sea—including pollutants that contribute to coastal dead zones and toxic algal blooms. Now, a new study
provides the first high-resolution map of the freshwater flow along coastlines in the continental United States, revealing
pollution “hot spots.” The study finds that 12% of the U.S. coastline is particularly vulnerable to contamination, including
parts of the northern Gulf Coast, the Pacific Northwest, and the northern Atlantic coast, where high rates of seepage overlap
areas of human development.
“This freshwater is right underfoot, flowing around leaky gas and septic tanks,” says Audrey Sawyer, a hydrogeologist at The
Ohio State University, Columbus, who led the study.
Typically, researchers don waders or wetsuits to hunt for individual points of groundwater seepage along the coast. They then
use the flows measured at these points as representative of wide stretches of coastline, an extrapolation fraught with
assumptions. Moreover, these hand-collected samples are limited to easily accessible places, such as the shallow, sandy
shorelines of the Atlantic coast. The resulting data are extremely spotty, making it difficult for scientists to accurately predict
the location of seeps, their flow rates, or where pollution will occur, Sawyer says.
Recently, public databases on U.S. rivers, streams, and coastlines have made more sophisticated analyses possible. In the new
paper, Sawyer and colleagues tapped the National Hydrography Dataset, which contains realistic topographic models of
riverbeds, streams, and coastlines across the United States. Combining these models with data on local rainfall and snowmelt,
the team calculated what fraction of the water is carried to the sea by rivers, and what fraction sinks into the ground.
They then focused on the small wedges of coastal land, sandwiched between river drainages, where groundwater drains
directly into the fragile ecosystems near shore. Nationwide, this subterranean flow of freshwater accounts for just 1% to 2% of
total land runoff, according to the study, which is published today in Science. But despite its relatively small volume, fresh
SGD can carry huge contaminant loads, Sawyer notes.
The team found that SGD was highest in places like the Pacific Northwest, where there is both heavy rainfall and steep
topography that leads the groundwater to the ocean. Many of these regions of high SGD—12% of the overall coastline—
overlapped with areas of heavy development, and Sawyer says these areas are the most vulnerable to contamination. “That’s
where we’re growing food, paving cities and towns, and digging septic tanks that leach nutrients and contaminants,” she says.
But extremely low rates of groundwater discharge can also pose a problem. Along the coast of southern California, for
example, low outflows increase the likelihood that saltwater could encroach into an aquifer, particularly as sea levels rise.
That puts local freshwater supplies in danger, Sawyer says. “It really only takes a tiny fraction of saltwater invading
groundwater to render it nonpotable.”
The study can help researchers identify which variables of topography and climate drive submarine groundwater discharge,
says Robert Buddemeier, a geohydrologist at the Kansas Geological Survey in Lawrence. The West Coast’s rocky, steep
terrain, combined with periods of intense rain and drought, makes it intrinsically different from the coastline along the Mid-
Atlantic, which receives steadier rain and slopes more shallowly to the ocean, he says.
A previous attempt to model fresh SGD found flow rates that were an order of magnitude greater than those from the current
study, says Willard Moore, an emeritus professor of geochemistry at the University of South Carolina, Columbia. However,
Moore says the current study is “a big leap” forward, because it uses better topographic and climatic data, and matches well
with 18 localized measurements conducted by other groups.
Page 10 AGS August 2017
Much of U.S. Coastline Vulnerable to Hidden Contamination (Continued)
Sawyer says she hopes researchers and environmental groups will use the new, publicly available database to
identify potential points of contamination in their own communities. Armed with local knowledge of where farms,
paved surfaces, and septic fields may be contributing to toxic runoff, she says, “people will be able to make more
powerful estimates of where risk of contamination might be higher.”
http://www.sciencemag.org/news/2016/08/much-us-coastline-vulnerable-hidden-contamination
The Germans Torpedoed a Ship During World War II. The Wreck is
Now Revealing Secrets About Underwater Mudslides
In 1942, in the midst of World War II, the oil tanker Virginia was anchored off the mouth of the Mississippi River
in the Gulf of Mexico, waiting to unload its cargo in nearby New Orleans. It never made it. Three torpedoes from
a German submarine, the U-507, caused the ship to become engulfed in flames, sinking it and killing 27 of its
crew.
For nearly 60 years, the Virginia rested forgotten on the sea floor. Its vacant decks became decorated with coral
and its portholes housed small fish. Over time, a multibillion-dollar offshore energy industry boomed around it.
Then, in 2001, an oil and gas exploration crew discovered the wreck while using sonar to scan the sea floor. Now,
the Virginia is once again serving as a workhorse: Instead of hauling oil, however, the tanker is helping
archaeologists and geologists understand the Gulf’s underwater mudslides. The sometimes massive slides can
threaten historic wrecks and can cause catastrophic damage to oil pipelines and wells.
In particular, the wreck’s movements over the past 16 years are helping researchers understand how even
relatively modest changes in the weather, not just major events like hurricanes, are reshaping the seafloor.
The Virginia lies on the edge of the Gulf’s continental shelf, in about 200 meters of water just off the Louisiana
coast. It’s a hot spot for underwater mudslides, according to geologist Sam Bentley of Louisiana State
University (LSU) in Baton Rouge, because the Mississippi River deposits large amounts of loose sediment in the
area. The sediments build up over time, forming giant lobes that can break apart and slide down the shelf.
Such slides worry regulators and the oil and gas industry for at least two reasons. One is they cause sediment to
slip from beneath seafloor pipes, leaving them suspended in the water and more vulnerable to breaks. The other
is that the slides—which can be 30 meters thick—can shear through pipelines and other infrastructure. In 2004,
for example, Hurricane Ivan triggered a mudslide that violently damaged 16 oil wells and created leaks.
The wreck’s discovery has provided geologists with some unexpected insight into how fast these lobes can
move. In 2006, archaeologists with the federal government—which manages areas more than 5 kilometers
offshore—set out to survey the Virginia. What they found mystified them: the 10,000-ton wreck had moved 370
meters seaward from its location in a 2004 mapping effort.
The likely cause, the researchers believed, was hurricanes that violently stormed through the Gulf in 2004 and
2005. Geologists knew that severe storms create large waves that, in turn, produce pressure differences on the
sea floor. This buffeting causes naturally occurring methane bubbles in the seabed sediments to contact and
expand, liquefying the mud around them. The process unleashes mudslides—which can carry even a 150-meter-
AGS August 2017 Page 11
The Germans Torpedoed a Ship During World War II. The Wreck is
Now Revealing Secrets About Underwater Mudslides (Continued)
long wreck along for the ride.
In 2017, when another team of researchers from the U.S. Geological Survey (USGS) returned to survey the wreck,
they found it had moved an additional 60 meters seaward. Again, the scientists puzzled: This time, there had been
no major storms to propel the movement.
A recent study led by LSU’s Bentley might explain what is happening. In 2012, the federal Bureau of Ocean
Energy Management (BOEM), which oversees offshore oil operations in federal waters, funded Bentley and
researchers at the USGS to study mudslides in a 100-square-kilometer section near the Mississippi delta, which is
dotted with numerous oil and gas wells and crisscrossed by pipelines.
The team mapped potential mudslide hotspots, extracted 9-meter-long cores from the sea floor, and measured
movements of ocean floor sediments. They also examined weather and other records to see what might be driving
sediment movements in the absence of hurricanes or other major storms.
One conclusion: Masses of cold air that regularly move over the gulf in the winter can stir up waves and pressure
differences that can help push the sediment seawards at rates of up to a meter per year. The cold fronts could help
explain the Virginia’s recent movements, Bentley says. “It would have to be something less energetic than a
hurricane that was causing [the movement], so the next thing down from that are winter cold fronts.”
The findings have implication for both efforts to prevent oil spills and to protect historic wrecks. Under federal
law, offshore oil and gas companies are required to protect cultural artifacts from industrial operations. In the
Virginia’s case, for example, BOEM barred companies from drilling, running pipelines, or dropping anchors
within 300 meters of the wreck. But a moving wreck complicates industry efforts to stay out of that buffer zone.
The rusting hulk could also pose a substantial threat to pipelines or other infrastructure that was originally far
downslope. Luckily, researchers say there are no pipelines in the immediate vicinity of Virginia.
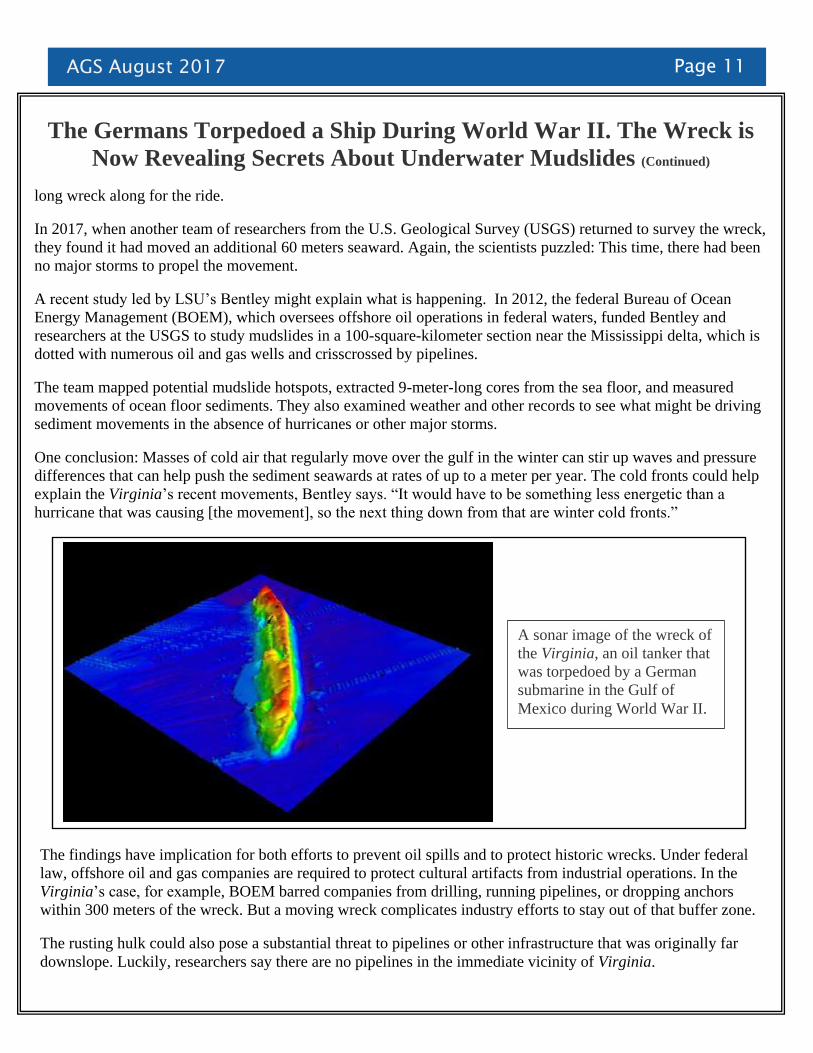
A sonar image of the wreck of
the Virginia, an oil tanker that
was torpedoed by a German
submarine in the Gulf of
Mexico during World War II.

Page 12 AGS August 2017
The Germans Torpedoed a Ship During World War II. The Wreck is
Now Revealing Secrets About Underwater Mudslides (Continued)
Researchers note, however, that there haven’t been systematic surveys of wrecks or slides in the Gulf of Mexico
since the 1970s, so there could be unknown threats sitting in the deep. To fill that knowledge gap, Bentley is
hoping BOEM will support expanding his mudslide study to a larger area covering some 2000 square
kilometers. And archaeologist Douglas Jones, who works out of BOEM’s office in New Orleans, Louisiana, is
proposing a study that would identify other wrecks in slide-prone areas.
In the meantime, researchers plan to keep an eye on the Virginia, which they say has opened a door to better
understanding the complexity and instability of the Gulf’s sea floor. Where the wreck will go next, they say, will
depend on the natural forces that can be difficult to predict.
http://www.sciencemag.org/news/2017/08/germans-torpedoed-ship-during-world-war-ii-wreck-now-revealing-secrets-about-submarine
'Frankenstein Dinosaur' Mystery Solved
Scientists have solved the puzzle of the so-called "Frankenstein dinosaur", which seems to consist of body
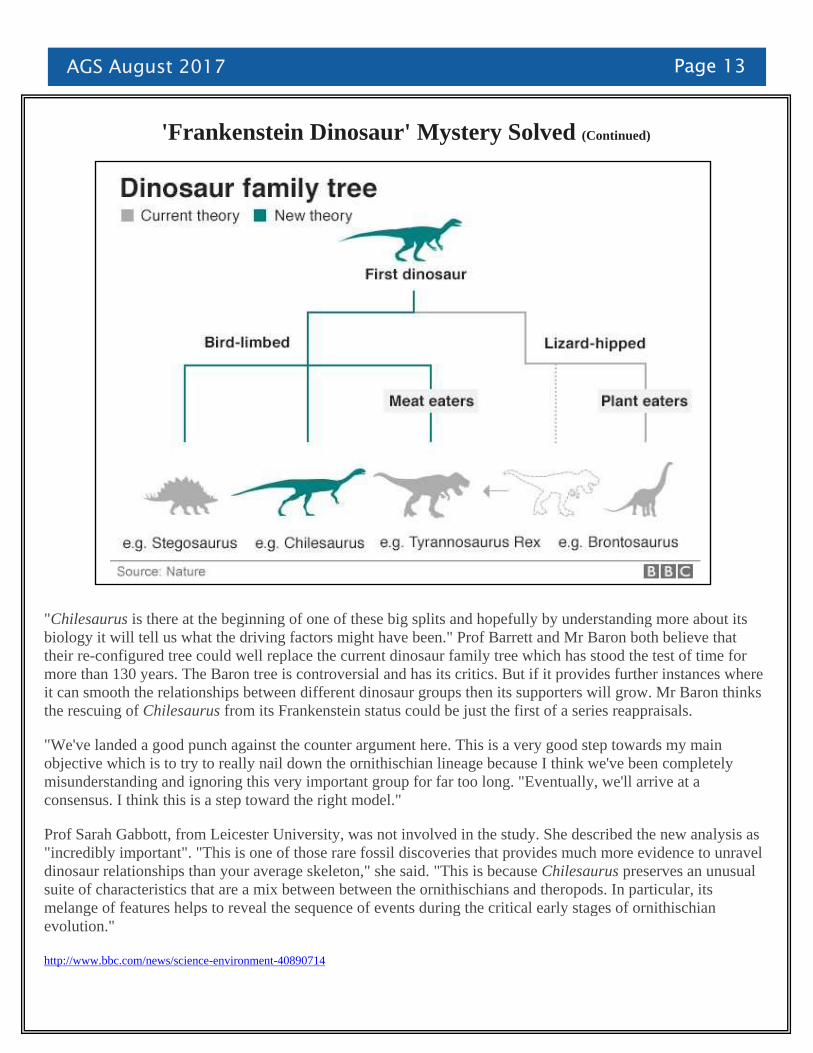
parts from unrelated species. A new study suggests that it is in fact the missing link between plant-eating
dinosaurs, such as Stegosaurus, and carnivorous dinosaurs, like T. rex. The finding provides fresh insight on the
evolution of the group of dinos known as the ornithischians. The study is published in the Royal Society journal
Biology Letters.
Matthew Baron, a PhD student at Cambridge University, told BBC News that his assessment indicated that the
Frankenstein dinosaur was one of the very first ornithischians, a group that included familiar beasts such as the
horned Triceratops, and Stegosaurus which sported an array of bony plates along its back. "We had absolutely
no idea how the ornithischian body plan started to develop because they look so different to all the other
dinosaurs. They have so many unusual features," the Cambridge scientist said.
"In the 130 years since the ornithischian group was first recognised, we have never had any concept of how the
first ones could have looked until now." The Frankenstein dinosaur, more properly called Chilesaurus, puzzled
experts when it was first discovered two years ago. It had the legs of an animal like a Brontosaurus, the hips of a
Stegosaurus, and the arms and body of an animal like Tyrannosaurus rex. Scientists simply did not know where
it fitted in the dino family tree. In the currently accepted family tree, the ornithischian group was always thought
to be completely unrelated to all of the other dinosaurs. Palaeontologists regarded these creatures as an odd-ball
group. But a reassessment by Mr Baron published in March in the journal Nature indicated that ornithischians
were more closely related to the meat-eaters, such as T.rex, than previously thought. And it is in re-configuring
the dinosaur family tree that Mr Baron transforms the Frankenstein dinosaur from an enigma into a missing link.
"Now that we think ornithischians and meat-eating dinosaurs such as Tyrannosaurus are related, Chilesaurus
slots exactly in between the two groups. It is a perfect half-and-half mix. So, suddenly in the new tree it makes a
whole lot of sense." The alternative version of the dinosaur family tree, now called the "Baron tree", is more
than just a rearrangement, however. It sheds new light on how different groups of dinosaurs split from one
another and evolved along different paths, adds co-author Prof Paul Barrett from London's Natural History
Museum.
AGS August 2017 Page 13
'Frankenstein Dinosaur' Mystery Solved (Continued)
"Chilesaurus is there at the beginning of one of these big splits and hopefully by understanding more about its
biology it will tell us what the driving factors might have been." Prof Barrett and Mr Baron both believe that
their re-configured tree could well replace the current dinosaur family tree which has stood the test of time for
more than 130 years. The Baron tree is controversial and has its critics. But if it provides further instances where
it can smooth the relationships between different dinosaur groups then its supporters will grow. Mr Baron thinks
the rescuing of Chilesaurus from its Frankenstein status could be just the first of a series reappraisals.
"We've landed a good punch against the counter argument here. This is a very good step towards my main
objective which is to try to really nail down the ornithischian lineage because I think we've been completely
misunderstanding and ignoring this very important group for far too long. "Eventually, we'll arrive at a
consensus. I think this is a step toward the right model."
Prof Sarah Gabbott, from Leicester University, was not involved in the study. She described the new analysis as
"incredibly important". "This is one of those rare fossil discoveries that provides much more evidence to unravel
dinosaur relationships than your average skeleton," she said. "This is because Chilesaurus preserves an unusual
suite of characteristics that are a mix between between the ornithischians and theropods. In particular, its
melange of features helps to reveal the sequence of events during the critical early stages of ornithischian
evolution."
http://www.bbc.com/news/science-environment-40890714
Page 14 AGS August 2017
Scientists Discover 91 Volcanoes Below Antarctic Ice Sheet
This is in addition to 47 already known about and eruption would melt more ice in region affected by climate
change. Scientists have uncovered the largest volcanic region on Earth – two kilometres below the surface of the
vast ice sheet that covers west Antarctica.
The project, by Edinburgh University researchers, has revealed almost 100 volcanoes – with the highest as tall as
the Eiger, which stands at almost 4,000 metres in Switzerland. Geologists say this huge region is likely to dwarf
that of east Africa’s volcanic ridge, currently rated the densest concentration of volcanoes in the world.
Volcanic eruptions may not reach the surface but could melt the ice from beneath and drastically destabilise
itAnd the activity of this range could have worrying consequences, they have warned. “If one of these volcanoes
were to erupt it could further destabilise west Antarctica’s ice sheets,” said glacier expert Robert Bingham, one
of the paper’s authors. “Anything that causes the melting of ice – which an eruption certainly would – is likely to
speed up the flow of ice into the sea.
“The big question is: how active are these volcanoes? That is something we need to determine as quickly as
possible.” The Edinburgh volcano survey, reported in the Geological Society’s special publications series,
involved studying the underside of the west Antarctica ice sheet for hidden peaks of basalt rock similar to those
produced by the region’s other volcanoes. Their tips actually lie above the ice and have been spotted by polar
explorers over the past century.
But how many lie below the ice? This question was originally asked by the team’s youngest member, Max Van
Wyk de Vries, an undergraduate at the university’s school of geosciences and a self-confessed volcano fanatic.
He set up the project with the help of Bingham. Their study involved analysing measurements made by previous
surveys, which involved the use of ice-penetrating radar, carried either by planes or land vehicles, to survey
strips of the west Antarctic ice. The results were then compared with satellite and database records and
geological information from other aerial surveys. “Essentially, we were looking for evidence of volcanic cones
sticking up into the ice,” Bingham said.
After the team had collated the results, it reported a staggering 91 previously unknown volcanoes, adding to the
47 others that had been discovered over the previous century of exploring the region.
These newly discovered volcanoes range in height from 100 to 3,850 metres. All are covered in ice, which
sometimes lies in layers that are more than 4km thick in the region. These active peaks are concentrated in a
region known as the west Antarctic rift system, which stretches 3,500km from Antarctica’s Ross ice shelf to the
Antarctic peninsula.
“We were amazed,” Bingham said. “We had not expected to find anything like that number. We have almost
trebled the number of volcanoes known to exist in west Antarctica. We also suspect there are even more on the
bed of the sea that lies under the Ross ice shelf, so that I think it is very likely this region will turn out to be the
densest region of volcanoes in the world, greater even than east Africa, where mounts Nyiragongo, Kilimanjaro,
Longonot and all the other active volcanoes are concentrated.”
The discovery is particularly important because the activity of these volcanoes could have crucial implications for
the rest of the planet. If one erupts, it could further destabilise some of the region’s ice sheets, which have already
been affected by global warming. Meltwater outflows into the Antarctic ocean could trigger sea level rises. “We
just don’t know about how active these volcanoes have been in the past,” Bingham said.
However, he pointed to one alarming trend: “The most volcanism that is going in the world at present is in
regions that have only recently lost their glacier covering – after the end of the last ice age. These places include

AGS August 2017 Page 15
Scientists Discover 91 Volcanoes Below Antarctic Ice Sheet
However, he pointed to one alarming trend: “The most volcanism that is going in the world at present is in
regions that have only recently lost their glacier covering – after the end of the last ice age. These places include
Iceland and Alaska.
“Theory suggests that this is occurring because, without ice sheets on top of them, there is a release of pressure
on the regions’ volcanoes and they become more active.”
And this could happen in west Antarctica, where significant warming in the region caused by climate change
has begun to affect its ice sheets. If they are reduced significantly, this could release pressure on the volcanoes
that lie below and lead to eruptions that could further destabilise the ice sheets and enhance sea level rises that
are already affecting our oceans.
“It is something we will have to watch closely,” Bingham said.
https://www.theguardian.com/world/2017/aug/12/scientists-discover-91-volcanos-antarctica
2017 Total Solar Eclipse – Phases to Totality
http://www.skyandtelescope.com/astronomy-news/best-2017-solar-eclipse-pictures-from-our-readers/

Page 16 AGS August 2017
August AGS PG Workshop Announcement
Date: August 26, 2017 Time: 10:00am to 12:00pm
Venue: Fernbank Science Center Annex
Speaker: Benjamin Black, PG
Subject: Engineering Geology
The class will cover Soil Mechanics and Soil Strength Testing (Laboratory and Field Methods), Geologic
Hazards (Slope Stability, Earthquakes, etc.), Engineering Geological Mapping, and Site Investigation.
Ben Principal Engineering Geologist for Oasis Consulting Services and has eighteen years experience in
hydrogeological analysis and geotechnical assessment and analysis. He is a registered Professional Geologist
in six states, and is experienced in a wide variety of geotechnical subsurface investigation methods, including
geophysical surveys, geotechnical soil borings, and coring of various types of soft and hard rock. In
particular, he is experienced with the assessment and analysis of rock mass strength with application to slope
stability and engineered structures.
Ben is experienced in shallow and deep foundation design including piles and drilled shafts, slope stability
analysis and stabilization techniques, seepage analysis, excavation design and materials handling, tunnel
design and construction, surveying, and ground reinforcing techniques. He has conducted slope stability
analysis for open pit mines and transportation corridors. He has been responsible for processing and
interpretation of rock mass properties, joint frequencies, selection of design sections, and other pertinent
data. He developed a stability model and performed all calculations necessary to determine factor of safety
and recommendations for slope stabilization for both planar and wedge failure modes.
Ben has worked on U.S. Army Corps of Engineers projects in New Orleans, Louisiana and Miami,
Florida. These projects include levee and deep foundation assessment and design in soft sediments and
statistical analysis based on load and resistance factor design.
Please join us and feel free to forward this announcement to anyone that might be interested. Engineering
geology is well covered on the licensure exams.
Two Professional Development Hours will be offered and everyone is invited to attend. AGS Membership is
not required, but certainly encouraged. An application is attached. More info
at: www.atlantageologicalsociety.org
Thanks,
Ken Simonton, P.G.
Ginny Mauldin-Kinney, P.G.
Atlanta Geological Society
Professional Registration/Career Development Committee
AGS August 2017 Page 17
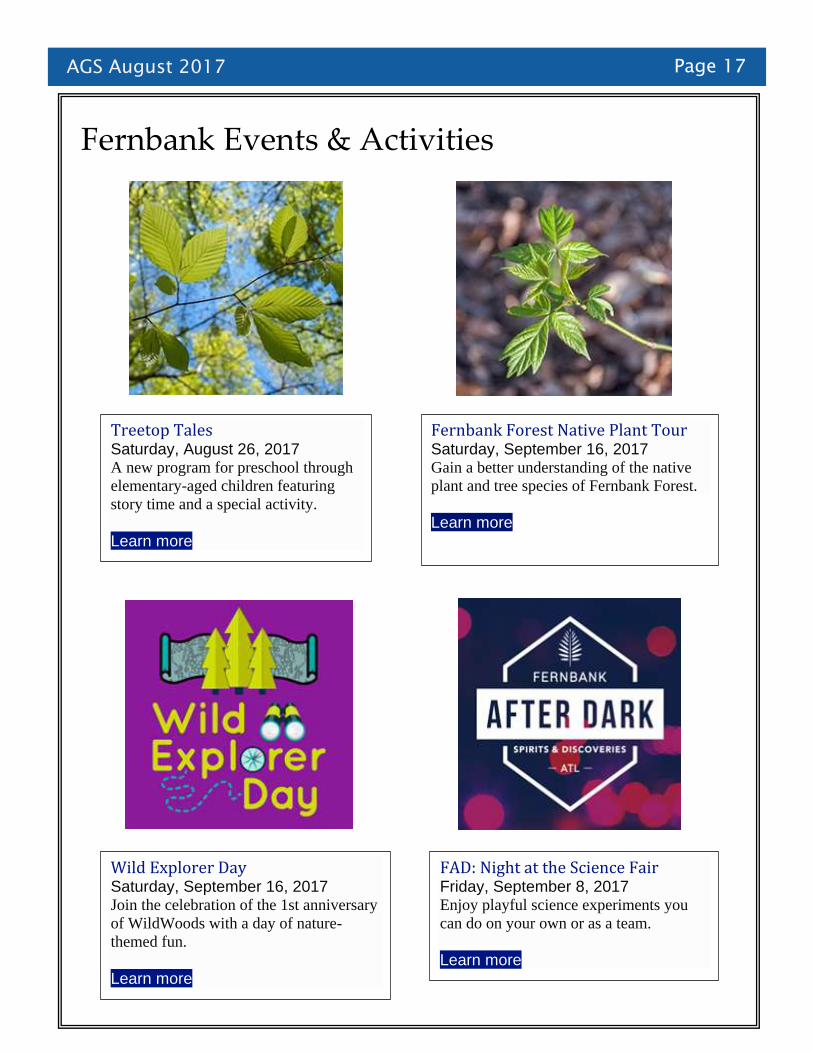
Fernbank Events & Activities
Treetop Tales Saturday, August 26, 2017 A new program for preschool through
elementary-aged children featuring
story time and a special activity.
Learn more
Fernbank Forest Native Plant Tour Saturday, September 16, 2017 Gain a better understanding of the native
plant and tree species of Fernbank Forest.
Learn more
FAD: Night at the Science Fair Friday, September 8, 2017 Enjoy playful science experiments you
can do on your own or as a team.
Learn more
Wild Explorer Day Saturday, September 16, 2017 Join the celebration of the 1st anniversary
of WildWoods with a day of nature-
themed fun.
Learn more
Page 18 AGS August 2017
Wildwoods and Fernbank Forest WildWoods features 10 acres of lush woodlands,
highlighted by hands-on exhibits for all ages, tree
pods suspended in the canopy, a nature gallery,
immersive adventures, and meandering trails
emphasizing dramatic slopes and stunning
views. This interpretive nature experience serves as
the new entrance into Fernbank Forest.
Learn more
Titans of the Ice Age On view June 17 – August 27, 2017 Take an unforgettable journey back in time to the
otherworldly frozen landscapes of the northern hemisphere
10,000 years before modern civilization. Titans of the Ice
Age 2D brings this harsh and beautiful era to life—a world
buried in our ancestral memory, populated by saber-tooth
cats, giant sloths, dire wolves and the iconic woolly
mammoths. Travel across monumental glaciers and
sweeping grasslands, rich in life. Roam the mammoth
steppe with baby Lyuba, a female Woolly Mammoth calf
recently exposed by the melting Siberian permafrost, now
one of the best preserved mammoth mummies in the world.
AGS August 2017 Page 19
Now showing in the Fernbank IMAX movie theater:
Mammoths and Mastodons June 17 – August 27, 2017 Journey back in time millions of years ago when mammoths and mastodons roamed the earth. Explore how mammoths and
mastodons lived with other giant creatures like short-faced bears and saber-toothed cats. Joust with mammoth tusks. Touch
the teeth of the colossal mastodon, and feel mammoth fur between your fingertips. Create your own cave art and learn why
early humans both hunted and honored these majestic animals. Live among these larger than life creatures for a day, in the
most captivating, interactive exhibition since the Ice Age.
Amazon Adventure 3D May 20 – September 29, 2017 Experience the epic, true story of explorer Henry Bates' fascinating 11-year journey through the Amazon rainforest as a
young man working to unravel a great scientific mystery. As in any great detective story, audiences will experience the
compelling clues Bates unearths in his major discovery of the phenomenon of “Batesian” mimicry, whereby certain
animals adopt the look of others and thus can deceive predators and prey. Little known to the public, Bates made other
crucial contributions to biology: identifying 8,000 species new to science and most importantly, putting the first ever case
for the creation of a new species, which Charles Darwin called the “beautiful proof” for Natural Selection. See mind-
boggling examples of camouflage and mimicry in the visually stunning and biodiverse Amazon. You’ll be inspired by
Bates' endless curiosity and determination to explore the wilds of nature.
Fernbank Museum of Natural History (All programs require reservations, including free programs)
Page 20 AGS August 2017
AGS Committees
AGS Publications: Open
Career Networking/Advertising: Todd Roach
Phone (770) 242-9040, Fax (770) 242-8388
Continuing Education: Open
Fernbank Liaison: Kaden Borseth
Phone (404) 929-6342
Field Trips: Open
Georgia PG Registration: Ken Simonton
Phone: 404-825-3439
Ginny Mauldin-Kenney,
ginny.mauldin@gmailcom
Teacher Grants: Bill Waggener
Phone (404)354-8752
Hospitality: John Salvino, P.G.
Membership: Burton Dixon
Social Media Coordinator: Carina O’Bara
Newsletter Editor: James Ferreira
Phone (508) 878-0980
Web Master: Ken Simonton
www.atlantageologicalsociety.org
AGS 2017 Meeting Dates
Listed below are the planned meeting
dates for 2017. Please mark your calendar
and make plans to attend.
2017 Meeting Schedule
August 29
September 26
October 31
November 28
December 26
PG Study Group meetings Contact Ken Simonton for the details.
August 26
September 30
October 28
November 25
December 23
AGS Officers
President: Ben Bentkowski
Phone (770) 296-2529
Vice-President: Steven Stokowski
Secretary: Rob White
Phone (770) 891-0519
Treasurer: John Salvino, P.G.
Phone: 678-237-7329
Past President
Shannon Star George
AGS August 2017 Page 21
ATLANTA GEOLOGICAL SOCIETY
www.atlantageologicalsociety.org
ANNUAL MEMBERSHIP FORM
Please print the required details and check the appropriate membership box.
DATE:_____________________________________________
NAME:____________________________________________
ORGANIZATION:____________________________________________________________
TELEPHONE (1): TELEPHONE (2):
EMAIL (1): EMAIL (2):
STUDENT $10
PROFESSIONAL MEMBERSHIP $25
CORPORATE MEMBERSHIP $100 (Includes 4 professional members, please list names and emails below)
NAME: EMAIL:
NAME: EMAIL:
NAME: EMAIL:
NAME: EMAIL:
For further details, contact the AGS Treasurer:
John Salvino [email protected]
Please make checks payable to the “Atlanta Geological Society” and bring them to the next meeting or remit
with the completed form to:
Atlanta Geological Society, Attn: John Salvino
3073 Lexington Avenue
Woodstock, Georgia 30189
To pay electronically; click
https://squareup.com/store/atlanta-geological-society
CASH CHECK (CHECK NUMBER:___________)


