ATINER's Conference Paper Series PLA2013-0490 Addressing
16
ATINER CONFERENCE PAPER SERIES No: PLA2013-0490 Athens Institute for Education and Research ATINER ATINER's Conference Paper Series PLA2013-0490 Eleni Katrini, MSSD Carnegie Mellon University, Dipl.Arch NTUA Masters Student Center for Building Performance & Diagnostics, Carnegie Mellon University USA Addressing Food, Water, Waste and Energy Locally Yields in Urban Regenerative Environments
Transcript of ATINER's Conference Paper Series PLA2013-0490 Addressing

ATINER CONFERENCE PAPER SERIES No: PLA2013-0490
1
Athens Institute for Education and Research
ATINER
ATINER's Conference Paper Series
PLA2013-0490
Eleni Katrini,
MSSD Carnegie Mellon University, Dipl.Arch NTUA
Masters Student
Center for Building Performance & Diagnostics,
Carnegie Mellon University
USA
Addressing Food, Water, Waste
and Energy Locally Yields in
Urban Regenerative
Environments

ATINER CONFERENCE PAPER SERIES No: PLA2013-0490
2
Athens Institute for Education and Research
8 Valaoritou Street, Kolonaki, 10671 Athens, Greece
Tel: + 30 210 3634210 Fax: + 30 210 3634209
Email: [email protected] URL: www.atiner.gr
URL Conference Papers Series: www.atiner.gr/papers.htm
Printed in Athens, Greece by the Athens Institute for Education and Research.
All rights reserved. Reproduction is allowed for non-commercial purposes if the
source is fully acknowledged.
ISSN 2241-2891
2/08/2013

ATINER CONFERENCE PAPER SERIES No: PLA2013-0490
3
An Introduction to
ATINER's Conference Paper Series
ATINER started to publish this conference papers series in 2012. It includes only the
papers submitted for publication after they were presented at one of the conferences
organized by our Institute every year. The papers published in the series have not
been refereed and are published as they were submitted by the author. The series
serves two purposes. First, we want to disseminate the information as fast as possible.
Second, by doing so, the authors can receive comments useful to revise their papers
before they are considered for publication in one of ATINER's books, following our
standard procedures of a blind review.
Dr. Gregory T. Papanikos
President
Athens Institute for Education and Research

ATINER CONFERENCE PAPER SERIES No: PLA2013-0490
4
This paper should be cited as follows:
Katrini, E. (2013) "Addressing Food, Water, Waste and Energy Locally
Yields in Urban Regenerative Environments" Athens: ATINER'S
Conference Paper Series, No: PLA2013-0490.

ATINER CONFERENCE PAPER SERIES No: PLA2013-0490
5
Addressing Food, Water, Waste and Energy Locally Yields in
Urban Regenerative Environments
Eleni Katrini,
MSSD Carnegie Mellon University, Dipl.Arch NTUA
Masters Student
Center for Building Performance & Diagnostics,
Carnegie Mellon University
USA
Abstract
Our cities are built dependent on centralized systems of water and waste
management, food and energy production. This practice has proven efficient
for a while; nonetheless as our cities expand with immense speed and
population increases, severe issues of food access, waste accumulation, floods,
water contamination and increased energy demand reveal the obsolescence of
those systems. The solution does not lie anymore only in conservation and
precautionary measures but in a diverse way of thinking and redesigning
existing infrastructures. Through this research, several systems of urban
agriculture, decentralized water management and treatment, as well as energy
production from waste were identified and studied through literature and actual
case studies. The ultimate goal was to create a toolkit for urban regenerative
environments, which will be used to introduce those systems to designers. The
key component of the toolkit is the quantitative link between the spatial
demands of each system and its efficiency.
The process of the work is defined by three phases. The first phase was to
delineate the different systems through literature review and data collection of
recent or ongoing case studies. The second phase was to analyze, classify and
document the case studies for the Toolkit of Urban Regenerative
Environments. Finally, as a proof of concept of the usability of the Toolkit as
well as a way of investigation of the potentials of the systems presented, a
design exercise was realized in a neighborhood in Philadelphia. Different
systems were selected and applied in an area considered as a food desert in
Northern Liberties, close to downtown Philadelphia. Through this exercise the
applicability of the Toolkit was tested and the potentials of the systems were
identified.
This paper presents the results of the proof of concept, highlighting the
benefits and potentials of decentralized food, water, waste and energy systems.
Keywords: Urban regenerative environments, sustainable design, food
production, water treatment, energy from waste, decentralized infrastructure,
urban resiliency
Corresponding Author:

ATINER CONFERENCE PAPER SERIES No: PLA2013-0490
6
Introduction
Urban density constitutes a critical part of the sustainable communities.
Denser cities have reduced per capita use of resource, due to the limited needs
in commuting. (Calthorpe, 2011) Nowadays, 28% of the energy consumed in
US is due to transportation, (U.S. Department of Energy, 2011) hence it is
really important to reduce commuting distances. Dense urban areas minimize
commuting long distances, and therefore reduce the carbon footprint of a
community. However, the idea of minimizing long distances and using local
resources comes in conflict with the current model of globalization and the
open global market. Consequently, working within a global framework we
have to come up with local ideas.
In this global framework, cities and dense urbanized areas are expanding
with immense speed, creating controversies about the quality of space
produced. In 2000, China announced her intention to create 400 new cities, (an
urban area as big as 24 times the size of the metropolitan area of London) until
2020 due to the intense immigration of rural population to the cities. (Katrini &
Ventourakis, 2008) Under those terms, air and visual quality, human comfort
and health, as well the connection to nature are often being compromised.
Cities are created with no local solutions for food supply and waste
management. We spend 10.2 quadrillion Btus annually in the food production
and distribution sector. (Heller & Keoleian, 2000) From the above energy
consumption, 14% is consumed for transportation. (Hill, 2008) In the U.S.
fresh produce is estimated to travel 1,500 miles from the growers to the
consumers. (Hendrickson, 1996) The food transportations by airplanes, trucks
and other means lead to increasing emissions of greenhouse gases and air
pollution. For example the imports of fruits and vegetables in California in
2005, only by airplane, led to more than 70,000 tons of CO2 to be released in
the atmosphere. (NRDC, 2007) A main reason for food transportation is also
the ability to provide certain types of fresh produce year round. However, in
order for this fresh produce to stay intact while travelling, pesticides and toxic
preservatives are added, which are harmful both to human health and the
environment. Despite that, fresh produce still loses important part of its
nutritious value from the moment it is produced to the moment it gets
delivered.
Unfortunately, apart from being energy demanding, our current food system
is full of contradictions. Based on the energy consumed and food miles
travelled, it could be implied that food is being uniformly distributed and
available to everybody. Nonetheless, that lies far away from the truth. In 2009,
there were more than 23 million people in U.S. who live in food deserts.
(Bornstein, 2012) A food desert is defined by US Department of Agriculture
(USDA) as “a low-income census tract where substantial number or share of
residents has low access to a supermarket or a large grocery store”. (USDA,
2012b) Food deserts are the aftermath of the disconnection between food
production and actual demand. Food is mass produced far away from the cities
where the actual demand is. That leads to problems of increased food

ATINER CONFERENCE PAPER SERIES No: PLA2013-0490
7
production, bad distribution and consequently unmet demand. That means that
we produce more food than we actually need, and a great part of us still stays
hungry.
It is estimated that 1/3 of the food produced in the US is being thrown away
before it is even eaten. (Martin, 2008) In 2010, 34,000,000 tons of food waste
was created and almost all of it was thrown to the landfills. Each person
produces 1 pound of food waste every day, leading food scrap to the second
place as the largest source of waste to end up in landfills. (US EPA, 2010) On
the other hand, the number of landfills in the US is diminishing significantly
every year. From 1991 to 2007, landfills have been reduced by 2/3, creating
issues of waste management and treatment. (US EPA, 2008) As landfills
become fewer, waste has to travel greater distances to get treated. After March
2001, when Fresh Kills, the landfill of the City of New York closed, the waste
produced by 8,175,133 people cannot be treated locally anymore and has to be
transported to Ohio, Pennsylvania to get disposed, costing approximately as
much as $67.50 per ton. (Lipton, 2000) Moreover, the concentrated waste in
specific areas leads to air, water and ground pollution, which compromise the
health of the residents in surrounding areas. Neighboring regions of landfills
can suffer up to 13.7% decrease of residential property values due to pollution
and odor problems. (Ready, 2011).
The current practices of urban development and structure have an effect on
the hydrological cycle. The impermeable, concrete, dense urban clusters
provoke environmental issues of climate change; with increasing floods and
urban heat island effects that pose threats on human life. One of the major
problems in dense urban centers is the incapability to retain the storm water.
The expansive impermeable surfaces of concrete and asphalt along with the
dense built environment result in flooding and polluted surface water. Flooding
incidents are getting more and more frequent; only in 2004 there were more
than 80 flood events in the US. (US DOE, 2008) Apart from the obvious risks
that they include, they cause damages with great costs for infrastructure. It is
estimated that floods cause an annual cost of damage of about $6 billion.
(National Geographic, 2012) Moreover, the repercussion of those floods is the
overflow of the sewer systems, which in the case of approximately 772 cities in
the US, which have combined sewer systems, leading to the contamination of
the watersheds. (NPDES, 2012)
Finally, the buildings themselves contribute even more to the above urban
complications. The construction industry, by creating buildings on a first cost
base, ignores their performance, creating a high energy-demanding landscape.
In the U.S., buildings are responsible for the 42% of the total energy
consumption, resulting in greenhouse gas emissions which account for the 30%
of the U.S. total. (EPA, 2011) (Figure 1 A) The greenhouse gases emissions are
due to the way we produce energy; through combustion of mostly coal or
natural gas. Producing electricity through combustion and then distributing it
through the grid, leads in serious energy losses that consist the 2/3 of the
initially produced energy. (U.S. EIA, 2011) (Figure 1B)

ATINER CONFERENCE PAPER SERIES No: PLA2013-0490
8
The above examples question the efficiency of centralized systems. The
emerging hypothesis from these statistics that was analyzed is; Will addressing
food, water, waste and energy locally yield in urban regenerative
environments? If it does, how designers and people related to the building
industry can be updated about such environmentally sustainable decentralized
systems?
Methodology
Scope of work
The scope of this research project was to identify technologies and case
studies of urban food production, stormwater management, decentralized
wastewater treatment and energy production from waste and present them
through a comprehensive method. The representation of the case studies
through the Toolkit for Urban Regenerative Environments aims at creating a
link between the size of the systems, their performance and capability to a
district, neighborhood or building level.
Research process
The process of the work is defined by three phases. The first phase was to
delineate the different systems through literature review and data collection of
recent or ongoing case studies. The second phase was to analyze, classify and
document the case studies for the Toolkit of Urban Regenerative
Environments.
The classification of the case studies selected was realized based on three
parameters (Figure 2):
1. The type of the system: food production, stormwater, wastewater treatment
and energy from waste.
2. The location of the system: landscape, rooftop, window, whole building
3. The scale of the system: building, neighborhood, district
Each case study has been documented with the following details (Figure 3):
1. Background story
2. System Description
3. Key dimensions
4. System capacity or annual production
5. Plan with graphic scale and general dimensions
6. Supporting information, diagrams and images
The ultimate goal of this process is to provide the users of the toolkit with the
ability to estimate the potential use of such a system in their projects based on
their available space, building typology, community characteristics and other
project demands.
Finally, as a proof of concept of the usability of the Toolkit as well as a way
of investigation of the potentials of the systems presented, a design exercise
was realized in a neighborhood in Philadelphia. Different systems were
selected and applied in an area considered as a food desert in Northern
ATINER CONFERENCE PAPER SERIES No: PLA2013-0490
9
Liberties, close to downtown Philadelphia. Through this exercise the
applicability of the Toolkit was tested and the potentials of the systems in
another neighborhood were identified.
The Toolkit for urban regenerative environments
The purpose of this toolkit is to make designers aware of various innovative
and forward-thinking strategies related to food production, stormwater
management, wastewater treatment and energy production. The toolkit for
urban regenerative environments is a tool for the design team during the
preliminary design phase. It illustrates spatial requirements and quantitative
benefits of these strategies with the goal of pushing the team towards a new
way of thinking. Considering the toolkit as a “Green Infrastructure for
Dummies”, it could actually help the design team during the schematic phases.
Due to ongoing technological advances, the intent is not to showcase best
practices, but present current practices. Consequently, the toolkit is not meant
to be a static best practices book to refer to, but a constantly evolving and
updated database.
Additionally, it can become useful in another part of the design process; the
charrette. It is an easy way to showcase several case studies to people from
different backgrounds, as both the illustrations and the texts are presented in a
simplified manner to be useful to a wider audience. Through the case studies,
the toolkit also provides convincing evidence to the clients by correlating the
space needed and the potential benefits of the systems being considered.
The different systems presented through the toolkit are for food production;
geoponics, hydroponics, aeroponic towers, aquaponics, greenhouses, for
stormwater management; wetland, bioswale, stormwater planters, for
wastewater treatment; living machine, membrane bio-reactor and for energy
from waste; anaerobic digester and incinerator.
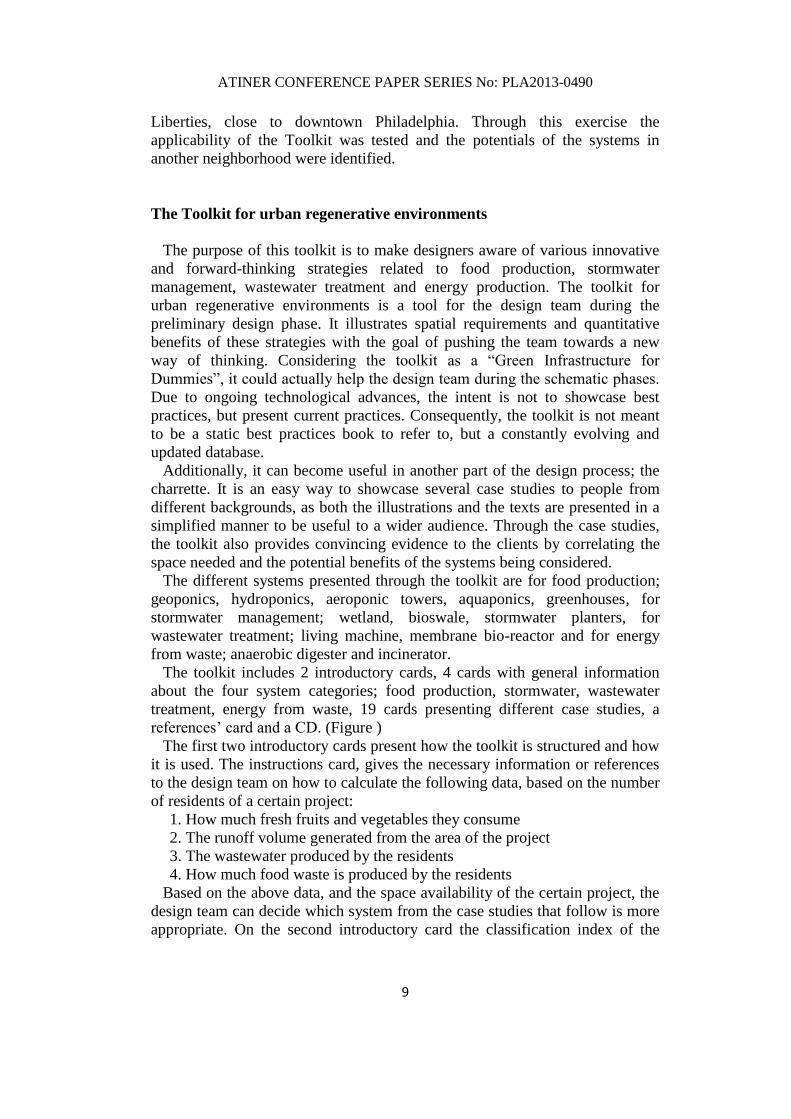
The toolkit includes 2 introductory cards, 4 cards with general information
about the four system categories; food production, stormwater, wastewater
treatment, energy from waste, 19 cards presenting different case studies, a
references’ card and a CD. (Figure )
The first two introductory cards present how the toolkit is structured and how
it is used. The instructions card, gives the necessary information or references
to the design team on how to calculate the following data, based on the number
of residents of a certain project:
1. How much fresh fruits and vegetables they consume
2. The runoff volume generated from the area of the project
3. The wastewater produced by the residents
4. How much food waste is produced by the residents
Based on the above data, and the space availability of the certain project, the
design team can decide which system from the case studies that follow is more
appropriate. On the second introductory card the classification index of the

ATINER CONFERENCE PAPER SERIES No: PLA2013-0490
10
case studies is presented. All the case studies are classified based on the
system, the location of action and the scale of the project.
The systems introductory cards are found before the related case studies
cards. They present the benefits of the system and a short description of the
different current technologies. Each case study card has the same structure that
helps the user understand the project, its basic information, the system and its
requirements. On the front side, there are images, the title, the classification of
the system (
Figure) and a short paragraph about the background of the project. The back
side is dedicated to the presentation of the system. On the right there are all the
main information about the system; the system description, its key dimensions,
its capacity, how much it yields etc. For all the case studies, there is always a
description of the system and key dimensions category, as well as a category
where shows the yield or capacity of the system. Consequently, the spatial
demands of each system presented are correlated with its quantitative benefits.
On the right side, there is the supporting graphic material along with the plan
of each system presented as a “stamp”. The idea of the stamp is to outline fully
the system and its key dimensions. The design team could literally recreate
those stamps on their development plan and multiply accordingly to calculate
the yields. However, as the design process is not being done anymore by hand,
a digital version of the case studies “stamps” is provided as an Autocad file in
the CD. Hence, the design teams can now “copy-paste” the stamps on their
project file following the same concept. Moreover, as the scales of each case
study and system vary from building to district, it would be impossible to
create all the stamps in a certain scale. Nevertheless, a graphic scale and a
North arrow indication are provided on each stamp.
Proof of Concept
The Neighborhood
In order to test how the toolkit will be used in an actual design process, a
design exercise was realized as a proof of concept in the city of Philadelphia.
(Figure 5) The design was based on the information gathered in the case
studies. Even though the city consists of an urban dense area, food deserts are
found within its limits. According to the United States Department of
Agriculture’s ‘Food Desert Locator,’ there are three basic areas currently
defined as a food desert (U.S. Department of Agriculture, 2013); one of those
was selected as the study example. The implications of limited food
accessibility in communities, especially areas considered as food deserts, often
influence the health and economy of the community and its residents.
(Wrigley, Warm, Margetts, & Whelan, 2002) (Pothukuchi, 2004) The selected
neighborhood is located in the general area of Northern Liberties and Fishtown.
It has 2171 residents, and all of them are considered to have low access to fresh
food. (USDA, 2012a) There are 951 housing units and the total area of the
development is 142 acres.

ATINER CONFERENCE PAPER SERIES No: PLA2013-0490
11
The Design Actions
Firstly, availability of space for food production in the neighborhood was
investigated. Vacant lots, industrial and commercial rooftops were considered
as possible spaces to grow edible plants. It was assumed that 80% of every
vacant lot and 62% of every industrial and commercial rooftop will be used for
urban agriculture. (Grewal & Grewal, 2012) That led to a total of 25.7 acres of
land. As far as wastewater was concerned a Membrane Bio-Reactor was
implemented in the neighborhood that has the capacity to treat about 100,000
gallons of water per day. The spatial demands of such a system were about
0.06 acres. Finally, the neighborhood will host an anaerobic digester that will
treat organic waste and produce biogas. The biogas can be used as a renewable
natural gas for cooking and heating purposes in the residential units.
The above design actions resulted in the following quantitative and
qualitative benefits:
Quantitative Benefits
Food Produced: Supply 50% of the residents’ needs for fresh fruits and
vegetables (1085 residents).
Wastewater treated: With the implementation of the Membrane Bio-Reactor
100% of the residential wastewater produced gets treated on site.
Waste treated: The neighborhood will host the anaerobic digester which will
treat the residential food waste of 12 neighborhoods of the same size.
Energy Produced: The anaerobic digester produces annually 5,860 MMBtus
of gas which satisfies 7% of the neiborhood’s gas demand (66.5 Housing
Units).
Qualitative Benefits
Education: Workshops and educational programs are organized in the local
farms for students. Informational Center of the digester brings ‘human waste to
human scale’. Residents are learning how organic waste is digested and how
energy is being produced.
Job opportunities: Creation of job opportunities and support of local
economy through on site farms and food processing businesses.
Community: Creation of green spaces with activities that can bring the
community together.
Reducing food miles travelled: Food is becoming accessible in the
neighborhood reducing the miles travelled. Moreover the local food production
industry can supply other areas of Philadelphia without travelling great
distances, as they are within a 5 miles radius.
Waste diversion: Every year 5,000 tons of organic waste is diverted from
landfills and about 70,629,334 ft3 of methane is being captured.
ATINER CONFERENCE PAPER SERIES No: PLA2013-0490
12
Conclusion
As mentioned in the introduction above, several problems related to food
access, water management and energy supply arise due to the attempt of
satisfying the cities’ needs only through centralized infrastructures. Such
massive global systems, which follow economical and political trends, face
fluctuations on their efficiency. That means that often enough they might fail to
satisfy everybody’s needs. The great advantage of decentralized systems, such
as the one presented through the toolkit, is that they can become back-up
mechanisms minimizing the failure risk of the centralized systems.
Moreover, if we imagine the community as an organism or a system, the
decentralized infrastructure act as the system’s balancing feedback loops. In
particular, every community has inputs and outputs. It imports food, energy
and water by using the centralized networks; it has energy losses and exports
waste and wastewater. The decentralized systems use the outputs of a
community in order to generate food, energy and water supply. Consequently,
the demand for external input is reduced while reducing waste and losses.
(Figure 61, Figure )
Creating opportunities for decentralized systems of food, water, waste and
energy in communities in combination to the greater networks can increase
urban resiliency and efficiency and eventually create urban regenerative
environments.
Bibliography
Bornstein, D. (2012, April 18). Conquering Food Deserts With Green Carts.
Opinionator. Retrieved August 12, 2012, from http://opinionator.blogs.
nytimes.com/2012/04/18/conquering-food-deserts-with-green-carts/
Calthorpe, P. (2011). Urbanism in the age of climate change. Washington DC: Island
Press.
EPA. (2011). Green Buildings. Retrieved May 13, 2012, from http://www.epa.gov/
oaintrnt/projects/
Grewal, S. S., & Grewal, P. S. (2012). Can cities become self-reliant in food? Cities,
29(1), 1–11. doi:10.1016/j.cities.2011.06.003
Heller, M. C., & Keoleian, G. A. (2000). Life Cycle-Based Sustainability Indicators
for Assessment of the U.S. Food System (No. CSS00-04). Center for Sustainable
Systems, University of Michigan. Retrieved from http://css.snre.umich.edu/css
_doc/CSS00-04.pdf
Hendrickson, J. (1996). Energy Use in the U.S. Food system: A Summary of existing
research and analysis. Quebec: Institute Menlo Park.
Hill, H. (2008). Food Miles: Background and Marketing. ATTRA - National
Sustainable Agriculture Information Service.
Katrini, E., & Ventourakis, A. (2008). China Town, Study and Analysis of the urban
growth in China, in association to its tradition. National Technical University of
Athens, School of Architecture, Athens, Greece.
Lipton, E. (2000, February 21). Efforts to Close Fresh Kills Are Taking Unforeseen
Tolls - New York Times. The New York Times. Retrieved from http://www.

ATINER CONFERENCE PAPER SERIES No: PLA2013-0490
13
nytimes.com/2000/02/21/nyregion/efforts-to-close-fresh-kills-are-taking-
unforeseen-tolls.html?pagewanted=all&src=pm
Martin, A. (2008, May 18). One Country’s Table Scraps, Another Country’s Meal.
The New York Times. Retrieved from http://www.nytimes.com/
2008/05/18/weekinreview/18martin.html
National Geographic. (2012). Flood Information, Flooding Facts, Flash Floods, Photos
-- National Geographic. Retrieved August 1, 2012, from http://environment.
nationalgeographic.com/environment/natural-disasters/floods-profile/
NPDES. (2012, February 16). EPA Combined Sewer Overflows - Office of
Wastewater Management. Retrieved August 13, 2012, from http://cfpub.epa.gov/
npdes/home.cfm?program_id=5
NRDC. (2007). Food miles: How far your food travels has serious consequences for
your health and the climate. Natural Resources Defense Council.
Pothukuchi, K. (2004). Community Food Assessment A First Step in Planning for
Community Food Security. Journal of Planning Education and Research, 23(4),
356–377. doi:10.1177/0739456X04264908
Ready, R. C. (2011). Do landfills always depress nearby property values? Journal of
Real Estate Research, 32(03). Retrieved from http://aux.zicklin.baruch.cuny.
edu/jrer/papers/pdf/past/vol32n03/04.321_340.pdf
U.S. Department of Agriculture. (2013). USDA Economic Research Service - Food
Access Research Atlas. Retrieved May 13, 2013, from http://www.ers.usda.gov/
data-products/food-access-research-atlas/about-the-atlas.aspx#.UZB6N8rJFdU
U.S. Department of Energy. (2011). Buildings Energy Data Book. Energy Efficiency
and Renewable Energy. Retrieved January 28, 2012, from http://buildingsdata
book.eren.doe.gov/ChapterIntro1.aspx
U.S. EIA. (2011). Total Energy - Data - U.S. Energy Information Administration
(EIA). Retrieved May 13, 2012, from http://205.254.135.24/totalenergy/data/
annual/
US DOE. (2008). Project America: Environment: Climate Change: Floods. Retrieved
June 30, 2012, from http://www.project.org/info.php?recordID=263
US EPA. (2008). Municipal Solid Waste in the United States, 2007 Facts and Figures.
Office of Solid Waste. Retrieved from http://www.epa.gov/osw/nonhaz/
municipal/pubs/msw07-rpt.pdf
US EPA. (2010). Basic Information about Food Waste | Organic Materials | US EPA.
Retrieved April 15, 2012, from http://www.epa.gov/osw/conserve/materials/
organics/food/fd-basic.htm
USDA. (2012a, July 11). Food Desert Locator. Retrieved July 27, 2012, from
http://www.ers.usda.gov/data-products/food-desert-locator/go-to-the-locator.aspx
USDA. (2012b, August 6). USDA Economic Research Service - About the Locator.
Retrieved August 12, 2012, from http://www.ers.usda.gov/data-products/food-
desert-locator/about-the-locator.aspx#Defined
Wrigley, N., Warm, D., Margetts, B., & Whelan, A. (2002). Assessing the Impact of
Improved Retail Access on Diet in a “Food Desert”: A Preliminary Report.
Urban Studies, 39(11), 2061–2082. doi:10.1080/0042098022000011362

ATINER CONFERENCE PAPER SERIES No: PLA2013-0490
14
Figures Appendix
Figure 1. A. Left: 2011 Energy Consumption estimates by sector [Source:
Energy Protection Agency (EPA) Data] / B. Right: Electricity Flow Chart
[Source: U.S. Energy Information Administration]
Figure 2. Case studies classification keys for different systems, locations and
scales
Figure 3. Documentation of case studies (Sample Card of Toolkit)

ATINER CONFERENCE PAPER SERIES No: PLA2013-0490
15
Figure 4. Toolkit for Urban Regenerative Environments
Figure 5. Map of the Northern Liberties area

ATINER CONFERENCE PAPER SERIES No: PLA2013-0490
16
Figure 61. Model of energy, water, food and waste flows through a typical
community served by centralized infrastructures
Figure 7. Model of energy, water, food and waste flows through a community
which uses decentralized systems as back-up mechanisms. Reduction of inputs
and outputs is noticed