ATHENA SWAN SILVER AWARD - Queen's University Belfast · 2019-12-17 · Athena SWAN Silver...
76
1 Athena SWAN Silver Department award renewal application Name of institution: Queen’s University Belfast Date of application: April 2016 Department: School of Medicine, Dentistry and Biomedical Sciences Contact for application: Professor Karen McCloskey and Dr Michelle McKinley Email: [email protected] Telephone: 02890 972386 Departmental website address: http://www.qub.ac.uk/schools/mdbs/ Date of previous award: May 2013 Date of university Bronze and/or Silver SWAN award: Silver May 2015 Level of award applied for: Silver
Transcript of ATHENA SWAN SILVER AWARD - Queen's University Belfast · 2019-12-17 · Athena SWAN Silver...
1
Athena SWAN Silver Department award renewal application
Name of institution: Queen’s University Belfast Date of application: April 2016 Department: School of Medicine, Dentistry and Biomedical Sciences Contact for application: Professor Karen McCloskey and Dr Michelle McKinley Email: [email protected] Telephone: 02890 972386 Departmental website address: http://www.qub.ac.uk/schools/mdbs/ Date of previous award: May 2013 Date of university Bronze and/or Silver SWAN award: Silver May 2015 Level of award applied for: Silver

2
Table of Contents
1. Dean of School’s Letter of endorsement 5
2. The self-assessment process 7
3. A picture of the School 10
4. Key transition points 33
5. Career development 42
6. Organisation and culture 46
7. Flexibility and managing career breaks 55
8. Any other comments 58
9. Case studies 60
10. Review of 2012-2015 Action Plan 62
11. 2016-2019 Renewal Action plan 69

3
List of Abbreviations BMS Biomedical Science
CATF Clinical Academic Teaching Fellow
CBSE Centre for Biomedical Science Education
CCRCB Centre for Cancer Research and Cell Biology
CD Centre for Dentistry
CEM Centre for Experimental Medicine
CII Centre for Infection and Immunity
CL Clinical Lecturer
CME Centre for Medical Education
CSL Clinical Senior Lecturer
CR Clinical Reader
CP Clinical Professor
CTF Clinical Teaching Fellow
CPH Centre for Public Health
Dean Dean of the School of Medicine, Dentistry and Biomedical Sciences
DENT Dentistry
EOU Equal Opportunities Unit
FT Full-time
GE Gender Equality
GEC Gender Equality Committee
GEO Gender Equality Office
HEIDI Higher Education Information Database for Institutions
HESA Higher Education Statistics Agency
HR Human Resources
JACS Joint Academic Coding System
L Lecturer
MD Doctor of Medicine
MED Medicine
MPH Masters in Public Health
MRes Master of Research
MSc Master of Science
NI Northern Ireland
PG Postgraduate
PGR Post-graduate research
PGT Post-graduate taught
4
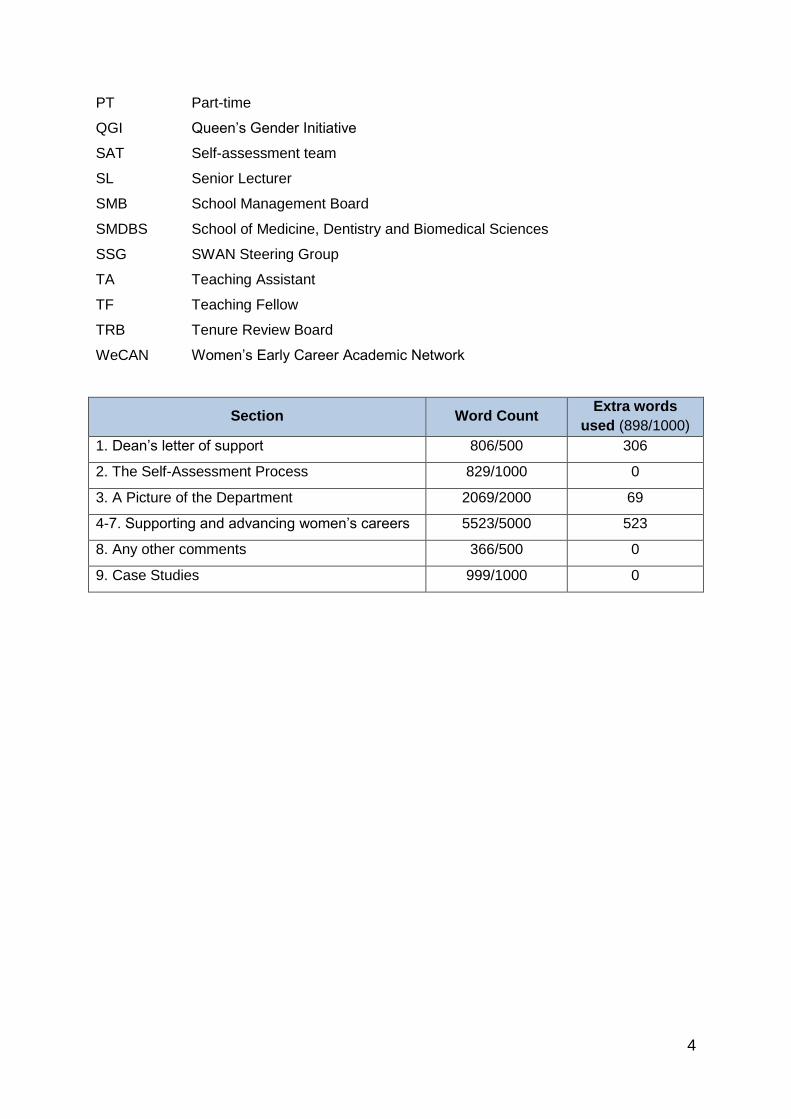
PT Part-time
QGI Queen’s Gender Initiative
SAT Self-assessment team
SL Senior Lecturer
SMB School Management Board
SMDBS School of Medicine, Dentistry and Biomedical Sciences
SSG SWAN Steering Group
TA Teaching Assistant
TF Teaching Fellow
TRB Tenure Review Board
WeCAN Women’s Early Career Academic Network
Section Word Count Extra words
used (898/1000)
1. Dean’s letter of support 806/500 306
2. The Self-Assessment Process 829/1000 0
3. A Picture of the Department 2069/2000 69
4-7. Supporting and advancing women’s careers 5523/5000 523
8. Any other comments 366/500 0
9. Case Studies 999/1000 0
5
1. Letter of endorsement from the Head of Department – maximum 500 words
School of Medicine, Dentistry and Biomedical Sciences Queen’s University
Belfast Office of the Dean
Whitla Medical Building 97 Lisburn Road
Belfast BT9 7BL Tel. +44 (0) 28 9097 2764
[email protected] www.qub.ac.uk/schools/mdb
s
28th April, 2016
Ms Sarah Dickinson
Athena SWAN Manager
Equality Challenge Unit,
7th floor, Queens House,
55/56 Lincoln’s Inn Fields,
London WC2A 3LJ
Dear Sarah,
I unreservedly endorse this application for a renewal of our Athena SWAN Silver Award. Our 2013
award was a landmark event in our School and both my predecessor, Professor Johnston (now
President and Vice-Chancellor of QUB) and myself are immensely proud of the progress that the
School has made.
Gender Equality is now embedded in all aspects of the work of our School of Medicine, Dentistry and
Biomedical Sciences. It has impacted the culture from the senior leadership through to staff and
students in our education and research programmes. The School’s Gender Equality Office (GEO)
under the Directorship of Professor Karen McCloskey is a beacon activity, ensuring that the SWAN
Action Plan is implemented, realised and exceeded. This has been resourced through provision of
postdoctoral research support for Professor McCloskey and dedicated administrative assistance
funded by the School. The impact of the School’s GEO was the subject of an invited article in the
Medical and Dental Schools Athena SWAN newsletter. It is a credit to the work of the GEO
Committee, which represents students and staff at all grades, that Gender Equality principles are now
part of the mainstream culture in the School.
As Dean, I am committed to the development and progression of all of our staff. In particular, I have
sought to address under-representation of women at senior academic levels and am encouraged proud
that 62% of our Lecturers, 41% of Senior Lecturers and 40% of Readers are now female. We will
continue to make significant progress and now have a target of 30% female Professors by 2019.
Women continue to be successful at promotion in our School. Figures for 2015, just released, show
100% success for females (4/4 promoted) and 75% for males (3/4 promoted). In recognition that
women may be more reluctant than men to apply for promotion, I will lead a group comprising our
Centre Directors which will proactively identify female staff who are reaching the promotion criteria,
to mentor them towards a successful application.
6
Over the last 3 years, we recruited a significant number of academic staff and I am encouraged that
we achieved parity between female and male appointments at Lecturer level. We actively sought
applications from women for senior academic positions through the use of welcoming statements,
recruitment agencies and academic/clinical networks. In spite of this, recruiting women to the
Professoriate has been challenging. I am committed to doing everything possible to improve this
situation from implementing Unconscious Bias training to staff on recruitment panels, appointing
50/50 female/male search committees and working with professional organisations. I am determined
to ensure we have a culture of equality of opportunity within this School.
Mentorship and support are key elements of our Action Plan and we have partnered with Dr Amy
Iversen with support from the Academy of Medical Sciences to implement a School Mentoring
Scheme. Initially piloted to Clinical Trainees and Research Fellows, this Scheme is now in its second
year with excellent feedback from the first cohort. Our Women’s early Career Academic Network
(WeCAN) meetings provide support, networking and discussion fora and I commend Dr Michelle
McKinley’s leadership of one of our most successful initiatives.
In our previous Action Plan, Key Performance Indicators were set for Senior Managers (Centre
Directors) and the Dean ensuring that ownership was with key decision makers. I have been very
encouraged with one of the impacts of our Award; 3 women have been appointed as Centre Deputy
Directors with decisive leadership responsibilities. To further increase opportunity for women in
leadership roles, I have changed the criteria so that all Senior Lecturers, Readers and Professors are
eligible to apply where previously, only the Professoriate were eligible. I am committed to supporting
women for leadership training and the School has sponsored the GEO Director for the highly-
competitive ‘Excellence Leadership Development Programme’ in QUB. Specific SWAN-objectives
embedded within all appraisals has enabled me to ensure that all staff are engaged with SWAN and
the GEO’s remit and I am pleased that this action has been achieved.
Women in our School continue to excel in Research, Education and Leadership. An excellent example
is Dr Denise Fitzgerald who has recently been awarded a prestigious Wellcome Fellowship (£1.8m)
and prior to this was promoted to Senior Lecturer. Dr Sandra McAllister (Academic Clinical Lecturer)
has been awarded a place in the Academy of Medical Sciences pilot SUSTAIN initiative - Supporting
Women’s Careers in Science. Such women represent role models for those around them and leaders
of the future. We are working together to ensure that their ambition and well-earned successes
become the norm within the School.
This application, and its Action Plan, has my unreserved support and I look forward to the continuing
impact of Athena SWAN principles across our School as we now endeavour to further develop our
Gender Equality programme towards a Gold Athena SWAN award.
Yours sincerely,
Professor J. Stuart Elborn
Dean of the School of Medicine, Dentistry and Biomedical Sciences
7
2. The self-assessment process – maximum 1000 words Describe the Self-Assessment Process. This should include:
a) A description of the self-assessment team: members’ roles (both within the department and as part of the team) and their experiences of work-life balance, parental leave, flexible working etc;
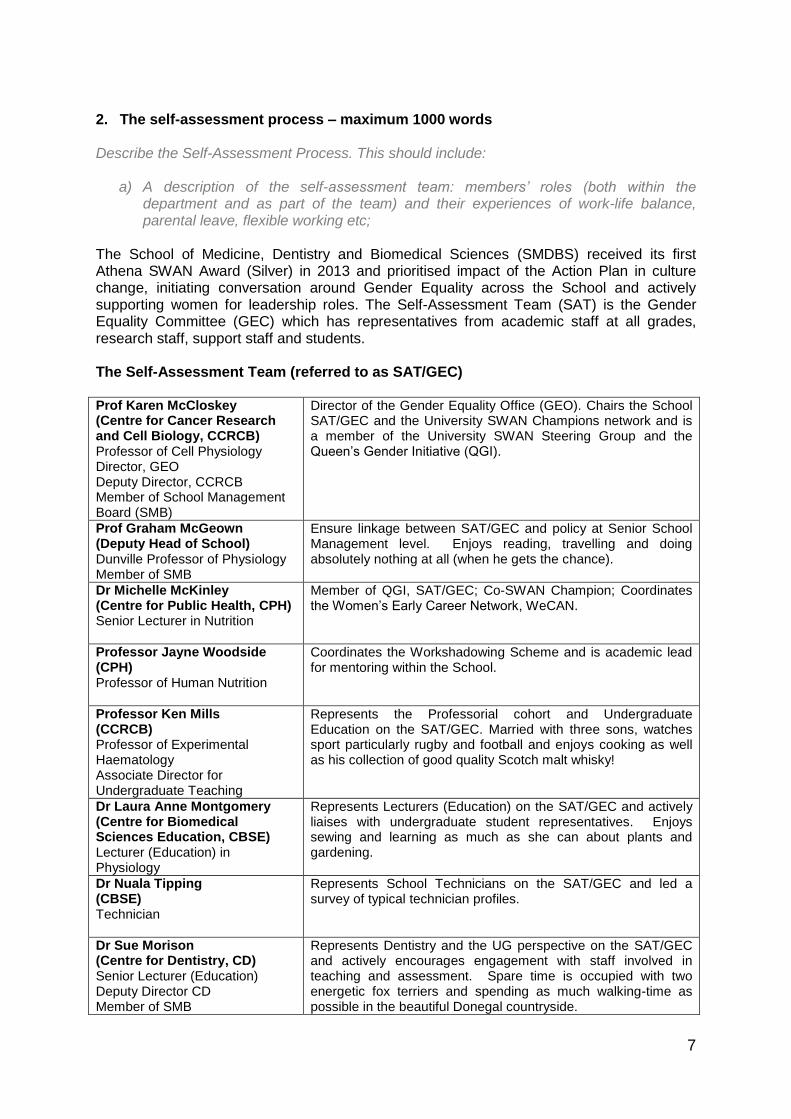
The School of Medicine, Dentistry and Biomedical Sciences (SMDBS) received its first Athena SWAN Award (Silver) in 2013 and prioritised impact of the Action Plan in culture change, initiating conversation around Gender Equality across the School and actively supporting women for leadership roles. The Self-Assessment Team (SAT) is the Gender Equality Committee (GEC) which has representatives from academic staff at all grades, research staff, support staff and students. The Self-Assessment Team (referred to as SAT/GEC) Prof Karen McCloskey (Centre for Cancer Research and Cell Biology, CCRCB) Professor of Cell Physiology Director, GEO Deputy Director, CCRCB Member of School Management Board (SMB)
Director of the Gender Equality Office (GEO). Chairs the School SAT/GEC and the University SWAN Champions network and is a member of the University SWAN Steering Group and the Queen’s Gender Initiative (QGI).
Prof Graham McGeown (Deputy Head of School) Dunville Professor of Physiology Member of SMB
Ensure linkage between SAT/GEC and policy at Senior School Management level. Enjoys reading, travelling and doing absolutely nothing at all (when he gets the chance).
Dr Michelle McKinley (Centre for Public Health, CPH) Senior Lecturer in Nutrition
Member of QGI, SAT/GEC; Co-SWAN Champion; Coordinates the Women’s Early Career Network, WeCAN.
Professor Jayne Woodside (CPH) Professor of Human Nutrition
Coordinates the Workshadowing Scheme and is academic lead for mentoring within the School.
Professor Ken Mills (CCRCB) Professor of Experimental Haematology Associate Director for Undergraduate Teaching
Represents the Professorial cohort and Undergraduate Education on the SAT/GEC. Married with three sons, watches sport particularly rugby and football and enjoys cooking as well as his collection of good quality Scotch malt whisky!
Dr Laura Anne Montgomery (Centre for Biomedical Sciences Education, CBSE) Lecturer (Education) in Physiology
Represents Lecturers (Education) on the SAT/GEC and actively liaises with undergraduate student representatives. Enjoys sewing and learning as much as she can about plants and gardening.
Dr Nuala Tipping (CBSE) Technician
Represents School Technicians on the SAT/GEC and led a survey of typical technician profiles.
Dr Sue Morison (Centre for Dentistry, CD) Senior Lecturer (Education) Deputy Director CD Member of SMB
Represents Dentistry and the UG perspective on the SAT/GEC and actively encourages engagement with staff involved in teaching and assessment. Spare time is occupied with two energetic fox terriers and spending as much walking-time as possible in the beautiful Donegal countryside.
8
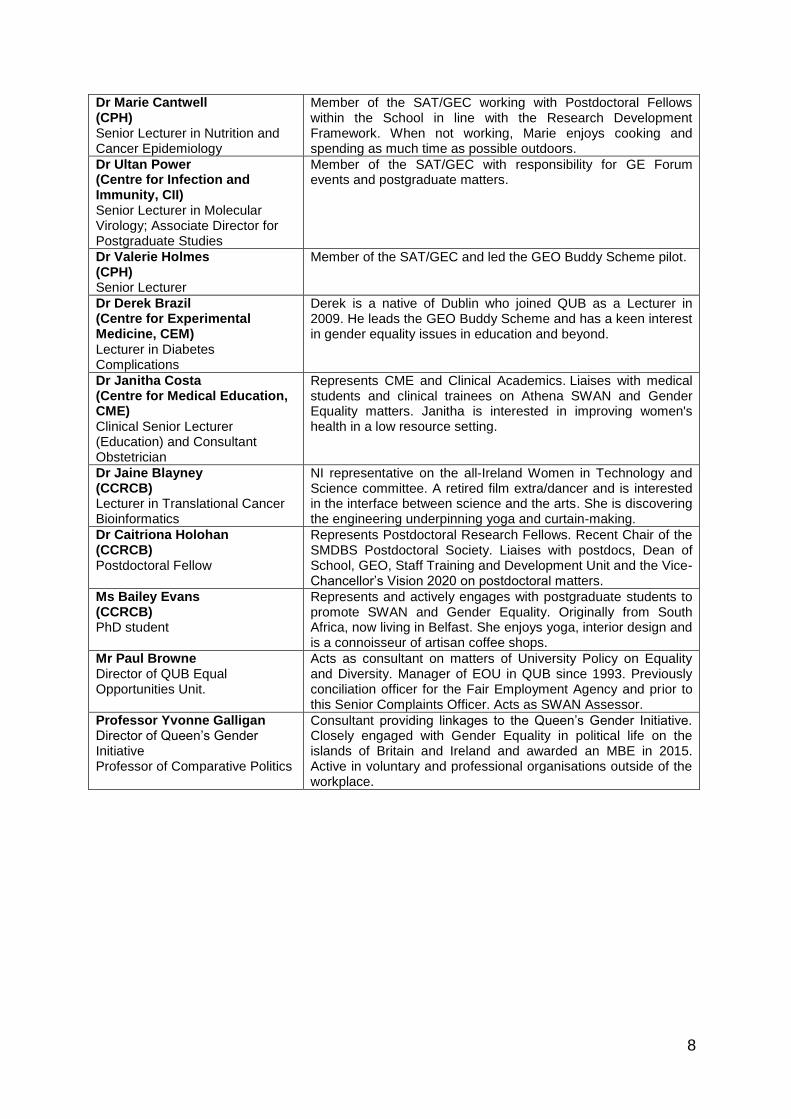
Dr Marie Cantwell (CPH) Senior Lecturer in Nutrition and Cancer Epidemiology
Member of the SAT/GEC working with Postdoctoral Fellows within the School in line with the Research Development Framework. When not working, Marie enjoys cooking and spending as much time as possible outdoors.
Dr Ultan Power (Centre for Infection and Immunity, CII) Senior Lecturer in Molecular Virology; Associate Director for Postgraduate Studies
Member of the SAT/GEC with responsibility for GE Forum events and postgraduate matters.
Dr Valerie Holmes (CPH) Senior Lecturer
Member of the SAT/GEC and led the GEO Buddy Scheme pilot.
Dr Derek Brazil (Centre for Experimental Medicine, CEM) Lecturer in Diabetes Complications
Derek is a native of Dublin who joined QUB as a Lecturer in 2009. He leads the GEO Buddy Scheme and has a keen interest in gender equality issues in education and beyond.
Dr Janitha Costa (Centre for Medical Education, CME) Clinical Senior Lecturer (Education) and Consultant Obstetrician
Represents CME and Clinical Academics. Liaises with medical students and clinical trainees on Athena SWAN and Gender Equality matters. Janitha is interested in improving women's health in a low resource setting.
Dr Jaine Blayney (CCRCB) Lecturer in Translational Cancer Bioinformatics
NI representative on the all-Ireland Women in Technology and Science committee. A retired film extra/dancer and is interested in the interface between science and the arts. She is discovering the engineering underpinning yoga and curtain-making.
Dr Caitriona Holohan (CCRCB) Postdoctoral Fellow
Represents Postdoctoral Research Fellows. Recent Chair of the SMDBS Postdoctoral Society. Liaises with postdocs, Dean of School, GEO, Staff Training and Development Unit and the Vice-Chancellor’s Vision 2020 on postdoctoral matters.
Ms Bailey Evans (CCRCB) PhD student
Represents and actively engages with postgraduate students to promote SWAN and Gender Equality. Originally from South Africa, now living in Belfast. She enjoys yoga, interior design and is a connoisseur of artisan coffee shops.
Mr Paul Browne Director of QUB Equal Opportunities Unit.
Acts as consultant on matters of University Policy on Equality and Diversity. Manager of EOU in QUB since 1993. Previously conciliation officer for the Fair Employment Agency and prior to this Senior Complaints Officer. Acts as SWAN Assessor.
Professor Yvonne Galligan Director of Queen’s Gender Initiative Professor of Comparative Politics
Consultant providing linkages to the Queen’s Gender Initiative. Closely engaged with Gender Equality in political life on the islands of Britain and Ireland and awarded an MBE in 2015. Active in voluntary and professional organisations outside of the workplace.
9
b) an account of the self assessment process, with reference to year-on-year activities
since the original Department award application, details of the self assessment team meetings, including any consultation with staff or individuals inside or outside of the university, and how these have fed into the submission;
The GEO sits within the School Office and is supported administratively by a clerical assistant and an annual budget funded by the School. The GEC meets as a full committee 6 times per year and monitors Gender Equality (GE) across the School, challenges the culture, implements initiatives and makes recommendations to the SMB. The GEO Director is a member of the Professoriate and the SMB. Each member has responsibility for particular parts of the Action Plan and brings an update to GEC meetings, having submitted a report for inclusion as an agenda item. Smaller groups meet between GEC meetings to plan initiatives and events. The GEO Director monitors progress towards objectives of the Action Plan and supports members in their remits. Our approach to embedding GE/SWAN principles within the School culture was to engage in dialogue/discussion with staff and students through: (i) Focus Groups on specific aspects of the Action Plan and any emerging issues (typically 2-3 per year); (ii) surveys at all events/initiatives and (iii) GE Forums for all staff. In addition, we conduct a biennial Culture Survey. For our baseline in 2013, we participated in an ECU research survey led by Dr F Munir ‘Evaluating the effectiveness and impact of the Athena SWAN Charter’ http://www.ecu.ac.uk/publications/evaluating-athena-swan/. Unfortunately, due to unforeseen circumstances, the authors were unable to disaggregate QUB SMDBS data as per our agreement, however, we implemented a similar Culture Survey in 2015-16 (next survey 2017-18) and are reporting the 2015-16 findings in the present application. Dissemination of SWAN-related information occurs at School Board, SMB, in Centres by
GEC members, the GEO section of the School website, Twitter, Facebook and email. (http://www.qub.ac.uk/schools/mdbs/AboutUs/GenderEqualityOffice/)
A Sharepoint site on the University intranet was utilised by GEC/SAT members in preparation of this submission; this resource also serves as an archive of SWAN/GE data and information. GEC meeting agendas and minutes with action points are available via Sharepoint and email. Completion of the application was a collaborative effort by the GEC/SAT in consultation with University and External Advisors. The application was presented to the SMB for discussion and sign-off. The GEC consults with the Queen’s University Gender Initiative (QGI) and the Equal Opportunities Unit (EOU) whose Directors regularly attend GEC meetings. The GEO Director was invited to speak at a SWAN Symposium in University College Dublin and acted as Consultant to Dr Patricia Maguire’s team in their initial planning for SWAN applications. She also participated in an EUFP7 Forum of the INTEGER group at the GESIS Institute in Cologne, Germany (http://www.gesis.org/en/institute/), sharing our Athena SWAN experience and its impact across the School. This served to inform essential elements of our 2016 Action Plan, particularly targeting gender balance across senior academic roles. The GEC met with External Consultants Ms Caroline Fox and Dr Sean McWhinnie in 2014 to review impact of the Action Plan and develop further actions to sustain progress and provide beacon activity for other schools and institutions.
c) Plans for the future of the self-assessment team, such as how often the team will continue to meet, any reporting mechanisms and in particular how the self-assessment team intends to monitor implementation of the action plan.
10
Figure (i)
The GEC is a permanent entity within the School and will continue to meet as a full committee 6 times per year with sub-groups meeting more frequently to plan/implement initiatives contained with the annual programme. Membership of the GEC is recognized within the School Workload Allocation Model (WAM). The GEO Director is a member of the SMB where the SWAN/GEO report is a standing item at monthly meetings. In addition, GE is a standing item at the School Board and Senior Management Teams in each of the Centres. Core members of the GEC will remain constant (GEO Director, Deputy HoS; SWAN Champion, Equal Opportunities Manager); other roles will rotate over time increasing the number of colleagues throughout the School who will promote GE. Dissemination of SWAN-related information will continue at School Board, SMB, GEO website, social media
and email. The GEO, in liaison with the Dean, will take the lead in implementation of the
Action Plan. The School has 7 Centres each having a Director and Administrative Manager (details below), both of whom attend the SMB where the work of the GEO is a standing item. Centre Directors have GE-related Key Performance Indicators (KPIs) (Action 5.4) and this is monitored by the Dean of School at Centre review and individual annual appraisals. In addition, each Centre is represented on the GEC ensuring two-way dissemination of information. Our practice is to review School data over the summer months and prepare an Interim report which the GEO Director presents to the SMB. The annual programme of the GEO is also planned over the summer period. Progress against the Action Plan will also be reviewed at each GEC meeting. 3. A picture of the department – maximum 2000 words
a) Provide a pen-picture of the department to set the context for the application, outlining in particular any significant changes since the original award.
SMDBS is the largest School in the University, with 1,890 undergraduate students, 271 postgraduate taught students, 196 postgraduate research students, 196 research staff and 198 academic staff (2014/15 data). Geographically, SMDBS is located on the Belfast City Hospital Campus and the Royal Victoria Hospital Campus (15-minute walk between sites). The estate has dedicated areas for teaching, social areas for students and staff and research centres are located in dedicated research buildings within the campus. The University is a Russell Group member and SMDBS’ research was ranked 7th and 8th out of 32 in the UK for research intensity in Public Health and Clinical Medicine respectively in the 2014 Research Excellence Framework. Testimony of the quality undergraduate experience in SMDBS was provided by the Sunday Times UK University Guide, 2013 in which SMDBS was listed 1st in Medical Science and 4th in Medicine and Dentistry. Our degrees are accredited by the General Medical Council, the General Dental Council and the Institute of Biomedical Sciences.
SMDBS is organised into 3 Education Centres and 4 Research Centres (Figure i), overseen by the Dean. Staff are members of either a Research or Education Centre. Each Centre has a Director, Deputy
11
Director(s), Associate Directors for Postgraduate or Undergraduate Education and supporting committees. Centre Directors have devolved responsibility for all resources including personnel, financial and infrastructure. Our staff categories include Lecturer (L), Clinical Lecturer (CL), Senior Lecturer (SL), Clinical Senior Lecturer (CSL), Reader (R), Clinical Reader (CR), Professor (P) and Clinical Professor (CP) in addition to Academic Clinical Fellow (ACF) and Academic Clinical Lecturer (ACL); the latter 2 are training positions. Within Medicine and Dentistry Education Centres, Clinical Teaching Fellows (CTF) are employed for clinical teaching on a sessional basis (not employed under the academic contractual framework) in addition to Teaching Assistants (TA). Honorary appointments are held by NHS staff in the School.
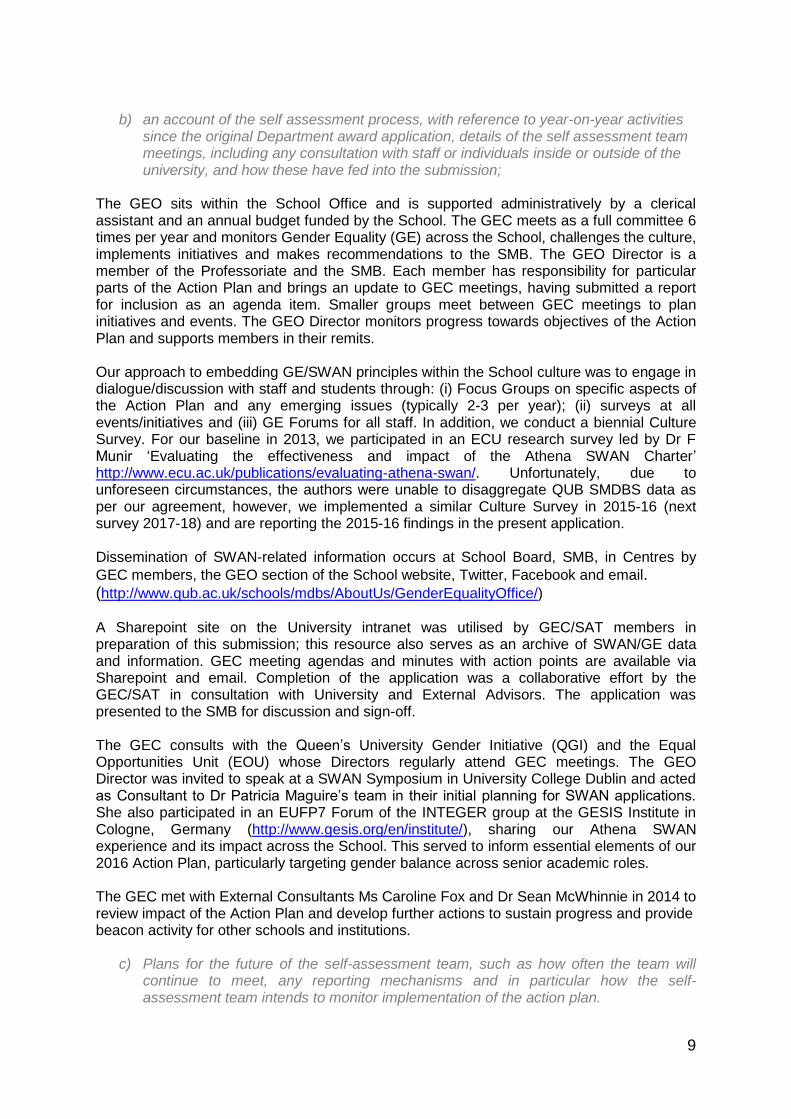
Gender representation across the Centres is shown below (Figures 1-7), and we note improvements with increased number of female academics in 3 of the 7 Centres. Encouragingly, 3 Centres now have gender balance in academic staff. This progress has been achieved through recruitment. (a) Centre for Cancer Research and Cell Biology (CCRCB)
PE
RC
EN
TA
GE
(%
) O
F S
TA
FF
02
04
06
08
01
00
20%
80%
17%
83%
20%
80%
20%
80%
19%
81%
57%
43%
62%
38%
54%
46%
56%
44%
57%
43%
n=6
n=24
n=5
n=24
n=6
n=24
n=6
n=24
n=6
n=26
n=35
n=26
n=32
n=20
n=26
n=22
n=28
n=22
n=32
n=24
2010-2011 2011-2012 2012-2013 2013-2014 2014-2015 2010-2011 2011-2012 2012-2013 2013-2014 2014-2015
Female
Male
YEAR: CCRCB ACADEMIC STAFF YEAR: CCRCB RESEARCH STAFF
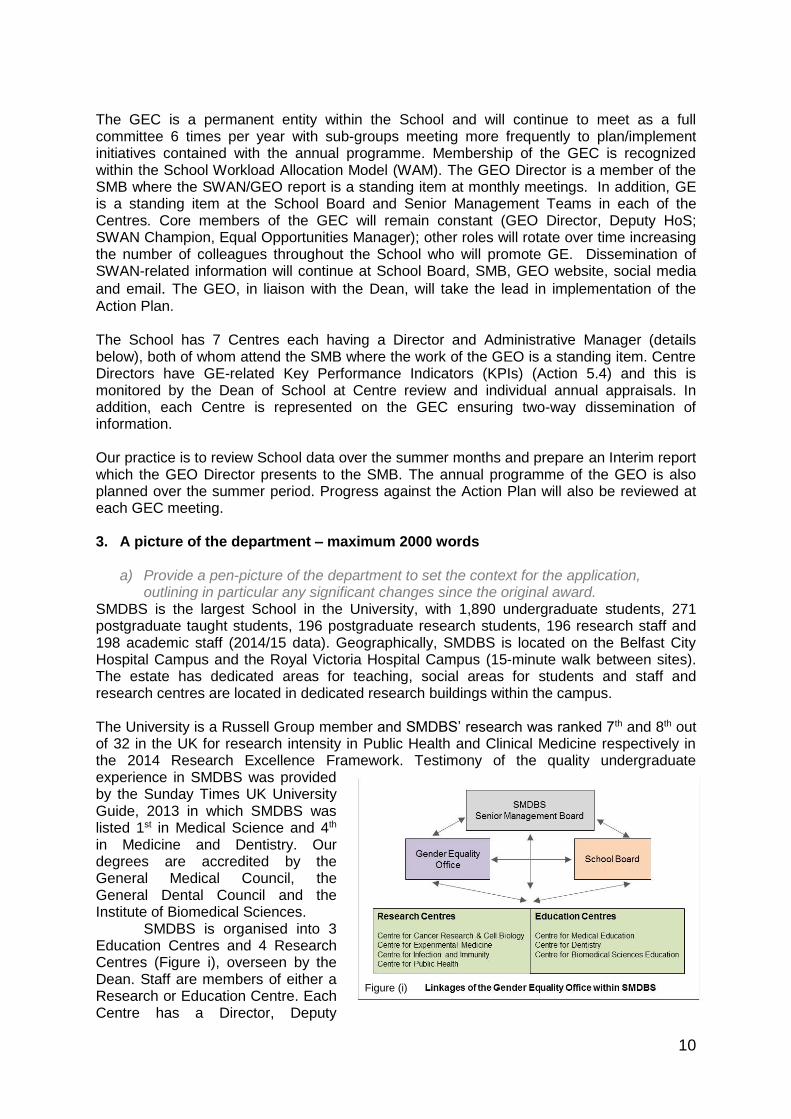
Figure 1. Profile of academic and research staff in CCRCB by gender. (b) Centre for Experimental Medicine (CEM)
PE
RC
EN
TA
GE
(%
) O
F S
TA
FF
02
04
06
08
01
00
26%
74%
31%
69%
35%
65%
40%
60%
43%
57%
62%
38%
65%
35%
65%
35%
65%
35%
65%
35%
n=5
n=14
n=5
n=11
n=6
n=11
n=8
n=12
n=9
n=12
n=10
n=6
n=11
n=6
n=15
n=8
n=15
n=8
n=17
n=9
2010-2011 2011-2012 2012-2013 2013-2014 2014-2015 2010-2011 2011-2012 2012-2013 2013-2014 2014-2015
Female
Male
YEAR: CEM ACADEMIC STAFF YEAR: CEM RESEARCH STAFF
Figure 2. Profile of academic and research staff in CEM by gender.
12
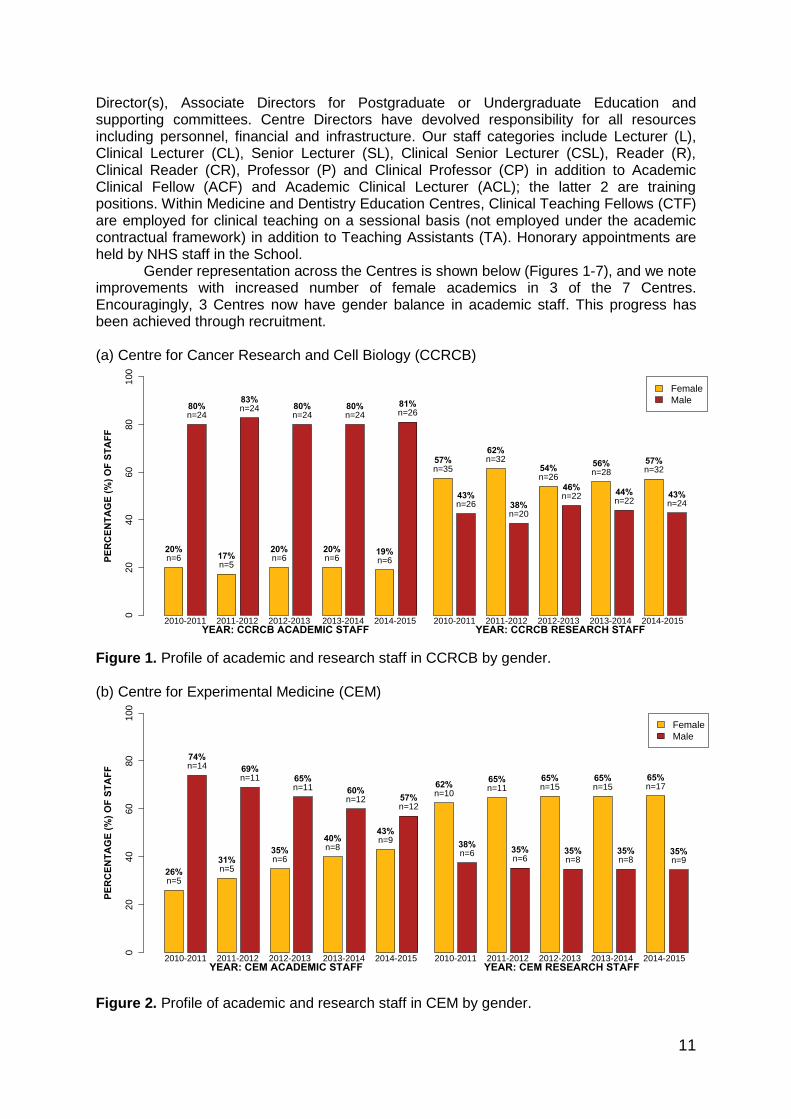
(c) Centre for Infection and Immunity (CII) P
ER
CE
NT
AG
E (
%)
OF
ST
AF
F
02
04
06
08
01
00
43%
57%
45%
55%
50% 50% 50% 50%
45%
55%
64%
36%
54%
46%
68%
32%
67%
33%
70%
30%
n=9
n=12
n=9
n=11
n=12 n=12 n=12 n=12
n=10
n=12
n=23
n=13
n=14
n=12
n=17
n=8
n=22
n=11
n=21
n=9
2010-2011 2011-2012 2012-2013 2013-2014 2014-2015 2010-2011 2011-2012 2012-2013 2013-2014 2014-2015
Female
Male
YEAR: CII ACADEMIC STAFF YEAR: CII RESEARCH STAFF
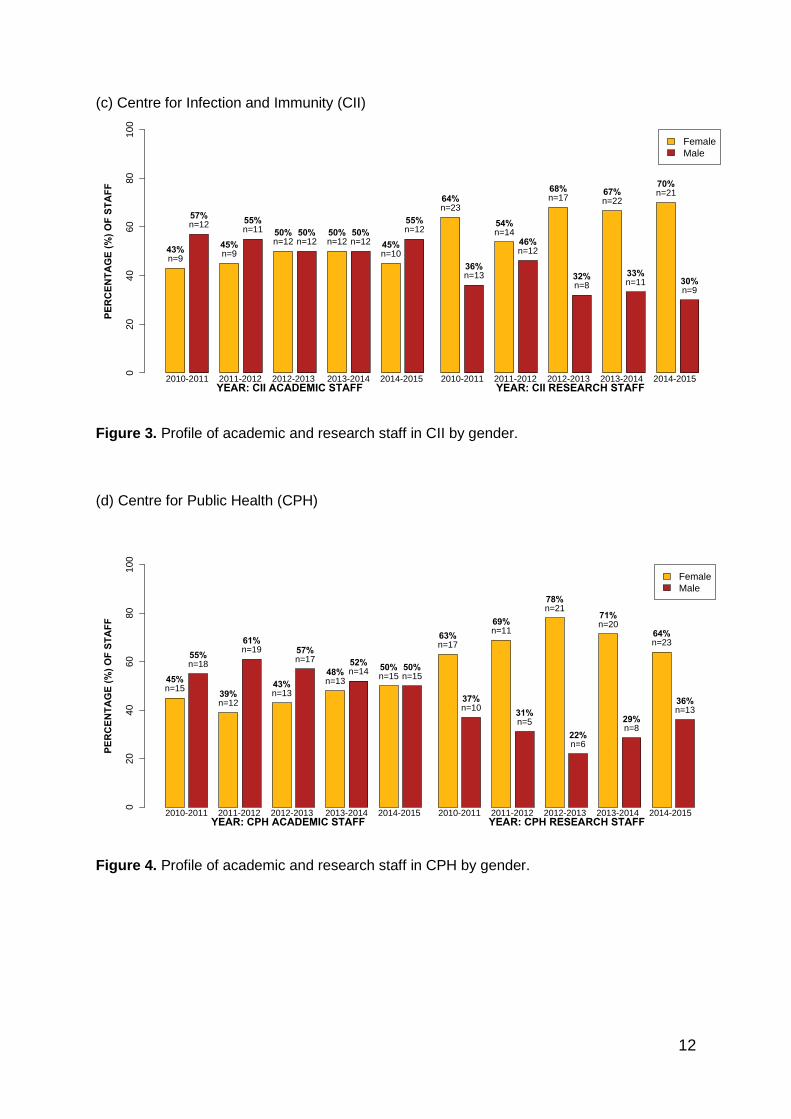
Figure 3. Profile of academic and research staff in CII by gender. (d) Centre for Public Health (CPH)
PE
RC
EN
TA
GE
(%
) O
F S
TA
FF
02
04
06
08
01
00
45%
55%
39%
61%
43%
57%
48%52%
50% 50%
63%
37%
69%
31%
78%
22%
71%
29%
64%
36%
n=15
n=18
n=12
n=19
n=13
n=17
n=13n=14
n=15 n=15
n=17
n=10
n=11
n=5
n=21
n=6
n=20
n=8
n=23
n=13
2010-2011 2011-2012 2012-2013 2013-2014 2014-2015 2010-2011 2011-2012 2012-2013 2013-2014 2014-2015
Female
Male
YEAR: CPH ACADEMIC STAFF YEAR: CPH RESEARCH STAFF
Figure 4. Profile of academic and research staff in CPH by gender.

13
PE
RC
EN
TA
GE
(%
) O
F S
TA
FF
02
040
60
80
10
0
29%
71%
32%
68%
32%
68%
29%
71%
25%
75%
n=8
n=20
n=9
n=19
n=9
n=19
n=8
n=20
n=7
n=21
2010-2011 2011-2012 2012-2013 2013-2014 2014-2015
Female
Male
YEAR: CME ACADEMIC STAFF
PE
RC
EN
TA
GE
(%
) O
F S
TA
FF
02
040
60
80
10
0
77%
23%
69%
31%
75%
25%
77%
23%
82%
18%
n=10
n=3
n=9
n=4
n=9
n=3
n=10
n=3
n=9
n=2
2010-2011 2011-2012 2012-2013 2013-2014 2014-2015
Female
Male
YEAR: CME CTF/TA STAFF
PE
RC
EN
TA
GE
(%
) O
F S
TA
FF
020
40
60
80
10
0
86%
14%
83%
17%
87%
13%
93%
7%
86%
14%
n=6
n=1
n=10
n=2
n=13
n=12
n=14
n=1
n=12
n=2
2010-2011 2011-2012 2012-2013 2013-2014 2014-2015
Female
Male
YEAR: CDE CTF
PE
RC
EN
TA
GE
(%
) O
F S
TA
FF
020
40
60
80
10
0
33%
67%
33%
67%
30%
70%
47%
53%50% 50%
n=3
n=6
n=3
n=6
n=3
n=7
n=7
n=8n=7 n=7
2010-2011 2011-2012 2012-2013 2013-2014 2014-2015
Female
Male
YEAR: CDE ACADEMIC
(e) Centre for Medical Education (CME)
Figure 5. Profile of academic staff (left graph) and Clinical Teaching Fellows/Teaching Assistants (right graph) in CME by gender. (f) Centre for Dentistry
Figure 6. Profile of academic staff (left graph) and Clinical Teaching Fellows (right graph) in CD by gender

14
(g) Centre for Biomedical Sciences Education
PE
RC
EN
TA
GE
(%
) O
F S
TA
FF
02
04
06
08
01
00
43%
57%
42%
58%
42%
58%
38%
62%
50% 50%
n=6
n=8
n=5
n=7
n=5
n=7
n=5
n=8
n=6 n=6
2010-2011 2011-2012 2012-2013 2013-2014 2014-2015
Female
Male
YEAR: CBSE ACADEMIC STAFF
Figure 7. Profile of academic staff in CBSE by gender. Note this Centre had 1 female and 1 male TA for each of the 5 years (not included in graph).
15
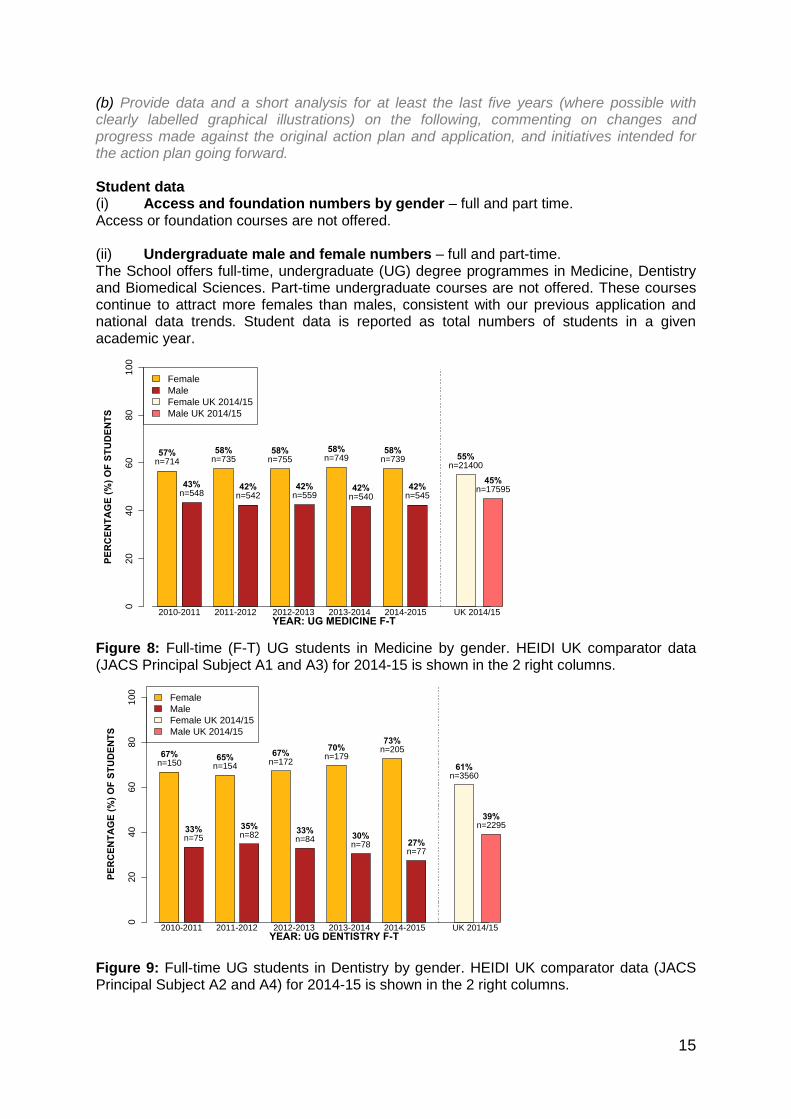
(b) Provide data and a short analysis for at least the last five years (where possible with clearly labelled graphical illustrations) on the following, commenting on changes and progress made against the original action plan and application, and initiatives intended for the action plan going forward.
Student data (i) Access and foundation numbers by gender – full and part time. Access or foundation courses are not offered. (ii) Undergraduate male and female numbers – full and part-time. The School offers full-time, undergraduate (UG) degree programmes in Medicine, Dentistry and Biomedical Sciences. Part-time undergraduate courses are not offered. These courses continue to attract more females than males, consistent with our previous application and national data trends. Student data is reported as total numbers of students in a given academic year.
PE
RC
EN
TA
GE
(%
) O
F S
TU
DE
NT
S
02
04
06
08
01
00
57%
43%
58%
42%
58%
42%
58%
42%
58%
42%
55%
45%
n=714
n=548
n=735
n=542
n=755
n=559
n=749
n=540
n=739
n=545
n=21400
n=17595
2010-2011 2011-2012 2012-2013 2013-2014 2014-2015 UK 2014/15
Female
Male
Female UK 2014/15
Male UK 2014/15
YEAR: UG MEDICINE F-T
Figure 8: Full-time (F-T) UG students in Medicine by gender. HEIDI UK comparator data (JACS Principal Subject A1 and A3) for 2014-15 is shown in the 2 right columns.
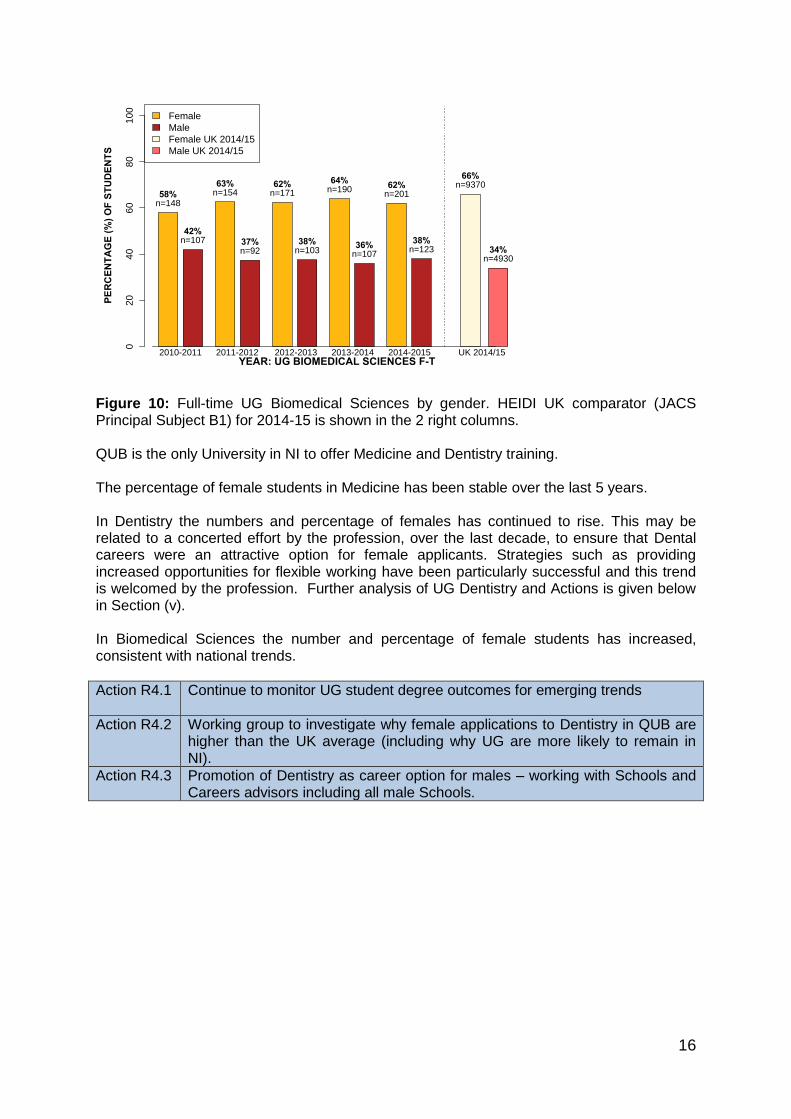
Figure 9: Full-time UG students in Dentistry by gender. HEIDI UK comparator data (JACS Principal Subject A2 and A4) for 2014-15 is shown in the 2 right columns.
PE
RC
EN
TA
GE
(%
) O
F S
TU
DE
NT
S
020
40
60
80
10
0
67%
33%
65%
35%
67%
33%
70%
30%
73%
27%
61%
39%
n=150
n=75
n=154
n=82
n=172
n=84
n=179
n=78
n=205
n=77
n=3560
n=2295
2010-2011 2011-2012 2012-2013 2013-2014 2014-2015 UK 2014/15
Female
Male
Female UK 2014/15
Male UK 2014/15
YEAR: UG DENTISTRY F-T
16
PE
RC
EN
TA
GE
(%
) O
F S
TU
DE
NT
S
020
40
60
80
10
0
58%
42%
63%
37%
62%
38%
64%
36%
62%
38%
66%
34%
n=148
n=107
n=154
n=92
n=171
n=103
n=190
n=107
n=201
n=123
n=9370
n=4930
2010-2011 2011-2012 2012-2013 2013-2014 2014-2015 UK 2014/15
Female
Male
Female UK 2014/15
Male UK 2014/15
YEAR: UG BIOMEDICAL SCIENCES F-T
Figure 10: Full-time UG Biomedical Sciences by gender. HEIDI UK comparator (JACS Principal Subject B1) for 2014-15 is shown in the 2 right columns. QUB is the only University in NI to offer Medicine and Dentistry training. The percentage of female students in Medicine has been stable over the last 5 years. In Dentistry the numbers and percentage of females has continued to rise. This may be related to a concerted effort by the profession, over the last decade, to ensure that Dental careers were an attractive option for female applicants. Strategies such as providing increased opportunities for flexible working have been particularly successful and this trend is welcomed by the profession. Further analysis of UG Dentistry and Actions is given below in Section (v). In Biomedical Sciences the number and percentage of female students has increased, consistent with national trends.
Action R4.1 Continue to monitor UG student degree outcomes for emerging trends
Action R4.2 Working group to investigate why female applications to Dentistry in QUB are higher than the UK average (including why UG are more likely to remain in NI).
Action R4.3 Promotion of Dentistry as career option for males – working with Schools and Careers advisors including all male Schools.
17
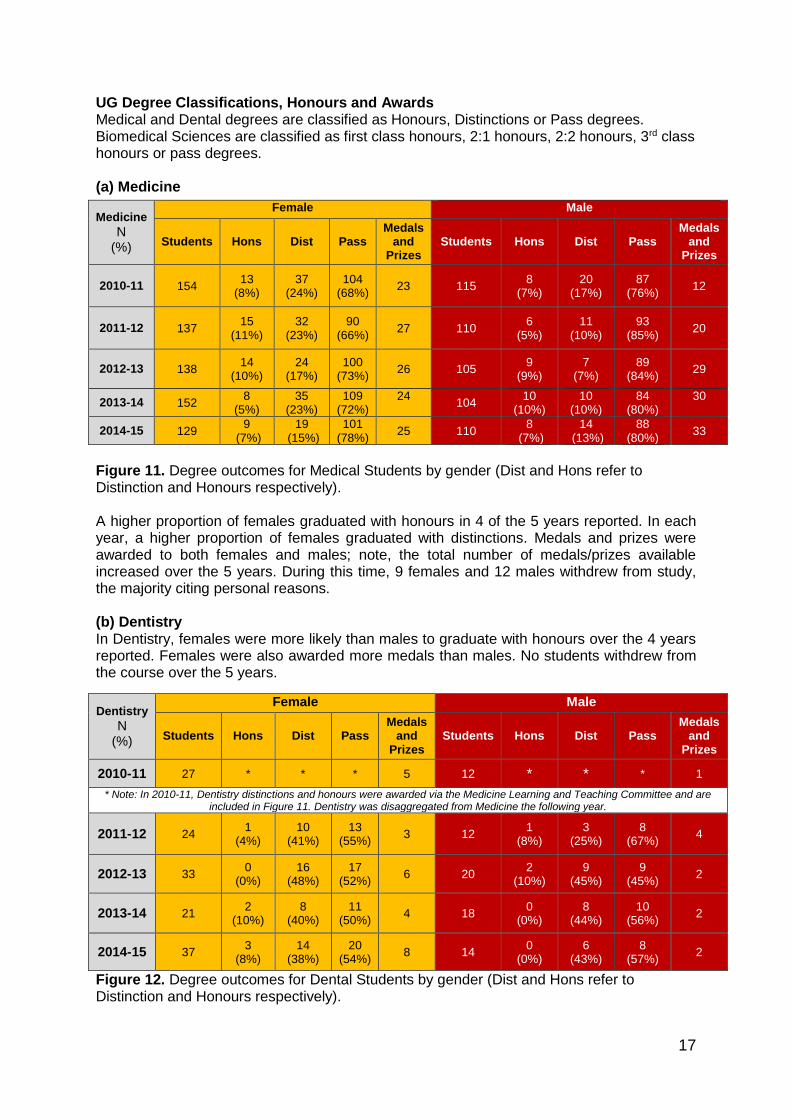
UG Degree Classifications, Honours and Awards Medical and Dental degrees are classified as Honours, Distinctions or Pass degrees. Biomedical Sciences are classified as first class honours, 2:1 honours, 2:2 honours, 3rd class honours or pass degrees. (a) Medicine
Figure 11. Degree outcomes for Medical Students by gender (Dist and Hons refer to Distinction and Honours respectively). A higher proportion of females graduated with honours in 4 of the 5 years reported. In each year, a higher proportion of females graduated with distinctions. Medals and prizes were awarded to both females and males; note, the total number of medals/prizes available increased over the 5 years. During this time, 9 females and 12 males withdrew from study, the majority citing personal reasons. (b) Dentistry In Dentistry, females were more likely than males to graduate with honours over the 4 years reported. Females were also awarded more medals than males. No students withdrew from the course over the 5 years.
Figure 12. Degree outcomes for Dental Students by gender (Dist and Hons refer to Distinction and Honours respectively).
Medicine
N (%)
Female Male
Students Hons Dist Pass Medals
and Prizes
Students Hons Dist Pass Medals
and Prizes
2010-11 154 13
(8%) 37
(24%) 104
(68%) 23 115
8 (7%)
20 (17%)
87 (76%)
12
2011-12 137 15
(11%) 32
(23%) 90
(66%) 27 110
6 (5%)
11 (10%)
93 (85%)
20
2012-13 138 14
(10%) 24
(17%) 100
(73%) 26 105
9 (9%)
7 (7%)
89 (84%)
29
2013-14 152 8
(5%) 35
(23%) 109
(72%) 24
104 10
(10%) 10
(10%) 84
(80%) 30
2014-15 129 9
(7%) 19
(15%) 101
(78%) 25 110
8 (7%)
14 (13%)
88 (80%)
33
Dentistry
N (%)
Female Male
Students Hons Dist Pass Medals
and Prizes
Students Hons Dist Pass Medals
and Prizes
2010-11 27 * * * 5 12 * * * 1
* Note: In 2010-11, Dentistry distinctions and honours were awarded via the Medicine Learning and Teaching Committee and are included in Figure 11. Dentistry was disaggregated from Medicine the following year.
2011-12 24 1
(4%) 10
(41%) 13
(55%) 3 12
1 (8%)
3 (25%)
8 (67%)
4
2012-13 33 0
(0%) 16
(48%) 17
(52%) 6 20
2 (10%)
9 (45%)
9 (45%)
2
2013-14 21 2
(10%) 8
(40%) 11
(50%) 4 18
0 (0%)
8 (44%)
10 (56%)
2
2014-15 37 3
(8%) 14
(38%) 20
(54%) 8 14
0 (0%)
6 (43%)
8 (57%)
2

18
PE
RC
EN
TA
GE
(%
) O
F S
TU
DE
NT
S
010
20
30
40
50
60
29 %
49 %
22 %
0 %
51 %
38 %
11 %
0 %
n = 15
n = 25
n = 11
n = 0
n = 19
n = 14
n = 4
n = 01 2.1 2.2 3 1 2.1 2.2 3
Female
Male
Degree Class Degree Class2011/2012
PE
RC
EN
TA
GE
(%
) O
F S
TU
DE
NT
S
010
20
30
40
50
60
26 %
61 %
13 %
0 %
26 %
44 %
28 %
2 %
n = 14
n = 33
n = 7
n = 0
n = 13
n = 22
n = 14
n = 1
1 2.1 2.2 3 1 2.1 2.2 3
Female
Male
Degree Class Degree Class2012/2013
PE
RC
EN
TA
GE
(%
) O
F S
TU
DE
NT
S
010
20
30
40
50
60
60 %
31 %
7 %
2 %
62 %
24 %
14 %
0 %
n = 33
n = 17
n = 4
n = 1
n = 18
n = 7
n = 4
n = 01 2.1 2.2 3 1 2.1 2.2 3
Female
Male
Degree Class Degree Class2013/2014
PE
RC
EN
TA
GE
(%
) O
F S
TU
DE
NT
S
010
20
30
40
50
60
56 %
33 %
11 %
0 %
40 %43 %
14 %
3 %
n = 40
n = 24
n = 8
n = 0
n = 15n = 16
n = 5
n = 1
1 2.1 2.2 3 1 2.1 2.2 3
Female
Male
Degree Class Degree Class2014/2015
PE
RC
EN
TA
GE
(%
) O
F S
TU
DE
NT
S
010
20
30
40
50
60
36 %
47 %
17 %
0 %
38 %40 %
21 %
0 %
n = 23
n = 30
n = 11
n = 0
n = 18n = 19
n = 10
n = 01 2.1 2.2 3 1 2.1 2.2 3
Female
Male
Degree Class Degree Class2010/2011
(c) Biomedical Sciences
Figure 13. Degree outcomes for Biomedical Science by gender over the last 5 academic years.
19
Data relating to Biomedical science degree outcomes includes intercalating medical students (Figure 13). This is a highly motivated and high performing cohort. The relative proportions of females to males obtaining 2.1 and above remained consistent. In 2011/12, the higher percentage of males vs females obtaining firsts was due to more male intercalated students that particular year. In 2013/14 the predominant degree classification achieved by females and males was first class. This may be due to the earlier introduction of increased entry grades. Encouragingly, this trend continued into 2014/15 for females. Over the 5 years, 27 females and 23 males withdrew from the degree; the majority cited personal reasons.
Action R4.1 Continue to monitor UG student degree outcomes for emerging trends including reviewing degree classifications annually by gender, correlating with admission grades, and monitoring degree outcomes of intercalated students
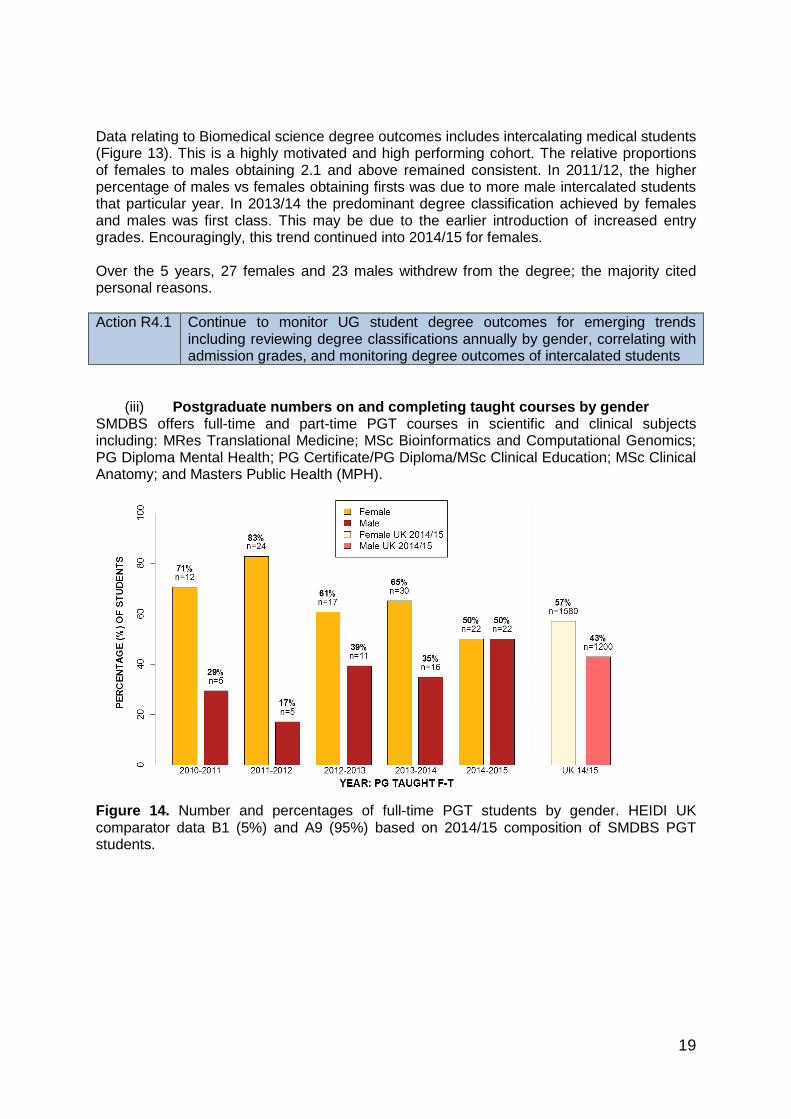
(iii) Postgraduate numbers on and completing taught courses by gender SMDBS offers full-time and part-time PGT courses in scientific and clinical subjects including: MRes Translational Medicine; MSc Bioinformatics and Computational Genomics; PG Diploma Mental Health; PG Certificate/PG Diploma/MSc Clinical Education; MSc Clinical Anatomy; and Masters Public Health (MPH).
Figure 14. Number and percentages of full-time PGT students by gender. HEIDI UK comparator data B1 (5%) and A9 (95%) based on 2014/15 composition of SMDBS PGT students.
20
PE
RC
EN
TA
GE
(%
) O
F S
TU
DE
NT
S
02
04
06
08
0100
55%
45%
55%
45%
58%
42%
51%49%
56%
44%
59%
41%
n=143
n=119
n=129
n=105
n=146
n=108
n=144n=138
n=127
n=100
n=2580
n=1760
2010-2011 2011-2012 2012-2013 2013-2014 2014-2015 UK 14/15
Female
Male
Female UK 2014/15
Male UK 2014/15
YEAR: PG TAUGHT P-T
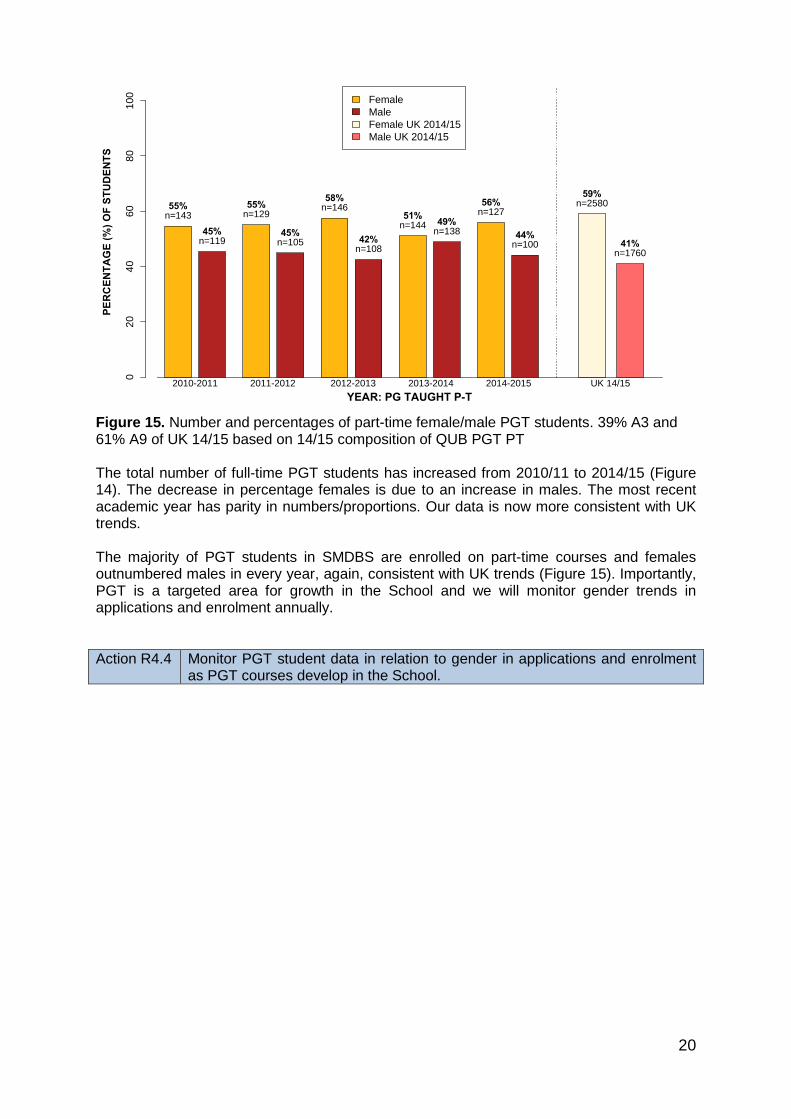
Figure 15. Number and percentages of part-time female/male PGT students. 39% A3 and 61% A9 of UK 14/15 based on 14/15 composition of QUB PGT PT The total number of full-time PGT students has increased from 2010/11 to 2014/15 (Figure 14). The decrease in percentage females is due to an increase in males. The most recent academic year has parity in numbers/proportions. Our data is now more consistent with UK trends. The majority of PGT students in SMDBS are enrolled on part-time courses and females outnumbered males in every year, again, consistent with UK trends (Figure 15). Importantly, PGT is a targeted area for growth in the School and we will monitor gender trends in applications and enrolment annually.
Action R4.4 Monitor PGT student data in relation to gender in applications and enrolment as PGT courses develop in the School.

21
PE
RC
EN
TA
GE
(%
)
010
20
30
40
50
60
24%
49%
27%
22%
26%
52%
n=16
n=33
n=18
n=12
n=14
n=28
Dist Comm Pass Dist Comm Pass
Female
Male
PGT Class PGT Class2010/2011
PE
RC
EN
TA
GE
(%
)
010
20
30
40
50
60
25%
57%
18%
33%35%
32%
n=28
n=63
n=20
n=20n=21
n=19
Dist Comm Pass Dist Comm Pass
Female
Male
PGT Class PGT Class2011/2012
PE
RC
EN
TA
GE
(%
)
010
20
30
40
50
60
25%
63%
12%
31%
59%
9%
n=26
n=64
n=12
n=23
n=44
n=7
Dist Comm Pass Dist Comm Pass
Female
Male
PGT Class PGT Class2012/2013
PE
RC
EN
TA
GE
(%
)
010
20
30
40
50
60
34%
52%
14%
32%
44%
24%
n=32
n=49
n=13
n=25
n=35
n=19
Dist Comm Pass Dist Comm Pass
Female
Male
PGT Class PGT Class2013/2014
PE
RC
EN
TA
GE
(%
)
010
20
30
40
50
60
35%
51%
15%
34%
52%
14%
n=43
n=63
n=18
n=29
n=44
n=12
Dist Comm Pass Dist Comm Pass
Female
Male
PGT Class PGT Class2014/2015
Degree outcome data for PGT students
Figure 16. Degree outcome data for PGT students from 2010-2015 (Dist – distinction; Comm – commendation).
22
PE
RC
EN
TA
GE
(%
) O
F S
TU
DE
NT
S
02
04
06
08
01
00
36%
64%
56%
44%
50% 50%
58%
42%45%
55%58%
42%
n=9
n=16
n=13
n=10
n=10 n=10
n=14
n=10n=9
n=11n=3745
n=2730
2010-2011 2011-2012 2012-2013 2013-2014 2014-2015 UK 14/15
Female
Male
Female UK 2014/15
Male UK 2014/15
YEAR: PG RESEARCH P-T
PE
RC
EN
TA
GE
(%
) O
F S
TU
DE
NT
S
02
04
06
08
0100
62%
38%
61%
39%
66%
34%
68%
32%
69%
31%
58%
42%
n=93
n=57
n=84
n=53
n=81
n=42
n=109
n=52
n=121
n=55
n=3745
n=2730
2010-2011 2011-2012 2012-2013 2013-2014 2014-2015 UK 14/15
Female
Male
Female UK 2014/15
Male UK 2014/15
YEAR: PG RESEARCH F-T
The number and percentage of female PGT graduating with distinctions has increased from 2010/11 to 2014/15 (Figure 16). Similarly, outcomes for males have improved where the majority now obtain commendations or distinctions. There is now parity of outcome for male and female PGT students. This may have been partly due to actions from the external-led Education Enhancement Process review of PGT/PGR programmes in the School in (2011/12). Over the 5-year period, 54 females (8%) and 29 males (5%) withdrew from PGT courses; the majority cited personal reasons and work commitments.
Action R4.5 Evaluate PGT outcome data by gender annually.
(iv) Postgraduate numbers on research degrees and completion times – full and
part-time.
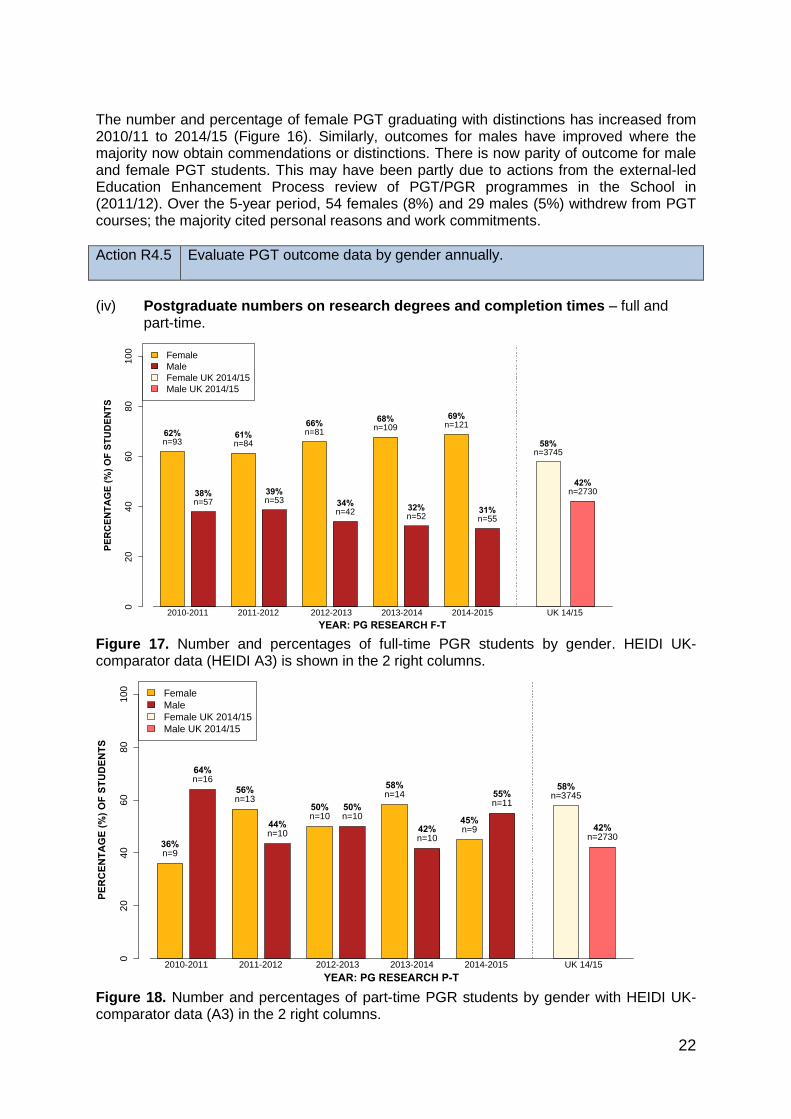
Figure 17. Number and percentages of full-time PGR students by gender. HEIDI UK-comparator data (HEIDI A3) is shown in the 2 right columns.
Figure 18. Number and percentages of part-time PGR students by gender with HEIDI UK-comparator data (A3) in the 2 right columns.
23
The majority of PGR students are full-time (Figure 17). Over the 5 reporting years, the majority of full-time students were female, again consistent with national data. Actions are planned to investigate this trend. For part-time PGR students (Figure 18), female/male ratios varied somewhat from year to year, with male majorities in 2010-11 but small difference in numbers in other years. Part-time PGR students typically represent those who have completed their original research and are enrolled part-time for thesis completion. We do not plan any actions in this area.
Action R4.9 Investigate why there is a lower percentage of males on PGR courses.
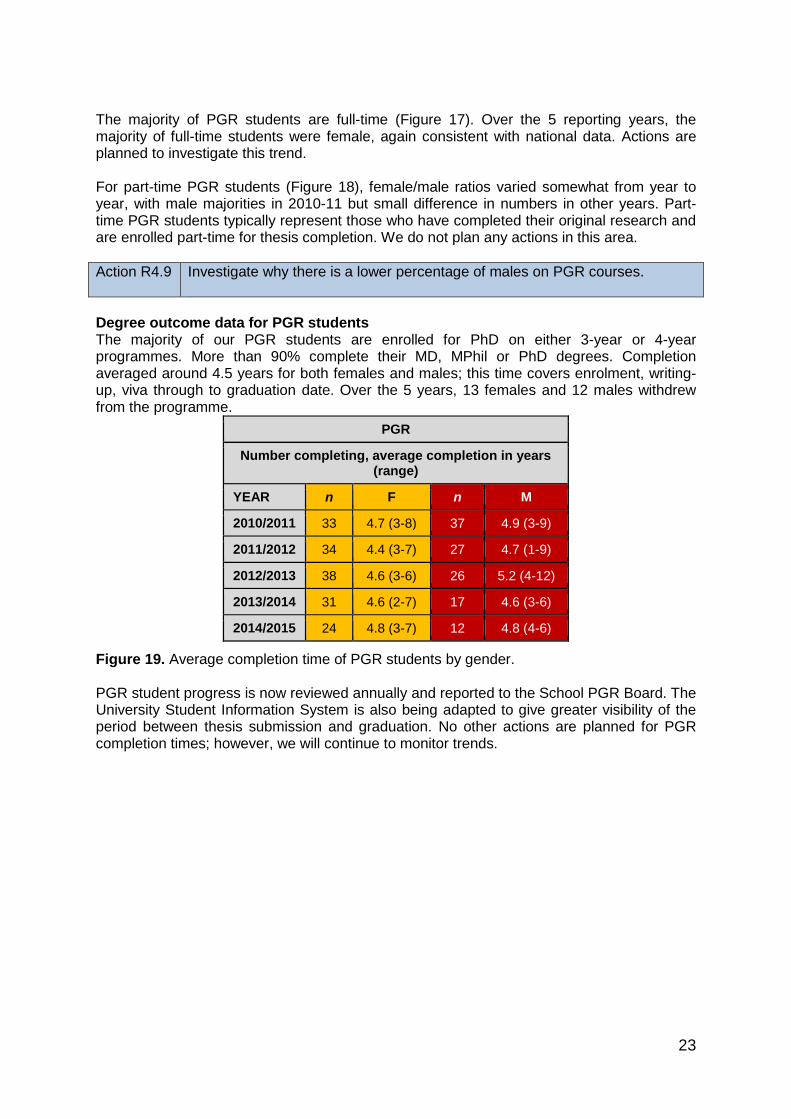
Degree outcome data for PGR students The majority of our PGR students are enrolled for PhD on either 3-year or 4-year programmes. More than 90% complete their MD, MPhil or PhD degrees. Completion averaged around 4.5 years for both females and males; this time covers enrolment, writing-up, viva through to graduation date. Over the 5 years, 13 females and 12 males withdrew from the programme. Figure 19. Average completion time of PGR students by gender. PGR student progress is now reviewed annually and reported to the School PGR Board. The University Student Information System is also being adapted to give greater visibility of the period between thesis submission and graduation. No other actions are planned for PGR completion times; however, we will continue to monitor trends.
PGR
Number completing, average completion in years (range)
YEAR n F n M
2010/2011 33 4.7 (3-8) 37 4.9 (3-9)
2011/2012 34 4.4 (3-7) 27 4.7 (1-9)
2012/2013 38 4.6 (3-6) 26 5.2 (4-12)
2013/2014 31 4.6 (2-7) 17 4.6 (3-6)
2014/2015 24 4.8 (3-7) 12 4.8 (4-6)

24
Destination data for PGT students Over the three years of data available, the majority of PGT students went on to graduate employment with gender parity in the most recent 2 years. Small numbers went on to further study at QUB or elsewhere. No further actions are planned.
Figure 20. Destination data by gender for PGT students from 2011-2014
Figure 21. Destination data by gender for PGR students from 2011-2014 The majority of female PGR graduates continue their careers within academia. Interestingly, the numbers of females moving to industry has increased over the last 5 years, and represent the majority of PGR graduates taking up industrial employment. PGR students in the NHS largely represent Clinical PhDs who then return to full-time clinical work.
PGT Destination
Data % (N)
2011/2012 2012/2013 2013/2014 Overall
F M F M F M F M
Further Study 33%
2 66%
4 78%
7 22%
2 75%
3 25%
1 63%
12 37%
7
Graduate Employment
68% 63
32% 29
53% 30
47% 27
45% 27
55% 33
57% 120
43% 89
Non-Graduate Employment
100% 1
0% 0
100% 1
0% 0
100% 2
0% 0
100% 4
0% 0
Other (e.g. public
engagement)
100% 4
0% 0
100% 3
0% 0
50% 2
50% 2
82% 9
18% 2
PGR Destination
Data % (N)
2011/2012 2012/2013 2013/2014 Overall
F M F M F M F M
Industry 100%
3 0% 0
57% 4
43% 3
100% 2
0% 0
75% 9
25% 3
Academia 44% 12
56% 15
65% 17
35% 9
72% 21
28% 8
61% 50
39% 32
NHS 67%
6 33%
3 0% 0
100% 4
39% 9
61% 14
42% 15
58% 21
Other (e.g. public
engagement)
100% 2
0% 0
100% 2
0% 0
70% 7
30% 3
79% 11
21% 3
25
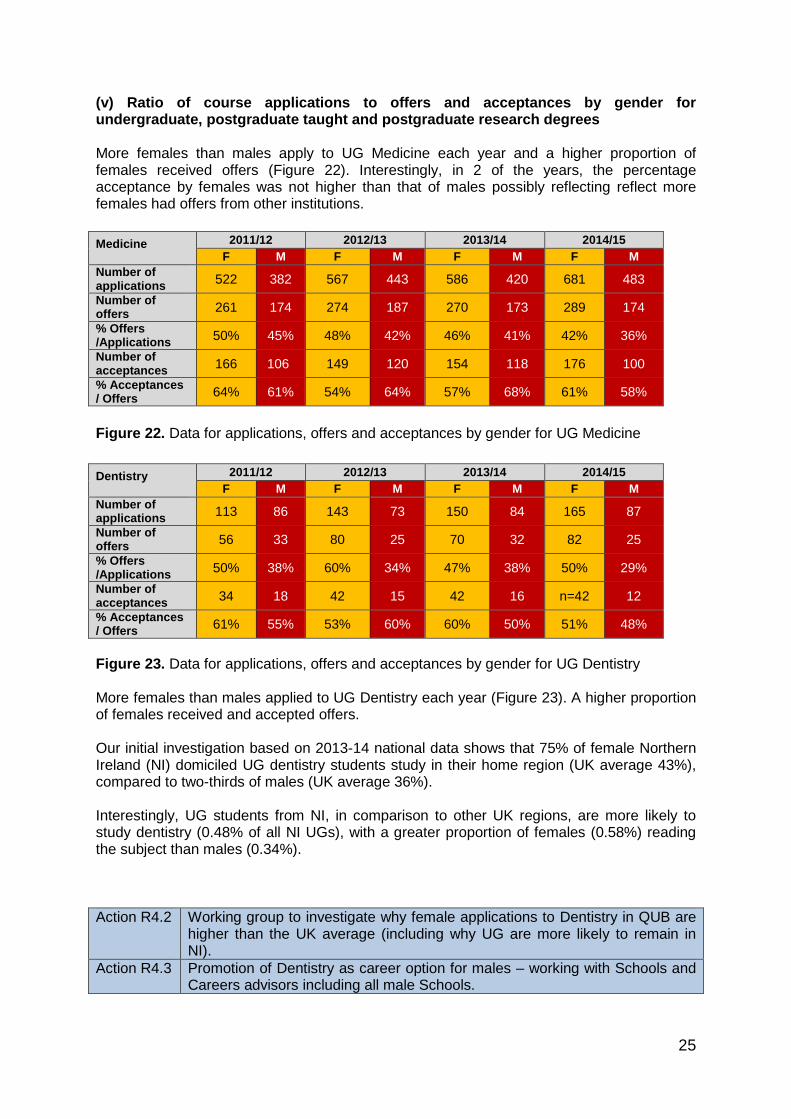
(v) Ratio of course applications to offers and acceptances by gender for undergraduate, postgraduate taught and postgraduate research degrees More females than males apply to UG Medicine each year and a higher proportion of females received offers (Figure 22). Interestingly, in 2 of the years, the percentage acceptance by females was not higher than that of males possibly reflecting reflect more females had offers from other institutions.
Figure 22. Data for applications, offers and acceptances by gender for UG Medicine
Figure 23. Data for applications, offers and acceptances by gender for UG Dentistry More females than males applied to UG Dentistry each year (Figure 23). A higher proportion of females received and accepted offers. Our initial investigation based on 2013-14 national data shows that 75% of female Northern Ireland (NI) domiciled UG dentistry students study in their home region (UK average 43%), compared to two-thirds of males (UK average 36%). Interestingly, UG students from NI, in comparison to other UK regions, are more likely to study dentistry (0.48% of all NI UGs), with a greater proportion of females (0.58%) reading the subject than males (0.34%).
Action R4.2 Working group to investigate why female applications to Dentistry in QUB are higher than the UK average (including why UG are more likely to remain in NI).
Action R4.3 Promotion of Dentistry as career option for males – working with Schools and Careers advisors including all male Schools.
Medicine
2011/12 2012/13 2013/14 2014/15
F M F M F M F M
Number of applications
522 382 567 443 586 420 681 483
Number of offers
261 174 274 187 270 173 289 174
% Offers /Applications
50% 45% 48% 42% 46% 41% 42% 36%
Number of acceptances
166 106 149 120 154 118 176 100
% Acceptances / Offers
64% 61% 54% 64% 57% 68% 61% 58%
Dentistry
2011/12 2012/13 2013/14 2014/15
F M F M F M F M
Number of applications
113 86 143 73 150 84 165 87
Number of offers
56 33 80 25 70 32 82 25
% Offers /Applications
50% 38% 60% 34% 47% 38% 50% 29%
Number of acceptances
34 18 42 15 42 16 n=42 12
% Acceptances / Offers
61% 55% 53% 60% 60% 50% 51% 48%

26
Figure 24. Data for applications, offers and acceptances by gender for UG Biomedical Sciences Similar to UG Medicine and Dentistry, more females than males apply to UG Biomedical Sciences each year (Figure 24). Females and males were equally likely to receive and accept offers.
Figure 25. Data for applications, offers and acceptances by gender for PGT degrees The number of female PGT applicants exceeded that of males each year. The proportion of female students receiving and accepting offers was similar to males.
Figure 26. Data for applications, offers and acceptances by gender for PGR degrees Each year, more females than males applied for PGR degrees. Females were also more likely to receive offers. There was parity in females and males accepting offers.
Action R4.9 Investigate why there is a lower percentage of males on PGR courses.
Biomedical Sciences
2011/12 2012/13 2013/14 2014/15
F M F M F M F M
Number of applications
299 223 367 249 371 260 403 268
Number of offers
267 204 337 220 337 232 370 239
% Offers /Applications
89% 92% 92% 88% 91% 89% 92% 89%
Number of acceptances
41 18 48 29 53 36 56 35
% Acceptances / Offers
15% 9% 14% 13% 16% 15% 15% 15%
PGT 2011/12 2012/13 2013/14 2014/15
F M F M F M F M
Number of applications
155 112 186 120 230 187 233 169
Number of offers
133 90 153 94 181 146 185 141
% Offers /Applications
86% 80% 82% 78% 79% 78% 79% 85%
Number of acceptances
112 70 124 78 126 104 111 76
% Acceptances /Offers
84% 78% 81% 83% 70% 71% 60% 54%
PGR 2011/12 2012/13 2013/14 2014/15
F M F M F M F M
Number of applications
148 146 302 214 313 284 338 284
Number of offers
28 24 35 18 57 30 59 33
% Offers/ Applications
19% 16% 12% 8% 18% 11% 17% 12%
Number of acceptances
25 23 31 16 52 27 52 27
% Acceptances/ Offers
89% 96% 89% 89% 91% 90% 88% 82%
27
PE
RC
EN
TA
GE
(%
) O
F S
TA
FF
02
04
06
08
01
00
40%
60%
40%
60%
43%
57%
45%
55%
44%
56%53%
47%
n=70
n=107
n=70
n=107
n=79
n=106
n=86
n=105
n=84
n=107n=10650
n=9495
2010-2011 2011-2012 2012-2013 2013-2014 2014-2015 UK 14/15
Female
Male
Female UK 2014/15
Male UK 2014/15
YEAR: ACADEMIC STAFF
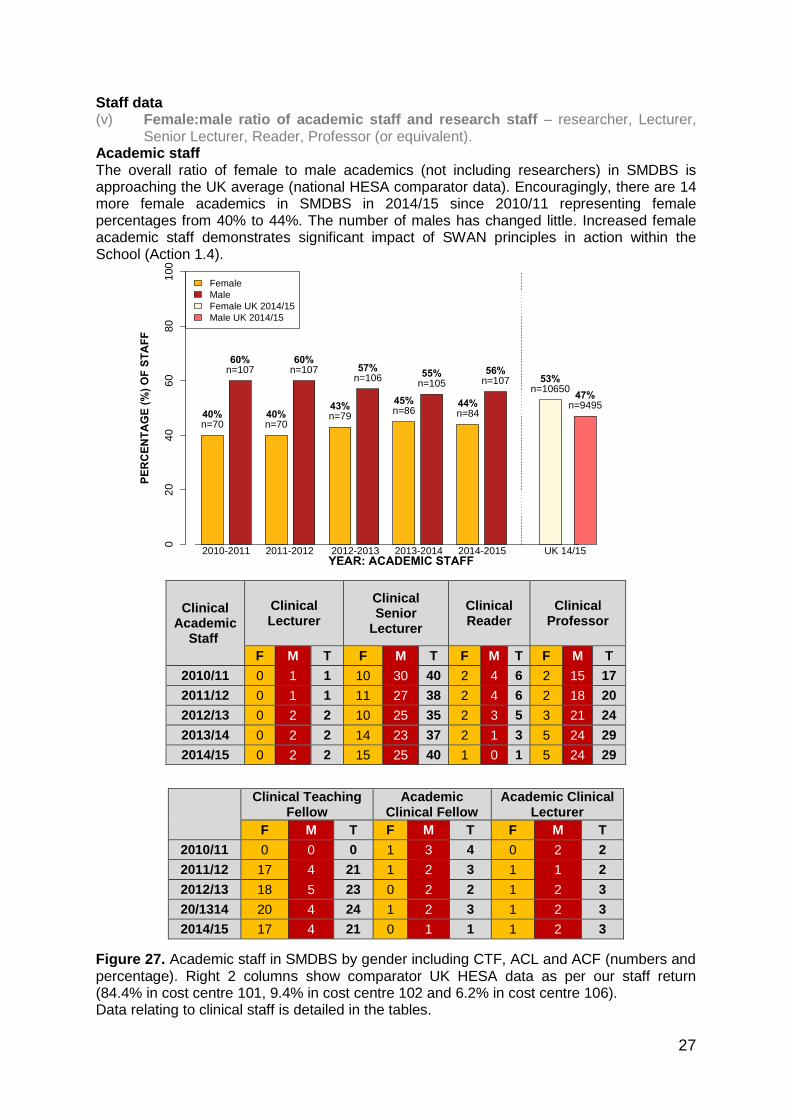
Staff data (v) Female:male ratio of academic staff and research staff – researcher, Lecturer,
Senior Lecturer, Reader, Professor (or equivalent). Academic staff The overall ratio of female to male academics (not including researchers) in SMDBS is approaching the UK average (national HESA comparator data). Encouragingly, there are 14 more female academics in SMDBS in 2014/15 since 2010/11 representing female percentages from 40% to 44%. The number of males has changed little. Increased female academic staff demonstrates significant impact of SWAN principles in action within the School (Action 1.4).
Figure 27. Academic staff in SMDBS by gender including CTF, ACL and ACF (numbers and percentage). Right 2 columns show comparator UK HESA data as per our staff return (84.4% in cost centre 101, 9.4% in cost centre 102 and 6.2% in cost centre 106). Data relating to clinical staff is detailed in the tables.
Clinical Academic
Staff
Clinical Lecturer
Clinical Senior
Lecturer
Clinical Reader
Clinical Professor
F M T F M T F M T F M T
2010/11 0 1 1 10 30 40 2 4 6 2 15 17
2011/12 0 1 1 11 27 38 2 4 6 2 18 20
2012/13 0 2 2 10 25 35 2 3 5 3 21 24
2013/14 0 2 2 14 23 37 2 1 3 5 24 29
2014/15 0 2 2 15 25 40 1 0 1 5 24 29
Clinical Teaching Fellow
Academic Clinical Fellow
Academic Clinical Lecturer
F M T F M T F M T
2010/11 0 0 0 1 3 4 0 2 2
2011/12 17 4 21 1 2 3 1 1 2
2012/13 18 5 23 0 2 2 1 2 3
20/1314 20 4 24 1 2 3 1 2 3
2014/15 17 4 21 0 1 1 1 2 3

28
YEAR: LECTURER
PE
RC
EN
TA
GE
(%
) O
F S
TA
FF
020
40
60
80
10
0
59%
41%
58%
42%
62%
38%
62%
38%
62%
38%
n=36
n=25
n=35
n=25
n=44
n=27
n=42
n=26
n=43
n=26
2010/2011 2011/2012 2012/2013 2013/2014 2014/2015
Female
Male
YEAR: SENIOR LECTURER
PE
RC
EN
TA
GE
(%
) O
F S
TA
FF
020
40
60
80
10
0
25%
75%
22%
78%
32%
68%
39%
61%
41%
59%
n=14
n=43
n=12
n=43
n=17
n=36
n=24
n=37
n=26
n=38
2010/2011 2011/2012 2012/2013 2013/2014 2014/2015
Female
Male
There has been sustained improvement in the numbers (and percentages) of female Lecturers and Senior Lecturers (Figure 28). It was a key objective of our previous SWAN application to ensure that the pipeline of female academics was improved by promoting and recruiting female staff to Senior Lecturer level (Actions 1.1-1.7). We note that male SL numbers decreased and this is reflected in promotions data (Figure 39). Figure 28. Academic staff in SMDBS by gender (numbers and percentage) at Lecturer (top panel) and Senior Lecturer (bottom panel) over the last 5 years. The number of Readers is small, currently 2 females and 3 males (figure 29). Since 2010/11, male Readers decreased from 11 to 3, whereas the numbers of females fluctuated between 2 and 5. The reduction in men at Reader level is explained by promotions at QUB (n=5 in Figure 39) or at another institution. In SMDBS, promotion to Professor typically progresses through Reader, so the low number of female and male Readers remains a concern.
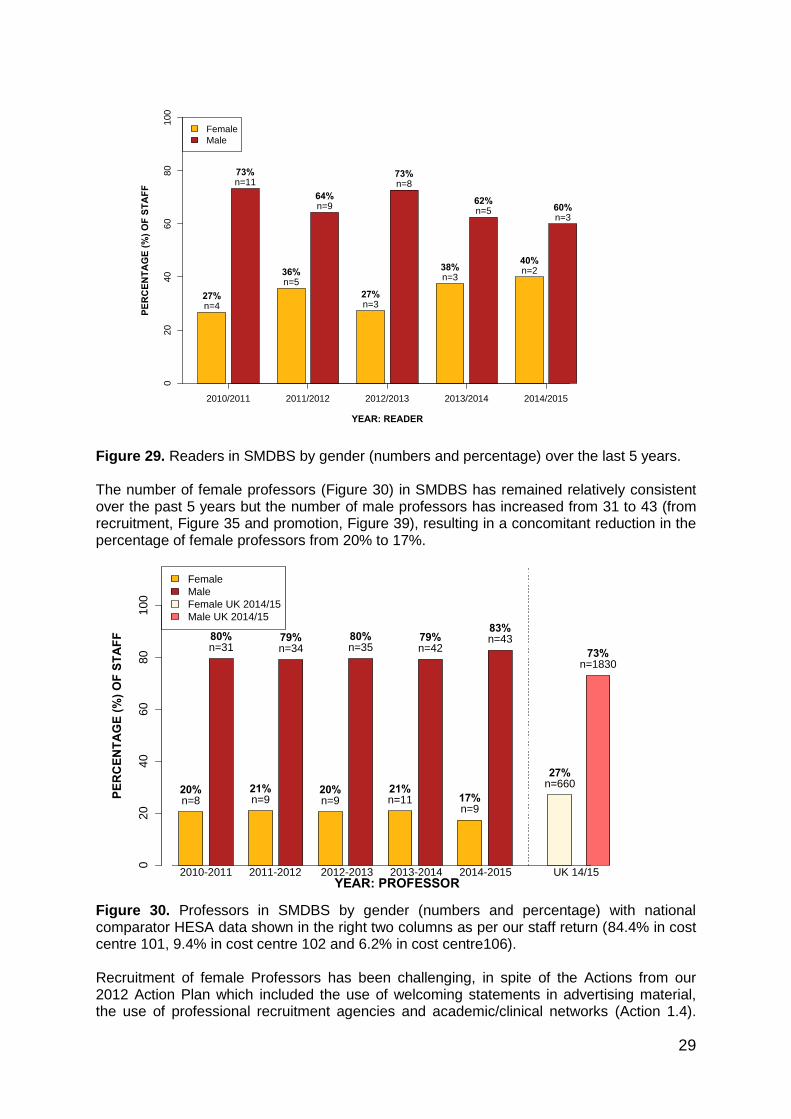
29
YEAR: READER
PE
RC
EN
TA
GE
(%
) O
F S
TA
FF
020
40
60
80
10
0
27%
73%
36%
64%
27%
73%
38%
62%
40%
60%
n=4
n=11
n=5
n=9
n=3
n=8
n=3
n=5
n=2
n=3
2010/2011 2011/2012 2012/2013 2013/2014 2014/2015
Female
Male
PE
RC
EN
TA
GE
(%
) O
F S
TA
FF
02
04
060
80
100
20%
80%
21%
79%
20%
80%
21%
79%
17%
83%
27%
73%
n=8
n=31
n=9
n=34
n=9
n=35
n=11
n=42
n=9
n=43
n=660
n=1830
2010-2011 2011-2012 2012-2013 2013-2014 2014-2015 UK 14/15
Female
Male
Female UK 2014/15
Male UK 2014/15
YEAR: PROFESSOR
Figure 29. Readers in SMDBS by gender (numbers and percentage) over the last 5 years. The number of female professors (Figure 30) in SMDBS has remained relatively consistent over the past 5 years but the number of male professors has increased from 31 to 43 (from recruitment, Figure 35 and promotion, Figure 39), resulting in a concomitant reduction in the percentage of female professors from 20% to 17%.
Figure 30. Professors in SMDBS by gender (numbers and percentage) with national comparator HESA data shown in the right two columns as per our staff return (84.4% in cost centre 101, 9.4% in cost centre 102 and 6.2% in cost centre106). Recruitment of female Professors has been challenging, in spite of the Actions from our 2012 Action Plan which included the use of welcoming statements in advertising material, the use of professional recruitment agencies and academic/clinical networks (Action 1.4).

30
PE
RC
EN
TA
GE
(%
) O
F S
TA
FF
02
04
060
80
10
0
61 %
39 %
61 %
39 %
61 %
39 %
65 %
35 %
64 %
36 %
n = 88
n = 56
n = 69
n = 44
n = 71
n = 45
n = 89
n = 47
n = 93
n = 53
2010-2011 2011-2012 2012-2013 2013-2014 2014-2015
Female
Male
YEAR: RESEARCH AC1-AC4
The School is actively targeting women in the national and international marketplace to make the progress required. This is a key area for the 2016 Action Plan and the Dean and SMB are committed to driving progress in this area (Action R1.1-R1.4).
Action R1.1 Increase the numbers and proportions of female Professors.
Action R1.2 Appoint gender balanced search committees for academic vacancies.
Action R1.3 Create a recruitment page on the School website with information on flexible working, family-friendly policies and links to the School GEO with links from University HR site.
Action R1.4 Increase the use of professional networks, such as WISE (Women in Science and Engineering), Learned Societies e.g. The Physiological Society, The Academy of Medical Sciences and the Clinical Royal Colleges, in recruitment.
Research Staff Across the School, female Postdoctoral Researchers have outnumbered males over the last five years with similar proportions to PGR students. Postdoctoral research is essential for entry to an academic career and many industry positions in our disciplines.
Figure 31. Graph showing research staff by gender in the School over the last 5 years.
31
JOB TITLE
PE
RC
EN
TA
GE
(%
) O
F S
TA
FF
UNDER-GRAD POST-GRAD RESEARCHER LECTURER SNR LECTURER READER PROFESSOR
0
20
40
60
80
100
YEAR
F 2010/2011
F 2014/2015
M 2010/2011
M 2014/2015
2010/2011 2014/2015
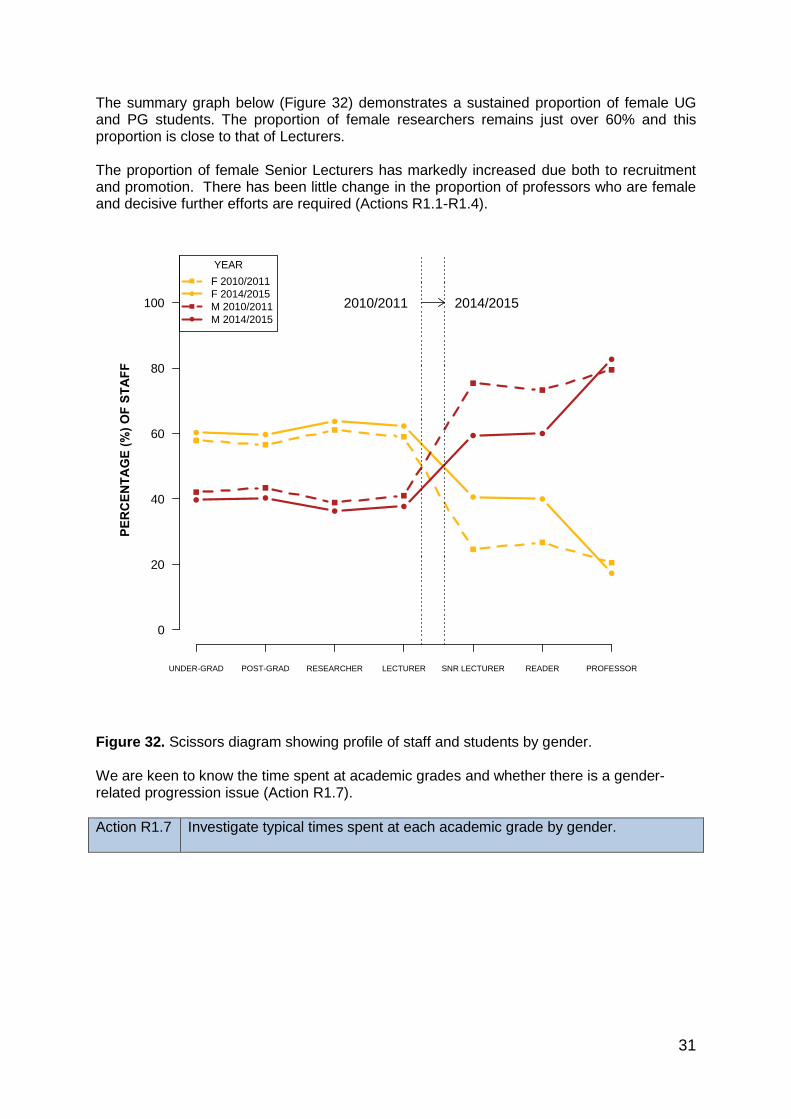
The summary graph below (Figure 32) demonstrates a sustained proportion of female UG and PG students. The proportion of female researchers remains just over 60% and this proportion is close to that of Lecturers. The proportion of female Senior Lecturers has markedly increased due both to recruitment and promotion. There has been little change in the proportion of professors who are female and decisive further efforts are required (Actions R1.1-R1.4).
Figure 32. Scissors diagram showing profile of staff and students by gender. We are keen to know the time spent at academic grades and whether there is a gender-related progression issue (Action R1.7).
Action R1.7 Investigate typical times spent at each academic grade by gender.
32
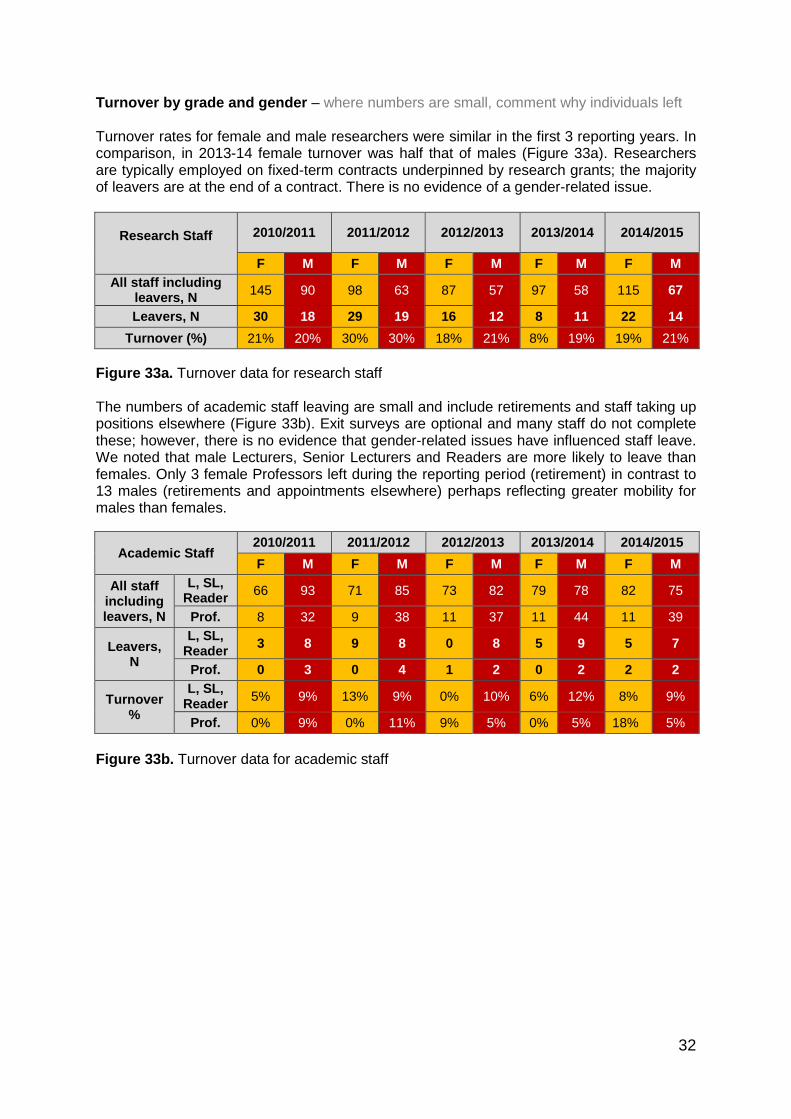
Turnover by grade and gender – where numbers are small, comment why individuals left Turnover rates for female and male researchers were similar in the first 3 reporting years. In comparison, in 2013-14 female turnover was half that of males (Figure 33a). Researchers are typically employed on fixed-term contracts underpinned by research grants; the majority of leavers are at the end of a contract. There is no evidence of a gender-related issue.
Research Staff
2010/2011 2011/2012 2012/2013 2013/2014 2014/2015
F M F M F M F M F M
All staff including leavers, N
145 90 98 63 87 57 97 58 115 67
Leavers, N 30 18 29 19 16 12 8 11 22 14
Turnover (%) 21% 20% 30% 30% 18% 21% 8% 19% 19% 21%
Figure 33a. Turnover data for research staff The numbers of academic staff leaving are small and include retirements and staff taking up positions elsewhere (Figure 33b). Exit surveys are optional and many staff do not complete these; however, there is no evidence that gender-related issues have influenced staff leave. We noted that male Lecturers, Senior Lecturers and Readers are more likely to leave than females. Only 3 female Professors left during the reporting period (retirement) in contrast to 13 males (retirements and appointments elsewhere) perhaps reflecting greater mobility for males than females.
Academic Staff 2010/2011 2011/2012 2012/2013 2013/2014 2014/2015
F M F M F M F M F M
All staff including leavers, N
L, SL, Reader
66 93 71 85 73 82 79 78 82 75
Prof. 8 32 9 38 11 37 11 44 11 39
Leavers, N
L, SL, Reader
3 8 9 8 0 8 5 9 5 7
Prof. 0 3 0 4 1 2 0 2 2 2
Turnover %
L, SL, Reader
5% 9% 13% 9% 0% 10% 6% 12% 8% 9%
Prof. 0% 9% 0% 11% 9% 5% 0% 5% 18% 5%
Figure 33b. Turnover data for academic staff
33
Supporting and advancing women’s careers – maximum 5000 words Please provide a report covering the following sections 4 – 7. Within each section provide data and a short analysis for at least the last three years (including clearly labelled graphical illustrations where possible) on the data sets listed, commenting on changes and progress made since the original application, and including details of successes and where actions have not worked and planned initiatives going forward. Please also attach the action plan from your last application with an additional column indicating the level of progress achieved (e.g. zero, limited, excellent, completed).
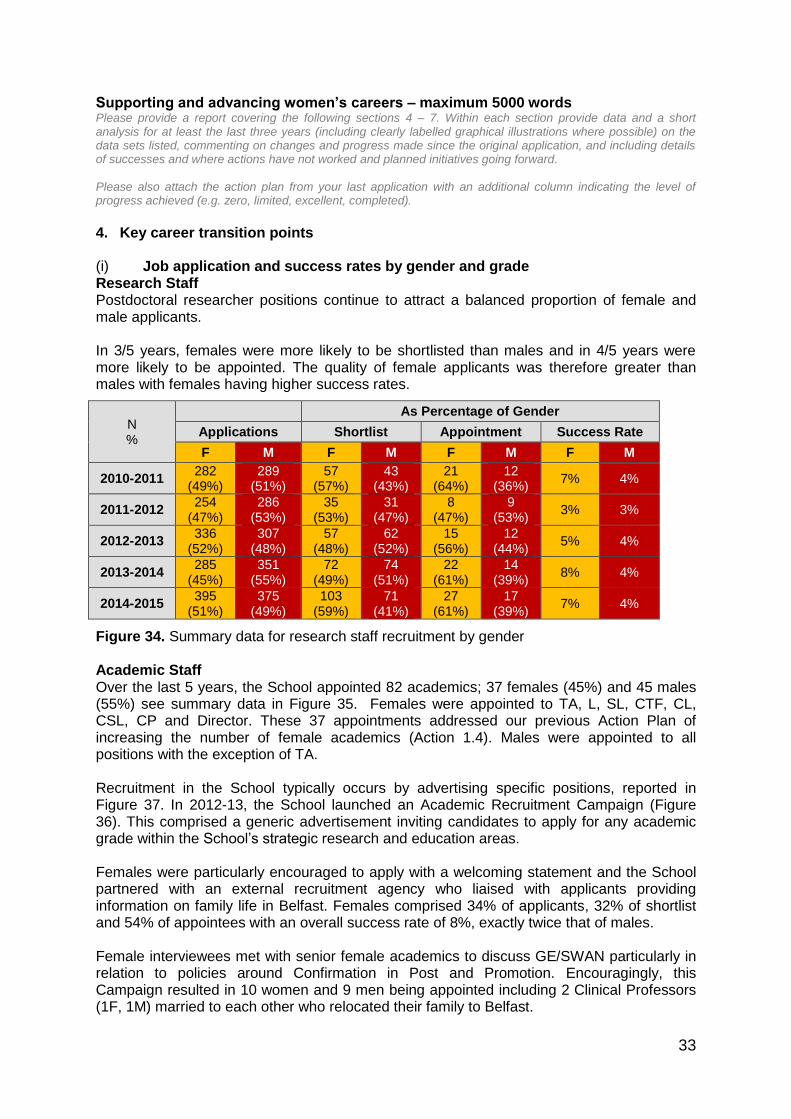
4. Key career transition points (i) Job application and success rates by gender and grade Research Staff Postdoctoral researcher positions continue to attract a balanced proportion of female and male applicants. In 3/5 years, females were more likely to be shortlisted than males and in 4/5 years were more likely to be appointed. The quality of female applicants was therefore greater than males with females having higher success rates.
Figure 34. Summary data for research staff recruitment by gender Academic Staff Over the last 5 years, the School appointed 82 academics; 37 females (45%) and 45 males (55%) see summary data in Figure 35. Females were appointed to TA, L, SL, CTF, CL, CSL, CP and Director. These 37 appointments addressed our previous Action Plan of increasing the number of female academics (Action 1.4). Males were appointed to all positions with the exception of TA. Recruitment in the School typically occurs by advertising specific positions, reported in Figure 37. In 2012-13, the School launched an Academic Recruitment Campaign (Figure 36). This comprised a generic advertisement inviting candidates to apply for any academic grade within the School’s strategic research and education areas. Females were particularly encouraged to apply with a welcoming statement and the School partnered with an external recruitment agency who liaised with applicants providing information on family life in Belfast. Females comprised 34% of applicants, 32% of shortlist and 54% of appointees with an overall success rate of 8%, exactly twice that of males. Female interviewees met with senior female academics to discuss GE/SWAN particularly in relation to policies around Confirmation in Post and Promotion. Encouragingly, this Campaign resulted in 10 women and 9 men being appointed including 2 Clinical Professors (1F, 1M) married to each other who relocated their family to Belfast.
N %
As Percentage of Gender
Applications Shortlist Appointment Success Rate
F M F M F M F M
2010-2011 282
(49%) 289
(51%) 57
(57%) 43
(43%) 21
(64%) 12
(36%) 7% 4%
2011-2012 254
(47%) 286
(53%) 35
(53%) 31
(47%) 8
(47%) 9
(53%) 3% 3%
2012-2013 336
(52%) 307
(48%) 57
(48%) 62
(52%) 15
(56%) 12
(44%) 5% 4%
2013-2014 285
(45%) 351
(55%) 72
(49%) 74
(51%) 22
(61%) 14
(39%) 8% 4%
2014-2015 395
(51%) 375
(49%) 103
(59%) 71
(41%) 27
(61%) 17
(39%) 7% 4%

34
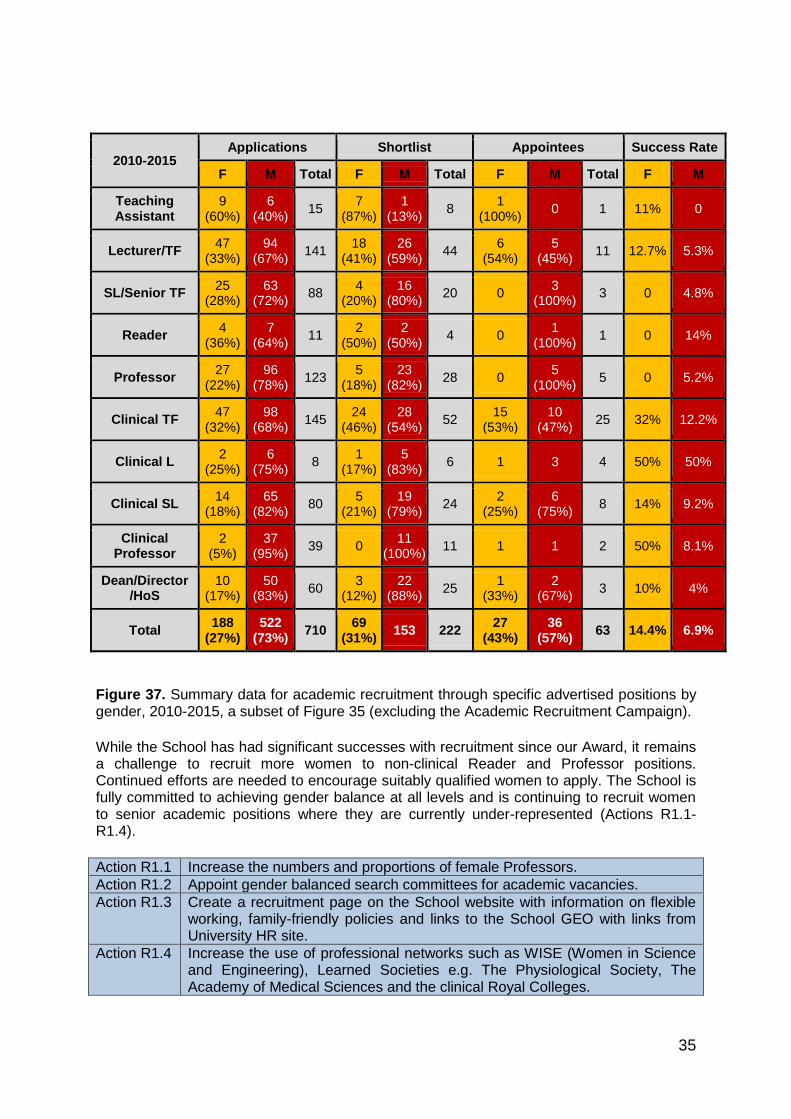
In other years, recruitment occurred with specific post advertising (Figure 37) where women made up 27% of applicants, 31% of the shortlist, 43% of appointees with an overall success rate of 14%, 2-fold greater than males. The average number of female applicants per post over the 5 year reporting period was 2.2, 4.6, 2.3, 3.5 and 2.6 respectively. Corresponding figures for men were 7.1, 9.6, 9.9, 10.6, 7.1 around 3 times greater than females. Interestingly, in the Campaign, average female and male applicants per post were 6.5 and 12.3, a 1.9-fold difference. This indicates that the open recruitment with specific promotional material aimed at women and families may have enhanced application rates for women. Figure 35. Summary data for total recruitment in SMDBS over the last 5 years (note that non-clinical Teaching Fellows and non-clinical Senior Teaching Fellows were transferred to Lecturer and Senior Lecturer respectively in 2013).
Figure 36. Summary data for recruitment through the Academic Recruitment Campaign, 2012-13 (a subset of Figure 35).
2010-2015 Total appointments
Female Male Total
Teaching Assistant 1 (100%) 0 1
Lecturer/TF 12 (60%) 8 (40%) 20
SL/Senior TF 2 (40%) 3 (60%) 5
Reader 0 1 (100%) 1
Professor 0 7 (100%) 7
Clinical TF 15 (60%) 10 (40%) 25
Clinical L 1 (25%) 3 (75%) 4
Clinical SL 3 (27%) 8 (73%) 11
Clinical Professor 2 (40%) 3 (60%) 5
Dean/Director/HoS 1 (33%) 2 (67%) 3
Total 37 (45%) 45 (55%) 82
2012-13 Academic
Recruitment Campaign
Applications Shortlist Appointees Success Rate
F M Total F M Total F M Total F M
123 (34%)
235 (66%)
358 23
(32%) 48
(67%) 71
10 (53%)
9 (47%)
19 8% 4%
Position appointed to
6 L, 2 SL, 1 Clinical SL 1 Clinical Professor
3L, 2 Clinical SL 2 Clinical Professors,
2 Professors
35
Figure 37. Summary data for academic recruitment through specific advertised positions by gender, 2010-2015, a subset of Figure 35 (excluding the Academic Recruitment Campaign).
While the School has had significant successes with recruitment since our Award, it remains a challenge to recruit more women to non-clinical Reader and Professor positions. Continued efforts are needed to encourage suitably qualified women to apply. The School is fully committed to achieving gender balance at all levels and is continuing to recruit women to senior academic positions where they are currently under-represented (Actions R1.1-R1.4).
Action R1.1 Increase the numbers and proportions of female Professors.
Action R1.2 Appoint gender balanced search committees for academic vacancies.
Action R1.3 Create a recruitment page on the School website with information on flexible working, family-friendly policies and links to the School GEO with links from University HR site.
Action R1.4 Increase the use of professional networks such as WISE (Women in Science and Engineering), Learned Societies e.g. The Physiological Society, The Academy of Medical Sciences and the clinical Royal Colleges.
2010-2015 Applications Shortlist Appointees Success Rate
F M Total F M Total F M Total F M
Teaching Assistant
9 (60%)
6 (40%)
15 7
(87%) 1
(13%) 8
1 (100%)
0 1 11% 0
Lecturer/TF 47
(33%) 94
(67%) 141
18 (41%)
26 (59%)
44 6
(54%) 5
(45%) 11 12.7% 5.3%
SL/Senior TF 25
(28%) 63
(72%) 88
4 (20%)
16 (80%)
20 0 3
(100%) 3 0 4.8%
Reader 4
(36%) 7
(64%) 11
2 (50%)
2 (50%)
4 0 1
(100%) 1 0 14%
Professor 27
(22%) 96
(78%) 123
5 (18%)
23 (82%)
28 0 5
(100%) 5 0 5.2%
Clinical TF 47
(32%) 98
(68%) 145
24 (46%)
28 (54%)
52 15
(53%) 10
(47%) 25 32% 12.2%
Clinical L 2
(25%) 6
(75%) 8
1 (17%)
5 (83%)
6 1 3 4 50% 50%
Clinical SL 14
(18%) 65
(82%) 80
5 (21%)
19 (79%)
24 2
(25%) 6
(75%) 8 14% 9.2%
Clinical Professor
2 (5%)
37 (95%)
39 0 11
(100%) 11 1 1 2 50% 8.1%
Dean/Director /HoS
10 (17%)
50 (83%)
60 3
(12%) 22
(88%) 25
1 (33%)
2 (67%)
3 10% 4%
Total 188
(27%) 522
(73%) 710
69 (31%)
153 222 27
(43%) 36
(57%) 63 14.4% 6.9%
36
(ii) Applications for promotion and success rates by gender and grade Queen’s runs an Annual Academic Promotions exercise, reviewed by the University Executive Board. Tenured academic staff can apply for promotion. In considering applications, the composition of the SMDBS Tenure Review Board (TRB) represents both genders. Furthermore, females are judged on publication quality (not quantity) allowing due consideration of situations where females may have fewer publications than male comparators, e.g. due to maternity leave or caring responsibilities. In 2015, Schools revised their Academic Standards which describe expected contributions from academics, averaged over a three-year period, in Research, Education, Academic Leadership and Societal/Economic Impact, differentiated by staff grade. The Standards are aligned with Appraisal and Promotions and are cognisant of flexible working arrangements, maternity/paternity leave and allow for differential performance across the four areas.
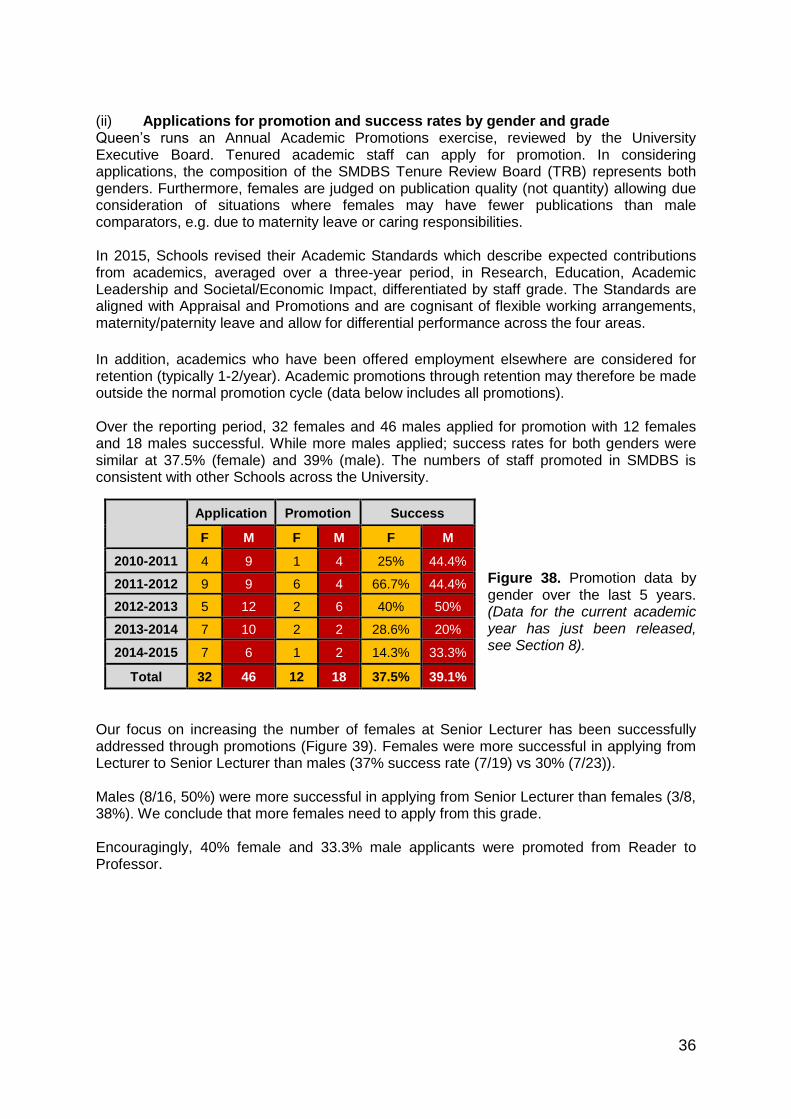
In addition, academics who have been offered employment elsewhere are considered for retention (typically 1-2/year). Academic promotions through retention may therefore be made outside the normal promotion cycle (data below includes all promotions). Over the reporting period, 32 females and 46 males applied for promotion with 12 females and 18 males successful. While more males applied; success rates for both genders were similar at 37.5% (female) and 39% (male). The numbers of staff promoted in SMDBS is consistent with other Schools across the University.
Figure 38. Promotion data by gender over the last 5 years. (Data for the current academic year has just been released, see Section 8).
Our focus on increasing the number of females at Senior Lecturer has been successfully addressed through promotions (Figure 39). Females were more successful in applying from Lecturer to Senior Lecturer than males (37% success rate (7/19) vs 30% (7/23)). Males (8/16, 50%) were more successful in applying from Senior Lecturer than females (3/8, 38%). We conclude that more females need to apply from this grade. Encouragingly, 40% female and 33.3% male applicants were promoted from Reader to Professor.
Application Promotion Success
F M F M F M
2010-2011 4 9 1 4 25% 44.4%
2011-2012 9 9 6 4 66.7% 44.4%
2012-2013 5 12 2 6 40% 50%
2013-2014 7 10 2 2 28.6% 20%
2014-2015 7 6 1 2 14.3% 33.3%
Total 32 46 12 18 37.5% 39.1%
37
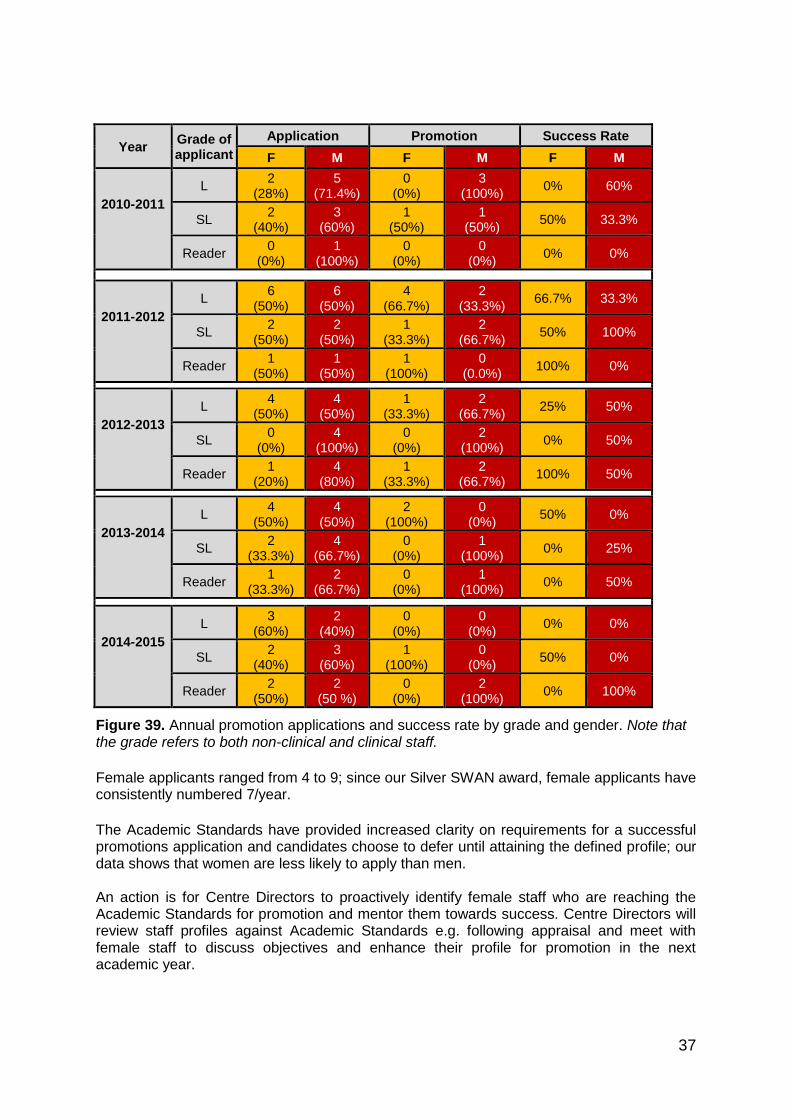
Figure 39. Annual promotion applications and success rate by grade and gender. Note that the grade refers to both non-clinical and clinical staff.
Female applicants ranged from 4 to 9; since our Silver SWAN award, female applicants have consistently numbered 7/year.
The Academic Standards have provided increased clarity on requirements for a successful promotions application and candidates choose to defer until attaining the defined profile; our data shows that women are less likely to apply than men. An action is for Centre Directors to proactively identify female staff who are reaching the Academic Standards for promotion and mentor them towards success. Centre Directors will review staff profiles against Academic Standards e.g. following appraisal and meet with female staff to discuss objectives and enhance their profile for promotion in the next academic year.
Year Grade of applicant
Application Promotion Success Rate
F M F M F M
2010-2011
L 2
(28%) 5
(71.4%) 0
(0%) 3
(100%) 0% 60%
SL 2
(40%) 3
(60%) 1
(50%) 1
(50%) 50% 33.3%
Reader 0
(0%) 1
(100%) 0
(0%) 0
(0%) 0% 0%
2011-2012
L 6
(50%) 6
(50%) 4
(66.7%) 2
(33.3%) 66.7% 33.3%
SL 2
(50%) 2
(50%) 1
(33.3%) 2
(66.7%) 50% 100%
Reader 1
(50%) 1
(50%) 1
(100%) 0
(0.0%) 100% 0%
2012-2013
L 4
(50%) 4
(50%) 1
(33.3%) 2
(66.7%) 25% 50%
SL 0
(0%) 4
(100%) 0
(0%) 2
(100%) 0% 50%
Reader 1
(20%) 4
(80%) 1
(33.3%) 2
(66.7%) 100% 50%
2013-2014
L 4
(50%) 4
(50%) 2
(100%) 0
(0%) 50% 0%
SL 2
(33.3%) 4
(66.7%) 0
(0%) 1
(100%) 0% 25%
Reader 1
(33.3%) 2
(66.7%) 0
(0%) 1
(100%) 0% 50%
2014-2015
L 3
(60%) 2
(40%) 0
(0%) 0
(0%) 0% 0%
SL 2
(40%) 3
(60%) 1
(100%) 0
(0%) 50% 0%
Reader 2
(50%) 2
(50 %) 0
(0%) 2
(100%) 0% 100%
38
We will continue to run the Workshadowing Programme, WeCAN network and Mentoring; the implementation and impact of these are discussed below.
Action R1.5 An annual process where Centre Directors proactively identify female staff who are reaching the Academic Standards for promotion, to mentor them towards a successful application.
Action R1.6 Academic standards to be discussed at all appraisals in the context of future promotions.
Action R1.8 Continue with Workshadowing Programme, WeCAN and Mentoring
Action R3.1 Support for Promotions Applicants who have been unsuccessful
(iii) Impact of activities to support the recruitment of staff – how the department’s recruitment processes ensure that female candidates are attracted to apply, and how the department ensures its short listing, selection processes and criteria comply with the university’s equal opportunities policies
All short-listing, selection and interview panels in SMDBS have gender representation, as per University Equal Opportunities Policy. A Senior Human Resources Business Partner is now embedded within the School and oversees staff recruitment including the Academic Campaign. The critical requirement for gender balance across all grades has been raised by the GEC among academic and administrative staff who are responsible for arranging search committees. Academic staff are asked to use networks to highlight vacancies and encourage women to apply. Our recruitment literature and advertising material has a welcoming statement for females and information on family-friendly policies and our SWAN award. Female interviewees meet with an academic for a tour of the Centre/School and discussion of GE/SWAN; recent appointees found this was very helpful in their decision making. Best practice in respect of recruitment is followed where in staff members involved are required to undertake a mandatory one-day course on non-discriminatory selection. In addition, all staff are required to complete the University’s online Equality and Diversity module. This is rigidly enforced by the School and Human Resources. Feedback from the academic respondent cohort in the recent Culture Survey revealed that 47% considered that the School took positive action to encourage women to apply for posts in areas where they are currently under-represented (only 19% disagreed, the remainder selected ‘don’t know’). Unconscious bias training The School has taken decisive action to increase awareness of Unconscious (implicit) bias. In our recent Culture Survey, while the majority had undertaken GE training, only 33% had Unconscious bias training. The GEC Director implemented a number of awareness sessions with the SAT/GEC including a review of resources available from the Royal Society and ECU. Members took modules from the Harvard online Implicit Awareness Tests (IAT). In addition, several academics from the School attended a seminar on an academic review of unconscious bias literature convened by Professor Teresa McCormack (School of Psychology). Thereafter, an awareness session was implemented for the SMB, the School Board and the Education Forum; again, participants completed the Harvard IATs. We will now deliver an Unconscious Bias training module to academic and senior administrative staff (Action R1.9) with a future roll out to all staff and students. Currently, search committees are used infrequently and contain at least one woman and one man. To increase the pool of female applicants the School will use search gender-balanced search committees for all Professorial/Director appointments.
39
To address under-representation of female Professors, the Dean has agreed an ambitious target to increase the proportion of females to 30% by 2019 through recruitment and promotion.
(iv) Impact of activities to support staff at key career transition points – interventions,
programmes and activities that support women at the crucial stages, such as personal development training, opportunities for networking, mentoring programmes and leadership training.
Our previous Action Plan implemented pilot initiatives that are now embedded in the School. The popular SMDBS Women’s Early Career Academic Network (WeCAN) meets 3-4 times per year for a networking lunch followed by a presentation and Q&A. Meeting topics meetings are proposed by members and have included ‘Imposter syndrome’, ‘The SWAN Action Plan, What Can It Do For Me?’, ‘Work-life balance; having it all’ and ‘Career Pathways and Role Models’. The latter included speakers who progressed to Professor, postdocs who obtained fellowships, PGR graduates working in Industry and local policy. WeCAN attendees average 24/event and include PhD students, postdoctoral researchers and academics. Feedback collated after each event is reviewed by the academic lead and GEO Director to assess impact. Participants invariably state that they enjoyed the event, it met their expectations, they would attend future WeCAN events and would recommend WeCAN to colleagues. “I particularly enjoyed hearing about the career path and lifestyle choices of a more senior Academic doctor in a lunchtime seminar session. I could relate to a lot of what she said and felt quite inspired!” Clinical Senior Lecturer “An aspect of the events I have found particularly useful is that they have increased my awareness of training opportunities to help with career progression, including the PGCHET offered at QUB. It has been useful to hear about other female academics’ career paths and that the path has not always been straight or easy and means a lot of hard work. The speakers have been very frank and honest and this has provided me with a good opportunity to discuss strategies for dealing with life in academia, as well as achieving a good work-life balance.” Post-doctoral Research Fellow “The varied events put on by WeCAN have given me a real insight into the numerous factors which influence academic careers for females, such as work-life balance and career progression. As a PhD student considering a career in academia, I have found it particularly useful to have the chance to speak to successful female academics in an informal setting which might not otherwise have been available in the ‘traditional’ research setting”. Third year PhD student
Action R1.1 1 Increase the numbers and proportions of female Professors – target 30% by 2019.
Action R1.2 Appoint gender balanced search committees for academic vacancies.
Action R1.3 Create a recruitment page on the School website with information on flexible working, family-friendly policies and links to the School GEO, with links from University HR site.
Action R1.4 Increase the use of professional networks, such as WISE (Women in Science and Engineering), Learned Societies e.g. The Physiological Society, The Academy of Medical Sciences and the clinical Royal Colleges, in recruitment.
Action R1.9 Deliver Unconscious Bias training to all academic and senior administrative staff.
40
“It has been really valuable for me to see that, aside from the hard work, there isn’t necessarily a magic formula when it comes to reaching your goals. I have also found it reassuring to hear the many different approaches women have to managing a busy work life along with a busy family life.” Lecturer We believe that WeCAN, in conjunction with other initiatives described in this application, has had a positive impact on female promotions with more females applying since 2010/11. Recently-appointed academics and researchers report WeCAN to be an excellent opportunity to meet new colleagues. WeCAN is also attended by male academics, technical, administrative and clerical staff. SMDBS and the Centres host Seminars, Symposia and Away Days which provide networking opportunities across the School and with external speakers. The WorkShadowing Scheme was piloted in 2012/13 and is now an integral part of SMDBS with 10 participants/year. WorkShadowing demystifies participants’ next academic role; a bespoke package of shadowing opportunities is developed by the academic lead in discussion with the participant e.g. attending senior committees, shadowing an academic to learn about writing, funding panels, teaching committees and career planning. Postdoctoral Research Fellows, Lecturers and Senior Lecturers have benefitted from the Scheme.
Feedback indicates high satisfaction levels; personal objectives of gaining insights into aspects of academic life not usually accessible at earlier career levels or not covered by staff training within QUB were addressed. One respondent was promoted following WorkShadowing and all stated they would recommend the scheme to colleagues.
“I found the attitudes of academic colleagues very helpful and supportive - I was sitting in on meetings that post-docs don't usually attend, but at no time did I feel that I was being treated differently or made to feel that I shouldn't be there. That was extremely helpful in helping me to integrate into those situations and experience them just as an academic would”. Postdoctoral Research Fellow
A Mentoring Scheme for females was developed in collaboration with QGI. It remains over-subscribed annually with 26 SMDBS staff acting as Mentors and 20 as Mentees over the last 5 years. After training, Mentees (academic and research) are usually matched with a Mentor outside of SMDBS; we have worked with the QGI to widen participation to include SMDBS Senior Technical Staff. Mentees report high satisfaction with this popular Scheme.
Since our Award, SMDBS has engaged Dr Amy Iversen from the Academy of Medical Sciences to deliver a bespoke mentoring scheme including training, to early career Clinical Fellows and Postdoctoral Researchers. This new initiative is open to females and males with Mentees selecting a Mentor following an initial ‘speed-dating’ where academic career pathway, personal issues e.g. caring responsibilities and gender are considered in Mentees’ selection of the best Mentors. The academic lead is a GEC member and reports annually to the SMB.
SMDBS actively supports women in Leadership Training which is now a key element of promotion to senior grades. In 2015, a female academic and 2 female senior administrators were supported in their successful applications for a place on the highly-competitive Excellence Leadership Programme, delivered by an external Consultant, Dr Louisa Hardman, Director of Living Potential Consulting, UK.
SMDBS has also committed support for female academics to take the Leadership Foundation for Higher Education, Aurora Programme (Action R1.10).
41
Staff are encouraged and supported to take training opportunities both from University Staff Training and Development Unit and externally e.g. Professional bodies. Training needs are specifically addressed at Appraisal and agreed actions are signed off and reviewed at 6 and 12 months. SMDBS commissioned training for Mentors, delivered by the Academy of Medical Sciences and works with the Research Support Office to deliver bespoke training on specific research applications e.g. Horizon 2020. SMDBS has no complaints from staff regarding a refusal from line mangers for training participation.
Participation at the workshops on Research Council grants and Marie-Curie ITN applications has been invaluable. I have no doubt that this contributed to my recent successful Research Council grant.’ Academic (female)
Action R1.10 School will support 5 female academics to take the Aurora Programme.
Action R2.1 Postdoctoral Portfolio – implement with PURE platform
Action R2.2 Career planning workshops for postdoctoral researchers
Action R2.3 WeCAN – Monitor postdoc participation
Action R2.4 Workshadowing – Monitor postdoc engagement
Action R2.5 Fellowship workshop – Deliver Fellowship writing workshop to postdocs and establish mentoring group for fellowship applicants
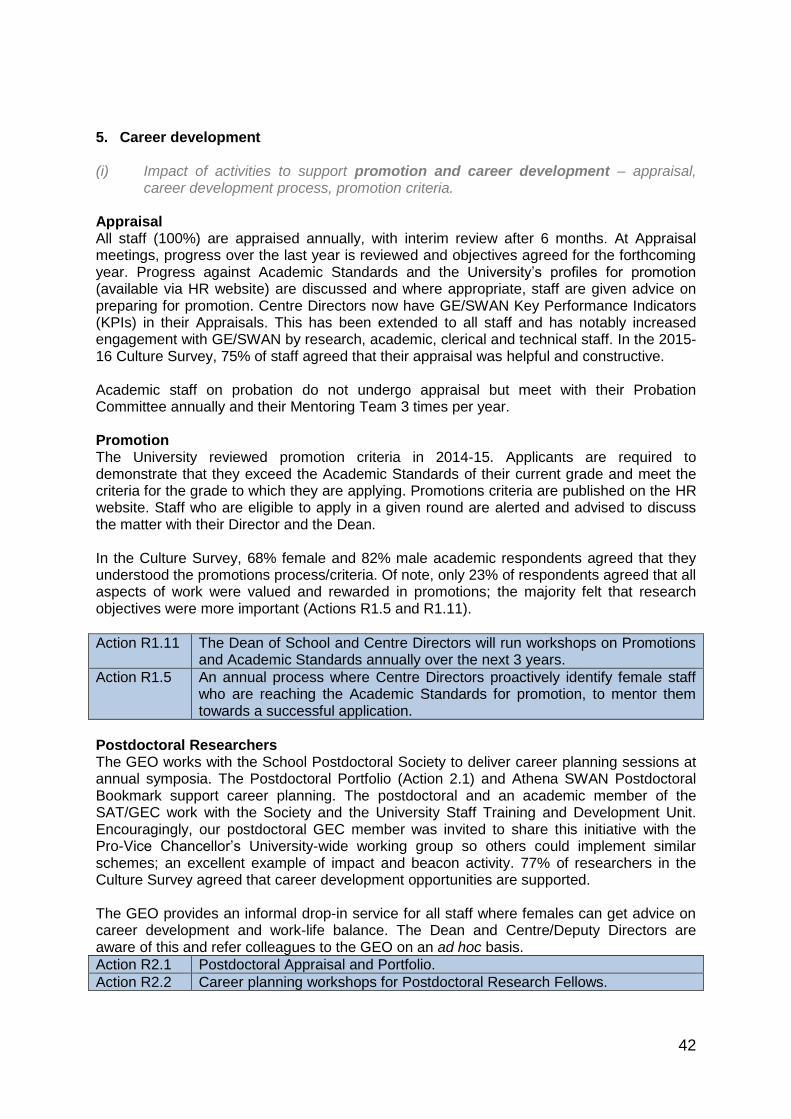
42
5. Career development (i) Impact of activities to support promotion and career development – appraisal,
career development process, promotion criteria. Appraisal All staff (100%) are appraised annually, with interim review after 6 months. At Appraisal meetings, progress over the last year is reviewed and objectives agreed for the forthcoming year. Progress against Academic Standards and the University’s profiles for promotion (available via HR website) are discussed and where appropriate, staff are given advice on preparing for promotion. Centre Directors now have GE/SWAN Key Performance Indicators (KPIs) in their Appraisals. This has been extended to all staff and has notably increased engagement with GE/SWAN by research, academic, clerical and technical staff. In the 2015-16 Culture Survey, 75% of staff agreed that their appraisal was helpful and constructive. Academic staff on probation do not undergo appraisal but meet with their Probation Committee annually and their Mentoring Team 3 times per year. Promotion The University reviewed promotion criteria in 2014-15. Applicants are required to demonstrate that they exceed the Academic Standards of their current grade and meet the criteria for the grade to which they are applying. Promotions criteria are published on the HR website. Staff who are eligible to apply in a given round are alerted and advised to discuss the matter with their Director and the Dean. In the Culture Survey, 68% female and 82% male academic respondents agreed that they understood the promotions process/criteria. Of note, only 23% of respondents agreed that all aspects of work were valued and rewarded in promotions; the majority felt that research objectives were more important (Actions R1.5 and R1.11).
Action R1.11 The Dean of School and Centre Directors will run workshops on Promotions and Academic Standards annually over the next 3 years.
Action R1.5 An annual process where Centre Directors proactively identify female staff who are reaching the Academic Standards for promotion, to mentor them towards a successful application.
Postdoctoral Researchers The GEO works with the School Postdoctoral Society to deliver career planning sessions at annual symposia. The Postdoctoral Portfolio (Action 2.1) and Athena SWAN Postdoctoral Bookmark support career planning. The postdoctoral and an academic member of the SAT/GEC work with the Society and the University Staff Training and Development Unit. Encouragingly, our postdoctoral GEC member was invited to share this initiative with the Pro-Vice Chancellor’s University-wide working group so others could implement similar schemes; an excellent example of impact and beacon activity. 77% of researchers in the Culture Survey agreed that career development opportunities are supported. The GEO provides an informal drop-in service for all staff where females can get advice on career development and work-life balance. The Dean and Centre/Deputy Directors are aware of this and refer colleagues to the GEO on an ad hoc basis.
Action R2.1 Postdoctoral Appraisal and Portfolio.
Action R2.2 Career planning workshops for Postdoctoral Research Fellows.
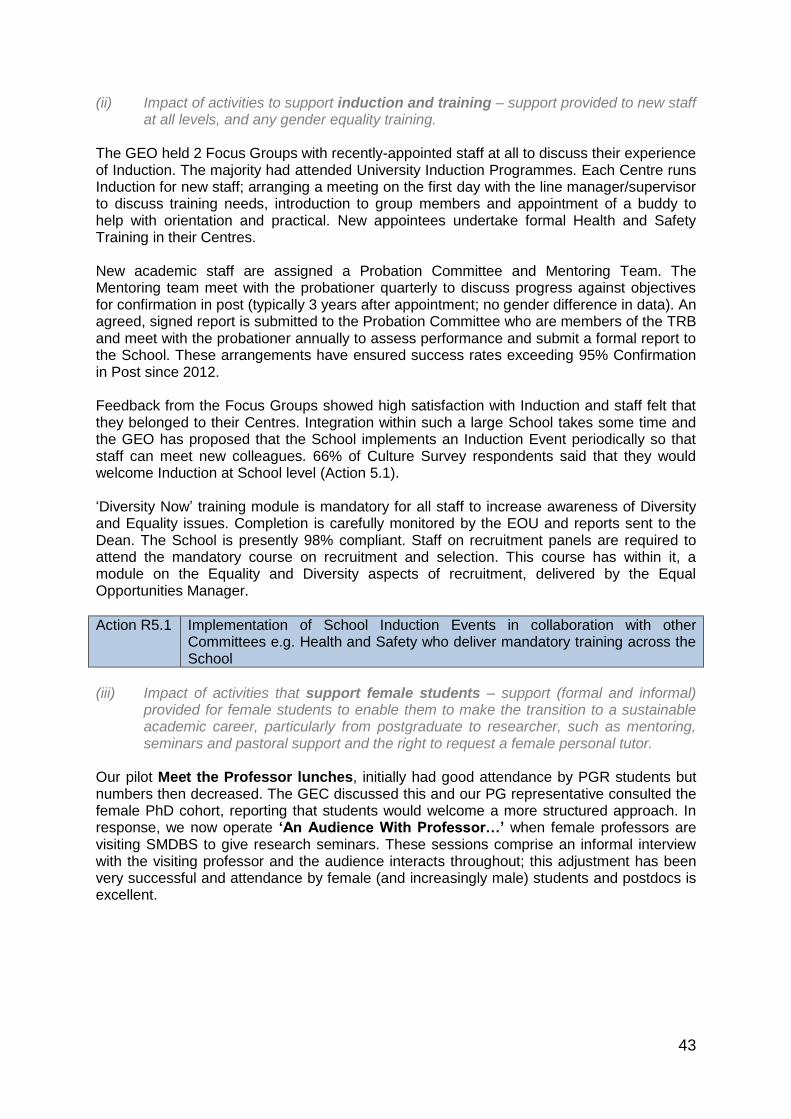
43
(ii) Impact of activities to support induction and training – support provided to new staff at all levels, and any gender equality training.
The GEO held 2 Focus Groups with recently-appointed staff at all to discuss their experience of Induction. The majority had attended University Induction Programmes. Each Centre runs Induction for new staff; arranging a meeting on the first day with the line manager/supervisor to discuss training needs, introduction to group members and appointment of a buddy to help with orientation and practical. New appointees undertake formal Health and Safety Training in their Centres. New academic staff are assigned a Probation Committee and Mentoring Team. The Mentoring team meet with the probationer quarterly to discuss progress against objectives for confirmation in post (typically 3 years after appointment; no gender difference in data). An agreed, signed report is submitted to the Probation Committee who are members of the TRB and meet with the probationer annually to assess performance and submit a formal report to the School. These arrangements have ensured success rates exceeding 95% Confirmation in Post since 2012. Feedback from the Focus Groups showed high satisfaction with Induction and staff felt that they belonged to their Centres. Integration within such a large School takes some time and the GEO has proposed that the School implements an Induction Event periodically so that staff can meet new colleagues. 66% of Culture Survey respondents said that they would welcome Induction at School level (Action 5.1). ‘Diversity Now’ training module is mandatory for all staff to increase awareness of Diversity and Equality issues. Completion is carefully monitored by the EOU and reports sent to the Dean. The School is presently 98% compliant. Staff on recruitment panels are required to attend the mandatory course on recruitment and selection. This course has within it, a module on the Equality and Diversity aspects of recruitment, delivered by the Equal Opportunities Manager.
Action R5.1 Implementation of School Induction Events in collaboration with other Committees e.g. Health and Safety who deliver mandatory training across the School
(iii) Impact of activities that support female students – support (formal and informal)
provided for female students to enable them to make the transition to a sustainable academic career, particularly from postgraduate to researcher, such as mentoring, seminars and pastoral support and the right to request a female personal tutor.
Our pilot Meet the Professor lunches, initially had good attendance by PGR students but numbers then decreased. The GEC discussed this and our PG representative consulted the female PhD cohort, reporting that students would welcome a more structured approach. In response, we now operate ‘An Audience With Professor…’ when female professors are visiting SMDBS to give research seminars. These sessions comprise an informal interview with the visiting professor and the audience interacts throughout; this adjustment has been very successful and attendance by female (and increasingly male) students and postdocs is excellent.
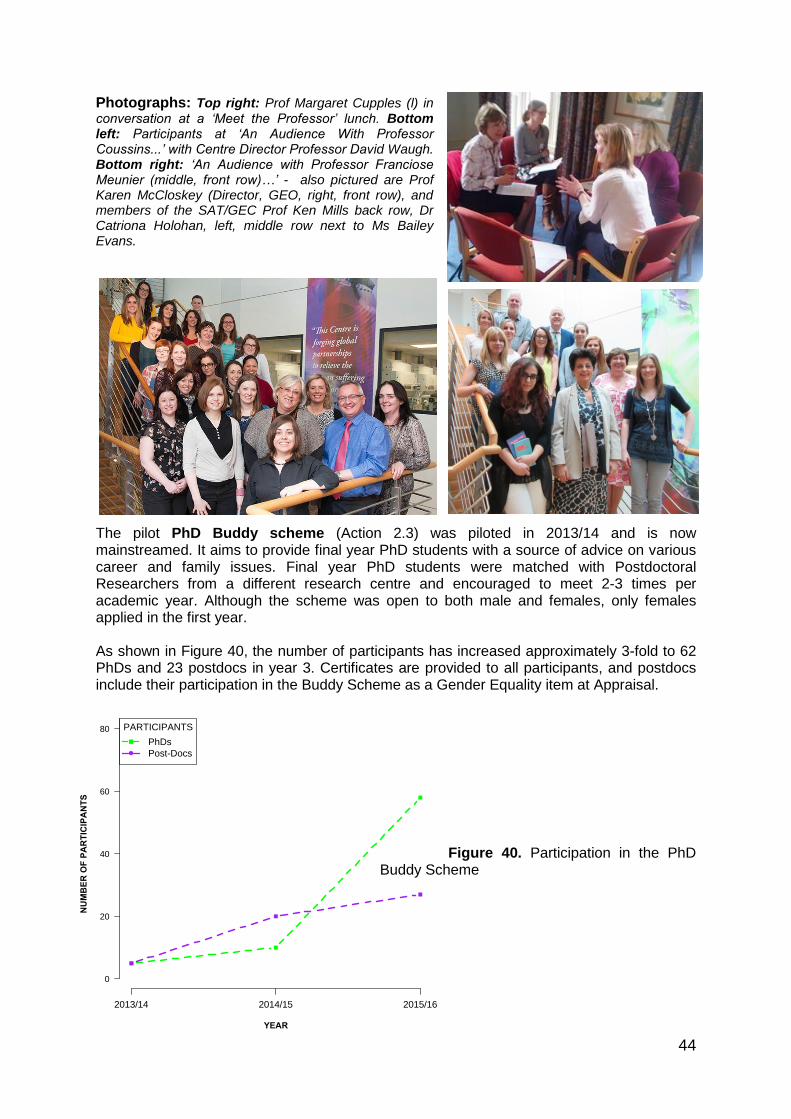
44
YEAR
NU
MB
ER
OF
PA
RT
ICIP
AN
TS
2013/14 2014/15 2015/16
0
20
40
60
80 PARTICIPANTS
PhDs
Post-Docs
Photographs: Top right: Prof Margaret Cupples (l) in
conversation at a ‘Meet the Professor’ lunch. Bottom left: Participants at ‘An Audience With Professor Coussins...’ with Centre Director Professor David Waugh. Bottom right: ‘An Audience with Professor Franciose Meunier (middle, front row)…’ - also pictured are Prof Karen McCloskey (Director, GEO, right, front row), and members of the SAT/GEC Prof Ken Mills back row, Dr Catriona Holohan, left, middle row next to Ms Bailey Evans.
The pilot PhD Buddy scheme (Action 2.3) was piloted in 2013/14 and is now mainstreamed. It aims to provide final year PhD students with a source of advice on various career and family issues. Final year PhD students were matched with Postdoctoral Researchers from a different research centre and encouraged to meet 2-3 times per academic year. Although the scheme was open to both male and females, only females applied in the first year. As shown in Figure 40, the number of participants has increased approximately 3-fold to 62 PhDs and 23 postdocs in year 3. Certificates are provided to all participants, and postdocs include their participation in the Buddy Scheme as a Gender Equality item at Appraisal.
Figure 40. Participation in the PhD Buddy Scheme
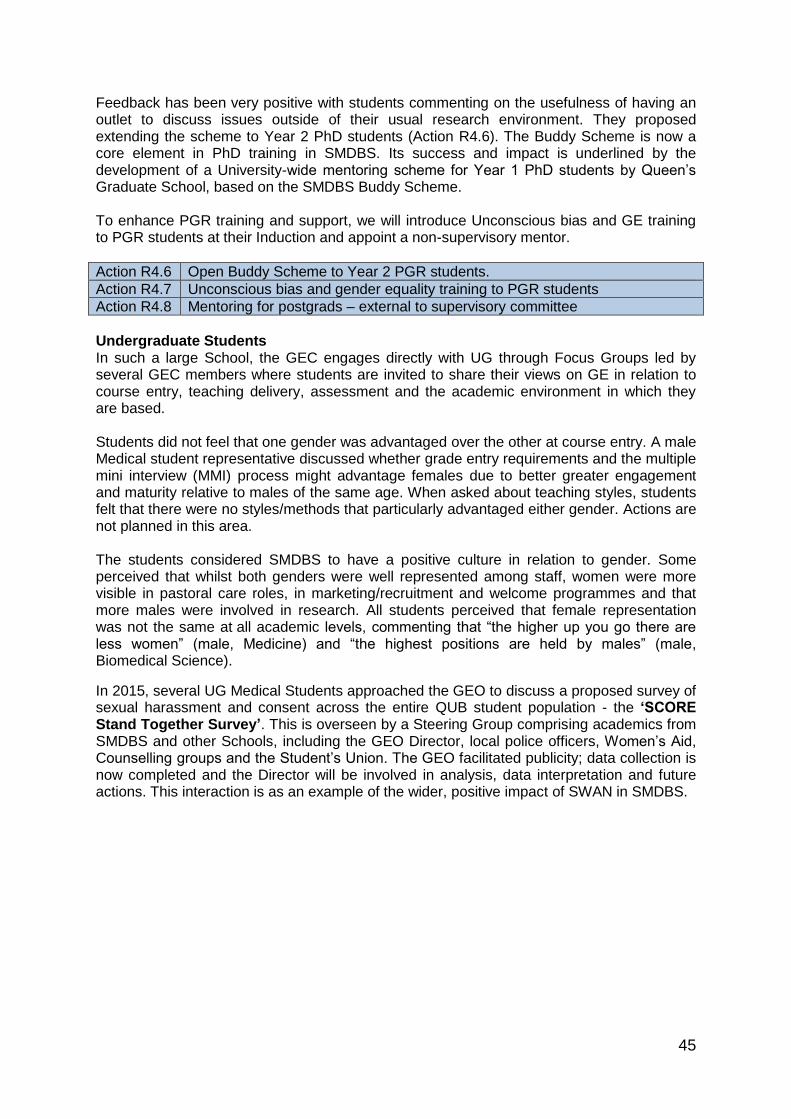
45
Feedback has been very positive with students commenting on the usefulness of having an outlet to discuss issues outside of their usual research environment. They proposed extending the scheme to Year 2 PhD students (Action R4.6). The Buddy Scheme is now a core element in PhD training in SMDBS. Its success and impact is underlined by the development of a University-wide mentoring scheme for Year 1 PhD students by Queen’s Graduate School, based on the SMDBS Buddy Scheme. To enhance PGR training and support, we will introduce Unconscious bias and GE training to PGR students at their Induction and appoint a non-supervisory mentor.
Action R4.6 Open Buddy Scheme to Year 2 PGR students.
Action R4.7 Unconscious bias and gender equality training to PGR students
Action R4.8 Mentoring for postgrads – external to supervisory committee
Undergraduate Students In such a large School, the GEC engages directly with UG through Focus Groups led by several GEC members where students are invited to share their views on GE in relation to course entry, teaching delivery, assessment and the academic environment in which they are based. Students did not feel that one gender was advantaged over the other at course entry. A male Medical student representative discussed whether grade entry requirements and the multiple mini interview (MMI) process might advantage females due to better greater engagement and maturity relative to males of the same age. When asked about teaching styles, students felt that there were no styles/methods that particularly advantaged either gender. Actions are not planned in this area. The students considered SMDBS to have a positive culture in relation to gender. Some perceived that whilst both genders were well represented among staff, women were more visible in pastoral care roles, in marketing/recruitment and welcome programmes and that more males were involved in research. All students perceived that female representation was not the same at all academic levels, commenting that “the higher up you go there are less women” (male, Medicine) and “the highest positions are held by males” (male, Biomedical Science).
In 2015, several UG Medical Students approached the GEO to discuss a proposed survey of sexual harassment and consent across the entire QUB student population - the ‘SCORE Stand Together Survey’. This is overseen by a Steering Group comprising academics from SMDBS and other Schools, including the GEO Director, local police officers, Women’s Aid, Counselling groups and the Student’s Union. The GEO facilitated publicity; data collection is now completed and the Director will be involved in analysis, data interpretation and future actions. This interaction is as an example of the wider, positive impact of SWAN in SMDBS.
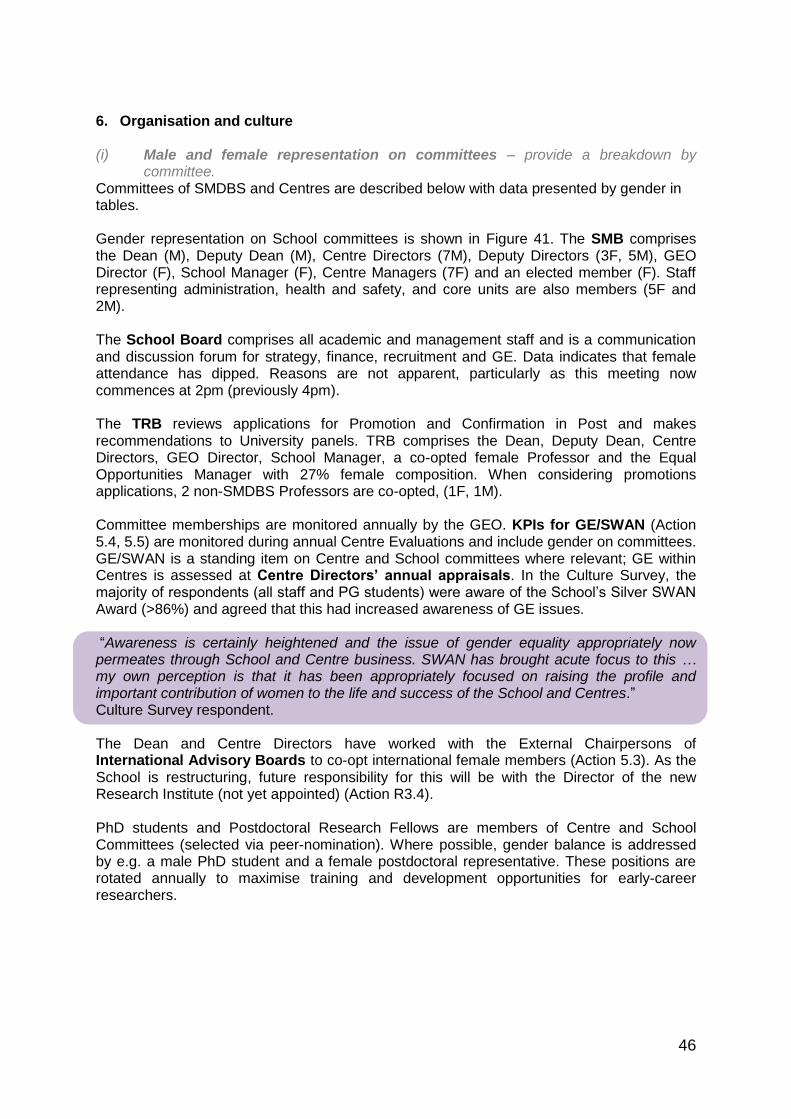
46
6. Organisation and culture (i) Male and female representation on committees – provide a breakdown by
committee. Committees of SMDBS and Centres are described below with data presented by gender in tables. Gender representation on School committees is shown in Figure 41. The SMB comprises the Dean (M), Deputy Dean (M), Centre Directors (7M), Deputy Directors (3F, 5M), GEO Director (F), School Manager (F), Centre Managers (7F) and an elected member (F). Staff representing administration, health and safety, and core units are also members (5F and 2M). The School Board comprises all academic and management staff and is a communication and discussion forum for strategy, finance, recruitment and GE. Data indicates that female attendance has dipped. Reasons are not apparent, particularly as this meeting now commences at 2pm (previously 4pm). The TRB reviews applications for Promotion and Confirmation in Post and makes recommendations to University panels. TRB comprises the Dean, Deputy Dean, Centre Directors, GEO Director, School Manager, a co-opted female Professor and the Equal Opportunities Manager with 27% female composition. When considering promotions applications, 2 non-SMDBS Professors are co-opted, (1F, 1M). Committee memberships are monitored annually by the GEO. KPIs for GE/SWAN (Action 5.4, 5.5) are monitored during annual Centre Evaluations and include gender on committees. GE/SWAN is a standing item on Centre and School committees where relevant; GE within Centres is assessed at Centre Directors’ annual appraisals. In the Culture Survey, the majority of respondents (all staff and PG students) were aware of the School’s Silver SWAN Award (>86%) and agreed that this had increased awareness of GE issues. “Awareness is certainly heightened and the issue of gender equality appropriately now permeates through School and Centre business. SWAN has brought acute focus to this … my own perception is that it has been appropriately focused on raising the profile and important contribution of women to the life and success of the School and Centres.” Culture Survey respondent. The Dean and Centre Directors have worked with the External Chairpersons of International Advisory Boards to co-opt international female members (Action 5.3). As the School is restructuring, future responsibility for this will be with the Director of the new Research Institute (not yet appointed) (Action R3.4). PhD students and Postdoctoral Research Fellows are members of Centre and School Committees (selected via peer-nomination). Where possible, gender balance is addressed by e.g. a male PhD student and a female postdoctoral representative. These positions are rotated annually to maximise training and development opportunities for early-career researchers.
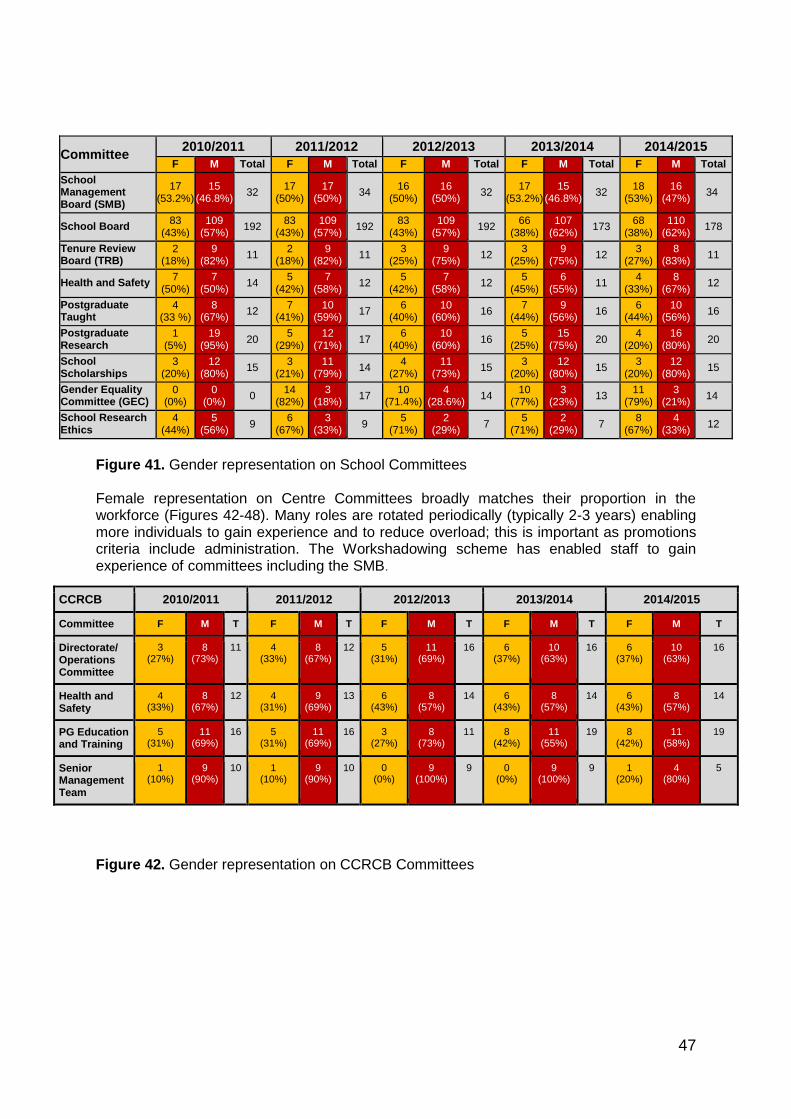
47
Figure 41. Gender representation on School Committees Female representation on Centre Committees broadly matches their proportion in the workforce (Figures 42-48). Many roles are rotated periodically (typically 2-3 years) enabling more individuals to gain experience and to reduce overload; this is important as promotions criteria include administration. The Workshadowing scheme has enabled staff to gain experience of committees including the SMB.
Figure 42. Gender representation on CCRCB Committees
Committee 2010/2011 2011/2012 2012/2013 2013/2014 2014/2015
F M Total F M Total F M Total F M Total F M Total
School Management Board (SMB)
17 (53.2%)
15 (46.8%)
32 17
(50%) 17
(50%) 34
16 (50%)
16 (50%)
32 17
(53.2%) 15
(46.8%) 32
18 (53%)
16 (47%)
34
School Board 83
(43%) 109
(57%) 192
83 (43%)
109 (57%)
192 83
(43%) 109
(57%) 192
66 (38%)
107 (62%)
173 68
(38%) 110
(62%) 178
Tenure Review Board (TRB)
2 (18%)
9 (82%)
11 2
(18%) 9
(82%) 11
3 (25%)
9 (75%)
12 3
(25%) 9
(75%) 12
3 (27%)
8 (83%)
11
Health and Safety 7
(50%) 7
(50%) 14
5 (42%)
7 (58%)
12 5
(42%) 7
(58%) 12
5 (45%)
6 (55%)
11 4
(33%) 8
(67%) 12
Postgraduate Taught
4 (33 %)
8 (67%)
12 7
(41%) 10
(59%) 17
6 (40%)
10 (60%)
16 7
(44%) 9
(56%) 16
6 (44%)
10 (56%)
16
Postgraduate Research
1 (5%)
19 (95%)
20 5
(29%) 12
(71%) 17
6 (40%)
10 (60%)
16 5
(25%) 15
(75%) 20
4 (20%)
16 (80%)
20
School Scholarships
3 (20%)
12 (80%)
15 3
(21%) 11
(79%) 14
4 (27%)
11 (73%)
15 3
(20%) 12
(80%) 15
3 (20%)
12 (80%)
15
Gender Equality Committee (GEC)
0 (0%)
0 (0%)
0 14
(82%) 3
(18%) 17
10 (71.4%)
4 (28.6%)
14 10
(77%) 3
(23%) 13
11 (79%)
3 (21%)
14
School Research Ethics
4 (44%)
5 (56%)
9 6
(67%) 3
(33%) 9
5 (71%)
2 (29%)
7 5
(71%) 2
(29%) 7
8 (67%)
4 (33%)
12
CCRCB 2010/2011 2011/2012 2012/2013 2013/2014 2014/2015
Committee F M T F M T F M T F M T F M T
Directorate/ Operations Committee
3 (27%)
8 (73%)
11 4 (33%)
8 (67%)
12 5 (31%)
11 (69%)
16 6 (37%)
10 (63%)
16 6 (37%)
10 (63%)
16
Health and Safety
4 (33%)
8 (67%)
12 4 (31%)
9 (69%)
13 6 (43%)
8 (57%)
14 6 (43%)
8 (57%)
14 6 (43%)
8 (57%)
14
PG Education and Training
5 (31%)
11 (69%)
16 5 (31%)
11 (69%)
16 3 (27%)
8 (73%)
11 8 (42%)
11 (55%)
19 8 (42%)
11 (58%)
19
Senior Management Team
1 (10%)
9 (90%)
10 1 (10%)
9 (90%)
10 0 (0%)
9 (100%)
9 0 (0%)
9 (100%)
9 1 (20%)
4 (80%)
5

48
Figure 43. Gender representation on CPH Committees
Figure 44. Gender representation on CEM Committees
Figure 45. Gender representation on CII Committees
CPH 2010/2011 2011/2012 2012/2013 2013/2014 2014/2015
Committee F M Total F M Total F M Total F M Total F M Total
Senior Management
2 (35%)
6 (75%)
8 3 (33%)
6 (67%)
9 3 (33.3%)
6 (66.7%)
9 3 (37%)
5 (63%)
8 3 (37%)
5 (63%)
8
Health and Safety
7 (54%)
6 (46%)
13 7 (64%)
4 (36%)
11 6 (54.6%)
5 (45.4%)
11 7 (70%)
3 (30%)
10 8 (72%)
3 (28%)
11
Centre of Excellence Management Board
4 (31%)
9 (69%)
13 4 (31%)
9 (69%)
13 0 (0%)
0 (0%)
0 5 (29%)
12 (71%)
17 7 (39%)
11 (61%)
18
Centre of Excellence Management Exec
5 (42%)
7 (58%)
12 5 (42%)
7 (58%)
12 0 (0%)
0 (0%)
0 9 (64%)
5 (36%)
14 9 (53%)
8 (47%)
17
CII 2010/2011 2011/2012 2012/2013 2013/2014 2014/2015
Committee F M Total F M Total F M Total F M Total F M Total
Centre Business Meeting
15 (60%)
10 (40%)
25 15 (56%)
12 (44%)
27 23 (58%)
17 (42%)
40 23 (60.5%)
15 (39.5%)
38 21 (64%)
12 (36%)
33
Senior Management
1 (33%)
2 (67%)
3 1 (25%)
3 (75%)
4 2 (33%)
4 (67%)
6 2 (33%)
4 (67%)
6 2 (40%)
3 (60%)
5
PG Education and Training
10 (77%)
3 (23%)
13 9 (82%)
2 (17%)
11 9 (69%)
4 (31%)
13 9 (69%)
4 (31%)
13 8 (62%)
5 (38%)
13
Health and Safety
10 (77%)
3 (23%)
13 9 (82%)
2 (17%)
11 12 (71%)
5 (29%)
17 12 (75%)
4 (25%)
16 9 (64%)
5 (36%)
14
CEM 2010/2011 2011/2012 2012/2013 2013/2014 2014/2015
Committee F M Total F M Total F M Total F M Total F M Total
Senior Management
2 (40%)
3 (60%)
5 2
(25%) 6
(75%) 8
3 (37%)
5 (63%)
8 2
(29%) 5
(71%) 7
2 (29%)
5 (71%)
7
General Board 5
(26%) 14
(74%) 19
7 (35%)
13 (65%)
20 10
(43%) 13
(57%) 23
9 (43%)
12 (67%)
21 10
(43%) 13
(57%) 23
PG Education and Training
1 (20%)
4 (80%)
5 1
(17%) 5
(83%) 6
3 (37%)
5 (63%)
8 3
(38%) 5
(62%) 8
3 (43%)
4 (57%)
7
Health and Safety
1 (33%)
2 (67%)
3 1
(33%) 2
(67%) 3
2 (33%)
4 (67%)
6 1
(50%) 1
(50%) 2
1 (50%)
1 (50%)
2
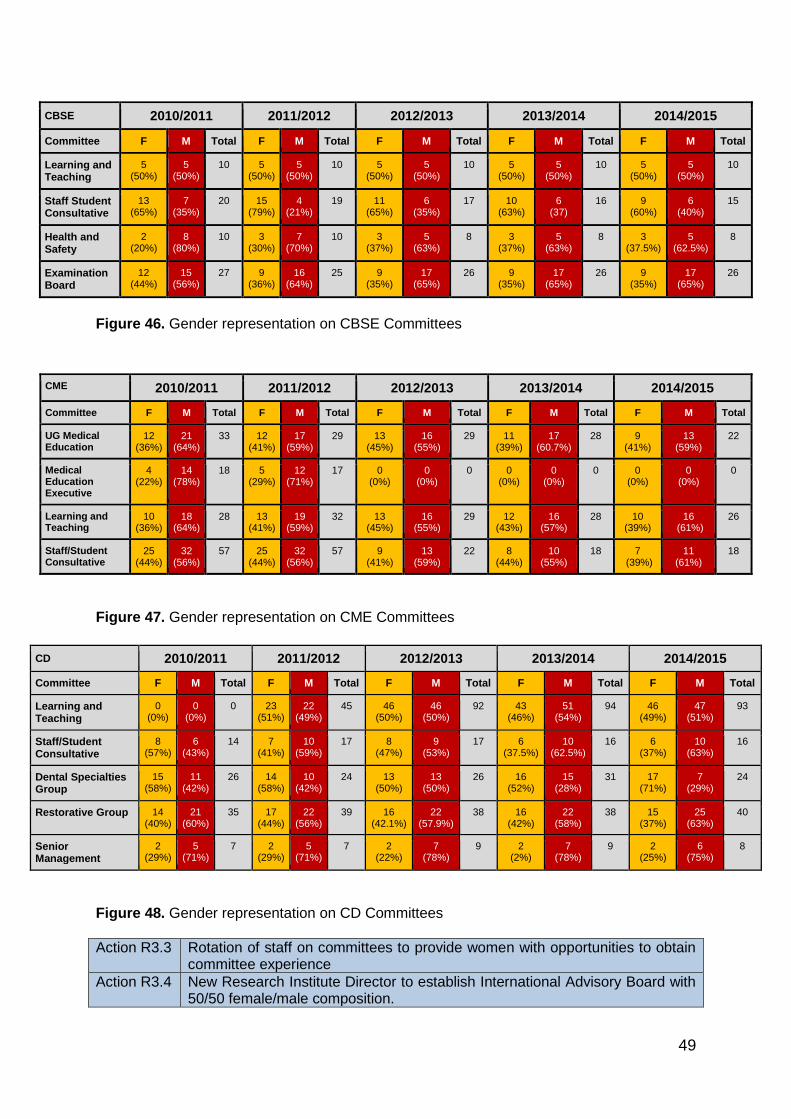
49
Figure 46. Gender representation on CBSE Committees
Figure 47. Gender representation on CME Committees
Figure 48. Gender representation on CD Committees
Action R3.3 Rotation of staff on committees to provide women with opportunities to obtain committee experience
Action R3.4 New Research Institute Director to establish International Advisory Board with 50/50 female/male composition.
CBSE 2010/2011 2011/2012 2012/2013 2013/2014 2014/2015
Committee F M Total F M Total F M Total F M Total F M Total
Learning and Teaching
5 (50%)
5 (50%)
10 5 (50%)
5 (50%)
10 5 (50%)
5 (50%)
10 5 (50%)
5 (50%)
10 5 (50%)
5 (50%)
10
Staff Student Consultative
13 (65%)
7 (35%)
20 15 (79%)
4 (21%)
19 11 (65%)
6 (35%)
17 10 (63%)
6 (37)
16 9 (60%)
6 (40%)
15
Health and Safety
2 (20%)
8 (80%)
10 3 (30%)
7 (70%)
10 3 (37%)
5 (63%)
8 3 (37%)
5 (63%)
8 3 (37.5%)
5 (62.5%)
8
Examination Board
12 (44%)
15 (56%)
27 9 (36%)
16 (64%)
25 9 (35%)
17 (65%)
26 9 (35%)
17 (65%)
26 9 (35%)
17 (65%)
26
CME 2010/2011 2011/2012 2012/2013 2013/2014 2014/2015
Committee F M Total F M Total F M Total F M Total F M Total
UG Medical Education
12 (36%)
21 (64%)
33 12 (41%)
17 (59%)
29 13 (45%)
16 (55%)
29 11 (39%)
17 (60.7%)
28 9 (41%)
13 (59%)
22
Medical Education Executive
4 (22%)
14 (78%)
18 5 (29%)
12 (71%)
17 0 (0%)
0 (0%)
0 0 (0%)
0 (0%)
0 0 (0%)
0 (0%)
0
Learning and Teaching
10 (36%)
18 (64%)
28 13 (41%)
19 (59%)
32 13 (45%)
16 (55%)
29 12 (43%)
16 (57%)
28 10 (39%)
16 (61%)
26
Staff/Student Consultative
25 (44%)
32 (56%)
57 25 (44%)
32 (56%)
57 9 (41%)
13 (59%)
22 8 (44%)
10 (55%)
18 7 (39%)
11 (61%)
18
CD 2010/2011 2011/2012 2012/2013 2013/2014 2014/2015
Committee F M Total F M Total F M Total F M Total F M Total
Learning and Teaching
0 (0%)
0 (0%)
0 23 (51%)
22 (49%)
45 46 (50%)
46 (50%)
92 43 (46%)
51 (54%)
94 46 (49%)
47 (51%)
93
Staff/Student Consultative
8 (57%)
6 (43%)
14 7 (41%)
10 (59%)
17 8 (47%)
9 (53%)
17 6 (37.5%)
10 (62.5%)
16 6 (37%)
10 (63%)
16
Dental Specialties Group
15 (58%)
11 (42%)
26 14 (58%)
10 (42%)
24 13 (50%)
13 (50%)
26 16 (52%)
15 (28%)
31 17 (71%)
7 (29%)
24
Restorative Group 14 (40%)
21 (60%)
35 17 (44%)
22 (56%)
39 16 (42.1%)
22 (57.9%)
38 16 (42%)
22 (58%)
38 15 (37%)
25 (63%)
40
Senior Management
2 (29%)
5 (71%)
7 2 (29%)
5 (71%)
7 2 (22%)
7 (78%)
9 2 (2%)
7 (78%)
9 2 (25%)
6 (75%)
8
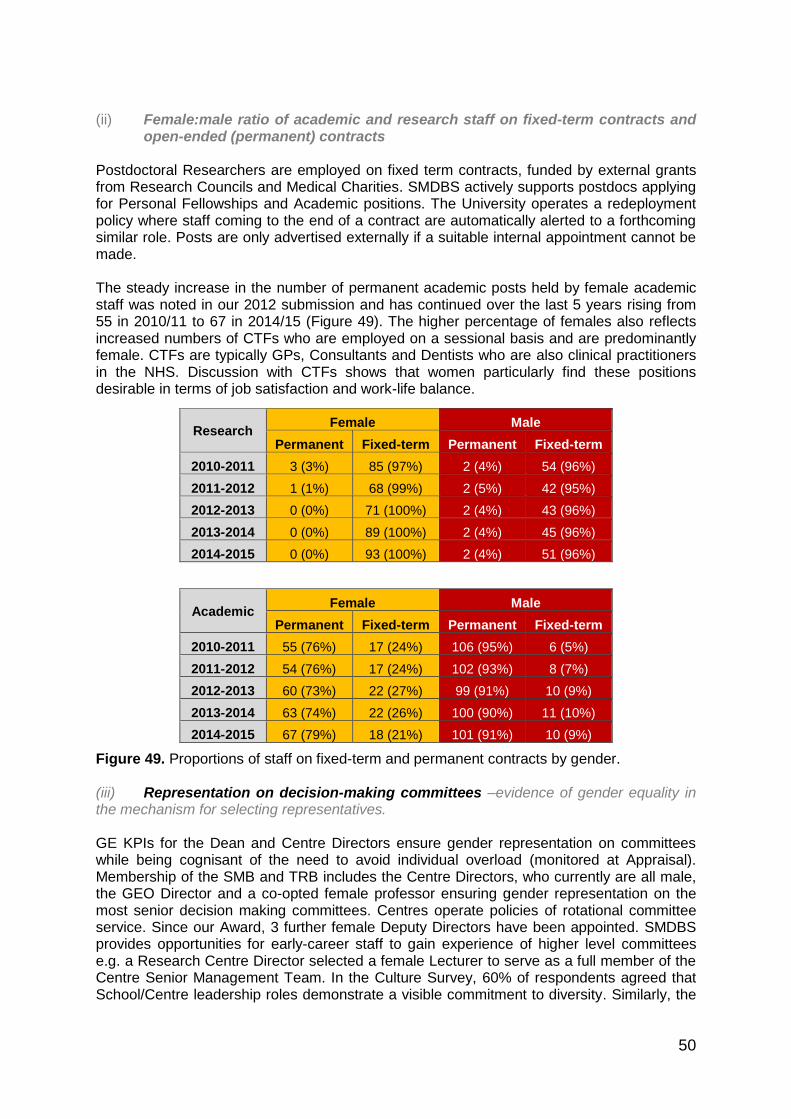
50
(ii) Female:male ratio of academic and research staff on fixed-term contracts and
open-ended (permanent) contracts Postdoctoral Researchers are employed on fixed term contracts, funded by external grants from Research Councils and Medical Charities. SMDBS actively supports postdocs applying for Personal Fellowships and Academic positions. The University operates a redeployment policy where staff coming to the end of a contract are automatically alerted to a forthcoming similar role. Posts are only advertised externally if a suitable internal appointment cannot be made. The steady increase in the number of permanent academic posts held by female academic staff was noted in our 2012 submission and has continued over the last 5 years rising from 55 in 2010/11 to 67 in 2014/15 (Figure 49). The higher percentage of females also reflects increased numbers of CTFs who are employed on a sessional basis and are predominantly female. CTFs are typically GPs, Consultants and Dentists who are also clinical practitioners in the NHS. Discussion with CTFs shows that women particularly find these positions desirable in terms of job satisfaction and work-life balance. Figure 49. Proportions of staff on fixed-term and permanent contracts by gender. (iii) Representation on decision-making committees –evidence of gender equality in the mechanism for selecting representatives. GE KPIs for the Dean and Centre Directors ensure gender representation on committees while being cognisant of the need to avoid individual overload (monitored at Appraisal). Membership of the SMB and TRB includes the Centre Directors, who currently are all male, the GEO Director and a co-opted female professor ensuring gender representation on the most senior decision making committees. Centres operate policies of rotational committee service. Since our Award, 3 further female Deputy Directors have been appointed. SMDBS provides opportunities for early-career staff to gain experience of higher level committees e.g. a Research Centre Director selected a female Lecturer to serve as a full member of the Centre Senior Management Team. In the Culture Survey, 60% of respondents agreed that School/Centre leadership roles demonstrate a visible commitment to diversity. Similarly, the
Research Female Male
Permanent Fixed-term Permanent Fixed-term
2010-2011 3 (3%) 85 (97%) 2 (4%) 54 (96%)
2011-2012 1 (1%) 68 (99%) 2 (5%) 42 (95%)
2012-2013 0 (0%) 71 (100%) 2 (4%) 43 (96%)
2013-2014 0 (0%) 89 (100%) 2 (4%) 45 (96%)
2014-2015 0 (0%) 93 (100%) 2 (4%) 51 (96%)
Academic Female Male
Permanent Fixed-term Permanent Fixed-term
2010-2011 55 (76%) 17 (24%) 106 (95%) 6 (5%)
2011-2012 54 (76%) 17 (24%) 102 (93%) 8 (7%)
2012-2013 60 (73%) 22 (27%) 99 (91%) 10 (9%)
2013-2014 63 (74%) 22 (26%) 100 (90%) 11 (10%)
2014-2015 67 (79%) 18 (21%) 101 (91%) 10 (9%)
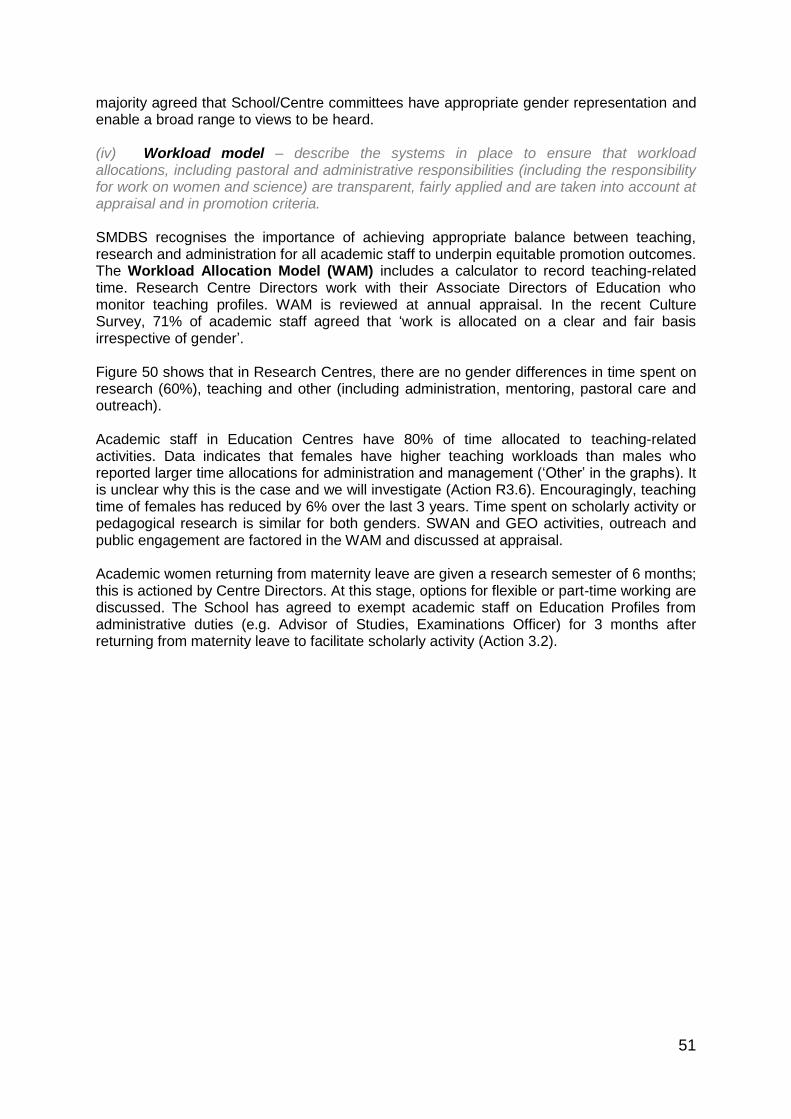
51
majority agreed that School/Centre committees have appropriate gender representation and enable a broad range to views to be heard. (iv) Workload model – describe the systems in place to ensure that workload allocations, including pastoral and administrative responsibilities (including the responsibility for work on women and science) are transparent, fairly applied and are taken into account at appraisal and in promotion criteria. SMDBS recognises the importance of achieving appropriate balance between teaching, research and administration for all academic staff to underpin equitable promotion outcomes. The Workload Allocation Model (WAM) includes a calculator to record teaching-related time. Research Centre Directors work with their Associate Directors of Education who monitor teaching profiles. WAM is reviewed at annual appraisal. In the recent Culture Survey, 71% of academic staff agreed that ‘work is allocated on a clear and fair basis irrespective of gender’. Figure 50 shows that in Research Centres, there are no gender differences in time spent on research (60%), teaching and other (including administration, mentoring, pastoral care and outreach). Academic staff in Education Centres have 80% of time allocated to teaching-related activities. Data indicates that females have higher teaching workloads than males who reported larger time allocations for administration and management (‘Other’ in the graphs). It is unclear why this is the case and we will investigate (Action R3.6). Encouragingly, teaching time of females has reduced by 6% over the last 3 years. Time spent on scholarly activity or pedagogical research is similar for both genders. SWAN and GEO activities, outreach and public engagement are factored in the WAM and discussed at appraisal. Academic women returning from maternity leave are given a research semester of 6 months; this is actioned by Centre Directors. At this stage, options for flexible or part-time working are discussed. The School has agreed to exempt academic staff on Education Profiles from administrative duties (e.g. Advisor of Studies, Examinations Officer) for 3 months after returning from maternity leave to facilitate scholarly activity (Action 3.2).
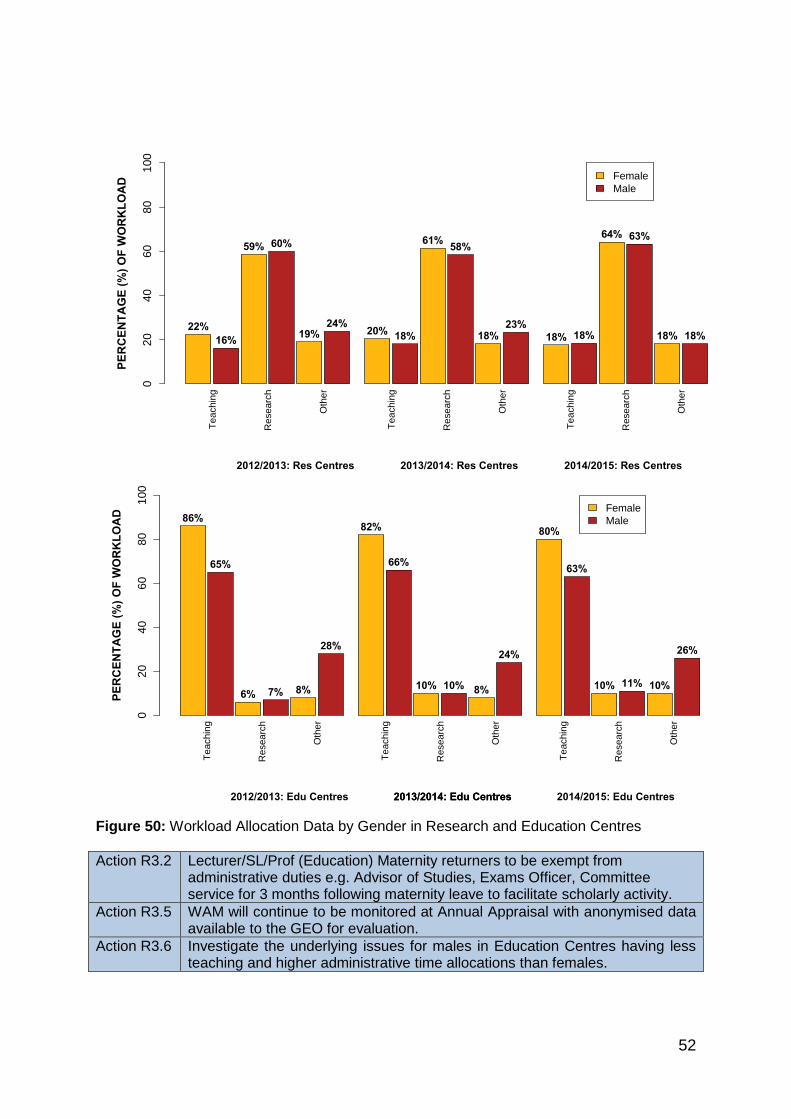
52
PE
RC
EN
TA
GE
(%
) O
F W
OR
KL
OA
D
02
04
06
080
100
86%
65%
6% 7% 8%
28%
82%
66%
10% 10% 8%
24%
80%
63%
10% 11% 10%
26%
Te
achin
g
Researc
h
Oth
er
Te
achin
g
Researc
h
Oth
er
Te
achin
g
Researc
h
Oth
er
Female
Male
2012/2013: Edu Centres 2013/2014: Edu Centres2013/2014: Edu Centres 2014/2015: Edu Centres
PE
RC
EN
TA
GE
(%
) O
F W
OR
KL
OA
D
02
04
06
080
100
22%
16%
59% 60%
19%24%
20%18%
61%58%
18%23%
18% 18%
64% 63%
18% 18%
Te
achin
g
Researc
h
Oth
er
Te
achin
g
Researc
h
Oth
er
Te
achin
g
Researc
h
Oth
er
Female
Male
2012/2013: Res Centres 2013/2014: Res Centres 2014/2015: Res Centres
Figure 50: Workload Allocation Data by Gender in Research and Education Centres
Action R3.2
Lecturer/SL/Prof (Education) Maternity returners to be exempt from administrative duties e.g. Advisor of Studies, Exams Officer, Committee service for 3 months following maternity leave to facilitate scholarly activity.
Action R3.5 WAM will continue to be monitored at Annual Appraisal with anonymised data available to the GEO for evaluation.
Action R3.6 Investigate the underlying issues for males in Education Centres having less teaching and higher administrative time allocations than females.

53
(v) Timing of departmental meetings and social gatherings – evidence of consideration for those with family responsibilities, for example what the department considers to be core hours and whether there is a more flexible system in place.
In order to ensure inclusivity, representation and participation by women in academic life SMDBS core business meetings continue to occur between 10am-4pm facilitating staff with caring responsibilities. Social gatherings have a family-friendly atmosphere e.g. children are welcome at coffee mornings and similar events. 70% of Culture Survey respondents agreed that work-related social activities are welcoming to both women and men. Smaller group meetings take place outside of core hours with the collective agreement of the participants e.g. at 9am so that clinical colleagues and collaborators can attend. Many staff prefer to come to work early and leave in mid-afternoon to facilitate caring responsibilities. In the Culture Survey, 60% agreed that meetings were completed within the core hours with 25% disagreeing (represents small group meetings). Public lectures e.g. Professorial Inaugural Lectures, which traditionally commenced at 5pm now take place at 4pm as a compromise between attendance by School staff and visitors. (vi) Culture –demonstrate how the department is female-friendly and inclusive and
ensures visibility of women, for example external speakers. ‘Culture’ refers to the language, behaviours and other informal interactions that characterise the atmosphere of the department, and includes all staff (academic, technical and support) and students.
SMDBS aims to be welcoming and collegial with an inclusive, supportive culture. In the recent Culture Survey, more than 85% staff/PG students) agreed that the School had a friendly culture. The Annual Charity Fashion Show (see photographs) arranged by medical students to raise funds to purchase equipment for hospitals overseas, demonstrates the positive culture where students work together to arrange, host and act as models in the show, supported by staff who also agree to participate as models.
Photographs: The 2016 Fashion Show; Dr Derek Brazil, SAT/GEC member,4th male on right photograph). SMDBS takes positive action to ensure gender representation and balance in speakers at meetings, workshops, symposia and other events. Awareness has increased and student teams organising events have been guided by staff to ensure GE on programmes. The ‘Women in Science – An Audience with Professor XX’ and WeCAN events have significantly increased the profile of external female speakers and this activity is increasingly mainstreamed (see photographs above). Since our previous application, international high-profile women have been invited to present the prestigious named lectures in the School. A new prestigious lecture, named after a prominent female graduate or staff of the School will be created (Action R5.3). We are keen to share good practice in Beacon activities and plan to host an All-Ireland Athena-SWAN Conference (Action R5.4).
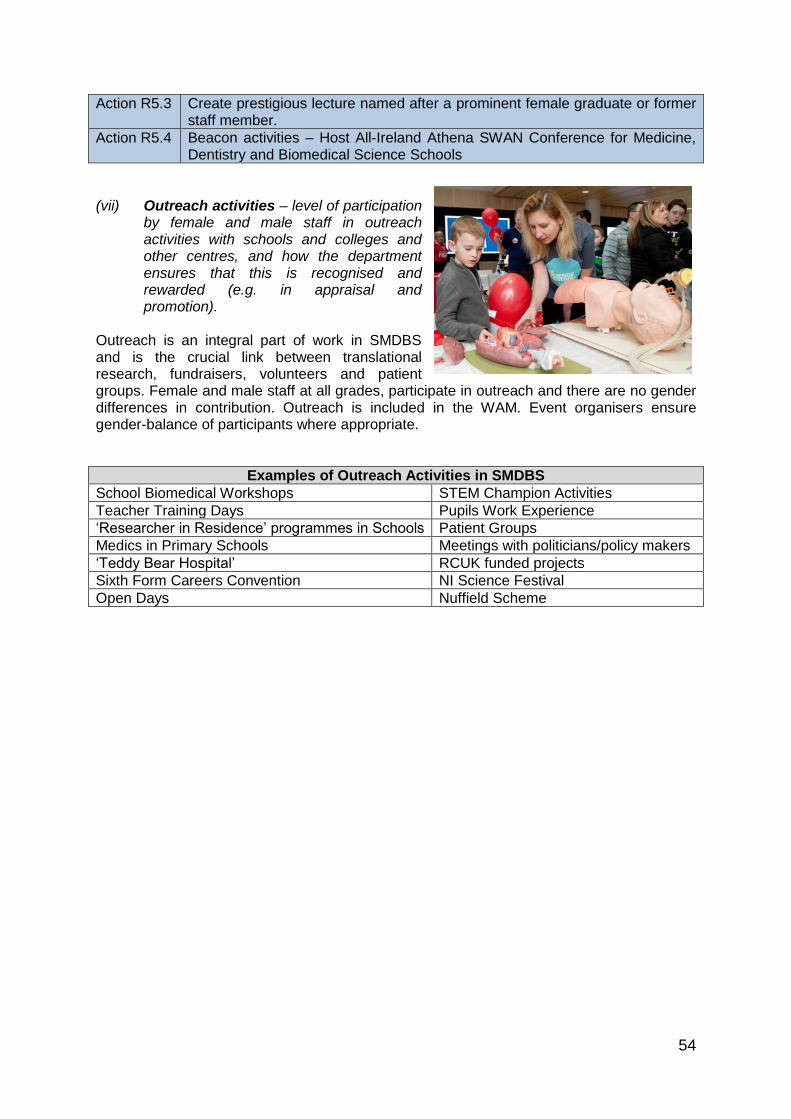
54
Action R5.3 Create prestigious lecture named after a prominent female graduate or former staff member.
Action R5.4 Beacon activities – Host All-Ireland Athena SWAN Conference for Medicine, Dentistry and Biomedical Science Schools
(vii) Outreach activities – level of participation
by female and male staff in outreach activities with schools and colleges and other centres, and how the department ensures that this is recognised and rewarded (e.g. in appraisal and promotion).
Outreach is an integral part of work in SMDBS and is the crucial link between translational research, fundraisers, volunteers and patient groups. Female and male staff at all grades, participate in outreach and there are no gender differences in contribution. Outreach is included in the WAM. Event organisers ensure gender-balance of participants where appropriate.
Examples of Outreach Activities in SMDBS
School Biomedical Workshops STEM Champion Activities
Teacher Training Days Pupils Work Experience
‘Researcher in Residence’ programmes in Schools Patient Groups
Medics in Primary Schools Meetings with politicians/policy makers
‘Teddy Bear Hospital’ RCUK funded projects
Sixth Form Careers Convention NI Science Festival
Open Days Nuffield Scheme

55
7. Flexibility and managing career breaks (i) Maternity return rate The majority of staff who take maternity leave return to work. Only 1 academic and 3 of researchers did not return. The latter 3 cases are likely to be due to end of research contract coinciding with the time of return to work.
Figure 51. Maternity leave and return rate. (ii) Paternity, adoption and parental leave uptake Small numbers of academics and researchers took paternity leave; there were no instances of adoptive leave. The University provides 3 weeks of paternity leave; adoptive leave for women is identical to maternity leave (full-pay week 1-18; statutory maternity pay week 19-30 and week 40-52 unpaid leave). Twice as many females (31) as males (15) took dependant/parental leave over the last 4 years; indicating that women take a greater share of caring responsibilities. It is encouraging that men are using this type of leave and that policies initially designed to benefit women also benefit men.
Figure 52. Paternity and Adoptive Leave.
Figure 53. Dependant/Parental Leave.
Maternity leave (Return) Return Rate
Academic Research Academic Research
2010-2011 4 (4) 12 (11) 100% 91%
2011-2012 6 (6) 9 (9) 100% 100%
2012-2013 5 (4) 7 (7) 80% 100%
2013-2014 5 (5) 6 (6) 100% 100%
2014-2015 9 (9) 11 (9) 100% 81.8%
Paternity, Adoptive Leave
Paternity Adoptive
Academic Research
2010-2011 2 4 0
2011-2012 2 0 0
2012-2013 4 0 0
2013-2014 4 3 0
2014-2015 NA NA NA
Dependant/ Parental Leave
Academic Research
F M F M
2010-2011 1 1 1 1
2011-2012 2 3 6 1
2012-2013 6 1 5 1
2013-2014 5 6 5 1
2014-2015 NA NA NA NA
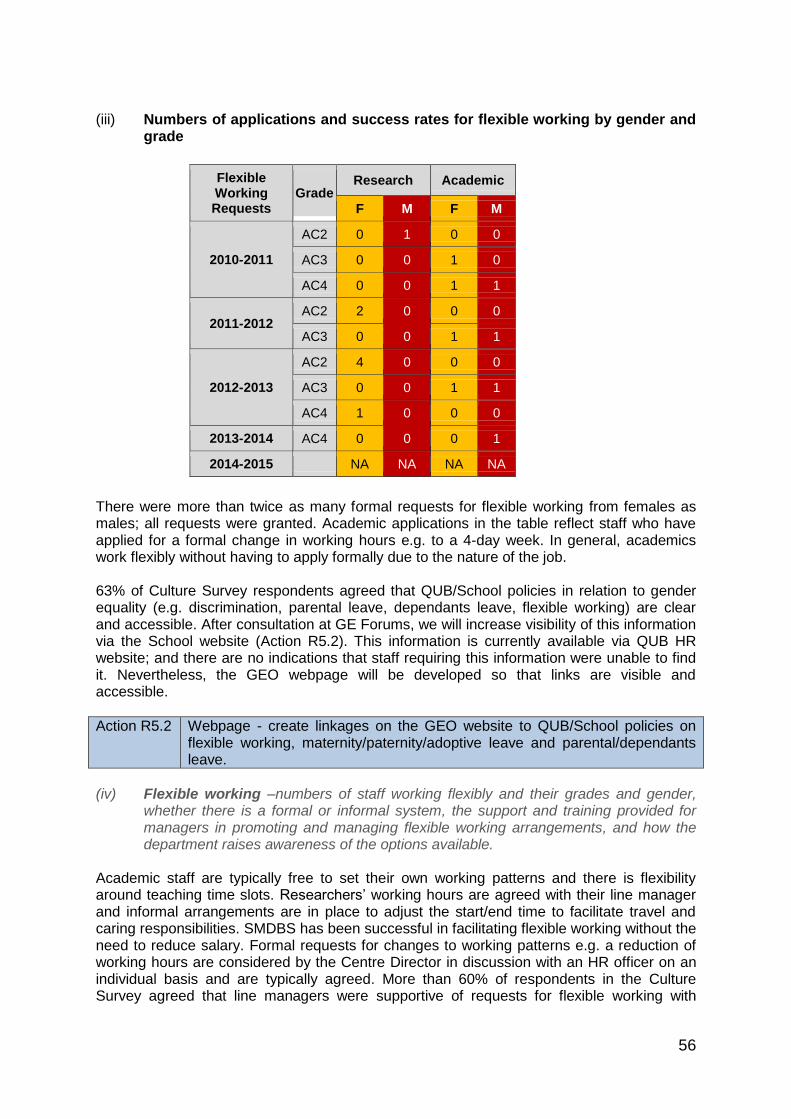
56
(iii) Numbers of applications and success rates for flexible working by gender and
grade There were more than twice as many formal requests for flexible working from females as males; all requests were granted. Academic applications in the table reflect staff who have applied for a formal change in working hours e.g. to a 4-day week. In general, academics work flexibly without having to apply formally due to the nature of the job. 63% of Culture Survey respondents agreed that QUB/School policies in relation to gender equality (e.g. discrimination, parental leave, dependants leave, flexible working) are clear and accessible. After consultation at GE Forums, we will increase visibility of this information via the School website (Action R5.2). This information is currently available via QUB HR website; and there are no indications that staff requiring this information were unable to find it. Nevertheless, the GEO webpage will be developed so that links are visible and accessible.
Action R5.2 Webpage - create linkages on the GEO website to QUB/School policies on flexible working, maternity/paternity/adoptive leave and parental/dependants leave.
(iv) Flexible working –numbers of staff working flexibly and their grades and gender,
whether there is a formal or informal system, the support and training provided for managers in promoting and managing flexible working arrangements, and how the department raises awareness of the options available.
Academic staff are typically free to set their own working patterns and there is flexibility around teaching time slots. Researchers’ working hours are agreed with their line manager and informal arrangements are in place to adjust the start/end time to facilitate travel and caring responsibilities. SMDBS has been successful in facilitating flexible working without the need to reduce salary. Formal requests for changes to working patterns e.g. a reduction of working hours are considered by the Centre Director in discussion with an HR officer on an individual basis and are typically agreed. More than 60% of respondents in the Culture Survey agreed that line managers were supportive of requests for flexible working with
Flexible Working Requests
Grade Research Academic
F M F M
2010-2011
AC2 0 1 0 0
AC3 0 0 1 0
AC4 0 0 1 1
2011-2012 AC2 2 0 0 0
AC3 0 0 1 1
2012-2013
AC2 4 0 0 0
AC3 0 0 1 1
AC4 1 0 0 0
2013-2014 AC4 0 0 0 1
2014-2015 NA NA NA NA
57
others responding ‘don’t know’ therefore suggesting that this was not relevant to their circumstances.
(v) Cover for maternity and adoption leave and support on return – what the
department does, beyond the university maternity policy package, to support female staff before they go on maternity leave, arrangements for covering work during absence, and to help them achieve a suitable work-life balance on their return.
Policy University arrangements for maternity leave are available to all females (there is no minimum service requirement for paid maternity leave eligibility, in contrast to other employers). Women discuss their planned leave with line managers although dates for the start/completion of maternity leave may be adjusted by the staff member at any time. A review of Health and Safety issues is conducted once the pregnancy is reported and adjustments to working practices are made where relevant. The GEO held a Focus Group with maternity returners to learn about experiences of prior to, during and returning from maternity leave. The group included academics, researchers and PhD students. All reported high satisfaction with the understanding and flexibility of their line managers and colleagues. Before The University provides a Maternity Support package which is used e.g. to hire a researcher or a teaching assistant to cover the work. At the Focus Group, women reported that they had discussed maternity arrangements prior to going on leave e.g. a planned phased return to work on a temporary part-time basis taking advantage of unused annual leave. During Women also expressed their satisfaction with Keeping-In-Touch days and were encouraged to bring their babies to work and to meetings if desired. Some chose to attend scientific meetings and social events while on maternity leave. After Furthermore, SMDBS has a policy of a teaching-free, research semester on return for academic staff with reduced teaching/administrative duties to facilitate research progression. All reported flexibility on return to work to deal with childhood illnesses and issues with childcare and many chose to combine working from home with days in the department; again this was positively supported by colleagues and line managers. Discussion with academic staff on teaching-only contracts e.g. Lecturer (Education) revealed that exemption from administrative duties e.g. Advisor of Studies, Examinations Officer, Committee service for 3 months following maternity leave would facilitate scholarly activity (Action R3.2). Maternity leave is an important factor when applying for Promotion/Confirmation in Post and adjustments are made for Research Excellence Framework return outputs. Publication quality rather than quantity is considered at promotion. In addition, it is recognised that women with caring responsibilities may not be able to develop a significant international profile for a number of years and this is also considered by Promotion panels.
Action R3.2 Relief from administrative duties e.g. Advisor of Studies, Exams Officer, Committee service for 3 months following maternity leave to facilitate scholarly activity.
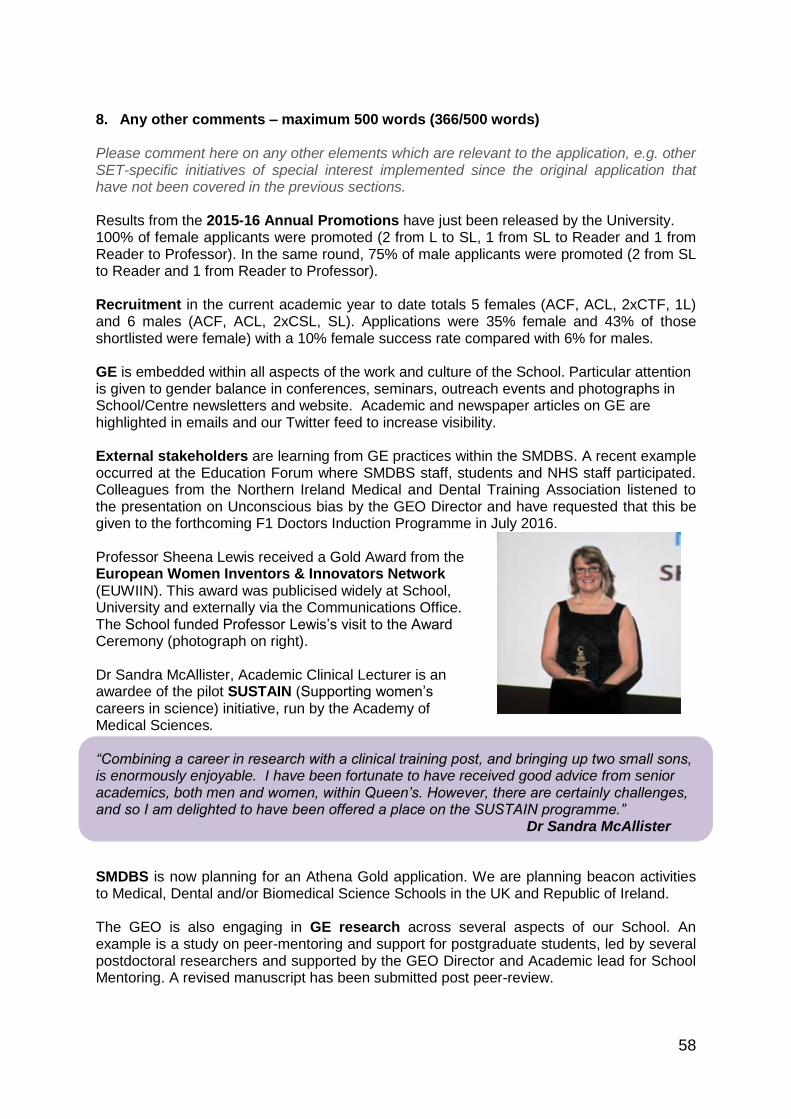
58
8. Any other comments – maximum 500 words (366/500 words) Please comment here on any other elements which are relevant to the application, e.g. other SET-specific initiatives of special interest implemented since the original application that have not been covered in the previous sections. Results from the 2015-16 Annual Promotions have just been released by the University. 100% of female applicants were promoted (2 from L to SL, 1 from SL to Reader and 1 from Reader to Professor). In the same round, 75% of male applicants were promoted (2 from SL to Reader and 1 from Reader to Professor). Recruitment in the current academic year to date totals 5 females (ACF, ACL, 2xCTF, 1L) and 6 males (ACF, ACL, 2xCSL, SL). Applications were 35% female and 43% of those shortlisted were female) with a 10% female success rate compared with 6% for males. GE is embedded within all aspects of the work and culture of the School. Particular attention is given to gender balance in conferences, seminars, outreach events and photographs in School/Centre newsletters and website. Academic and newspaper articles on GE are highlighted in emails and our Twitter feed to increase visibility. External stakeholders are learning from GE practices within the SMDBS. A recent example occurred at the Education Forum where SMDBS staff, students and NHS staff participated. Colleagues from the Northern Ireland Medical and Dental Training Association listened to the presentation on Unconscious bias by the GEO Director and have requested that this be given to the forthcoming F1 Doctors Induction Programme in July 2016. Professor Sheena Lewis received a Gold Award from the European Women Inventors & Innovators Network (EUWIIN). This award was publicised widely at School, University and externally via the Communications Office. The School funded Professor Lewis’s visit to the Award Ceremony (photograph on right).
Dr Sandra McAllister, Academic Clinical Lecturer is an awardee of the pilot SUSTAIN (Supporting women’s careers in science) initiative, run by the Academy of Medical Sciences. “Combining a career in research with a clinical training post, and bringing up two small sons, is enormously enjoyable. I have been fortunate to have received good advice from senior academics, both men and women, within Queen’s. However, there are certainly challenges, and so I am delighted to have been offered a place on the SUSTAIN programme.”
Dr Sandra McAllister SMDBS is now planning for an Athena Gold application. We are planning beacon activities to Medical, Dental and/or Biomedical Science Schools in the UK and Republic of Ireland. The GEO is also engaging in GE research across several aspects of our School. An example is a study on peer-mentoring and support for postgraduate students, led by several postdoctoral researchers and supported by the GEO Director and Academic lead for School Mentoring. A revised manuscript has been submitted post peer-review.

59
9. Action plan Provide a new action plan as an appendix. An action plan template is available on the Athena SWAN website. The Action Plan should be a table or a spreadsheet comprising actions to address the priorities identified by the analysis of relevant data presented in this application, success/outcome measures, the post holder responsible for each action and a timeline for completion. The Plan should cover current initiatives and your aspirations for the next three years.

60
10. Case study: impacting on individuals – maximum 1000 words Describe how the department’s SWAN activities have benefitted two individuals working in the department. One of these case studies should be a member of the self assessment team, the other someone else in the department. More information on case studies is available in the guidance. Case studies have been removed in accordance with School practice.
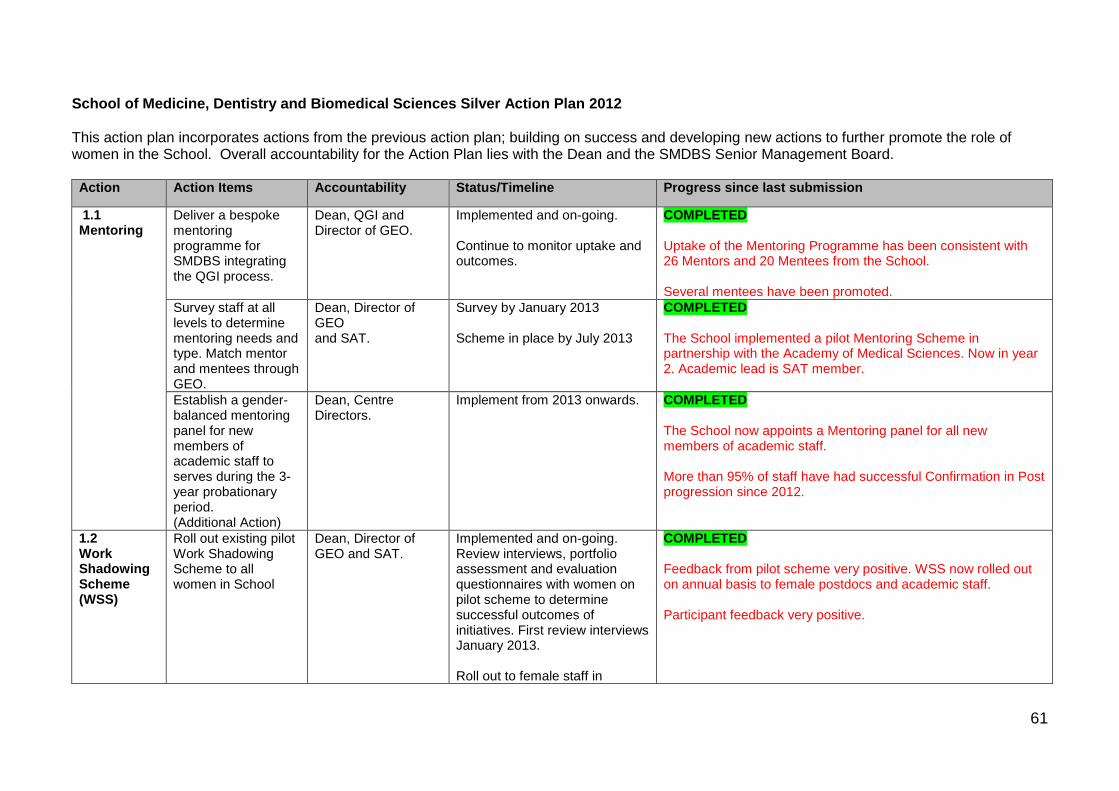
61
School of Medicine, Dentistry and Biomedical Sciences Silver Action Plan 2012 This action plan incorporates actions from the previous action plan; building on success and developing new actions to further promote the role of women in the School. Overall accountability for the Action Plan lies with the Dean and the SMDBS Senior Management Board. Action Action Items Accountability Status/Timeline Progress since last submission
1.1 Mentoring
Deliver a bespoke mentoring programme for SMDBS integrating the QGI process.
Dean, QGI and Director of GEO.
Implemented and on-going. Continue to monitor uptake and outcomes.
COMPLETED Uptake of the Mentoring Programme has been consistent with 26 Mentors and 20 Mentees from the School. Several mentees have been promoted.
Survey staff at all levels to determine mentoring needs and type. Match mentor and mentees through GEO.
Dean, Director of GEO and SAT.
Survey by January 2013 Scheme in place by July 2013
COMPLETED The School implemented a pilot Mentoring Scheme in partnership with the Academy of Medical Sciences. Now in year 2. Academic lead is SAT member.
Establish a gender-balanced mentoring panel for new members of academic staff to serves during the 3-year probationary period. (Additional Action)
Dean, Centre Directors.
Implement from 2013 onwards. COMPLETED The School now appoints a Mentoring panel for all new members of academic staff. More than 95% of staff have had successful Confirmation in Post progression since 2012.
1.2 Work Shadowing Scheme (WSS)
Roll out existing pilot Work Shadowing Scheme to all women in School
Dean, Director of GEO and SAT.
Implemented and on-going. Review interviews, portfolio assessment and evaluation questionnaires with women on pilot scheme to determine successful outcomes of initiatives. First review interviews January 2013. Roll out to female staff in
COMPLETED Feedback from pilot scheme very positive. WSS now rolled out on annual basis to female postdocs and academic staff. Participant feedback very positive.
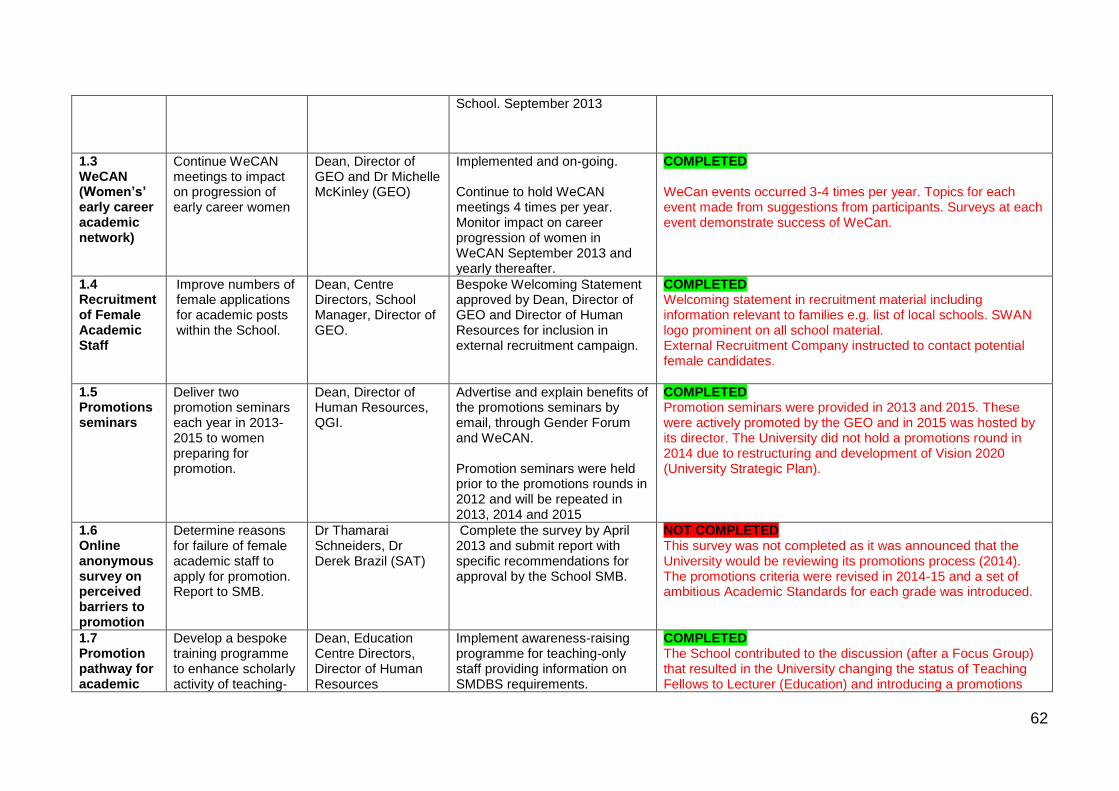
62
School. September 2013
1.3 WeCAN (Women’s’ early career academic network)
Continue WeCAN meetings to impact on progression of early career women
Dean, Director of GEO and Dr Michelle McKinley (GEO)
Implemented and on-going. Continue to hold WeCAN meetings 4 times per year. Monitor impact on career progression of women in WeCAN September 2013 and yearly thereafter.
COMPLETED WeCan events occurred 3-4 times per year. Topics for each event made from suggestions from participants. Surveys at each event demonstrate success of WeCan.
1.4 Recruitment of Female Academic Staff
Improve numbers of female applications for academic posts within the School.
Dean, Centre Directors, School Manager, Director of GEO.
Bespoke Welcoming Statement approved by Dean, Director of GEO and Director of Human Resources for inclusion in external recruitment campaign.
COMPLETED Welcoming statement in recruitment material including information relevant to families e.g. list of local schools. SWAN logo prominent on all school material. External Recruitment Company instructed to contact potential female candidates.
1.5 Promotions seminars
Deliver two promotion seminars each year in 2013-2015 to women preparing for promotion.
Dean, Director of Human Resources, QGI.
Advertise and explain benefits of the promotions seminars by email, through Gender Forum and WeCAN. Promotion seminars were held prior to the promotions rounds in 2012 and will be repeated in 2013, 2014 and 2015
COMPLETED Promotion seminars were provided in 2013 and 2015. These were actively promoted by the GEO and in 2015 was hosted by its director. The University did not hold a promotions round in 2014 due to restructuring and development of Vision 2020 (University Strategic Plan).
1.6 Online anonymous survey on perceived barriers to promotion
Determine reasons for failure of female academic staff to apply for promotion. Report to SMB.
Dr Thamarai Schneiders, Dr Derek Brazil (SAT)
Complete the survey by April 2013 and submit report with specific recommendations for approval by the School SMB.
NOT COMPLETED This survey was not completed as it was announced that the University would be reviewing its promotions process (2014). The promotions criteria were revised in 2014-15 and a set of ambitious Academic Standards for each grade was introduced.
1.7 Promotion pathway for academic
Develop a bespoke training programme to enhance scholarly activity of teaching-
Dean, Education Centre Directors, Director of Human Resources
Implement awareness-raising programme for teaching-only staff providing information on SMDBS requirements.
COMPLETED The School contributed to the discussion (after a Focus Group) that resulted in the University changing the status of Teaching Fellows to Lecturer (Education) and introducing a promotions

63
teaching-only staff
only staff. Ensure standards relating to scholarly activity are addressed in appraisals for teaching-only staff in SMDBS.
pathway up to Professor (Education). Several members of staff have now been promoted on this pathway.
Action Action Items Accountability Status/Timeline Progress since last submission
2.1 Postdoctoral portfolio
Implement the Work Shadowing Scheme) to all female postdoctoral staff by 2013.
Dean, Centre Directors, Dr Marie Cantwell, GEO.
Portfolio documentation and bookmark (with links to Athena Swan) will be distributed to all female postdoctoral researchers in the School in December 2012. Information will be given to supervisors regarding monitoring the portfolios of their research staff.
COMPLETED Athena SWANA bookmark given to female (and male) postdoctoral fellows at the Annual GE Lecture in early 2013 and at the Postdoctoral Symposium. The GEO has worked with the School Postdoctoral Society to develop a career planning portfolio. This initiative is being considered by the University for all postdoctoral fellows.
2.2 Career planning workshops for postdoctoral researchers
Develop a bespoke postdoctoral career planning programme in conjunction with the Staff Training and Development Unit.
Dean, Director of GEO, Chair of Postdoctoral Society, QUB Staff Training and Development Unit.
Partial implementation in place. New bespoke programme in place for 2013-2015 with an expectation that staff will participate in allocated ‘development days’ each year.
COMPLETED This has been implemented. Training workshops have taken place for fellowship writing, networking, generic skills and a number of Career Symposia have taken place. PhD students have been invited to the careers symposia.
2.3 Female postdoctoral researcher-female PhD student Buddy Scheme
Final year female PhD students to meet with postdoctoral scientists.
Director of GEO, PhD representative and Postdoctoral representative
Initiate September 2013 and continue thereafter. Evaluate the impact of the programme in September 2014 and recommend changes where appropriate.
COMPLETED The pilot scheme was very successful and is now an annual event and part of core PhD training. This has been extended to male and female PhD student in second and third year. A mentoring scheme for PhD students has now been adopted across the University.
2.4 ‘Meet the Professor’ lunches for
Professors to host lunches with female PhD students.
Dean, GEO, Professors, PhD student representative
From June 2013 and twice yearly thereafter.
COMPLETED Several of these lunches have taken place. Feedback was mixed and we responded to this by creating “An Audience with Professor…” events.
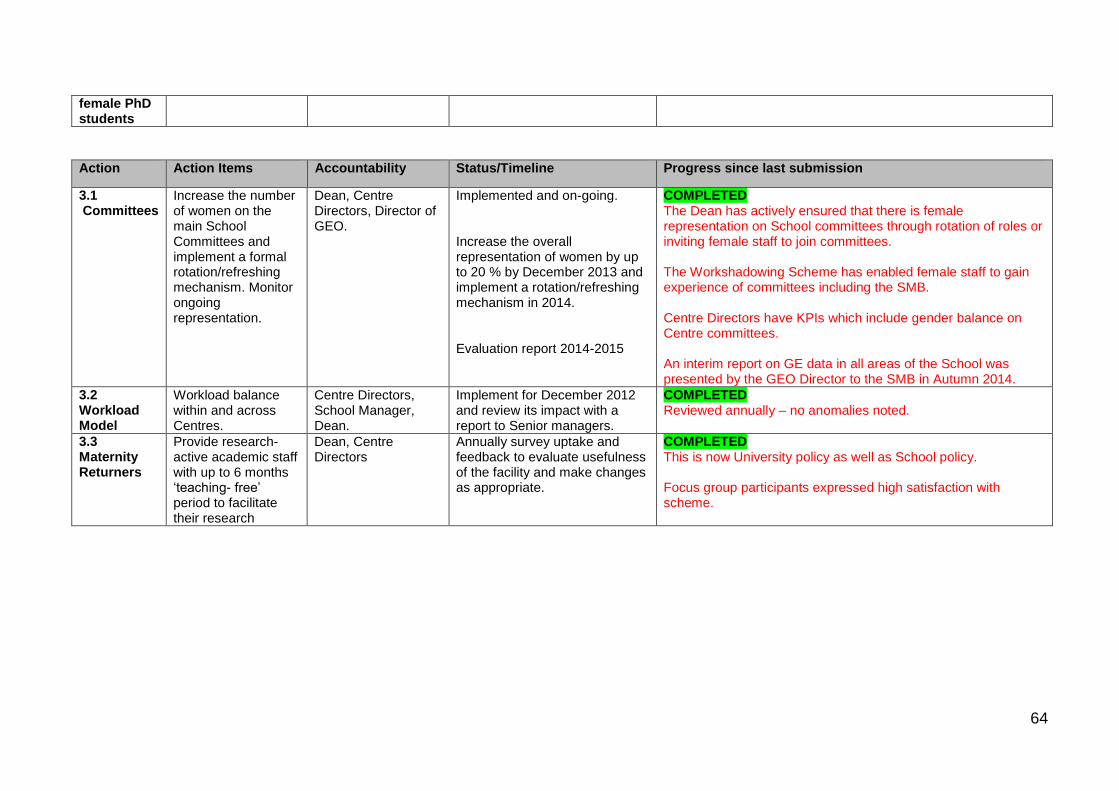
64
female PhD students
Action Action Items Accountability Status/Timeline Progress since last submission
3.1 Committees
Increase the number of women on the main School Committees and implement a formal rotation/refreshing mechanism. Monitor ongoing representation.
Dean, Centre Directors, Director of GEO.
Implemented and on-going. Increase the overall representation of women by up to 20 % by December 2013 and implement a rotation/refreshing mechanism in 2014. Evaluation report 2014-2015
COMPLETED The Dean has actively ensured that there is female representation on School committees through rotation of roles or inviting female staff to join committees. The Workshadowing Scheme has enabled female staff to gain experience of committees including the SMB. Centre Directors have KPIs which include gender balance on Centre committees. An interim report on GE data in all areas of the School was presented by the GEO Director to the SMB in Autumn 2014.
3.2 Workload Model
Workload balance within and across Centres.
Centre Directors, School Manager, Dean.
Implement for December 2012 and review its impact with a report to Senior managers.
COMPLETED Reviewed annually – no anomalies noted.
3.3 Maternity Returners
Provide research-active academic staff with up to 6 months ‘teaching- free’ period to facilitate their research
Dean, Centre Directors
Annually survey uptake and feedback to evaluate usefulness of the facility and make changes as appropriate.
COMPLETED This is now University policy as well as School policy. Focus group participants expressed high satisfaction with scheme.
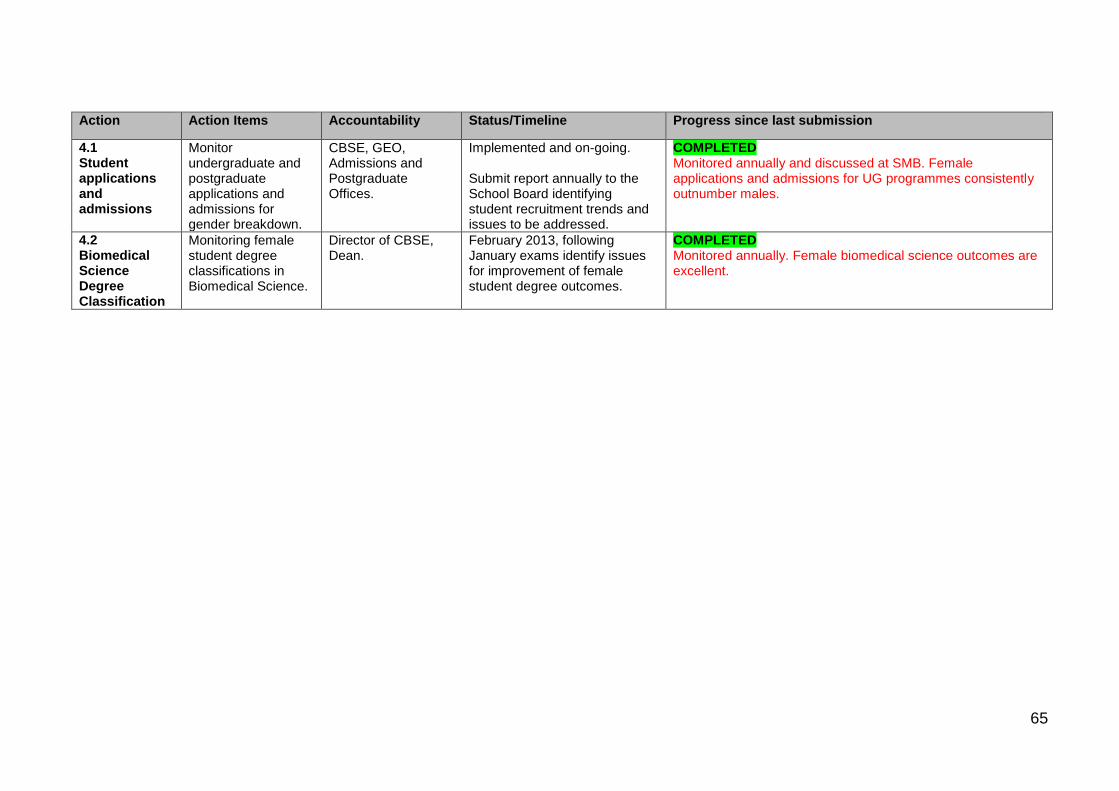
65
Action Action Items Accountability Status/Timeline Progress since last submission
4.1 Student applications and admissions
Monitor undergraduate and postgraduate applications and admissions for gender breakdown.
CBSE, GEO, Admissions and Postgraduate Offices.
Implemented and on-going. Submit report annually to the School Board identifying student recruitment trends and issues to be addressed.
COMPLETED Monitored annually and discussed at SMB. Female applications and admissions for UG programmes consistently outnumber males.
4.2 Biomedical Science Degree Classification
Monitoring female student degree classifications in Biomedical Science.
Director of CBSE, Dean.
February 2013, following January exams identify issues for improvement of female student degree outcomes.
COMPLETED Monitored annually. Female biomedical science outcomes are excellent.
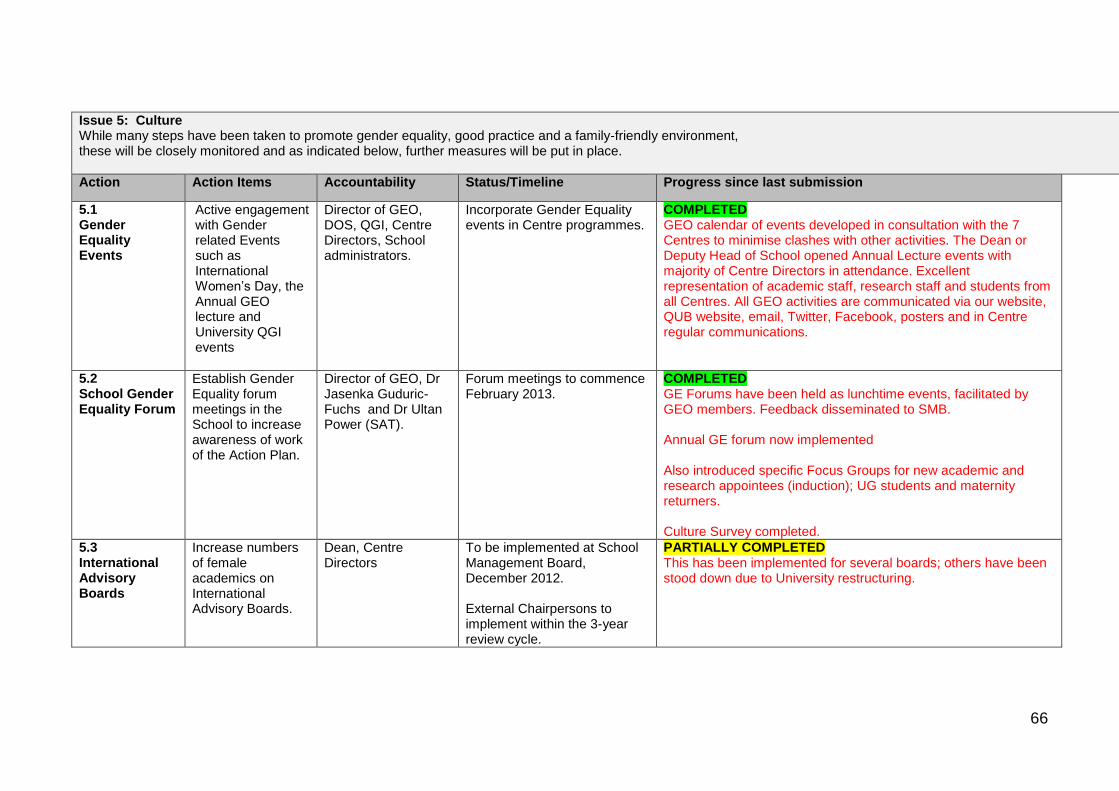
66
Issue 5: Culture While many steps have been taken to promote gender equality, good practice and a family-friendly environment, these will be closely monitored and as indicated below, further measures will be put in place.
Action Action Items Accountability Status/Timeline Progress since last submission
5.1 Gender Equality Events
Active engagement with Gender related Events such as International Women’s Day, the Annual GEO lecture and University QGI events
Director of GEO, DOS, QGI, Centre Directors, School administrators.
Incorporate Gender Equality events in Centre programmes.
COMPLETED GEO calendar of events developed in consultation with the 7 Centres to minimise clashes with other activities. The Dean or Deputy Head of School opened Annual Lecture events with majority of Centre Directors in attendance. Excellent representation of academic staff, research staff and students from all Centres. All GEO activities are communicated via our website, QUB website, email, Twitter, Facebook, posters and in Centre regular communications.
5.2 School Gender Equality Forum
Establish Gender Equality forum meetings in the School to increase awareness of work of the Action Plan.
Director of GEO, Dr Jasenka Guduric-Fuchs and Dr Ultan Power (SAT).
Forum meetings to commence February 2013.
COMPLETED GE Forums have been held as lunchtime events, facilitated by GEO members. Feedback disseminated to SMB. Annual GE forum now implemented Also introduced specific Focus Groups for new academic and research appointees (induction); UG students and maternity returners. Culture Survey completed.
5.3 International Advisory Boards
Increase numbers of female academics on International Advisory Boards.
Dean, Centre Directors
To be implemented at School Management Board, December 2012. External Chairpersons to implement within the 3-year review cycle.
PARTIALLY COMPLETED This has been implemented for several boards; others have been stood down due to University restructuring.
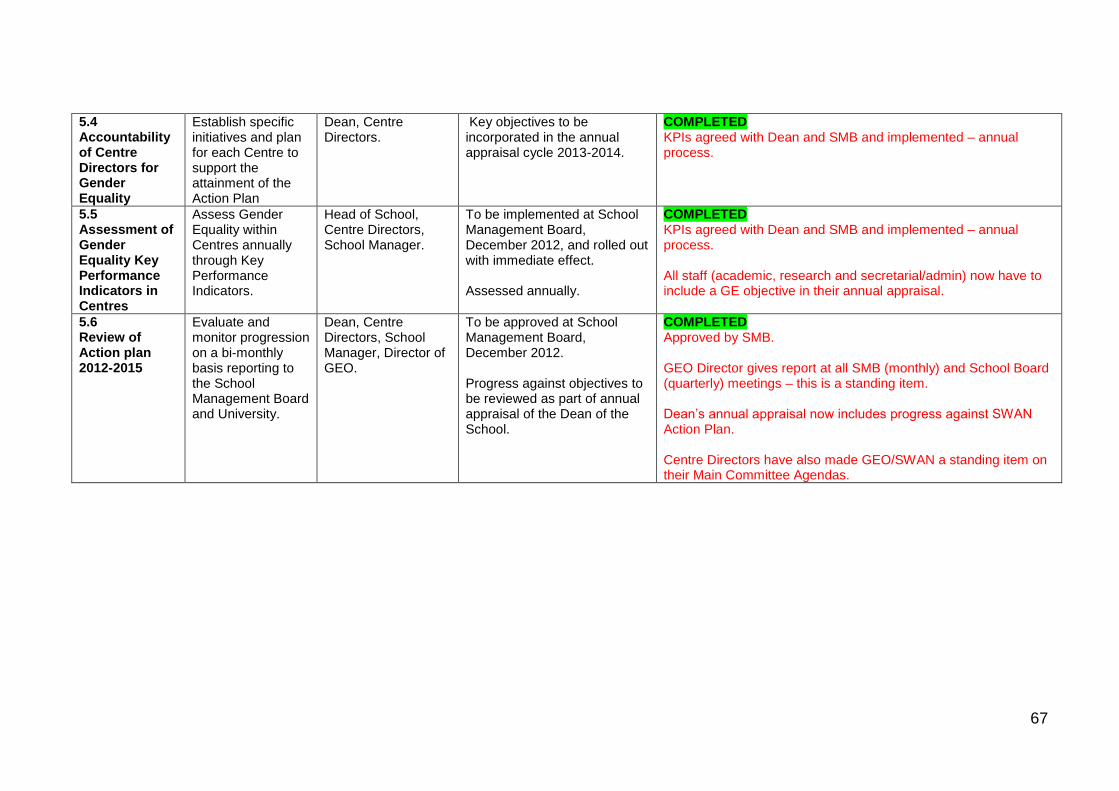
67
5.4 Accountability of Centre Directors for Gender Equality
Establish specific initiatives and plan for each Centre to support the attainment of the Action Plan
Dean, Centre Directors.
Key objectives to be incorporated in the annual appraisal cycle 2013-2014.
COMPLETED KPIs agreed with Dean and SMB and implemented – annual process.
5.5 Assessment of Gender Equality Key Performance Indicators in Centres
Assess Gender Equality within Centres annually through Key Performance Indicators.
Head of School, Centre Directors, School Manager.
To be implemented at School Management Board, December 2012, and rolled out with immediate effect. Assessed annually.
COMPLETED KPIs agreed with Dean and SMB and implemented – annual process. All staff (academic, research and secretarial/admin) now have to include a GE objective in their annual appraisal.
5.6 Review of Action plan 2012-2015
Evaluate and monitor progression on a bi-monthly basis reporting to the School Management Board and University.
Dean, Centre Directors, School Manager, Director of GEO.
To be approved at School Management Board, December 2012. Progress against objectives to be reviewed as part of annual appraisal of the Dean of the School.
COMPLETED Approved by SMB. GEO Director gives report at all SMB (monthly) and School Board (quarterly) meetings – this is a standing item. Dean’s annual appraisal now includes progress against SWAN Action Plan. Centre Directors have also made GEO/SWAN a standing item on their Main Committee Agendas.

68
School of Medicine, Dentistry and Biomedical Sciences Silver Renewal Action Plan 2016 This action plan incorporates actions from the previous action plan 2012; building on success and developing new actions to further promote the role of women in the School. Overall accountability for the Action Plan lies with the Dean and the SMDBS Senior Management Board.
Issue 1: Promotion and recruitment of women Analysis of data over the past 3 years has highlighted the ‘leaky pipeline’ for women in relation to career progression particularly at Senior Lecturer, Reader and Professor levels. Lecturers in the School are 64% female and we have made significant progress at Senior Lecturer from 22% to 41% female over the last 5 years.
Issue identified Actions underway and planned Person/group responsible
Measures of Success Timescale
R1.1 The numbers and proportions of female Lecturers and Senior Lecturers have improved over the last 5 years. The numbers and percentages of female Professors have not changed, remaining at 17%.
We will improve our current 40% female Senior Lecturers and Readers, aiming for parity with male colleagues at the same grade.
We have set a new target reaching 30% female Professorial staff. This will be achieved by actions relating to promotions and recruitment (R1.2-R1.5, R1.9-R1.11).
Dean of the School.
An annual report on progress towards targets will be produced and reviewed by the SMB which will be used to direct any further actions needed to ensure success. Improving numbers and percentages of female Senior Lecturers and Readers each year, towards 50%. Target of 30% female Professors by 2019.
September 2016 and annually thereafter. September 2019
R1.2 Search Committees are used infrequently for recruitment and fewer women than men apply for academic positions.
The School will use gender-balanced Search Committees for all Professorial/Director appointments. School Manager to collate Search Committee data from Annual Centre Reports.
Centre Directors and School Manager.
Data to be available September 2017, 2018 and 2019 and reported to the SMB each September highlighting trends and recommending actions. 20% increase in the number of female applicants by Sep 2019.
September 2017 and annually thereafter. September 2019
R1.3 Significantly fewer women than men apply for externally advertised academic positions.
The current website serves prospective students better than staff applicants.
Create a recruitment page on the School website with information on flexible working, family-friendly policies and links to the School GEO and HR websites.
GEO Clerical Staff and School IT support team.
New website created and live online. Impact to be measured by website usage statistics and reviewed by GEO. Popup surveys to every 10th visitor inviting participation in a feedback survey will help to measure impact.
December 2016 June 2017 and annually thereafter From January 2017
R1.4 Professional networks are Increase the use of professional Dean of School Information to be captured from Initiated as vacancies

69
currently under-used during recruitment.
networks, e.g. WISE (Women in Science and Engineering), Learned Societies e.g. The Physiological Society, The Academy of Medical Sciences and the Clinical Royal Colleges, in recruitment by creating links to advertisements. Search Committees to promote use of networks.
and Search Committees.
application forms where candidates noted advert to assess impact. Increased number of female applicants by at least 20% by 2019. Design and distribute a survey for candidates to include experience of School website, interaction with search committee, interview experience.
arise. Strategic review in GEC meeting every June.
R1.5 Fewer women (40% of applicants) than men apply for promotion.
Centre Directors to proactively identify and engage with female staff who are reaching the Academic Standards for promotion and to mentor them towards a successful application
Centre Directors. Over the 3 year Action Plan, increase in the number of female applicants to an average of 8/year (6/year currently). Develop an anonymised Case Study of one successful female mentee indicating degree of satisfaction with process and host on the GEO website.
Annually post-appraisal, from September 2016 September 2018
R1.6 Many staff may not be familiar with the recently introduced Academic Standards. This may contribute to fewer women applying for promotion. Improved familiarity with Academic Standards may encourage more females to apply.
Academic Standards and Promotion Planning to be discussed at all appraisals with monitoring of workload models.
Appraisers. A question relating to staff understanding of Academic Standards will be added to the Culture Survey to investigate perceived awareness and understanding of the academic standards.
Culture survey from January 2017
R1.7 We are keen to know whether there is a gender related difference in the typical times spent at each academic grade.
Investigate typical times spent at each academic grade by gender.
Director and Clerical staff of the GEO.
Generate a dataset and report of the time spent at each grade by gender in current staff cohort. GEC Agenda item, October 2016. Present to SMB.
September 2016 October 2016 December 2016
R1.8 Feedback demonstrates the popularity and success of the Workshadowing Programme, WeCAN and Mentoring
GEO to continue to deliver these mainstream activities; developing programme content to address participant needs raised through
GEO Director, Academic leads.
Event surveys and Focus Groups. Outcome data from Culture Survey.
Ongoing Culture survey from January 2017
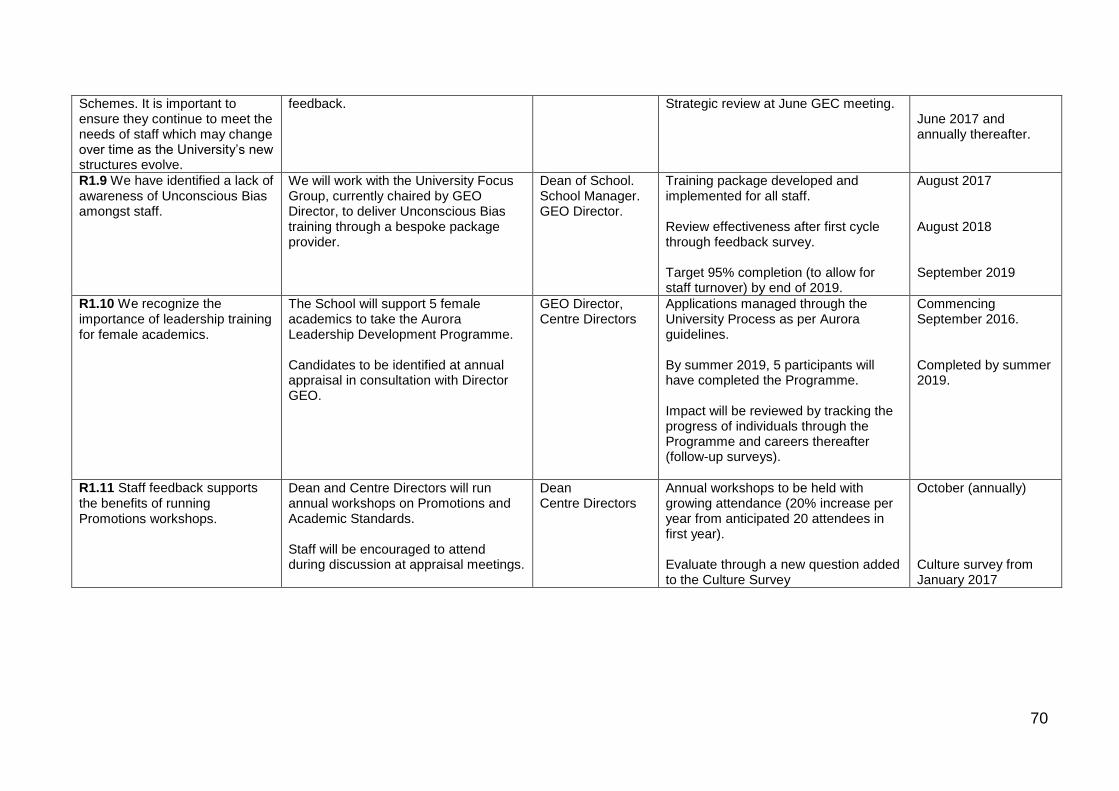
70
Schemes. It is important to ensure they continue to meet the needs of staff which may change over time as the University’s new structures evolve.
feedback. Strategic review at June GEC meeting. June 2017 and annually thereafter.
R1.9 We have identified a lack of awareness of Unconscious Bias amongst staff.
We will work with the University Focus Group, currently chaired by GEO Director, to deliver Unconscious Bias training through a bespoke package provider.
Dean of School. School Manager. GEO Director.
Training package developed and implemented for all staff. Review effectiveness after first cycle through feedback survey. Target 95% completion (to allow for staff turnover) by end of 2019.
August 2017 August 2018 September 2019
R1.10 We recognize the importance of leadership training for female academics.
The School will support 5 female academics to take the Aurora Leadership Development Programme. Candidates to be identified at annual appraisal in consultation with Director GEO.
GEO Director, Centre Directors
Applications managed through the University Process as per Aurora guidelines. By summer 2019, 5 participants will have completed the Programme. Impact will be reviewed by tracking the progress of individuals through the Programme and careers thereafter (follow-up surveys).
Commencing September 2016. Completed by summer 2019.
R1.11 Staff feedback supports the benefits of running Promotions workshops.
Dean and Centre Directors will run annual workshops on Promotions and Academic Standards. Staff will be encouraged to attend during discussion at appraisal meetings.
Dean Centre Directors
Annual workshops to be held with growing attendance (20% increase per year from anticipated 20 attendees in first year). Evaluate through a new question added to the Culture Survey
October (annually) Culture survey from January 2017

71
Issue 2: Supporting women at postdoctoral level In addition to the Work Shadowing Scheme and Gender Forum, other measures to support postdoctoral researchers to advance to Lecturer post will be undertaken. There is not a major block in the transition from PDRA to Lecturer but measures to encourage more women to become academics will be implemented in order to maintain a sufficient pool of female academics at Lecturer level.
Issue identified Actions underway and planned
Person/group responsible
Measures of Success Timescale
R2.1 During our Silver SWAN award, the GEO worked with the Postdoctoral Society to develop a career planning portfolio. An e-Portfolio now needs to be implemented to support career planning.
Launch the Postdoctoral Portfolio e-portfolio from the PURE platform. Pilot test the e-Portfolio. Inform Line Managers about the implementation of the Portfolio on PURE. Modify the ePortfolio based on pilot testing. Combine the e-portfolio with annual appraisal. Provide information about the Portfolio and Appraisal at Induction, Handbooks and at the Postdoctoral Symposium.
Associate Directors for Postdoctoral Training. Chair, School Postdoctoral Society.
A new e-portfolio available to all postdoctoral researchers. Pilot in 2017 Evidence of awareness of the postdoctoral portfolio gathered in the annual culture survey/PDRA survey. Success measured by feedback from pilot and case studies. Increased participation each year with target 60% of PDRA by Sep 2019.
Launched December 2016 January 2017-January 2018 Quarterly Inductions March 2018 September 2019
R2.2 As a result of SWAN in the School, the GEO has worked with the Postdoctoral Society to deliver career planning sessions the Postdoctoral Symposium.
Continue to provide annual Career planning workshops for Postdoctoral Research Fellows. Collect feedback and action.
Deputy Head of School Chair, School Postdoctoral Society.
Impact will be measured by feedback from participants after annual workshops. This will be used to inform future workshop topics and format of these workshops.
Annual Postdoc Symposium held every November.
R2.3 WeCAN events are well attended by PDRAs and feedback on these events is very positive. It is a key activity supporting career planning for female PDRAs.
Promote WeCAN to PDRAs via line managers, GEO Facebook and Twitter accounts.
Academic lead. Continued attendance of PDRAs at WeCAN events (PDRAs typically comprise 30-60% of the audience depending on the topic). Impact will be assessed by feedback forms at events.
Ongoing Annual review at June GEC meetings.
R2.4 The established Promote Workshadowing to PDRAs via Academic lead. Continued participation by PDRAs in Ongoing

72
Workshadowing scheme allows PDRAs to gain insights into aspects of academic life that are not usually accessible at earlier career levels or via staff training.
line managers, GEO Facebook and Twitter account.
Workshadowing and positive feedback indicating satisfaction with the scheme. (currently no limit to number of PDRAs participating).
Annual review at June GEC meetings.
R2.5 The School encourages PDRAs’ transition to independent academic roles via securing a personal fellowship.
Deliver annual fellowship writing workshops for PDRAs. Workshop feedback indicates benefits for career development. Establish mentoring groups for fellowship applicants to give feedback on applications and mock interview panels.
Associate Directors for Postdoctoral Training.
At least 25% of female PDRAs attending annual workshops (expect similar % of males to attend). Success will be measured by the number of female attendees who submit fellowship applications.
From October 2016 and annually thereafter. Annual review at June GEC meeting.
Issue 3: Equal Opportunities and Workload Balance The Workload Allocation Model (WAM) will continue to be monitored by the GEO for gender disparities. In addition, a new action has been added specifically for Lecturers in Education Centres to provide individuals returning from maternity leave with a reduced administrative load for 3 months.
Issue identified Actions underway and planned Person/group responsible
Measures of Success Timescale
R3.1 Candidates who are unsuccessful when applying for promotion require support to improve chances of success with future applications.
Dean to meet with all applicants who were unsuccessful and discuss panel feedback.
Centre Directors to provide support, e.g. adjustment of WAM to provide opportunities for the candidate to improve profile in required areas.
Dean of School, Centre Directors.
A higher success rate for those who make further applications for promotions. Impact to be measured by Dean due to confidential nature of promotions applications.
June 2016 and annually thereafter
R3.2 Re-engagement with scholarly activity can be challenging for maternity returners in Education Centres.
Introduce a policy of 3 months relief from administrative duties for Lecturer/SL/Prof (Education) Maternity returners to facilitate scholarly activity.
Education Centre Directors.
Policy introduction and information disseminated. Measure satisfaction with the policy from maternity returners through survey and focus groups.
January 2017 Summer 2019
R3.3 Committee experience will Rotation of staff on committees to School Manager, Evidence of annual or biannual rotation GEC June meeting
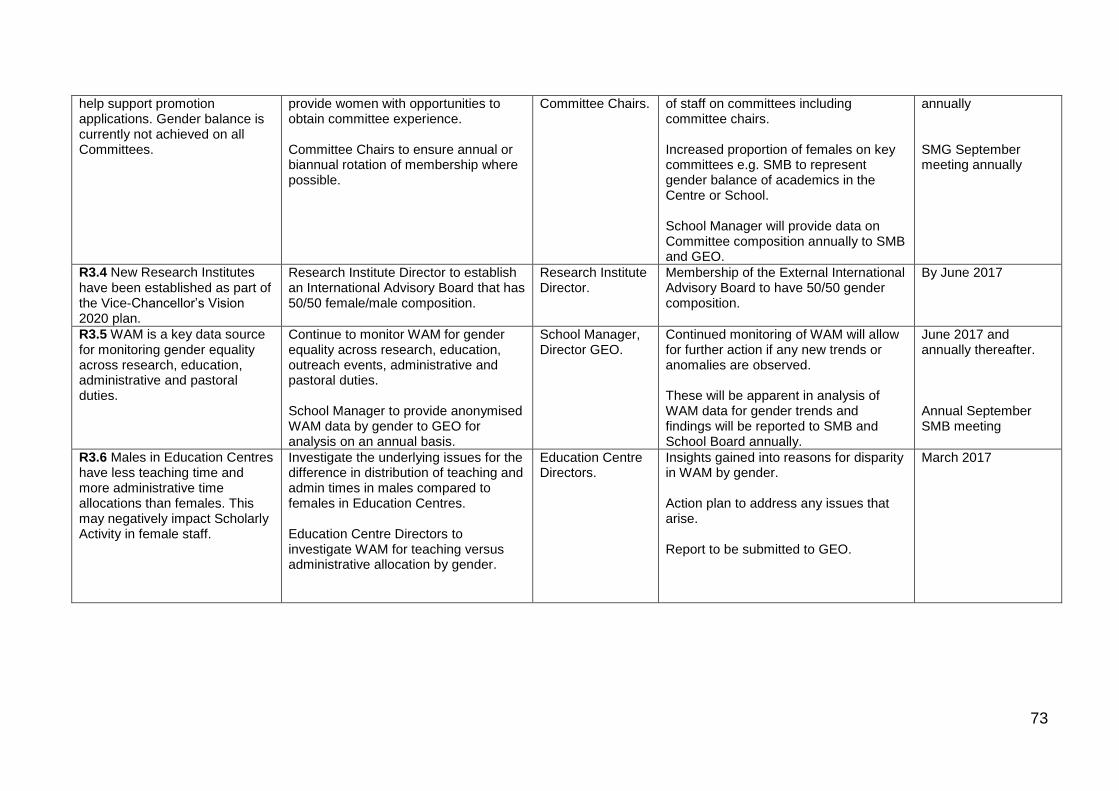
73
help support promotion applications. Gender balance is currently not achieved on all Committees.
provide women with opportunities to obtain committee experience. Committee Chairs to ensure annual or biannual rotation of membership where possible.
Committee Chairs. of staff on committees including committee chairs. Increased proportion of females on key committees e.g. SMB to represent gender balance of academics in the Centre or School. School Manager will provide data on Committee composition annually to SMB and GEO.
annually SMG September meeting annually
R3.4 New Research Institutes have been established as part of the Vice-Chancellor’s Vision 2020 plan.
Research Institute Director to establish an International Advisory Board that has 50/50 female/male composition.
Research Institute Director.
Membership of the External International Advisory Board to have 50/50 gender composition.
By June 2017
R3.5 WAM is a key data source for monitoring gender equality across research, education, administrative and pastoral duties.
Continue to monitor WAM for gender equality across research, education, outreach events, administrative and pastoral duties. School Manager to provide anonymised WAM data by gender to GEO for analysis on an annual basis.
School Manager, Director GEO.
Continued monitoring of WAM will allow for further action if any new trends or anomalies are observed. These will be apparent in analysis of WAM data for gender trends and findings will be reported to SMB and School Board annually.
June 2017 and annually thereafter. Annual September SMB meeting
R3.6 Males in Education Centres have less teaching time and more administrative time allocations than females. This may negatively impact Scholarly Activity in female staff.
Investigate the underlying issues for the difference in distribution of teaching and admin times in males compared to females in Education Centres. Education Centre Directors to investigate WAM for teaching versus administrative allocation by gender.
Education Centre Directors.
Insights gained into reasons for disparity in WAM by gender. Action plan to address any issues that arise. Report to be submitted to GEO.
March 2017
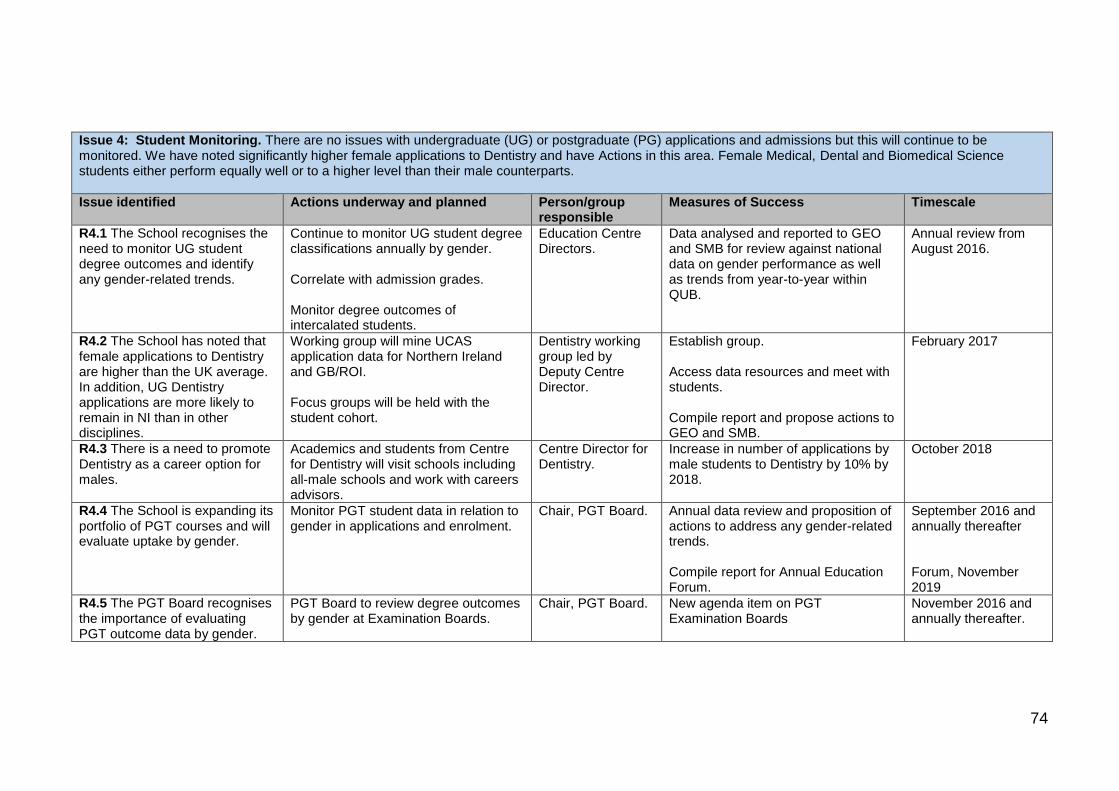
74
Issue 4: Student Monitoring. There are no issues with undergraduate (UG) or postgraduate (PG) applications and admissions but this will continue to be monitored. We have noted significantly higher female applications to Dentistry and have Actions in this area. Female Medical, Dental and Biomedical Science students either perform equally well or to a higher level than their male counterparts.
Issue identified Actions underway and planned Person/group responsible
Measures of Success Timescale
R4.1 The School recognises the need to monitor UG student degree outcomes and identify any gender-related trends.
Continue to monitor UG student degree classifications annually by gender. Correlate with admission grades. Monitor degree outcomes of intercalated students.
Education Centre Directors.
Data analysed and reported to GEO and SMB for review against national data on gender performance as well as trends from year-to-year within QUB.
Annual review from August 2016.
R4.2 The School has noted that female applications to Dentistry are higher than the UK average. In addition, UG Dentistry applications are more likely to remain in NI than in other disciplines.
Working group will mine UCAS application data for Northern Ireland and GB/ROI. Focus groups will be held with the student cohort.
Dentistry working group led by Deputy Centre Director.
Establish group. Access data resources and meet with students. Compile report and propose actions to GEO and SMB.
February 2017
R4.3 There is a need to promote Dentistry as a career option for males.
Academics and students from Centre for Dentistry will visit schools including all-male schools and work with careers advisors.
Centre Director for Dentistry.
Increase in number of applications by male students to Dentistry by 10% by 2018.
October 2018
R4.4 The School is expanding its portfolio of PGT courses and will evaluate uptake by gender.
Monitor PGT student data in relation to gender in applications and enrolment.
Chair, PGT Board. Annual data review and proposition of actions to address any gender-related trends. Compile report for Annual Education Forum.
September 2016 and annually thereafter Forum, November 2019
R4.5 The PGT Board recognises the importance of evaluating PGT outcome data by gender.
PGT Board to review degree outcomes by gender at Examination Boards.
Chair, PGT Board. New agenda item on PGT Examination Boards
November 2016 and annually thereafter.
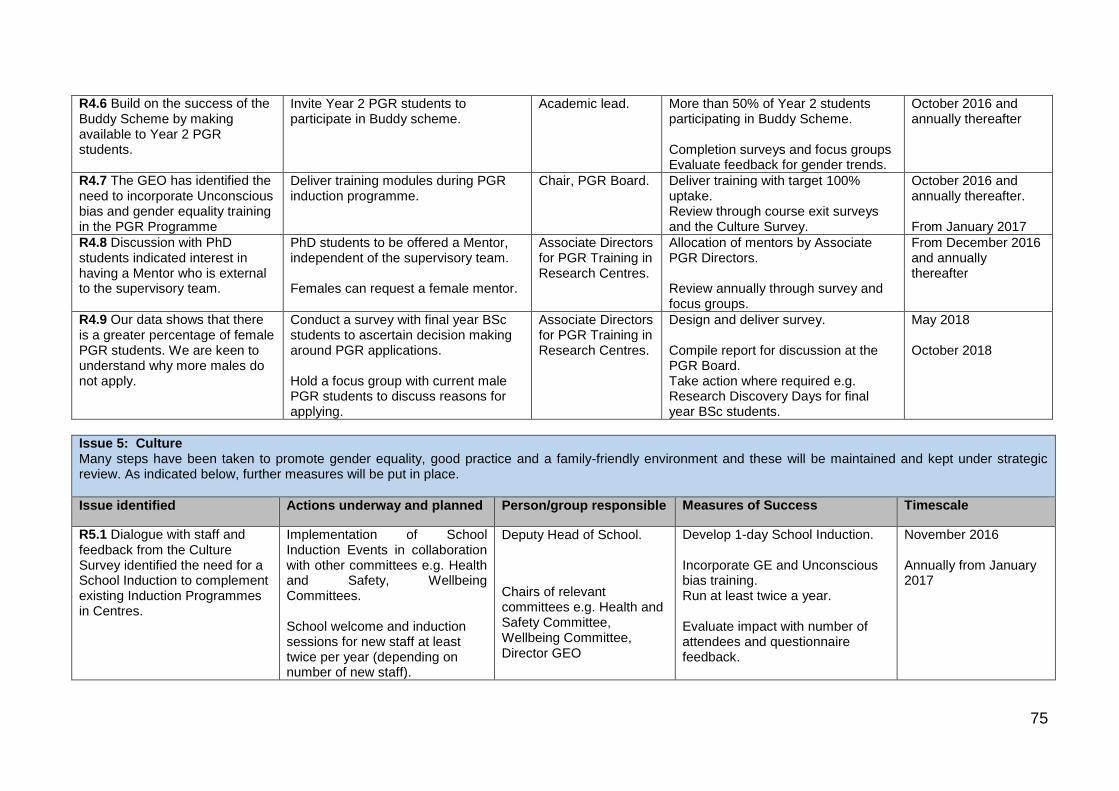
75
R4.6 Build on the success of the Buddy Scheme by making available to Year 2 PGR students.
Invite Year 2 PGR students to participate in Buddy scheme.
Academic lead. More than 50% of Year 2 students participating in Buddy Scheme. Completion surveys and focus groups Evaluate feedback for gender trends.
October 2016 and annually thereafter
R4.7 The GEO has identified the need to incorporate Unconscious bias and gender equality training in the PGR Programme
Deliver training modules during PGR induction programme.
Chair, PGR Board. Deliver training with target 100% uptake. Review through course exit surveys and the Culture Survey.
October 2016 and annually thereafter. From January 2017
R4.8 Discussion with PhD students indicated interest in having a Mentor who is external to the supervisory team.
PhD students to be offered a Mentor, independent of the supervisory team. Females can request a female mentor.
Associate Directors for PGR Training in Research Centres.
Allocation of mentors by Associate PGR Directors. Review annually through survey and focus groups.
From December 2016 and annually thereafter
R4.9 Our data shows that there is a greater percentage of female PGR students. We are keen to understand why more males do not apply.
Conduct a survey with final year BSc students to ascertain decision making around PGR applications. Hold a focus group with current male PGR students to discuss reasons for applying.
Associate Directors for PGR Training in Research Centres.
Design and deliver survey. Compile report for discussion at the PGR Board. Take action where required e.g. Research Discovery Days for final year BSc students.
May 2018 October 2018
Issue 5: Culture Many steps have been taken to promote gender equality, good practice and a family-friendly environment and these will be maintained and kept under strategic review. As indicated below, further measures will be put in place.
Issue identified Actions underway and planned Person/group responsible Measures of Success Timescale
R5.1 Dialogue with staff and feedback from the Culture Survey identified the need for a School Induction to complement existing Induction Programmes in Centres.
Implementation of School Induction Events in collaboration with other committees e.g. Health and Safety, Wellbeing Committees. School welcome and induction sessions for new staff at least twice per year (depending on number of new staff).
Deputy Head of School.
Chairs of relevant committees e.g. Health and Safety Committee, Wellbeing Committee, Director GEO
Develop 1-day School Induction. Incorporate GE and Unconscious bias training. Run at least twice a year. Evaluate impact with number of attendees and questionnaire feedback.
November 2016 Annually from January 2017

76
R5.2 Feedback from the Culture Survey and Gender Equality Focus Groups highlighted the benefits of improved weblinks around family-friendly policies.
Create linkages on the GEO website to QUB/School policies on flexible working, maternity/paternity/adoptive leave and parental/dependants leave.
GEO Clerical Staff and School IT support team.
Develop website with links to current policies. GEO to review website usage statistics.
February 2017 June 2018 and 2019
R5.3 The School has several prestigious lectures given by invited international speakers. Currently, all of these are named after men and we plan to create a further lecture named after a prominent female graduate or former staff member
Create and identify funding for prestigious lecture. Working group to explore and propose a list of female lecture names for the School to vote on. Prominent international female speakers to be invited.
Dean of School. Working group.
Lecture name and details to be finalised. Launch annual lecture.
March 2017 and annually thereafter
R5.4 The School is committed to sharing best practice with other Schools and Institutions and is planning new Beacon activities in addition to actions already underway (e.g. supporting UK and Ireland SWAN SATs).
Host an All-Ireland Athena SWAN Conference for Medicine, Dentistry and Biomedical Science Schools.
GEO Director and Committee. Dean of School
Arrange conference to be held in 2018 with prominent UK, Ireland, and EU speakers. Target representation from all Higher Education providers on the island of Ireland. Collate feedback and share outcome with the sector.
2017 planning December 2018, host conference in Belfast.