at the Harvard Graduate School of Education
55
COACHE Faculty Job Satisfaction Survey MEANS TABLES University of Arizona 2014 The Collaborative on Academic Careers in Higher Education at the Harvard Graduate School of Education University of Arizona COACHE Survey Results for T/TE and C/CE Faculty.
Transcript of at the Harvard Graduate School of Education

COACHE Faculty Job Satisfaction SurveyMEANS TABLES
University of Arizona2014
The Collaborative on Academic Careers in Higher Educationat the Harvard Graduate School of Education
University of Arizona COACHE Survey Results for T/TE and C/CE Faculty.

University of Arizona COACHE Survey Results for T/TE and C/CE Faculty.

The Collaborative on Academic Careers in Higher Education at the Harvard Graduate School of Education
CONTENTS
Means and Standard Deviation Tables
Overall means 1
Means by tenure status
Tenured 6
Pre-tenure 11
Means by tenured ranks
Full 16
Associate 21
Means by gender
Men 26
Women 31
Responses by race
White 36
Faculty of color 41
Historic data (when applicable) 46
University of Arizona COACHE Survey Results for T/TE and C/CE Faculty.

University of Arizona COACHE Survey Results for T/TE and C/CE Faculty.

The Collaborative on Academic Careers in Higher Education at the Harvard Graduate School of Education
University of Arizona COACHE Survey Results for T/TE and C/CE Faculty.

The Collaborative on Academic Careers in Higher Education (COACHE)Faculty Job Satisfaction Survey 2013-14
MEANS AND STANDARD DEVIATIONS
University of Arizona
item short name mean sd mean sd mean sd mean sd mean sd mean sd mean sdBenchmark: Nature of Work Research 3.12 0.68 3.12 0.23 3.38 0.67 3.29 0.72 3.23 0.69 3.29 0.71 3.43 0.75
Q45B Time spent on research 3.49 1.19 3.17 0.37 3.62 1.17 3.67 1.14 3.67 1.15 3.53 1.11 3.69 1.10Q80A Expectations for finding external funding 3.11 0.99 3.11 0.19 3.22 1.03 3.32 0.98 3.15 1.04 3.22 1.03 3.30 1.02Q80B Influence over focus of research 4.40 0.77 4.24 0.25 4.41 0.80 4.48 0.72 4.49 0.73 4.30 0.90 4.33 0.89Q80C Quality of grad students to support research 3.37 1.11 2.94 0.41 3.64 1.05 3.36 1.09 3.57 1.08 3.38 1.09 3.34 1.15Q80D Support for research 2.54 1.14 2.82 0.31 3.08 1.18 2.80 1.20 2.70 1.17 2.91 1.17 3.28 1.16Q80E Support for engaging undergrads in research 2.90 1.05 3.05 0.30 3.41 1.01 3.27 1.08 2.94 1.08 3.23 1.04 3.40 1.06Q85A Support for obtaining grants (pre-award) 2.88 1.11 3.03 0.29 3.20 1.08 3.11 1.12 3.01 1.14 3.54 1.16 3.34 1.13Q85B Support for maintaining grants (post-award) 3.12 1.13 3.05 0.30 3.27 1.09 3.17 1.11 3.11 1.12 3.22 1.08 3.29 1.13Q85C Support for securing grad student assistance 2.72 1.07 2.65 0.38 3.03 1.06 2.99 1.12 2.89 1.07 2.92 1.10 3.08 1.08Q85D Support for travel to present/conduct research 2.84 1.24 3.10 0.37 3.22 1.17 3.12 1.24 3.17 1.15 3.10 1.21 3.34 1.18Q85E Availability of course release for research 2.77 1.13 2.50 0.37 2.84 1.14 2.82 1.23 2.57 1.10 2.79 1.16 3.08 1.23
Benchmark: Nature of Work: Service 3.23 0.77 3.27 0.14 3.29 0.74 3.38 0.87 3.22 0.74 3.15 0.81 3.38 0.77Q45C Time spent on service 3.46 0.99 3.37 0.19 3.45 0.99 3.44 1.07 3.29 1.04 3.34 1.00 3.53 0.97Q55B Support for faculty in leadership roles 2.68 1.24 2.71 0.28 2.90 1.28 3.02 1.38 2.65 1.29 2.77 1.32 2.87 1.28Q60A Number of committees 3.39 0.92 3.43 0.16 3.44 0.90 3.60 0.96 3.35 0.88 3.31 0.95 3.53 0.87Q60B Attractiveness of committees 3.38 0.92 3.46 0.14 3.41 0.93 3.49 0.93 3.42 0.89 3.30 1.00 3.49 0.94Q60C Discretion to choose committees 3.44 1.04 3.56 0.19 3.45 0.96 3.49 1.04 3.57 0.95 3.25 1.06 3.59 1.02Q60D Equitability of committee assignments 2.98 1.17 3.05 0.17 3.04 1.06 3.12 1.22 3.00 1.15 2.87 1.14 3.14 1.13Q60E Number of student advisees 3.67 0.93 3.44 0.22 3.63 0.89 3.69 1.03 3.74 0.84 3.67 0.95 3.63 0.95
Benchmark: Nature of Work: Teaching 3.71 0.64 3.71 0.16 3.81 0.64 3.77 0.69 3.73 0.61 3.70 0.66 3.82 0.65Q45A Time spent on teaching 3.86 0.91 3.90 0.16 3.92 0.87 3.87 0.92 3.82 0.92 3.86 0.91 3.99 0.87Q70A Number of courses taught 3.92 0.89 3.66 0.30 3.93 0.87 3.90 1.01 3.77 1.00 3.86 1.00 3.97 0.91Q70B Level of courses taught 4.02 0.83 4.01 0.14 4.03 0.84 4.09 0.86 3.97 0.83 4.02 0.86 4.14 0.79Q70C Discretion over course content 4.34 0.80 4.40 0.11 4.32 0.81 4.38 0.86 4.37 0.82 4.33 0.84 4.44 0.74Q70D Number of students in classes taught 3.73 1.05 3.68 0.24 3.77 0.99 3.80 1.06 3.51 1.13 3.73 1.05 3.85 1.05Q70E Quality of students taught 3.23 1.04 3.32 0.35 3.71 0.95 3.35 1.00 3.48 1.02 3.35 1.02 3.50 1.06Q70H Equitability of distribution of teaching load 3.03 1.17 3.26 0.19 3.10 1.14 3.22 1.29 3.15 1.18 2.97 1.22 3.20 1.17Q70I Quality of grad students to support teaching 3.44 1.14 3.05 0.46 3.61 1.09 3.50 1.12 3.73 0.95 3.45 1.08 3.42 1.11Q45D Time spent on outreach 3.67 0.85 3.50 0.15 3.62 0.84 3.59 0.80 3.53 0.83 3.57 0.87 3.65 0.85Q45E Time spent on administrative tasks 2.88 1.03 2.91 0.19 2.82 1.02 3.09 1.05 2.65 1.05 2.89 1.04 3.11 1.03Q55A Ability to balance teaching/research/service 3.27 1.27 3.14 0.29 3.34 1.27 3.59 1.24 3.21 1.28 3.25 1.29 3.50 1.24
Benchmark: Facilities and work resources 3.42 0.68 3.41 0.24 3.63 0.63 3.52 0.71 3.34 0.72 3.46 0.69 3.54 0.70Q70F Support for improving teaching 3.02 1.01 3.24 0.28 3.49 1.00 3.28 1.03 3.07 1.05 3.34 1.05 3.23 1.04Q90A Office 3.85 0.97 3.74 0.24 3.94 0.95 3.77 1.07 3.64 1.08 3.69 1.05 3.87 0.99Q90B Laboratory, research, studio space 3.44 1.09 3.17 0.29 3.60 1.08 3.61 1.12 3.38 1.18 3.17 1.21 3.26 1.23Q90C Equipment 3.27 1.07 3.33 0.30 3.54 0.98 3.40 1.08 3.29 1.08 3.38 1.04 3.51 1.03
you peer 2 peer 3 peer 4peer 1Alloverall
peer 5
1
University of Arizona COACHE Survey Results for T/TE and C/CE Faculty.

The Collaborative on Academic Careers in Higher Education (COACHE)Faculty Job Satisfaction Survey 2013-14
MEANS AND STANDARD DEVIATIONS
University of Arizona
item short name mean sd mean sd mean sd mean sd mean sd mean sd mean sdyou peer 2 peer 3 peer 4peer 1All
overallpeer 5
Q90D Classrooms 3.35 1.02 3.31 0.31 3.57 0.96 3.35 1.13 3.15 1.08 3.40 1.09 3.34 1.05Q90E Library resources 3.90 0.94 3.68 0.36 4.16 0.78 3.79 1.01 3.89 0.90 3.79 0.94 3.81 0.92Q90F Computing and technical support 3.32 1.16 3.40 0.34 3.47 1.06 3.66 1.02 3.27 1.15 3.43 1.16 3.71 1.09Q90H Clerical/administrative support 3.13 1.23 3.30 0.31 3.25 1.16 3.24 1.24 2.98 1.23 3.40 1.14 3.46 1.20
Benchmark: Personal and family policies 3.26 0.89 3.01 0.26 3.07 0.92 3.10 0.94 3.20 0.83 3.13 0.86 3.23 0.87Q95D Housing benefits 2.27 0.96 2.29 0.37 2.67 1.03 2.48 0.94 3.39 1.15 2.67 0.99 2.69 1.01Q95E Tuition waivers, remission, or exchange 3.86 0.89 2.77 0.68 2.22 1.06 2.43 1.15 1.87 0.93 3.13 1.09 3.17 1.09Q95F Spousal/partner hiring program 3.01 1.20 2.57 0.29 2.80 1.19 3.00 1.33 3.14 1.27 2.86 1.23 2.82 1.17Q95G Childcare 2.54 1.05 2.64 0.45 2.65 1.07 3.00 1.14 2.68 0.91 2.79 1.01 2.54 1.05Q95H Eldercare 2.87 0.78 2.76 0.22 2.94 0.91 2.85 0.85 2.90 0.75 2.79 0.88 2.97 0.92Q95J Family medical/parental leave 3.52 0.95 3.36 0.28 3.51 0.98 3.22 1.16 3.69 0.85 3.39 0.97 3.59 0.91Q95K Flexible workload/modified duties 3.57 1.02 3.39 0.26 3.51 1.07 3.36 1.17 3.63 0.89 3.45 1.11 3.61 0.94Q95L Stop-the-clock policies 3.77 1.09 3.39 0.52 3.99 0.98 3.68 1.10 3.85 0.93 3.71 0.95 3.75 0.88Q200B Inst. does what it can for work/life compatibility 2.86 1.20 2.97 0.29 3.02 1.20 3.12 1.23 3.17 1.18 2.93 1.21 3.12 1.19Q200A Right balance between professional/personal 3.14 1.31 3.26 0.23 3.26 1.31 3.54 1.23 3.20 1.32 3.20 1.32 3.41 1.30
Benchmark: Health and retirement benefits 3.80 0.67 3.53 0.35 4.03 0.66 3.94 0.72 3.84 0.74 3.37 0.86 3.67 0.78Q95A Health benefits for yourself 4.02 0.77 3.66 0.42 4.13 0.75 4.13 0.79 3.99 0.85 3.33 1.03 3.80 0.86Q95B Health benefits for family 4.01 0.82 3.53 0.53 4.03 0.83 4.07 0.81 3.95 0.88 3.31 1.03 3.76 0.91Q95C Retirement benefits 3.57 0.86 3.50 0.30 4.07 0.86 3.80 0.85 3.87 0.93 3.46 1.03 3.61 0.99Q95I Phased retirement options 3.17 0.90 3.20 0.29 3.66 0.91 3.38 1.06 3.02 0.97 3.33 0.98 3.27 0.99Q90G Salary 2.86 1.25 2.88 0.40 3.17 1.21 3.57 1.11 3.19 1.21 3.10 1.20 3.02 1.25
Benchmark: Interdisciplinary work 2.82 0.94 2.63 0.23 2.80 0.97 2.83 1.05 2.83 0.95 2.86 1.04 2.93 1.00Q100A Budgets encourage interdiscip. work 2.53 1.16 2.49 0.31 2.54 1.19 2.85 1.26 2.66 1.16 2.78 1.22 2.99 1.16Q100B Facilities conducive to interdiscip. work 2.77 1.13 2.59 0.26 2.75 1.18 2.55 1.23 2.80 1.20 2.97 1.26 2.95 1.17Q100C Interdiscip. work is rewarded in merit 2.78 1.17 2.56 0.29 2.84 1.18 2.71 1.28 2.80 1.20 2.86 1.24 2.85 1.21Q100D Interdiscip. work is rewarded in promotion 2.86 1.18 2.58 0.26 2.89 1.17 2.75 1.25 2.77 1.18 2.94 1.22 2.84 1.18Q100E Interdiscip. work is rewarded in tenure 2.96 1.07 2.78 0.46 2.83 1.25 2.89 1.26 2.66 1.23 2.64 1.28 2.98 1.29Q100G Dept. knows how to evaluate interdiscip. work 3.03 1.26 2.79 0.25 2.93 1.25 3.10 1.36 3.08 1.26 2.76 1.28 2.91 1.29
Benchmark: Collaboration 3.70 0.81 3.52 0.19 3.67 0.86 3.71 0.88 3.83 0.83 3.65 0.83 3.69 0.87Q105A Opportunities for collab. within dept. 3.66 1.10 3.63 0.16 3.65 1.11 3.67 1.13 3.80 1.06 3.54 1.14 3.69 1.14Q105E Opportunities for collab. outside dept. 3.60 1.02 3.38 0.20 3.58 1.04 3.53 1.08 3.70 1.06 3.61 1.05 3.64 1.04Q105D Opportunities for collab. outside inst. 3.83 0.94 3.51 0.32 3.80 1.01 3.93 1.03 3.99 0.93 3.82 0.97 3.74 0.98
Benchmark: Mentoring 3.01 0.99 3.00 0.19 3.11 0.99 3.09 1.07 3.03 0.96 3.01 1.00 3.05 1.02Q125A Effectiveness of mentoring within dept. 3.59 1.26 3.57 0.16 3.55 1.30 3.34 1.26 3.62 1.21 3.38 1.29 3.55 1.28Q125B Effectiveness of mentoring outside dept. 3.61 1.04 3.41 0.17 3.68 1.06 3.47 1.06 3.51 1.07 3.36 1.05 3.55 1.09Q130A Mentoring of pre-tenure faculty 3.10 1.33 3.12 0.29 3.39 1.28 3.35 1.33 3.13 1.30 3.17 1.34 3.15 1.34Q130B Mentoring of associate faculty 2.44 1.22 2.45 0.23 2.51 1.19 2.54 1.31 2.57 1.18 2.66 1.26 2.41 1.19
2
University of Arizona COACHE Survey Results for T/TE and C/CE Faculty.

The Collaborative on Academic Careers in Higher Education (COACHE)Faculty Job Satisfaction Survey 2013-14
MEANS AND STANDARD DEVIATIONS
University of Arizona
item short name mean sd mean sd mean sd mean sd mean sd mean sd mean sdyou peer 2 peer 3 peer 4peer 1All
overallpeer 5
Q130C Support for faculty to be good mentors 2.32 1.07 2.31 0.24 2.46 1.07 2.46 1.17 2.38 1.08 2.41 1.12 2.42 1.09Q115 Being a mentor is fulfilling 4.20 0.84 4.12 0.14 4.13 0.88 4.09 0.89 4.28 0.78 3.96 0.99 4.11 0.90Q120A Importance of mentoring within dept. 4.21 0.96 4.19 0.12 4.19 0.96 4.06 1.07 4.15 0.98 4.16 1.03 4.22 0.97Q120B Importance of mentoring outside dept. 3.66 1.08 3.56 0.18 3.62 1.05 3.51 1.15 3.53 1.09 3.53 1.11 3.62 1.14Q120C Importance of mentoring outside inst. 3.83 1.04 3.64 0.24 3.79 1.03 3.86 1.07 3.77 1.02 3.57 1.11 3.73 1.04Q125C Effectiveness of mentoring outside the inst. 4.02 0.91 3.79 0.22 3.98 0.97 3.89 0.96 3.88 0.95 3.71 0.96 3.80 1.05
Benchmark: Tenure policies 3.30 0.99 3.45 0.33 3.71 0.98 3.61 1.03 3.58 0.94 3.28 1.04 3.42 1.04Q136A Clarity of tenure process 3.35 1.25 3.61 0.38 3.86 1.14 3.78 1.26 3.76 1.12 3.47 1.25 3.56 1.25Q136B Clarity of tenure criteria 3.33 1.23 3.59 0.36 3.84 1.11 3.73 1.24 3.75 1.20 3.38 1.23 3.54 1.23Q136C Clarity of tenure standards 2.99 1.28 3.29 0.35 3.64 1.19 3.53 1.20 3.35 1.25 3.03 1.26 3.26 1.31Q136D Clarity of body of evidence for deciding tenure 3.59 1.13 3.60 0.36 3.93 1.05 3.75 1.20 4.06 1.00 3.46 1.24 3.52 1.30Q136E Clarity of whether I will achieve tenure 3.41 1.11 3.47 0.33 3.63 1.21 3.52 1.21 3.33 1.32 3.21 1.20 3.42 1.23Q139A Consistency of messages about tenure 2.84 1.32 3.04 0.39 3.24 1.36 3.27 1.38 3.03 1.32 3.04 1.37 3.02 1.37Q139B Tenure decisions are performance-based 3.62 1.24 3.53 0.43 3.84 1.14 3.73 1.24 3.78 1.26 3.43 1.26 3.67 1.15
Benchmark: Tenure clarity 3.19 0.89 3.37 0.26 3.53 1.03 3.62 0.95 3.49 0.91 3.21 0.93 3.31 1.03Q137A Clarity of expectations: Scholar 3.77 1.17 3.63 0.41 4.13 1.09 4.13 1.12 3.93 1.11 3.76 1.17 3.80 1.19Q137B Clarity of expectations: Teacher 3.57 1.14 3.89 0.33 3.88 1.16 4.03 1.01 3.94 1.04 3.68 1.10 3.79 1.19Q137C Clarity of expectations: Advisor 3.11 1.12 3.33 0.34 3.52 1.23 3.56 1.21 3.29 1.20 3.18 1.22 3.23 1.28Q137D Clarity of expectations: Colleague 3.06 1.15 3.31 0.27 3.46 1.24 3.44 1.21 3.48 1.18 3.01 1.20 3.26 1.30Q137E Clarity of expectations: Campus citizen 2.81 1.15 3.13 0.33 3.12 1.25 3.23 1.23 3.21 1.20 2.82 1.19 2.95 1.28Q137F Clarity of expectations: Broader community 2.82 1.11 2.92 0.26 3.06 1.23 3.21 1.23 3.06 1.22 2.81 1.21 2.72 1.30
Benchmark: Tenure reasonableness 3.76 0.72 3.84 0.20 3.99 0.73 3.93 0.92 4.02 0.82 3.73 0.75 3.94 0.75Q138A Reasonable expectations: Scholar 3.79 0.97 3.79 0.38 4.08 1.02 3.91 1.16 3.95 1.03 3.71 1.10 3.90 1.10Q138B Reasonable expectations: Teacher 3.96 0.87 4.10 0.26 4.30 0.85 4.12 1.02 4.17 1.02 3.94 0.98 4.15 0.93Q138C Reasonable expectations: Advisor 3.76 0.88 3.85 0.29 4.10 0.89 4.03 1.01 4.16 1.00 3.69 0.90 4.04 0.97Q138D Reasonable expectations: Colleague 3.77 0.93 3.88 0.23 3.96 0.98 3.91 1.08 4.08 1.01 3.69 0.93 3.95 0.96Q138E Reasonable expectations: Campus citizen 3.69 0.87 3.74 0.22 3.77 0.84 3.82 0.99 4.00 0.98 3.60 0.90 3.84 0.92Q138F Reasonable expectations: Community member 3.66 0.86 3.62 0.23 3.74 0.93 3.82 1.01 3.88 0.98 3.59 0.90 3.73 0.93
Benchmark: Promotion 3.66 1.05 3.59 0.28 3.88 0.96 3.76 1.04 4.13 0.88 3.61 1.06 3.68 1.03Q135C Reasonable expectations: Promotion 3.85 1.15 3.68 0.29 4.02 1.11 3.86 1.22 4.17 1.06 3.65 1.33 3.87 1.12Q135B Dept. culture encourages promotion 3.58 1.34 3.42 0.40 3.76 1.32 3.66 1.36 4.44 0.91 3.89 1.24 3.65 1.29Q140A Clarity of promotion process 3.79 1.23 3.78 0.29 4.08 1.11 3.92 1.25 4.15 1.10 3.80 1.22 3.87 1.20Q140B Clarity of promotion criteria 3.74 1.26 3.72 0.28 4.07 1.10 3.91 1.20 4.11 1.11 3.63 1.26 3.76 1.24Q140C Clarity of promotion standards 3.54 1.27 3.52 0.30 3.84 1.17 3.69 1.27 3.76 1.21 3.31 1.32 3.57 1.26Q140D Clarity of body of evidence for promotion 3.77 1.24 3.73 0.27 4.09 1.10 3.98 1.14 4.18 1.07 3.67 1.23 3.83 1.18Q140E Clarity of time frame for promotion 3.48 1.32 3.46 0.38 3.45 1.26 3.41 1.31 4.20 1.03 3.36 1.29 3.35 1.35Q140F Clarity of whether I will be promoted 3.10 1.34 3.09 0.33 3.29 1.30 3.52 1.33 3.64 1.17 3.04 1.33 3.32 1.35
3
University of Arizona COACHE Survey Results for T/TE and C/CE Faculty.

The Collaborative on Academic Careers in Higher Education (COACHE)Faculty Job Satisfaction Survey 2013-14
MEANS AND STANDARD DEVIATIONS
University of Arizona
item short name mean sd mean sd mean sd mean sd mean sd mean sd mean sdyou peer 2 peer 3 peer 4peer 1All
overallpeer 5
Q170A Priorities are stated consistently 2.68 1.19 2.82 0.34 2.82 1.18 3.01 1.25 2.61 1.20 2.76 1.19 2.72 1.20Q170C Priorities are acted on consistently 2.44 1.11 2.65 0.32 2.66 1.16 2.86 1.23 2.49 1.15 2.61 1.17 2.61 1.18Q170D Changed priorities negatively affect my work** 2.44 1.21 2.77 0.36 2.82 1.30 3.01 1.36 2.47 1.32 2.58 1.25 2.93 1.28
Benchmark: Leadership: Senior 3.06 0.87 3.12 0.32 3.21 0.84 3.25 0.99 3.01 0.92 2.72 0.86 2.94 0.94Q180A Pres/Chancellor: Pace of decision making 3.10 0.92 3.19 0.36 3.33 0.91 3.28 1.03 3.05 1.07 2.68 0.98 3.04 0.98Q180B Pres/Chancellor: Stated priorities 2.98 1.09 3.16 0.38 3.28 1.05 3.30 1.07 2.96 1.19 2.59 1.02 3.05 1.05Q180C Pres/Chancellor: Communication of priorities 3.18 1.06 3.11 0.42 3.29 1.01 3.27 1.14 2.89 1.18 2.47 1.08 2.89 1.11Q180L CAO: Pace of decision making 3.07 0.97 3.11 0.31 3.14 0.94 3.24 1.05 3.11 1.03 2.97 0.98 2.96 1.08Q180M CAO: Stated priorities 3.00 1.06 3.09 0.31 3.10 1.00 3.22 1.12 3.05 1.11 2.88 1.04 2.90 1.14Q180N CAO: Communication of priorities 3.07 1.06 3.05 0.34 3.11 1.01 3.15 1.17 3.00 1.13 2.78 1.08 2.80 1.16Q180O CAO: Ensuring faculty input N/A N/A N/A N/A N/A N/A N/A N/A N/A N/A N/A N/A N/A N/AQ175C CAO: Support in adapting to change N/A N/A N/A N/A N/A N/A N/A N/A N/A N/A N/A N/A N/A N/A
Benchmark: Leadership: Divisional 2.92 1.07 3.22 0.29 3.06 1.07 3.25 1.20 3.01 1.18 3.23 1.09 3.29 1.13Q185D Dean: Pace of decision making 3.00 1.14 3.30 0.28 3.09 1.12 3.37 1.22 3.11 1.21 3.30 1.10 3.44 1.12Q185E Dean: Stated priorities 2.95 1.18 3.22 0.29 3.04 1.17 3.29 1.25 3.00 1.26 3.19 1.19 3.40 1.23Q185F Dean: Communication of priorities 2.92 1.19 3.22 0.30 3.07 1.18 3.27 1.30 2.95 1.29 3.25 1.24 3.24 1.28Q185G Dean: Ensuring faculty input 2.84 1.20 3.13 0.31 3.03 1.19 3.11 1.33 2.97 1.34 3.20 1.27 3.10 1.28Q175A Dean: Support in adapting to change 2.47 1.31 2.69 0.37 2.46 1.28 2.51 1.32 2.51 1.34 2.64 1.28 2.77 1.38
Benchmark: Leadership: Departmental 3.47 1.15 3.67 0.21 3.57 1.13 3.69 1.22 3.83 1.08 3.29 1.19 3.57 1.17Q185H Head/Chair: Pace of decision making 3.40 1.23 3.62 0.22 3.55 1.20 3.71 1.25 3.84 1.10 3.25 1.27 3.57 1.22Q185I Head/Chair: Stated priorities 3.37 1.27 3.58 0.20 3.47 1.26 3.61 1.32 3.71 1.19 3.22 1.33 3.46 1.31Q185J Head/Chair: Communication of priorities 3.41 1.31 3.59 0.21 3.53 1.29 3.63 1.36 3.78 1.22 3.21 1.37 3.45 1.32Q185K Head/Chair: Ensuring faculty input 3.51 1.34 3.72 0.23 3.60 1.30 3.62 1.40 3.88 1.26 3.20 1.40 3.59 1.31Q185L Head/Chair: Fairness in evaluating work 3.73 1.23 3.86 0.21 3.73 1.25 3.87 1.24 4.09 1.11 3.54 1.29 3.78 1.25Q175B Head/Chair: Support in adapting to change 3.10 1.46 3.26 0.33 2.99 1.37 3.15 1.47 3.32 1.32 3.00 1.37 2.94 1.45
Benchmark: Departmental collegiality 3.73 0.79 3.84 0.14 3.69 0.80 3.74 0.84 3.87 0.74 3.58 0.79 3.73 0.85Q200C Colleagues support work/life balance 3.43 1.15 3.70 0.18 3.55 1.13 3.59 1.11 3.62 1.07 3.47 1.09 3.68 1.08Q200D Meeting times compatible with personal needs 4.03 1.04 4.06 0.14 4.02 1.11 4.06 1.12 4.15 1.02 3.84 1.11 3.97 1.10Q205B Amount of personal interaction w/Pre-tenure 3.66 0.92 3.74 0.13 3.58 0.91 3.75 0.97 3.71 0.92 3.57 0.94 3.68 0.94Q205C How well you fit 3.58 1.20 3.78 0.20 3.48 1.24 3.69 1.20 3.68 1.17 3.42 1.25 3.62 1.25Q205E Amount of personal interaction w/Tenured 3.63 0.96 3.70 0.15 3.57 0.98 3.62 1.01 3.73 0.97 3.49 1.00 3.60 1.00Q210A Colleagues pitch in when needed 3.68 1.15 3.81 0.21 3.69 1.15 3.68 1.17 3.79 1.14 3.42 1.20 3.66 1.20Q210C Dept. is collegial 3.92 1.20 3.97 0.22 3.84 1.23 3.83 1.25 4.10 1.14 3.66 1.25 3.84 1.26Q212A Colleagues committed to diversity/inclusion 3.89 1.14 3.99 0.17 3.85 1.14 3.84 1.24 4.12 1.03 3.78 1.13 3.87 1.15
Benchmark: Departmental engagement 3.42 0.75 3.46 0.12 3.39 0.76 3.41 0.77 3.53 0.72 3.40 0.75 3.44 0.80Q190A Discussions of undergrad student learning 3.26 1.18 3.68 0.36 3.07 1.24 3.07 1.26 3.36 1.16 3.43 1.12 3.23 1.26Q190B Discussions of grad student learning 3.60 1.06 2.98 0.74 3.55 1.10 3.71 1.06 3.72 1.02 3.58 1.06 3.70 1.10
4
University of Arizona COACHE Survey Results for T/TE and C/CE Faculty.

The Collaborative on Academic Careers in Higher Education (COACHE)Faculty Job Satisfaction Survey 2013-14
MEANS AND STANDARD DEVIATIONS
University of Arizona
item short name mean sd mean sd mean sd mean sd mean sd mean sd mean sdyou peer 2 peer 3 peer 4peer 1All
overallpeer 5
Q190C Discussions of effective teaching practices 3.18 1.07 3.50 0.23 3.17 1.04 3.17 1.04 3.31 1.03 3.21 1.01 3.25 1.05Q190D Discussions of effective use of technology 3.13 1.02 3.30 0.21 3.12 1.02 3.04 1.04 3.12 1.03 3.10 1.01 3.16 1.06Q190E Discussions of current research methods 3.25 1.12 3.09 0.27 3.39 1.11 3.36 1.13 3.51 1.10 3.24 1.10 3.34 1.14Q205A Amount of professional interaction w/Pre-tenure 3.82 0.91 3.84 0.13 3.74 0.91 3.86 1.00 3.90 0.88 3.67 0.97 3.76 0.99Q205D Amount of professional interaction w/Tenured 3.73 0.98 3.77 0.17 3.69 1.00 3.68 1.05 3.83 0.98 3.60 1.03 3.66 1.05
Benchmark: Departmental quality 3.51 0.80 3.55 0.19 3.64 0.77 3.55 0.81 3.91 0.71 3.40 0.76 3.59 0.79Q195A Intellectual vitality of tenured faculty 3.60 1.13 3.55 0.23 3.72 1.07 3.58 1.11 4.05 0.94 3.38 1.14 3.64 1.09Q195B Intellectual vitality of pre-tenure faculty 4.00 0.95 3.98 0.20 4.09 0.94 4.08 0.90 4.24 0.86 3.94 0.91 4.00 0.91Q195C Scholarly productivity of tenured faculty 3.54 1.12 3.36 0.29 3.70 1.05 3.47 1.12 4.07 0.96 3.30 1.08 3.60 1.10Q195D Scholarly productivity of pre-tenure faculty 3.87 0.99 3.80 0.24 4.00 0.89 3.91 0.94 4.19 0.87 3.81 0.87 3.86 0.95Q195G Teaching effectiveness of tenured faculty 3.62 0.99 3.67 0.18 3.65 0.94 3.55 1.04 3.94 0.91 3.49 0.99 3.71 0.97Q195H Teaching effectiveness of pre-tenure faculty 3.88 0.84 3.90 0.15 3.90 0.81 3.82 0.90 4.10 0.79 3.72 0.84 3.83 0.83Q240B Dept. is successful at faculty recruitment 3.53 1.21 3.54 0.29 3.64 1.19 3.62 1.24 3.98 1.08 3.38 1.21 3.61 1.20Q240C Dept. is successful at faculty retention 2.98 1.27 3.41 0.28 3.44 1.21 3.23 1.20 3.76 1.12 3.11 1.19 3.40 1.20Q240D Dept. addresses sub-standard performance 2.52 1.14 2.62 0.20 2.62 1.18 2.61 1.24 2.75 1.16 2.40 1.17 2.64 1.20
Benchmark: Appreciation and recognition 3.18 0.79 3.28 0.19 3.26 0.80 3.26 0.92 3.32 0.81 3.11 0.84 3.28 0.82Q215A Recognition: For teaching 3.23 1.10 3.33 0.20 3.30 1.12 3.24 1.17 3.38 1.09 3.18 1.12 3.33 1.11Q215B Recognition: For advising 3.05 1.02 3.04 0.20 3.12 1.06 3.05 1.11 3.19 1.08 2.94 1.04 3.14 1.05Q215C Recognition: For scholarship 3.30 1.12 3.30 0.22 3.45 1.11 3.42 1.20 3.65 1.10 3.34 1.12 3.44 1.09Q215D Recognition: For service 3.13 1.10 3.12 0.20 3.18 1.08 3.15 1.20 3.20 1.14 3.02 1.11 3.16 1.11Q215E Recognition: For outreach 3.13 1.05 3.08 0.19 3.11 0.99 3.07 1.05 3.12 1.04 3.04 1.05 3.13 0.98Q215I Recognition: From colleagues 3.62 1.03 3.67 0.19 3.64 1.02 3.57 1.09 3.84 0.99 3.46 1.08 3.58 1.05Q215J Recognition: From CAO 2.63 1.08 2.92 0.30 2.85 1.04 2.95 1.21 2.88 1.13 2.79 1.10 2.79 1.16Q215K Recognition: From Dean 2.92 1.24 3.11 0.25 3.00 1.21 2.94 1.31 3.11 1.30 3.10 1.24 3.23 1.22Q215L Recognition: From Head/Chair 3.45 1.23 3.63 0.19 3.48 1.25 3.51 1.32 3.76 1.14 3.34 1.28 3.53 1.25Q220A School/college is valued by Pres/Provost 3.30 1.26 3.45 0.36 3.31 1.25 3.62 1.29 3.24 1.33 3.06 1.36 3.49 1.23Q220B Dept. is valued by Pres/Provost 2.95 1.21 3.20 0.36 3.15 1.20 3.22 1.40 3.02 1.32 2.80 1.31 3.24 1.27Q245A CAO cares about faculty of my rank 2.97 1.17 3.13 0.32 3.15 1.15 3.13 1.29 3.14 1.17 2.90 1.19 2.99 1.22Q240A Outside offers are necessary in negotiations 1.89 1.23 2.46 0.50 1.98 1.26 2.16 1.28 1.95 1.26 2.02 1.24 2.10 1.27Q212B Visible leadership for support of diversity 3.60 1.16 3.76 0.24 3.79 1.14 3.58 1.26 3.91 1.14 3.86 1.12 3.84 1.13Q245D I would again choose this institution 3.53 1.26 3.69 0.27 3.81 1.22 3.67 1.25 3.90 1.19 3.59 1.27 3.71 1.23Q250A Department as a place to work 3.68 1.14 3.82 0.19 3.74 1.17 3.75 1.19 3.91 1.10 3.57 1.15 3.80 1.15Q250B Institution as a place to work 3.41 1.06 3.58 0.28 3.79 1.00 3.65 1.08 3.74 1.05 3.57 1.06 3.64 1.07
5
University of Arizona COACHE Survey Results for T/TE and C/CE Faculty.

The Collaborative on Academic Careers in Higher Education (COACHE)Faculty Job Satisfaction Survey 2013-14
MEANS AND STANDARD DEVIATIONS
University of Arizona
item short nameBenchmark: Nature of Work Research
Q45B Time spent on researchQ80A Expectations for finding external fundingQ80B Influence over focus of researchQ80C Quality of grad students to support researchQ80D Support for researchQ80E Support for engaging undergrads in researchQ85A Support for obtaining grants (pre-award)Q85B Support for maintaining grants (post-award)Q85C Support for securing grad student assistanceQ85D Support for travel to present/conduct researchQ85E Availability of course release for research
Benchmark: Nature of Work: ServiceQ45C Time spent on serviceQ55B Support for faculty in leadership rolesQ60A Number of committeesQ60B Attractiveness of committeesQ60C Discretion to choose committeesQ60D Equitability of committee assignmentsQ60E Number of student advisees
Benchmark: Nature of Work: TeachingQ45A Time spent on teachingQ70A Number of courses taughtQ70B Level of courses taughtQ70C Discretion over course contentQ70D Number of students in classes taughtQ70E Quality of students taughtQ70H Equitability of distribution of teaching loadQ70I Quality of grad students to support teachingQ45D Time spent on outreachQ45E Time spent on administrative tasksQ55A Ability to balance teaching/research/service
Benchmark: Facilities and work resourcesQ70F Support for improving teachingQ90A OfficeQ90B Laboratory, research, studio spaceQ90C Equipment
by Tenure Status
mean sd mean sd mean sd mean sd mean sd mean sd mean sd3.12 0.68 3.10 0.22 3.37 0.67 3.24 0.71 3.23 0.70 3.28 0.72 3.44 0.743.53 1.17 3.19 0.36 3.63 1.18 3.67 1.18 3.70 1.16 3.56 1.10 3.72 1.083.12 0.98 3.11 0.19 3.24 1.01 3.30 0.97 3.14 1.06 3.23 1.04 3.33 1.004.43 0.73 4.26 0.26 4.42 0.78 4.50 0.70 4.51 0.72 4.32 0.89 4.35 0.873.43 1.10 2.90 0.60 3.67 1.06 3.38 1.07 3.58 1.08 3.43 1.07 3.39 1.142.51 1.14 2.75 0.29 3.02 1.17 2.66 1.16 2.65 1.16 2.83 1.16 3.23 1.172.90 1.05 3.02 0.30 3.43 1.00 3.21 1.09 2.93 1.07 3.17 1.04 3.39 1.052.85 1.11 2.99 0.29 3.20 1.05 3.11 1.11 3.01 1.13 3.47 1.18 3.37 1.103.11 1.13 3.03 0.31 3.26 1.09 3.13 1.12 3.13 1.11 3.20 1.09 3.30 1.132.70 1.08 2.64 0.40 3.02 1.07 2.95 1.14 2.87 1.08 2.91 1.10 3.11 1.052.76 1.24 3.03 0.38 3.16 1.18 3.04 1.26 3.15 1.16 3.07 1.21 3.32 1.192.71 1.14 2.47 0.33 2.82 1.14 2.75 1.24 2.54 1.10 2.79 1.18 3.06 1.223.23 0.77 3.25 0.15 3.28 0.74 3.33 0.89 3.22 0.75 3.13 0.81 3.37 0.793.47 1.00 3.37 0.22 3.45 1.00 3.40 1.09 3.29 1.05 3.32 1.02 3.55 0.972.64 1.25 2.66 0.28 2.88 1.29 2.97 1.42 2.66 1.30 2.75 1.34 2.88 1.283.38 0.91 3.40 0.16 3.42 0.90 3.51 0.99 3.35 0.89 3.27 0.94 3.49 0.893.40 0.92 3.45 0.15 3.40 0.94 3.51 0.94 3.42 0.91 3.29 1.02 3.48 0.973.45 1.06 3.60 0.21 3.48 0.97 3.54 1.06 3.59 0.94 3.29 1.05 3.64 1.032.96 1.18 3.01 0.19 3.00 1.07 3.03 1.23 2.98 1.17 2.83 1.14 3.10 1.153.69 0.90 3.46 0.22 3.63 0.90 3.71 1.01 3.73 0.84 3.68 0.96 3.64 0.943.73 0.63 3.72 0.17 3.82 0.63 3.78 0.67 3.73 0.62 3.73 0.65 3.85 0.643.89 0.90 3.94 0.18 3.95 0.86 3.92 0.93 3.85 0.90 3.92 0.89 4.07 0.853.90 0.90 3.66 0.31 3.95 0.87 3.87 0.98 3.75 1.01 3.88 1.00 3.97 0.944.05 0.80 4.02 0.15 4.03 0.85 4.11 0.82 3.97 0.86 4.08 0.83 4.15 0.784.37 0.77 4.42 0.11 4.35 0.81 4.43 0.81 4.37 0.84 4.40 0.77 4.46 0.733.74 1.04 3.68 0.25 3.78 1.00 3.85 0.98 3.54 1.12 3.76 1.05 3.86 1.063.26 1.04 3.32 0.37 3.73 0.95 3.34 0.97 3.47 1.02 3.38 1.02 3.56 1.062.99 1.18 3.23 0.22 3.06 1.15 3.18 1.30 3.14 1.16 2.91 1.22 3.13 1.183.49 1.14 3.01 0.60 3.66 1.08 3.53 1.09 3.73 0.95 3.48 1.08 3.49 1.093.69 0.85 3.54 0.16 3.65 0.84 3.59 0.78 3.55 0.81 3.56 0.87 3.66 0.842.88 1.04 2.87 0.21 2.83 1.03 3.02 1.05 2.63 1.03 2.86 1.05 3.08 1.033.29 1.28 3.14 0.29 3.36 1.28 3.58 1.23 3.25 1.28 3.30 1.30 3.53 1.243.41 0.69 3.41 0.23 3.63 0.62 3.49 0.71 3.32 0.74 3.44 0.69 3.56 0.713.01 1.01 3.21 0.27 3.46 1.00 3.25 1.03 3.06 1.05 3.29 1.06 3.25 1.033.86 0.97 3.75 0.22 3.94 0.94 3.71 1.09 3.60 1.09 3.69 1.05 3.89 0.993.43 1.09 3.19 0.30 3.60 1.09 3.61 1.12 3.38 1.19 3.17 1.24 3.30 1.233.23 1.07 3.31 0.29 3.51 0.98 3.34 1.12 3.25 1.10 3.33 1.07 3.52 1.02
Allyou peer 1 peer 2 peer 3 peer 4 peer 5tenured
6
University of Arizona COACHE Survey Results for T/TE and C/CE Faculty.

The Collaborative on Academic Careers in Higher Education (COACHE)Faculty Job Satisfaction Survey 2013-14
MEANS AND STANDARD DEVIATIONS
University of Arizona
item short nameQ90D ClassroomsQ90E Library resourcesQ90F Computing and technical supportQ90H Clerical/administrative support
Benchmark: Personal and family policiesQ95D Housing benefitsQ95E Tuition waivers, remission, or exchangeQ95F Spousal/partner hiring programQ95G ChildcareQ95H EldercareQ95J Family medical/parental leaveQ95K Flexible workload/modified dutiesQ95L Stop-the-clock policiesQ200B Inst. does what it can for work/life compatibilityQ200A Right balance between professional/personal
Benchmark: Health and retirement benefitsQ95A Health benefits for yourselfQ95B Health benefits for familyQ95C Retirement benefitsQ95I Phased retirement optionsQ90G Salary
Benchmark: Interdisciplinary workQ100A Budgets encourage interdiscip. workQ100B Facilities conducive to interdiscip. workQ100C Interdiscip. work is rewarded in meritQ100D Interdiscip. work is rewarded in promotionQ100E Interdiscip. work is rewarded in tenureQ100G Dept. knows how to evaluate interdiscip. work
Benchmark: CollaborationQ105A Opportunities for collab. within dept.Q105E Opportunities for collab. outside dept.Q105D Opportunities for collab. outside inst.
Benchmark: MentoringQ125A Effectiveness of mentoring within dept.Q125B Effectiveness of mentoring outside dept.Q130A Mentoring of pre-tenure facultyQ130B Mentoring of associate faculty
by Tenure Status
mean sd mean sd mean sd mean sd mean sd mean sd mean sdAllyou peer 1 peer 2 peer 3 peer 4 peer 5
tenured
3.31 1.03 3.29 0.29 3.58 0.97 3.31 1.17 3.15 1.07 3.35 1.11 3.34 1.083.93 0.91 3.72 0.36 4.19 0.76 3.81 1.00 3.88 0.90 3.77 0.94 3.82 0.933.32 1.17 3.42 0.33 3.49 1.06 3.66 1.04 3.26 1.16 3.45 1.14 3.75 1.083.09 1.23 3.26 0.31 3.24 1.16 3.21 1.26 2.93 1.22 3.35 1.15 3.42 1.213.25 0.90 3.00 0.24 3.05 0.93 3.06 0.93 3.19 0.84 3.11 0.86 3.23 0.862.30 0.97 2.29 0.39 2.69 1.00 2.45 0.94 3.36 1.13 2.58 0.96 2.68 0.953.85 0.87 2.73 0.69 2.14 1.04 2.38 1.15 1.83 0.91 3.08 1.12 3.17 1.112.95 1.16 2.62 0.30 2.83 1.18 3.09 1.29 3.14 1.27 2.85 1.20 2.83 1.162.57 1.03 2.68 0.47 2.66 1.07 3.00 1.13 2.73 0.88 2.76 0.98 2.59 1.062.84 0.78 2.71 0.23 2.91 0.93 2.80 0.91 2.88 0.77 2.72 0.86 2.94 0.923.57 0.90 3.37 0.27 3.53 0.97 3.30 1.14 3.68 0.86 3.42 0.94 3.58 0.923.60 1.00 3.37 0.25 3.50 1.07 3.40 1.12 3.64 0.90 3.48 1.10 3.59 0.95N/A N/A N/A N/A N/A N/A N/A N/A N/A N/A N/A N/A N/A N/A2.84 1.21 2.95 0.28 3.01 1.20 3.07 1.25 3.21 1.17 2.89 1.22 3.09 1.183.19 1.30 3.36 0.23 3.33 1.29 3.68 1.21 3.29 1.31 3.28 1.32 3.51 1.253.78 0.68 3.51 0.35 4.03 0.65 3.96 0.72 3.83 0.73 3.34 0.88 3.66 0.794.03 0.78 3.66 0.44 4.16 0.73 4.17 0.76 3.99 0.85 3.32 1.04 3.81 0.874.01 0.83 3.52 0.54 4.05 0.81 4.10 0.79 3.95 0.87 3.30 1.04 3.72 0.943.55 0.86 3.47 0.31 4.07 0.87 3.80 0.88 3.89 0.91 3.42 1.06 3.64 1.013.14 0.91 3.13 0.30 3.65 0.92 3.33 1.12 3.00 0.99 3.30 1.01 3.19 1.022.80 1.27 2.88 0.41 3.16 1.21 3.55 1.18 3.19 1.23 3.03 1.24 2.93 1.272.81 0.95 2.57 0.22 2.77 0.96 2.75 1.03 2.82 0.95 2.85 1.04 2.93 1.002.52 1.16 2.39 0.30 2.47 1.17 2.73 1.28 2.64 1.15 2.74 1.22 3.02 1.142.77 1.13 2.53 0.25 2.71 1.18 2.42 1.21 2.77 1.21 2.92 1.26 2.95 1.182.77 1.18 2.49 0.26 2.83 1.17 2.62 1.26 2.80 1.19 2.88 1.23 2.83 1.192.86 1.18 2.58 0.26 2.89 1.17 2.75 1.25 2.77 1.18 2.94 1.22 2.84 1.18N/A N/A N/A N/A N/A N/A N/A N/A N/A N/A N/A N/A N/A N/A3.04 1.27 2.77 0.27 2.92 1.25 3.13 1.34 3.09 1.26 2.78 1.28 2.95 1.303.72 0.78 3.51 0.19 3.68 0.86 3.74 0.88 3.84 0.85 3.67 0.83 3.73 0.873.70 1.07 3.65 0.16 3.66 1.09 3.68 1.14 3.80 1.07 3.63 1.11 3.74 1.123.60 0.99 3.39 0.20 3.59 1.05 3.58 1.11 3.69 1.06 3.59 1.06 3.67 1.053.84 0.93 3.49 0.33 3.82 1.01 3.96 1.02 4.00 0.94 3.80 0.97 3.76 0.992.94 0.93 2.92 0.18 3.03 0.94 3.01 1.01 2.98 0.93 2.96 0.94 2.99 0.943.59 1.25 3.57 0.18 3.53 1.28 3.31 1.22 3.61 1.21 3.39 1.25 3.52 1.283.57 1.04 3.44 0.17 3.67 1.07 3.47 1.08 3.50 1.07 3.36 1.05 3.55 1.093.16 1.28 3.18 0.28 3.40 1.26 3.44 1.28 3.14 1.28 3.24 1.29 3.22 1.302.44 1.22 2.45 0.23 2.51 1.19 2.54 1.31 2.57 1.18 2.66 1.26 2.41 1.19
7
University of Arizona COACHE Survey Results for T/TE and C/CE Faculty.

The Collaborative on Academic Careers in Higher Education (COACHE)Faculty Job Satisfaction Survey 2013-14
MEANS AND STANDARD DEVIATIONS
University of Arizona
item short nameQ130C Support for faculty to be good mentorsQ115 Being a mentor is fulfillingQ120A Importance of mentoring within dept.Q120B Importance of mentoring outside dept.Q120C Importance of mentoring outside inst.Q125C Effectiveness of mentoring outside the inst.
Benchmark: Tenure policiesQ136A Clarity of tenure processQ136B Clarity of tenure criteriaQ136C Clarity of tenure standardsQ136D Clarity of body of evidence for deciding tenureQ136E Clarity of whether I will achieve tenureQ139A Consistency of messages about tenureQ139B Tenure decisions are performance-based
Benchmark: Tenure clarityQ137A Clarity of expectations: ScholarQ137B Clarity of expectations: TeacherQ137C Clarity of expectations: AdvisorQ137D Clarity of expectations: ColleagueQ137E Clarity of expectations: Campus citizenQ137F Clarity of expectations: Broader community
Benchmark: Tenure reasonablenessQ138A Reasonable expectations: ScholarQ138B Reasonable expectations: TeacherQ138C Reasonable expectations: AdvisorQ138D Reasonable expectations: ColleagueQ138E Reasonable expectations: Campus citizenQ138F Reasonable expectations: Community member
Benchmark: PromotionQ135C Reasonable expectations: PromotionQ135B Dept. culture encourages promotionQ140A Clarity of promotion processQ140B Clarity of promotion criteriaQ140C Clarity of promotion standardsQ140D Clarity of body of evidence for promotionQ140E Clarity of time frame for promotionQ140F Clarity of whether I will be promoted
by Tenure Status
mean sd mean sd mean sd mean sd mean sd mean sd mean sdAllyou peer 1 peer 2 peer 3 peer 4 peer 5
tenured
2.32 1.07 2.31 0.24 2.46 1.07 2.46 1.17 2.38 1.08 2.41 1.12 2.42 1.094.20 0.84 4.12 0.14 4.13 0.88 4.09 0.89 4.28 0.78 3.96 0.99 4.11 0.904.15 1.00 4.11 0.14 4.12 0.98 3.91 1.12 4.08 1.01 4.07 1.08 4.16 0.993.58 1.08 3.47 0.19 3.58 1.06 3.41 1.15 3.49 1.12 3.44 1.12 3.51 1.133.77 1.06 3.55 0.27 3.76 1.04 3.73 1.07 3.73 1.04 3.50 1.11 3.64 1.064.02 0.91 3.75 0.25 3.96 1.00 3.88 0.93 3.87 0.97 3.70 0.96 3.73 1.05N/A N/A N/A N/A N/A N/A N/A N/A N/A N/A N/A N/A N/A N/AN/A N/A N/A N/A N/A N/A N/A N/A N/A N/A N/A N/A N/A N/AN/A N/A N/A N/A N/A N/A N/A N/A N/A N/A N/A N/A N/A N/AN/A N/A N/A N/A N/A N/A N/A N/A N/A N/A N/A N/A N/A N/AN/A N/A N/A N/A N/A N/A N/A N/A N/A N/A N/A N/A N/A N/AN/A N/A N/A N/A N/A N/A N/A N/A N/A N/A N/A N/A N/A N/AN/A N/A N/A N/A N/A N/A N/A N/A N/A N/A N/A N/A N/A N/AN/A N/A N/A N/A N/A N/A N/A N/A N/A N/A N/A N/A N/A N/AN/A N/A N/A N/A N/A N/A N/A N/A N/A N/A N/A N/A N/A N/AN/A N/A N/A N/A N/A N/A N/A N/A N/A N/A N/A N/A N/A N/AN/A N/A N/A N/A N/A N/A N/A N/A N/A N/A N/A N/A N/A N/AN/A N/A N/A N/A N/A N/A N/A N/A N/A N/A N/A N/A N/A N/AN/A N/A N/A N/A N/A N/A N/A N/A N/A N/A N/A N/A N/A N/AN/A N/A N/A N/A N/A N/A N/A N/A N/A N/A N/A N/A N/A N/AN/A N/A N/A N/A N/A N/A N/A N/A N/A N/A N/A N/A N/A N/AN/A N/A N/A N/A N/A N/A N/A N/A N/A N/A N/A N/A N/A N/AN/A N/A N/A N/A N/A N/A N/A N/A N/A N/A N/A N/A N/A N/AN/A N/A N/A N/A N/A N/A N/A N/A N/A N/A N/A N/A N/A N/AN/A N/A N/A N/A N/A N/A N/A N/A N/A N/A N/A N/A N/A N/AN/A N/A N/A N/A N/A N/A N/A N/A N/A N/A N/A N/A N/A N/AN/A N/A N/A N/A N/A N/A N/A N/A N/A N/A N/A N/A N/A N/AN/A N/A N/A N/A N/A N/A N/A N/A N/A N/A N/A N/A N/A N/A3.66 1.05 3.59 0.28 3.88 0.96 3.76 1.04 4.13 0.88 3.61 1.06 3.68 1.033.85 1.15 3.68 0.29 4.02 1.11 3.86 1.22 4.17 1.06 3.65 1.33 3.87 1.123.58 1.34 3.42 0.40 3.76 1.32 3.66 1.36 4.44 0.91 3.89 1.24 3.65 1.293.79 1.23 3.78 0.29 4.08 1.11 3.92 1.25 4.15 1.10 3.80 1.22 3.87 1.203.74 1.26 3.72 0.28 4.07 1.10 3.91 1.20 4.11 1.11 3.63 1.26 3.76 1.243.54 1.27 3.52 0.30 3.84 1.17 3.69 1.27 3.76 1.21 3.31 1.32 3.57 1.263.77 1.24 3.73 0.27 4.09 1.10 3.98 1.14 4.18 1.07 3.67 1.23 3.83 1.183.48 1.32 3.46 0.38 3.45 1.26 3.41 1.31 4.20 1.03 3.36 1.29 3.35 1.353.10 1.34 3.09 0.33 3.29 1.30 3.52 1.33 3.64 1.17 3.04 1.33 3.32 1.35
8
University of Arizona COACHE Survey Results for T/TE and C/CE Faculty.

The Collaborative on Academic Careers in Higher Education (COACHE)Faculty Job Satisfaction Survey 2013-14
MEANS AND STANDARD DEVIATIONS
University of Arizona
item short nameQ170A Priorities are stated consistentlyQ170C Priorities are acted on consistentlyQ170D Changed priorities negatively affect my work**
Benchmark: Leadership: SeniorQ180A Pres/Chancellor: Pace of decision makingQ180B Pres/Chancellor: Stated prioritiesQ180C Pres/Chancellor: Communication of prioritiesQ180L CAO: Pace of decision makingQ180M CAO: Stated prioritiesQ180N CAO: Communication of prioritiesQ180O CAO: Ensuring faculty inputQ175C CAO: Support in adapting to change
Benchmark: Leadership: DivisionalQ185D Dean: Pace of decision makingQ185E Dean: Stated prioritiesQ185F Dean: Communication of prioritiesQ185G Dean: Ensuring faculty inputQ175A Dean: Support in adapting to change
Benchmark: Leadership: DepartmentalQ185H Head/Chair: Pace of decision makingQ185I Head/Chair: Stated prioritiesQ185J Head/Chair: Communication of prioritiesQ185K Head/Chair: Ensuring faculty inputQ185L Head/Chair: Fairness in evaluating workQ175B Head/Chair: Support in adapting to change
Benchmark: Departmental collegialityQ200C Colleagues support work/life balanceQ200D Meeting times compatible with personal needsQ205B Amount of personal interaction w/Pre-tenureQ205C How well you fitQ205E Amount of personal interaction w/TenuredQ210A Colleagues pitch in when neededQ210C Dept. is collegialQ212A Colleagues committed to diversity/inclusion
Benchmark: Departmental engagementQ190A Discussions of undergrad student learningQ190B Discussions of grad student learning
by Tenure Status
mean sd mean sd mean sd mean sd mean sd mean sd mean sdAllyou peer 1 peer 2 peer 3 peer 4 peer 5
tenured
2.62 1.21 2.72 0.32 2.75 1.16 2.87 1.26 2.61 1.21 2.67 1.18 2.71 1.212.40 1.10 2.55 0.31 2.59 1.15 2.73 1.22 2.49 1.16 2.53 1.17 2.54 1.172.37 1.22 2.69 0.36 2.77 1.31 2.89 1.39 2.48 1.33 2.48 1.22 2.90 1.303.02 0.87 3.05 0.32 3.19 0.85 3.16 1.02 3.01 0.94 2.65 0.87 2.87 0.973.08 0.92 3.15 0.38 3.31 0.93 3.22 1.08 3.05 1.08 2.61 1.00 2.99 1.022.93 1.10 3.10 0.40 3.26 1.07 3.21 1.12 2.97 1.21 2.52 1.02 3.01 1.113.13 1.07 3.06 0.44 3.28 1.02 3.18 1.18 2.89 1.19 2.39 1.08 2.83 1.143.04 0.99 3.03 0.32 3.11 0.95 3.18 1.09 3.10 1.05 2.92 1.01 2.88 1.122.95 1.07 2.99 0.32 3.08 1.02 3.11 1.16 3.05 1.14 2.80 1.07 2.81 1.183.02 1.08 2.95 0.35 3.08 1.03 3.05 1.20 2.99 1.14 2.71 1.10 2.71 1.19N/A N/A N/A N/A N/A N/A N/A N/A N/A N/A N/A N/A N/A N/AN/A N/A N/A N/A N/A N/A N/A N/A N/A N/A N/A N/A N/A N/A2.90 1.08 3.12 0.28 3.03 1.07 3.12 1.24 2.99 1.19 3.16 1.13 3.30 1.152.98 1.16 3.21 0.28 3.06 1.13 3.25 1.25 3.08 1.22 3.25 1.13 3.44 1.132.93 1.20 3.12 0.28 3.02 1.19 3.12 1.29 2.98 1.28 3.10 1.22 3.41 1.242.90 1.20 3.12 0.30 3.05 1.19 3.16 1.34 2.94 1.30 3.18 1.27 3.25 1.282.82 1.21 3.04 0.30 2.98 1.20 2.97 1.39 2.96 1.36 3.13 1.31 3.10 1.302.46 1.31 2.61 0.37 2.44 1.27 2.45 1.29 2.49 1.35 2.60 1.30 2.79 1.403.43 1.16 3.60 0.22 3.52 1.15 3.60 1.27 3.80 1.10 3.23 1.21 3.57 1.173.38 1.23 3.56 0.23 3.50 1.22 3.63 1.29 3.80 1.13 3.20 1.27 3.58 1.233.31 1.28 3.49 0.23 3.41 1.28 3.48 1.38 3.66 1.22 3.15 1.33 3.48 1.303.36 1.32 3.51 0.24 3.47 1.30 3.55 1.40 3.75 1.24 3.13 1.38 3.41 1.333.46 1.34 3.64 0.25 3.57 1.32 3.55 1.45 3.86 1.28 3.13 1.41 3.58 1.313.70 1.25 3.79 0.22 3.68 1.27 3.75 1.31 4.08 1.11 3.48 1.33 3.76 1.273.09 1.46 3.20 0.33 2.95 1.35 3.07 1.44 3.24 1.33 2.96 1.39 2.94 1.443.73 0.80 3.84 0.15 3.68 0.80 3.72 0.84 3.87 0.74 3.59 0.79 3.72 0.883.43 1.15 3.70 0.19 3.55 1.11 3.59 1.09 3.63 1.06 3.44 1.09 3.65 1.094.02 1.05 4.06 0.15 4.03 1.09 4.00 1.19 4.13 1.01 3.80 1.14 3.94 1.123.65 0.90 3.72 0.14 3.57 0.88 3.70 0.98 3.69 0.93 3.55 0.93 3.66 0.943.59 1.21 3.78 0.23 3.43 1.26 3.64 1.26 3.67 1.18 3.46 1.24 3.58 1.303.64 0.97 3.74 0.16 3.56 0.98 3.64 0.97 3.75 0.96 3.53 0.98 3.60 1.023.69 1.15 3.82 0.21 3.66 1.15 3.61 1.23 3.82 1.13 3.43 1.18 3.64 1.233.90 1.21 3.96 0.23 3.82 1.24 3.79 1.27 4.10 1.15 3.66 1.24 3.82 1.293.91 1.14 4.01 0.17 3.85 1.14 3.83 1.25 4.13 1.04 3.80 1.14 3.88 1.183.43 0.73 3.47 0.12 3.39 0.77 3.43 0.80 3.53 0.73 3.44 0.70 3.48 0.803.27 1.17 3.69 0.35 3.10 1.23 3.14 1.27 3.36 1.15 3.48 1.06 3.25 1.283.62 1.05 2.99 0.77 3.57 1.10 3.67 1.08 3.74 1.02 3.62 1.03 3.71 1.11
9
University of Arizona COACHE Survey Results for T/TE and C/CE Faculty.

The Collaborative on Academic Careers in Higher Education (COACHE)Faculty Job Satisfaction Survey 2013-14
MEANS AND STANDARD DEVIATIONS
University of Arizona
item short nameQ190C Discussions of effective teaching practicesQ190D Discussions of effective use of technologyQ190E Discussions of current research methodsQ205A Amount of professional interaction w/Pre-tenureQ205D Amount of professional interaction w/Tenured
Benchmark: Departmental qualityQ195A Intellectual vitality of tenured facultyQ195B Intellectual vitality of pre-tenure facultyQ195C Scholarly productivity of tenured facultyQ195D Scholarly productivity of pre-tenure facultyQ195G Teaching effectiveness of tenured facultyQ195H Teaching effectiveness of pre-tenure facultyQ240B Dept. is successful at faculty recruitmentQ240C Dept. is successful at faculty retentionQ240D Dept. addresses sub-standard performance
Benchmark: Appreciation and recognitionQ215A Recognition: For teachingQ215B Recognition: For advisingQ215C Recognition: For scholarshipQ215D Recognition: For serviceQ215E Recognition: For outreachQ215I Recognition: From colleaguesQ215J Recognition: From CAOQ215K Recognition: From DeanQ215L Recognition: From Head/ChairQ220A School/college is valued by Pres/ProvostQ220B Dept. is valued by Pres/ProvostQ245A CAO cares about faculty of my rankQ240A Outside offers are necessary in negotiationsQ212B Visible leadership for support of diversityQ245D I would again choose this institutionQ250A Department as a place to workQ250B Institution as a place to work
by Tenure Status
mean sd mean sd mean sd mean sd mean sd mean sd mean sdAllyou peer 1 peer 2 peer 3 peer 4 peer 5
tenured
3.17 1.07 3.48 0.21 3.18 1.04 3.13 1.05 3.31 1.02 3.23 0.98 3.32 1.053.16 1.02 3.31 0.21 3.12 1.03 3.07 1.04 3.13 1.02 3.15 0.98 3.20 1.043.25 1.10 3.08 0.27 3.37 1.13 3.35 1.13 3.49 1.11 3.26 1.09 3.39 1.133.84 0.88 3.84 0.13 3.74 0.88 3.87 0.99 3.89 0.88 3.69 0.94 3.80 0.963.76 0.97 3.81 0.18 3.69 0.99 3.73 1.01 3.84 0.97 3.67 0.98 3.68 1.053.51 0.79 3.55 0.18 3.63 0.76 3.54 0.80 3.89 0.72 3.40 0.76 3.61 0.773.63 1.13 3.60 0.23 3.71 1.07 3.61 1.11 4.06 0.93 3.45 1.11 3.69 1.083.99 0.98 3.95 0.21 4.07 0.95 4.10 0.92 4.22 0.88 3.93 0.91 4.01 0.923.57 1.10 3.41 0.28 3.71 1.05 3.50 1.12 4.07 0.96 3.35 1.05 3.68 1.043.86 1.00 3.78 0.25 4.00 0.89 3.90 0.96 4.16 0.89 3.80 0.88 3.88 0.933.66 0.97 3.72 0.17 3.66 0.92 3.57 1.02 3.95 0.90 3.50 0.99 3.73 0.963.86 0.87 3.88 0.16 3.88 0.79 3.77 0.92 4.09 0.80 3.70 0.87 3.83 0.833.53 1.21 3.54 0.29 3.64 1.19 3.62 1.24 3.98 1.08 3.38 1.21 3.61 1.202.98 1.27 3.41 0.28 3.44 1.21 3.23 1.20 3.76 1.12 3.11 1.19 3.40 1.202.55 1.14 2.66 0.21 2.63 1.18 2.58 1.20 2.75 1.17 2.41 1.17 2.69 1.203.15 0.78 3.23 0.20 3.23 0.79 3.25 0.92 3.29 0.81 3.08 0.84 3.26 0.813.20 1.10 3.29 0.21 3.28 1.13 3.29 1.19 3.37 1.10 3.18 1.13 3.32 1.133.04 1.04 3.00 0.21 3.11 1.06 3.07 1.11 3.17 1.09 2.94 1.05 3.13 1.053.29 1.13 3.27 0.24 3.43 1.11 3.40 1.25 3.66 1.11 3.32 1.14 3.42 1.103.11 1.11 3.08 0.21 3.18 1.10 3.14 1.23 3.17 1.17 3.00 1.14 3.15 1.143.11 1.08 3.05 0.19 3.12 1.00 3.08 1.10 3.12 1.03 3.03 1.08 3.15 0.983.63 1.04 3.68 0.21 3.64 1.04 3.59 1.09 3.84 1.00 3.50 1.08 3.56 1.082.63 1.08 2.92 0.30 2.85 1.04 2.95 1.21 2.88 1.13 2.79 1.10 2.79 1.162.92 1.24 3.11 0.25 3.00 1.21 2.94 1.31 3.11 1.30 3.10 1.24 3.23 1.223.46 1.25 3.59 0.21 3.43 1.27 3.39 1.34 3.76 1.15 3.30 1.30 3.53 1.283.30 1.26 3.45 0.36 3.31 1.25 3.62 1.29 3.24 1.33 3.06 1.36 3.49 1.232.95 1.21 3.20 0.36 3.15 1.20 3.22 1.40 3.02 1.32 2.80 1.31 3.24 1.272.94 1.18 3.08 0.33 3.10 1.15 3.06 1.27 3.10 1.16 2.87 1.21 2.90 1.221.89 1.23 2.46 0.50 1.98 1.26 2.16 1.28 1.95 1.26 2.02 1.24 2.10 1.273.63 1.17 3.77 0.25 3.77 1.17 3.52 1.29 3.91 1.15 3.88 1.12 3.83 1.153.49 1.28 3.65 0.27 3.81 1.21 3.59 1.28 3.89 1.20 3.57 1.30 3.67 1.243.67 1.15 3.80 0.20 3.73 1.17 3.69 1.24 3.90 1.11 3.59 1.15 3.80 1.143.37 1.08 3.54 0.28 3.75 1.03 3.55 1.13 3.76 1.05 3.53 1.09 3.58 1.08
10
University of Arizona COACHE Survey Results for T/TE and C/CE Faculty.

The Collaborative on Academic Careers in Higher Education (COACHE)Faculty Job Satisfaction Survey 2013-14
MEANS AND STANDARD DEVIATIONS
University of Arizona
item short nameBenchmark: Nature of Work Research
Q45B Time spent on researchQ80A Expectations for finding external fundingQ80B Influence over focus of researchQ80C Quality of grad students to support researchQ80D Support for researchQ80E Support for engaging undergrads in researchQ85A Support for obtaining grants (pre-award)Q85B Support for maintaining grants (post-award)Q85C Support for securing grad student assistanceQ85D Support for travel to present/conduct researchQ85E Availability of course release for research
Benchmark: Nature of Work: ServiceQ45C Time spent on serviceQ55B Support for faculty in leadership rolesQ60A Number of committeesQ60B Attractiveness of committeesQ60C Discretion to choose committeesQ60D Equitability of committee assignmentsQ60E Number of student advisees
Benchmark: Nature of Work: TeachingQ45A Time spent on teachingQ70A Number of courses taughtQ70B Level of courses taughtQ70C Discretion over course contentQ70D Number of students in classes taughtQ70E Quality of students taughtQ70H Equitability of distribution of teaching loadQ70I Quality of grad students to support teachingQ45D Time spent on outreachQ45E Time spent on administrative tasksQ55A Ability to balance teaching/research/service
Benchmark: Facilities and work resourcesQ70F Support for improving teachingQ90A OfficeQ90B Laboratory, research, studio spaceQ90C Equipment
by Tenure Status
mean sd mean sd mean sd mean sd mean sd mean sd mean sd3.14 0.67 3.17 0.29 3.39 0.68 3.40 0.73 3.26 0.63 3.34 0.68 3.38 0.793.33 1.28 3.12 0.45 3.56 1.14 3.67 1.06 3.50 1.11 3.43 1.13 3.61 1.143.06 1.02 3.14 0.27 3.09 1.12 3.36 0.99 3.21 0.93 3.15 0.98 3.18 1.094.29 0.92 4.21 0.28 4.33 0.88 4.43 0.76 4.38 0.75 4.21 0.91 4.28 0.943.08 1.12 2.84 0.66 3.49 1.00 3.31 1.13 3.50 1.06 3.17 1.13 3.18 1.182.66 1.15 3.01 0.40 3.38 1.18 3.08 1.23 3.01 1.18 3.20 1.15 3.41 1.142.92 1.06 3.11 0.38 3.32 1.02 3.41 1.03 2.97 1.13 3.49 1.00 3.41 1.103.04 1.10 3.12 0.36 3.21 1.21 3.12 1.15 3.04 1.24 3.78 1.05 3.24 1.233.17 1.11 3.08 0.33 3.32 1.10 3.29 1.09 2.99 1.21 3.35 1.02 3.27 1.132.79 1.03 2.69 0.59 3.07 1.00 3.06 1.07 2.98 1.01 2.94 1.08 2.99 1.153.15 1.19 3.29 0.42 3.53 1.11 3.29 1.20 3.31 1.13 3.21 1.20 3.41 1.173.05 1.05 2.55 0.49 3.02 1.16 2.98 1.20 2.80 1.07 2.78 1.12 3.14 1.253.26 0.75 3.33 0.21 3.35 0.76 3.49 0.82 3.26 0.68 3.24 0.80 3.43 0.713.39 0.96 3.36 0.28 3.46 0.94 3.53 1.00 3.29 0.98 3.39 0.95 3.49 0.972.85 1.18 2.87 0.39 2.99 1.24 3.17 1.26 2.53 1.23 2.85 1.24 2.87 1.263.43 0.96 3.51 0.27 3.56 0.90 3.81 0.87 3.38 0.87 3.49 0.98 3.68 0.773.29 0.89 3.50 0.19 3.42 0.91 3.46 0.91 3.41 0.77 3.35 0.92 3.53 0.813.40 0.97 3.50 0.26 3.33 0.95 3.39 1.00 3.41 1.00 3.07 1.07 3.46 0.983.10 1.11 3.14 0.28 3.20 1.04 3.33 1.20 3.17 1.06 3.02 1.12 3.27 1.053.60 1.03 3.39 0.29 3.63 0.85 3.66 1.08 3.81 0.81 3.67 0.91 3.62 0.953.62 0.68 3.69 0.20 3.72 0.66 3.75 0.74 3.70 0.56 3.58 0.65 3.72 0.653.72 0.92 3.80 0.23 3.74 0.89 3.76 0.89 3.59 1.04 3.67 0.96 3.74 0.904.03 0.83 3.68 0.35 3.83 0.90 3.95 1.06 3.87 0.93 3.79 1.01 3.99 0.833.88 0.96 3.99 0.18 3.99 0.78 4.05 0.92 3.99 0.60 3.80 0.92 4.10 0.824.21 0.93 4.34 0.18 4.20 0.82 4.26 0.94 4.39 0.66 4.06 1.01 4.35 0.773.67 1.07 3.67 0.29 3.73 0.93 3.70 1.21 3.31 1.19 3.60 1.05 3.82 1.033.12 1.01 3.31 0.36 3.57 0.96 3.37 1.06 3.57 0.97 3.25 1.03 3.30 1.033.20 1.11 3.34 0.28 3.31 1.06 3.32 1.26 3.18 1.27 3.17 1.18 3.41 1.133.21 1.15 3.01 0.71 3.36 1.10 3.43 1.18 3.71 0.96 3.33 1.07 3.21 1.153.56 0.85 3.43 0.24 3.49 0.83 3.59 0.84 3.45 0.95 3.58 0.86 3.64 0.862.89 1.03 3.01 0.25 2.80 0.96 3.23 1.05 2.79 1.16 3.01 0.97 3.23 1.033.18 1.24 3.11 0.41 3.27 1.22 3.60 1.24 2.98 1.28 3.09 1.23 3.43 1.233.47 0.64 3.43 0.28 3.63 0.65 3.58 0.71 3.46 0.59 3.55 0.66 3.50 0.653.07 1.02 3.33 0.35 3.66 0.98 3.34 1.04 3.13 0.99 3.53 0.96 3.15 1.063.80 0.98 3.75 0.30 3.95 0.98 3.91 1.01 3.87 0.94 3.71 1.04 3.80 0.983.47 1.06 3.16 0.34 3.61 1.05 3.61 1.12 3.40 1.14 3.17 1.09 3.16 1.263.45 1.03 3.39 0.37 3.65 0.95 3.53 1.01 3.55 0.91 3.56 0.92 3.47 1.04
peer 1 peer 2you peer 5peer 3 peer 4pre-tenure
All
11
University of Arizona COACHE Survey Results for T/TE and C/CE Faculty.

The Collaborative on Academic Careers in Higher Education (COACHE)Faculty Job Satisfaction Survey 2013-14
MEANS AND STANDARD DEVIATIONS
University of Arizona
item short nameQ90D ClassroomsQ90E Library resourcesQ90F Computing and technical supportQ90H Clerical/administrative support
Benchmark: Personal and family policiesQ95D Housing benefitsQ95E Tuition waivers, remission, or exchangeQ95F Spousal/partner hiring programQ95G ChildcareQ95H EldercareQ95J Family medical/parental leaveQ95K Flexible workload/modified dutiesQ95L Stop-the-clock policiesQ200B Inst. does what it can for work/life compatibilityQ200A Right balance between professional/personal
Benchmark: Health and retirement benefitsQ95A Health benefits for yourselfQ95B Health benefits for familyQ95C Retirement benefitsQ95I Phased retirement optionsQ90G Salary
Benchmark: Interdisciplinary workQ100A Budgets encourage interdiscip. workQ100B Facilities conducive to interdiscip. workQ100C Interdiscip. work is rewarded in meritQ100D Interdiscip. work is rewarded in promotionQ100E Interdiscip. work is rewarded in tenureQ100G Dept. knows how to evaluate interdiscip. work
Benchmark: CollaborationQ105A Opportunities for collab. within dept.Q105E Opportunities for collab. outside dept.Q105D Opportunities for collab. outside inst.
Benchmark: MentoringQ125A Effectiveness of mentoring within dept.Q125B Effectiveness of mentoring outside dept.Q130A Mentoring of pre-tenure facultyQ130B Mentoring of associate faculty
by Tenure Status
mean sd mean sd mean sd mean sd mean sd mean sd mean sdpeer 1 peer 2you peer 5peer 3 peer 4
pre-tenureAll
3.50 0.96 3.35 0.37 3.54 0.93 3.43 1.05 3.18 1.12 3.58 0.99 3.36 0.983.76 1.01 3.61 0.41 4.00 0.85 3.74 1.02 3.91 0.90 3.85 0.93 3.80 0.913.34 1.07 3.38 0.41 3.37 1.07 3.66 0.99 3.29 1.06 3.34 1.22 3.60 1.093.29 1.23 3.42 0.37 3.32 1.15 3.31 1.22 3.28 1.23 3.57 1.11 3.58 1.173.31 0.87 3.05 0.33 3.17 0.89 3.20 0.97 3.30 0.77 3.22 0.88 3.22 0.912.15 0.93 2.34 0.51 2.60 1.17 2.51 0.95 3.53 1.23 3.00 1.03 2.71 1.183.91 0.94 2.90 0.62 2.66 1.09 2.55 1.16 2.30 1.06 3.44 0.86 3.18 1.003.21 1.35 2.44 0.56 2.65 1.26 2.79 1.40 3.16 1.24 2.90 1.34 2.78 1.182.44 1.11 2.57 0.56 2.62 1.11 3.00 1.16 2.31 1.00 2.89 1.08 2.35 1.013.05 0.83 2.92 0.32 3.33 0.49 3.00 0.65 3.08 0.49 3.22 0.85 3.12 0.933.26 1.13 3.33 0.44 3.40 1.04 3.03 1.18 3.76 0.76 3.26 1.08 3.63 0.833.47 1.11 3.44 0.33 3.55 1.12 3.26 1.29 3.54 0.83 3.35 1.16 3.70 0.883.77 1.09 3.39 0.52 3.99 0.98 3.68 1.10 3.85 0.93 3.71 0.95 3.75 0.882.98 1.17 3.01 0.43 3.04 1.22 3.25 1.18 2.91 1.23 3.09 1.15 3.20 1.242.93 1.30 3.01 0.34 2.87 1.32 3.24 1.23 2.56 1.24 2.88 1.31 3.10 1.413.85 0.64 3.62 0.37 3.99 0.71 3.92 0.72 3.88 0.81 3.47 0.80 3.68 0.744.01 0.71 3.71 0.42 4.02 0.80 4.03 0.84 4.00 0.82 3.38 0.95 3.80 0.853.99 0.77 3.55 0.56 3.93 0.92 4.01 0.84 3.94 0.91 3.37 1.00 3.88 0.783.66 0.83 3.62 0.30 4.04 0.81 3.79 0.79 3.68 1.06 3.62 0.92 3.53 0.933.39 0.75 3.43 0.35 3.75 0.75 3.54 0.84 3.17 0.78 3.49 0.77 3.53 0.803.13 1.15 2.90 0.47 3.25 1.23 3.59 0.97 3.17 1.12 3.36 0.99 3.30 1.162.82 0.88 2.76 0.29 2.93 1.00 2.99 1.08 2.94 0.92 2.92 1.07 2.94 1.022.55 1.15 2.70 0.36 2.92 1.23 3.14 1.18 2.83 1.18 2.96 1.23 2.92 1.232.78 1.12 2.72 0.34 2.91 1.16 2.84 1.24 3.03 1.13 3.15 1.23 2.97 1.152.86 1.09 2.70 0.44 2.87 1.28 2.95 1.30 2.77 1.31 2.78 1.30 2.92 1.26N/A N/A N/A N/A N/A N/A N/A N/A N/A N/A N/A N/A N/A N/A2.96 1.07 2.78 0.46 2.83 1.25 2.89 1.26 2.66 1.23 2.64 1.28 2.98 1.293.00 1.18 2.83 0.34 3.01 1.23 3.02 1.41 3.00 1.25 2.68 1.31 2.75 1.233.63 0.92 3.51 0.25 3.62 0.86 3.65 0.88 3.82 0.72 3.59 0.85 3.59 0.863.52 1.20 3.60 0.27 3.60 1.24 3.67 1.11 3.81 1.05 3.22 1.21 3.53 1.203.59 1.14 3.37 0.29 3.52 0.98 3.44 1.00 3.74 1.05 3.69 1.03 3.55 1.023.78 1.00 3.54 0.34 3.70 1.00 3.86 1.05 3.92 0.87 3.89 0.97 3.68 0.953.32 1.14 3.23 0.32 3.53 1.12 3.26 1.18 3.32 1.10 3.18 1.20 3.24 1.223.57 1.30 3.57 0.27 3.63 1.40 3.39 1.33 3.65 1.20 3.36 1.43 3.63 1.303.76 1.03 3.34 0.32 3.72 1.00 3.47 1.03 3.55 1.10 3.35 1.07 3.53 1.112.85 1.51 2.98 0.41 3.35 1.39 3.16 1.42 3.04 1.43 2.91 1.46 2.94 1.46N/A N/A N/A N/A N/A N/A N/A N/A N/A N/A N/A N/A N/A N/A
12
University of Arizona COACHE Survey Results for T/TE and C/CE Faculty.

The Collaborative on Academic Careers in Higher Education (COACHE)Faculty Job Satisfaction Survey 2013-14
MEANS AND STANDARD DEVIATIONS
University of Arizona
item short nameQ130C Support for faculty to be good mentorsQ115 Being a mentor is fulfillingQ120A Importance of mentoring within dept.Q120B Importance of mentoring outside dept.Q120C Importance of mentoring outside inst.Q125C Effectiveness of mentoring outside the inst.
Benchmark: Tenure policiesQ136A Clarity of tenure processQ136B Clarity of tenure criteriaQ136C Clarity of tenure standardsQ136D Clarity of body of evidence for deciding tenureQ136E Clarity of whether I will achieve tenureQ139A Consistency of messages about tenureQ139B Tenure decisions are performance-based
Benchmark: Tenure clarityQ137A Clarity of expectations: ScholarQ137B Clarity of expectations: TeacherQ137C Clarity of expectations: AdvisorQ137D Clarity of expectations: ColleagueQ137E Clarity of expectations: Campus citizenQ137F Clarity of expectations: Broader community
Benchmark: Tenure reasonablenessQ138A Reasonable expectations: ScholarQ138B Reasonable expectations: TeacherQ138C Reasonable expectations: AdvisorQ138D Reasonable expectations: ColleagueQ138E Reasonable expectations: Campus citizenQ138F Reasonable expectations: Community member
Benchmark: PromotionQ135C Reasonable expectations: PromotionQ135B Dept. culture encourages promotionQ140A Clarity of promotion processQ140B Clarity of promotion criteriaQ140C Clarity of promotion standardsQ140D Clarity of body of evidence for promotionQ140E Clarity of time frame for promotionQ140F Clarity of whether I will be promoted
by Tenure Status
mean sd mean sd mean sd mean sd mean sd mean sd mean sdpeer 1 peer 2you peer 5peer 3 peer 4
pre-tenureAll
N/A N/A N/A N/A N/A N/A N/A N/A N/A N/A N/A N/A N/A N/AN/A N/A N/A N/A N/A N/A N/A N/A N/A N/A N/A N/A N/A N/A4.43 0.73 4.39 0.17 4.53 0.73 4.37 0.87 4.58 0.52 4.52 0.70 4.42 0.903.96 1.02 3.75 0.23 3.86 0.95 3.71 1.12 3.81 0.89 3.85 1.01 3.92 1.114.07 0.91 3.86 0.26 3.94 0.97 4.11 1.02 4.04 0.85 3.84 1.04 4.02 0.924.03 0.91 3.88 0.21 4.07 0.85 3.90 1.03 3.97 0.76 3.75 0.94 4.02 1.023.30 0.99 3.45 0.33 3.71 0.98 3.61 1.03 3.58 0.94 3.28 1.04 3.42 1.043.35 1.25 3.61 0.38 3.86 1.14 3.78 1.26 3.76 1.12 3.47 1.25 3.56 1.253.33 1.23 3.59 0.36 3.84 1.11 3.73 1.24 3.75 1.20 3.38 1.23 3.54 1.232.99 1.28 3.29 0.35 3.64 1.19 3.53 1.20 3.35 1.25 3.03 1.26 3.26 1.313.59 1.13 3.60 0.36 3.93 1.05 3.75 1.20 4.06 1.00 3.46 1.24 3.52 1.303.41 1.11 3.47 0.33 3.63 1.21 3.52 1.21 3.33 1.32 3.21 1.20 3.42 1.232.84 1.32 3.04 0.39 3.24 1.36 3.27 1.38 3.03 1.32 3.04 1.37 3.02 1.373.62 1.24 3.53 0.43 3.84 1.14 3.73 1.24 3.78 1.26 3.43 1.26 3.67 1.153.19 0.89 3.37 0.26 3.53 1.03 3.62 0.95 3.49 0.91 3.21 0.93 3.31 1.033.77 1.17 3.63 0.41 4.13 1.09 4.13 1.12 3.93 1.11 3.76 1.17 3.80 1.193.57 1.14 3.89 0.33 3.88 1.16 4.03 1.01 3.94 1.04 3.68 1.10 3.79 1.193.11 1.12 3.33 0.34 3.52 1.23 3.56 1.21 3.29 1.20 3.18 1.22 3.23 1.283.06 1.15 3.31 0.27 3.46 1.24 3.44 1.21 3.48 1.18 3.01 1.20 3.26 1.302.81 1.15 3.13 0.33 3.12 1.25 3.23 1.23 3.21 1.20 2.82 1.19 2.95 1.282.82 1.11 2.92 0.26 3.06 1.23 3.21 1.23 3.06 1.22 2.81 1.21 2.72 1.303.76 0.72 3.84 0.20 3.99 0.73 3.93 0.92 4.02 0.82 3.73 0.75 3.94 0.753.79 0.97 3.79 0.38 4.08 1.02 3.91 1.16 3.95 1.03 3.71 1.10 3.90 1.103.96 0.87 4.10 0.26 4.30 0.85 4.12 1.02 4.17 1.02 3.94 0.98 4.15 0.933.76 0.88 3.85 0.29 4.10 0.89 4.03 1.01 4.16 1.00 3.69 0.90 4.04 0.973.77 0.93 3.88 0.23 3.96 0.98 3.91 1.08 4.08 1.01 3.69 0.93 3.95 0.963.69 0.87 3.74 0.22 3.77 0.84 3.82 0.99 4.00 0.98 3.60 0.90 3.84 0.923.66 0.86 3.62 0.23 3.74 0.93 3.82 1.01 3.88 0.98 3.59 0.90 3.73 0.93N/A N/A N/A N/A N/A N/A N/A N/A N/A N/A N/A N/A N/A N/AN/A N/A N/A N/A N/A N/A N/A N/A N/A N/A N/A N/A N/A N/AN/A N/A N/A N/A N/A N/A N/A N/A N/A N/A N/A N/A N/A N/AN/A N/A N/A N/A N/A N/A N/A N/A N/A N/A N/A N/A N/A N/AN/A N/A N/A N/A N/A N/A N/A N/A N/A N/A N/A N/A N/A N/AN/A N/A N/A N/A N/A N/A N/A N/A N/A N/A N/A N/A N/A N/AN/A N/A N/A N/A N/A N/A N/A N/A N/A N/A N/A N/A N/A N/AN/A N/A N/A N/A N/A N/A N/A N/A N/A N/A N/A N/A N/A N/AN/A N/A N/A N/A N/A N/A N/A N/A N/A N/A N/A N/A N/A N/A
13
University of Arizona COACHE Survey Results for T/TE and C/CE Faculty.

The Collaborative on Academic Careers in Higher Education (COACHE)Faculty Job Satisfaction Survey 2013-14
MEANS AND STANDARD DEVIATIONS
University of Arizona
item short nameQ170A Priorities are stated consistentlyQ170C Priorities are acted on consistentlyQ170D Changed priorities negatively affect my work**
Benchmark: Leadership: SeniorQ180A Pres/Chancellor: Pace of decision makingQ180B Pres/Chancellor: Stated prioritiesQ180C Pres/Chancellor: Communication of prioritiesQ180L CAO: Pace of decision makingQ180M CAO: Stated prioritiesQ180N CAO: Communication of prioritiesQ180O CAO: Ensuring faculty inputQ175C CAO: Support in adapting to change
Benchmark: Leadership: DivisionalQ185D Dean: Pace of decision makingQ185E Dean: Stated prioritiesQ185F Dean: Communication of prioritiesQ185G Dean: Ensuring faculty inputQ175A Dean: Support in adapting to change
Benchmark: Leadership: DepartmentalQ185H Head/Chair: Pace of decision makingQ185I Head/Chair: Stated prioritiesQ185J Head/Chair: Communication of prioritiesQ185K Head/Chair: Ensuring faculty inputQ185L Head/Chair: Fairness in evaluating workQ175B Head/Chair: Support in adapting to change
Benchmark: Departmental collegialityQ200C Colleagues support work/life balanceQ200D Meeting times compatible with personal needsQ205B Amount of personal interaction w/Pre-tenureQ205C How well you fitQ205E Amount of personal interaction w/TenuredQ210A Colleagues pitch in when neededQ210C Dept. is collegialQ212A Colleagues committed to diversity/inclusion
Benchmark: Departmental engagementQ190A Discussions of undergrad student learningQ190B Discussions of grad student learning
by Tenure Status
mean sd mean sd mean sd mean sd mean sd mean sd mean sdpeer 1 peer 2you peer 5peer 3 peer 4
pre-tenureAll
2.93 1.09 3.07 0.37 3.19 1.19 3.33 1.17 2.61 1.14 3.14 1.14 2.79 1.162.66 1.10 2.88 0.37 3.12 1.18 3.19 1.18 2.52 1.09 2.95 1.09 2.87 1.192.80 1.13 2.97 0.43 3.16 1.22 3.30 1.25 2.34 1.24 3.03 1.27 3.05 1.203.23 0.83 3.33 0.33 3.31 0.79 3.47 0.88 3.03 0.77 3.03 0.75 3.17 0.783.19 0.92 3.34 0.38 3.41 0.74 3.45 0.87 3.04 1.00 2.99 0.86 3.21 0.813.17 1.00 3.34 0.41 3.45 0.90 3.53 0.91 2.90 1.07 2.92 0.95 3.17 0.843.37 1.00 3.28 0.43 3.36 0.96 3.49 1.03 2.89 1.09 2.80 1.01 3.09 0.963.23 0.86 3.32 0.32 3.29 0.84 3.41 0.93 3.15 0.95 3.19 0.80 3.24 0.863.20 0.97 3.34 0.33 3.22 0.89 3.47 1.00 3.10 0.92 3.23 0.83 3.25 0.913.26 0.96 3.30 0.34 3.23 0.89 3.39 1.06 3.07 1.01 3.11 0.91 3.13 1.00N/A N/A N/A N/A N/A N/A N/A N/A N/A N/A N/A N/A N/A N/AN/A N/A N/A N/A N/A N/A N/A N/A N/A N/A N/A N/A N/A N/A3.02 0.99 3.46 0.29 3.22 1.03 3.53 1.07 3.13 1.07 3.52 0.88 3.27 1.093.10 1.04 3.51 0.32 3.22 1.11 3.63 1.10 3.28 1.14 3.51 0.93 3.44 1.073.06 1.06 3.48 0.32 3.20 1.10 3.64 1.10 3.14 1.14 3.54 0.94 3.37 1.213.02 1.16 3.46 0.33 3.18 1.11 3.51 1.18 3.05 1.22 3.55 1.06 3.21 1.262.92 1.14 3.40 0.36 3.27 1.09 3.38 1.17 3.04 1.20 3.50 1.03 3.11 1.232.55 1.33 2.94 0.46 2.71 1.43 2.81 1.44 2.65 1.29 2.96 1.07 2.68 1.273.63 1.12 3.83 0.29 3.81 1.01 3.87 1.11 4.01 0.95 3.52 1.12 3.58 1.173.48 1.25 3.75 0.32 3.79 1.10 3.86 1.18 4.04 0.83 3.42 1.26 3.51 1.213.58 1.23 3.75 0.28 3.77 1.11 3.86 1.19 3.97 0.99 3.46 1.29 3.43 1.343.58 1.26 3.76 0.30 3.78 1.22 3.78 1.27 3.95 1.14 3.51 1.33 3.54 1.293.71 1.29 3.88 0.30 3.77 1.20 3.75 1.30 4.03 1.13 3.44 1.33 3.60 1.303.86 1.16 4.01 0.29 3.96 1.12 4.10 1.06 4.13 1.09 3.75 1.14 3.82 1.183.16 1.48 3.46 0.45 3.50 1.53 3.48 1.56 3.78 1.23 3.25 1.27 2.97 1.533.73 0.75 3.83 0.22 3.75 0.79 3.80 0.84 3.85 0.70 3.56 0.79 3.78 0.753.46 1.16 3.70 0.32 3.57 1.23 3.61 1.15 3.53 1.13 3.57 1.07 3.75 1.054.07 1.01 4.08 0.18 3.93 1.19 4.18 0.94 4.27 1.07 3.99 0.94 4.10 1.023.68 1.01 3.80 0.25 3.64 1.06 3.86 0.95 3.84 0.86 3.65 0.98 3.73 0.953.53 1.19 3.79 0.25 3.75 1.13 3.80 1.06 3.72 1.14 3.27 1.31 3.75 1.093.57 0.92 3.61 0.25 3.60 0.98 3.59 1.10 3.59 1.01 3.33 1.04 3.61 0.943.64 1.14 3.79 0.33 3.83 1.14 3.85 1.03 3.63 1.21 3.36 1.25 3.72 1.114.01 1.20 3.97 0.35 3.95 1.18 3.92 1.21 4.06 1.07 3.68 1.30 3.91 1.193.80 1.11 3.93 0.28 3.82 1.14 3.87 1.23 4.08 0.96 3.68 1.12 3.84 1.043.37 0.82 3.44 0.17 3.36 0.72 3.37 0.70 3.53 0.66 3.26 0.87 3.32 0.783.25 1.20 3.65 0.40 2.95 1.24 2.93 1.25 3.40 1.22 3.22 1.29 3.17 1.193.48 1.13 2.97 0.70 3.46 1.11 3.78 1.02 3.62 1.02 3.42 1.17 3.67 1.06
14
University of Arizona COACHE Survey Results for T/TE and C/CE Faculty.

The Collaborative on Academic Careers in Higher Education (COACHE)Faculty Job Satisfaction Survey 2013-14
MEANS AND STANDARD DEVIATIONS
University of Arizona
item short nameQ190C Discussions of effective teaching practicesQ190D Discussions of effective use of technologyQ190E Discussions of current research methodsQ205A Amount of professional interaction w/Pre-tenureQ205D Amount of professional interaction w/Tenured
Benchmark: Departmental qualityQ195A Intellectual vitality of tenured facultyQ195B Intellectual vitality of pre-tenure facultyQ195C Scholarly productivity of tenured facultyQ195D Scholarly productivity of pre-tenure facultyQ195G Teaching effectiveness of tenured facultyQ195H Teaching effectiveness of pre-tenure facultyQ240B Dept. is successful at faculty recruitmentQ240C Dept. is successful at faculty retentionQ240D Dept. addresses sub-standard performance
Benchmark: Appreciation and recognitionQ215A Recognition: For teachingQ215B Recognition: For advisingQ215C Recognition: For scholarshipQ215D Recognition: For serviceQ215E Recognition: For outreachQ215I Recognition: From colleaguesQ215J Recognition: From CAOQ215K Recognition: From DeanQ215L Recognition: From Head/ChairQ220A School/college is valued by Pres/ProvostQ220B Dept. is valued by Pres/ProvostQ245A CAO cares about faculty of my rankQ240A Outside offers are necessary in negotiationsQ212B Visible leadership for support of diversityQ245D I would again choose this institutionQ250A Department as a place to workQ250B Institution as a place to work
by Tenure Status
mean sd mean sd mean sd mean sd mean sd mean sd mean sdpeer 1 peer 2you peer 5peer 3 peer 4
pre-tenureAll
3.20 1.11 3.53 0.31 3.14 1.06 3.25 1.02 3.33 1.10 3.12 1.12 3.04 1.033.03 1.05 3.26 0.26 3.12 0.93 2.96 1.05 3.05 1.06 2.95 1.10 3.06 1.103.28 1.20 3.10 0.33 3.50 1.01 3.36 1.12 3.63 0.99 3.18 1.15 3.18 1.163.73 1.01 3.85 0.27 3.70 1.08 3.84 1.02 3.99 0.88 3.60 1.10 3.64 1.073.60 1.02 3.65 0.27 3.71 1.03 3.58 1.12 3.73 1.05 3.32 1.19 3.57 1.063.55 0.83 3.54 0.25 3.73 0.80 3.58 0.84 4.02 0.65 3.39 0.75 3.52 0.863.47 1.13 3.40 0.32 3.80 1.09 3.51 1.10 3.94 0.97 3.11 1.21 3.44 1.144.06 0.84 4.05 0.24 4.18 0.85 4.03 0.87 4.36 0.70 3.95 0.90 3.98 0.903.37 1.17 3.20 0.38 3.68 1.08 3.40 1.10 4.09 0.97 3.12 1.18 3.32 1.223.92 0.91 3.86 0.32 4.01 0.84 3.95 0.89 4.38 0.71 3.85 0.84 3.78 1.023.45 1.08 3.52 0.32 3.60 1.05 3.49 1.08 3.91 0.93 3.45 1.00 3.65 1.003.96 0.72 3.98 0.18 3.98 0.88 3.94 0.84 4.18 0.67 3.82 0.73 3.86 0.85N/A N/A N/A N/A N/A N/A N/A N/A N/A N/A N/A N/A N/A N/AN/A N/A N/A N/A N/A N/A N/A N/A N/A N/A N/A N/A N/A N/A2.30 1.13 2.49 0.31 2.52 1.15 2.69 1.34 2.76 1.10 2.32 1.17 2.44 1.203.31 0.81 3.40 0.24 3.45 0.84 3.31 0.93 3.52 0.77 3.21 0.81 3.36 0.843.34 1.08 3.44 0.31 3.36 1.05 3.13 1.14 3.44 1.04 3.16 1.07 3.35 1.053.10 0.95 3.14 0.28 3.19 1.02 2.99 1.11 3.39 1.02 2.95 0.96 3.18 1.033.35 1.06 3.39 0.27 3.54 1.09 3.47 1.08 3.60 1.00 3.38 1.05 3.48 1.043.18 1.04 3.25 0.28 3.21 0.99 3.17 1.11 3.43 0.95 3.07 0.96 3.19 0.993.18 0.91 3.19 0.31 3.06 0.91 3.04 0.97 3.11 1.09 3.10 0.95 3.05 0.973.60 0.98 3.66 0.25 3.64 0.89 3.53 1.09 3.82 0.92 3.33 1.05 3.63 0.95N/A N/A N/A N/A N/A N/A N/A N/A N/A N/A N/A N/A N/A N/AN/A N/A N/A N/A N/A N/A N/A N/A N/A N/A N/A N/A N/A N/A3.44 1.17 3.74 0.25 3.71 1.14 3.72 1.26 3.77 1.12 3.47 1.18 3.54 1.18N/A N/A N/A N/A N/A N/A N/A N/A N/A N/A N/A N/A N/A N/AN/A N/A N/A N/A N/A N/A N/A N/A N/A N/A N/A N/A N/A N/A3.16 1.08 3.27 0.40 3.43 1.13 3.31 1.34 3.51 1.21 3.03 1.10 3.41 1.10N/A N/A N/A N/A N/A N/A N/A N/A N/A N/A N/A N/A N/A N/A3.47 1.13 3.74 0.28 3.88 0.95 3.73 1.21 3.98 1.02 3.76 1.09 3.88 1.043.73 1.17 3.79 0.38 3.80 1.23 3.87 1.16 3.96 1.14 3.66 1.17 3.86 1.223.74 1.07 3.87 0.28 3.81 1.14 3.87 1.07 3.99 1.01 3.51 1.16 3.78 1.203.61 0.92 3.69 0.35 3.99 0.83 3.87 0.92 3.65 1.10 3.69 0.97 3.82 1.02
15
University of Arizona COACHE Survey Results for T/TE and C/CE Faculty.

The Collaborative on Academic Careers in Higher Education (COACHE)Faculty Job Satisfaction Survey 2013-14
MEANS AND STANDARD DEVIATIONS
University of Arizona
item short nameBenchmark: Nature of Work Research
Q45B Time spent on researchQ80A Expectations for finding external fundingQ80B Influence over focus of researchQ80C Quality of grad students to support researchQ80D Support for researchQ80E Support for engaging undergrads in researchQ85A Support for obtaining grants (pre-award)Q85B Support for maintaining grants (post-award)Q85C Support for securing grad student assistanceQ85D Support for travel to present/conduct researchQ85E Availability of course release for research
Benchmark: Nature of Work: ServiceQ45C Time spent on serviceQ55B Support for faculty in leadership rolesQ60A Number of committeesQ60B Attractiveness of committeesQ60C Discretion to choose committeesQ60D Equitability of committee assignmentsQ60E Number of student advisees
Benchmark: Nature of Work: TeachingQ45A Time spent on teachingQ70A Number of courses taughtQ70B Level of courses taughtQ70C Discretion over course contentQ70D Number of students in classes taughtQ70E Quality of students taughtQ70H Equitability of distribution of teaching loadQ70I Quality of grad students to support teachingQ45D Time spent on outreachQ45E Time spent on administrative tasksQ55A Ability to balance teaching/research/service
Benchmark: Facilities and work resourcesQ70F Support for improving teachingQ90A OfficeQ90B Laboratory, research, studio spaceQ90C Equipment
by Rank
mean sd mean sd mean sd mean sd mean sd mean sd mean sd3.21 0.68 3.19 0.24 3.48 0.65 3.33 0.67 3.26 0.73 3.36 0.70 3.48 0.753.66 1.15 3.40 0.39 3.84 1.09 3.84 1.11 3.83 1.12 3.78 1.03 3.90 1.053.20 0.96 3.21 0.24 3.37 0.97 3.38 0.89 3.16 1.10 3.33 1.03 3.42 1.004.48 0.69 4.35 0.27 4.50 0.74 4.57 0.61 4.53 0.73 4.41 0.87 4.41 0.773.55 1.06 2.97 0.78 3.79 1.02 3.49 1.07 3.70 1.04 3.55 1.01 3.42 1.122.57 1.16 2.79 0.35 3.10 1.17 2.61 1.13 2.63 1.17 2.82 1.17 3.20 1.162.94 1.05 3.05 0.35 3.43 0.99 3.20 1.15 2.91 1.08 3.17 1.05 3.39 1.022.91 1.11 3.05 0.33 3.28 1.04 3.12 1.11 2.97 1.17 3.54 1.18 3.34 1.123.22 1.11 3.06 0.36 3.31 1.09 3.14 1.10 3.11 1.14 3.22 1.10 3.29 1.092.83 1.10 2.68 0.54 3.15 1.04 3.13 1.11 2.91 1.10 2.95 1.13 3.15 1.092.83 1.26 3.10 0.41 3.26 1.16 3.15 1.23 3.20 1.16 3.13 1.22 3.33 1.212.76 1.14 2.57 0.38 2.96 1.10 2.87 1.26 2.56 1.12 2.90 1.17 3.10 1.213.26 0.76 3.34 0.18 3.37 0.72 3.39 0.88 3.30 0.76 3.22 0.82 3.40 0.833.48 0.99 3.49 0.24 3.55 0.97 3.54 1.05 3.44 1.05 3.42 1.01 3.60 0.982.70 1.24 2.76 0.31 2.98 1.30 3.04 1.44 2.69 1.33 2.85 1.40 2.92 1.313.41 0.87 3.48 0.18 3.52 0.87 3.52 1.03 3.42 0.89 3.37 0.92 3.49 0.893.42 0.90 3.50 0.18 3.45 0.95 3.52 0.93 3.47 0.94 3.38 1.01 3.44 1.023.42 1.08 3.67 0.24 3.56 0.93 3.59 1.04 3.68 0.92 3.36 1.06 3.64 1.043.02 1.17 3.13 0.27 3.14 1.04 3.12 1.20 3.06 1.15 2.97 1.14 3.21 1.143.76 0.82 3.55 0.30 3.79 0.85 3.90 0.92 3.82 0.82 3.74 0.92 3.74 0.903.83 0.58 3.78 0.18 3.89 0.60 3.85 0.68 3.79 0.63 3.81 0.64 3.90 0.664.01 0.84 4.04 0.19 4.06 0.79 4.04 0.89 3.93 0.85 4.02 0.85 4.19 0.803.97 0.85 3.71 0.32 4.02 0.82 3.89 1.07 3.84 0.96 3.97 0.97 3.97 0.944.17 0.66 4.05 0.19 4.08 0.83 4.13 0.89 4.02 0.85 4.23 0.74 4.20 0.794.43 0.70 4.45 0.13 4.39 0.78 4.46 0.81 4.38 0.84 4.45 0.78 4.46 0.733.86 0.97 3.76 0.29 3.87 0.96 4.01 0.96 3.61 1.11 3.79 1.05 3.94 1.053.37 1.00 3.33 0.40 3.78 0.92 3.42 1.02 3.51 1.03 3.46 0.99 3.60 1.083.04 1.18 3.32 0.26 3.16 1.15 3.28 1.25 3.21 1.17 3.02 1.22 3.26 1.213.57 1.11 3.06 0.77 3.74 1.06 3.54 1.13 3.80 0.95 3.51 1.06 3.53 1.063.73 0.84 3.62 0.19 3.69 0.81 3.66 0.79 3.58 0.83 3.67 0.84 3.70 0.852.88 1.04 2.92 0.24 2.91 1.00 3.06 1.11 2.67 1.07 2.91 1.09 3.06 1.083.42 1.28 3.39 0.30 3.63 1.19 3.74 1.20 3.38 1.27 3.55 1.22 3.71 1.213.47 0.68 3.43 0.25 3.65 0.61 3.56 0.75 3.33 0.77 3.48 0.69 3.55 0.733.01 1.03 3.26 0.28 3.51 0.99 3.35 1.00 3.09 1.07 3.29 1.07 3.31 1.033.96 0.92 3.78 0.24 3.99 0.91 3.80 1.06 3.53 1.13 3.75 1.04 3.91 1.003.49 1.05 3.22 0.38 3.63 1.07 3.77 1.06 3.36 1.20 3.25 1.25 3.34 1.243.28 1.06 3.33 0.33 3.51 0.96 3.38 1.14 3.22 1.13 3.33 1.10 3.46 1.07
peer 5you peer 3 peer 4Allfull
peer 1 peer 2
16
University of Arizona COACHE Survey Results for T/TE and C/CE Faculty.

The Collaborative on Academic Careers in Higher Education (COACHE)Faculty Job Satisfaction Survey 2013-14
MEANS AND STANDARD DEVIATIONS
University of Arizona
item short nameQ90D ClassroomsQ90E Library resourcesQ90F Computing and technical supportQ90H Clerical/administrative support
Benchmark: Personal and family policiesQ95D Housing benefitsQ95E Tuition waivers, remission, or exchangeQ95F Spousal/partner hiring programQ95G ChildcareQ95H EldercareQ95J Family medical/parental leaveQ95K Flexible workload/modified dutiesQ95L Stop-the-clock policiesQ200B Inst. does what it can for work/life compatibilityQ200A Right balance between professional/personal
Benchmark: Health and retirement benefitsQ95A Health benefits for yourselfQ95B Health benefits for familyQ95C Retirement benefitsQ95I Phased retirement optionsQ90G Salary
Benchmark: Interdisciplinary workQ100A Budgets encourage interdiscip. workQ100B Facilities conducive to interdiscip. workQ100C Interdiscip. work is rewarded in meritQ100D Interdiscip. work is rewarded in promotionQ100E Interdiscip. work is rewarded in tenureQ100G Dept. knows how to evaluate interdiscip. work
Benchmark: CollaborationQ105A Opportunities for collab. within dept.Q105E Opportunities for collab. outside dept.Q105D Opportunities for collab. outside inst.
Benchmark: MentoringQ125A Effectiveness of mentoring within dept.Q125B Effectiveness of mentoring outside dept.Q130A Mentoring of pre-tenure facultyQ130B Mentoring of associate faculty
by Rank
mean sd mean sd mean sd mean sd mean sd mean sd mean sdpeer 5you peer 3 peer 4All
fullpeer 1 peer 2
3.35 0.97 3.29 0.32 3.60 0.92 3.36 1.15 3.18 1.09 3.38 1.10 3.32 1.093.99 0.90 3.74 0.41 4.18 0.73 3.87 0.96 3.92 0.90 3.83 0.89 3.83 0.953.41 1.12 3.46 0.35 3.51 1.05 3.70 1.05 3.30 1.18 3.54 1.09 3.75 1.043.15 1.24 3.26 0.38 3.26 1.14 3.27 1.29 2.91 1.23 3.40 1.16 3.36 1.233.29 0.86 3.06 0.26 3.15 0.93 3.05 0.92 3.17 0.84 3.17 0.83 3.26 0.842.46 0.88 2.33 0.55 2.79 1.01 2.41 0.90 3.25 1.13 2.66 0.94 2.75 0.993.80 0.88 2.73 0.72 2.17 1.00 2.36 1.05 1.82 0.94 3.11 1.12 3.24 1.133.09 1.10 2.64 0.38 2.95 1.15 3.04 1.24 3.13 1.28 2.85 1.19 2.99 1.042.72 0.92 2.72 0.57 2.77 1.14 2.98 1.06 2.71 0.89 2.83 0.94 2.79 0.872.89 0.73 2.66 0.35 2.92 0.97 2.84 0.86 2.90 0.78 2.79 0.87 3.02 0.863.63 0.79 3.42 0.27 3.61 0.92 3.32 1.10 3.63 0.86 3.53 0.86 3.60 0.883.66 0.87 3.35 0.38 3.64 1.01 3.44 1.10 3.59 0.90 3.54 1.02 3.69 0.91N/A N/A N<5 N<5 N/A N/A N/A N/A N/A N/A N/A N/A N<5 N<52.83 1.15 3.02 0.30 3.12 1.20 3.15 1.26 3.28 1.16 2.92 1.18 3.08 1.213.32 1.32 3.55 0.25 3.56 1.25 3.82 1.18 3.45 1.28 3.46 1.27 3.56 1.283.78 0.69 3.51 0.36 4.04 0.64 4.01 0.73 3.83 0.75 3.35 0.87 3.65 0.844.04 0.80 3.66 0.46 4.19 0.70 4.24 0.76 3.97 0.87 3.34 1.04 3.79 0.904.03 0.82 3.54 0.55 4.09 0.77 4.14 0.80 3.93 0.90 3.33 1.01 3.68 0.943.54 0.87 3.47 0.35 4.04 0.91 3.94 0.86 3.98 0.90 3.44 1.07 3.65 1.053.12 0.93 3.09 0.35 3.72 0.95 3.19 1.17 2.89 1.04 3.31 1.00 3.18 1.143.02 1.30 3.05 0.45 3.33 1.19 3.73 1.16 3.35 1.23 3.13 1.28 3.06 1.312.87 0.95 2.61 0.27 2.85 0.94 2.87 1.03 2.92 0.95 2.87 1.06 2.96 0.932.53 1.16 2.42 0.31 2.51 1.17 2.73 1.23 2.69 1.16 2.77 1.22 2.90 1.112.81 1.15 2.56 0.31 2.78 1.15 2.57 1.25 2.85 1.21 2.94 1.26 2.90 1.182.83 1.17 2.54 0.31 2.92 1.16 2.75 1.26 2.93 1.19 2.86 1.22 2.88 1.132.95 1.16 2.65 0.33 2.97 1.17 2.89 1.19 2.90 1.19 2.94 1.22 2.91 1.11N/A N/A N/A N/A N/A N/A N/A N/A N/A N/A N/A N/A N/A N/A3.08 1.28 2.85 0.36 3.03 1.23 3.23 1.34 3.17 1.25 2.82 1.27 3.07 1.253.79 0.75 3.60 0.22 3.83 0.83 3.81 0.88 3.94 0.81 3.75 0.84 3.77 0.853.77 1.02 3.72 0.23 3.84 1.04 3.79 1.10 3.89 1.07 3.74 1.08 3.74 1.153.67 0.96 3.45 0.24 3.72 1.01 3.67 1.12 3.79 1.03 3.64 1.07 3.70 1.063.92 0.88 3.59 0.37 3.94 0.98 3.98 0.98 4.12 0.84 3.88 0.98 3.85 0.972.99 0.94 3.00 0.25 3.15 0.95 3.14 0.95 3.05 0.89 3.13 0.89 3.05 0.913.55 1.25 3.62 0.30 3.61 1.22 3.37 1.16 3.60 1.14 3.53 1.15 3.56 1.193.51 1.05 3.45 0.25 3.61 1.12 3.58 0.97 3.51 1.05 3.37 1.03 3.45 1.063.23 1.27 3.30 0.35 3.54 1.23 3.55 1.22 3.25 1.23 3.42 1.26 3.33 1.242.67 1.22 2.68 0.31 2.76 1.19 2.88 1.28 2.74 1.15 3.00 1.23 2.67 1.18
17
University of Arizona COACHE Survey Results for T/TE and C/CE Faculty.

The Collaborative on Academic Careers in Higher Education (COACHE)Faculty Job Satisfaction Survey 2013-14
MEANS AND STANDARD DEVIATIONS
University of Arizona
item short nameQ130C Support for faculty to be good mentorsQ115 Being a mentor is fulfillingQ120A Importance of mentoring within dept.Q120B Importance of mentoring outside dept.Q120C Importance of mentoring outside inst.Q125C Effectiveness of mentoring outside the inst.
Benchmark: Tenure policiesQ136A Clarity of tenure processQ136B Clarity of tenure criteriaQ136C Clarity of tenure standardsQ136D Clarity of body of evidence for deciding tenureQ136E Clarity of whether I will achieve tenureQ139A Consistency of messages about tenureQ139B Tenure decisions are performance-based
Benchmark: Tenure clarityQ137A Clarity of expectations: ScholarQ137B Clarity of expectations: TeacherQ137C Clarity of expectations: AdvisorQ137D Clarity of expectations: ColleagueQ137E Clarity of expectations: Campus citizenQ137F Clarity of expectations: Broader community
Benchmark: Tenure reasonablenessQ138A Reasonable expectations: ScholarQ138B Reasonable expectations: TeacherQ138C Reasonable expectations: AdvisorQ138D Reasonable expectations: ColleagueQ138E Reasonable expectations: Campus citizenQ138F Reasonable expectations: Community member
Benchmark: PromotionQ135C Reasonable expectations: PromotionQ135B Dept. culture encourages promotionQ140A Clarity of promotion processQ140B Clarity of promotion criteriaQ140C Clarity of promotion standardsQ140D Clarity of body of evidence for promotionQ140E Clarity of time frame for promotionQ140F Clarity of whether I will be promoted
by Rank
mean sd mean sd mean sd mean sd mean sd mean sd mean sdpeer 5you peer 3 peer 4All
fullpeer 1 peer 2
2.38 1.09 2.38 0.28 2.59 1.07 2.58 1.13 2.46 1.08 2.56 1.15 2.45 1.074.23 0.84 4.17 0.17 4.14 0.89 4.11 0.91 4.31 0.76 4.02 0.99 4.06 0.944.08 1.04 4.00 0.23 4.01 1.06 3.85 1.14 3.98 1.05 4.02 1.09 4.05 1.053.49 1.05 3.36 0.24 3.44 1.11 3.34 1.15 3.40 1.12 3.35 1.13 3.37 1.143.69 1.05 3.46 0.29 3.63 1.09 3.62 1.06 3.62 1.05 3.41 1.13 3.54 1.053.99 0.91 3.77 0.26 3.97 1.01 3.84 0.84 3.82 0.94 3.68 0.98 3.65 1.10N/A N/A N/A N/A N/A N/A N/A N/A N/A N/A N/A N/A N/A N/AN/A N/A N/A N/A N/A N/A N/A N/A N/A N/A N/A N/A N/A N/AN/A N/A N/A N/A N/A N/A N/A N/A N/A N/A N/A N/A N/A N/AN/A N/A N/A N/A N/A N/A N/A N/A N/A N/A N/A N/A N/A N/AN/A N/A N/A N/A N/A N/A N/A N/A N/A N/A N/A N/A N/A N/AN/A N/A N/A N/A N/A N/A N/A N/A N/A N/A N/A N/A N/A N/AN/A N/A N/A N/A N/A N/A N/A N/A N/A N/A N/A N/A N/A N/AN/A N/A N/A N/A N/A N/A N/A N/A N/A N/A N/A N/A N/A N/AN/A N/A N/A N/A N/A N/A N/A N/A N/A N/A N/A N/A N/A N/AN/A N/A N/A N/A N/A N/A N/A N/A N/A N/A N/A N/A N/A N/AN/A N/A N/A N/A N/A N/A N/A N/A N/A N/A N/A N/A N/A N/AN/A N/A N/A N/A N/A N/A N/A N/A N/A N/A N/A N/A N/A N/AN/A N/A N/A N/A N/A N/A N/A N/A N/A N/A N/A N/A N/A N/AN/A N/A N/A N/A N/A N/A N/A N/A N/A N/A N/A N/A N/A N/AN/A N/A N/A N/A N/A N/A N/A N/A N/A N/A N/A N/A N/A N/AN/A N/A N/A N/A N/A N/A N/A N/A N/A N/A N/A N/A N/A N/AN/A N/A N/A N/A N/A N/A N/A N/A N/A N/A N/A N/A N/A N/AN/A N/A N/A N/A N/A N/A N/A N/A N/A N/A N/A N/A N/A N/AN/A N/A N/A N/A N/A N/A N/A N/A N/A N/A N/A N/A N/A N/AN/A N/A N/A N/A N/A N/A N/A N/A N/A N/A N/A N/A N/A N/AN/A N/A N/A N/A N/A N/A N/A N/A N/A N/A N/A N/A N/A N/AN/A N/A N/A N/A N/A N/A N/A N/A N/A N/A N/A N/A N/A N/A3.99 0.88 3.93 0.26 4.16 0.81 3.98 0.94 4.26 0.84 3.93 0.95 3.94 0.944.14 1.00 4.01 0.26 4.32 0.89 4.16 1.04 4.29 1.01 4.01 1.20 4.14 0.993.90 1.22 3.83 0.36 4.06 1.13 3.94 1.22 4.52 0.84 4.24 1.06 3.90 1.164.11 1.04 4.06 0.28 4.35 0.95 4.12 1.12 4.26 1.02 4.08 1.07 4.10 1.114.04 1.10 3.99 0.27 4.32 0.94 4.13 1.09 4.21 1.05 3.92 1.18 4.02 1.133.86 1.15 3.79 0.29 4.08 1.07 3.88 1.20 3.92 1.14 3.61 1.25 3.78 1.194.07 1.07 4.01 0.29 4.32 0.99 4.11 1.05 4.27 1.07 3.94 1.14 4.10 1.083.86 1.17 3.83 0.34 3.72 1.20 3.64 1.25 4.36 0.91 3.71 1.17 3.61 1.28N/A N/A N/A N/A N/A N/A N/A N/A N/A N/A N/A N/A N/A N/A
18
University of Arizona COACHE Survey Results for T/TE and C/CE Faculty.

The Collaborative on Academic Careers in Higher Education (COACHE)Faculty Job Satisfaction Survey 2013-14
MEANS AND STANDARD DEVIATIONS
University of Arizona
item short nameQ170A Priorities are stated consistentlyQ170C Priorities are acted on consistentlyQ170D Changed priorities negatively affect my work**
Benchmark: Leadership: SeniorQ180A Pres/Chancellor: Pace of decision makingQ180B Pres/Chancellor: Stated prioritiesQ180C Pres/Chancellor: Communication of prioritiesQ180L CAO: Pace of decision makingQ180M CAO: Stated prioritiesQ180N CAO: Communication of prioritiesQ180O CAO: Ensuring faculty inputQ175C CAO: Support in adapting to change
Benchmark: Leadership: DivisionalQ185D Dean: Pace of decision makingQ185E Dean: Stated prioritiesQ185F Dean: Communication of prioritiesQ185G Dean: Ensuring faculty inputQ175A Dean: Support in adapting to change
Benchmark: Leadership: DepartmentalQ185H Head/Chair: Pace of decision makingQ185I Head/Chair: Stated prioritiesQ185J Head/Chair: Communication of prioritiesQ185K Head/Chair: Ensuring faculty inputQ185L Head/Chair: Fairness in evaluating workQ175B Head/Chair: Support in adapting to change
Benchmark: Departmental collegialityQ200C Colleagues support work/life balanceQ200D Meeting times compatible with personal needsQ205B Amount of personal interaction w/Pre-tenureQ205C How well you fitQ205E Amount of personal interaction w/TenuredQ210A Colleagues pitch in when neededQ210C Dept. is collegialQ212A Colleagues committed to diversity/inclusion
Benchmark: Departmental engagementQ190A Discussions of undergrad student learningQ190B Discussions of grad student learning
by Rank
mean sd mean sd mean sd mean sd mean sd mean sd mean sdpeer 5you peer 3 peer 4All
fullpeer 1 peer 2
2.60 1.18 2.74 0.34 2.81 1.16 2.91 1.29 2.66 1.25 2.69 1.16 2.65 1.202.37 1.11 2.57 0.33 2.62 1.15 2.79 1.28 2.53 1.21 2.54 1.13 2.52 1.192.38 1.21 2.74 0.42 2.83 1.32 3.03 1.42 2.60 1.37 2.53 1.21 2.86 1.362.98 0.90 3.03 0.33 3.21 0.85 3.18 1.11 3.04 0.97 2.65 0.88 2.79 1.053.04 0.94 3.15 0.40 3.36 0.95 3.21 1.18 3.06 1.10 2.57 1.00 2.93 1.132.92 1.10 3.10 0.41 3.27 1.06 3.25 1.17 3.04 1.22 2.52 1.02 3.01 1.193.10 1.07 3.06 0.46 3.32 1.03 3.23 1.25 2.93 1.20 2.38 1.08 2.82 1.222.99 1.02 2.99 0.36 3.12 0.97 3.17 1.22 3.11 1.08 2.92 1.03 2.74 1.222.91 1.10 2.96 0.35 3.09 1.02 3.13 1.25 3.06 1.16 2.83 1.09 2.66 1.262.95 1.09 2.93 0.36 3.07 1.05 3.08 1.31 3.03 1.17 2.73 1.15 2.58 1.24N/A N/A N/A N/A N/A N/A N/A N/A N/A N/A N/A N/A N/A N/AN/A N/A N/A N/A N/A N/A N/A N/A N/A N/A N/A N/A N/A N/A2.85 1.09 3.12 0.32 3.09 1.06 3.02 1.30 2.99 1.24 3.13 1.16 3.34 1.152.96 1.17 3.19 0.33 3.13 1.11 3.15 1.33 3.09 1.26 3.26 1.17 3.53 1.152.89 1.21 3.11 0.32 3.08 1.18 3.00 1.37 2.97 1.33 3.07 1.24 3.49 1.202.82 1.21 3.11 0.33 3.12 1.17 3.07 1.38 2.95 1.35 3.10 1.31 3.27 1.282.75 1.22 3.04 0.36 3.04 1.18 2.88 1.41 2.95 1.40 3.11 1.34 3.12 1.292.55 1.36 2.60 0.40 2.49 1.32 2.43 1.32 2.47 1.39 2.54 1.31 2.90 1.483.35 1.18 3.61 0.26 3.54 1.15 3.54 1.31 3.81 1.13 3.21 1.20 3.55 1.213.26 1.24 3.58 0.29 3.54 1.23 3.55 1.36 3.82 1.15 3.18 1.26 3.58 1.243.22 1.32 3.50 0.28 3.40 1.29 3.43 1.42 3.64 1.26 3.13 1.32 3.47 1.343.24 1.35 3.50 0.30 3.47 1.32 3.44 1.44 3.77 1.25 3.10 1.38 3.38 1.373.39 1.37 3.64 0.29 3.57 1.33 3.43 1.50 3.87 1.30 3.16 1.41 3.58 1.353.69 1.25 3.82 0.27 3.74 1.23 3.75 1.34 4.10 1.15 3.45 1.34 3.73 1.292.98 1.48 3.17 0.38 3.01 1.37 2.74 1.48 3.22 1.37 2.96 1.35 2.94 1.503.76 0.81 3.86 0.17 3.74 0.78 3.78 0.80 3.92 0.75 3.63 0.79 3.66 0.853.51 1.10 3.71 0.22 3.64 1.07 3.61 1.11 3.72 1.01 3.48 1.06 3.59 1.124.08 1.02 4.10 0.16 4.11 1.04 4.08 1.09 4.13 1.03 3.90 1.11 3.89 1.113.68 0.89 3.71 0.18 3.54 0.89 3.67 1.00 3.71 0.92 3.56 0.95 3.53 0.953.62 1.22 3.82 0.27 3.52 1.27 3.80 1.17 3.71 1.19 3.56 1.24 3.55 1.313.64 0.97 3.74 0.20 3.59 0.98 3.64 0.92 3.78 0.97 3.54 0.99 3.54 0.993.72 1.16 3.88 0.22 3.75 1.13 3.66 1.19 3.90 1.10 3.51 1.19 3.66 1.163.90 1.24 3.96 0.27 3.88 1.20 3.82 1.21 4.13 1.16 3.65 1.28 3.76 1.263.95 1.12 4.03 0.25 3.93 1.07 4.03 1.11 4.21 1.02 3.84 1.12 3.86 1.143.47 0.73 3.49 0.16 3.41 0.78 3.45 0.80 3.59 0.72 3.50 0.69 3.42 0.793.22 1.17 3.65 0.38 3.07 1.25 3.16 1.28 3.38 1.16 3.48 1.05 3.19 1.263.66 1.00 3.04 0.81 3.59 1.11 3.67 1.13 3.79 1.00 3.72 0.96 3.65 1.15
19
University of Arizona COACHE Survey Results for T/TE and C/CE Faculty.

The Collaborative on Academic Careers in Higher Education (COACHE)Faculty Job Satisfaction Survey 2013-14
MEANS AND STANDARD DEVIATIONS
University of Arizona
item short nameQ190C Discussions of effective teaching practicesQ190D Discussions of effective use of technologyQ190E Discussions of current research methodsQ205A Amount of professional interaction w/Pre-tenureQ205D Amount of professional interaction w/Tenured
Benchmark: Departmental qualityQ195A Intellectual vitality of tenured facultyQ195B Intellectual vitality of pre-tenure facultyQ195C Scholarly productivity of tenured facultyQ195D Scholarly productivity of pre-tenure facultyQ195G Teaching effectiveness of tenured facultyQ195H Teaching effectiveness of pre-tenure facultyQ240B Dept. is successful at faculty recruitmentQ240C Dept. is successful at faculty retentionQ240D Dept. addresses sub-standard performance
Benchmark: Appreciation and recognitionQ215A Recognition: For teachingQ215B Recognition: For advisingQ215C Recognition: For scholarshipQ215D Recognition: For serviceQ215E Recognition: For outreachQ215I Recognition: From colleaguesQ215J Recognition: From CAOQ215K Recognition: From DeanQ215L Recognition: From Head/ChairQ220A School/college is valued by Pres/ProvostQ220B Dept. is valued by Pres/ProvostQ245A CAO cares about faculty of my rankQ240A Outside offers are necessary in negotiationsQ212B Visible leadership for support of diversityQ245D I would again choose this institutionQ250A Department as a place to workQ250B Institution as a place to work
by Rank
mean sd mean sd mean sd mean sd mean sd mean sd mean sdpeer 5you peer 3 peer 4All
fullpeer 1 peer 2
3.18 1.03 3.48 0.25 3.16 1.02 3.14 1.04 3.39 1.01 3.28 0.98 3.24 1.043.19 0.97 3.33 0.26 3.11 1.01 3.07 1.02 3.20 0.99 3.25 1.00 3.09 1.053.36 1.07 3.13 0.29 3.43 1.11 3.39 1.13 3.61 1.06 3.32 1.06 3.36 1.103.89 0.89 3.86 0.18 3.76 0.89 3.88 1.02 3.93 0.85 3.75 0.94 3.72 0.973.80 0.97 3.84 0.23 3.78 0.97 3.78 0.93 3.89 0.94 3.75 0.95 3.66 0.993.57 0.80 3.58 0.24 3.68 0.75 3.59 0.81 3.93 0.73 3.44 0.77 3.60 0.763.66 1.12 3.62 0.28 3.78 1.06 3.66 1.10 4.11 0.92 3.52 1.12 3.70 1.084.03 0.99 3.95 0.26 4.10 0.97 4.12 0.95 4.23 0.90 3.92 0.95 3.97 0.953.60 1.11 3.44 0.35 3.76 1.03 3.47 1.17 4.12 0.94 3.39 1.05 3.67 1.053.87 1.06 3.78 0.32 4.03 0.89 3.93 1.00 4.15 0.93 3.77 0.89 3.80 0.983.70 0.95 3.79 0.22 3.74 0.87 3.66 1.00 3.99 0.92 3.51 0.97 3.73 0.953.88 0.88 3.91 0.20 3.91 0.80 3.84 0.91 4.10 0.83 3.71 0.85 3.81 0.793.63 1.23 3.57 0.35 3.71 1.18 3.69 1.23 4.04 1.05 3.46 1.17 3.58 1.193.14 1.28 3.46 0.31 3.53 1.19 3.38 1.15 3.85 1.11 3.18 1.18 3.47 1.142.60 1.18 2.69 0.29 2.68 1.19 2.61 1.25 2.81 1.19 2.45 1.21 2.65 1.153.20 0.80 3.30 0.21 3.32 0.79 3.35 0.92 3.36 0.84 3.17 0.85 3.27 0.863.25 1.10 3.38 0.24 3.37 1.13 3.40 1.15 3.47 1.10 3.27 1.14 3.34 1.153.08 1.02 3.09 0.24 3.22 1.06 3.25 1.06 3.24 1.11 3.07 1.04 3.19 1.053.34 1.15 3.37 0.28 3.54 1.11 3.50 1.30 3.77 1.12 3.42 1.16 3.48 1.163.14 1.12 3.18 0.24 3.31 1.06 3.21 1.24 3.28 1.18 3.16 1.14 3.24 1.143.14 1.06 3.14 0.26 3.21 0.97 3.17 1.11 3.23 1.02 3.16 1.10 3.17 1.003.68 0.99 3.73 0.27 3.72 1.01 3.70 1.04 3.90 0.98 3.56 1.08 3.54 1.102.65 1.12 2.98 0.33 2.89 1.10 3.10 1.27 2.93 1.18 2.86 1.14 2.81 1.263.00 1.27 3.16 0.31 3.08 1.23 2.96 1.37 3.13 1.36 3.12 1.27 3.29 1.283.46 1.27 3.62 0.31 3.48 1.27 3.43 1.46 3.78 1.19 3.32 1.31 3.51 1.353.39 1.27 3.46 0.37 3.46 1.22 3.70 1.31 3.28 1.35 3.15 1.36 3.45 1.273.00 1.24 3.24 0.35 3.27 1.17 3.33 1.40 3.09 1.33 2.87 1.33 3.28 1.323.04 1.16 3.12 0.34 3.14 1.18 3.24 1.25 3.19 1.17 2.97 1.24 2.86 1.261.85 1.17 2.49 0.53 1.97 1.23 2.22 1.29 2.05 1.32 2.05 1.28 2.10 1.293.73 1.10 3.83 0.30 3.85 1.10 3.70 1.20 4.04 1.12 3.94 1.09 3.80 1.153.56 1.30 3.69 0.30 3.94 1.18 3.68 1.27 3.91 1.23 3.67 1.26 3.66 1.263.72 1.18 3.84 0.26 3.87 1.12 3.78 1.22 3.94 1.14 3.63 1.16 3.84 1.143.42 1.09 3.59 0.29 3.86 0.99 3.59 1.18 3.78 1.10 3.63 1.08 3.56 1.12
20
University of Arizona COACHE Survey Results for T/TE and C/CE Faculty.

The Collaborative on Academic Careers in Higher Education (COACHE)Faculty Job Satisfaction Survey 2013-14
MEANS AND STANDARD DEVIATIONS
University of Arizona
item short nameBenchmark: Nature of Work Research
Q45B Time spent on researchQ80A Expectations for finding external fundingQ80B Influence over focus of researchQ80C Quality of grad students to support researchQ80D Support for researchQ80E Support for engaging undergrads in researchQ85A Support for obtaining grants (pre-award)Q85B Support for maintaining grants (post-award)Q85C Support for securing grad student assistanceQ85D Support for travel to present/conduct researchQ85E Availability of course release for research
Benchmark: Nature of Work: ServiceQ45C Time spent on serviceQ55B Support for faculty in leadership rolesQ60A Number of committeesQ60B Attractiveness of committeesQ60C Discretion to choose committeesQ60D Equitability of committee assignmentsQ60E Number of student advisees
Benchmark: Nature of Work: TeachingQ45A Time spent on teachingQ70A Number of courses taughtQ70B Level of courses taughtQ70C Discretion over course contentQ70D Number of students in classes taughtQ70E Quality of students taughtQ70H Equitability of distribution of teaching loadQ70I Quality of grad students to support teachingQ45D Time spent on outreachQ45E Time spent on administrative tasksQ55A Ability to balance teaching/research/service
Benchmark: Facilities and work resourcesQ70F Support for improving teachingQ90A OfficeQ90B Laboratory, research, studio spaceQ90C Equipment
by Rank
mean sd mean sd mean sd mean sd mean sd mean sd mean sd2.99 0.66 3.03 0.23 3.22 0.68 3.15 0.75 3.14 0.63 3.16 0.73 3.41 0.733.36 1.18 3.02 0.36 3.33 1.23 3.49 1.23 3.34 1.19 3.22 1.12 3.53 1.083.00 1.01 3.05 0.23 3.04 1.06 3.20 1.07 3.07 0.94 3.10 1.04 3.23 0.994.36 0.78 4.19 0.28 4.30 0.83 4.45 0.76 4.46 0.72 4.20 0.90 4.29 0.963.25 1.13 2.72 0.74 3.47 1.09 3.18 1.06 3.27 1.13 3.25 1.14 3.36 1.152.44 1.10 2.73 0.34 2.91 1.17 2.73 1.22 2.72 1.13 2.86 1.17 3.27 1.182.83 1.04 2.99 0.33 3.41 1.02 3.22 1.03 2.99 1.03 3.18 1.02 3.41 1.082.77 1.10 2.95 0.33 3.09 1.06 3.10 1.10 3.10 1.02 3.37 1.18 3.42 1.062.96 1.14 2.99 0.34 3.19 1.08 3.10 1.14 3.17 1.02 3.16 1.07 3.32 1.162.53 1.04 2.49 0.65 2.82 1.09 2.70 1.14 2.80 0.99 2.85 1.06 3.06 1.002.65 1.22 2.98 0.42 3.05 1.20 2.93 1.29 3.03 1.15 3.00 1.20 3.31 1.152.64 1.14 2.40 0.36 2.63 1.16 2.60 1.21 2.47 1.02 2.66 1.19 3.01 1.243.18 0.78 3.17 0.20 3.14 0.74 3.23 0.88 3.01 0.68 2.99 0.77 3.33 0.743.44 1.00 3.27 0.26 3.31 1.02 3.22 1.12 2.91 0.98 3.17 1.02 3.48 0.962.55 1.24 2.58 0.35 2.74 1.25 2.84 1.38 2.55 1.22 2.60 1.23 2.82 1.243.34 0.96 3.33 0.22 3.27 0.91 3.53 0.93 3.15 0.86 3.11 0.96 3.46 0.893.38 0.96 3.41 0.20 3.32 0.91 3.49 0.95 3.29 0.79 3.16 1.03 3.51 0.913.47 1.04 3.53 0.26 3.34 0.99 3.44 1.09 3.34 0.94 3.21 1.04 3.61 1.032.86 1.18 2.91 0.23 2.80 1.07 2.92 1.27 2.74 1.17 2.62 1.11 3.00 1.153.58 1.00 3.35 0.24 3.40 0.92 3.48 1.04 3.52 0.84 3.58 1.00 3.54 0.973.58 0.66 3.66 0.18 3.71 0.66 3.71 0.65 3.57 0.55 3.61 0.65 3.81 0.623.73 0.96 3.85 0.21 3.80 0.93 3.77 0.95 3.64 0.99 3.76 0.93 3.94 0.873.80 0.96 3.60 0.35 3.83 0.92 3.89 0.87 3.53 1.10 3.75 1.01 3.95 0.933.87 0.94 3.97 0.16 3.96 0.88 4.11 0.74 3.83 0.89 3.86 0.92 4.10 0.774.29 0.86 4.38 0.15 4.28 0.83 4.42 0.80 4.32 0.83 4.32 0.76 4.46 0.723.58 1.12 3.62 0.28 3.65 1.05 3.68 0.97 3.36 1.12 3.71 1.04 3.77 1.063.09 1.07 3.29 0.39 3.66 0.99 3.26 0.91 3.35 1.00 3.25 1.05 3.52 1.032.91 1.18 3.14 0.27 2.91 1.11 3.06 1.34 2.97 1.14 2.76 1.21 3.02 1.133.36 1.17 2.87 0.70 3.52 1.11 3.52 1.05 3.57 0.94 3.43 1.12 3.45 1.133.64 0.87 3.45 0.19 3.58 0.87 3.51 0.76 3.46 0.76 3.41 0.88 3.63 0.852.88 1.02 2.83 0.26 2.72 1.07 2.99 0.98 2.55 0.91 2.78 0.99 3.10 0.983.09 1.27 2.93 0.31 2.97 1.30 3.37 1.24 2.87 1.22 2.92 1.33 3.33 1.253.31 0.68 3.38 0.24 3.60 0.65 3.40 0.65 3.32 0.64 3.38 0.69 3.57 0.693.01 0.98 3.18 0.32 3.40 1.02 3.11 1.04 3.01 1.01 3.32 1.05 3.20 1.033.70 1.04 3.70 0.30 3.87 1.01 3.61 1.11 3.79 0.98 3.60 1.08 3.90 0.993.33 1.13 3.13 0.30 3.55 1.12 3.39 1.16 3.45 1.13 3.05 1.20 3.25 1.203.17 1.09 3.29 0.34 3.53 1.02 3.28 1.09 3.33 0.98 3.35 1.02 3.60 0.97
you peer 1 peer 2Allassociate
peer 4 peer 5peer 3
21
University of Arizona COACHE Survey Results for T/TE and C/CE Faculty.

The Collaborative on Academic Careers in Higher Education (COACHE)Faculty Job Satisfaction Survey 2013-14
MEANS AND STANDARD DEVIATIONS
University of Arizona
item short nameQ90D ClassroomsQ90E Library resourcesQ90F Computing and technical supportQ90H Clerical/administrative support
Benchmark: Personal and family policiesQ95D Housing benefitsQ95E Tuition waivers, remission, or exchangeQ95F Spousal/partner hiring programQ95G ChildcareQ95H EldercareQ95J Family medical/parental leaveQ95K Flexible workload/modified dutiesQ95L Stop-the-clock policiesQ200B Inst. does what it can for work/life compatibilityQ200A Right balance between professional/personal
Benchmark: Health and retirement benefitsQ95A Health benefits for yourselfQ95B Health benefits for familyQ95C Retirement benefitsQ95I Phased retirement optionsQ90G Salary
Benchmark: Interdisciplinary workQ100A Budgets encourage interdiscip. workQ100B Facilities conducive to interdiscip. workQ100C Interdiscip. work is rewarded in meritQ100D Interdiscip. work is rewarded in promotionQ100E Interdiscip. work is rewarded in tenureQ100G Dept. knows how to evaluate interdiscip. work
Benchmark: CollaborationQ105A Opportunities for collab. within dept.Q105E Opportunities for collab. outside dept.Q105D Opportunities for collab. outside inst.
Benchmark: MentoringQ125A Effectiveness of mentoring within dept.Q125B Effectiveness of mentoring outside dept.Q130A Mentoring of pre-tenure facultyQ130B Mentoring of associate faculty
by Rank
mean sd mean sd mean sd mean sd mean sd mean sd mean sdyou peer 1 peer 2All
associatepeer 4 peer 5peer 3
3.25 1.12 3.30 0.32 3.55 1.02 3.19 1.19 3.08 1.03 3.30 1.13 3.36 1.053.87 0.92 3.70 0.37 4.21 0.80 3.74 1.03 3.77 0.89 3.69 1.00 3.82 0.903.17 1.24 3.39 0.36 3.46 1.07 3.58 1.03 3.20 1.10 3.31 1.20 3.76 1.123.02 1.21 3.24 0.34 3.23 1.19 3.18 1.23 2.99 1.17 3.29 1.14 3.50 1.183.20 0.94 2.95 0.26 2.93 0.93 3.07 0.94 3.24 0.83 3.02 0.89 3.20 0.892.06 1.06 2.24 0.45 2.53 0.98 2.66 1.04 3.59 1.09 2.44 0.99 2.63 0.903.91 0.89 2.70 0.69 2.13 1.08 2.41 1.28 1.85 0.81 3.01 1.12 3.09 1.082.80 1.22 2.51 0.41 2.67 1.20 3.20 1.37 3.14 1.26 2.84 1.24 2.65 1.292.42 1.16 2.54 0.62 2.54 0.98 3.04 1.20 2.79 0.86 2.66 1.05 2.38 1.212.78 0.90 2.66 0.58 2.91 0.86 2.73 0.99 2.82 0.72 2.61 0.86 2.85 0.993.47 1.05 3.32 0.34 3.40 1.02 3.22 1.22 3.78 0.86 3.25 1.00 3.55 0.983.52 1.12 3.37 0.31 3.33 1.12 3.33 1.13 3.77 0.88 3.40 1.19 3.49 0.984.50 1.00 2.93 1.22 3.67 0.58 3.67 1.16 N/A N/A N<5 N<5 3.00 0.002.82 1.29 2.91 0.37 2.87 1.18 2.98 1.21 3.03 1.16 2.84 1.27 3.11 1.172.99 1.25 3.16 0.33 2.98 1.26 3.49 1.24 2.89 1.29 3.01 1.34 3.45 1.233.80 0.67 3.50 0.36 4.03 0.67 3.89 0.69 3.85 0.66 3.31 0.88 3.68 0.734.01 0.75 3.64 0.45 4.10 0.78 4.06 0.75 4.03 0.78 3.30 1.05 3.82 0.833.99 0.84 3.49 0.55 4.00 0.88 4.03 0.78 4.00 0.80 3.24 1.07 3.75 0.943.56 0.85 3.47 0.32 4.12 0.81 3.65 0.87 3.63 0.88 3.39 1.03 3.64 0.953.16 0.90 3.18 0.34 3.49 0.81 3.60 0.93 3.36 0.70 3.29 1.03 3.21 0.852.51 1.17 2.73 0.38 2.93 1.20 3.34 1.17 2.79 1.13 2.88 1.16 2.80 1.202.71 0.93 2.53 0.20 2.67 0.99 2.64 1.06 2.55 0.90 2.83 1.01 2.91 1.062.51 1.16 2.39 0.33 2.44 1.18 2.78 1.36 2.50 1.11 2.72 1.22 3.15 1.172.69 1.09 2.54 0.29 2.62 1.21 2.26 1.14 2.56 1.19 2.91 1.28 3.02 1.172.66 1.20 2.47 0.29 2.73 1.17 2.50 1.31 2.42 1.10 2.91 1.25 2.78 1.262.71 1.20 2.53 0.31 2.78 1.16 2.55 1.30 2.41 1.10 2.95 1.21 2.75 1.26N/A N/A N/A N/A N/A N/A N/A N/A N/A N/A N/A N/A N/A N/A2.97 1.24 2.68 0.27 2.76 1.27 3.06 1.37 2.87 1.28 2.72 1.29 2.83 1.343.62 0.80 3.43 0.19 3.48 0.86 3.66 0.86 3.56 0.89 3.54 0.80 3.68 0.883.59 1.13 3.57 0.22 3.42 1.11 3.54 1.15 3.53 1.02 3.46 1.13 3.75 1.093.52 1.02 3.32 0.23 3.40 1.07 3.47 1.08 3.42 1.08 3.50 1.04 3.65 1.043.72 0.97 3.41 0.30 3.63 1.02 3.93 1.07 3.68 1.10 3.67 0.96 3.66 1.012.83 0.90 2.83 0.21 2.87 0.90 2.83 1.05 2.82 0.99 2.71 0.94 2.94 0.973.62 1.26 3.53 0.26 3.43 1.35 3.28 1.28 3.67 1.33 3.18 1.34 3.48 1.353.64 1.03 3.43 0.25 3.73 1.01 3.33 1.20 3.49 1.11 3.34 1.08 3.66 1.093.05 1.29 3.05 0.31 3.20 1.26 3.28 1.31 2.90 1.35 2.98 1.29 3.10 1.352.12 1.15 2.19 0.25 2.14 1.11 2.04 1.20 2.17 1.15 2.15 1.12 2.12 1.14
22
University of Arizona COACHE Survey Results for T/TE and C/CE Faculty.

The Collaborative on Academic Careers in Higher Education (COACHE)Faculty Job Satisfaction Survey 2013-14
MEANS AND STANDARD DEVIATIONS
University of Arizona
item short nameQ130C Support for faculty to be good mentorsQ115 Being a mentor is fulfillingQ120A Importance of mentoring within dept.Q120B Importance of mentoring outside dept.Q120C Importance of mentoring outside inst.Q125C Effectiveness of mentoring outside the inst.
Benchmark: Tenure policiesQ136A Clarity of tenure processQ136B Clarity of tenure criteriaQ136C Clarity of tenure standardsQ136D Clarity of body of evidence for deciding tenureQ136E Clarity of whether I will achieve tenureQ139A Consistency of messages about tenureQ139B Tenure decisions are performance-based
Benchmark: Tenure clarityQ137A Clarity of expectations: ScholarQ137B Clarity of expectations: TeacherQ137C Clarity of expectations: AdvisorQ137D Clarity of expectations: ColleagueQ137E Clarity of expectations: Campus citizenQ137F Clarity of expectations: Broader community
Benchmark: Tenure reasonablenessQ138A Reasonable expectations: ScholarQ138B Reasonable expectations: TeacherQ138C Reasonable expectations: AdvisorQ138D Reasonable expectations: ColleagueQ138E Reasonable expectations: Campus citizenQ138F Reasonable expectations: Community member
Benchmark: PromotionQ135C Reasonable expectations: PromotionQ135B Dept. culture encourages promotionQ140A Clarity of promotion processQ140B Clarity of promotion criteriaQ140C Clarity of promotion standardsQ140D Clarity of body of evidence for promotionQ140E Clarity of time frame for promotionQ140F Clarity of whether I will be promoted
by Rank
mean sd mean sd mean sd mean sd mean sd mean sd mean sdyou peer 1 peer 2All
associatepeer 4 peer 5peer 3
2.24 1.05 2.22 0.30 2.25 1.02 2.25 1.20 2.17 1.05 2.17 1.04 2.39 1.104.15 0.84 4.08 0.16 4.11 0.86 4.06 0.86 4.17 0.87 3.83 0.99 4.17 0.844.26 0.93 4.21 0.15 4.29 0.83 4.02 1.08 4.33 0.85 4.14 1.07 4.26 0.903.72 1.11 3.58 0.21 3.78 0.95 3.48 1.15 3.73 1.05 3.58 1.11 3.68 1.093.88 1.07 3.67 0.30 3.98 0.91 3.92 1.05 4.04 0.93 3.61 1.09 3.75 1.044.06 0.92 3.76 0.37 3.96 0.98 3.94 1.02 3.98 1.05 3.75 0.95 3.83 0.99N/A N/A N/A N/A N/A N/A N/A N/A N/A N/A N/A N/A N/A N/AN/A N/A N/A N/A N/A N/A N/A N/A N/A N/A N/A N/A N/A N/AN/A N/A N/A N/A N/A N/A N/A N/A N/A N/A N/A N/A N/A N/AN/A N/A N/A N/A N/A N/A N/A N/A N/A N/A N/A N/A N/A N/AN/A N/A N/A N/A N/A N/A N/A N/A N/A N/A N/A N/A N/A N/AN/A N/A N/A N/A N/A N/A N/A N/A N/A N/A N/A N/A N/A N/AN/A N/A N/A N/A N/A N/A N/A N/A N/A N/A N/A N/A N/A N/AN/A N/A N/A N/A N/A N/A N/A N/A N/A N/A N/A N/A N/A N/AN/A N/A N/A N/A N/A N/A N/A N/A N/A N/A N/A N/A N/A N/AN/A N/A N/A N/A N/A N/A N/A N/A N/A N/A N/A N/A N/A N/AN/A N/A N/A N/A N/A N/A N/A N/A N/A N/A N/A N/A N/A N/AN/A N/A N/A N/A N/A N/A N/A N/A N/A N/A N/A N/A N/A N/AN/A N/A N/A N/A N/A N/A N/A N/A N/A N/A N/A N/A N/A N/AN/A N/A N/A N/A N/A N/A N/A N/A N/A N/A N/A N/A N/A N/AN/A N/A N/A N/A N/A N/A N/A N/A N/A N/A N/A N/A N/A N/AN/A N/A N/A N/A N/A N/A N/A N/A N/A N/A N/A N/A N/A N/AN/A N/A N/A N/A N/A N/A N/A N/A N/A N/A N/A N/A N/A N/AN/A N/A N/A N/A N/A N/A N/A N/A N/A N/A N/A N/A N/A N/AN/A N/A N/A N/A N/A N/A N/A N/A N/A N/A N/A N/A N/A N/AN/A N/A N/A N/A N/A N/A N/A N/A N/A N/A N/A N/A N/A N/AN/A N/A N/A N/A N/A N/A N/A N/A N/A N/A N/A N/A N/A N/AN/A N/A N/A N/A N/A N/A N/A N/A N/A N/A N/A N/A N/A N/A3.17 1.08 3.25 0.30 3.45 1.00 3.45 1.09 3.81 0.90 3.10 1.03 3.40 1.063.37 1.22 3.30 0.34 3.53 1.25 3.36 1.34 3.86 1.12 3.04 1.32 3.56 1.203.09 1.37 2.98 0.42 3.29 1.45 3.26 1.47 4.23 1.04 3.33 1.32 3.36 1.373.34 1.33 3.51 0.36 3.69 1.21 3.65 1.36 3.87 1.24 3.36 1.32 3.62 1.253.31 1.35 3.46 0.34 3.69 1.21 3.61 1.30 3.86 1.23 3.19 1.26 3.48 1.293.07 1.31 3.24 0.37 3.47 1.22 3.42 1.32 3.36 1.28 2.83 1.28 3.34 1.303.34 1.33 3.45 0.32 3.74 1.17 3.80 1.24 3.96 1.05 3.25 1.24 3.54 1.232.92 1.33 3.07 0.43 3.05 1.24 3.08 1.34 3.79 1.19 2.79 1.28 3.07 1.363.10 1.34 3.09 0.33 3.29 1.30 3.52 1.33 3.64 1.17 3.04 1.33 3.32 1.35
23
University of Arizona COACHE Survey Results for T/TE and C/CE Faculty.

The Collaborative on Academic Careers in Higher Education (COACHE)Faculty Job Satisfaction Survey 2013-14
MEANS AND STANDARD DEVIATIONS
University of Arizona
item short nameQ170A Priorities are stated consistentlyQ170C Priorities are acted on consistentlyQ170D Changed priorities negatively affect my work**
Benchmark: Leadership: SeniorQ180A Pres/Chancellor: Pace of decision makingQ180B Pres/Chancellor: Stated prioritiesQ180C Pres/Chancellor: Communication of prioritiesQ180L CAO: Pace of decision makingQ180M CAO: Stated prioritiesQ180N CAO: Communication of prioritiesQ180O CAO: Ensuring faculty inputQ175C CAO: Support in adapting to change
Benchmark: Leadership: DivisionalQ185D Dean: Pace of decision makingQ185E Dean: Stated prioritiesQ185F Dean: Communication of prioritiesQ185G Dean: Ensuring faculty inputQ175A Dean: Support in adapting to change
Benchmark: Leadership: DepartmentalQ185H Head/Chair: Pace of decision makingQ185I Head/Chair: Stated prioritiesQ185J Head/Chair: Communication of prioritiesQ185K Head/Chair: Ensuring faculty inputQ185L Head/Chair: Fairness in evaluating workQ175B Head/Chair: Support in adapting to change
Benchmark: Departmental collegialityQ200C Colleagues support work/life balanceQ200D Meeting times compatible with personal needsQ205B Amount of personal interaction w/Pre-tenureQ205C How well you fitQ205E Amount of personal interaction w/TenuredQ210A Colleagues pitch in when neededQ210C Dept. is collegialQ212A Colleagues committed to diversity/inclusion
Benchmark: Departmental engagementQ190A Discussions of undergrad student learningQ190B Discussions of grad student learning
by Rank
mean sd mean sd mean sd mean sd mean sd mean sd mean sdyou peer 1 peer 2All
associatepeer 4 peer 5peer 3
2.64 1.24 2.72 0.36 2.69 1.18 2.79 1.19 2.48 1.10 2.63 1.21 2.75 1.202.45 1.11 2.55 0.34 2.56 1.15 2.62 1.13 2.39 1.04 2.53 1.23 2.55 1.142.37 1.26 2.68 0.38 2.71 1.29 2.67 1.32 2.17 1.16 2.42 1.25 2.94 1.233.07 0.84 3.07 0.35 3.17 0.85 3.13 0.86 2.93 0.85 2.66 0.85 2.96 0.863.12 0.89 3.15 0.41 3.26 0.90 3.24 0.90 3.02 1.03 2.68 0.99 3.05 0.872.94 1.11 3.11 0.42 3.23 1.08 3.16 1.04 2.82 1.15 2.52 1.03 3.03 1.003.15 1.09 3.06 0.47 3.23 1.01 3.11 1.07 2.78 1.14 2.43 1.08 2.85 1.053.10 0.95 3.08 0.34 3.11 0.92 3.19 0.86 3.10 0.95 2.91 0.97 3.02 0.973.01 1.03 3.03 0.34 3.06 1.02 3.10 1.02 3.01 1.09 2.76 1.03 2.97 1.053.11 1.06 2.99 0.38 3.11 1.00 3.02 1.05 2.91 1.06 2.67 1.03 2.84 1.10N/A N/A N/A N/A N/A N/A N/A N/A N/A N/A N/A N/A N/A N/AN/A N/A N/A N/A N/A N/A N/A N/A N/A N/A N/A N/A N/A N/A2.97 1.08 3.14 0.31 2.95 1.08 3.25 1.14 2.98 1.06 3.22 1.08 3.23 1.133.00 1.16 3.23 0.30 2.99 1.14 3.38 1.12 3.05 1.11 3.26 1.08 3.33 1.102.97 1.20 3.15 0.31 2.94 1.19 3.30 1.15 3.00 1.14 3.16 1.20 3.31 1.273.00 1.19 3.13 0.34 2.98 1.20 3.25 1.30 2.90 1.18 3.30 1.20 3.21 1.272.93 1.19 3.06 0.32 2.91 1.22 3.08 1.37 2.97 1.24 3.17 1.26 3.08 1.312.30 1.21 2.59 0.39 2.37 1.20 2.46 1.24 2.52 1.25 2.66 1.29 2.61 1.263.52 1.13 3.59 0.26 3.52 1.15 3.70 1.21 3.78 1.03 3.26 1.21 3.60 1.123.53 1.19 3.54 0.29 3.45 1.20 3.76 1.18 3.77 1.10 3.25 1.27 3.58 1.213.43 1.24 3.49 0.27 3.44 1.26 3.57 1.32 3.71 1.10 3.21 1.33 3.48 1.253.52 1.28 3.52 0.27 3.50 1.27 3.71 1.33 3.72 1.20 3.18 1.37 3.46 1.293.53 1.33 3.65 0.31 3.58 1.31 3.72 1.36 3.82 1.23 3.10 1.42 3.59 1.263.71 1.25 3.78 0.28 3.62 1.31 3.77 1.26 4.03 1.02 3.53 1.30 3.81 1.243.22 1.41 3.27 0.39 2.87 1.32 3.41 1.34 3.29 1.23 2.98 1.42 2.89 1.343.67 0.79 3.80 0.17 3.58 0.81 3.63 0.88 3.75 0.72 3.52 0.78 3.79 0.913.29 1.22 3.68 0.30 3.42 1.15 3.56 1.06 3.42 1.14 3.37 1.14 3.74 1.053.93 1.10 4.03 0.22 3.91 1.15 3.91 1.30 4.15 0.95 3.66 1.18 4.01 1.123.62 0.92 3.73 0.18 3.60 0.88 3.79 0.94 3.65 0.96 3.54 0.91 3.82 0.903.54 1.21 3.72 0.28 3.30 1.22 3.44 1.32 3.57 1.15 3.34 1.21 3.63 1.283.64 0.97 3.70 0.20 3.50 0.99 3.64 1.04 3.67 0.96 3.51 0.97 3.69 1.043.62 1.16 3.75 0.29 3.54 1.17 3.54 1.28 3.60 1.17 3.29 1.17 3.64 1.293.89 1.15 3.95 0.27 3.74 1.29 3.71 1.37 4.04 1.13 3.68 1.16 3.90 1.303.85 1.18 3.97 0.23 3.74 1.22 3.57 1.37 3.92 1.07 3.74 1.17 3.91 1.213.38 0.75 3.44 0.16 3.36 0.75 3.41 0.79 3.37 0.76 3.32 0.72 3.55 0.793.37 1.16 3.70 0.43 3.12 1.21 3.06 1.29 3.30 1.15 3.46 1.09 3.30 1.303.58 1.09 2.95 0.76 3.53 1.10 3.68 1.03 3.61 1.07 3.45 1.12 3.79 1.03
24
University of Arizona COACHE Survey Results for T/TE and C/CE Faculty.

The Collaborative on Academic Careers in Higher Education (COACHE)Faculty Job Satisfaction Survey 2013-14
MEANS AND STANDARD DEVIATIONS
University of Arizona
item short nameQ190C Discussions of effective teaching practicesQ190D Discussions of effective use of technologyQ190E Discussions of current research methodsQ205A Amount of professional interaction w/Pre-tenureQ205D Amount of professional interaction w/Tenured
Benchmark: Departmental qualityQ195A Intellectual vitality of tenured facultyQ195B Intellectual vitality of pre-tenure facultyQ195C Scholarly productivity of tenured facultyQ195D Scholarly productivity of pre-tenure facultyQ195G Teaching effectiveness of tenured facultyQ195H Teaching effectiveness of pre-tenure facultyQ240B Dept. is successful at faculty recruitmentQ240C Dept. is successful at faculty retentionQ240D Dept. addresses sub-standard performance
Benchmark: Appreciation and recognitionQ215A Recognition: For teachingQ215B Recognition: For advisingQ215C Recognition: For scholarshipQ215D Recognition: For serviceQ215E Recognition: For outreachQ215I Recognition: From colleaguesQ215J Recognition: From CAOQ215K Recognition: From DeanQ215L Recognition: From Head/ChairQ220A School/college is valued by Pres/ProvostQ220B Dept. is valued by Pres/ProvostQ245A CAO cares about faculty of my rankQ240A Outside offers are necessary in negotiationsQ212B Visible leadership for support of diversityQ245D I would again choose this institutionQ250A Department as a place to workQ250B Institution as a place to work
by Rank
mean sd mean sd mean sd mean sd mean sd mean sd mean sdyou peer 1 peer 2All
associatepeer 4 peer 5peer 3
3.17 1.13 3.49 0.24 3.21 1.06 3.13 1.04 3.10 1.03 3.14 0.98 3.40 1.073.10 1.09 3.28 0.25 3.13 1.06 3.10 1.07 2.94 1.08 2.96 0.93 3.31 1.043.11 1.12 3.05 0.29 3.30 1.14 3.30 1.13 3.18 1.19 3.14 1.12 3.44 1.163.78 0.86 3.82 0.17 3.72 0.87 3.92 0.93 3.77 0.95 3.60 0.94 3.90 0.953.69 0.96 3.75 0.23 3.56 1.00 3.64 1.12 3.71 1.04 3.53 1.00 3.73 1.113.42 0.77 3.50 0.22 3.55 0.76 3.50 0.78 3.80 0.67 3.34 0.74 3.62 0.763.58 1.13 3.53 0.28 3.61 1.07 3.60 1.12 3.94 0.97 3.33 1.10 3.70 1.083.92 0.94 3.95 0.23 4.02 0.92 4.11 0.84 4.20 0.81 3.95 0.85 4.05 0.893.54 1.09 3.35 0.31 3.62 1.06 3.55 1.05 3.95 0.98 3.25 1.06 3.68 1.043.86 0.90 3.78 0.25 3.94 0.90 3.89 0.88 4.19 0.76 3.86 0.86 3.96 0.863.60 0.97 3.64 0.24 3.55 0.98 3.47 1.04 3.84 0.86 3.47 1.02 3.71 0.963.83 0.84 3.83 0.20 3.85 0.77 3.70 0.92 4.05 0.74 3.68 0.90 3.84 0.863.39 1.17 3.49 0.36 3.52 1.19 3.53 1.26 3.83 1.13 3.24 1.25 3.65 1.212.75 1.21 3.33 0.32 3.30 1.23 3.02 1.25 3.53 1.12 2.99 1.20 3.32 1.272.49 1.09 2.59 0.28 2.54 1.16 2.53 1.12 2.62 1.09 2.35 1.10 2.73 1.243.08 0.77 3.17 0.22 3.09 0.77 3.11 0.89 3.11 0.70 2.97 0.81 3.25 0.753.13 1.10 3.23 0.29 3.16 1.11 3.15 1.21 3.10 1.04 3.06 1.11 3.32 1.102.98 1.07 2.93 0.30 2.96 1.04 2.83 1.12 2.98 1.01 2.75 1.05 3.10 1.063.21 1.12 3.19 0.30 3.27 1.09 3.30 1.15 3.38 1.05 3.18 1.08 3.37 1.033.06 1.11 2.99 0.28 2.99 1.12 3.05 1.22 2.88 1.08 2.78 1.10 3.06 1.123.07 1.11 2.95 0.25 2.98 1.02 2.93 1.06 2.78 0.99 2.85 1.02 3.13 0.953.54 1.11 3.63 0.24 3.52 1.06 3.44 1.13 3.68 1.04 3.41 1.08 3.59 1.052.61 1.01 2.84 0.30 2.78 0.94 2.70 1.05 2.74 0.96 2.67 1.02 2.78 1.052.81 1.20 3.06 0.28 2.87 1.18 2.91 1.24 3.04 1.10 3.07 1.20 3.16 1.143.45 1.23 3.57 0.26 3.37 1.27 3.36 1.17 3.72 1.03 3.30 1.28 3.57 1.183.16 1.25 3.42 0.40 3.09 1.26 3.49 1.25 3.15 1.27 2.93 1.34 3.53 1.182.88 1.16 3.13 0.39 2.98 1.24 3.05 1.38 2.86 1.28 2.70 1.27 3.21 1.212.75 1.18 3.05 0.40 3.04 1.10 2.76 1.22 2.85 1.10 2.70 1.13 2.96 1.181.96 1.32 2.41 0.54 2.00 1.29 2.06 1.28 1.67 1.07 1.96 1.17 2.10 1.263.45 1.27 3.70 0.27 3.67 1.25 3.26 1.37 3.56 1.18 3.81 1.15 3.87 1.153.34 1.24 3.61 0.33 3.62 1.24 3.50 1.29 3.82 1.10 3.43 1.34 3.68 1.203.59 1.11 3.74 0.25 3.53 1.21 3.62 1.25 3.80 1.03 3.54 1.12 3.78 1.133.27 1.06 3.50 0.33 3.60 1.06 3.54 1.06 3.70 0.91 3.38 1.09 3.63 1.03
25
University of Arizona COACHE Survey Results for T/TE and C/CE Faculty.

The Collaborative on Academic Careers in Higher Education (COACHE)Faculty Job Satisfaction Survey 2013-14
MEANS AND STANDARD DEVIATIONS
University of Arizona
item short nameBenchmark: Nature of Work Research
Q45B Time spent on researchQ80A Expectations for finding external fundingQ80B Influence over focus of researchQ80C Quality of grad students to support researchQ80D Support for researchQ80E Support for engaging undergrads in researchQ85A Support for obtaining grants (pre-award)Q85B Support for maintaining grants (post-award)Q85C Support for securing grad student assistanceQ85D Support for travel to present/conduct researchQ85E Availability of course release for research
Benchmark: Nature of Work: ServiceQ45C Time spent on serviceQ55B Support for faculty in leadership rolesQ60A Number of committeesQ60B Attractiveness of committeesQ60C Discretion to choose committeesQ60D Equitability of committee assignmentsQ60E Number of student advisees
Benchmark: Nature of Work: TeachingQ45A Time spent on teachingQ70A Number of courses taughtQ70B Level of courses taughtQ70C Discretion over course contentQ70D Number of students in classes taughtQ70E Quality of students taughtQ70H Equitability of distribution of teaching loadQ70I Quality of grad students to support teachingQ45D Time spent on outreachQ45E Time spent on administrative tasksQ55A Ability to balance teaching/research/service
Benchmark: Facilities and work resourcesQ70F Support for improving teachingQ90A OfficeQ90B Laboratory, research, studio spaceQ90C Equipment
by Sex
mean sd mean sd mean sd mean sd mean sd mean sd mean sd3.17 0.70 3.18 0.23 3.46 0.66 3.36 0.68 3.28 0.72 3.34 0.70 3.43 0.773.63 1.17 3.35 0.38 3.84 1.05 3.83 1.10 3.86 1.13 3.68 1.06 3.79 1.063.19 1.00 3.18 0.19 3.32 0.99 3.39 0.97 3.25 1.01 3.24 1.03 3.34 1.024.40 0.75 4.28 0.26 4.42 0.80 4.53 0.68 4.49 0.74 4.32 0.89 4.31 0.923.39 1.10 2.96 0.52 3.70 1.00 3.38 1.04 3.60 1.08 3.40 1.08 3.32 1.142.54 1.14 2.84 0.32 3.11 1.17 2.75 1.18 2.72 1.20 2.93 1.17 3.18 1.182.91 1.04 3.08 0.29 3.46 1.02 3.29 1.04 2.98 1.08 3.25 1.03 3.43 1.062.95 1.10 3.09 0.30 3.26 1.04 3.17 1.12 3.03 1.17 3.60 1.14 3.31 1.143.17 1.13 3.08 0.31 3.35 1.06 3.17 1.06 3.12 1.16 3.29 1.06 3.26 1.142.76 1.08 2.69 0.42 3.10 1.04 3.14 1.05 2.88 1.07 2.96 1.05 3.09 1.082.86 1.25 3.11 0.38 3.23 1.17 3.20 1.21 3.19 1.15 3.14 1.22 3.34 1.172.86 1.11 2.59 0.37 3.04 1.05 2.94 1.21 2.68 1.10 2.88 1.16 3.12 1.253.28 0.78 3.31 0.17 3.40 0.72 3.46 0.79 3.32 0.72 3.17 0.81 3.43 0.793.55 0.98 3.41 0.22 3.57 0.93 3.54 0.96 3.39 1.04 3.36 1.00 3.61 0.952.76 1.25 2.79 0.30 3.10 1.22 3.15 1.36 2.74 1.27 2.81 1.30 2.95 1.273.43 0.91 3.47 0.21 3.53 0.89 3.64 0.93 3.45 0.85 3.34 0.93 3.57 0.873.37 0.94 3.45 0.18 3.42 0.96 3.54 0.88 3.46 0.89 3.28 1.01 3.49 0.963.43 1.09 3.58 0.23 3.54 0.92 3.58 0.95 3.65 0.94 3.28 1.05 3.66 1.003.07 1.18 3.15 0.19 3.21 1.02 3.23 1.19 3.19 1.11 2.94 1.14 3.20 1.123.77 0.88 3.50 0.24 3.72 0.80 3.84 0.93 3.80 0.79 3.73 0.90 3.69 0.913.74 0.62 3.72 0.17 3.87 0.64 3.81 0.64 3.80 0.59 3.72 0.65 3.82 0.683.95 0.88 3.96 0.18 3.98 0.85 3.95 0.86 3.92 0.86 3.93 0.91 4.07 0.843.94 0.89 3.69 0.31 3.99 0.82 3.96 0.92 3.85 0.96 3.90 0.96 3.96 0.934.03 0.80 4.01 0.16 4.09 0.83 4.10 0.81 4.02 0.80 4.06 0.81 4.12 0.814.37 0.76 4.41 0.13 4.39 0.75 4.43 0.77 4.44 0.76 4.36 0.82 4.43 0.753.76 1.03 3.69 0.26 3.87 0.95 3.84 1.01 3.60 1.09 3.79 1.04 3.82 1.043.20 1.04 3.24 0.39 3.67 0.97 3.25 0.99 3.51 0.98 3.34 1.04 3.46 1.073.07 1.18 3.33 0.22 3.20 1.10 3.33 1.21 3.25 1.14 2.97 1.23 3.25 1.193.38 1.18 3.02 0.62 3.71 1.05 3.50 1.11 3.75 0.93 3.45 1.08 3.42 1.123.70 0.85 3.51 0.17 3.62 0.85 3.58 0.77 3.54 0.85 3.56 0.87 3.65 0.852.91 1.06 2.92 0.23 2.92 1.02 3.11 1.04 2.68 1.07 2.89 1.04 3.13 1.043.48 1.23 3.33 0.29 3.60 1.17 3.76 1.14 3.43 1.25 3.38 1.28 3.67 1.203.43 0.66 3.42 0.24 3.68 0.63 3.55 0.70 3.37 0.72 3.50 0.70 3.53 0.722.93 1.01 3.21 0.28 3.49 0.96 3.29 1.02 3.05 1.04 3.35 1.06 3.23 1.043.79 0.99 3.73 0.24 3.99 0.92 3.81 1.05 3.61 1.09 3.72 1.05 3.86 1.013.42 1.06 3.20 0.32 3.66 1.11 3.73 1.03 3.41 1.15 3.22 1.20 3.27 1.253.31 1.03 3.34 0.29 3.65 0.93 3.46 1.02 3.27 1.09 3.41 1.04 3.46 1.05
peer 2 peer 3 peer 4 peer 5men
you peer 1All
26
University of Arizona COACHE Survey Results for T/TE and C/CE Faculty.

The Collaborative on Academic Careers in Higher Education (COACHE)Faculty Job Satisfaction Survey 2013-14
MEANS AND STANDARD DEVIATIONS
University of Arizona
item short nameQ90D ClassroomsQ90E Library resourcesQ90F Computing and technical supportQ90H Clerical/administrative support
Benchmark: Personal and family policiesQ95D Housing benefitsQ95E Tuition waivers, remission, or exchangeQ95F Spousal/partner hiring programQ95G ChildcareQ95H EldercareQ95J Family medical/parental leaveQ95K Flexible workload/modified dutiesQ95L Stop-the-clock policiesQ200B Inst. does what it can for work/life compatibilityQ200A Right balance between professional/personal
Benchmark: Health and retirement benefitsQ95A Health benefits for yourselfQ95B Health benefits for familyQ95C Retirement benefitsQ95I Phased retirement optionsQ90G Salary
Benchmark: Interdisciplinary workQ100A Budgets encourage interdiscip. workQ100B Facilities conducive to interdiscip. workQ100C Interdiscip. work is rewarded in meritQ100D Interdiscip. work is rewarded in promotionQ100E Interdiscip. work is rewarded in tenureQ100G Dept. knows how to evaluate interdiscip. work
Benchmark: CollaborationQ105A Opportunities for collab. within dept.Q105E Opportunities for collab. outside dept.Q105D Opportunities for collab. outside inst.
Benchmark: MentoringQ125A Effectiveness of mentoring within dept.Q125B Effectiveness of mentoring outside dept.Q130A Mentoring of pre-tenure facultyQ130B Mentoring of associate faculty
by Sex
mean sd mean sd mean sd mean sd mean sd mean sd mean sdpeer 2 peer 3 peer 4 peer 5men
you peer 1All
3.39 0.99 3.34 0.31 3.62 0.95 3.44 1.10 3.17 1.07 3.48 1.08 3.38 1.043.89 0.89 3.65 0.38 4.15 0.77 3.78 1.00 3.96 0.86 3.81 0.93 3.81 0.883.29 1.12 3.42 0.35 3.51 1.04 3.67 1.03 3.37 1.12 3.48 1.15 3.63 1.093.26 1.20 3.33 0.33 3.37 1.11 3.23 1.26 3.03 1.21 3.45 1.13 3.50 1.193.30 0.88 3.04 0.27 3.16 0.85 3.13 0.89 3.16 0.84 3.17 0.82 3.23 0.852.29 0.96 2.30 0.40 2.68 0.95 2.35 0.93 3.35 1.16 2.71 0.99 2.65 0.953.84 0.92 2.71 0.73 2.20 1.01 2.28 1.08 1.84 0.95 3.08 1.08 3.16 1.092.95 1.16 2.57 0.34 2.85 1.13 2.88 1.29 3.04 1.24 2.79 1.21 2.77 1.112.68 0.98 2.69 0.42 2.79 0.95 3.00 1.04 2.71 0.91 2.86 0.96 2.60 1.002.86 0.78 2.79 0.26 2.96 0.82 2.96 0.75 2.85 0.75 2.85 0.87 3.01 0.813.60 0.87 3.39 0.29 3.67 0.82 3.36 1.00 3.63 0.79 3.44 0.95 3.55 0.853.66 0.92 3.46 0.28 3.72 0.94 3.50 0.96 3.60 0.88 3.54 1.07 3.62 0.913.67 1.15 3.43 0.47 3.84 1.07 3.69 1.05 3.84 0.85 3.75 1.11 3.48 0.892.92 1.21 3.06 0.28 3.22 1.11 3.30 1.17 3.17 1.16 2.99 1.18 3.16 1.183.30 1.29 3.44 0.24 3.49 1.26 3.78 1.10 3.36 1.30 3.35 1.28 3.53 1.273.76 0.68 3.51 0.35 4.02 0.66 3.93 0.71 3.81 0.75 3.34 0.86 3.63 0.773.99 0.78 3.65 0.43 4.13 0.75 4.12 0.77 3.96 0.86 3.31 1.04 3.77 0.853.96 0.84 3.51 0.54 4.04 0.83 4.06 0.80 3.92 0.90 3.28 1.05 3.74 0.893.58 0.86 3.48 0.32 4.09 0.85 3.82 0.85 3.88 0.95 3.47 1.02 3.58 1.013.13 0.92 3.18 0.30 3.67 0.88 3.34 1.09 2.94 0.97 3.29 0.98 3.27 0.992.91 1.27 2.92 0.42 3.29 1.19 3.65 1.10 3.28 1.20 3.10 1.23 3.05 1.272.86 0.92 2.67 0.23 2.87 0.95 2.88 1.05 2.89 0.93 2.89 1.05 2.95 0.972.58 1.13 2.53 0.31 2.64 1.17 2.86 1.23 2.67 1.12 2.81 1.22 3.00 1.142.84 1.11 2.64 0.26 2.84 1.14 2.59 1.23 2.86 1.14 3.02 1.26 3.01 1.132.81 1.14 2.60 0.28 2.91 1.14 2.78 1.27 2.88 1.17 2.88 1.23 2.86 1.142.91 1.15 2.62 0.28 2.92 1.12 2.83 1.19 2.86 1.15 2.94 1.21 2.83 1.152.86 1.07 2.83 0.49 3.00 1.29 3.08 1.35 2.90 1.24 2.91 1.27 3.06 1.313.08 1.27 2.84 0.28 3.00 1.20 3.19 1.31 3.12 1.25 2.76 1.29 2.97 1.273.74 0.79 3.56 0.19 3.76 0.82 3.76 0.83 3.88 0.82 3.69 0.82 3.70 0.903.75 1.05 3.67 0.17 3.74 1.08 3.75 1.06 3.85 1.03 3.60 1.14 3.71 1.143.60 1.02 3.41 0.21 3.64 1.03 3.57 1.06 3.74 1.05 3.64 1.07 3.62 1.093.87 0.92 3.57 0.31 3.89 0.96 3.95 0.97 4.04 0.89 3.83 0.95 3.77 1.023.01 0.99 2.99 0.20 3.15 0.98 3.13 1.03 3.03 0.92 3.03 0.98 3.03 1.013.54 1.25 3.55 0.19 3.62 1.25 3.42 1.20 3.62 1.18 3.38 1.28 3.54 1.263.46 1.02 3.29 0.22 3.50 1.05 3.40 0.98 3.37 1.04 3.26 1.01 3.35 1.113.13 1.30 3.16 0.29 3.47 1.25 3.46 1.26 3.17 1.27 3.24 1.31 3.17 1.322.59 1.22 2.52 0.28 2.61 1.15 2.64 1.25 2.60 1.17 2.74 1.24 2.48 1.16
27
University of Arizona COACHE Survey Results for T/TE and C/CE Faculty.

The Collaborative on Academic Careers in Higher Education (COACHE)Faculty Job Satisfaction Survey 2013-14
MEANS AND STANDARD DEVIATIONS
University of Arizona
item short nameQ130C Support for faculty to be good mentorsQ115 Being a mentor is fulfillingQ120A Importance of mentoring within dept.Q120B Importance of mentoring outside dept.Q120C Importance of mentoring outside inst.Q125C Effectiveness of mentoring outside the inst.
Benchmark: Tenure policiesQ136A Clarity of tenure processQ136B Clarity of tenure criteriaQ136C Clarity of tenure standardsQ136D Clarity of body of evidence for deciding tenureQ136E Clarity of whether I will achieve tenureQ139A Consistency of messages about tenureQ139B Tenure decisions are performance-based
Benchmark: Tenure clarityQ137A Clarity of expectations: ScholarQ137B Clarity of expectations: TeacherQ137C Clarity of expectations: AdvisorQ137D Clarity of expectations: ColleagueQ137E Clarity of expectations: Campus citizenQ137F Clarity of expectations: Broader community
Benchmark: Tenure reasonablenessQ138A Reasonable expectations: ScholarQ138B Reasonable expectations: TeacherQ138C Reasonable expectations: AdvisorQ138D Reasonable expectations: ColleagueQ138E Reasonable expectations: Campus citizenQ138F Reasonable expectations: Community member
Benchmark: PromotionQ135C Reasonable expectations: PromotionQ135B Dept. culture encourages promotionQ140A Clarity of promotion processQ140B Clarity of promotion criteriaQ140C Clarity of promotion standardsQ140D Clarity of body of evidence for promotionQ140E Clarity of time frame for promotionQ140F Clarity of whether I will be promoted
by Sex
mean sd mean sd mean sd mean sd mean sd mean sd mean sdpeer 2 peer 3 peer 4 peer 5men
you peer 1All
2.38 1.07 2.35 0.27 2.54 1.05 2.45 1.14 2.42 1.04 2.50 1.14 2.48 1.134.19 0.86 4.08 0.20 4.08 0.89 4.02 0.88 4.30 0.79 3.95 0.98 4.04 0.934.10 1.01 4.06 0.15 4.04 0.98 3.95 1.09 3.97 1.07 4.07 1.06 4.09 1.033.48 1.10 3.37 0.21 3.39 1.03 3.25 1.12 3.32 1.09 3.38 1.10 3.40 1.143.64 1.07 3.45 0.24 3.55 1.05 3.59 1.07 3.57 1.04 3.43 1.10 3.55 1.043.82 0.97 3.67 0.25 3.81 1.01 3.72 0.93 3.78 0.91 3.58 0.99 3.63 1.093.28 1.08 3.55 0.36 3.82 0.96 3.74 0.98 3.64 0.90 3.41 1.02 3.40 1.083.28 1.32 3.72 0.42 3.96 1.13 3.92 1.22 3.88 1.08 3.51 1.27 3.54 1.283.29 1.27 3.69 0.40 3.95 1.05 3.85 1.16 3.83 1.20 3.48 1.18 3.41 1.222.93 1.41 3.34 0.41 3.71 1.17 3.54 1.16 3.34 1.33 3.19 1.25 3.16 1.313.62 1.19 3.68 0.39 3.95 1.03 3.74 1.21 4.07 0.88 3.65 1.14 3.52 1.273.39 1.15 3.60 0.37 3.83 1.12 3.70 1.10 3.32 1.37 3.43 1.13 3.51 1.312.79 1.36 3.17 0.42 3.39 1.45 3.47 1.27 3.25 1.35 3.16 1.36 3.00 1.453.68 1.23 3.62 0.43 3.90 1.18 3.95 1.17 3.87 1.36 3.54 1.25 3.65 1.263.16 0.95 3.39 0.31 3.61 1.03 3.71 0.92 3.46 0.90 3.32 0.95 3.32 1.073.72 1.27 3.75 0.44 4.12 1.14 4.29 0.97 3.98 1.06 3.79 1.14 3.75 1.243.57 1.17 3.89 0.35 3.97 1.15 4.02 0.90 3.78 1.17 3.73 1.03 3.78 1.243.07 1.15 3.36 0.38 3.65 1.22 3.71 1.09 3.27 1.12 3.41 1.20 3.27 1.383.10 1.19 3.32 0.33 3.57 1.23 3.59 1.11 3.61 1.18 3.19 1.22 3.28 1.272.76 1.18 3.11 0.39 3.21 1.21 3.29 1.25 3.22 1.19 2.91 1.23 2.97 1.232.81 1.15 2.91 0.36 3.14 1.22 3.21 1.25 2.93 1.19 2.85 1.27 2.77 1.293.70 0.76 3.87 0.23 4.02 0.81 4.01 0.97 3.96 0.77 3.77 0.79 3.91 0.773.76 1.04 3.94 0.36 4.15 1.15 4.07 1.15 3.98 1.00 3.73 1.05 3.98 1.093.91 0.90 4.13 0.26 4.30 0.94 4.23 0.95 4.08 1.07 3.92 1.00 4.23 0.843.71 0.86 3.90 0.27 4.28 0.90 4.08 1.00 4.21 0.99 3.82 0.94 4.10 0.933.70 0.85 3.89 0.24 3.93 1.14 4.00 1.03 4.03 1.09 3.81 0.97 3.83 1.033.57 0.86 3.73 0.27 3.74 0.87 3.92 1.00 3.90 0.98 3.65 0.99 3.72 0.903.60 0.84 3.62 0.24 3.72 0.92 3.82 1.01 3.78 0.96 3.68 1.00 3.57 0.953.78 1.01 3.67 0.32 4.00 0.86 3.89 0.98 4.17 0.87 3.66 1.06 3.77 0.993.91 1.12 3.73 0.32 4.09 1.05 3.93 1.20 4.24 1.04 3.71 1.33 3.93 1.093.74 1.29 3.53 0.43 3.95 1.22 3.88 1.27 4.49 0.86 3.97 1.21 3.68 1.273.93 1.18 3.85 0.34 4.20 1.00 4.05 1.16 4.17 1.10 3.84 1.20 3.98 1.143.87 1.17 3.79 0.34 4.16 1.01 4.03 1.14 4.13 1.11 3.65 1.27 3.85 1.183.64 1.21 3.58 0.35 3.95 1.07 3.77 1.25 3.79 1.20 3.33 1.32 3.64 1.223.92 1.14 3.77 0.32 4.17 1.03 4.09 1.04 4.20 1.10 3.72 1.21 3.91 1.143.61 1.26 3.56 0.40 3.60 1.19 3.54 1.29 4.25 0.99 3.45 1.28 3.51 1.323.25 1.33 3.16 0.38 3.50 1.18 3.64 1.24 3.84 1.00 3.16 1.36 3.42 1.32
28
University of Arizona COACHE Survey Results for T/TE and C/CE Faculty.

The Collaborative on Academic Careers in Higher Education (COACHE)Faculty Job Satisfaction Survey 2013-14
MEANS AND STANDARD DEVIATIONS
University of Arizona
item short nameQ170A Priorities are stated consistentlyQ170C Priorities are acted on consistentlyQ170D Changed priorities negatively affect my work**
Benchmark: Leadership: SeniorQ180A Pres/Chancellor: Pace of decision makingQ180B Pres/Chancellor: Stated prioritiesQ180C Pres/Chancellor: Communication of prioritiesQ180L CAO: Pace of decision makingQ180M CAO: Stated prioritiesQ180N CAO: Communication of prioritiesQ180O CAO: Ensuring faculty inputQ175C CAO: Support in adapting to change
Benchmark: Leadership: DivisionalQ185D Dean: Pace of decision makingQ185E Dean: Stated prioritiesQ185F Dean: Communication of prioritiesQ185G Dean: Ensuring faculty inputQ175A Dean: Support in adapting to change
Benchmark: Leadership: DepartmentalQ185H Head/Chair: Pace of decision makingQ185I Head/Chair: Stated prioritiesQ185J Head/Chair: Communication of prioritiesQ185K Head/Chair: Ensuring faculty inputQ185L Head/Chair: Fairness in evaluating workQ175B Head/Chair: Support in adapting to change
Benchmark: Departmental collegialityQ200C Colleagues support work/life balanceQ200D Meeting times compatible with personal needsQ205B Amount of personal interaction w/Pre-tenureQ205C How well you fitQ205E Amount of personal interaction w/TenuredQ210A Colleagues pitch in when neededQ210C Dept. is collegialQ212A Colleagues committed to diversity/inclusion
Benchmark: Departmental engagementQ190A Discussions of undergrad student learningQ190B Discussions of grad student learning
by Sex
mean sd mean sd mean sd mean sd mean sd mean sd mean sdpeer 2 peer 3 peer 4 peer 5men
you peer 1All
2.66 1.20 2.81 0.35 2.90 1.15 3.12 1.20 2.60 1.18 2.70 1.20 2.64 1.172.44 1.12 2.65 0.34 2.73 1.16 2.94 1.18 2.48 1.16 2.58 1.15 2.57 1.162.43 1.23 2.78 0.40 2.95 1.30 3.16 1.33 2.62 1.34 2.53 1.26 2.95 1.312.95 0.90 3.11 0.30 3.23 0.84 3.30 1.02 3.04 0.92 2.68 0.88 2.88 0.992.99 0.95 3.20 0.36 3.34 0.94 3.29 1.11 3.08 1.07 2.64 1.02 3.00 1.022.86 1.10 3.14 0.40 3.29 1.04 3.37 1.07 3.02 1.17 2.51 1.03 3.01 1.103.05 1.08 3.11 0.41 3.26 1.00 3.33 1.16 2.95 1.17 2.44 1.09 2.83 1.122.99 1.01 3.12 0.30 3.18 0.94 3.25 1.10 3.15 1.04 2.95 1.01 2.89 1.142.88 1.08 3.06 0.29 3.13 1.02 3.27 1.15 3.08 1.07 2.83 1.06 2.82 1.192.96 1.08 3.04 0.31 3.11 1.02 3.22 1.19 3.02 1.12 2.76 1.10 2.73 1.20N/A N/A N/A N/A N/A N/A N/A N/A N/A N/A N/A N/A N/A N/AN/A N/A N/A N/A N/A N/A N/A N/A N/A N/A N/A N/A N/A N/A2.92 1.08 3.22 0.30 3.11 1.06 3.37 1.12 3.05 1.17 3.20 1.14 3.30 1.172.99 1.17 3.31 0.29 3.14 1.12 3.44 1.16 3.14 1.21 3.28 1.13 3.46 1.152.95 1.18 3.21 0.30 3.08 1.18 3.41 1.17 3.06 1.25 3.13 1.22 3.40 1.282.90 1.21 3.22 0.31 3.13 1.16 3.42 1.19 3.00 1.27 3.24 1.27 3.27 1.292.84 1.23 3.15 0.33 3.08 1.16 3.23 1.25 3.03 1.33 3.16 1.30 3.12 1.312.57 1.34 2.66 0.45 2.59 1.29 2.61 1.24 2.51 1.34 2.59 1.29 2.70 1.443.52 1.18 3.70 0.22 3.66 1.08 3.80 1.17 3.86 1.07 3.28 1.19 3.61 1.193.44 1.24 3.65 0.24 3.65 1.17 3.83 1.21 3.88 1.09 3.23 1.26 3.61 1.223.40 1.27 3.58 0.24 3.55 1.22 3.70 1.27 3.77 1.15 3.24 1.32 3.50 1.323.47 1.32 3.61 0.23 3.61 1.23 3.75 1.29 3.79 1.22 3.22 1.37 3.51 1.333.57 1.36 3.75 0.26 3.70 1.25 3.76 1.32 3.88 1.26 3.22 1.39 3.62 1.313.77 1.25 3.90 0.24 3.82 1.19 3.99 1.19 4.11 1.13 3.51 1.32 3.79 1.283.17 1.44 3.27 0.36 3.06 1.39 3.17 1.46 3.30 1.29 3.03 1.38 2.85 1.483.74 0.78 3.87 0.16 3.75 0.78 3.80 0.79 3.87 0.72 3.60 0.80 3.73 0.853.47 1.12 3.76 0.21 3.65 1.06 3.67 1.02 3.66 1.05 3.47 1.08 3.68 1.054.08 1.03 4.09 0.16 4.07 1.01 4.12 1.05 4.16 1.01 3.86 1.09 3.99 1.053.64 0.90 3.73 0.14 3.58 0.93 3.71 0.97 3.63 0.93 3.56 0.95 3.59 0.943.57 1.21 3.83 0.23 3.54 1.25 3.74 1.16 3.71 1.14 3.46 1.25 3.65 1.243.62 0.96 3.71 0.20 3.61 0.98 3.62 0.99 3.71 0.95 3.53 0.99 3.57 0.993.68 1.14 3.85 0.23 3.74 1.09 3.70 1.19 3.82 1.10 3.43 1.22 3.66 1.183.90 1.21 4.00 0.23 3.92 1.16 3.91 1.17 4.08 1.14 3.65 1.27 3.82 1.303.95 1.09 4.04 0.20 3.96 1.02 4.04 1.11 4.19 0.98 3.84 1.11 3.93 1.123.43 0.74 3.46 0.14 3.40 0.80 3.41 0.73 3.53 0.70 3.43 0.73 3.43 0.793.29 1.15 3.67 0.35 3.09 1.25 3.16 1.20 3.34 1.16 3.47 1.08 3.21 1.243.62 1.03 2.98 0.75 3.52 1.12 3.67 1.03 3.70 1.00 3.60 1.05 3.69 1.12
29
University of Arizona COACHE Survey Results for T/TE and C/CE Faculty.

The Collaborative on Academic Careers in Higher Education (COACHE)Faculty Job Satisfaction Survey 2013-14
MEANS AND STANDARD DEVIATIONS
University of Arizona
item short nameQ190C Discussions of effective teaching practicesQ190D Discussions of effective use of technologyQ190E Discussions of current research methodsQ205A Amount of professional interaction w/Pre-tenureQ205D Amount of professional interaction w/Tenured
Benchmark: Departmental qualityQ195A Intellectual vitality of tenured facultyQ195B Intellectual vitality of pre-tenure facultyQ195C Scholarly productivity of tenured facultyQ195D Scholarly productivity of pre-tenure facultyQ195G Teaching effectiveness of tenured facultyQ195H Teaching effectiveness of pre-tenure facultyQ240B Dept. is successful at faculty recruitmentQ240C Dept. is successful at faculty retentionQ240D Dept. addresses sub-standard performance
Benchmark: Appreciation and recognitionQ215A Recognition: For teachingQ215B Recognition: For advisingQ215C Recognition: For scholarshipQ215D Recognition: For serviceQ215E Recognition: For outreachQ215I Recognition: From colleaguesQ215J Recognition: From CAOQ215K Recognition: From DeanQ215L Recognition: From Head/ChairQ220A School/college is valued by Pres/ProvostQ220B Dept. is valued by Pres/ProvostQ245A CAO cares about faculty of my rankQ240A Outside offers are necessary in negotiationsQ212B Visible leadership for support of diversityQ245D I would again choose this institutionQ250A Department as a place to workQ250B Institution as a place to work
by Sex
mean sd mean sd mean sd mean sd mean sd mean sd mean sdpeer 2 peer 3 peer 4 peer 5men
you peer 1All
3.15 1.04 3.45 0.24 3.18 1.05 3.06 1.00 3.30 1.02 3.19 1.01 3.22 1.043.15 1.03 3.29 0.23 3.12 1.05 3.00 0.99 3.14 1.00 3.13 1.00 3.12 1.053.31 1.12 3.12 0.31 3.44 1.14 3.38 1.08 3.56 1.08 3.27 1.11 3.34 1.153.81 0.90 3.84 0.14 3.74 0.92 3.85 0.99 3.86 0.89 3.68 0.96 3.71 1.003.74 0.95 3.79 0.21 3.73 1.00 3.73 0.98 3.86 0.96 3.66 0.99 3.70 1.013.51 0.81 3.55 0.20 3.63 0.78 3.58 0.80 3.88 0.72 3.37 0.78 3.55 0.803.60 1.12 3.55 0.25 3.70 1.08 3.58 1.06 4.01 0.94 3.34 1.16 3.60 1.093.99 0.95 3.96 0.21 4.01 0.97 4.05 0.91 4.16 0.91 3.87 0.94 3.91 0.953.51 1.12 3.36 0.30 3.64 1.07 3.44 1.11 4.05 0.96 3.27 1.08 3.56 1.103.88 0.98 3.79 0.25 3.92 0.92 3.90 0.96 4.10 0.91 3.76 0.90 3.79 0.973.57 0.97 3.66 0.19 3.63 0.93 3.58 1.02 3.91 0.92 3.50 0.99 3.68 0.963.83 0.83 3.88 0.17 3.85 0.79 3.80 0.85 4.07 0.84 3.68 0.88 3.77 0.853.54 1.20 3.52 0.33 3.65 1.16 3.64 1.20 3.98 1.06 3.33 1.22 3.57 1.222.96 1.30 3.41 0.34 3.52 1.18 3.33 1.16 3.74 1.08 3.08 1.17 3.42 1.212.60 1.17 2.69 0.23 2.70 1.20 2.68 1.23 2.74 1.14 2.43 1.18 2.67 1.193.20 0.82 3.31 0.19 3.35 0.80 3.37 0.89 3.37 0.81 3.12 0.85 3.28 0.833.28 1.10 3.34 0.20 3.33 1.11 3.31 1.15 3.42 1.09 3.16 1.14 3.38 1.093.11 1.02 3.07 0.20 3.22 1.05 3.19 1.08 3.24 1.10 2.96 1.05 3.23 1.033.30 1.16 3.33 0.24 3.51 1.10 3.55 1.18 3.67 1.12 3.29 1.14 3.44 1.103.16 1.12 3.16 0.22 3.28 1.05 3.23 1.17 3.28 1.14 3.05 1.09 3.21 1.103.16 1.05 3.09 0.18 3.16 0.97 3.22 1.02 3.13 1.06 3.06 1.04 3.15 0.983.62 1.02 3.71 0.21 3.67 1.00 3.61 1.04 3.88 0.95 3.49 1.07 3.59 1.052.60 1.06 2.93 0.31 2.88 1.02 3.08 1.17 2.88 1.15 2.77 1.09 2.70 1.152.95 1.27 3.13 0.28 3.06 1.17 3.09 1.24 3.14 1.31 3.08 1.23 3.21 1.223.51 1.25 3.68 0.20 3.61 1.19 3.63 1.25 3.83 1.12 3.34 1.29 3.60 1.273.30 1.25 3.49 0.41 3.46 1.22 3.74 1.22 3.33 1.33 3.10 1.37 3.42 1.252.94 1.23 3.24 0.40 3.26 1.19 3.33 1.38 3.10 1.32 2.80 1.31 3.19 1.282.95 1.17 3.17 0.33 3.28 1.11 3.21 1.22 3.16 1.15 2.94 1.20 2.96 1.211.91 1.24 2.45 0.51 2.05 1.26 2.23 1.30 2.00 1.28 2.02 1.25 2.10 1.273.67 1.13 3.82 0.24 3.91 1.04 3.78 1.12 4.03 1.05 3.94 1.07 3.88 1.113.52 1.27 3.69 0.30 3.94 1.16 3.70 1.20 3.93 1.17 3.59 1.28 3.69 1.253.71 1.15 3.87 0.22 3.89 1.11 3.85 1.11 3.94 1.09 3.56 1.17 3.81 1.153.39 1.06 3.59 0.30 3.86 1.01 3.67 1.01 3.77 1.05 3.59 1.07 3.58 1.09
30
University of Arizona COACHE Survey Results for T/TE and C/CE Faculty.

The Collaborative on Academic Careers in Higher Education (COACHE)Faculty Job Satisfaction Survey 2013-14
MEANS AND STANDARD DEVIATIONS
University of Arizona
item short nameBenchmark: Nature of Work Research
Q45B Time spent on researchQ80A Expectations for finding external fundingQ80B Influence over focus of researchQ80C Quality of grad students to support researchQ80D Support for researchQ80E Support for engaging undergrads in researchQ85A Support for obtaining grants (pre-award)Q85B Support for maintaining grants (post-award)Q85C Support for securing grad student assistanceQ85D Support for travel to present/conduct researchQ85E Availability of course release for research
Benchmark: Nature of Work: ServiceQ45C Time spent on serviceQ55B Support for faculty in leadership rolesQ60A Number of committeesQ60B Attractiveness of committeesQ60C Discretion to choose committeesQ60D Equitability of committee assignmentsQ60E Number of student advisees
Benchmark: Nature of Work: TeachingQ45A Time spent on teachingQ70A Number of courses taughtQ70B Level of courses taughtQ70C Discretion over course contentQ70D Number of students in classes taughtQ70E Quality of students taughtQ70H Equitability of distribution of teaching loadQ70I Quality of grad students to support teachingQ45D Time spent on outreachQ45E Time spent on administrative tasksQ55A Ability to balance teaching/research/service
Benchmark: Facilities and work resourcesQ70F Support for improving teachingQ90A OfficeQ90B Laboratory, research, studio spaceQ90C Equipment
by Sex
mean sd mean sd mean sd mean sd mean sd mean sd mean sd3.06 0.64 3.03 0.24 3.26 0.68 3.19 0.76 3.15 0.64 3.18 0.71 3.43 0.733.28 1.20 2.93 0.36 3.31 1.26 3.42 1.17 3.38 1.13 3.21 1.14 3.52 1.152.97 0.96 3.00 0.25 3.07 1.06 3.21 0.99 2.98 1.06 3.15 1.01 3.21 1.024.40 0.80 4.21 0.27 4.39 0.80 4.40 0.77 4.49 0.71 4.25 0.92 4.39 0.833.33 1.13 2.78 0.71 3.55 1.12 3.31 1.16 3.53 1.07 3.31 1.12 3.37 1.182.54 1.15 2.79 0.35 3.03 1.18 2.87 1.23 2.66 1.12 2.85 1.17 3.46 1.112.89 1.06 2.99 0.35 3.35 0.99 3.25 1.13 2.85 1.07 3.19 1.07 3.33 1.052.77 1.11 2.94 0.33 3.12 1.12 3.01 1.12 2.98 1.11 3.38 1.19 3.39 1.123.03 1.12 2.99 0.34 3.14 1.11 3.18 1.20 3.09 1.05 3.06 1.09 3.37 1.102.65 1.05 2.50 0.65 2.93 1.09 2.74 1.19 2.89 1.07 2.81 1.19 3.05 1.082.80 1.22 3.08 0.42 3.21 1.18 2.99 1.29 3.15 1.16 3.01 1.19 3.36 1.212.63 1.14 2.38 0.37 2.59 1.20 2.64 1.26 2.41 1.08 2.62 1.15 3.00 1.193.17 0.73 3.20 0.16 3.14 0.74 3.25 0.96 3.06 0.74 3.10 0.81 3.29 0.723.32 0.99 3.30 0.23 3.29 1.04 3.28 1.19 3.14 1.03 3.29 1.01 3.39 1.012.55 1.21 2.60 0.32 2.62 1.32 2.82 1.40 2.50 1.32 2.68 1.36 2.72 1.283.34 0.92 3.37 0.19 3.33 0.90 3.54 1.01 3.19 0.91 3.25 1.00 3.46 0.863.41 0.88 3.47 0.17 3.39 0.90 3.41 1.01 3.36 0.88 3.35 0.98 3.49 0.893.46 0.97 3.53 0.23 3.34 1.01 3.34 1.16 3.43 0.93 3.18 1.09 3.47 1.062.86 1.14 2.90 0.25 2.80 1.08 2.95 1.27 2.71 1.17 2.72 1.13 3.04 1.143.51 0.98 3.35 0.22 3.51 0.99 3.45 1.14 3.65 0.89 3.54 1.03 3.52 1.003.66 0.66 3.69 0.17 3.73 0.63 3.71 0.76 3.62 0.63 3.64 0.68 3.82 0.593.72 0.94 3.81 0.19 3.84 0.88 3.73 1.00 3.65 0.99 3.71 0.91 3.84 0.903.90 0.88 3.62 0.33 3.85 0.94 3.81 1.14 3.64 1.04 3.76 1.08 4.00 0.893.99 0.88 4.00 0.15 3.94 0.85 4.07 0.93 3.91 0.88 3.93 0.96 4.17 0.764.30 0.87 4.38 0.14 4.23 0.88 4.29 0.98 4.27 0.88 4.28 0.89 4.44 0.723.68 1.07 3.66 0.26 3.64 1.03 3.74 1.13 3.36 1.18 3.58 1.05 3.90 1.073.28 1.03 3.41 0.35 3.76 0.94 3.51 1.00 3.44 1.08 3.39 0.98 3.57 1.032.94 1.16 3.17 0.22 2.95 1.17 3.06 1.38 2.98 1.22 2.97 1.20 3.10 1.133.54 1.08 2.97 0.66 3.48 1.14 3.50 1.16 3.69 0.98 3.45 1.09 3.43 1.103.63 0.85 3.47 0.19 3.63 0.82 3.60 0.84 3.53 0.79 3.58 0.87 3.65 0.852.84 0.99 2.88 0.23 2.69 1.01 3.04 1.08 2.61 1.00 2.90 1.03 3.08 1.032.96 1.28 2.87 0.31 2.99 1.32 3.31 1.33 2.86 1.26 2.98 1.26 3.19 1.263.41 0.71 3.40 0.26 3.56 0.62 3.45 0.73 3.29 0.72 3.37 0.65 3.55 0.653.15 1.00 3.28 0.33 3.50 1.05 3.26 1.06 3.11 1.06 3.34 1.02 3.22 1.023.93 0.94 3.76 0.28 3.88 0.98 3.71 1.10 3.67 1.05 3.63 1.05 3.90 0.943.47 1.12 3.12 0.32 3.50 1.03 3.39 1.23 3.32 1.23 3.03 1.21 3.25 1.213.22 1.12 3.31 0.34 3.38 1.03 3.30 1.17 3.31 1.06 3.30 1.04 3.60 0.96
peer 3peer 1 peer 2you All peer 4 peer 5women
31
University of Arizona COACHE Survey Results for T/TE and C/CE Faculty.

The Collaborative on Academic Careers in Higher Education (COACHE)Faculty Job Satisfaction Survey 2013-14
MEANS AND STANDARD DEVIATIONS
University of Arizona
item short nameQ90D ClassroomsQ90E Library resourcesQ90F Computing and technical supportQ90H Clerical/administrative support
Benchmark: Personal and family policiesQ95D Housing benefitsQ95E Tuition waivers, remission, or exchangeQ95F Spousal/partner hiring programQ95G ChildcareQ95H EldercareQ95J Family medical/parental leaveQ95K Flexible workload/modified dutiesQ95L Stop-the-clock policiesQ200B Inst. does what it can for work/life compatibilityQ200A Right balance between professional/personal
Benchmark: Health and retirement benefitsQ95A Health benefits for yourselfQ95B Health benefits for familyQ95C Retirement benefitsQ95I Phased retirement optionsQ90G Salary
Benchmark: Interdisciplinary workQ100A Budgets encourage interdiscip. workQ100B Facilities conducive to interdiscip. workQ100C Interdiscip. work is rewarded in meritQ100D Interdiscip. work is rewarded in promotionQ100E Interdiscip. work is rewarded in tenureQ100G Dept. knows how to evaluate interdiscip. work
Benchmark: CollaborationQ105A Opportunities for collab. within dept.Q105E Opportunities for collab. outside dept.Q105D Opportunities for collab. outside inst.
Benchmark: MentoringQ125A Effectiveness of mentoring within dept.Q125B Effectiveness of mentoring outside dept.Q130A Mentoring of pre-tenure facultyQ130B Mentoring of associate faculty
by Sex
mean sd mean sd mean sd mean sd mean sd mean sd mean sdpeer 3peer 1 peer 2you All peer 4 peer 5
women
3.28 1.06 3.26 0.35 3.50 0.97 3.20 1.17 3.13 1.09 3.21 1.10 3.27 1.073.92 1.00 3.72 0.38 4.17 0.78 3.80 1.02 3.77 0.95 3.73 0.96 3.83 1.003.36 1.21 3.37 0.38 3.40 1.09 3.65 1.02 3.10 1.17 3.32 1.17 3.87 1.062.93 1.25 3.24 0.33 3.09 1.21 3.26 1.22 2.89 1.24 3.27 1.16 3.39 1.233.21 0.91 2.98 0.30 2.95 1.00 3.06 1.03 3.26 0.82 3.05 0.95 3.22 0.912.24 0.98 2.25 0.52 2.65 1.18 2.67 0.94 3.46 1.12 2.52 0.99 2.82 1.173.88 0.82 2.86 0.64 2.24 1.15 2.73 1.23 1.96 0.90 3.32 1.11 3.19 1.093.10 1.27 2.54 0.49 2.72 1.29 3.19 1.38 3.30 1.29 3.02 1.29 2.92 1.272.32 1.12 2.55 0.60 2.46 1.21 3.00 1.27 2.62 0.90 2.61 1.09 2.43 1.142.88 0.79 2.71 0.36 2.91 1.06 2.69 0.97 3.00 0.75 2.64 0.89 2.82 1.193.41 1.04 3.31 0.37 3.28 1.14 3.00 1.37 3.77 0.94 3.28 1.00 3.67 1.013.45 1.14 3.31 0.31 3.22 1.18 3.18 1.38 3.67 0.91 3.25 1.19 3.59 0.993.85 1.04 3.36 0.69 4.09 0.91 3.67 1.15 3.86 1.04 3.67 0.72 3.97 0.812.78 1.19 2.85 0.36 2.75 1.26 2.86 1.27 3.16 1.20 2.79 1.26 3.03 1.222.92 1.30 3.01 0.28 2.95 1.30 3.18 1.34 2.94 1.31 2.87 1.36 3.18 1.333.85 0.65 3.56 0.36 4.03 0.65 3.97 0.73 3.89 0.73 3.41 0.87 3.73 0.784.08 0.74 3.68 0.44 4.14 0.73 4.14 0.81 4.04 0.82 3.39 1.00 3.86 0.884.10 0.76 3.55 0.54 4.03 0.83 4.09 0.82 4.01 0.84 3.39 0.99 3.79 0.953.56 0.85 3.53 0.30 4.04 0.88 3.75 0.86 3.85 0.89 3.43 1.05 3.69 0.943.25 0.85 3.24 0.34 3.65 0.96 3.45 1.01 3.17 0.95 3.44 0.99 3.26 0.982.79 1.23 2.84 0.42 3.01 1.23 3.44 1.12 3.05 1.22 3.11 1.13 2.95 1.222.75 0.97 2.57 0.26 2.70 0.99 2.74 1.06 2.74 0.96 2.79 1.04 2.89 1.072.45 1.20 2.43 0.35 2.40 1.20 2.84 1.31 2.65 1.21 2.72 1.22 2.98 1.222.67 1.15 2.52 0.29 2.62 1.21 2.49 1.24 2.71 1.28 2.85 1.25 2.84 1.242.74 1.23 2.49 0.34 2.74 1.24 2.60 1.30 2.67 1.25 2.81 1.26 2.82 1.332.78 1.23 2.53 0.32 2.86 1.23 2.61 1.34 2.61 1.22 2.95 1.25 2.86 1.293.09 1.07 2.70 0.40 2.70 1.21 2.73 1.17 2.41 1.19 2.35 1.24 2.89 1.272.96 1.24 2.71 0.28 2.84 1.31 2.95 1.42 3.03 1.28 2.75 1.26 2.80 1.313.64 0.83 3.45 0.22 3.56 0.90 3.64 0.95 3.76 0.85 3.57 0.85 3.68 0.813.54 1.16 3.57 0.20 3.53 1.15 3.55 1.23 3.71 1.11 3.41 1.13 3.65 1.163.60 1.03 3.34 0.24 3.49 1.05 3.47 1.10 3.64 1.06 3.55 1.01 3.69 0.953.77 0.97 3.42 0.38 3.67 1.07 3.90 1.12 3.92 1.01 3.77 1.03 3.69 0.913.01 0.97 3.01 0.25 3.06 1.01 3.02 1.15 3.02 1.02 2.96 1.05 3.08 1.053.66 1.28 3.59 0.23 3.47 1.37 3.24 1.34 3.63 1.25 3.39 1.32 3.57 1.333.81 1.03 3.55 0.22 3.90 1.03 3.55 1.16 3.70 1.10 3.55 1.12 3.94 0.943.07 1.38 3.06 0.37 3.29 1.32 3.19 1.42 3.07 1.34 3.02 1.38 3.12 1.392.20 1.18 2.34 0.28 2.36 1.24 2.37 1.41 2.53 1.21 2.46 1.31 2.24 1.24
32
University of Arizona COACHE Survey Results for T/TE and C/CE Faculty.

The Collaborative on Academic Careers in Higher Education (COACHE)Faculty Job Satisfaction Survey 2013-14
MEANS AND STANDARD DEVIATIONS
University of Arizona
item short nameQ130C Support for faculty to be good mentorsQ115 Being a mentor is fulfillingQ120A Importance of mentoring within dept.Q120B Importance of mentoring outside dept.Q120C Importance of mentoring outside inst.Q125C Effectiveness of mentoring outside the inst.
Benchmark: Tenure policiesQ136A Clarity of tenure processQ136B Clarity of tenure criteriaQ136C Clarity of tenure standardsQ136D Clarity of body of evidence for deciding tenureQ136E Clarity of whether I will achieve tenureQ139A Consistency of messages about tenureQ139B Tenure decisions are performance-based
Benchmark: Tenure clarityQ137A Clarity of expectations: ScholarQ137B Clarity of expectations: TeacherQ137C Clarity of expectations: AdvisorQ137D Clarity of expectations: ColleagueQ137E Clarity of expectations: Campus citizenQ137F Clarity of expectations: Broader community
Benchmark: Tenure reasonablenessQ138A Reasonable expectations: ScholarQ138B Reasonable expectations: TeacherQ138C Reasonable expectations: AdvisorQ138D Reasonable expectations: ColleagueQ138E Reasonable expectations: Campus citizenQ138F Reasonable expectations: Community member
Benchmark: PromotionQ135C Reasonable expectations: PromotionQ135B Dept. culture encourages promotionQ140A Clarity of promotion processQ140B Clarity of promotion criteriaQ140C Clarity of promotion standardsQ140D Clarity of body of evidence for promotionQ140E Clarity of time frame for promotionQ140F Clarity of whether I will be promoted
by Sex
mean sd mean sd mean sd mean sd mean sd mean sd mean sdpeer 3peer 1 peer 2you All peer 4 peer 5
women
2.22 1.08 2.25 0.30 2.34 1.07 2.46 1.22 2.31 1.15 2.18 1.05 2.27 0.964.21 0.81 4.18 0.16 4.20 0.86 4.22 0.90 4.25 0.77 3.99 1.02 4.25 0.804.37 0.85 4.37 0.14 4.39 0.88 4.22 1.02 4.42 0.73 4.36 0.94 4.47 0.793.92 0.99 3.81 0.19 3.93 1.00 3.89 1.09 3.87 1.01 3.84 1.08 4.02 1.014.11 0.93 3.91 0.29 4.11 0.90 4.25 0.94 4.09 0.90 3.86 1.07 4.09 0.944.30 0.74 3.96 0.24 4.18 0.88 4.09 0.97 4.03 0.98 3.98 0.83 4.13 0.903.33 0.91 3.39 0.35 3.61 0.99 3.50 1.08 3.51 0.99 3.14 1.05 3.44 1.003.42 1.18 3.57 0.40 3.77 1.15 3.66 1.29 3.64 1.16 3.44 1.24 3.58 1.233.38 1.20 3.55 0.38 3.74 1.16 3.61 1.32 3.67 1.20 3.27 1.27 3.68 1.243.06 1.12 3.27 0.42 3.57 1.21 3.51 1.23 3.36 1.18 2.87 1.26 3.36 1.313.56 1.07 3.57 0.37 3.92 1.07 3.75 1.21 4.05 1.12 3.26 1.30 3.52 1.353.44 1.08 3.37 0.38 3.45 1.26 3.34 1.29 3.33 1.28 2.97 1.24 3.33 1.142.89 1.29 2.95 0.45 3.10 1.26 3.07 1.46 2.80 1.26 2.91 1.38 3.05 1.303.56 1.26 3.46 0.47 3.79 1.11 3.52 1.28 3.68 1.17 3.32 1.26 3.70 1.033.22 0.81 3.35 0.27 3.46 1.03 3.52 0.98 3.51 0.92 3.10 0.91 3.29 0.993.83 1.06 3.57 0.45 4.13 1.05 3.98 1.23 3.87 1.17 3.72 1.21 3.86 1.143.57 1.10 3.90 0.30 3.81 1.17 4.03 1.11 4.10 0.85 3.63 1.17 3.81 1.153.14 1.09 3.30 0.33 3.40 1.25 3.43 1.30 3.32 1.30 2.93 1.20 3.19 1.193.02 1.10 3.26 0.34 3.35 1.25 3.31 1.29 3.33 1.18 2.83 1.16 3.24 1.352.86 1.14 3.13 0.34 3.05 1.29 3.18 1.22 3.21 1.22 2.72 1.16 2.94 1.342.82 1.07 2.93 0.30 2.98 1.25 3.20 1.22 3.21 1.26 2.77 1.16 2.66 1.333.84 0.67 3.79 0.23 3.97 0.66 3.85 0.88 4.08 0.87 3.68 0.71 3.97 0.743.82 0.88 3.67 0.44 4.02 0.90 3.75 1.16 3.92 1.08 3.69 1.15 3.82 1.114.02 0.84 4.09 0.28 4.31 0.77 4.02 1.08 4.26 0.97 3.96 0.96 4.07 1.013.81 0.90 3.82 0.27 3.93 0.86 3.98 1.03 4.11 1.02 3.55 0.83 3.98 1.013.85 1.00 3.87 0.28 4.00 0.80 3.83 1.13 4.13 0.94 3.57 0.88 4.07 0.883.80 0.87 3.74 0.22 3.81 0.82 3.73 0.99 4.11 0.98 3.55 0.80 3.97 0.943.72 0.88 3.65 0.25 3.76 0.94 3.82 1.02 3.97 1.00 3.50 0.78 3.91 0.883.45 1.08 3.47 0.31 3.70 1.06 3.50 1.10 4.06 0.88 3.46 1.05 3.47 1.123.74 1.20 3.62 0.37 3.91 1.19 3.71 1.27 4.05 1.08 3.50 1.30 3.73 1.203.31 1.39 3.25 0.43 3.47 1.41 3.21 1.46 4.36 0.98 3.69 1.32 3.56 1.363.57 1.27 3.67 0.36 3.90 1.24 3.66 1.38 4.11 1.10 3.69 1.27 3.62 1.333.53 1.36 3.62 0.34 3.94 1.22 3.67 1.30 4.07 1.12 3.58 1.25 3.53 1.353.37 1.36 3.42 0.36 3.67 1.28 3.52 1.30 3.70 1.23 3.24 1.32 3.38 1.333.53 1.35 3.65 0.32 3.95 1.19 3.75 1.30 4.16 1.03 3.54 1.27 3.64 1.283.27 1.39 3.29 0.44 3.22 1.32 3.12 1.32 4.11 1.08 3.11 1.30 2.97 1.342.94 1.33 3.01 0.36 3.08 1.39 3.38 1.44 3.45 1.28 2.83 1.26 3.16 1.40
33
University of Arizona COACHE Survey Results for T/TE and C/CE Faculty.

The Collaborative on Academic Careers in Higher Education (COACHE)Faculty Job Satisfaction Survey 2013-14
MEANS AND STANDARD DEVIATIONS
University of Arizona
item short nameQ170A Priorities are stated consistentlyQ170C Priorities are acted on consistentlyQ170D Changed priorities negatively affect my work**
Benchmark: Leadership: SeniorQ180A Pres/Chancellor: Pace of decision makingQ180B Pres/Chancellor: Stated prioritiesQ180C Pres/Chancellor: Communication of prioritiesQ180L CAO: Pace of decision makingQ180M CAO: Stated prioritiesQ180N CAO: Communication of prioritiesQ180O CAO: Ensuring faculty inputQ175C CAO: Support in adapting to change
Benchmark: Leadership: DivisionalQ185D Dean: Pace of decision makingQ185E Dean: Stated prioritiesQ185F Dean: Communication of prioritiesQ185G Dean: Ensuring faculty inputQ175A Dean: Support in adapting to change
Benchmark: Leadership: DepartmentalQ185H Head/Chair: Pace of decision makingQ185I Head/Chair: Stated prioritiesQ185J Head/Chair: Communication of prioritiesQ185K Head/Chair: Ensuring faculty inputQ185L Head/Chair: Fairness in evaluating workQ175B Head/Chair: Support in adapting to change
Benchmark: Departmental collegialityQ200C Colleagues support work/life balanceQ200D Meeting times compatible with personal needsQ205B Amount of personal interaction w/Pre-tenureQ205C How well you fitQ205E Amount of personal interaction w/TenuredQ210A Colleagues pitch in when neededQ210C Dept. is collegialQ212A Colleagues committed to diversity/inclusion
Benchmark: Departmental engagementQ190A Discussions of undergrad student learningQ190B Discussions of grad student learning
by Sex
mean sd mean sd mean sd mean sd mean sd mean sd mean sdpeer 3peer 1 peer 2you All peer 4 peer 5
women
2.70 1.19 2.84 0.39 2.71 1.21 2.83 1.32 2.63 1.22 2.89 1.16 2.91 1.232.45 1.08 2.64 0.35 2.56 1.16 2.75 1.30 2.52 1.15 2.67 1.20 2.71 1.232.46 1.20 2.74 0.37 2.63 1.29 2.76 1.38 2.22 1.24 2.69 1.22 2.87 1.223.23 0.80 3.14 0.37 3.18 0.84 3.18 0.93 2.96 0.93 2.82 0.80 3.05 0.843.26 0.85 3.19 0.40 3.31 0.87 3.28 0.89 3.00 1.07 2.77 0.90 3.11 0.893.15 1.05 3.18 0.42 3.27 1.06 3.20 1.08 2.88 1.22 2.78 0.98 3.12 0.963.36 1.00 3.12 0.48 3.33 1.03 3.18 1.12 2.79 1.18 2.54 1.05 3.00 1.083.19 0.91 3.10 0.36 3.07 0.93 3.24 0.96 3.05 1.03 3.01 0.91 3.10 0.933.18 1.00 3.12 0.39 3.05 0.99 3.14 1.08 3.00 1.17 2.99 1.00 3.08 1.023.23 1.02 3.07 0.40 3.09 1.01 3.05 1.13 2.98 1.14 2.84 1.04 2.96 1.07N/A N/A N/A N/A N/A N/A N/A N/A N/A N/A N/A N/A N/A N/AN/A N/A N/A N/A N/A N/A N/A N/A N/A N/A N/A N/A N/A N/A2.93 1.05 3.22 0.35 2.99 1.07 3.07 1.32 2.93 1.19 3.31 0.98 3.27 1.063.02 1.10 3.29 0.35 3.01 1.13 3.25 1.30 3.06 1.22 3.35 1.01 3.40 1.052.95 1.17 3.24 0.36 3.00 1.16 3.09 1.36 2.90 1.28 3.31 1.09 3.42 1.122.96 1.17 3.22 0.36 2.99 1.19 3.04 1.43 2.88 1.32 3.28 1.16 3.19 1.262.83 1.15 3.12 0.36 2.96 1.22 2.90 1.44 2.87 1.34 3.30 1.17 3.07 1.222.32 1.25 2.70 0.40 2.32 1.26 2.38 1.41 2.51 1.35 2.78 1.25 2.90 1.243.41 1.11 3.63 0.26 3.44 1.19 3.50 1.29 3.79 1.10 3.30 1.20 3.49 1.133.34 1.22 3.59 0.28 3.41 1.24 3.51 1.31 3.77 1.11 3.31 1.29 3.48 1.223.32 1.28 3.56 0.27 3.36 1.31 3.47 1.40 3.60 1.25 3.18 1.35 3.39 1.283.31 1.28 3.55 0.29 3.40 1.37 3.42 1.45 3.78 1.24 3.19 1.39 3.33 1.303.42 1.30 3.66 0.29 3.46 1.37 3.38 1.49 3.89 1.26 3.14 1.42 3.52 1.303.68 1.20 3.80 0.25 3.59 1.31 3.68 1.30 4.05 1.08 3.59 1.23 3.75 1.183.01 1.48 3.23 0.42 2.93 1.35 3.12 1.49 3.34 1.36 2.93 1.36 3.11 1.383.70 0.81 3.79 0.17 3.60 0.82 3.65 0.90 3.85 0.76 3.54 0.77 3.74 0.873.39 1.20 3.63 0.20 3.42 1.19 3.47 1.22 3.55 1.11 3.45 1.12 3.67 1.153.96 1.06 4.02 0.18 3.94 1.22 3.95 1.22 4.14 1.04 3.80 1.14 3.94 1.193.68 0.95 3.75 0.17 3.58 0.89 3.82 0.98 3.84 0.89 3.58 0.94 3.87 0.923.58 1.20 3.71 0.23 3.39 1.23 3.62 1.26 3.63 1.22 3.35 1.27 3.56 1.283.65 0.97 3.68 0.16 3.50 0.98 3.64 1.05 3.77 1.00 3.39 1.02 3.68 1.013.67 1.17 3.76 0.24 3.61 1.23 3.65 1.15 3.76 1.20 3.38 1.15 3.67 1.253.95 1.20 3.92 0.29 3.73 1.32 3.71 1.37 4.13 1.13 3.70 1.22 3.88 1.203.80 1.21 3.91 0.23 3.68 1.26 3.54 1.37 4.01 1.09 3.64 1.18 3.76 1.203.39 0.76 3.46 0.13 3.37 0.70 3.42 0.82 3.53 0.76 3.35 0.77 3.46 0.813.22 1.22 3.69 0.40 3.05 1.22 2.94 1.36 3.40 1.16 3.34 1.18 3.28 1.303.57 1.11 2.98 0.75 3.59 1.08 3.76 1.11 3.75 1.06 3.53 1.10 3.72 1.06
34
University of Arizona COACHE Survey Results for T/TE and C/CE Faculty.

The Collaborative on Academic Careers in Higher Education (COACHE)Faculty Job Satisfaction Survey 2013-14
MEANS AND STANDARD DEVIATIONS
University of Arizona
item short nameQ190C Discussions of effective teaching practicesQ190D Discussions of effective use of technologyQ190E Discussions of current research methodsQ205A Amount of professional interaction w/Pre-tenureQ205D Amount of professional interaction w/Tenured
Benchmark: Departmental qualityQ195A Intellectual vitality of tenured facultyQ195B Intellectual vitality of pre-tenure facultyQ195C Scholarly productivity of tenured facultyQ195D Scholarly productivity of pre-tenure facultyQ195G Teaching effectiveness of tenured facultyQ195H Teaching effectiveness of pre-tenure facultyQ240B Dept. is successful at faculty recruitmentQ240C Dept. is successful at faculty retentionQ240D Dept. addresses sub-standard performance
Benchmark: Appreciation and recognitionQ215A Recognition: For teachingQ215B Recognition: For advisingQ215C Recognition: For scholarshipQ215D Recognition: For serviceQ215E Recognition: For outreachQ215I Recognition: From colleaguesQ215J Recognition: From CAOQ215K Recognition: From DeanQ215L Recognition: From Head/ChairQ220A School/college is valued by Pres/ProvostQ220B Dept. is valued by Pres/ProvostQ245A CAO cares about faculty of my rankQ240A Outside offers are necessary in negotiationsQ212B Visible leadership for support of diversityQ245D I would again choose this institutionQ250A Department as a place to workQ250B Institution as a place to work
by Sex
mean sd mean sd mean sd mean sd mean sd mean sd mean sdpeer 3peer 1 peer 2you All peer 4 peer 5
women
3.21 1.12 3.55 0.25 3.17 1.03 3.35 1.08 3.33 1.05 3.24 1.00 3.31 1.083.12 1.02 3.30 0.24 3.11 0.97 3.09 1.12 3.08 1.06 3.05 1.03 3.24 1.083.16 1.11 3.06 0.25 3.32 1.07 3.32 1.20 3.43 1.13 3.18 1.08 3.34 1.123.84 0.92 3.84 0.18 3.73 0.91 3.87 1.01 3.97 0.85 3.67 1.01 3.86 0.953.72 1.02 3.72 0.18 3.64 0.99 3.61 1.16 3.78 1.03 3.45 1.11 3.58 1.143.52 0.78 3.55 0.22 3.66 0.75 3.52 0.83 3.96 0.69 3.47 0.72 3.67 0.763.60 1.15 3.54 0.28 3.75 1.05 3.58 1.19 4.09 0.94 3.48 1.09 3.70 1.104.01 0.96 4.00 0.22 4.20 0.87 4.12 0.90 4.38 0.75 4.09 0.80 4.19 0.803.57 1.11 3.37 0.33 3.79 1.02 3.51 1.12 4.11 0.96 3.38 1.09 3.67 1.093.87 1.00 3.82 0.28 4.10 0.82 3.94 0.91 4.34 0.76 3.92 0.80 3.99 0.903.70 1.02 3.68 0.22 3.68 0.95 3.49 1.08 4.00 0.89 3.47 0.98 3.77 0.993.96 0.86 3.93 0.17 3.97 0.83 3.84 0.98 4.14 0.70 3.83 0.75 3.96 0.793.53 1.23 3.58 0.32 3.61 1.23 3.59 1.34 3.99 1.10 3.50 1.15 3.72 1.153.02 1.21 3.43 0.33 3.32 1.24 3.04 1.26 3.78 1.19 3.17 1.23 3.34 1.202.39 1.10 2.53 0.27 2.50 1.13 2.50 1.26 2.78 1.19 2.32 1.15 2.58 1.233.16 0.75 3.24 0.22 3.13 0.79 3.10 0.96 3.25 0.80 3.10 0.82 3.28 0.803.14 1.10 3.31 0.27 3.24 1.13 3.13 1.21 3.31 1.08 3.20 1.06 3.23 1.142.95 1.03 2.99 0.27 2.99 1.05 2.83 1.12 3.12 1.04 2.91 0.99 2.98 1.063.31 1.05 3.27 0.27 3.36 1.12 3.22 1.19 3.61 1.07 3.43 1.07 3.42 1.063.08 1.07 3.07 0.26 3.05 1.11 3.01 1.23 3.09 1.14 2.95 1.15 3.06 1.113.08 1.05 3.07 0.27 3.05 1.01 2.84 1.07 3.10 1.01 2.99 1.09 3.07 0.983.63 1.03 3.62 0.21 3.60 1.04 3.52 1.15 3.77 1.05 3.41 1.10 3.56 1.052.68 1.11 2.92 0.39 2.79 1.07 2.67 1.25 2.88 1.10 2.84 1.12 3.03 1.172.87 1.21 3.11 0.39 2.91 1.27 2.61 1.40 3.04 1.27 3.17 1.27 3.27 1.203.37 1.20 3.57 0.25 3.29 1.31 3.32 1.40 3.65 1.16 3.34 1.25 3.41 1.213.29 1.29 3.40 0.41 3.09 1.25 3.36 1.38 3.10 1.32 2.96 1.32 3.65 1.182.96 1.19 3.14 0.38 3.00 1.21 2.97 1.41 2.89 1.31 2.81 1.30 3.38 1.223.00 1.16 3.07 0.37 2.95 1.18 2.98 1.39 3.12 1.21 2.81 1.15 3.06 1.241.86 1.22 2.47 0.57 1.88 1.25 2.01 1.26 1.86 1.24 2.01 1.22 2.09 1.293.50 1.20 3.66 0.29 3.63 1.24 3.27 1.41 3.74 1.24 3.67 1.19 3.77 1.153.55 1.24 3.69 0.29 3.62 1.27 3.63 1.35 3.84 1.23 3.60 1.25 3.76 1.193.64 1.11 3.76 0.23 3.54 1.22 3.58 1.29 3.87 1.11 3.60 1.11 3.77 1.163.45 1.04 3.57 0.29 3.69 0.99 3.61 1.18 3.69 1.07 3.51 1.06 3.76 1.01
35
University of Arizona COACHE Survey Results for T/TE and C/CE Faculty.

The Collaborative on Academic Careers in Higher Education (COACHE)Faculty Job Satisfaction Survey 2013-14
MEANS AND STANDARD DEVIATIONS
University of Arizona
item short nameBenchmark: Nature of Work Research
Q45B Time spent on researchQ80A Expectations for finding external fundingQ80B Influence over focus of researchQ80C Quality of grad students to support researchQ80D Support for researchQ80E Support for engaging undergrads in researchQ85A Support for obtaining grants (pre-award)Q85B Support for maintaining grants (post-award)Q85C Support for securing grad student assistanceQ85D Support for travel to present/conduct researchQ85E Availability of course release for research
Benchmark: Nature of Work: ServiceQ45C Time spent on serviceQ55B Support for faculty in leadership rolesQ60A Number of committeesQ60B Attractiveness of committeesQ60C Discretion to choose committeesQ60D Equitability of committee assignmentsQ60E Number of student advisees
Benchmark: Nature of Work: TeachingQ45A Time spent on teachingQ70A Number of courses taughtQ70B Level of courses taughtQ70C Discretion over course contentQ70D Number of students in classes taughtQ70E Quality of students taughtQ70H Equitability of distribution of teaching loadQ70I Quality of grad students to support teachingQ45D Time spent on outreachQ45E Time spent on administrative tasksQ55A Ability to balance teaching/research/service
Benchmark: Facilities and work resourcesQ70F Support for improving teachingQ90A OfficeQ90B Laboratory, research, studio spaceQ90C Equipment
by Race/Ethnicity
mean sd mean sd mean sd mean sd mean sd mean sd mean sd3.14 0.68 3.11 0.24 3.37 0.67 3.29 0.71 3.23 0.68 3.28 0.70 3.43 0.753.46 1.19 3.14 0.38 3.58 1.18 3.64 1.19 3.67 1.16 3.47 1.11 3.65 1.113.13 0.97 3.12 0.20 3.23 1.03 3.31 1.02 3.14 1.04 3.21 1.02 3.33 1.004.42 0.77 4.28 0.26 4.43 0.80 4.53 0.73 4.53 0.72 4.32 0.89 4.38 0.883.38 1.10 2.93 0.51 3.65 1.05 3.35 1.11 3.64 1.07 3.38 1.09 3.33 1.142.55 1.15 2.82 0.34 3.06 1.18 2.76 1.17 2.69 1.18 2.91 1.14 3.32 1.172.97 1.04 3.06 0.31 3.43 1.01 3.28 1.09 2.94 1.11 3.23 1.04 3.40 1.052.90 1.10 3.03 0.32 3.21 1.08 3.12 1.10 3.02 1.15 3.53 1.14 3.34 1.103.15 1.11 3.02 0.33 3.24 1.09 3.19 1.14 3.11 1.14 3.20 1.06 3.28 1.122.75 1.07 2.63 0.42 3.03 1.07 2.99 1.12 2.88 1.07 2.90 1.09 3.05 1.072.80 1.24 3.08 0.41 3.19 1.18 3.10 1.24 3.14 1.16 3.06 1.23 3.36 1.152.76 1.12 2.49 0.38 2.81 1.14 2.82 1.23 2.54 1.10 2.77 1.14 3.07 1.223.25 0.76 3.25 0.15 3.29 0.74 3.37 0.85 3.22 0.74 3.13 0.77 3.35 0.773.44 1.00 3.34 0.20 3.46 0.98 3.43 1.06 3.30 1.05 3.34 0.99 3.49 0.982.70 1.23 2.67 0.31 2.87 1.27 2.99 1.43 2.60 1.28 2.71 1.31 2.82 1.253.40 0.91 3.41 0.18 3.43 0.90 3.61 0.96 3.34 0.89 3.27 0.92 3.49 0.883.40 0.90 3.46 0.15 3.40 0.94 3.49 0.92 3.42 0.91 3.29 0.98 3.48 0.953.46 1.03 3.58 0.20 3.47 0.97 3.48 1.02 3.57 0.96 3.26 1.02 3.58 1.033.01 1.17 3.04 0.17 3.03 1.07 3.09 1.20 3.01 1.17 2.84 1.12 3.11 1.133.67 0.89 3.43 0.22 3.63 0.91 3.66 1.02 3.73 0.84 3.66 0.94 3.63 0.943.72 0.62 3.72 0.16 3.81 0.65 3.79 0.68 3.73 0.62 3.71 0.64 3.83 0.633.87 0.90 3.91 0.18 3.93 0.86 3.90 0.90 3.81 0.93 3.88 0.91 4.02 0.843.91 0.88 3.68 0.31 3.91 0.90 3.92 1.02 3.76 1.01 3.85 0.99 3.99 0.914.04 0.80 4.03 0.14 4.04 0.86 4.12 0.84 3.97 0.84 4.07 0.80 4.17 0.784.36 0.79 4.42 0.12 4.33 0.83 4.42 0.86 4.38 0.83 4.36 0.83 4.46 0.743.72 1.04 3.69 0.24 3.78 0.99 3.83 1.06 3.48 1.15 3.74 1.05 3.85 1.053.27 1.02 3.34 0.36 3.75 0.96 3.36 1.00 3.50 1.04 3.39 1.01 3.50 1.043.02 1.16 3.25 0.21 3.07 1.14 3.20 1.30 3.13 1.19 2.91 1.20 3.17 1.183.49 1.12 3.06 0.50 3.64 1.10 3.50 1.15 3.78 0.95 3.47 1.08 3.42 1.093.68 0.85 3.50 0.16 3.62 0.85 3.63 0.83 3.55 0.84 3.57 0.85 3.66 0.842.84 1.02 2.86 0.21 2.78 1.02 3.00 1.09 2.59 1.04 2.84 1.03 3.05 1.033.26 1.27 3.09 0.31 3.29 1.27 3.54 1.27 3.17 1.30 3.18 1.30 3.44 1.233.44 0.66 3.41 0.25 3.64 0.63 3.52 0.72 3.34 0.73 3.45 0.69 3.54 0.673.04 1.01 3.25 0.30 3.50 1.00 3.25 1.04 3.07 1.06 3.35 1.04 3.20 1.023.88 0.94 3.76 0.25 4.00 0.92 3.81 1.05 3.65 1.08 3.70 1.07 3.88 1.013.48 1.04 3.18 0.32 3.61 1.08 3.65 1.13 3.42 1.19 3.12 1.23 3.26 1.233.30 1.04 3.31 0.34 3.55 0.98 3.43 1.09 3.28 1.10 3.37 1.07 3.52 0.99
peer 2 peer 3white
you peer 4All peer 5peer 1
36
University of Arizona COACHE Survey Results for T/TE and C/CE Faculty.

The Collaborative on Academic Careers in Higher Education (COACHE)Faculty Job Satisfaction Survey 2013-14
MEANS AND STANDARD DEVIATIONS
University of Arizona
item short nameQ90D ClassroomsQ90E Library resourcesQ90F Computing and technical supportQ90H Clerical/administrative support
Benchmark: Personal and family policiesQ95D Housing benefitsQ95E Tuition waivers, remission, or exchangeQ95F Spousal/partner hiring programQ95G ChildcareQ95H EldercareQ95J Family medical/parental leaveQ95K Flexible workload/modified dutiesQ95L Stop-the-clock policiesQ200B Inst. does what it can for work/life compatibilityQ200A Right balance between professional/personal
Benchmark: Health and retirement benefitsQ95A Health benefits for yourselfQ95B Health benefits for familyQ95C Retirement benefitsQ95I Phased retirement optionsQ90G Salary
Benchmark: Interdisciplinary workQ100A Budgets encourage interdiscip. workQ100B Facilities conducive to interdiscip. workQ100C Interdiscip. work is rewarded in meritQ100D Interdiscip. work is rewarded in promotionQ100E Interdiscip. work is rewarded in tenureQ100G Dept. knows how to evaluate interdiscip. work
Benchmark: CollaborationQ105A Opportunities for collab. within dept.Q105E Opportunities for collab. outside dept.Q105D Opportunities for collab. outside inst.
Benchmark: MentoringQ125A Effectiveness of mentoring within dept.Q125B Effectiveness of mentoring outside dept.Q130A Mentoring of pre-tenure facultyQ130B Mentoring of associate faculty
by Race/Ethnicity
mean sd mean sd mean sd mean sd mean sd mean sd mean sdpeer 2 peer 3white
you peer 4All peer 5peer 1
3.33 1.01 3.28 0.33 3.53 0.96 3.31 1.16 3.11 1.11 3.34 1.11 3.31 1.043.92 0.91 3.70 0.37 4.16 0.79 3.79 1.04 3.91 0.91 3.81 0.93 3.84 0.893.35 1.16 3.39 0.37 3.45 1.09 3.67 1.06 3.28 1.16 3.44 1.17 3.74 1.053.12 1.23 3.31 0.32 3.25 1.17 3.22 1.25 2.97 1.23 3.38 1.16 3.46 1.203.27 0.91 3.01 0.28 3.08 0.93 3.07 0.96 3.23 0.84 3.16 0.85 3.24 0.892.31 0.89 2.31 0.38 2.65 1.04 2.47 0.92 3.42 1.17 2.71 0.96 2.60 0.993.87 0.89 2.77 0.69 2.17 1.07 2.39 1.13 1.86 0.92 3.16 1.08 3.18 1.133.05 1.21 2.59 0.33 2.84 1.21 2.99 1.31 3.20 1.29 2.93 1.23 2.82 1.202.55 1.08 2.62 0.49 2.65 1.11 3.09 1.16 2.64 0.92 2.78 1.01 2.50 1.122.86 0.78 2.75 0.25 2.88 0.91 2.71 0.92 2.94 0.77 2.85 0.83 2.92 0.983.55 0.94 3.37 0.30 3.52 0.96 3.21 1.21 3.73 0.84 3.39 0.97 3.61 0.913.61 1.00 3.40 0.26 3.49 1.08 3.33 1.19 3.66 0.87 3.45 1.13 3.64 0.963.85 1.04 3.39 0.66 3.94 0.88 3.71 1.14 3.90 0.97 3.73 0.97 3.92 0.872.85 1.19 2.96 0.31 3.02 1.21 3.06 1.23 3.19 1.19 2.93 1.21 3.13 1.173.14 1.31 3.24 0.24 3.27 1.31 3.53 1.28 3.17 1.33 3.16 1.34 3.43 1.293.82 0.66 3.55 0.36 4.05 0.65 4.03 0.70 3.87 0.76 3.40 0.85 3.71 0.744.05 0.76 3.68 0.44 4.16 0.74 4.21 0.78 4.02 0.89 3.36 1.02 3.86 0.824.05 0.80 3.53 0.55 4.06 0.82 4.18 0.80 3.98 0.91 3.35 1.03 3.81 0.883.60 0.86 3.53 0.30 4.10 0.86 3.88 0.82 3.89 0.94 3.49 1.03 3.66 0.963.17 0.89 3.20 0.29 3.68 0.93 3.42 1.10 3.02 1.03 3.35 0.98 3.26 1.042.92 1.25 2.92 0.40 3.23 1.22 3.61 1.12 3.22 1.22 3.18 1.19 3.02 1.242.84 0.95 2.61 0.24 2.82 0.98 2.81 1.03 2.87 0.94 2.86 1.05 2.90 0.992.55 1.16 2.46 0.33 2.53 1.20 2.80 1.27 2.67 1.16 2.77 1.22 2.99 1.182.80 1.13 2.55 0.27 2.73 1.19 2.52 1.20 2.84 1.20 2.95 1.26 2.89 1.162.79 1.17 2.54 0.30 2.86 1.20 2.71 1.27 2.84 1.21 2.89 1.26 2.83 1.192.87 1.18 2.58 0.29 2.91 1.18 2.80 1.24 2.80 1.19 3.00 1.21 2.84 1.183.02 1.11 2.76 0.46 2.90 1.26 2.77 1.22 2.72 1.28 2.54 1.30 2.88 1.313.04 1.26 2.79 0.26 2.98 1.25 3.12 1.35 3.11 1.25 2.76 1.29 2.88 1.273.73 0.80 3.54 0.20 3.70 0.86 3.76 0.87 3.90 0.83 3.68 0.83 3.73 0.843.70 1.09 3.68 0.16 3.70 1.09 3.71 1.13 3.86 1.06 3.58 1.15 3.74 1.133.63 1.01 3.40 0.22 3.60 1.03 3.58 1.06 3.77 1.05 3.63 1.04 3.66 1.033.86 0.92 3.51 0.33 3.81 1.03 3.99 1.00 4.05 0.92 3.84 0.98 3.80 0.953.01 0.99 2.99 0.21 3.11 0.96 3.02 1.08 3.03 0.96 2.99 0.98 3.04 1.023.58 1.26 3.54 0.18 3.52 1.30 3.25 1.26 3.60 1.21 3.34 1.29 3.52 1.303.55 1.06 3.37 0.18 3.67 1.07 3.44 1.06 3.48 1.09 3.33 1.05 3.56 1.083.15 1.32 3.13 0.30 3.41 1.26 3.31 1.34 3.16 1.30 3.17 1.33 3.19 1.352.47 1.23 2.45 0.24 2.54 1.19 2.56 1.31 2.60 1.18 2.69 1.25 2.40 1.18
37
University of Arizona COACHE Survey Results for T/TE and C/CE Faculty.

The Collaborative on Academic Careers in Higher Education (COACHE)Faculty Job Satisfaction Survey 2013-14
MEANS AND STANDARD DEVIATIONS
University of Arizona
item short nameQ130C Support for faculty to be good mentorsQ115 Being a mentor is fulfillingQ120A Importance of mentoring within dept.Q120B Importance of mentoring outside dept.Q120C Importance of mentoring outside inst.Q125C Effectiveness of mentoring outside the inst.
Benchmark: Tenure policiesQ136A Clarity of tenure processQ136B Clarity of tenure criteriaQ136C Clarity of tenure standardsQ136D Clarity of body of evidence for deciding tenureQ136E Clarity of whether I will achieve tenureQ139A Consistency of messages about tenureQ139B Tenure decisions are performance-based
Benchmark: Tenure clarityQ137A Clarity of expectations: ScholarQ137B Clarity of expectations: TeacherQ137C Clarity of expectations: AdvisorQ137D Clarity of expectations: ColleagueQ137E Clarity of expectations: Campus citizenQ137F Clarity of expectations: Broader community
Benchmark: Tenure reasonablenessQ138A Reasonable expectations: ScholarQ138B Reasonable expectations: TeacherQ138C Reasonable expectations: AdvisorQ138D Reasonable expectations: ColleagueQ138E Reasonable expectations: Campus citizenQ138F Reasonable expectations: Community member
Benchmark: PromotionQ135C Reasonable expectations: PromotionQ135B Dept. culture encourages promotionQ140A Clarity of promotion processQ140B Clarity of promotion criteriaQ140C Clarity of promotion standardsQ140D Clarity of body of evidence for promotionQ140E Clarity of time frame for promotionQ140F Clarity of whether I will be promoted
by Race/Ethnicity
mean sd mean sd mean sd mean sd mean sd mean sd mean sdpeer 2 peer 3white
you peer 4All peer 5peer 1
2.34 1.07 2.30 0.25 2.49 1.07 2.43 1.13 2.42 1.10 2.41 1.11 2.42 1.074.18 0.83 4.10 0.14 4.12 0.91 4.07 0.89 4.27 0.78 3.93 0.98 4.11 0.864.18 0.97 4.17 0.13 4.17 0.96 4.04 1.06 4.11 1.02 4.12 1.05 4.22 0.953.60 1.07 3.49 0.18 3.60 1.06 3.47 1.17 3.47 1.13 3.49 1.11 3.57 1.123.80 1.04 3.59 0.24 3.79 1.04 3.85 1.06 3.75 1.04 3.53 1.10 3.69 1.024.03 0.90 3.78 0.24 4.00 0.97 3.91 0.93 3.86 0.97 3.69 0.96 3.82 1.043.29 1.01 3.44 0.33 3.73 1.00 3.56 1.07 3.57 0.96 3.11 1.09 3.35 1.053.31 1.27 3.61 0.39 3.88 1.16 3.67 1.29 3.77 1.07 3.30 1.33 3.45 1.323.34 1.25 3.59 0.37 3.84 1.13 3.68 1.30 3.72 1.18 3.20 1.31 3.48 1.252.96 1.27 3.26 0.38 3.67 1.18 3.46 1.24 3.32 1.28 2.81 1.32 3.15 1.323.55 1.14 3.60 0.35 3.94 1.05 3.77 1.26 4.09 0.98 3.24 1.35 3.44 1.343.40 1.12 3.46 0.32 3.58 1.24 3.48 1.27 3.32 1.31 3.15 1.24 3.34 1.232.86 1.36 3.04 0.40 3.30 1.40 3.10 1.46 3.00 1.39 2.86 1.36 2.99 1.353.61 1.28 3.55 0.42 3.89 1.14 3.75 1.31 3.76 1.25 3.24 1.27 3.60 1.173.12 0.87 3.33 0.27 3.53 1.03 3.61 0.98 3.45 0.91 3.07 0.93 3.19 1.023.66 1.23 3.59 0.41 4.13 1.07 4.01 1.23 3.91 1.14 3.65 1.23 3.75 1.223.56 1.17 3.89 0.33 3.87 1.18 4.10 1.03 3.88 1.07 3.58 1.12 3.76 1.263.07 1.11 3.31 0.32 3.50 1.22 3.56 1.22 3.20 1.21 3.03 1.24 3.14 1.283.00 1.12 3.28 0.32 3.46 1.21 3.45 1.26 3.49 1.17 2.87 1.23 3.10 1.312.75 1.15 3.08 0.39 3.14 1.24 3.26 1.25 3.20 1.24 2.63 1.20 2.79 1.202.75 1.06 2.86 0.28 3.07 1.21 3.20 1.25 3.02 1.25 2.62 1.21 2.53 1.233.78 0.74 3.82 0.21 3.99 0.69 3.94 0.92 3.96 0.85 3.66 0.77 3.92 0.783.75 1.00 3.76 0.39 3.99 1.06 3.86 1.19 3.89 1.09 3.59 1.08 3.87 1.144.01 0.86 4.13 0.23 4.31 0.76 4.17 1.01 4.09 1.08 3.88 1.05 4.18 0.933.73 0.93 3.85 0.23 4.09 0.87 4.09 1.00 4.13 1.06 3.62 0.92 4.01 1.033.79 0.91 3.89 0.25 3.96 0.95 3.99 1.09 4.02 1.05 3.64 0.98 3.91 1.003.72 0.88 3.74 0.25 3.78 0.83 3.87 1.01 3.98 1.03 3.55 0.96 3.80 0.963.67 0.88 3.63 0.23 3.79 0.85 3.89 1.03 3.81 1.03 3.52 0.95 3.67 0.923.69 1.04 3.61 0.28 3.92 0.94 3.78 1.03 4.18 0.84 3.65 1.03 3.67 1.033.85 1.15 3.69 0.31 4.05 1.10 3.86 1.24 4.23 1.04 3.69 1.32 3.87 1.143.63 1.32 3.47 0.41 3.78 1.33 3.73 1.34 4.51 0.83 3.97 1.20 3.63 1.283.83 1.22 3.79 0.31 4.12 1.09 3.93 1.25 4.18 1.08 3.85 1.17 3.84 1.203.78 1.24 3.74 0.28 4.11 1.09 3.92 1.19 4.14 1.11 3.67 1.23 3.74 1.243.58 1.26 3.53 0.30 3.88 1.16 3.68 1.28 3.81 1.20 3.35 1.29 3.54 1.263.82 1.21 3.74 0.29 4.14 1.09 4.01 1.14 4.23 1.06 3.71 1.20 3.84 1.153.48 1.33 3.46 0.38 3.46 1.26 3.43 1.30 4.25 0.99 3.40 1.27 3.33 1.343.08 1.33 3.08 0.34 3.32 1.34 3.57 1.32 3.69 1.18 3.03 1.34 3.33 1.36
38
University of Arizona COACHE Survey Results for T/TE and C/CE Faculty.

The Collaborative on Academic Careers in Higher Education (COACHE)Faculty Job Satisfaction Survey 2013-14
MEANS AND STANDARD DEVIATIONS
University of Arizona
item short nameQ170A Priorities are stated consistentlyQ170C Priorities are acted on consistentlyQ170D Changed priorities negatively affect my work**
Benchmark: Leadership: SeniorQ180A Pres/Chancellor: Pace of decision makingQ180B Pres/Chancellor: Stated prioritiesQ180C Pres/Chancellor: Communication of prioritiesQ180L CAO: Pace of decision makingQ180M CAO: Stated prioritiesQ180N CAO: Communication of prioritiesQ180O CAO: Ensuring faculty inputQ175C CAO: Support in adapting to change
Benchmark: Leadership: DivisionalQ185D Dean: Pace of decision makingQ185E Dean: Stated prioritiesQ185F Dean: Communication of prioritiesQ185G Dean: Ensuring faculty inputQ175A Dean: Support in adapting to change
Benchmark: Leadership: DepartmentalQ185H Head/Chair: Pace of decision makingQ185I Head/Chair: Stated prioritiesQ185J Head/Chair: Communication of prioritiesQ185K Head/Chair: Ensuring faculty inputQ185L Head/Chair: Fairness in evaluating workQ175B Head/Chair: Support in adapting to change
Benchmark: Departmental collegialityQ200C Colleagues support work/life balanceQ200D Meeting times compatible with personal needsQ205B Amount of personal interaction w/Pre-tenureQ205C How well you fitQ205E Amount of personal interaction w/TenuredQ210A Colleagues pitch in when neededQ210C Dept. is collegialQ212A Colleagues committed to diversity/inclusion
Benchmark: Departmental engagementQ190A Discussions of undergrad student learningQ190B Discussions of grad student learning
by Race/Ethnicity
mean sd mean sd mean sd mean sd mean sd mean sd mean sdpeer 2 peer 3white
you peer 4All peer 5peer 1
2.67 1.17 2.78 0.34 2.78 1.18 2.94 1.27 2.62 1.22 2.73 1.19 2.64 1.152.43 1.10 2.59 0.33 2.62 1.16 2.78 1.24 2.48 1.17 2.59 1.15 2.53 1.132.41 1.20 2.73 0.38 2.81 1.30 2.92 1.38 2.45 1.30 2.53 1.24 2.93 1.283.06 0.86 3.09 0.33 3.21 0.84 3.18 1.01 3.01 0.93 2.69 0.86 2.89 0.923.09 0.90 3.17 0.37 3.34 0.92 3.22 1.05 3.04 1.08 2.65 0.97 3.00 0.962.97 1.07 3.13 0.39 3.29 1.05 3.22 1.10 2.95 1.22 2.55 1.02 3.01 1.043.19 1.04 3.09 0.43 3.30 1.02 3.20 1.16 2.88 1.18 2.42 1.07 2.84 1.093.07 0.97 3.08 0.33 3.13 0.94 3.17 1.08 3.11 1.05 2.94 0.98 2.92 1.063.01 1.05 3.05 0.34 3.09 1.01 3.14 1.15 3.07 1.13 2.87 1.05 2.85 1.123.09 1.06 3.02 0.36 3.09 1.02 3.08 1.19 3.01 1.14 2.76 1.09 2.74 1.12N/A N/A N/A N/A N/A N/A N/A N/A N/A N/A N/A N/A N/A N/AN/A N/A N/A N/A N/A N/A N/A N/A N/A N/A N/A N/A N/A N/A2.93 1.06 3.19 0.30 3.03 1.06 3.18 1.21 2.99 1.20 3.24 1.09 3.26 1.133.01 1.14 3.28 0.29 3.06 1.13 3.30 1.24 3.07 1.24 3.30 1.10 3.43 1.112.95 1.18 3.20 0.30 3.01 1.17 3.21 1.27 2.99 1.29 3.18 1.18 3.38 1.222.93 1.19 3.19 0.31 3.06 1.17 3.19 1.31 2.93 1.33 3.26 1.25 3.22 1.272.84 1.20 3.10 0.32 3.00 1.19 3.03 1.34 2.96 1.37 3.21 1.27 3.05 1.282.48 1.32 2.67 0.38 2.48 1.30 2.51 1.35 2.47 1.32 2.66 1.27 2.81 1.373.46 1.13 3.69 0.22 3.57 1.14 3.67 1.26 3.85 1.08 3.28 1.19 3.54 1.163.39 1.21 3.64 0.24 3.53 1.22 3.68 1.31 3.85 1.09 3.21 1.28 3.52 1.203.35 1.26 3.59 0.22 3.47 1.26 3.58 1.37 3.72 1.19 3.19 1.34 3.42 1.313.39 1.30 3.60 0.24 3.52 1.30 3.62 1.41 3.81 1.23 3.17 1.37 3.37 1.323.51 1.32 3.74 0.25 3.61 1.31 3.60 1.43 3.90 1.26 3.20 1.42 3.54 1.313.73 1.21 3.91 0.21 3.74 1.24 3.88 1.27 4.11 1.11 3.58 1.27 3.81 1.243.13 1.44 3.27 0.38 3.03 1.38 3.21 1.49 3.29 1.32 3.02 1.36 2.97 1.443.76 0.79 3.87 0.14 3.72 0.78 3.79 0.80 3.90 0.72 3.59 0.78 3.77 0.853.43 1.16 3.73 0.18 3.59 1.13 3.60 1.09 3.67 1.08 3.48 1.08 3.72 1.094.07 1.03 4.09 0.14 4.06 1.11 4.15 1.05 4.19 0.99 3.85 1.12 4.03 1.083.67 0.92 3.77 0.14 3.58 0.91 3.77 0.97 3.74 0.91 3.59 0.94 3.73 0.943.59 1.20 3.80 0.22 3.50 1.25 3.69 1.22 3.70 1.19 3.42 1.26 3.63 1.273.64 0.96 3.74 0.16 3.60 0.97 3.67 0.99 3.75 0.98 3.48 1.02 3.65 1.003.70 1.16 3.81 0.21 3.69 1.17 3.70 1.18 3.82 1.14 3.41 1.19 3.69 1.213.97 1.19 3.99 0.23 3.87 1.21 3.86 1.25 4.13 1.13 3.67 1.26 3.85 1.273.96 1.11 4.05 0.17 3.94 1.07 3.91 1.21 4.17 1.00 3.84 1.10 3.92 1.123.44 0.72 3.48 0.12 3.41 0.77 3.41 0.78 3.56 0.71 3.41 0.74 3.47 0.793.27 1.15 3.71 0.37 3.08 1.26 3.08 1.27 3.36 1.17 3.45 1.12 3.25 1.263.62 1.03 2.98 0.76 3.56 1.11 3.73 1.08 3.76 1.01 3.57 1.05 3.72 1.10
39
University of Arizona COACHE Survey Results for T/TE and C/CE Faculty.

The Collaborative on Academic Careers in Higher Education (COACHE)Faculty Job Satisfaction Survey 2013-14
MEANS AND STANDARD DEVIATIONS
University of Arizona
item short nameQ190C Discussions of effective teaching practicesQ190D Discussions of effective use of technologyQ190E Discussions of current research methodsQ205A Amount of professional interaction w/Pre-tenureQ205D Amount of professional interaction w/Tenured
Benchmark: Departmental qualityQ195A Intellectual vitality of tenured facultyQ195B Intellectual vitality of pre-tenure facultyQ195C Scholarly productivity of tenured facultyQ195D Scholarly productivity of pre-tenure facultyQ195G Teaching effectiveness of tenured facultyQ195H Teaching effectiveness of pre-tenure facultyQ240B Dept. is successful at faculty recruitmentQ240C Dept. is successful at faculty retentionQ240D Dept. addresses sub-standard performance
Benchmark: Appreciation and recognitionQ215A Recognition: For teachingQ215B Recognition: For advisingQ215C Recognition: For scholarshipQ215D Recognition: For serviceQ215E Recognition: For outreachQ215I Recognition: From colleaguesQ215J Recognition: From CAOQ215K Recognition: From DeanQ215L Recognition: From Head/ChairQ220A School/college is valued by Pres/ProvostQ220B Dept. is valued by Pres/ProvostQ245A CAO cares about faculty of my rankQ240A Outside offers are necessary in negotiationsQ212B Visible leadership for support of diversityQ245D I would again choose this institutionQ250A Department as a place to workQ250B Institution as a place to work
by Race/Ethnicity
mean sd mean sd mean sd mean sd mean sd mean sd mean sdpeer 2 peer 3white
you peer 4All peer 5peer 1
3.17 1.04 3.52 0.24 3.19 1.07 3.13 1.06 3.31 1.03 3.21 1.01 3.28 1.053.17 1.00 3.30 0.21 3.14 1.00 3.02 1.06 3.11 1.01 3.11 1.01 3.17 1.063.29 1.08 3.09 0.27 3.41 1.11 3.38 1.15 3.56 1.10 3.23 1.10 3.34 1.133.85 0.89 3.88 0.13 3.75 0.92 3.84 1.02 3.94 0.86 3.72 0.95 3.81 0.973.75 0.98 3.81 0.17 3.72 0.99 3.70 1.04 3.86 0.99 3.61 1.03 3.70 1.053.56 0.77 3.57 0.19 3.67 0.74 3.57 0.79 3.95 0.69 3.41 0.75 3.61 0.803.66 1.10 3.58 0.24 3.75 1.06 3.60 1.10 4.09 0.90 3.41 1.13 3.65 1.134.05 0.92 4.03 0.19 4.13 0.92 4.14 0.87 4.29 0.84 4.00 0.86 4.04 0.933.58 1.11 3.39 0.29 3.73 1.05 3.48 1.13 4.11 0.93 3.31 1.10 3.61 1.113.93 0.96 3.84 0.25 4.04 0.88 3.95 0.94 4.23 0.86 3.84 0.87 3.89 0.963.64 0.99 3.67 0.20 3.67 0.93 3.54 1.06 3.97 0.91 3.49 0.99 3.71 0.993.89 0.84 3.92 0.16 3.92 0.81 3.83 0.91 4.14 0.77 3.73 0.84 3.86 0.853.59 1.19 3.58 0.30 3.69 1.18 3.61 1.26 4.06 1.04 3.42 1.19 3.66 1.193.02 1.26 3.45 0.28 3.47 1.20 3.22 1.21 3.79 1.10 3.14 1.18 3.42 1.192.54 1.16 2.59 0.22 2.61 1.17 2.57 1.22 2.75 1.16 2.36 1.15 2.63 1.213.19 0.78 3.27 0.19 3.25 0.80 3.25 0.92 3.32 0.82 3.12 0.83 3.29 0.803.23 1.10 3.33 0.20 3.27 1.12 3.23 1.18 3.37 1.12 3.19 1.12 3.36 1.103.03 1.01 3.02 0.20 3.08 1.05 3.03 1.12 3.16 1.10 2.95 1.03 3.13 1.033.29 1.11 3.31 0.23 3.46 1.11 3.41 1.22 3.67 1.12 3.39 1.08 3.45 1.063.13 1.09 3.11 0.20 3.17 1.09 3.15 1.21 3.20 1.15 3.02 1.09 3.17 1.093.12 1.03 3.07 0.18 3.09 0.98 3.08 1.06 3.11 1.04 3.03 1.05 3.14 0.953.64 1.00 3.69 0.19 3.67 1.03 3.58 1.08 3.87 0.99 3.47 1.09 3.58 1.062.64 1.08 2.90 0.33 2.83 1.03 2.92 1.21 2.85 1.14 2.79 1.09 2.79 1.132.95 1.23 3.10 0.26 3.00 1.23 2.94 1.32 3.09 1.33 3.14 1.24 3.26 1.203.45 1.23 3.66 0.20 3.48 1.27 3.50 1.34 3.78 1.16 3.38 1.27 3.55 1.253.36 1.25 3.43 0.38 3.29 1.26 3.59 1.32 3.22 1.38 3.07 1.36 3.52 1.223.01 1.23 3.17 0.38 3.15 1.20 3.19 1.40 3.02 1.35 2.80 1.31 3.31 1.263.01 1.18 3.11 0.33 3.14 1.17 3.08 1.29 3.14 1.20 2.90 1.17 2.98 1.231.86 1.23 2.41 0.51 1.94 1.24 2.07 1.21 1.87 1.22 2.04 1.24 2.02 1.203.70 1.11 3.81 0.27 3.87 1.10 3.62 1.25 4.01 1.10 3.93 1.04 3.91 1.083.55 1.28 3.72 0.27 3.85 1.22 3.71 1.24 3.95 1.19 3.65 1.26 3.73 1.243.72 1.14 3.85 0.20 3.78 1.17 3.76 1.19 3.93 1.11 3.61 1.15 3.80 1.153.44 1.06 3.58 0.30 3.81 1.01 3.64 1.10 3.72 1.07 3.58 1.08 3.67 1.03
40
University of Arizona COACHE Survey Results for T/TE and C/CE Faculty.

The Collaborative on Academic Careers in Higher Education (COACHE)Faculty Job Satisfaction Survey 2013-14
MEANS AND STANDARD DEVIATIONS
University of Arizona
item short nameBenchmark: Nature of Work Research
Q45B Time spent on researchQ80A Expectations for finding external fundingQ80B Influence over focus of researchQ80C Quality of grad students to support researchQ80D Support for researchQ80E Support for engaging undergrads in researchQ85A Support for obtaining grants (pre-award)Q85B Support for maintaining grants (post-award)Q85C Support for securing grad student assistanceQ85D Support for travel to present/conduct researchQ85E Availability of course release for research
Benchmark: Nature of Work: ServiceQ45C Time spent on serviceQ55B Support for faculty in leadership rolesQ60A Number of committeesQ60B Attractiveness of committeesQ60C Discretion to choose committeesQ60D Equitability of committee assignmentsQ60E Number of student advisees
Benchmark: Nature of Work: TeachingQ45A Time spent on teachingQ70A Number of courses taughtQ70B Level of courses taughtQ70C Discretion over course contentQ70D Number of students in classes taughtQ70E Quality of students taughtQ70H Equitability of distribution of teaching loadQ70I Quality of grad students to support teachingQ45D Time spent on outreachQ45E Time spent on administrative tasksQ55A Ability to balance teaching/research/service
Benchmark: Facilities and work resourcesQ70F Support for improving teachingQ90A OfficeQ90B Laboratory, research, studio spaceQ90C Equipment
by Race/Ethnicity
mean sd mean sd mean sd mean sd mean sd mean sd mean sd3.07 0.68 3.11 0.26 3.41 0.70 3.32 0.74 3.24 0.73 3.34 0.75 3.42 0.783.65 1.18 3.30 0.42 3.75 1.16 3.76 0.97 3.71 1.11 3.75 1.06 3.86 1.032.99 1.07 3.05 0.27 3.18 1.03 3.37 0.83 3.18 1.06 3.22 1.06 3.18 1.094.35 0.79 4.10 0.28 4.32 0.78 4.33 0.67 4.34 0.75 4.21 0.93 4.17 0.913.30 1.14 2.82 0.75 3.58 1.05 3.37 1.01 3.31 1.06 3.38 1.09 3.35 1.202.48 1.10 2.84 0.33 3.17 1.19 2.92 1.28 2.72 1.12 2.90 1.27 3.13 1.152.61 1.05 3.01 0.36 3.32 1.00 3.24 1.02 2.92 0.92 3.25 1.04 3.38 1.082.79 1.16 3.01 0.33 3.18 1.07 3.07 1.19 2.96 1.11 3.56 1.22 3.34 1.242.98 1.18 3.11 0.36 3.40 1.05 3.12 1.04 3.09 1.05 3.30 1.15 3.33 1.152.59 1.05 2.67 0.66 3.02 1.01 2.97 1.12 2.90 1.05 2.96 1.13 3.18 1.102.99 1.25 3.16 0.39 3.31 1.17 3.18 1.27 3.30 1.13 3.27 1.13 3.29 1.292.82 1.14 2.52 0.43 2.98 1.13 2.84 1.25 2.70 1.09 2.86 1.25 3.10 1.243.18 0.79 3.28 0.21 3.32 0.75 3.42 0.92 3.25 0.74 3.22 0.93 3.51 0.773.56 0.97 3.42 0.27 3.44 1.02 3.48 1.10 3.24 1.00 3.34 1.06 3.69 0.932.57 1.26 2.85 0.34 3.02 1.33 3.12 1.22 2.85 1.34 2.99 1.32 3.06 1.353.36 0.94 3.45 0.27 3.52 0.88 3.59 0.99 3.41 0.84 3.50 1.05 3.68 0.793.31 0.97 3.44 0.21 3.43 0.88 3.48 0.99 3.40 0.82 3.33 1.07 3.53 0.883.36 1.08 3.45 0.25 3.38 0.93 3.52 1.12 3.53 0.90 3.19 1.20 3.65 0.992.88 1.17 3.07 0.28 3.07 1.07 3.23 1.31 2.95 1.11 3.01 1.24 3.29 1.103.68 1.07 3.46 0.32 3.62 0.82 3.80 1.08 3.80 0.80 3.73 0.98 3.65 0.973.66 0.72 3.64 0.22 3.78 0.60 3.71 0.72 3.71 0.57 3.67 0.72 3.78 0.693.81 0.95 3.82 0.23 3.88 0.90 3.75 0.99 3.83 0.90 3.82 0.94 3.88 0.963.99 0.90 3.56 0.43 4.01 0.76 3.85 0.98 3.78 0.96 3.89 1.06 3.91 0.943.92 0.96 3.92 0.24 3.99 0.76 3.97 0.91 3.98 0.80 3.82 1.03 4.05 0.834.28 0.86 4.28 0.18 4.31 0.73 4.22 0.82 4.33 0.74 4.24 0.86 4.34 0.743.78 1.09 3.64 0.29 3.74 0.98 3.72 1.08 3.61 1.07 3.67 1.07 3.83 1.073.10 1.08 3.24 0.38 3.54 0.93 3.33 1.01 3.42 0.94 3.20 1.05 3.47 1.133.03 1.21 3.27 0.27 3.20 1.13 3.32 1.25 3.20 1.12 3.19 1.26 3.30 1.133.24 1.22 2.96 0.74 3.52 1.03 3.49 1.05 3.54 0.93 3.37 1.07 3.43 1.183.64 0.88 3.48 0.24 3.63 0.80 3.48 0.67 3.48 0.76 3.56 0.93 3.62 0.883.03 1.06 3.05 0.29 3.01 1.00 3.39 0.85 2.95 1.02 3.13 1.03 3.38 1.023.31 1.28 3.27 0.36 3.57 1.26 3.74 1.10 3.37 1.21 3.53 1.18 3.74 1.243.34 0.74 3.41 0.26 3.61 0.63 3.50 0.70 3.34 0.68 3.49 0.67 3.53 0.792.91 1.03 3.22 0.29 3.44 0.98 3.35 1.01 3.07 0.97 3.33 1.06 3.31 1.093.69 1.09 3.68 0.28 3.73 1.03 3.65 1.11 3.59 1.04 3.67 0.96 3.84 0.913.24 1.23 3.15 0.35 3.53 1.09 3.49 1.07 3.20 1.15 3.33 1.10 3.26 1.263.17 1.19 3.36 0.30 3.49 0.98 3.33 1.06 3.31 0.99 3.41 0.95 3.48 1.14
faculty of colorAllyou peer 2 peer 3peer 1 peer 4 peer 5
41
University of Arizona COACHE Survey Results for T/TE and C/CE Faculty.

The Collaborative on Academic Careers in Higher Education (COACHE)Faculty Job Satisfaction Survey 2013-14
MEANS AND STANDARD DEVIATIONS
University of Arizona
item short nameQ90D ClassroomsQ90E Library resourcesQ90F Computing and technical supportQ90H Clerical/administrative support
Benchmark: Personal and family policiesQ95D Housing benefitsQ95E Tuition waivers, remission, or exchangeQ95F Spousal/partner hiring programQ95G ChildcareQ95H EldercareQ95J Family medical/parental leaveQ95K Flexible workload/modified dutiesQ95L Stop-the-clock policiesQ200B Inst. does what it can for work/life compatibilityQ200A Right balance between professional/personal
Benchmark: Health and retirement benefitsQ95A Health benefits for yourselfQ95B Health benefits for familyQ95C Retirement benefitsQ95I Phased retirement optionsQ90G Salary
Benchmark: Interdisciplinary workQ100A Budgets encourage interdiscip. workQ100B Facilities conducive to interdiscip. workQ100C Interdiscip. work is rewarded in meritQ100D Interdiscip. work is rewarded in promotionQ100E Interdiscip. work is rewarded in tenureQ100G Dept. knows how to evaluate interdiscip. work
Benchmark: CollaborationQ105A Opportunities for collab. within dept.Q105E Opportunities for collab. outside dept.Q105D Opportunities for collab. outside inst.
Benchmark: MentoringQ125A Effectiveness of mentoring within dept.Q125B Effectiveness of mentoring outside dept.Q130A Mentoring of pre-tenure facultyQ130B Mentoring of associate faculty
by Race/Ethnicity
mean sd mean sd mean sd mean sd mean sd mean sd mean sd
faculty of colorAllyou peer 2 peer 3peer 1 peer 4 peer 5
3.42 1.05 3.42 0.33 3.72 0.94 3.48 1.03 3.33 0.93 3.60 1.01 3.46 1.113.81 1.02 3.64 0.38 4.15 0.72 3.78 0.89 3.78 0.84 3.71 0.95 3.70 1.033.21 1.14 3.44 0.36 3.55 0.94 3.64 0.88 3.23 1.12 3.38 1.08 3.60 1.203.15 1.22 3.25 0.36 3.28 1.12 3.33 1.21 3.00 1.20 3.45 1.09 3.47 1.223.22 0.83 3.00 0.27 3.04 0.91 3.21 0.88 3.08 0.80 3.04 0.91 3.21 0.822.16 1.18 2.19 0.51 2.75 0.99 2.49 0.99 3.27 1.05 2.57 1.05 2.85 1.043.81 0.88 2.77 0.67 2.44 0.98 2.57 1.21 1.93 0.99 3.00 1.12 3.15 0.962.88 1.16 2.47 0.46 2.67 1.10 3.04 1.39 2.85 1.14 2.63 1.22 2.83 1.082.53 0.93 2.65 0.50 2.67 0.95 2.80 1.07 2.81 0.86 2.82 1.01 2.63 0.882.87 0.81 2.78 0.51 3.22 0.85 3.11 0.64 2.79 0.70 2.60 0.99 3.04 0.803.38 0.99 3.29 0.37 3.44 1.07 3.26 1.02 3.51 0.90 3.39 0.96 3.52 0.893.44 1.10 3.36 0.34 3.60 1.04 3.45 1.10 3.46 0.95 3.47 1.05 3.51 0.863.57 1.20 3.28 0.70 4.10 1.25 3.62 1.02 3.63 0.74 3.68 0.91 3.43 0.812.89 1.25 3.00 0.35 3.00 1.17 3.33 1.21 3.07 1.12 2.92 1.20 3.06 1.263.14 1.30 3.32 0.33 3.22 1.29 3.61 1.09 3.32 1.26 3.36 1.26 3.36 1.343.69 0.71 3.45 0.37 3.92 0.67 3.67 0.70 3.73 0.61 3.23 0.92 3.50 0.873.90 0.78 3.57 0.43 4.01 0.74 3.87 0.75 3.85 0.64 3.23 1.06 3.61 0.963.85 0.88 3.46 0.55 3.91 0.84 3.71 0.72 3.81 0.70 3.18 1.04 3.58 0.983.43 0.83 3.42 0.36 3.96 0.88 3.53 0.88 3.76 0.85 3.31 1.05 3.45 1.073.15 0.93 3.16 0.34 3.52 0.72 3.23 0.93 3.02 0.74 3.25 1.01 3.28 0.842.60 1.22 2.70 0.46 2.95 1.16 3.41 1.09 3.07 1.17 2.77 1.18 3.02 1.302.71 0.91 2.67 0.30 2.72 0.93 2.88 1.13 2.69 0.95 2.86 1.01 3.04 1.062.45 1.13 2.55 0.37 2.58 1.14 3.03 1.22 2.63 1.16 2.82 1.22 3.00 1.112.68 1.12 2.71 0.36 2.79 1.12 2.66 1.31 2.64 1.20 3.06 1.25 3.17 1.192.73 1.17 2.58 0.36 2.75 1.09 2.73 1.32 2.63 1.15 2.73 1.17 2.91 1.252.80 1.21 2.55 0.34 2.81 1.10 2.57 1.25 2.63 1.13 2.69 1.21 2.84 1.212.84 0.99 2.86 0.41 2.65 1.23 3.09 1.33 2.40 0.97 2.93 1.18 3.21 1.242.99 1.24 2.77 0.35 2.73 1.21 3.03 1.40 2.97 1.29 2.76 1.24 3.02 1.353.56 0.85 3.42 0.25 3.57 0.88 3.56 0.92 3.57 0.80 3.54 0.83 3.54 0.943.52 1.13 3.44 0.28 3.44 1.17 3.57 1.13 3.54 1.05 3.38 1.10 3.52 1.173.44 1.05 3.30 0.27 3.49 1.06 3.39 1.13 3.40 1.02 3.54 1.10 3.57 1.103.70 1.02 3.51 0.32 3.76 0.94 3.72 1.10 3.76 0.96 3.71 0.94 3.56 1.073.02 0.99 3.04 0.26 3.12 1.11 3.30 1.05 3.01 0.95 3.08 1.06 3.08 1.023.62 1.28 3.64 0.29 3.69 1.34 3.59 1.25 3.70 1.18 3.54 1.30 3.66 1.213.82 0.96 3.47 0.32 3.70 1.04 3.52 1.09 3.59 1.00 3.46 1.07 3.49 1.142.93 1.38 3.06 0.35 3.32 1.36 3.50 1.28 3.03 1.29 3.17 1.36 3.00 1.302.30 1.15 2.38 0.33 2.34 1.18 2.48 1.30 2.47 1.19 2.57 1.32 2.47 1.26
42
University of Arizona COACHE Survey Results for T/TE and C/CE Faculty.

The Collaborative on Academic Careers in Higher Education (COACHE)Faculty Job Satisfaction Survey 2013-14
MEANS AND STANDARD DEVIATIONS
University of Arizona
item short nameQ130C Support for faculty to be good mentorsQ115 Being a mentor is fulfillingQ120A Importance of mentoring within dept.Q120B Importance of mentoring outside dept.Q120C Importance of mentoring outside inst.Q125C Effectiveness of mentoring outside the inst.
Benchmark: Tenure policiesQ136A Clarity of tenure processQ136B Clarity of tenure criteriaQ136C Clarity of tenure standardsQ136D Clarity of body of evidence for deciding tenureQ136E Clarity of whether I will achieve tenureQ139A Consistency of messages about tenureQ139B Tenure decisions are performance-based
Benchmark: Tenure clarityQ137A Clarity of expectations: ScholarQ137B Clarity of expectations: TeacherQ137C Clarity of expectations: AdvisorQ137D Clarity of expectations: ColleagueQ137E Clarity of expectations: Campus citizenQ137F Clarity of expectations: Broader community
Benchmark: Tenure reasonablenessQ138A Reasonable expectations: ScholarQ138B Reasonable expectations: TeacherQ138C Reasonable expectations: AdvisorQ138D Reasonable expectations: ColleagueQ138E Reasonable expectations: Campus citizenQ138F Reasonable expectations: Community member
Benchmark: PromotionQ135C Reasonable expectations: PromotionQ135B Dept. culture encourages promotionQ140A Clarity of promotion processQ140B Clarity of promotion criteriaQ140C Clarity of promotion standardsQ140D Clarity of body of evidence for promotionQ140E Clarity of time frame for promotionQ140F Clarity of whether I will be promoted
by Race/Ethnicity
mean sd mean sd mean sd mean sd mean sd mean sd mean sd
faculty of colorAllyou peer 2 peer 3peer 1 peer 4 peer 5
2.22 1.06 2.30 0.30 2.27 1.03 2.57 1.30 2.20 0.99 2.44 1.18 2.43 1.154.30 0.87 4.21 0.24 4.23 0.71 4.17 0.88 4.31 0.81 4.11 1.06 4.11 1.094.33 0.90 4.24 0.24 4.27 0.94 4.11 1.09 4.29 0.77 4.33 0.95 4.22 1.053.88 1.08 3.79 0.27 3.71 1.02 3.63 1.10 3.81 0.86 3.67 1.10 3.78 1.163.94 1.04 3.83 0.29 3.81 0.97 3.89 1.10 3.89 0.90 3.72 1.11 3.88 1.114.00 0.96 3.84 0.30 3.88 1.00 3.84 1.07 3.98 0.85 3.80 0.96 3.76 1.093.34 0.96 3.54 0.37 3.69 0.93 3.73 0.96 3.62 0.88 3.69 0.78 3.57 1.013.46 1.22 3.69 0.44 3.86 1.13 4.03 1.17 3.73 1.34 3.89 0.92 3.81 1.053.32 1.20 3.67 0.40 3.86 1.07 3.82 1.14 3.87 1.30 3.80 0.86 3.66 1.203.08 1.30 3.42 0.42 3.58 1.23 3.66 1.10 3.47 1.19 3.58 0.92 3.49 1.273.70 1.10 3.66 0.41 3.94 1.07 3.71 1.09 3.93 1.10 3.98 0.69 3.71 1.213.43 1.09 3.55 0.38 3.74 1.17 3.61 1.08 3.33 1.40 3.36 1.11 3.62 1.212.78 1.25 3.14 0.47 3.09 1.27 3.61 1.15 3.13 0.99 3.49 1.31 3.10 1.433.66 1.14 3.66 0.40 3.73 1.15 3.68 1.11 3.87 1.36 3.91 1.10 3.83 1.123.36 0.92 3.51 0.29 3.55 1.06 3.62 0.90 3.64 0.92 3.56 0.86 3.57 1.004.08 0.92 3.91 0.37 4.14 1.15 4.40 0.79 4.00 1.00 4.02 0.98 3.93 1.133.62 1.05 3.95 0.31 3.91 1.15 3.87 0.96 4.20 0.86 3.91 1.01 3.88 1.053.19 1.14 3.46 0.40 3.58 1.30 3.57 1.19 3.71 1.07 3.54 1.11 3.45 1.283.22 1.21 3.41 0.37 3.47 1.32 3.43 1.09 3.40 1.24 3.35 1.06 3.61 1.242.97 1.17 3.25 0.36 3.11 1.28 3.16 1.19 3.27 1.03 3.28 1.07 3.33 1.393.00 1.23 3.09 0.33 3.06 1.31 3.22 1.21 3.27 1.10 3.27 1.12 3.13 1.383.73 0.66 3.84 0.25 4.00 0.83 3.90 0.94 4.26 0.61 3.87 0.70 3.98 0.703.89 0.85 3.94 0.37 4.30 0.92 4.00 1.12 4.20 0.68 3.98 1.11 3.98 1.033.82 0.88 4.04 0.29 4.27 1.07 4.03 1.05 4.47 0.64 4.09 0.76 4.08 0.923.83 0.71 3.88 0.31 4.12 0.95 3.89 1.05 4.29 0.73 3.84 0.85 4.10 0.853.71 0.99 3.87 0.31 3.97 1.05 3.74 1.05 4.33 0.82 3.82 0.81 4.03 0.873.60 0.85 3.74 0.24 3.77 0.90 3.70 0.95 4.07 0.80 3.73 0.75 3.95 0.853.63 0.81 3.64 0.28 3.63 1.10 3.67 0.96 4.13 0.74 3.76 0.77 3.87 0.953.49 1.09 3.47 0.35 3.68 0.99 3.68 1.08 3.91 0.98 3.42 1.20 3.74 1.073.84 1.15 3.57 0.37 3.85 1.15 3.83 1.17 3.93 1.10 3.48 1.36 3.88 1.063.32 1.44 3.19 0.52 3.62 1.29 3.40 1.43 4.12 1.13 3.56 1.38 3.72 1.353.61 1.25 3.68 0.38 3.91 1.19 3.88 1.24 4.00 1.18 3.60 1.42 4.01 1.203.53 1.32 3.60 0.38 3.87 1.15 3.86 1.25 3.97 1.14 3.46 1.40 3.83 1.213.34 1.32 3.41 0.42 3.63 1.21 3.70 1.22 3.58 1.22 3.11 1.45 3.67 1.283.55 1.35 3.61 0.37 3.81 1.13 3.88 1.14 3.98 1.12 3.48 1.33 3.78 1.313.49 1.26 3.37 0.45 3.38 1.24 3.31 1.36 3.98 1.15 3.15 1.38 3.44 1.373.15 1.35 3.04 0.42 3.16 1.17 3.35 1.37 3.50 1.15 3.07 1.32 3.29 1.34
43
University of Arizona COACHE Survey Results for T/TE and C/CE Faculty.

The Collaborative on Academic Careers in Higher Education (COACHE)Faculty Job Satisfaction Survey 2013-14
MEANS AND STANDARD DEVIATIONS
University of Arizona
item short nameQ170A Priorities are stated consistentlyQ170C Priorities are acted on consistentlyQ170D Changed priorities negatively affect my work**
Benchmark: Leadership: SeniorQ180A Pres/Chancellor: Pace of decision makingQ180B Pres/Chancellor: Stated prioritiesQ180C Pres/Chancellor: Communication of prioritiesQ180L CAO: Pace of decision makingQ180M CAO: Stated prioritiesQ180N CAO: Communication of prioritiesQ180O CAO: Ensuring faculty inputQ175C CAO: Support in adapting to change
Benchmark: Leadership: DivisionalQ185D Dean: Pace of decision makingQ185E Dean: Stated prioritiesQ185F Dean: Communication of prioritiesQ185G Dean: Ensuring faculty inputQ175A Dean: Support in adapting to change
Benchmark: Leadership: DepartmentalQ185H Head/Chair: Pace of decision makingQ185I Head/Chair: Stated prioritiesQ185J Head/Chair: Communication of prioritiesQ185K Head/Chair: Ensuring faculty inputQ185L Head/Chair: Fairness in evaluating workQ175B Head/Chair: Support in adapting to change
Benchmark: Departmental collegialityQ200C Colleagues support work/life balanceQ200D Meeting times compatible with personal needsQ205B Amount of personal interaction w/Pre-tenureQ205C How well you fitQ205E Amount of personal interaction w/TenuredQ210A Colleagues pitch in when neededQ210C Dept. is collegialQ212A Colleagues committed to diversity/inclusion
Benchmark: Departmental engagementQ190A Discussions of undergrad student learningQ190B Discussions of grad student learning
by Race/Ethnicity
mean sd mean sd mean sd mean sd mean sd mean sd mean sd
faculty of colorAllyou peer 2 peer 3peer 1 peer 4 peer 5
2.73 1.27 2.97 0.37 3.01 1.16 3.22 1.16 2.57 1.11 2.89 1.19 3.04 1.322.49 1.15 2.82 0.38 2.84 1.19 3.11 1.18 2.55 1.10 2.71 1.22 2.91 1.322.56 1.28 2.91 0.37 2.86 1.33 3.30 1.28 2.52 1.39 2.81 1.26 2.93 1.253.06 0.91 3.19 0.35 3.22 0.84 3.52 0.85 3.02 0.87 2.85 0.86 3.13 1.013.12 1.00 3.24 0.40 3.26 0.87 3.53 0.90 3.07 1.01 2.81 1.03 3.19 1.053.01 1.17 3.24 0.41 3.27 1.03 3.59 0.95 3.01 1.04 2.76 1.00 3.20 1.103.14 1.18 3.19 0.45 3.25 0.99 3.53 1.06 2.93 1.14 2.68 1.11 3.07 1.193.09 1.00 3.18 0.35 3.18 0.89 3.49 0.89 3.11 0.97 3.08 0.97 3.12 1.142.94 1.06 3.16 0.34 3.13 0.98 3.52 0.99 2.99 1.04 2.94 1.01 3.11 1.232.99 1.09 3.11 0.37 3.15 0.99 3.41 1.07 2.97 1.09 2.87 1.06 3.06 1.28N/A N/A N/A N/A N/A N/A N/A N/A N/A N/A N/A N/A N/A N/AN/A N/A N/A N/A N/A N/A N/A N/A N/A N/A N/A N/A N/A N/A2.89 1.07 3.29 0.35 3.16 1.08 3.51 1.13 3.09 1.06 3.23 1.10 3.41 1.162.95 1.16 3.35 0.36 3.21 1.08 3.61 1.11 3.25 1.11 3.30 1.10 3.46 1.172.94 1.16 3.30 0.36 3.18 1.19 3.53 1.16 3.06 1.15 3.22 1.21 3.51 1.242.88 1.20 3.30 0.36 3.12 1.21 3.54 1.22 3.06 1.11 3.23 1.22 3.35 1.302.83 1.20 3.23 0.37 3.15 1.17 3.36 1.30 3.00 1.20 3.19 1.23 3.30 1.262.44 1.27 2.57 0.43 2.37 1.17 2.47 1.12 2.69 1.44 2.55 1.34 2.58 1.423.52 1.24 3.58 0.31 3.56 1.11 3.75 1.06 3.75 1.08 3.35 1.20 3.70 1.213.44 1.34 3.57 0.32 3.62 1.14 3.82 1.05 3.82 1.12 3.43 1.23 3.72 1.283.43 1.34 3.51 0.31 3.46 1.27 3.73 1.15 3.63 1.18 3.35 1.27 3.64 1.303.46 1.34 3.53 0.32 3.53 1.26 3.64 1.20 3.68 1.21 3.37 1.37 3.69 1.283.50 1.39 3.63 0.35 3.57 1.28 3.68 1.29 3.80 1.24 3.20 1.32 3.75 1.303.74 1.31 3.69 0.31 3.67 1.29 3.85 1.12 3.99 1.10 3.35 1.37 3.67 1.272.94 1.58 3.06 0.45 2.81 1.33 2.75 1.34 3.45 1.36 2.86 1.46 2.81 1.493.60 0.81 3.71 0.21 3.54 0.86 3.59 0.95 3.71 0.79 3.53 0.83 3.60 0.853.43 1.13 3.57 0.27 3.39 1.12 3.56 1.16 3.41 1.01 3.39 1.11 3.51 1.063.84 1.09 3.96 0.23 3.84 1.06 3.75 1.28 3.97 1.11 3.80 1.06 3.78 1.133.58 0.93 3.65 0.22 3.56 0.91 3.71 0.98 3.58 0.95 3.47 0.95 3.46 0.943.54 1.22 3.68 0.29 3.38 1.19 3.71 1.13 3.57 1.09 3.45 1.24 3.57 1.173.59 0.98 3.56 0.27 3.40 1.02 3.47 1.07 3.66 0.94 3.51 0.89 3.43 0.993.57 1.12 3.77 0.26 3.65 1.08 3.61 1.16 3.66 1.11 3.43 1.24 3.56 1.183.69 1.26 3.87 0.31 3.69 1.32 3.73 1.26 3.97 1.16 3.65 1.19 3.82 1.253.56 1.21 3.71 0.31 3.44 1.32 3.62 1.32 3.90 1.13 3.51 1.24 3.70 1.253.32 0.86 3.37 0.19 3.30 0.73 3.42 0.75 3.42 0.78 3.36 0.79 3.34 0.833.21 1.27 3.53 0.37 3.05 1.14 3.05 1.24 3.36 1.11 3.35 1.10 3.16 1.243.49 1.17 3.00 0.68 3.51 1.06 3.62 0.99 3.56 1.05 3.63 1.10 3.63 1.10
44
University of Arizona COACHE Survey Results for T/TE and C/CE Faculty.
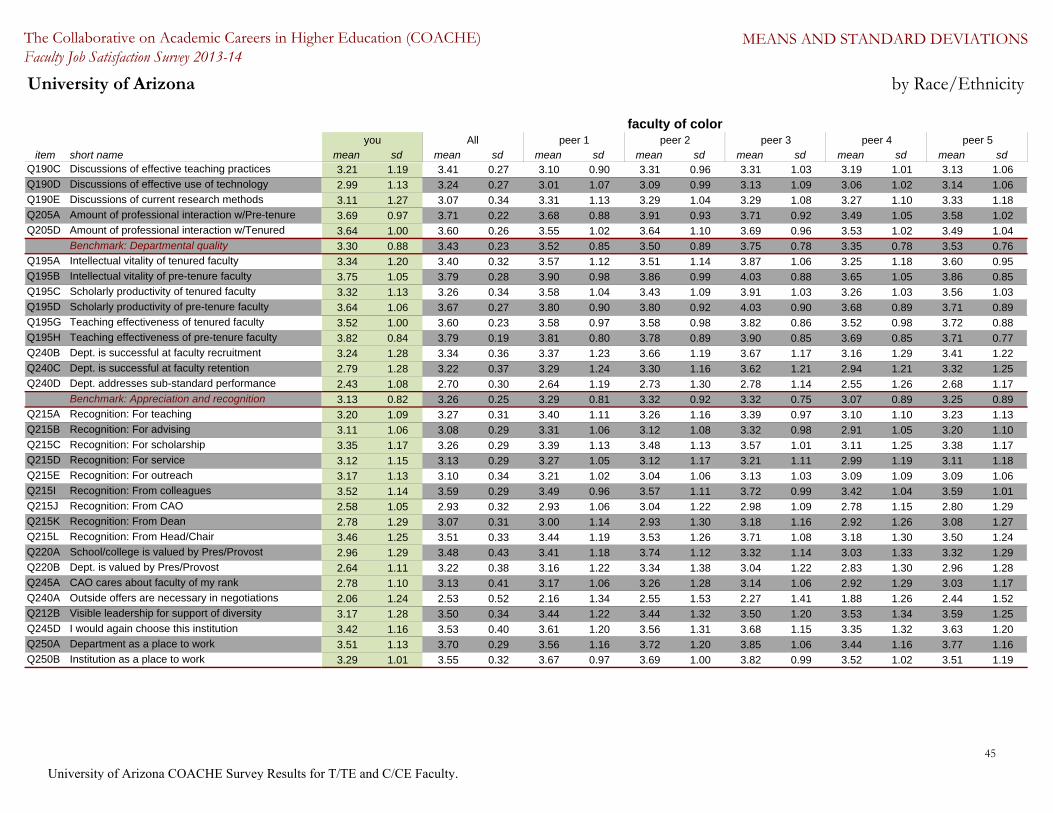
The Collaborative on Academic Careers in Higher Education (COACHE)Faculty Job Satisfaction Survey 2013-14
MEANS AND STANDARD DEVIATIONS
University of Arizona
item short nameQ190C Discussions of effective teaching practicesQ190D Discussions of effective use of technologyQ190E Discussions of current research methodsQ205A Amount of professional interaction w/Pre-tenureQ205D Amount of professional interaction w/Tenured
Benchmark: Departmental qualityQ195A Intellectual vitality of tenured facultyQ195B Intellectual vitality of pre-tenure facultyQ195C Scholarly productivity of tenured facultyQ195D Scholarly productivity of pre-tenure facultyQ195G Teaching effectiveness of tenured facultyQ195H Teaching effectiveness of pre-tenure facultyQ240B Dept. is successful at faculty recruitmentQ240C Dept. is successful at faculty retentionQ240D Dept. addresses sub-standard performance
Benchmark: Appreciation and recognitionQ215A Recognition: For teachingQ215B Recognition: For advisingQ215C Recognition: For scholarshipQ215D Recognition: For serviceQ215E Recognition: For outreachQ215I Recognition: From colleaguesQ215J Recognition: From CAOQ215K Recognition: From DeanQ215L Recognition: From Head/ChairQ220A School/college is valued by Pres/ProvostQ220B Dept. is valued by Pres/ProvostQ245A CAO cares about faculty of my rankQ240A Outside offers are necessary in negotiationsQ212B Visible leadership for support of diversityQ245D I would again choose this institutionQ250A Department as a place to workQ250B Institution as a place to work
by Race/Ethnicity
mean sd mean sd mean sd mean sd mean sd mean sd mean sd
faculty of colorAllyou peer 2 peer 3peer 1 peer 4 peer 5
3.21 1.19 3.41 0.27 3.10 0.90 3.31 0.96 3.31 1.03 3.19 1.01 3.13 1.062.99 1.13 3.24 0.27 3.01 1.07 3.09 0.99 3.13 1.09 3.06 1.02 3.14 1.063.11 1.27 3.07 0.34 3.31 1.13 3.29 1.04 3.29 1.08 3.27 1.10 3.33 1.183.69 0.97 3.71 0.22 3.68 0.88 3.91 0.93 3.71 0.92 3.49 1.05 3.58 1.023.64 1.00 3.60 0.26 3.55 1.02 3.64 1.10 3.69 0.96 3.53 1.02 3.49 1.043.30 0.88 3.43 0.23 3.52 0.85 3.50 0.89 3.75 0.78 3.35 0.78 3.53 0.763.34 1.20 3.40 0.32 3.57 1.12 3.51 1.14 3.87 1.06 3.25 1.18 3.60 0.953.75 1.05 3.79 0.28 3.90 0.98 3.86 0.99 4.03 0.88 3.65 1.05 3.86 0.853.32 1.13 3.26 0.34 3.58 1.04 3.43 1.09 3.91 1.03 3.26 1.03 3.56 1.033.64 1.06 3.67 0.27 3.80 0.90 3.80 0.92 4.03 0.90 3.68 0.89 3.71 0.893.52 1.00 3.60 0.23 3.58 0.97 3.58 0.98 3.82 0.86 3.52 0.98 3.72 0.883.82 0.84 3.79 0.19 3.81 0.80 3.78 0.89 3.90 0.85 3.69 0.85 3.71 0.773.24 1.28 3.34 0.36 3.37 1.23 3.66 1.19 3.67 1.17 3.16 1.29 3.41 1.222.79 1.28 3.22 0.37 3.29 1.24 3.30 1.16 3.62 1.21 2.94 1.21 3.32 1.252.43 1.08 2.70 0.30 2.64 1.19 2.73 1.30 2.78 1.14 2.55 1.26 2.68 1.173.13 0.82 3.26 0.25 3.29 0.81 3.32 0.92 3.32 0.75 3.07 0.89 3.25 0.893.20 1.09 3.27 0.31 3.40 1.11 3.26 1.16 3.39 0.97 3.10 1.10 3.23 1.133.11 1.06 3.08 0.29 3.31 1.06 3.12 1.08 3.32 0.98 2.91 1.05 3.20 1.103.35 1.17 3.26 0.29 3.39 1.13 3.48 1.13 3.57 1.01 3.11 1.25 3.38 1.173.12 1.15 3.13 0.29 3.27 1.05 3.12 1.17 3.21 1.11 2.99 1.19 3.11 1.183.17 1.13 3.10 0.34 3.21 1.02 3.04 1.06 3.13 1.03 3.09 1.09 3.09 1.063.52 1.14 3.59 0.29 3.49 0.96 3.57 1.11 3.72 0.99 3.42 1.04 3.59 1.012.58 1.05 2.93 0.32 2.93 1.06 3.04 1.22 2.98 1.09 2.78 1.15 2.80 1.292.78 1.29 3.07 0.31 3.00 1.14 2.93 1.30 3.18 1.16 2.92 1.26 3.08 1.273.46 1.25 3.51 0.33 3.44 1.19 3.53 1.26 3.71 1.08 3.18 1.30 3.50 1.242.96 1.29 3.48 0.43 3.41 1.18 3.74 1.12 3.32 1.14 3.03 1.33 3.32 1.292.64 1.11 3.22 0.38 3.16 1.22 3.34 1.38 3.04 1.22 2.83 1.30 2.96 1.282.78 1.10 3.13 0.41 3.17 1.06 3.26 1.28 3.14 1.06 2.92 1.29 3.03 1.172.06 1.24 2.53 0.52 2.16 1.34 2.55 1.53 2.27 1.41 1.88 1.26 2.44 1.523.17 1.28 3.50 0.34 3.44 1.22 3.44 1.32 3.50 1.20 3.53 1.34 3.59 1.253.42 1.16 3.53 0.40 3.61 1.20 3.56 1.31 3.68 1.15 3.35 1.32 3.63 1.203.51 1.13 3.70 0.29 3.56 1.16 3.72 1.20 3.85 1.06 3.44 1.16 3.77 1.163.29 1.01 3.55 0.32 3.67 0.97 3.69 1.00 3.82 0.99 3.52 1.02 3.51 1.19
45
University of Arizona COACHE Survey Results for T/TE and C/CE Faculty.

The Collaborative on Academic Careers in Higher Education (COACHE)Faculty Job Satisfaction Survey 2013-14
MEANS AND STANDARD DEVIATIONS
University of Arizona
item short nameBenchmark: Nature of Work Research
Q45B Time spent on researchQ80A Expectations for finding external fundingQ80B Influence over focus of researchQ80C Quality of grad students to support researchQ80D Support for researchQ80E Support for engaging undergrads in researchQ85A Support for obtaining grants (pre-award)Q85B Support for maintaining grants (post-award)Q85C Support for securing grad student assistanceQ85D Support for travel to present/conduct researchQ85E Availability of course release for research
Benchmark: Nature of Work: ServiceQ45C Time spent on serviceQ55B Support for faculty in leadership rolesQ60A Number of committeesQ60B Attractiveness of committeesQ60C Discretion to choose committeesQ60D Equitability of committee assignmentsQ60E Number of student advisees
Benchmark: Nature of Work: TeachingQ45A Time spent on teachingQ70A Number of courses taughtQ70B Level of courses taughtQ70C Discretion over course contentQ70D Number of students in classes taughtQ70E Quality of students taughtQ70H Equitability of distribution of teaching loadQ70I Quality of grad students to support teachingQ45D Time spent on outreachQ45E Time spent on administrative tasksQ55A Ability to balance teaching/research/service
Benchmark: Facilities and work resourcesQ70F Support for improving teachingQ90A OfficeQ90B Laboratory, research, studio spaceQ90C Equipment
mean sdN/A N/AN/A N/A2.93 1.234.51 0.79N/A N/AN/A N/AN/A N/AN/A N/AN/A N/A3.08 1.34N/A N/AN/A N/AN/A N/AN/A N/AN/A N/AN/A N/AN/A N/AN/A N/AN/A N/AN/A N/AN/A N/AN/A N/A4.16 1.074.26 0.904.71 0.693.99 1.18N/A N/AN/A N/AN/A N/AN/A N/AN/A N/AN/A N/AN/A N/AN/A N/AN/A N/AN/A N/AN/A N/A
2005you
46
University of Arizona COACHE Survey Results for T/TE and C/CE Faculty.

The Collaborative on Academic Careers in Higher Education (COACHE)Faculty Job Satisfaction Survey 2013-14
MEANS AND STANDARD DEVIATIONS
University of Arizona
item short nameQ90D ClassroomsQ90E Library resourcesQ90F Computing and technical supportQ90H Clerical/administrative support
Benchmark: Personal and family policiesQ95D Housing benefitsQ95E Tuition waivers, remission, or exchangeQ95F Spousal/partner hiring programQ95G ChildcareQ95H EldercareQ95J Family medical/parental leaveQ95K Flexible workload/modified dutiesQ95L Stop-the-clock policiesQ200B Inst. does what it can for work/life compatibilityQ200A Right balance between professional/personal
Benchmark: Health and retirement benefitsQ95A Health benefits for yourselfQ95B Health benefits for familyQ95C Retirement benefitsQ95I Phased retirement optionsQ90G Salary
Benchmark: Interdisciplinary workQ100A Budgets encourage interdiscip. workQ100B Facilities conducive to interdiscip. workQ100C Interdiscip. work is rewarded in meritQ100D Interdiscip. work is rewarded in promotionQ100E Interdiscip. work is rewarded in tenureQ100G Dept. knows how to evaluate interdiscip. work
Benchmark: CollaborationQ105A Opportunities for collab. within dept.Q105E Opportunities for collab. outside dept.Q105D Opportunities for collab. outside inst.
Benchmark: MentoringQ125A Effectiveness of mentoring within dept.Q125B Effectiveness of mentoring outside dept.Q130A Mentoring of pre-tenure facultyQ130B Mentoring of associate faculty
mean sd
2005you
N/A N/AN/A N/A3.50 1.253.66 1.36N/A N/AN/A N/AN/A N/AN/A N/AN/A N/AN/A N/AN/A N/AN/A N/AN/A N/AN/A N/AN/A N/AN/A N/AN/A N/AN/A N/AN/A N/AN/A N/A3.13 1.25N/A N/AN/A N/AN/A N/AN/A N/AN/A N/AN/A N/AN/A N/AN/A N/AN/A N/AN/A N/AN/A N/AN/A N/AN/A N/AN/A N/AN/A N/AN/A N/A
47
University of Arizona COACHE Survey Results for T/TE and C/CE Faculty.

The Collaborative on Academic Careers in Higher Education (COACHE)Faculty Job Satisfaction Survey 2013-14
MEANS AND STANDARD DEVIATIONS
University of Arizona
item short nameQ130C Support for faculty to be good mentorsQ115 Being a mentor is fulfillingQ120A Importance of mentoring within dept.Q120B Importance of mentoring outside dept.Q120C Importance of mentoring outside inst.Q125C Effectiveness of mentoring outside the inst.
Benchmark: Tenure policiesQ136A Clarity of tenure processQ136B Clarity of tenure criteriaQ136C Clarity of tenure standardsQ136D Clarity of body of evidence for deciding tenureQ136E Clarity of whether I will achieve tenureQ139A Consistency of messages about tenureQ139B Tenure decisions are performance-based
Benchmark: Tenure clarityQ137A Clarity of expectations: ScholarQ137B Clarity of expectations: TeacherQ137C Clarity of expectations: AdvisorQ137D Clarity of expectations: ColleagueQ137E Clarity of expectations: Campus citizenQ137F Clarity of expectations: Broader community
Benchmark: Tenure reasonablenessQ138A Reasonable expectations: ScholarQ138B Reasonable expectations: TeacherQ138C Reasonable expectations: AdvisorQ138D Reasonable expectations: ColleagueQ138E Reasonable expectations: Campus citizenQ138F Reasonable expectations: Community member
Benchmark: PromotionQ135C Reasonable expectations: PromotionQ135B Dept. culture encourages promotionQ140A Clarity of promotion processQ140B Clarity of promotion criteriaQ140C Clarity of promotion standardsQ140D Clarity of body of evidence for promotionQ140E Clarity of time frame for promotionQ140F Clarity of whether I will be promoted
mean sd
2005you
N/A N/AN/A N/AN/A N/AN/A N/AN/A N/AN/A N/AN/A N/A3.59 1.063.54 1.093.24 1.083.47 1.043.70 1.062.71 1.343.45 1.28N/A N/A3.91 1.033.69 0.993.30 1.083.26 1.173.21 1.123.13 1.11N/A N/A4.00 1.114.14 0.973.95 0.993.90 1.033.79 1.013.86 0.98N/A N/AN/A N/AN/A N/AN/A N/AN/A N/AN/A N/AN/A N/AN/A N/AN/A N/A
48
University of Arizona COACHE Survey Results for T/TE and C/CE Faculty.

The Collaborative on Academic Careers in Higher Education (COACHE)Faculty Job Satisfaction Survey 2013-14
MEANS AND STANDARD DEVIATIONS
University of Arizona
item short nameQ170A Priorities are stated consistentlyQ170C Priorities are acted on consistentlyQ170D Changed priorities negatively affect my work**
Benchmark: Leadership: SeniorQ180A Pres/Chancellor: Pace of decision makingQ180B Pres/Chancellor: Stated prioritiesQ180C Pres/Chancellor: Communication of prioritiesQ180L CAO: Pace of decision makingQ180M CAO: Stated prioritiesQ180N CAO: Communication of prioritiesQ180O CAO: Ensuring faculty inputQ175C CAO: Support in adapting to change
Benchmark: Leadership: DivisionalQ185D Dean: Pace of decision makingQ185E Dean: Stated prioritiesQ185F Dean: Communication of prioritiesQ185G Dean: Ensuring faculty inputQ175A Dean: Support in adapting to change
Benchmark: Leadership: DepartmentalQ185H Head/Chair: Pace of decision makingQ185I Head/Chair: Stated prioritiesQ185J Head/Chair: Communication of prioritiesQ185K Head/Chair: Ensuring faculty inputQ185L Head/Chair: Fairness in evaluating workQ175B Head/Chair: Support in adapting to change
Benchmark: Departmental collegialityQ200C Colleagues support work/life balanceQ200D Meeting times compatible with personal needsQ205B Amount of personal interaction w/Pre-tenureQ205C How well you fitQ205E Amount of personal interaction w/TenuredQ210A Colleagues pitch in when neededQ210C Dept. is collegialQ212A Colleagues committed to diversity/inclusion
Benchmark: Departmental engagementQ190A Discussions of undergrad student learningQ190B Discussions of grad student learning
mean sd
2005you
N/A N/AN/A N/AN/A N/AN/A N/AN/A N/AN/A N/AN/A N/AN/A N/AN/A N/AN/A N/AN/A N/AN/A N/AN/A N/AN/A N/AN/A N/AN/A N/AN/A N/AN/A N/AN/A N/AN/A N/AN/A N/AN/A N/AN/A N/AN/A N/AN/A N/AN/A N/AN/A N/AN/A N/A3.97 1.173.93 1.193.74 1.24N/A N/AN/A N/AN/A N/AN/A N/AN/A N/AN/A N/A
49
University of Arizona COACHE Survey Results for T/TE and C/CE Faculty.

The Collaborative on Academic Careers in Higher Education (COACHE)Faculty Job Satisfaction Survey 2013-14
MEANS AND STANDARD DEVIATIONS
University of Arizona
item short nameQ190C Discussions of effective teaching practicesQ190D Discussions of effective use of technologyQ190E Discussions of current research methodsQ205A Amount of professional interaction w/Pre-tenureQ205D Amount of professional interaction w/Tenured
Benchmark: Departmental qualityQ195A Intellectual vitality of tenured facultyQ195B Intellectual vitality of pre-tenure facultyQ195C Scholarly productivity of tenured facultyQ195D Scholarly productivity of pre-tenure facultyQ195G Teaching effectiveness of tenured facultyQ195H Teaching effectiveness of pre-tenure facultyQ240B Dept. is successful at faculty recruitmentQ240C Dept. is successful at faculty retentionQ240D Dept. addresses sub-standard performance
Benchmark: Appreciation and recognitionQ215A Recognition: For teachingQ215B Recognition: For advisingQ215C Recognition: For scholarshipQ215D Recognition: For serviceQ215E Recognition: For outreachQ215I Recognition: From colleaguesQ215J Recognition: From CAOQ215K Recognition: From DeanQ215L Recognition: From Head/ChairQ220A School/college is valued by Pres/ProvostQ220B Dept. is valued by Pres/ProvostQ245A CAO cares about faculty of my rankQ240A Outside offers are necessary in negotiationsQ212B Visible leadership for support of diversityQ245D I would again choose this institutionQ250A Department as a place to workQ250B Institution as a place to work
mean sd
2005you
N/A N/AN/A N/AN/A N/A3.87 1.193.52 1.36N/A N/A3.66 1.30N/A N/AN/A N/AN/A N/AN/A N/AN/A N/AN/A N/AN/A N/AN/A N/AN/A N/AN/A N/AN/A N/AN/A N/AN/A N/AN/A N/AN/A N/AN/A N/AN/A N/AN/A N/AN/A N/AN/A N/A2.72 1.22N/A N/AN/A N/A4.05 1.123.89 1.093.55 1.11
50
University of Arizona COACHE Survey Results for T/TE and C/CE Faculty.