At the beginning, node flaminiaDR2 has 9 outages ... - issues.opennms…€¦ · At the beginning,...
5
At the beginning, node flaminiaDR2 has 9 outages out of 26 services on interface 10.13.0.104. Except for ICMP and SNMP all services are managed by PassiveServiceMonitor. The Overall Service Availability page is ok: it reports 9 outages like you can see in node page (see 2 next pictures), service out are: Card-1-4-Port-10-L8M, Card-1-4-Port-8-E1, Card-1-4-Port-7-E1, Card-1-4-Port-6-E1, Card-1-10, Card-1-19, Card-1-15, Card-1-11, Card-1-2.
Transcript of At the beginning, node flaminiaDR2 has 9 outages ... - issues.opennms…€¦ · At the beginning,...

At the beginning, node flaminiaDR2 has 9 outages out of 26 services on interface 10.13.0.104. Except for ICMP and SNMP all services are managed by PassiveServiceMonitor.
The Overall Service Availability page is ok: it reports 9 outages like you can see in node page (see 2 next pictures), service out are: Card-1-4-Port-10-L8M, Card-1-4-Port-8-E1, Card-1-4-Port-7-E1, Card-1-4-Port-6-E1, Card-1-10, Card-1-19, Card-1-15, Card-1-11, Card-1-2.

At this point, node flaminiaDR2 goes down (I plugged out ethernet cable). As you can show in 2 pictures below, all services are down even if PSK doesn’t receive ‘Down’ event for the services. The node reports 25 outages, the 26 is due to the ‘Overall’ that has no ouitage.
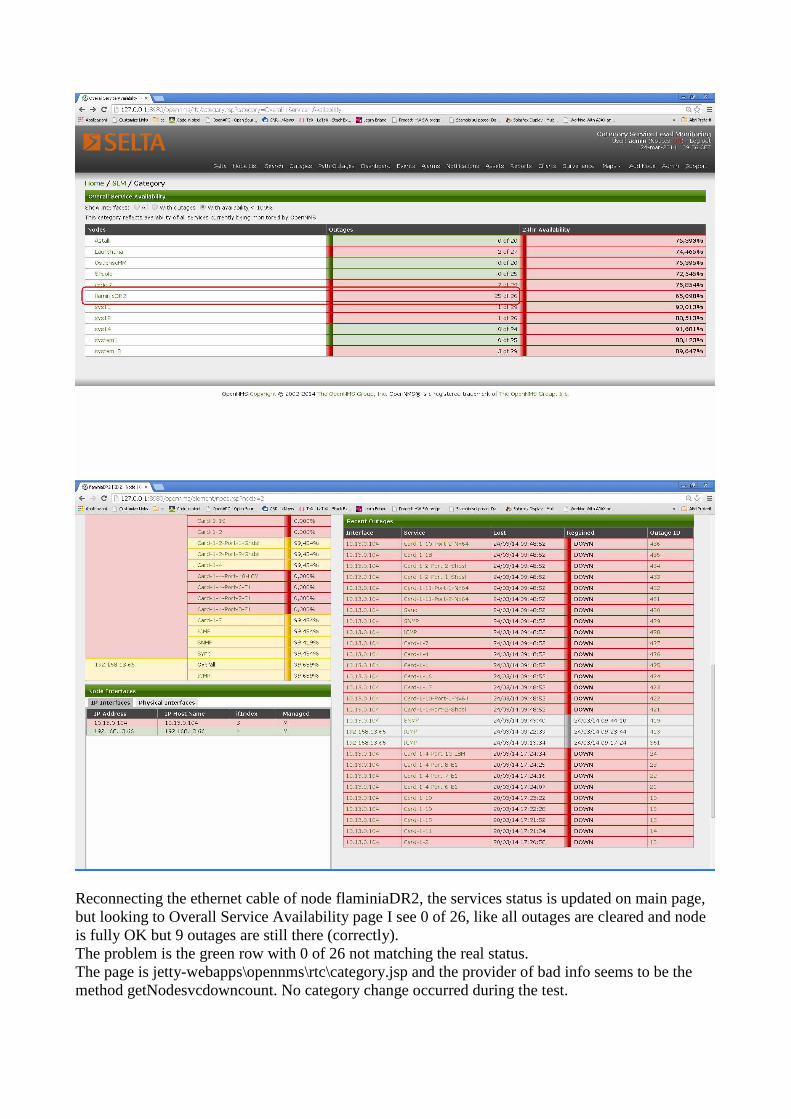
Reconnecting the ethernet cable of node flaminiaDR2, the services status is updated on main page, but looking to Overall Service Availability page I see 0 of 26, like all outages are cleared and node is fully OK but 9 outages are still there (correctly). The problem is the green row with 0 of 26 not matching the real status. The page is jetty-webapps\opennms\rtc\category.jsp and the provider of bad info seems to be the method getNodesvcdowncount. No category change occurred during the test.