“At Cardinal Capital we don’t want Advisors to partner with us because of our exceptional...
26
“At Cardinal Capital we don’t want Advisors to partner with us because of our exceptional returns, we want advisors to work with us because we provide a solution that is right for their practice and their clients.” Timothy E. Burt, CFA President & C.E.O. Discretionary Management – The Cornerstone to Building High Value Relationships
-
Upload
rosalyn-harper -
Category
Documents
-
view
215 -
download
2
Transcript of “At Cardinal Capital we don’t want Advisors to partner with us because of our exceptional...

“At Cardinal Capital we don’t want Advisors to partner with us because of our exceptional returns,
we want advisors to work with us because we provide a solution that is right for their practice
and their clients.”
Timothy E. Burt, CFAPresident & C.E.O.
Discretionary Management – The Cornerstone to Building High
Value Relationships

The thing we hear most from advisors is that they want to grow their
practices, strengthen their client relationships and have peace of mind
that they are providing the best financial advice and solutions possible.

Simply put…
INCREASING assets under administration while DECREASING the number of client accounts
Results in…
Having more time to work on the aspect of client management that matters most…
building the client relationship

INCREASING assets under administration
while DECREASING the number of clients
Requires advisors to…
Acquire
Retain and
Grow
High Net Worth Clients

More and more, high net worth individuals are demanding more planning, greater access to experts, solutions customized to their specific needs – their own personal CFO! Investment advice and portfolio management top the list
of “most valued services”.
Warren Buffet
Timothy E. Burt

You may not be planning on changing anything in your financial planning
practice, but the industry has other plans for you.

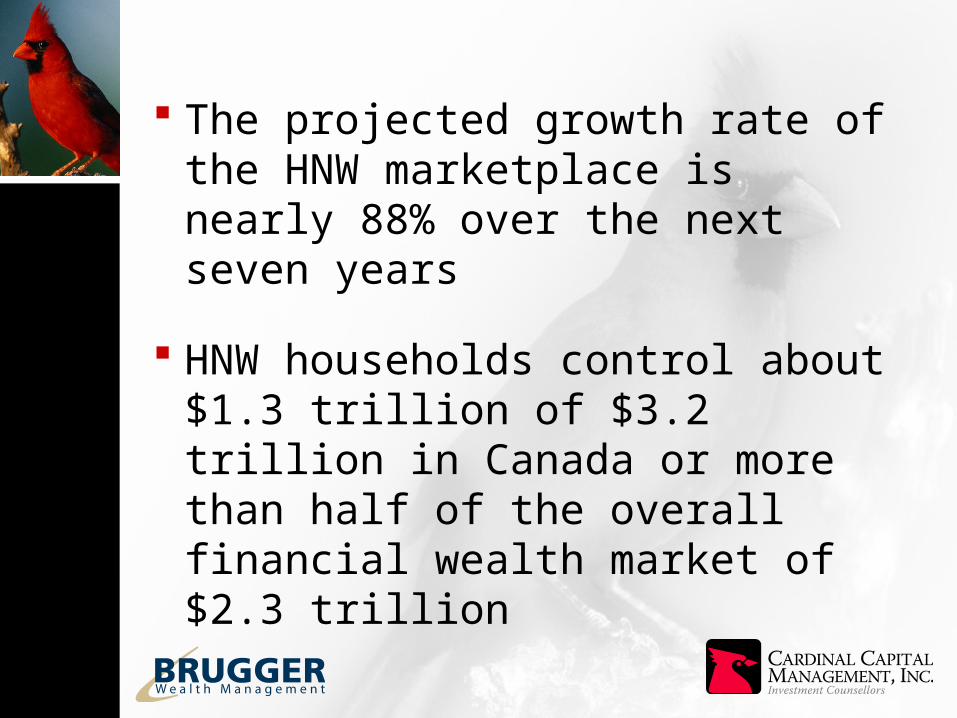
The projected growth rate of the HNW marketplace is nearly 88% over the next seven years
HNW households control about $1.3 trillion of $3.2 trillion in Canada or more than half of the overall financial wealth market of $2.3 trillion

When it comes to the primary advisors to Canada’s HNW households, full service brokers currently take the lead at 37%; while 22% of households use investment counsellors; and 21% opt for financial planners.
Bederman says a big challenge is that more than half of the HNW households that use a financial planner are not satisfied.
Only 48% of these households believe their advisor is exceeding expectations, compared to a much higher satisfaction rate for brokers (56%) and 67% for investment counsellors.

“It doesn’t necessarily mean that financial planners are
out of the game, but it means that the nature of
financial planning and what particular advisors do will
have to change.”

Brugger Wealth Management Ltd.The Managed Money Continuum
Fee based programs level of investable assets/degree of customization
$0 - $24,999 AIM/Trimark Investments – (MER 2.14 – 2.90)Mackenzie Financial Corp. – MER 2.20 – 2.91)Standard Life Mutual Funds – (MER 1.97 – 2.47)Franklin Templeton – (MER 2.41 – 2.98)
DEGREE OF CUSTOMIZATION LEV
EL
OF
IN
VE
ST
AB
LE A
SS
ET
S
$25,000 - $99,999Franklin Templeton Quotential – (MER 2.07 – 2.74)SEI LifePath – (MER 2.55)AGF Harmony – (MER 2.79 – 3.05)Mackenzie Financial Symmetry – (MER 2.26 – 2.79)
$100,000 - $249,999SEI Portfolios – (MER 1.95 – 2.32)Standard Life Eclipse – (MER 2.00 – 2.50)AIM/TRIMARK Dialogue – (MER 1.97 2.61)
$250,000 - $499,999Tapestry Pooled Portfolio Management – (MER 1.93 – 2.55)Standard Life Legends – (MER – 1.55 – 2.05)SEI Pooled Portfolio – (MER – 1.82 – 2.21)
$500,000+Cardinal Capital Management – (MER 1.50)Hemisphere Capital – (MER 1.50)Bissett Private Portfolio Management – (MER – 1.50 – 1.80)Connor Clark & Lunn – (MER 1.50)

Over time, cumulative dividends offer a similar benefit to traditional fixed income investments
Assuming a $30,000 Initial Investment - RBC
The Power of Dividends
$20,314 $21,750
ASSUMPTION: No dividend re-investment

The Tale of the Numbers
Assets Under
Administration
Assets with Cardinal
1998
1999
2000
$11.519 Million $0
$0$19.998 Million
$36.688 Million $0

Assets Under
Administration
Assets with
Cardinal
2003
2005
May 2007
$46.444 Million $3.982 Million
$64.615 Million$14.145 Million
$84.688 Million $19.758 Million
The Tale of the Numbers
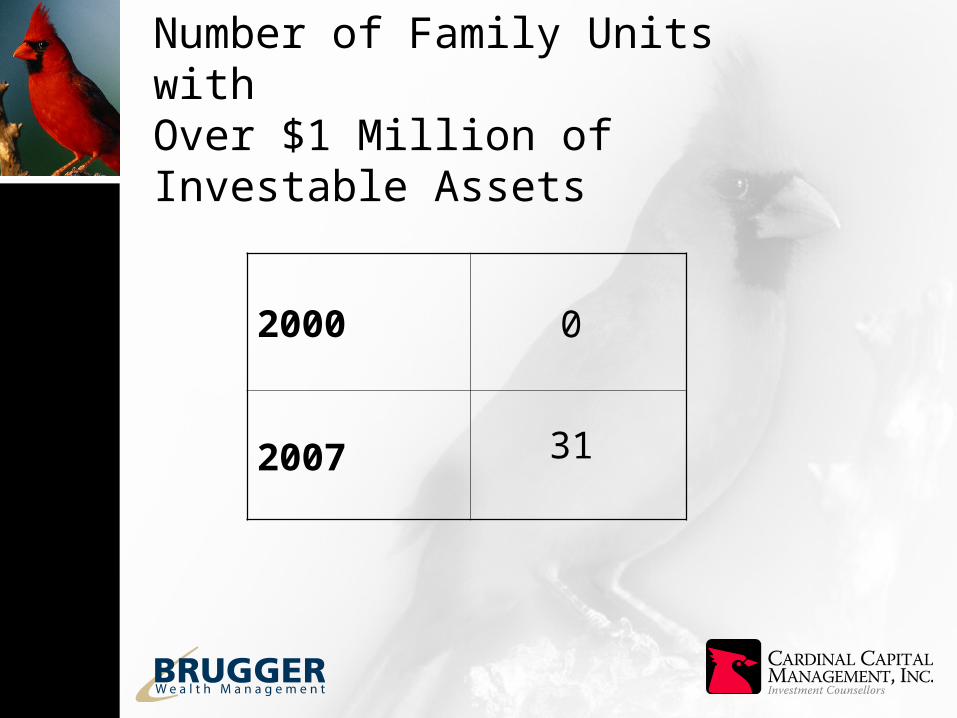
Number of Family Units with Over $1 Million of Investable Assets
2000
2007
0
31

Conclusion Change, or evolution, is not just an
option: it is a fact of life for all businesses
Change is all about people and it takes time
You have it within your reach to take your practise to the next level of performance
Thank You

Market Outlook
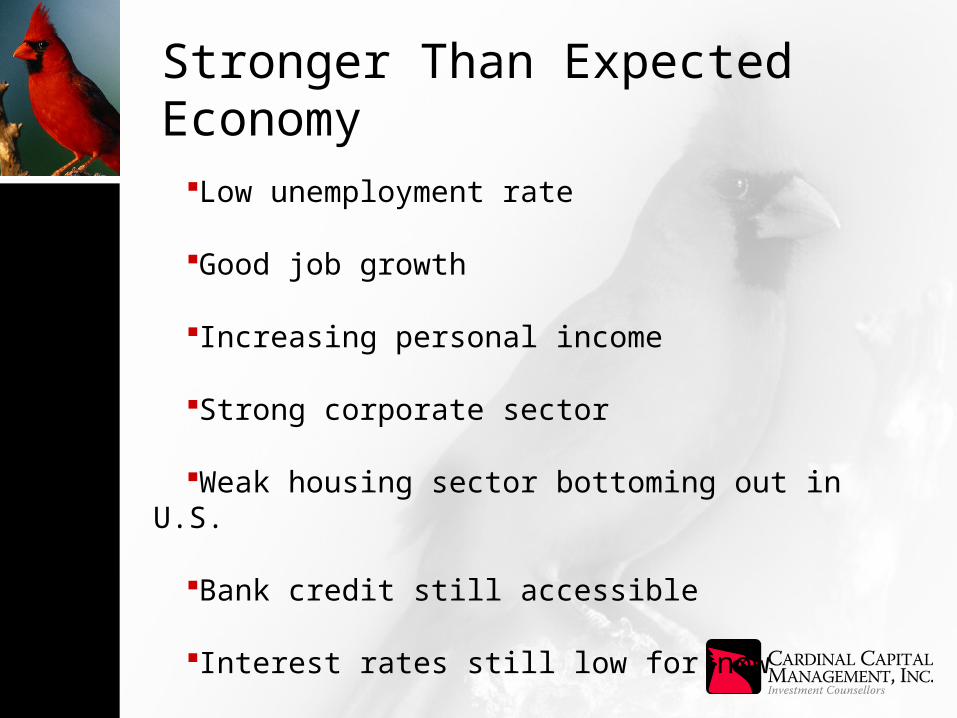
Low unemployment rate
Good job growth
Increasing personal income
Strong corporate sector
Weak housing sector bottoming out in U.S.
Bank credit still accessible
Interest rates still low for now
Stronger Than Expected Economy
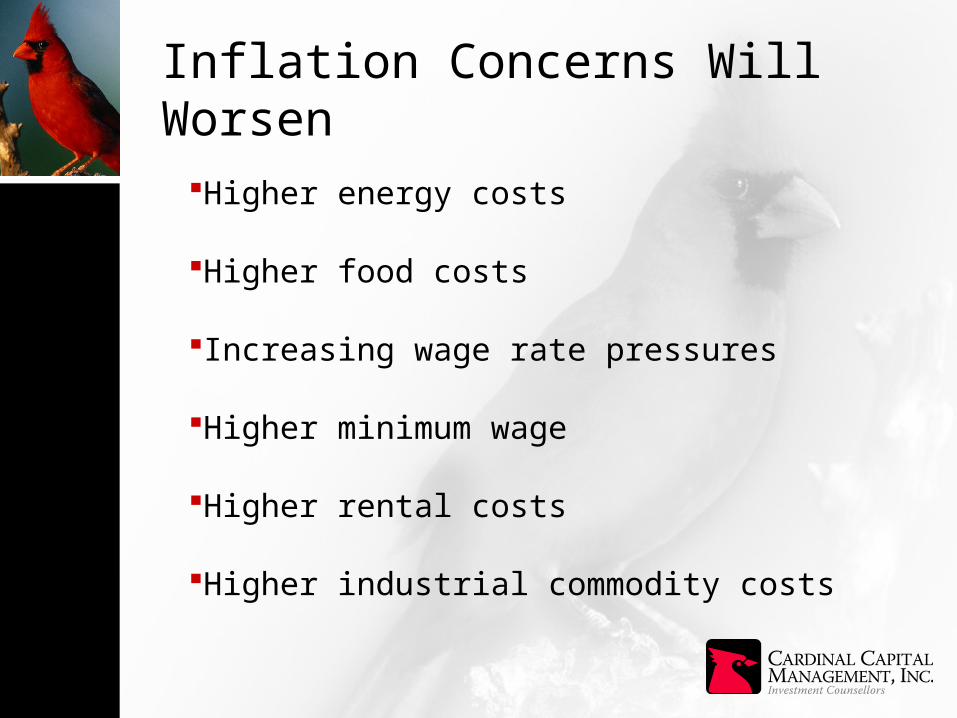
Higher energy costs
Higher food costs
Increasing wage rate pressures
Higher minimum wage
Higher rental costs
Higher industrial commodity costs
Inflation Concerns Will Worsen
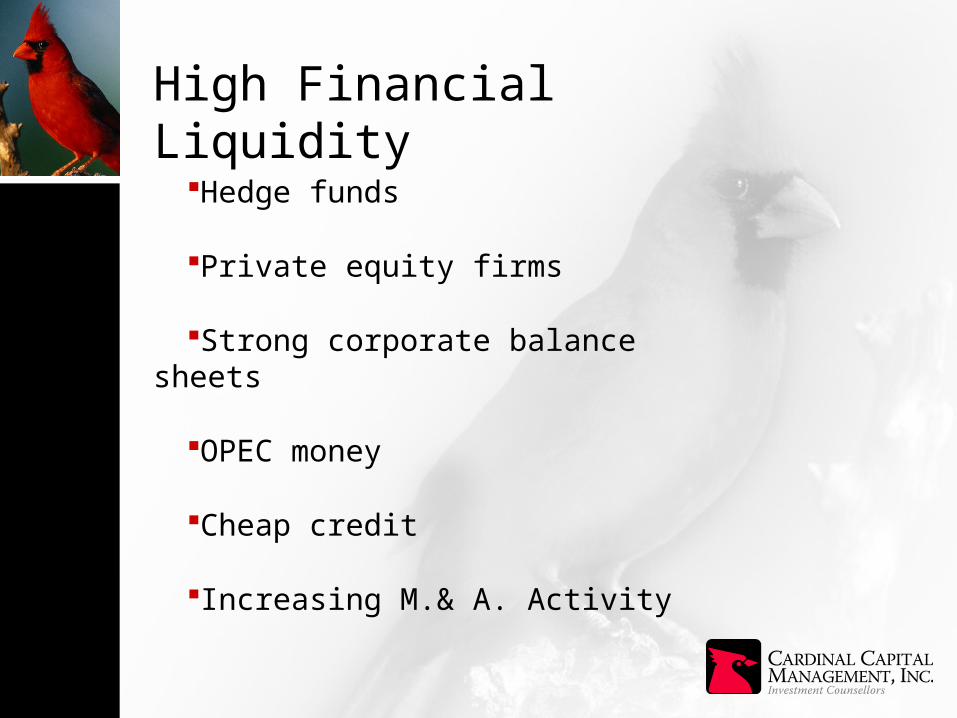
Hedge funds
Private equity firms
Strong corporate balance sheets
OPEC money
Cheap credit
Increasing M.& A. Activity
High Financial Liquidity

Many stocks still selling below their 1998-2000 highs
Corporate profit growth is still good
Many stocks still sell at historically low p/e’s
Low bond yields make stocks more attractive
Companies are still raising dividends and buying back stock
Increasing scarcity of high quality stocks due to takeovers
Stock Valuations Are Reasonable

Last bear market was in 2006 – bear markets occur every 4 yrs.
Next bear market in 2010 – bull market peak in 2009
Last recession was in 2001 – recessions occur every 8-9 yrs.
Next recession in 2010
Eventually steadily higher interest rates in 2008 and 2009 will cool off the global stock markets
Conclusion – stock markets will move higher in 2007 and 2008 due to a stronger than expected economy and better than expected corporate profits
Stock Market Outlook
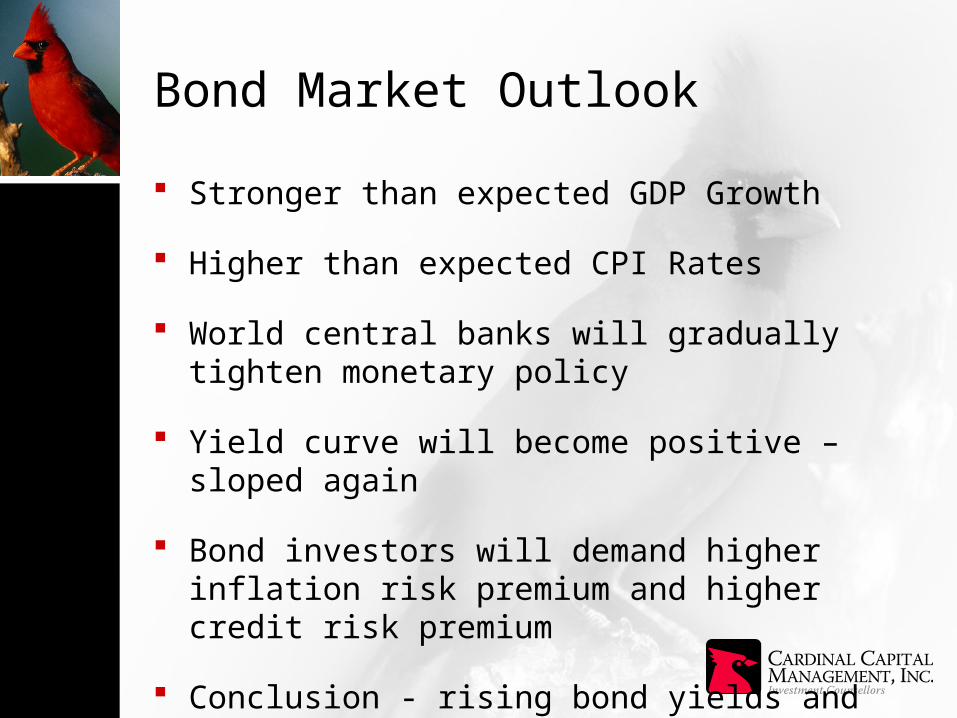
Bond Market Outlook
Stronger than expected GDP Growth
Higher than expected CPI Rates
World central banks will gradually tighten monetary policy
Yield curve will become positive – sloped again
Bond investors will demand higher inflation risk premium and higher credit risk premium
Conclusion - rising bond yields and falling bond prices for 2007 and 2008

Canadian dollar will strengthen against the U.S. dollar towards $0.95 U.S. by end of 2007 and towards $1.00 U.S. by end of 2008
Canadian dollar will weaken against the euro
Large U.S. budget and trade deficits will eventually take its toll on the U.S dollar
The U.S. will become increasingly protectionist with Democratic Congress and likely Democratic President in 2009
Higher energy prices and commodity prices will keep the Canadian dollar strong against the U.S. dollar
Political uncertainty in Canada is becoming less of a concern to global investors
Canadian Dollar Outlook