AT A GLANCE - SAZKA Group...SAZKA Group at a Glance 6 Our Operations 8 Our Brands 10 Our History 12...
66
CONSOLIDATED ANNUAL REPORT, CONSOLIDATED FINANCIAL STATEMENTS & INDEPENDENT AUDITOR’S REPORT 2018
Transcript of AT A GLANCE - SAZKA Group...SAZKA Group at a Glance 6 Our Operations 8 Our Brands 10 Our History 12...
CONSOLIDATED ANNUAL REPORT,CONSOLIDATED FINANCIAL STATEMENTS& INDEPENDENT AUDITOR’S REPORT2018
FINANCIAL STATEMENTS AND NOTES
2 3
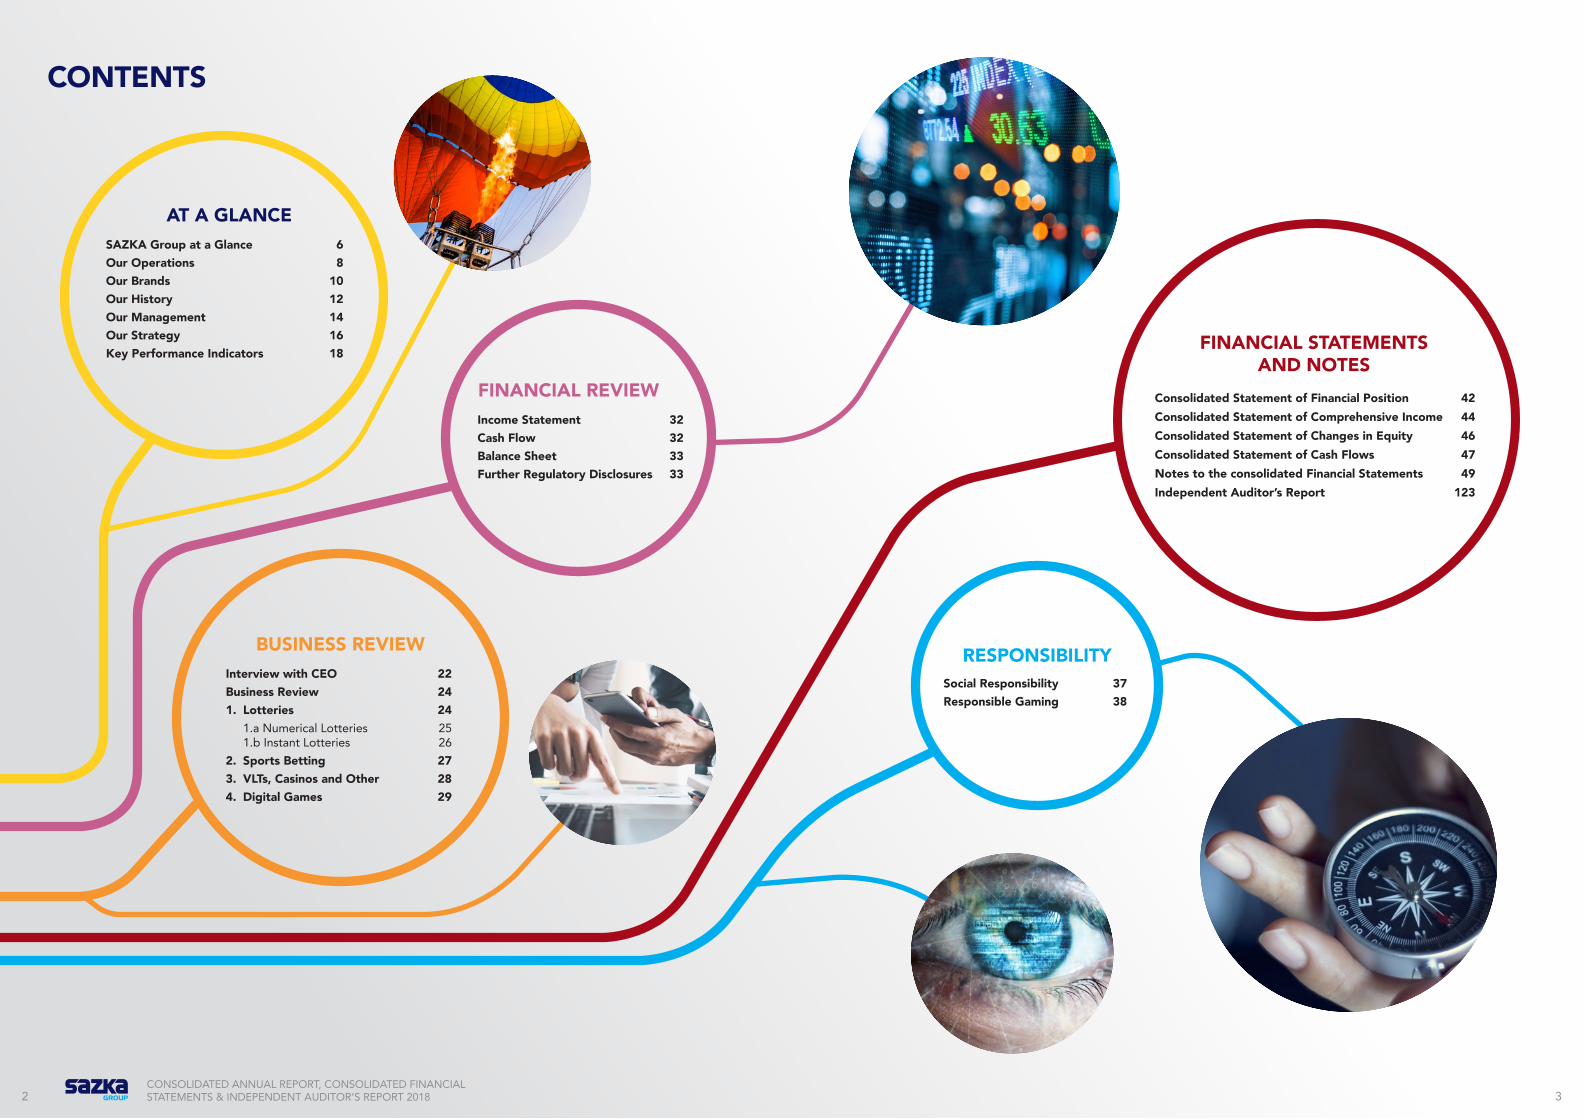
CONTENTS
CONSOLIDATED ANNUAL REPORT, CONSOLIDATED FINANCIAL STATEMENTS & INDEPENDENT AUDITOR’S REPORT 2018
Consolidated Statement of Financial Position 42Consolidated Statement of Comprehensive Income 44Consolidated Statement of Changes in Equity 46Consolidated Statement of Cash Flows 47Notes to the consolidated Financial Statements 49Independent Auditor’s Report 123
SAZKA Group at a Glance 6Our Operations 8Our Brands 10Our History 12Our Management 14Our Strategy 16Key Performance Indicators 18
Interview with CEO 22Business Review 241. Lotteries 24 1.a Numerical Lotteries 25 1.b Instant Lotteries 262. Sports Betting 273. VLTs, Casinos and Other 284. Digital Games 29
Income Statement 32Cash Flow 32Balance Sheet 33Further Regulatory Disclosures 33
Social Responsibility 37Responsible Gaming 38
AT A GLANCE
BUSINESS REVIEW
FINANCIAL REVIEW
RESPONSIBILITY

AT A GLANCE

One of the fastest growing
European lottery companies
Long-term licences provide us with
significant renewal advantages
6CONSOLIDATED ANNUAL REPORT, CONSOLIDATED FINANCIAL STATEMENTS & INDEPENDENT AUDITOR’S REPORT 2018
SAZKA GROUP AT A GLANCE
Primary focus on lotteries with
a secondary focus on digital and sports
bettinig
100% of our revenue is regulated and our
activities are supervised by numerous regulators
worldwide including many EU countries,
Switzerland and Australia
Key presence in 6 countries* with leading position in
each market supported by iconic and trusted brands and unrivalled distribution
networks
Entrepreneurial ownership: KKCG (75%) and EMMA Capital (25%)**
**Note: KKCG and EMMA Capital have successfully concluded negotiations on the split of the assets in the SAZKA Group. The agreement was signed on 14 March 2019. Following the transaction, KKCG will own 100% of shares in the SAZKA Group with all assets remaining as they are today except for the Croatian SuperSport business. EMMA Capital will take over ownership of the Croatian SuperSport business. The completion of the transaction is subject to the approval of regulatory and competition authorities in respective countries.
*Note: Austria, Croatia, Cyprus, Czech Republic, Greece, Italy
83 million+ players*
7 thousand+ employees of SAZKA Group companies**
€18 billion+ wagers in 2018***
64 thousand points of sale in Austria,
Croatia, Cyprus, Czech Republic, Greece and
Italy
*Note: Total addressable market in Austria, Croatia, Cyprus, Czech Republic, Greece and Italy. Adult population only. Source H2 Gambling Capital.
**Note: Total headcount in companies in which SAZKA Group holds an ownership interest
***Note: Amounts staked placed with companies in which the SAZKA Group holds an ownership interest
8Source: Company information, European Lottery association.Note: Croatia lottery market is state owned and operated. Albania is privately operated.
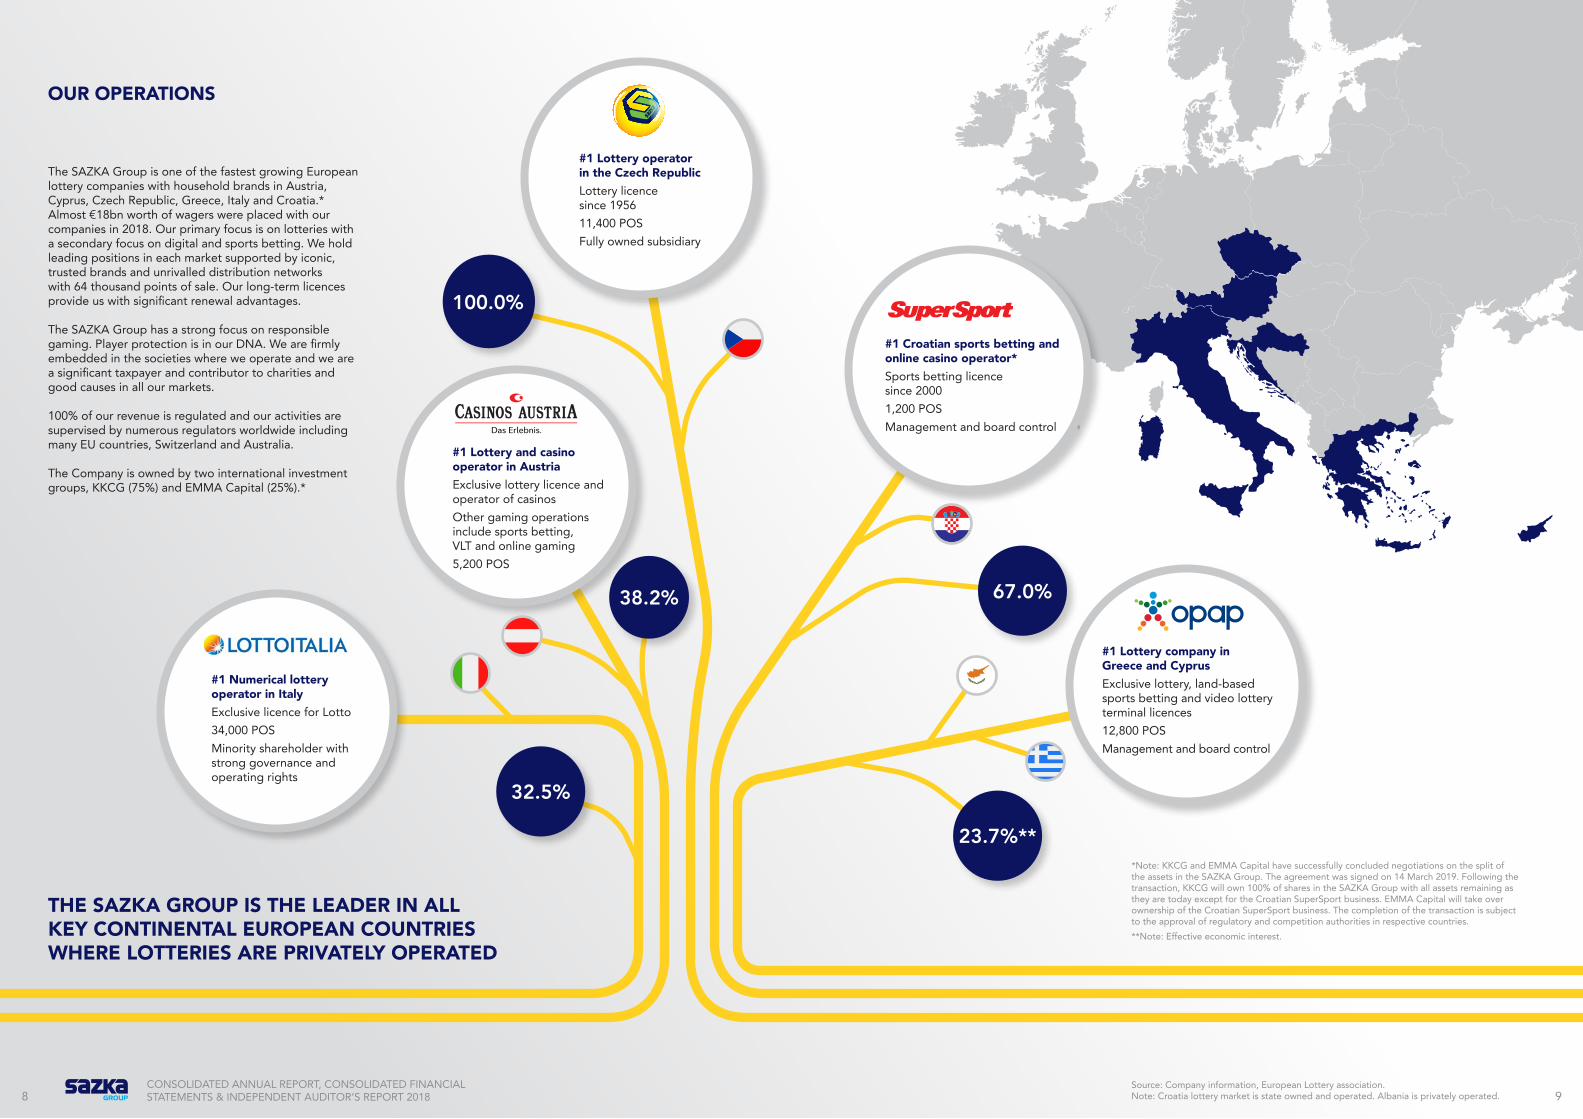
THE SAZKA GROUP IS THE LEADER IN ALL KEY CONTINENTAL EUROPEAN COUNTRIES WHERE LOTTERIES ARE PRIVATELY OPERATED
#1 Numerical lottery operator in ItalyExclusive licence for Lotto34,000 POSMinority shareholder with strong governance and operating rights
#1 Lottery and casino operator in AustriaExclusive lottery licence and operator of casinosOther gaming operations include sports betting, VLT and online gaming5,200 POS
#1 Croatian sports betting and online casino operator*Sports betting licence since 20001,200 POSManagement and board control
#1 Lottery operator in the Czech RepublicLottery licence since 195611,400 POSFully owned subsidiary
9CONSOLIDATED ANNUAL REPORT, CONSOLIDATED FINANCIAL STATEMENTS & INDEPENDENT AUDITOR’S REPORT 2018
67.0%
100.0%
32.5%
23.7%**
38.2%
OUR OPERATIONS
The SAZKA Group is one of the fastest growing European lottery companies with household brands in Austria, Cyprus, Czech Republic, Greece, Italy and Croatia.* Almost €18bn worth of wagers were placed with our companies in 2018. Our primary focus is on lotteries with a secondary focus on digital and sports betting. We hold leading positions in each market supported by iconic, trusted brands and unrivalled distribution networks with 64 thousand points of sale. Our long-term licences provide us with significant renewal advantages.
The SAZKA Group has a strong focus on responsible gaming. Player protection is in our DNA. We are firmly embedded in the societies where we operate and we are a significant taxpayer and contributor to charities and good causes in all our markets.
100% of our revenue is regulated and our activities are supervised by numerous regulators worldwide including many EU countries, Switzerland and Australia.
The Company is owned by two international investment groups, KKCG (75%) and EMMA Capital (25%).*
*Note: KKCG and EMMA Capital have successfully concluded negotiations on the split of the assets in the SAZKA Group. The agreement was signed on 14 March 2019. Following the transaction, KKCG will own 100% of shares in the SAZKA Group with all assets remaining as they are today except for the Croatian SuperSport business. EMMA Capital will take over ownership of the Croatian SuperSport business. The completion of the transaction is subject to the approval of regulatory and competition authorities in respective countries.**Note: Effective economic interest.
#1 Lottery company in Greece and CyprusExclusive lottery, land-based sports betting and video lottery terminal licences12,800 POSManagement and board control
ΛΟΓΟΤΥΠΑ ΟΠΑΠ
ΤΕΤΡΑΧΡΩΜΙΑ
10 11CONSOLIDATED ANNUAL REPORT, CONSOLIDATED FINANCIAL STATEMENTS & INDEPENDENT AUDITOR’S REPORT 2018
Source: Company information, H2 Gambling Capital
Note: All figure as per GGR 2018 for legal market with market size as per H2 Gambling Capital data. Company's estimate for the Czech Republic.
¹ Jackpot market share is part of the numerical lottery market share
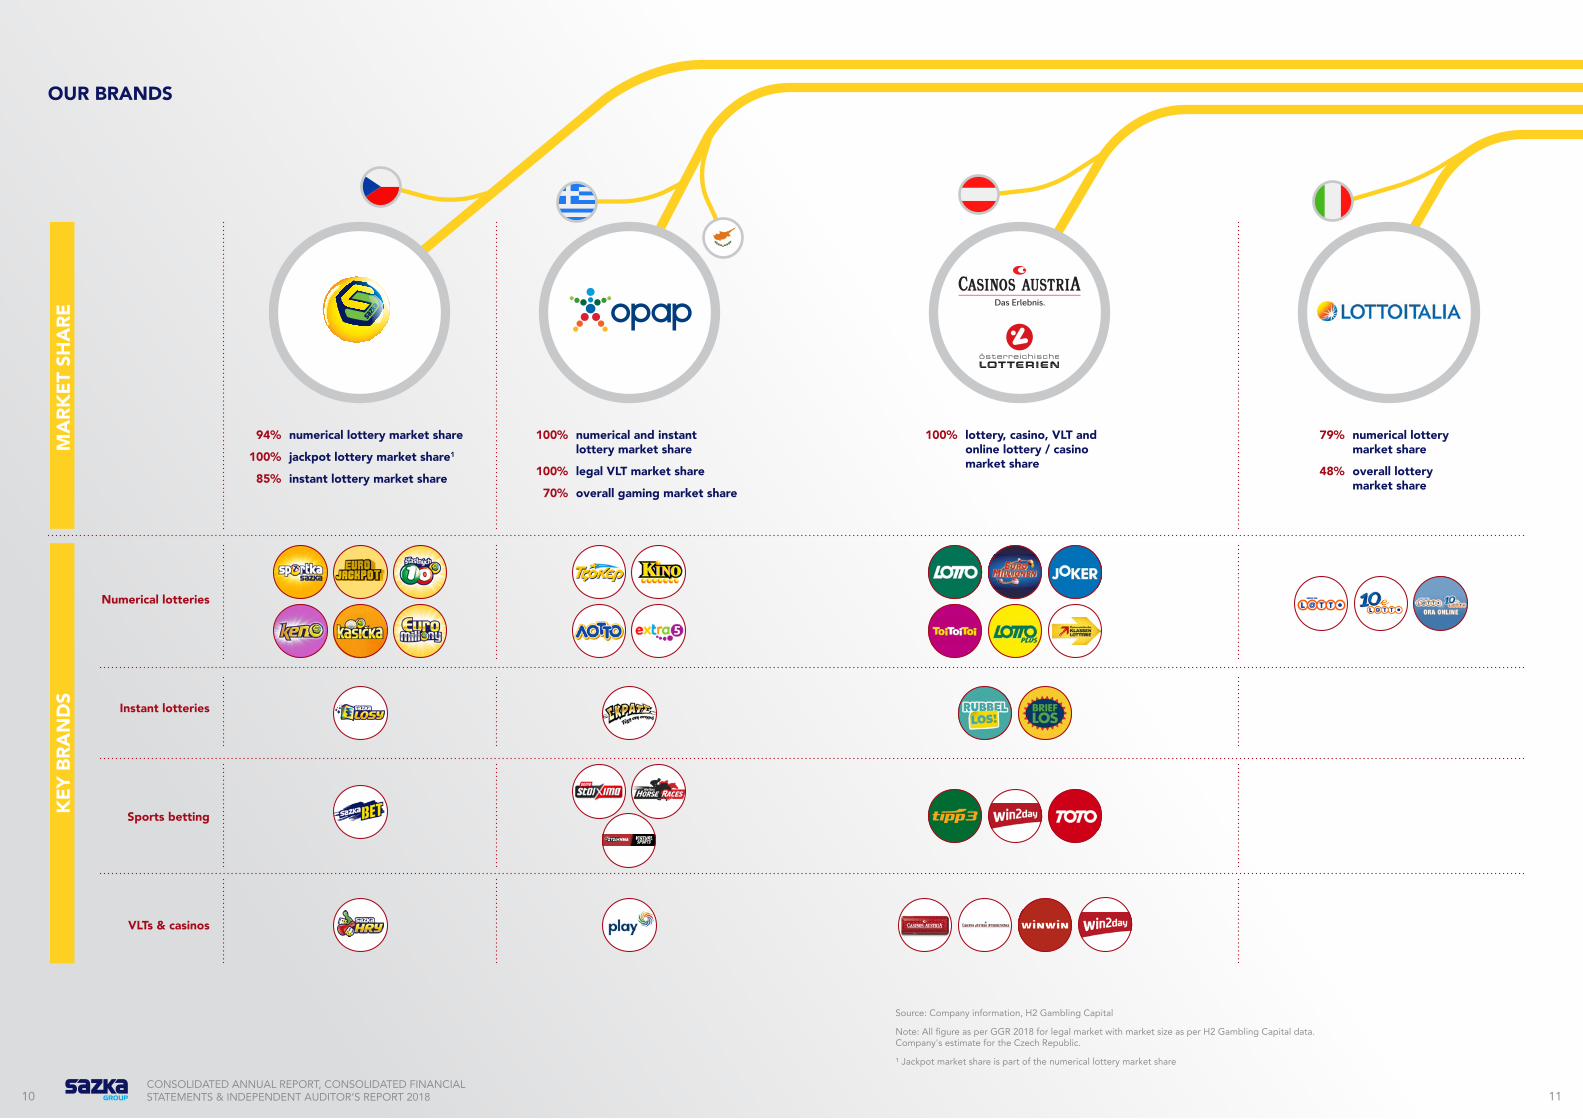
94% numerical lottery market share
100% jackpot lottery market share1
85% instant lottery market share
Numerical lotteries
Instant lotteries
Sports betting
VLTs & casinos
100% numerical and instant lottery market share
100% legal VLT market share
70% overall gaming market share
100% lottery, casino, VLT and online lottery / casino market share
79% numerical lottery market share
48% overall lottery market share
OUR BRANDSM
ARK
ET S
HA
REK
EY B
RAN
DS
ΛΟΓΟΤΥΠΑ ΟΠΑΠ
ΤΕΤΡΑΧΡΩΜΙΑ

12 13CONSOLIDATED ANNUAL REPORT, CONSOLIDATED FINANCIAL STATEMENTS & INDEPENDENT AUDITOR’S REPORT 2018
Privatisation of 33% stake in OPAP
2013
Acquisition of additional share capital
taking the total shareholding in Casinos Austria to 38.2%
Acquisition of 67% shareholding in
SuperSport
2018
OUR HISTORY
2011–2012
Acquisition of 100% of SAZKA
Czech
Acquisition of 11.4% shareholding in
Casinos Austria
2015
KKCG and EMMA Capital agreed on the
split of the assets in the SAZKA Group. Following the
transaction KKCG will become the sole owner of the SAZKA Group.
2019
Acquisition of an 11.6% stake in Austrian Lotteries
Acquisition of 32.5% stake in LOTTOITALIA
(JV with Lottomatica)
2016
ΛΟΓΟΤΥΠΑ ΟΠΑΠ
ΤΕΤΡΑΧΡΩΜΙΑ
14CONSOLIDATED ANNUAL REPORT, CONSOLIDATED FINANCIAL STATEMENTS & INDEPENDENT AUDITOR’S REPORT 2018 15
Board of Directors Management
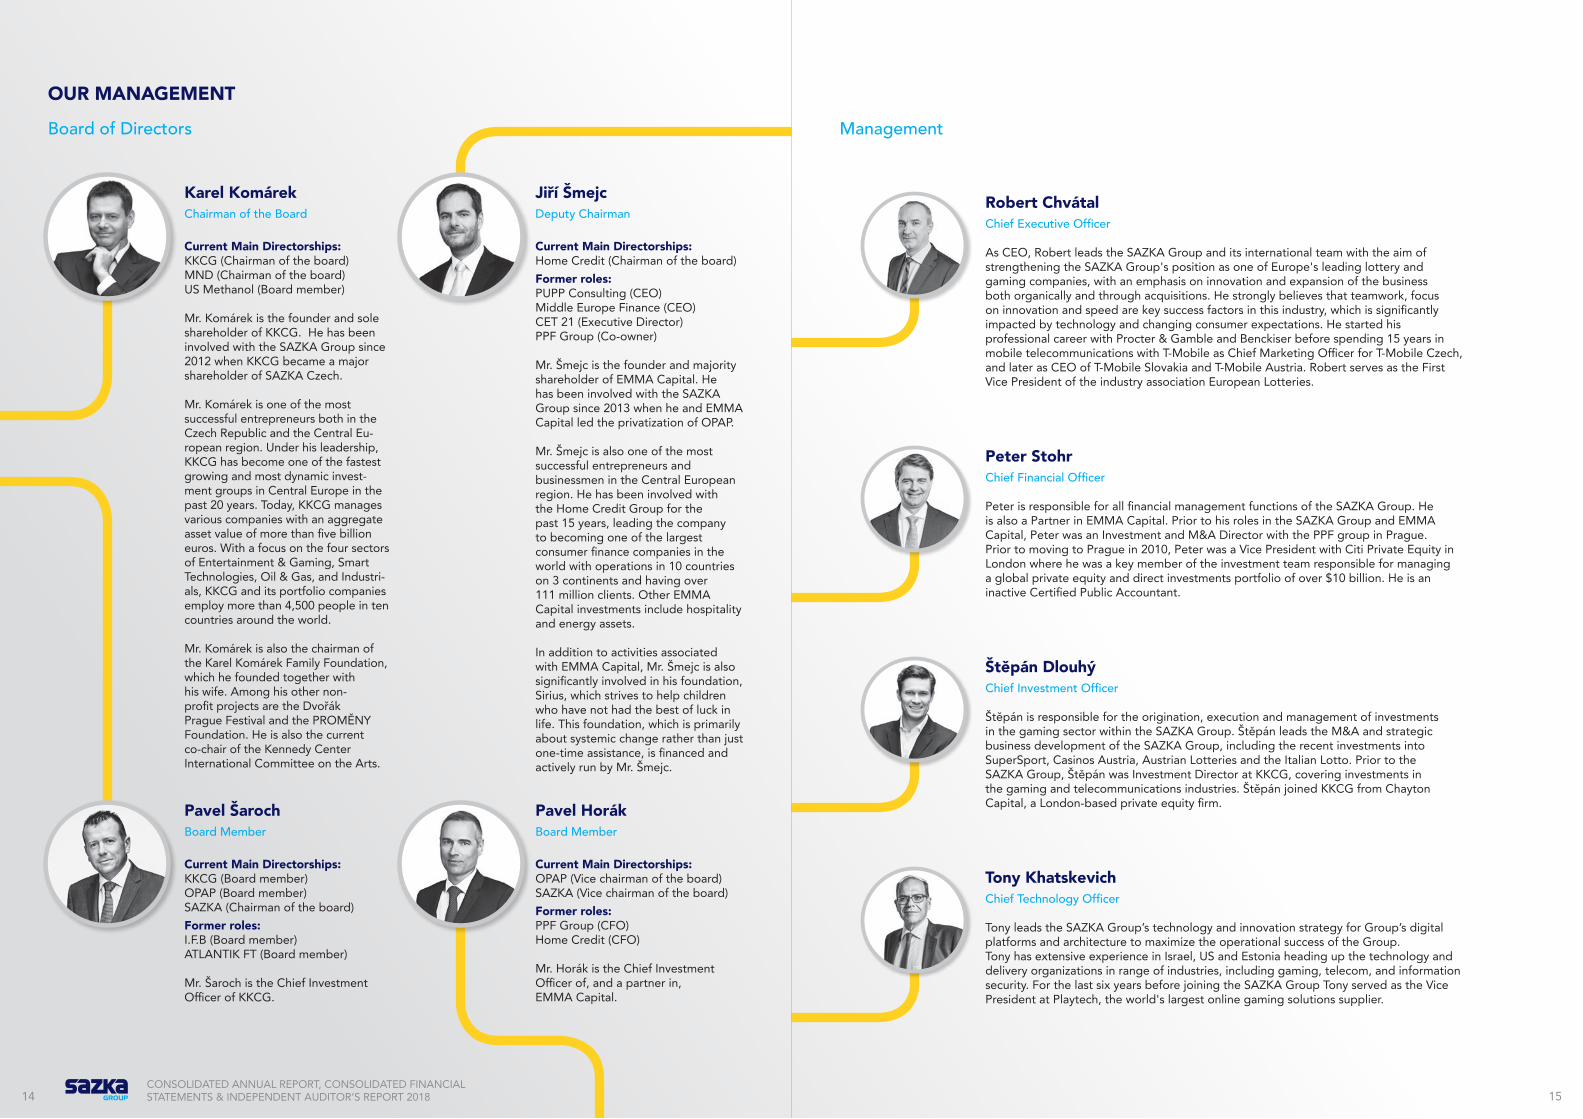
Karel KomárekChairman of the Board
Current Main Directorships:KKCG (Chairman of the board)MND (Chairman of the board)US Methanol (Board member)
Mr. Komárek is the founder and sole shareholder of KKCG. He has been involved with the SAZKA Group since 2012 when KKCG became a major shareholder of SAZKA Czech.
Mr. Komárek is one of the most successful entrepreneurs both in the Czech Republic and the Central Eu-ropean region. Under his leadership, KKCG has become one of the fastest growing and most dynamic invest-ment groups in Central Europe in the past 20 years. Today, KKCG manages various companies with an aggregate asset value of more than five billion euros. With a focus on the four sectors of Entertainment & Gaming, Smart Technologies, Oil & Gas, and Industri-als, KKCG and its portfolio companies employ more than 4,500 people in ten countries around the world.
Mr. Komárek is also the chairman of the Karel Komárek Family Foundation, which he founded together with his wife. Among his other non-profit projects are the Dvořák Prague Festival and the PROMĚNY Foundation. He is also the current co-chair of the Kennedy Center International Committee on the Arts.
Pavel ŠarochBoard Member
Current Main Directorships:KKCG (Board member)OPAP (Board member)SAZKA (Chairman of the board)Former roles:I.F.B (Board member)ATLANTIK FT (Board member)
Mr. Šaroch is the Chief Investment Officer of KKCG.
Jiří ŠmejcDeputy Chairman
Current Main Directorships:Home Credit (Chairman of the board)Former roles:PUPP Consulting (CEO)Middle Europe Finance (CEO)CET 21 (Executive Director)PPF Group (Co-owner)
Mr. Šmejc is the founder and majority shareholder of EMMA Capital. He has been involved with the SAZKA Group since 2013 when he and EMMA Capital led the privatization of OPAP.
Mr. Šmejc is also one of the most successful entrepreneurs and businessmen in the Central European region. He has been involved with the Home Credit Group for the past 15 years, leading the company to becoming one of the largest consumer finance companies in the world with operations in 10 countries on 3 continents and having over 111 million clients. Other EMMA Capital investments include hospitality and energy assets. In addition to activities associated with EMMA Capital, Mr. Šmejc is also significantly involved in his foundation, Sirius, which strives to help children who have not had the best of luck in life. This foundation, which is primarily about systemic change rather than just one-time assistance, is financed and actively run by Mr. Šmejc.
Pavel HorákBoard Member
Current Main Directorships:OPAP (Vice chairman of the board)SAZKA (Vice chairman of the board)Former roles:PPF Group (CFO)Home Credit (CFO)
Mr. Horák is the Chief Investment Officer of, and a partner in, EMMA Capital.
Robert ChvátalChief Executive Officer
As CEO, Robert leads the SAZKA Group and its international team with the aim of strengthening the SAZKA Group's position as one of Europe's leading lottery and gaming companies, with an emphasis on innovation and expansion of the business both organically and through acquisitions. He strongly believes that teamwork, focus on innovation and speed are key success factors in this industry, which is significantly impacted by technology and changing consumer expectations. He started his professional career with Procter & Gamble and Benckiser before spending 15 years in mobile telecommunications with T-Mobile as Chief Marketing Officer for T-Mobile Czech, and later as CEO of T-Mobile Slovakia and T-Mobile Austria. Robert serves as the First Vice President of the industry association European Lotteries.
Peter StohrChief Financial Officer
Peter is responsible for all financial management functions of the SAZKA Group. He is also a Partner in EMMA Capital. Prior to his roles in the SAZKA Group and EMMA Capital, Peter was an Investment and M&A Director with the PPF group in Prague. Prior to moving to Prague in 2010, Peter was a Vice President with Citi Private Equity in London where he was a key member of the investment team responsible for managing a global private equity and direct investments portfolio of over $10 billion. He is an inactive Certified Public Accountant.
Štěpán DlouhýChief Investment Officer
Štěpán is responsible for the origination, execution and management of investments in the gaming sector within the SAZKA Group. Štěpán leads the M&A and strategic business development of the SAZKA Group, including the recent investments into SuperSport, Casinos Austria, Austrian Lotteries and the Italian Lotto. Prior to the SAZKA Group, Štěpán was Investment Director at KKCG, covering investments in the gaming and telecommunications industries. Štěpán joined KKCG from Chayton Capital, a London-based private equity firm.
Tony KhatskevichChief Technology Officer
Tony leads the SAZKA Group’s technology and innovation strategy for Group’s digital platforms and architecture to maximize the operational success of the Group. Tony has extensive experience in Israel, US and Estonia heading up the technology and delivery organizations in range of industries, including gaming, telecom, and information security. For the last six years before joining the SAZKA Group Tony served as the Vice President at Playtech, the world's largest online gaming solutions supplier.
OUR MANAGEMENT

16 17CONSOLIDATED ANNUAL REPORT, CONSOLIDATED FINANCIAL STATEMENTS & INDEPENDENT AUDITOR’S REPORT 2018
OUR STRATEGY KEY INITIATIVESNew online gaming legalisation generally favourable to onshore operators
Leverage existing online lottery and betting platforms to cross-sell to other online gaming verticals
New lottery product portfolio innovations
Leverage extensive POS network coverage to broaden product offering
Capture greater market share in sports betting
Exploit potential of cross-selling to other online gaming verticals
Grow lottery GGR per adult above European average levels
Utilise brand and wide distribution network to expand in other segments
One of the largest customers for technology providers with strong purchasing power
Synergies in equipment sourcing working with multiple providers
Invest in technological support for online business growth
Invest into CRM for online platforms
Increase operational efficiency
Continue digital transformation
Efficient corporate governance
Value adding parenting role of the Group
Offer broadest gaming experience with lottery as a core
Offer new and innovative lottery products and sportsbook while focusing on further expansion into digital gaming
Focus on casual play and responsible gaming
Capitalise on large potential customer base - approximately 50% of the adult populations play lottery games
Responsible gaming commitment as a key driver of long-term trust with customers, regulators and governments
Embrace digital growth opportunitiesExploit under-penetrated markets via strong digital offeringUtilize cross-sell between gaming verticalsDevelop word-class competence in CRM (segmentation, penetration, real-time offering)
Enhance operational efficiency
Big in innovation, selective in spending
Deploy innovative technologies
Attract the best talent
High profile digital company
Blend experience with innovation and new ideas
Focus on CSR and support of good causes
Work closely with national regulators to balance contribution to good causes, responsible gaming and return to shareholders
1
2
3
4
5
6
Shift to digital gaming
Organisation
Procurement
Distribution network and marketing
Expansion into sports betting
Expanding lottery product
portfolio
Technology

KEY PERFORMANCE INDICATORS
18CONSOLIDATED ANNUAL REPORT, CONSOLIDATED FINANCIAL STATEMENTS & INDEPENDENT AUDITOR’S REPORT 2018 19
The SAZKA Group analyses its business using a number of key performance indicators KPIs. Our use or calculation of KPIs may not be comparable to the use or calculation of similarly titled measures reported by other companies in the industry, by research agencies or by market reports.
Business Segments (GGR, 2018)
Full detail on Operating segments can be found on pages 118 –119.
EBITDA is calculated as profit for the period before income tax expense, other financial gains/losses, interest expense, interest income and depreciation and amortization.
EBITDA/NGR
Net Debt/EBITDA
Net Gaming Revenues (NGR) are calculated as Gross Gaming Revenues (GGR) net of Lottery Tax. Gross Gaming Revenues are the difference between Amounts Staked and player winnings (prizes).
Net Debt and LeverageEUR millions
903
2016
1,180
2017
1,439
2018
Net Debt is calculated as debt (current and non-current bank borrowings and finance leases) less Cash, Cash equivalents and Short term financial assets.
*Note: OPAP's full year EBITDA included. **Note: SuperSport's full year EBITDA included.
Net Gaming RevenuesEUR millions
409
2016
1,134
2017
1,303
2018
EBITDA and EBITDA MarginEUR millions
149
36%
38%
2.4*
2.82.5**
42%
427
553
54%Numerical lotteries
8%Instant lotteries
25%Sports
betting
11%VLTs & gaming
machines
2%Digital games
2016 2017 2018
CAGR 2016 – 2018: 79%
CAGR 2016 – 2018: 93%

BUSINESS REVIEW

22 23CONSOLIDATED ANNUAL REPORT, CONSOLIDATED FINANCIAL STATEMENTS & INDEPENDENT AUDITOR’S REPORT 2018
Q What are your reflections on SAZKA Group’s performance for the full year 2018?
A 2018 saw the Group deliver significant strategic progress alongside continued strong growth across all our markets, both organically and via acquisition. We are continuing to leverage our iconic, trusted brands and unrivalled distribution networks, now stretching across 64,000 points of sale, to strengthen the leading position we have in all our markets.
A particular highlight was OPAP’s acquisition of a shareholding in Stoiximan, which helped to consolidate our Greek sports betting offering. We also increased our shareholding in the Austrian lottery and casino operations to 38.2%. Following the grant of the exclusive license, we have successfully rolled almost 20,000 VLTs to date and increased the number of gaming halls to more than 350, with strong performance to date.
Q Could you run through some of the key figures for the year?
A 2018 was another successful year for the SAZKA Group. We generated EBITDA of €553 million while further lowering the Group’s total leverage to 2.5 times net debt to EBITDA. EBITDA growth rates were positive across all our major European geographies and operating segments.
Numerical lotteries generated EBITDA of €365 million, up 11% year on year, instant lotteries brought EBITDA of €37 million, up 17%. EBITDA from sports betting reached €110 million which represents an increase of 73%, largely due to the contribution of the Croatian business. Digital games generated just over €22 million of EBITDA, six times more than the previous year, and this is our most
rapidly growing segment and a real priority going forward alongside our core lottery business. VLTs contributed €36 million to the overall Group’s EBITDA, which represents an increase of four times compared to 2017 due to the successful roll-out under the Greek VLT licence. In terms of our geographical markets, the year-on-year EBITDA increases were as follows: Greece and Cyprus up by 16%, the Czech Republic up by 32%, Italy up by 14% and Austria, in part due to acquisition, up by 108%.
Q How has the Group’s strategy evolved over the past year?
A SAZKA Group’s scale and breadth of experience has allowed the company to grow across multiple jurisdictions and regulatory frameworks and we are confident that we can expand our market share in new countries and markets in the future.
Our customers remain at the heart of what we do and delivering best-in-class lottery services and games drives the Group’s strategy day to day. In the long-term, we continue to focus on growing our market share with the goal of becoming one of Europe’s most preeminent entertainment companies. Our ambition is to shape the future of lottery and gaming. With unique access to cus-tomer insight, alongside our long-term commitment to investment in technology and innovation, we are strongly placed to make this happen.
Trust and reputation remain core drivers of the SAZKA Group story. Our commitment to excellence in this area underpins all our efforts. We have an unwavering commitment to work alongside industry bodies to ensure the highest standards of regulation and responsible gaming are met; indeed our gaming revenues are 100% regulated.
Finally, the aforementioned acquisitions have taken the SAZKA Group into new markets, where our products allow a greater pool of players to enjoy our games in a safe and responsible way.
Q How does the SAZKA Group give back to society?
A Our Group strategy is predicated on responsible gaming; this underpins our core values and business model and creates a long-term bond of trust with our customers who enjoy the benefits of safe and modern lotteries and other gaming products. We work very closely with a number of stakeholders and national regulators to balance our contribution to good causes, responsible gaming and returns to shareholders.
One of the Group’s commitments is to a better future for the next generation. In January 2019, we delivered the fully renovated and modernized Paediatric Clinic Nursing Ward, reception area and Renal Dialysis Unit of the Panagiotis & Aglaia Kyriakou General Children’s Hospital in Athens. With this restoration, we have completed over half of the renovation work needed to fully restore the two largest children hospitals in Greece.
A second commitment has been to the promotion of sport, particularly in the Czech Republic and Austria.
Q What are the main trends you see impacting the lottery industry in the future?
A Overall, the EU lottery market continues to expand and we are confident we have the strategy in place to continue to thrive in the long-term.
Advancements in technology are the real driver behind change in the lottery and gaming industry, and the growth of e-commerce and digital offerings will continue to shape these industries in the long-term. Consumers have increased leisure time as automation and artificial intelligence boost productivity.
This presents the Group with an opportunity, as we focus on leveraging our leading market position to adapt and grow in this ever-changing environment. The Group has strong ambitions to become the leader in this field and this has resonated strongly across the business, with our teams across Europe focused on increasing our digital presence and delivering both our traditional and new games in new and exciting ways, with new online gaming legalisation being favourable to onshore operators.
Finally, whilst we are cautious about the headwinds and geopolitical tensions fuelling increased uncertainty in the global economy, the lottery and gaming industry is relatively defensive through these macroeconomic cycles.
Overall, the world continues to change and evolve around us, and being and proactive has never been more important.
Q And how does this impact your view on prioritising investment?
A Our primary focus is on lotteries with a secondary focus on digital and sports betting. Investing in technology solutions and product innovation continue to be our priority areas and we are taking measures to ensure that our traditional and new games are accessible on the highest quality online and mobile platforms. We have also made it a priority to share our internally developed
solutions and capabilities across the different businesses and geographies within the Group.
Our approach is: big in innovation, selective in spending. Two developments that highlight this are our Win2Day platform in Austria and the acquisition of shareholding in Stoiximan, the leading online sports betting platform in Greece.
We are always seeking to exploit under-penetrated mar-kets and attract the next generation of players, not only via our strong digital offering, but also by using data analysis to make informed decisions around customer segmenta-tion, new segment penetration and real-time offerings.
Q What can you tell us about the SAZKA Group team?
A Our employees are the engine room behind our success.
I am proud to have a fantastic management team around me, with industry leading capabilities in Marketing, Technology, M&A and Finance. We need this high quality talent to be future-fit and truly grow in this industry’s changing environment. The Boards and management teams of our operating companies remain committed to the Group’s core values and our long-term strategy and we continue to attract the highest quality talent to the industry. This year’s first SAZKA Group Innovation Days was an excellent opportunity to thank the team for their commitment and to continue to encourage knowledge sharing among the Group’s business leaders across Europe.
Another highlight this year has been the strengthening of our technological and digital entertainment capabili-ties through the appointment of Tony Khatskevich from Playtech, as the Group’s Chief Technology Officer.
Q What is the Group doing to move into new growth niches?
A The SAZKA Group is advantaged by the iconic brands in its portfolio, which allow us to cross-sell between gaming verticals and enter new sub-segments. We continue to exploit under-penetrated markets via our strengthening digital offering, where our brands allow us to make ground quickly. We are growing both our mobile and online gaming products in underpenetrated markets, whilst introducing new games across our geographies.
Q What is the Group's M&A strategy moving forward?
A Our disciplined approach to M&A, supported by our ability to take on and win complex deals has certainly proven to be successful, as the Group has grown strongly to become one of Europe’s largest lottery companies. Our strategy remains one of selective acquisition balanced against organic growth and we have the purchasing power, and an entrepreneurial ownership to facilitate the deals that strengthen our business.
We assess each acquisition opportunity extremely care-fully and only seek opportunities that fit our business model. Where lotteries or individual licences are priva-tised, and the state is looking for reputable, responsible and experienced operators, we can bring the marketing and digital expertise to accelerate the growth rates of state-operated lotteries and ensure that the lottery re-mains relevant for the next generation of players.
INTERVIEW WITH CEO
Robert ChvátalChief Executive Officer
24 25CONSOLIDATED ANNUAL REPORT, CONSOLIDATED FINANCIAL STATEMENTS & INDEPENDENT AUDITOR’S REPORT 2018
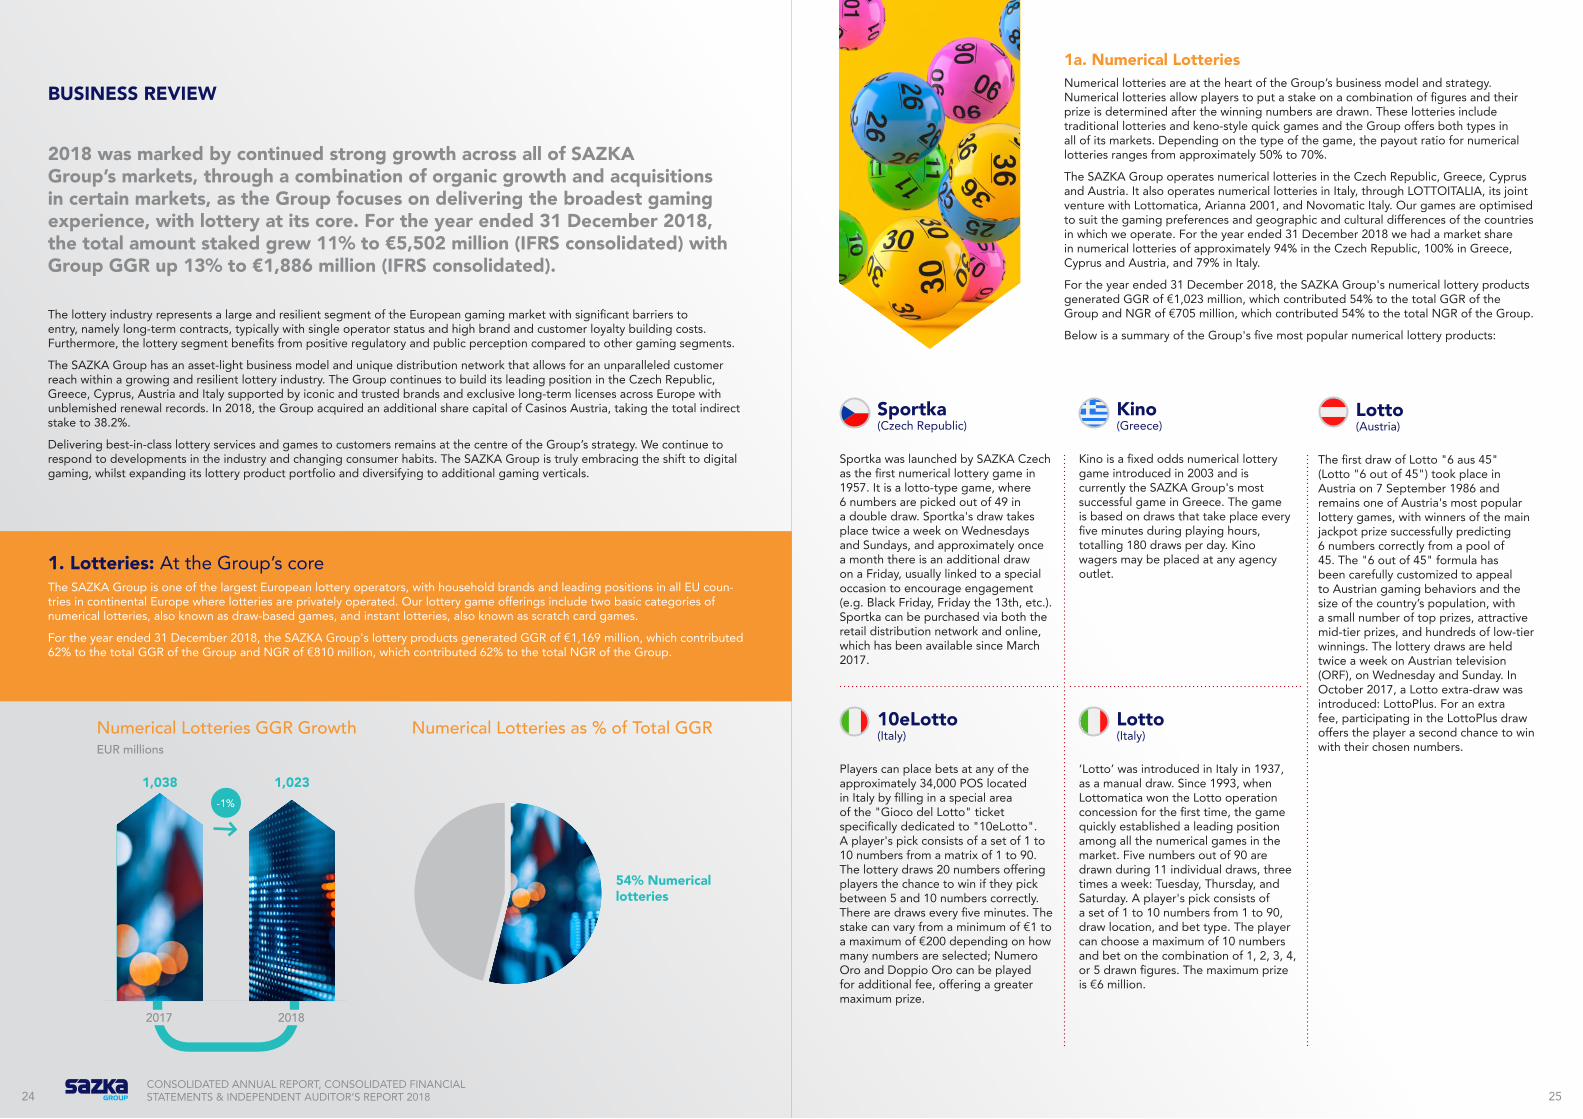
2018 was marked by continued strong growth across all of SAZKA Group’s markets, through a combination of organic growth and acquisitions in certain markets, as the Group focuses on delivering the broadest gaming experience, with lottery at its core. For the year ended 31 December 2018, the total amount staked grew 11% to €5,502 million (IFRS consolidated) with Group GGR up 13% to €1,886 million (IFRS consolidated).
1. Lotteries: At the Group’s coreThe SAZKA Group is one of the largest European lottery operators, with household brands and leading positions in all EU coun-tries in continental Europe where lotteries are privately operated. Our lottery game offerings include two basic categories of numerical lotteries, also known as draw-based games, and instant lotteries, also known as scratch card games.
For the year ended 31 December 2018, the SAZKA Group's lottery products generated GGR of €1,169 million, which contributed 62% to the total GGR of the Group and NGR of €810 million, which contributed 62% to the total NGR of the Group.
1a. Numerical LotteriesNumerical lotteries are at the heart of the Group’s business model and strategy. Numerical lotteries allow players to put a stake on a combination of figures and their prize is determined after the winning numbers are drawn. These lotteries include traditional lotteries and keno-style quick games and the Group offers both types in all of its markets. Depending on the type of the game, the payout ratio for numerical lotteries ranges from approximately 50% to 70%.
The SAZKA Group operates numerical lotteries in the Czech Republic, Greece, Cyprus and Austria. It also operates numerical lotteries in Italy, through LOTTOITALIA, its joint venture with Lottomatica, Arianna 2001, and Novomatic Italy. Our games are optimised to suit the gaming preferences and geographic and cultural differences of the countries in which we operate. For the year ended 31 December 2018 we had a market share in numerical lotteries of approximately 94% in the Czech Republic, 100% in Greece, Cyprus and Austria, and 79% in Italy.
For the year ended 31 December 2018, the SAZKA Group's numerical lottery products generated GGR of €1,023 million, which contributed 54% to the total GGR of the Group and NGR of €705 million, which contributed 54% to the total NGR of the Group.
Below is a summary of the Group's five most popular numerical lottery products:
Sportka (Czech Republic)
Sportka was launched by SAZKA Czech as the first numerical lottery game in 1957. It is a lotto-type game, where 6 numbers are picked out of 49 in a double draw. Sportka's draw takes place twice a week on Wednesdays and Sundays, and approximately once a month there is an additional draw on a Friday, usually linked to a special occasion to encourage engagement (e.g. Black Friday, Friday the 13th, etc.). Sportka can be purchased via both the retail distribution network and online, which has been available since March 2017.
Kino (Greece)
Kino is a fixed odds numerical lottery game introduced in 2003 and is currently the SAZKA Group's most successful game in Greece. The game is based on draws that take place every five minutes during playing hours, totalling 180 draws per day. Kino wagers may be placed at any agency outlet.
Lotto (Austria)
The first draw of Lotto "6 aus 45" (Lotto "6 out of 45") took place in Austria on 7 September 1986 and remains one of Austria's most popular lottery games, with winners of the main jackpot prize successfully predicting 6 numbers correctly from a pool of 45. The "6 out of 45" formula has been carefully customized to appeal to Austrian gaming behaviors and the size of the country’s population, with a small number of top prizes, attractive mid-tier prizes, and hundreds of low-tier winnings. The lottery draws are held twice a week on Austrian television (ORF), on Wednesday and Sunday. In October 2017, a Lotto extra-draw was introduced: LottoPlus. For an extra fee, participating in the LottoPlus draw offers the player a second chance to win with their chosen numbers.
10eLotto (Italy)
Players can place bets at any of the approximately 34,000 POS located in Italy by filling in a special area of the "Gioco del Lotto" ticket specifically dedicated to "10eLotto". A player's pick consists of a set of 1 to 10 numbers from a matrix of 1 to 90. The lottery draws 20 numbers offering players the chance to win if they pick between 5 and 10 numbers correctly. There are draws every five minutes. The stake can vary from a minimum of €1 to a maximum of €200 depending on how many numbers are selected; Numero Oro and Doppio Oro can be played for additional fee, offering a greater maximum prize.
Lotto (Italy)
‘Lotto’ was introduced in Italy in 1937, as a manual draw. Since 1993, when Lottomatica won the Lotto operation concession for the first time, the game quickly established a leading position among all the numerical games in the market. Five numbers out of 90 are drawn during 11 individual draws, three times a week: Tuesday, Thursday, and Saturday. A player's pick consists of a set of 1 to 10 numbers from 1 to 90, draw location, and bet type. The player can choose a maximum of 10 numbers and bet on the combination of 1, 2, 3, 4, or 5 drawn figures. The maximum prize is €6 million.
BUSINESS REVIEW
The lottery industry represents a large and resilient segment of the European gaming market with significant barriers to entry, namely long-term contracts, typically with single operator status and high brand and customer loyalty building costs. Furthermore, the lottery segment benefits from positive regulatory and public perception compared to other gaming segments.
The SAZKA Group has an asset-light business model and unique distribution network that allows for an unparalleled customer reach within a growing and resilient lottery industry. The Group continues to build its leading position in the Czech Republic, Greece, Cyprus, Austria and Italy supported by iconic and trusted brands and exclusive long-term licenses across Europe with unblemished renewal records. In 2018, the Group acquired an additional share capital of Casinos Austria, taking the total indirect stake to 38.2%.
Delivering best-in-class lottery services and games to customers remains at the centre of the Group’s strategy. We continue to respond to developments in the industry and changing consumer habits. The SAZKA Group is truly embracing the shift to digital gaming, whilst expanding its lottery product portfolio and diversifying to additional gaming verticals.
54% Numerical lotteries
Numerical Lotteries GGR GrowthEUR millions
Numerical Lotteries as % of Total GGR
1,038
2017
1,023
2018
-1%

26 27CONSOLIDATED ANNUAL REPORT, CONSOLIDATED FINANCIAL STATEMENTS & INDEPENDENT AUDITOR’S REPORT 2018
1b. Instant LotteriesInstant Lotteries offer players the chance to win prizes immediately, with prizes pre-drawn and distributed among the winning tickets beforehand. The Group regularly renews and enriches its scratch card offerings and other instant lottery games, introducing up to approximately 50 new games each year per market, and typically offers over a hundred unique scratch card games at any time. Scratch cards require the player to scratch off certain areas hiding numbers or symbols, and if the correct items are revealed, the player wins. More sophisticated scratch cards offer additional games or multiple ways to win on one card. The payout ratio for scratch card typically ranges from approximately 50% up to 70%.
The SAZKA Group offers instant lottery products in the Czech Republic, Greece and Austria. For the year ended 31 December 2018 we had a market share in instant lotteries of approximately 85% in the Czech Republic, and 100% in Greece and Austria
For the year ended 31 December 2018, the Sazka Group's instant lottery products generated GGR of €146 million, which contributed 8% to the total GGR of the Group and NGR of €106 million, which contributed 8% to the total NGR of the Group.
2. Sports Betting: Further expansion into digital gaming and retail sports bettingThe sports betting business consists of pre-match and live betting on sporting events, both through the SAZKA Group's POS and through its online sports betting platform.
The SAZKA Group offers sports betting products via its extensive POS network in Greece, Austria and Croatia* and on its online sports betting platform (including the Group's mobile websites) in the Czech Republic, Greece, Austria and Croatia.
For the year ended 31 December 2018, the Group's sports betting products generated GGR of €471 million, which contributed 25% to the total GGR of the SAZKA Group and NGR of €317 million, which contributed 24% to the total NGR of the Group.
Czech Republic
SAZKA Czech first launched instant games in 1989. Since then the product portfolio has been broadened to include higher nominal values. Moreover, new attractive thematic designs have also been introduced and customer segmentation and targeting has been applied through the launch of "product brand families". These families include "Cash" (targeted at regular players), "Black Pearls" (targeted at female players) and "Rentier" (targeted at players attracted by an opportunity to win lifetime payments). In 2017, SAZKA Czech launched the "Happiness café", a new alternative sales channel, where the customer buys a low-ticket scratch card called "Luck" when they purchase a coffee.
Greece
Launched in 2014, scratch cards are offered through an extensive sales network, which includes OPAP's agencies and additional POS, such as supermarkets, kiosks and street vendors throughout Greece. Sratch games have become successful in Greece due to their high winning rates (about one in four tickets are winning lottery tickets of any type), their diversity (different themes and price tiers) and their extensive sales network.
SAZKA Bet (Czech Republic)
SAZKA Czech launched online sports betting operations in 2009. Currently, SAZKA Bet is a pure online based sports betting operator, offering pre-match as well as live betting products where approximately 250,000 live events are offered per year. SAZKA Bet is the third largest player in the Czech sports betting market.
SuperSport* (Croatia)
Founded in 2000, SuperSport pursued an aggressive market strategy, opening through a large number of betting shops nationwide. Today, SuperSport has one of the largest retail networks in Croatia with 336 active betting shops and 853 active self-service betting terminals. In 2010, SuperSport started its online sports betting business and, thanks to its own proprietary online platform, it currently dominates the Croatian online market with more than 75% of total market share.
PAME STOIXIMA (Greece)
The main game in this category is PAME STOIXIMA where the player has the chance to predict the result of different sporting and miscellaneous events where an outcome can be anticipated. Released in 2000, PAME STOIXIMA includes constant fixed odds, where the final amount is fixed and is made known to players at the time of betting, and mutual odds, where the assigned amount changes according to the wagered amounts and is communicated to players only after the end of the betting period. Players win if they correctly predict the outcome of the event.
Austria
Since 1995, Austrian Lotteries has pursued a multi-game strategy for its scratch cards. This means that many different scratch cards, including permanent and limited-duration games, as well as games with a seasonal focus are offered on the market at the same time. The payout rate for scratch cards can be designed flexibly under Austrian regulations, but must range between 55% and 67.5% of the scratch card price. The average annual payout rate is 60%.
Sports betting and classic Toto (Austria)
In Austria, the Group offers sports betting, including the classic football pool (Toto) and betting on correct scores (Torwette). Both games are based on correctly predicting football match results and can be played via the land-based retail channel as well as online on the win2day platform. Comprehensive sports betting has also been offered through tipp3, Austria’s number one sports betting provider, since August 2001. Every year, approximately 6.3 million tipp3 bets are placed online and at more than 3,300 retail outlets throughout Austria.
Below is a summary of the Group's important instant lottery products in the Czech Republic, Greece and Austria.
Below is a summary of the Group's most popular sports betting platforms:
8% Instant lotteries
25% Sports betting
Instant Lotteries GGR GrowthEUR millions
Sports Betting GGR GrowthEUR millions
Instant Lotteries as % of Total GGR
Sports Betting as % of Total GGR
140
425
2017 2017
146
471
2018 2018
*Note: KKCG and EMMA Capital have successfully concluded negotiations on the split of the assets in the SAZKA Group. The agreement was signed on 14 March 2019. Following the transaction, KKCG will own 100% of shares in the SAZKA Group with all assets remaining as they are today except for the Croatian SuperSport business. EMMA Capital will take over ownership of the Croatian SuperSport business. The completion of the transaction is sub-ject to the approval of regulatory and competition authorities in respective countries.
+5%
+11%

28 29CONSOLIDATED ANNUAL REPORT, CONSOLIDATED FINANCIAL STATEMENTS & INDEPENDENT AUDITOR’S REPORT 2018
3. VLTs, Casinos and Other: Offering the broadest gaming experience
Financial and Payment ServicesSAZKA Czech has offered its bill payment services operations for selected partners, mainly utility providers, telecommunication operators, and insurance and media companies. SAZKA Czech's bill payment services provide customers with an alternative to Czech Post's services. SAZKA Czech also offers safe payment methods for online shops and platforms with its superCASH and paysafecard offerings. The Group also partnered with a bank to share SAZKA Czech's retail network, and offer a money withdrawal service. In 2017, the service was transformed to a cash advance service that is currently available at over 1,500 of SAZKA Czech's POS in the Czech Republic.
In 2015, SAZKA FTS a.s. was granted the permission to provide financial and transaction services by the Czech National Bank.
Mobile Virtual Network OperatorIn February 2014, SAZKA Czech launched a mobile virtual network operator (MVNO) business under the SAZKAmobil brand. The Group's MVNO provides prepaid and post-paid mobile telephone services hosted on the Vodafone network, one of the major telecommunications providers in the Czech Republic. This partnership enables SAZKA Czech to combine telecommunications and lottery offerings for its customers. As of 31 December 2018, SAZKAmobil had more than 200,000 active customers, confirming its No. 1 position on the MVNO market in the Czech Republic.
4. Digital Games: Leveraging technological advancements to grow market shareDigital games consist of games of chance developed specifically for and played via online platforms, either through websites or mobile applications. Digital products do not have any physical representation (such as a ticket or card). The payout ratio for digi-tal products ranges between approximately 74% and 98%.
The SAZKA Group offers eScratches, eCasino, and virtual sports through its online platforms in the Czech Republic, Austria and Croatia.
In Croatia, SuperSport launched its online casino operations in January 2017 and quickly became the market leader by GGR, according to H2 Gaming Capital. In the Czech Republic, SAZKA Czech launched eScratches in March 2017. Fourteen editions of eScratches have been launched benefiting from the brand awareness of the existing land-based product brand families.
For the year ended 31 December 2018, the SAZKA Group's digital products generated GGR of €32million, which contributed 2% to the total GGR of the Group and NGR of €26 million, which contributed 2% to the total NGR of the Group.
3a. VLTsVideo Lottery Terminals (VLTs) are gaming products which have proven their popularity across international gaming sector and generally refer to interactive video displays that provide a wider range of games compared with traditional slot machines. While VLTs are optically similar to the classic slot machines found in casinos, they differ in their gaming mechanism.
The Group operates VLTs in Austria and Greece. For the year ended 31 December 2018, the Group had a 100% market share in VLTs in Austria, through Austrian Lotteries, and a 100% market share in Greece, through OPAP. In Greece, OPAP holds a license for 25,000 VLTs, with approx. 19,000 being operational by the end of 2018 and the remaining 6,000 to be installed in 2019.
3b. CasinosLand-based casinos consist of real money gaming activity that takes place within a licensed casino including table games, gaming machines and bingo.
Casinos Austria is the only company licensed to operate casinos in Austria. Currently, the company has 12 domestic casinos located in Austria and 24 land-based casinos operated with local partners in 11 countries internationally. The International land-based casinos are located in Australia, Belgium, the Czech Republic, Denmark, Egypt, Liechtenstein, Georgia, Germany, Hungary and Switzerland.
3c. Other ServicesThe SAZKA Group also provides a variety of other services to its customers in Greece and the Czech Republic, including financial and payment services including mobile top-ups and bill payment services. Services offered in the Czech Republic also include automated teller machine services.

FINANCIAL REVIEW
32 33CONSOLIDATED ANNUAL REPORT, CONSOLIDATED FINANCIAL STATEMENTS & INDEPENDENT AUDITOR’S REPORT 2018
THE GROUP'S FINANCIAL POSITIONMAIN DRIVERS OF FINANCIAL PERFORMANCE
THE SAZKA GROUP'S FINANCIAL PROFITABILITY, CASHFLOW, AND FINANCIAL POSITION FURTHER IMPROVED IN 2018
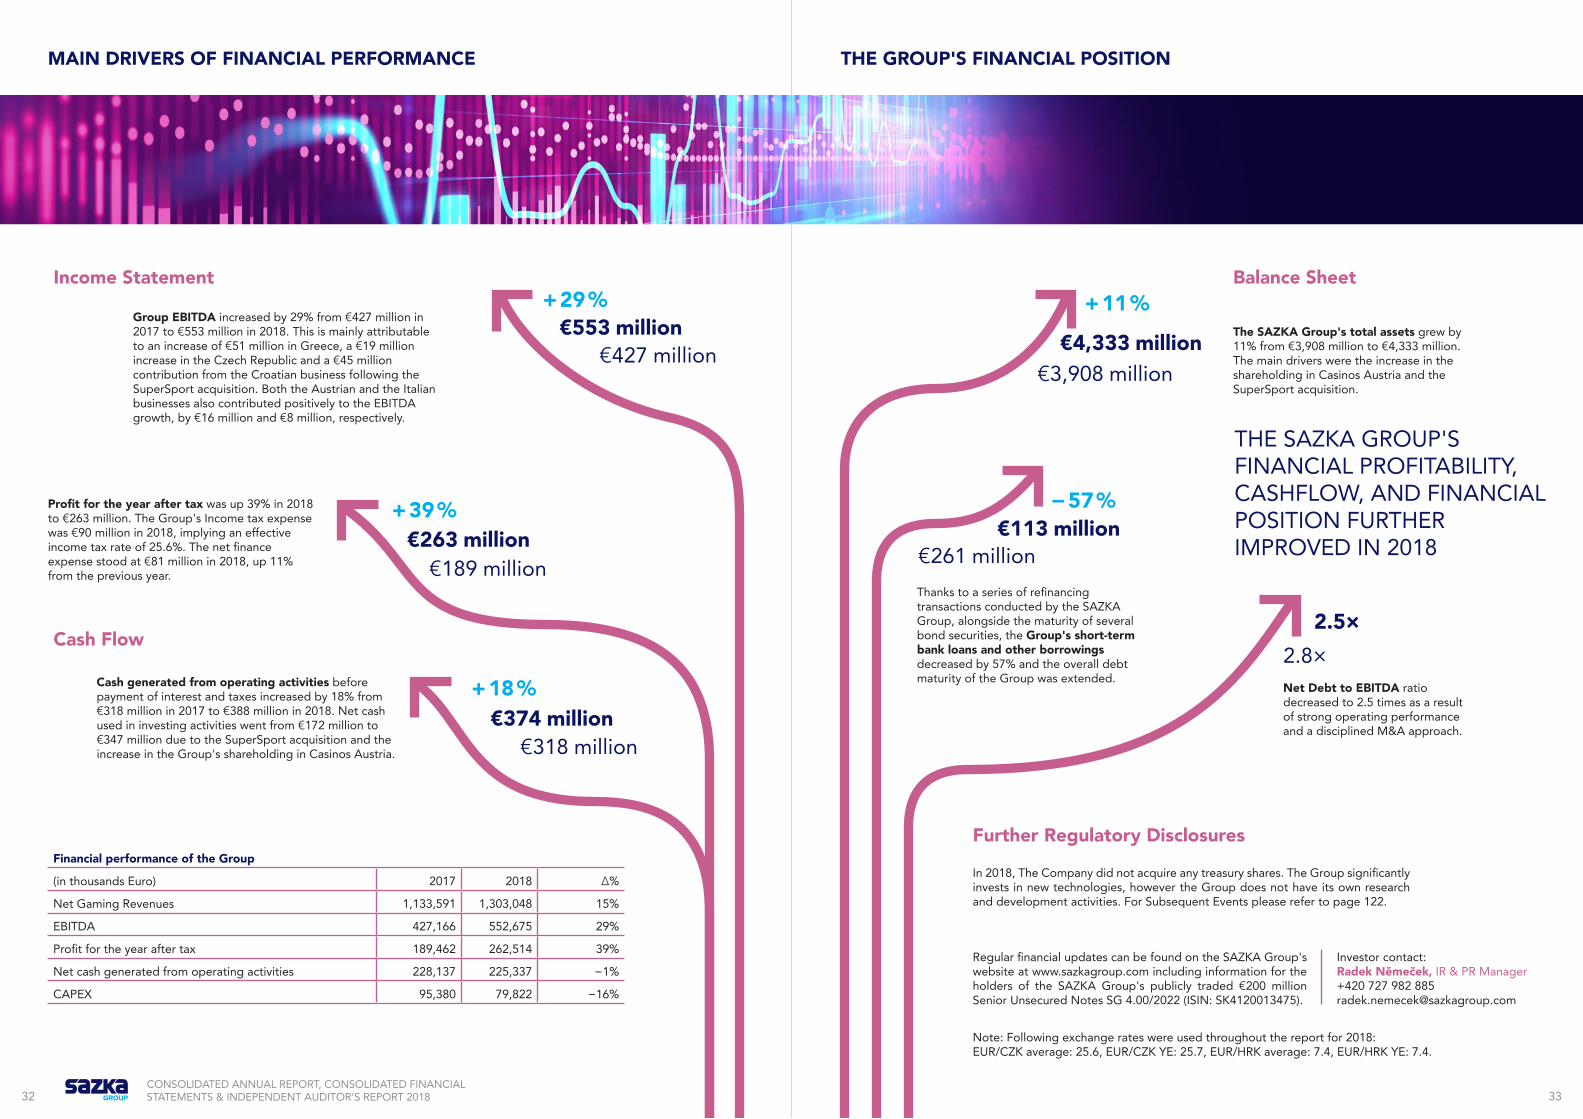
Cash generated from operating activities before payment of interest and taxes increased by 18% from €318 million in 2017 to €388 million in 2018. Net cash used in investing activities went from €172 million to €347 million due to the SuperSport acquisition and the increase in the Group's shareholding in Casinos Austria.
Financial performance of the Group
(in thousands Euro) 2017 2018 Δ%
Net Gaming Revenues 1,133,591 1,303,048 15%
EBITDA 427,166 552,675 29%
Profit for the year after tax 189,462 262,514 39%
Net cash generated from operating activities 228,137 225,337 −1%
CAPEX 95,380 79,822 −16%
Group EBITDA increased by 29% from €427 million in 2017 to €553 million in 2018. This is mainly attributable to an increase of €51 million in Greece, a €19 million increase in the Czech Republic and a €45 million contribution from the Croatian business following the SuperSport acquisition. Both the Austrian and the Italian businesses also contributed positively to the EBITDA growth, by €16 million and €8 million, respectively.
Income Statement Balance Sheet
Cash Flow
Further Regulatory Disclosures
The SAZKA Group's total assets grew by 11% from €3,908 million to €4,333 million. The main drivers were the increase in the shareholding in Casinos Austria and the SuperSport acquisition.
Net Debt to EBITDA ratio decreased to 2.5 times as a result of strong operating performance and a disciplined M&A approach.
Note: Following exchange rates were used throughout the report for 2018: EUR/CZK average: 25.6, EUR/CZK YE: 25.7, EUR/HRK average: 7.4, EUR/HRK YE: 7.4.
Regular financial updates can be found on the SAZKA Group's website at www.sazkagroup.com including information for the holders of the SAZKA Group's publicly traded €200 million Senior Unsecured Notes SG 4.00/2022 (ISIN: SK4120013475).
In 2018, The Company did not acquire any treasury shares. The Group significantly invests in new technologies, however the Group does not have its own research and development activities. For Subsequent Events please refer to page 122.
Investor contact: Radek Němeček, IR & PR Manager +420 727 982 885 [email protected]
Thanks to a series of refinancing transactions conducted by the SAZKA Group, alongside the maturity of several bond securities, the Group's short-term bank loans and other borrowings decreased by 57% and the overall debt maturity of the Group was extended.
€261 million
€3,908 million
2.8×
€113 million
€4,333 million
+ 29 %€553 million
€427 million
+ 18 %€374 million
€318 million
+ 39 %€263 million
€189 million
2.5×
− 57 %
+ 11 %
Profit for the year after tax was up 39% in 2018 to €263 million. The Group's Income tax expense was €90 million in 2018, implying an effective income tax rate of 25.6%. The net finance expense stood at €81 million in 2018, up 11% from the previous year.

RESPONSIBILITY

36 37CONSOLIDATED ANNUAL REPORT, CONSOLIDATED FINANCIAL STATEMENTS & INDEPENDENT AUDITOR’S REPORT 2018
The SAZKA Group operates in a number of different countries and jurisdictions across Europe; our overarching purpose however is the same in each geography – to balance the Group’s core commercial objectives as an entertainment company while promoting responsible gaming and driving a positive impact in society.
The countries where we operate benefit alongside us from our success. OPAP is one of Greece's highest taxpayers with SAZKA Czech and Casinos Austria also among the 10 largest taxpayers in the Czech Republic and Austria respectively.
With operations across a number of countries in continental Europe, the SAZKA Group has a unique understanding of the cultural importance and heritage of national lotteries, and places great pride in being able to operate these franchises and their trusted and well-known brands. We firmly believe we have a responsibility to make a real difference to the communities in which we operate, and we are committed to this end.
The SAZKA Group works closely with a number of stakeholders and national regulators to ensure players have a positive and entertaining experience, and that the Group also makes a lasting and beneficial impact. Through its operating companies, the Group has invested capital and resources into a number of different projects, striving to improve social wellbeing, particularly through supporting sport and culture, in addition to the job creation and opportunities enabled by the SAZKA Group’s activities.
Greece
OPAP’s work is centred around creat-ing a brighter future for Greece and its people, with projects and investments focused on community, sports and en-trepreneurship. As one of Greece’s most well-loved brands, OPAP has been inspired to make a real difference in the Greek community.
In 2014 OPAP set out to renovate Greece’s two largest children’s hospitals, General Children’s Hospital in Athens. Since the initiative was launched, OPAP has delivered 23 renovation works, including 16 completely renovated Nursing wards with 9,930 sq. meters of total area and 345 beds in capacity.
OPAP believes that sports are key to a full and healthy life, and understands there is nowhere better to start than with the youngest members of Greece’s population. By investing in children, OPAP invests in the future of sports. Through the programme “OPAP Sports Academies”, OPAP supports 128 Amateur Academies in 49 Greek Prefectures and 13,000 young athletes. At the same time, OPAP helps to develop the technical expertise of the Academies’ 700 coaches, through educational seminars and training. The programme‘s science team also offers children and their parents guidance and advice on medical, psychological and nutritional wellbeing.
OPAP’s positive impact in Greece is reinforced by its support for entre-preneurship and the implementation of the “OPAP Forward” programme, designed to offer a unique opportunity to fast growing small and medium sized businesses. OPAP helps these business-es reach their full potential, generating new jobs and contributing to OPAP’s vi-sion of revitalizing the Greek market, while creating better prospects for future generations.
Italy
In Italy, Lottomatica, the partner with whom we jointly operate the Lotto licence, supports a diverse array of community wellbeing projects
Most recently, Lottomatica partnered with the Bargello Museums of Florence to complete a lighting, maintenance and restoration project at the The New Sacristy of San Lorenzo in Florence, one of the most important monuments of the Italian Renaissance.
Vincere da Grandi, another initiative, was first established by Lottomatica in 2015, with the aim of offering children in the disadvantaged areas of Italy’s largest cities the opportunity to practice sports for free. The project has been carried out in collaboration with the Italian National Olympic Committee (CONI). In 2018, new free sports courses were introduced, dedicated to the mothers of the participating children, in the offices of Rome and Naples.
Generazione Cultura is a project initiated by Lottomatica, in partnership with Luiss-Business School, which aims to help young talent enhance their skills and build on the artistic and cultural heritage of our country.
Austria
The Austrian Lotteries Group partners with various organisations, funding sports initiatives as well as social projects, and is among the most important sponsors of arts and culture in Austria.
In 2013 the Group launched a corporate volunteering programme for all employees of the Austrian Lotteries Group, which gives them paid time off from work to support community or social causes.
Over 700 employees have already taken advantage of this offer, supporting organisations such as Caritas, Hilfswerk, Lebenshilfe, Soma, Wiener Tafel and the Austrian Red Cross. This response led management to expand the programme in 2018, and increase the grant from one day per employee per year to five days per employee, per year.
SOCIAL RESPONSIBILITYRESPONSIBILITY
Below are some of the key initiatives supported by the Group’s operating companies in each country we operate:
Czech Republic
In the Czech Republic, we are the long-term principal partner of the Czech Olympic Foundation, an organisation that supports young athletes aged from 6 to 18. The goal is to improve the lifestyle of today’s young generation and promote the traditional Olympic values. The Czech Olympic Foundation programmes involve elementary school children in eight sports disciplines during their PE classes and motivate them to pursue a physical activity of their choice outside of school.

38 39CONSOLIDATED ANNUAL REPORT, CONSOLIDATED FINANCIAL STATEMENTS & INDEPENDENT AUDITOR’S REPORT 2018
Czech Republic
In the Czech Republic, SAZKA Czech has been applying Responsible Gaming. In 2017, SAZKA Czech was awarded the European Lotteries Responsible Gaming Certificate confirming the company’s compliance with the European Lotteries’ highest standards. Subsequently, SAZKA Czech requested an assessment from the World Lottery Association, and was awarded with the Level 4 Responsible Gaming Certification, the highest level of Responsible Gaming certification issued by WLA.
RESPONSIBLE GAMING
Responsible Gaming is at the core of the SAZKA Group's culture and mission, as we strive to design and provide safe, legal, and balanced forms of entertainment in every market in which we operate. 100% of the Group’s gaming revenue is regulated and supervised by numerous regulators worldwide.
By their nature, draw-based games and instant lotteries operate through the periodic payments of small amounts by the players to participate in the game. Each of SAZKA Group’s operating companies have a set of robust measures in place to ensure the general public and especially vulnerable social groups are protected from excessive gaming, whilst protecting minors from any participation in games of chance.
Austria
In Austria, Responsible gaming measures were implemented under the guidance of the statutory and official provisions in Austria, and there has been no increased incidence of gaming addiction since 2009. Responsible Gaming is at the heart of Casino Austria’s sales activities and the World Lottery Association rewarded Austrian Lotteries with Level 4 certification for Responsible Gaming, the highest level of Responsible Gaming certification issued by WLA. In June 2009, Austrian Lotteries was also awarded the European Lotteries Responsible Gaming Certificate, which is still maintained based on triannual renewals.
Croatia
In Croatia, SuperSport fully complies with the regulation as set by the Croatian Gaming Act and all respective by-laws. Every retail player has his or her age checked by shop assistants to prove he or she is over 18. The online registration process is robust and sophisticated. It allows only Croatian residents to play as all the players need to provide their individual tax number. The SuperSport shops require sight of the player's ID when depositing money into their account or, where money is deposited by bank transfer, the shop will seek verification from the player's bank.
Greece
In Greece, OPAP supports independent research, studies and conferences that contribute to the wider understanding of problem gaming, and is utilising the findings of this research to design intervention programmes that primarily protect minors and other vulnerable groups. The above framework was recognised by the World Lottery Association. OPAP and Hellenic Lotteries S.A. are the only Greek companies to have attained Level 4 certification, confirming their commitment to protecting consumers and serving as a model organisation in the games of chance industry in Greece. OPAP has been presenting its strategy, initiatives and results through Corporate Responsibility Reports that follow the "Sustainability Reporting Guidelines" of the Global Reporting Initiative for structure and content.
30 April 2019
Signature of the authorised representatives:
........................................................
Pavel ŠarochMember of the Board of Directors
........................................................
Pavel HorákMember of the Board of Directors

FINANCIAL STATEMENTS AND NOTES

42 43CONSOLIDATED ANNUAL REPORT, CONSOLIDATED FINANCIAL STATEMENTS & INDEPENDENT AUDITOR’S REPORT 2018
SAZKA Group a.s. Consolidated financial statements for the year ended 31 December 2018 (in thousands of Euro)
Consolidated statement of financial position Note 31/12/2018 31/12/2017 Restated*
ASSETS
Intangible assets 4 1,989,714 1,980,572
Goodwill 4 892,149 620,195
Property, plant and equipment 5 142,732 138,182
Investment property 903 922
Other non-current investments 2,201 918
Equity method investees 6 670,729 498,579
Long-term receivables and other non-current assets 8 86,323 23,372
Deferred tax asset 7 2,046 3,716
Total non-current assets 3,786,797 3,266,456
Inventories 11,266 8,400
Short-term trade receivables and other current assets 8 206,556 213,522
Current tax asset 288 893
Short-term financial assets 9 15,010 8,908
Cash and cash equivalents 10 312,678 410,288
Total current assets 545,798 642,011
Total assets 4,332,595 3,908,467
*The Group restated comparatives upon completion of acquisition accounting for NEUROSOFT S.A. (Note 2 (i)).
The notes on pages 50 to 122 are an integral part of these consolidated financial statements.
Consolidated statement of financial position (continued) Note 31/12/2018 31/12/2017 Restated*
EQUITY AND LIABILITIES
Equity
Share capital 12 81 81
Capital contributions and other reserves 473,034 485,439
Translation reserve −9,842 −12,462
Retained earnings and profit for the year 347,849 250,004
Total equity attributable to owners of the Company 811,122 723,062
Non-controlling interest 13 961,960 929,072
Total equity 1,773,082 1,652,134
Liabilities
Bank loans and other borrowings – non-current portion 14 1,653,740 1,338,235
Other long-term liabilities 16 129,484 11,912
Long term provisions 15 31,688 33,767
Employee benefits 4,807 3,084
Deferred tax liability 7 234,005 225,801
Total non-current liabilities 2,053,724 1,612,799
Bank loans and other borrowings, current portion 14 113,172 261,429
Short-term trade and other payables 16 363,379 370,268
Current tax liability 16,600 2,148
Short-term provisions 15 12,638 9,689
Total current liabilities 505,789 643,534
Total liabilities 2,559,513 2,256,333
Total equity and liabilities 4,332,595 3,908,467
*The Group restated comparatives upon completion of acquisition accounting for NEUROSOFT S.A. (Note 2 (i)).
The notes on pages 50 to 122 are an integral part of these consolidated financial statements.
44 45CONSOLIDATED ANNUAL REPORT, CONSOLIDATED FINANCIAL STATEMENTS & INDEPENDENT AUDITOR’S REPORT 2018
SAZKA Group a.s. Consolidated financial statements for the year ended 31 December 2018 (in thousands of Euro)
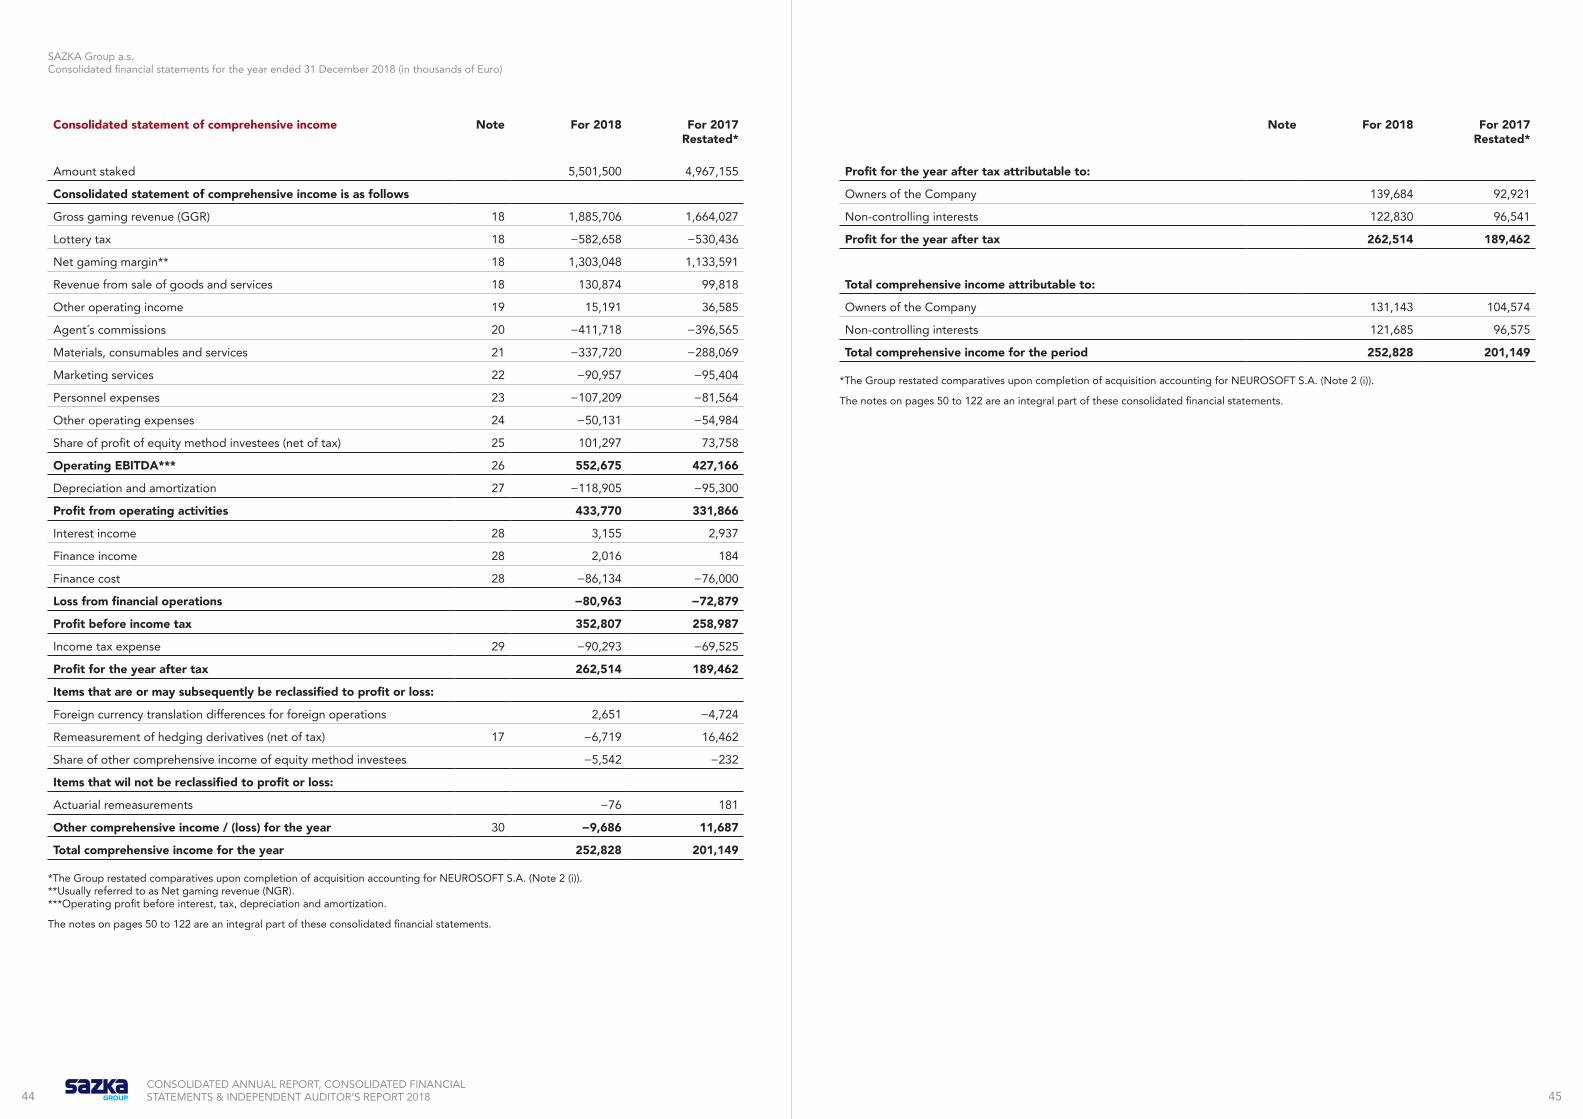
Consolidated statement of comprehensive income Note For 2018 For 2017 Restated*
Amount staked 5,501,500 4,967,155
Consolidated statement of comprehensive income is as follows
Gross gaming revenue (GGR) 18 1,885,706 1,664,027
Lottery tax 18 −582,658 −530,436
Net gaming margin** 18 1,303,048 1,133,591
Revenue from sale of goods and services 18 130,874 99,818
Other operating income 19 15,191 36,585
Agent´s commissions 20 −411,718 −396,565
Materials, consumables and services 21 −337,720 −288,069
Marketing services 22 −90,957 −95,404
Personnel expenses 23 −107,209 −81,564
Other operating expenses 24 −50,131 −54,984
Share of profit of equity method investees (net of tax) 25 101,297 73,758
Operating EBITDA*** 26 552,675 427,166
Depreciation and amortization 27 −118,905 −95,300
Profit from operating activities 433,770 331,866
Interest income 28 3,155 2,937
Finance income 28 2,016 184
Finance cost 28 −86,134 −76,000
Loss from financial operations −80,963 −72,879
Profit before income tax 352,807 258,987
Income tax expense 29 −90,293 −69,525
Profit for the year after tax 262,514 189,462
Items that are or may subsequently be reclassified to profit or loss:
Foreign currency translation differences for foreign operations 2,651 −4,724
Remeasurement of hedging derivatives (net of tax) 17 −6,719 16,462
Share of other comprehensive income of equity method investees −5,542 −232
Items that wil not be reclassified to profit or loss:
Actuarial remeasurements −76 181
Other comprehensive income / (loss) for the year 30 −9,686 11,687
Total comprehensive income for the year 252,828 201,149
*The Group restated comparatives upon completion of acquisition accounting for NEUROSOFT S.A. (Note 2 (i)). **Usually referred to as Net gaming revenue (NGR). ***Operating profit before interest, tax, depreciation and amortization.
The notes on pages 50 to 122 are an integral part of these consolidated financial statements.
Note For 2018 For 2017 Restated*
Profit for the year after tax attributable to:
Owners of the Company 139,684 92,921
Non-controlling interests 122,830 96,541
Profit for the year after tax 262,514 189,462
Total comprehensive income attributable to:
Owners of the Company 131,143 104,574
Non-controlling interests 121,685 96,575
Total comprehensive income for the period 252,828 201,149
*The Group restated comparatives upon completion of acquisition accounting for NEUROSOFT S.A. (Note 2 (i)).
The notes on pages 50 to 122 are an integral part of these consolidated financial statements.
SAZKA Group a.s. Consolidated financial statements for the year ended 31 December 2018 (in thousands of Euro)
CONSOLIDATED ANNUAL REPORT, CONSOLIDATED FINANCIAL STATEMENTS & INDEPENDENT AUDITOR’S REPORT 201846
Consolidated statement of changes in equity Note Share capital
Reserve fund
Other funds
Currency translation
reserve
Hedging reserve
Retained earnings and profit for
the period
Total equity attributable to owners
of the Company
Non-controlling interest
Total equity
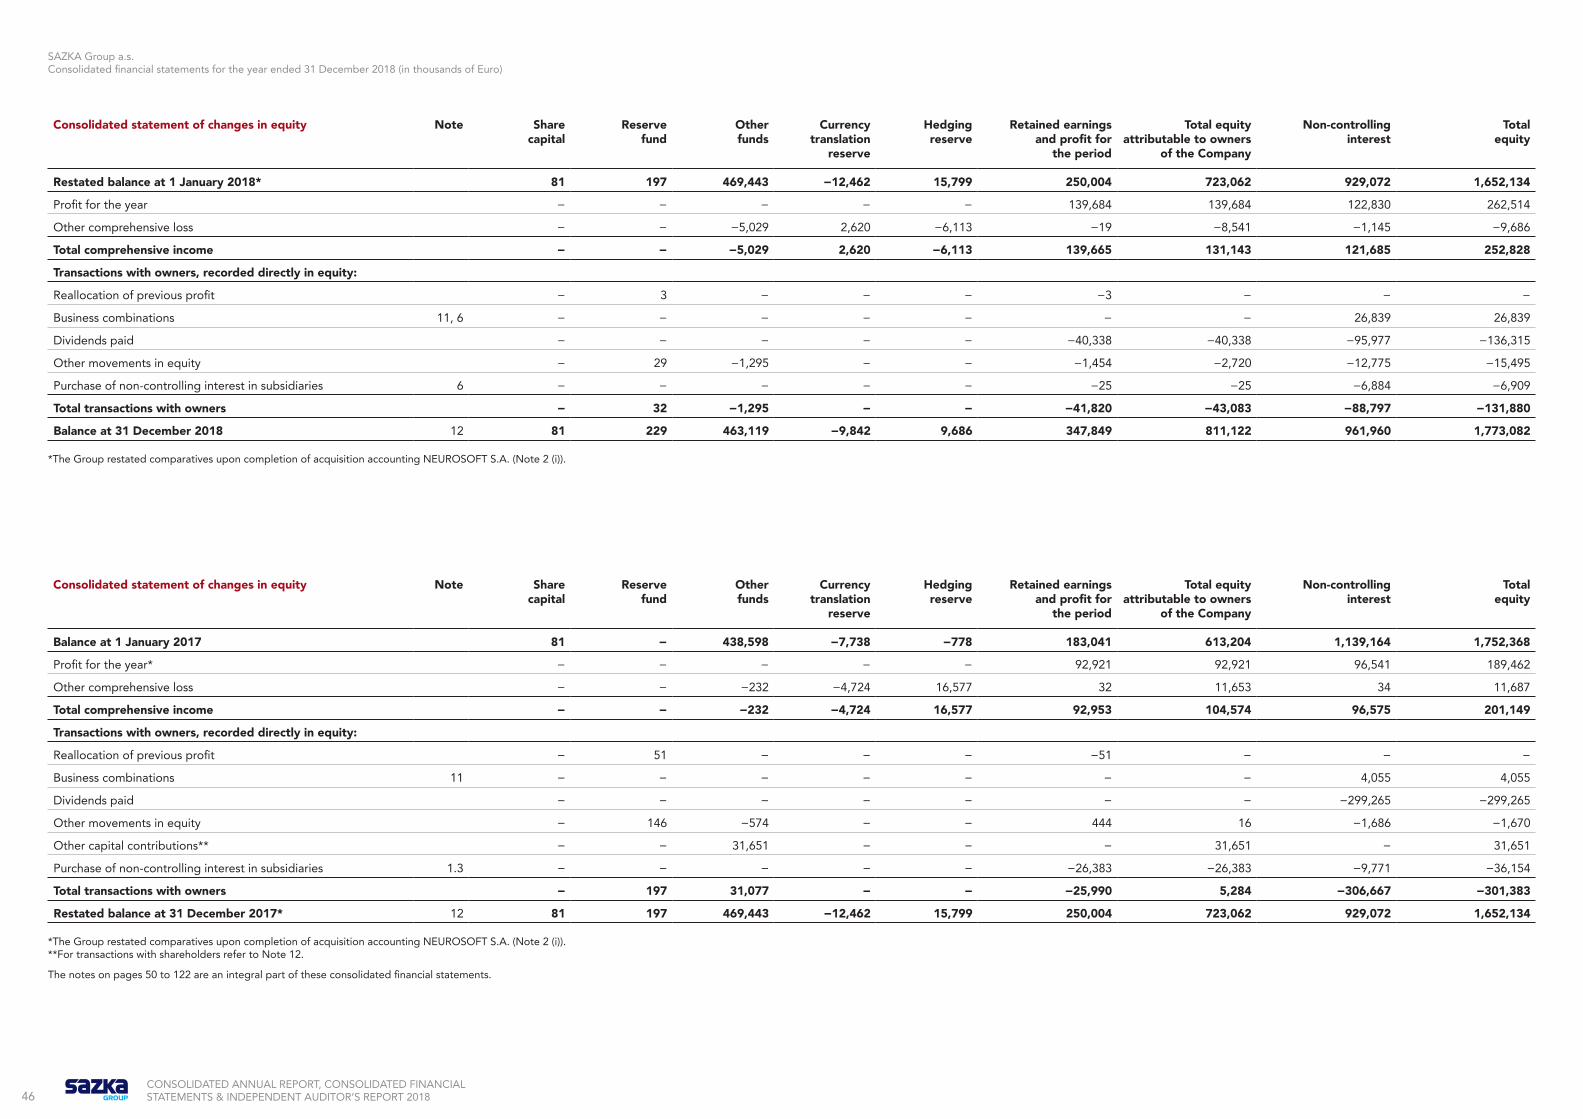
Restated balance at 1 January 2018* 81 197 469,443 −12,462 15,799 250,004 723,062 929,072 1,652,134
Profit for the year − − − − − 139,684 139,684 122,830 262,514
Other comprehensive loss − − −5,029 2,620 −6,113 −19 −8,541 −1,145 −9,686
Total comprehensive income − − −5,029 2,620 −6,113 139,665 131,143 121,685 252,828
Transactions with owners, recorded directly in equity:
Reallocation of previous profit − 3 − − − −3 − − −
Business combinations 11, 6 − − − − − − − 26,839 26,839
Dividends paid − − − − − −40,338 −40,338 −95,977 −136,315
Other movements in equity − 29 −1,295 − − −1,454 −2,720 −12,775 −15,495
Purchase of non-controlling interest in subsidiaries 6 − − − − − −25 −25 −6,884 −6,909
Total transactions with owners − 32 −1,295 − − −41,820 −43,083 −88,797 −131,880
Balance at 31 December 2018 12 81 229 463,119 −9,842 9,686 347,849 811,122 961,960 1,773,082
*The Group restated comparatives upon completion of acquisition accounting NEUROSOFT S.A. (Note 2 (i)).
Consolidated statement of changes in equity Note Share capital
Reserve fund
Other funds
Currency translation
reserve
Hedging reserve
Retained earnings and profit for
the period
Total equity attributable to owners
of the Company
Non-controlling interest
Total equity
Balance at 1 January 2017 81 − 438,598 −7,738 −778 183,041 613,204 1,139,164 1,752,368
Profit for the year* − − − − − 92,921 92,921 96,541 189,462
Other comprehensive loss − − −232 −4,724 16,577 32 11,653 34 11,687
Total comprehensive income − − −232 −4,724 16,577 92,953 104,574 96,575 201,149
Transactions with owners, recorded directly in equity:
Reallocation of previous profit − 51 − − − −51 − − −
Business combinations 11 − − − − − − − 4,055 4,055
Dividends paid − − − − − − − −299,265 −299,265
Other movements in equity − 146 −574 − − 444 16 −1,686 −1,670
Other capital contributions** − − 31,651 − − − 31,651 − 31,651
Purchase of non-controlling interest in subsidiaries 1.3 − − − − − −26,383 −26,383 −9,771 −36,154
Total transactions with owners − 197 31,077 − − −25,990 5,284 −306,667 −301,383
Restated balance at 31 December 2017* 12 81 197 469,443 −12,462 15,799 250,004 723,062 929,072 1,652,134
*The Group restated comparatives upon completion of acquisition accounting NEUROSOFT S.A. (Note 2 (i)). **For transactions with shareholders refer to Note 12.
The notes on pages 50 to 122 are an integral part of these consolidated financial statements.

47 48CONSOLIDATED ANNUAL REPORT, CONSOLIDATED FINANCIAL STATEMENTS & INDEPENDENT AUDITOR’S REPORT 2018
SAZKA Group a.s. Consolidated financial statements for the year ended 31 December 2018 (in thousands of Euro)
Consolidated statement of cash flows Note For 2018 For 2017 Restated*
OPERATING ACTIVITIES
Profit (+) for the year 262,514 189,462
Adjustments for:
Income tax expense 29 90,293 69,525
Depreciation and amortization 27 101,364 95,300
Impairment losses on intangible assets & goodwill 27 17,541 −
Profit (-) / loss (+) on sale of property, plant and equipment and intangible assets 19, 24 66 71
Net interest expense (+) 28 72,896 66,473
Net FX gains (-) / losses (+) 28 −161 346
Other financial gains (dividends) 28 −44 −34
Share of profit (-) of equity method investees 25 −101,297 −73,758
Operating result before changes in working capital and provisions 443,172 347,385
Increase (+) / decrease (-) in provisions 2,593 −1,369
Increase (-) / decrease (+) in inventories −2,866 4,549
Increase (-) / decrease (+) in trade receivables and other assets −51,304 −76,245
Increase (+) / decrease (-) in trade and other payables −3,369 43,355
Cash generated from operating activities 388,226 317,674
Interest paid −91,084 −54,796
Income tax paid −71,795 −34,741
Net cash generated from operating activities 225,337 228,137
INVESTING ACTIVITIES
Acquisition of property, plant and equipment and intangible assets −79,822 −95,380
Acquisition of subsidiaries, net of cash acquired 11 −200,915 −33,181
Acquisition of equity method investees 6 −186,528 −101,668
Distribution from equity method investees 6 32,796 27,330
Proceeds from sale of property, plant and equipment and intangible assets 276 190
Interest received 2,022 2,547
Dividends received 77,380 23,492
Net movement in short-term financial assets** 7,699 4,698
Net cash used in investing activities −347,091 −171,972
*The restated comparatives upon completion of acquisition accounting for NEUROSOFT S.A. (Note 2 (i)). **Net results from cashpooling transactions.
The notes on pages 50 to 122 are an integral part of these consolidated financial statements.
Consolidated statement of cash flows (continued) Note For 2018 For 2017 Restated*
FINANCING ACTIVITIES
Dividends paid to owners of the Company −40,338 −
Dividends paid to non-controlling interest 12 −95,977 −299,265
Contributions to other capital funds 12 − 31,651
Loans and borrowings received 14 996,345 696,696
Repayment of loans and borrowings 14 −806,885 −399,413
Net movement in restricted cash related to financing activities −13,801 −
Other capital transactions with owners −9,094 −1,586
Purchases of non-controlling interest in subsidiaries −6,909 −36,154
Net cash generated from (+) / used in (-) financing activities 23,341 −8,070
Net decrease (-) / increase (+) in cash and cash equivalents −98,413 48 095
Effect of currency translation on cash and cash equivalents 803 -3,806
Cash and cash equivalents at the beginning of the year 10 410,288 365,999
Cash and cash equivalents at the end of the year 10 312,678 410,288
*The restated comparatives upon completion of acquisition accounting for NEUROSOFT S.A. (Note 2 (i)).
The notes on pages 50 to 122 are an integral part of these consolidated financial statements.

49 50CONSOLIDATED ANNUAL REPORT, CONSOLIDATED FINANCIAL STATEMENTS & INDEPENDENT AUDITOR’S REPORT 2018
SAZKA Group a.s. Consolidated financial statements for the year ended 31 December 2018 (in thousands of Euro)
Notes to the consolidated financial statements – Contents
1. General information about the Group ....................................................................................................................................501.1 Description ..............................................................................................................................................................................501.2 Principal activity ......................................................................................................................................................................501.3 Group companies ...................................................................................................................................................................501.4 Statutory body and supervisory board ...................................................................................................................................531.5 Shareholders as at 31 December 2018: ..................................................................................................................................532. Basis of preparation ................................................................................................................................................................543. Significant accounting policies ...............................................................................................................................................604. Intangible assets and goodwill ...............................................................................................................................................735. Property, plant and equipment, investment property ............................................................................................................776. Equity method investees ........................................................................................................................................................797. Deferred tax assets and liabilities ...........................................................................................................................................838. Trade and other receivables ...................................................................................................................................................859. Short-term financial assets ......................................................................................................................................................8510. Cash and cash equivalents ......................................................................................................................................................8611. New acquisitions .....................................................................................................................................................................8612. Equity ......................................................................................................................................................................................9013. Non-controlling interests ........................................................................................................................................................9114. Loans and borrowings .............................................................................................................................................................9315. Provisions ................................................................................................................................................................................9416. Trade and other payables .......................................................................................................................................................9517. Derivatives ..............................................................................................................................................................................9618. Revenues and Revenue from sale of goods and services .......................................................................................................9819. Other operating income .......................................................................................................................................................10020. Agents’ commissions ............................................................................................................................................................10021. Materials, consumables and services ....................................................................................................................................10022. Marketing services ................................................................................................................................................................10123. Personnel expenses ..............................................................................................................................................................10124. Other operating expenses ....................................................................................................................................................10125. Share of profit equity method investees ..............................................................................................................................10226. Operating EBITDA ................................................................................................................................................................10227. Depreciation and amortization .............................................................................................................................................10228. Interest income, finance income and finance costs ..............................................................................................................10229. Income tax expense ..............................................................................................................................................................10330. Other comprehensive income/loss for the year ...................................................................................................................10431. Operating leases ...................................................................................................................................................................10532. Contingencies .......................................................................................................................................................................10533. Risk management and disclosure methods ..........................................................................................................................10734. Operating segments .............................................................................................................................................................11835. Related parties ......................................................................................................................................................................12036. Subsequent events ...............................................................................................................................................................122
1. General information about the Group
1.1 Description
SAZKA Group a.s. (“the Company”) was established on 2 April 2012 and registered in the Commercial Register maintained by the Municipal Court in Prague, Section B, Insert 18161. The Company’s registered office is at Vinohradská 1511/230, Strašnice, 100 00 Praha 10, and its Identification Number is 242 87 814. The Company‘s purpose is to hold investments in other group entities.
SAZKA Group a.s. (“the Group”) operates lottery, betting and non-lottery business in the Czech Republic, Greece, Cyprus, Austria, Italy, Croatia and other countries and is included into the consolidated Group . The immediate parent of the Group is KKCG AG (for more details see also Note 1.5 below).
Karel Komarek is a beneficial owner (in Czech: skutečný majitel) of SAZKA Group a.s. for the reason indicated in Section 4 Para. 4 of the Czech Act No. 253/2008 Coll., on certain measures against the legalization of proceeds of crime and the financing of terrorism, as amended, so by reason that Mr Karel Komarek is a natural person, who has (pursuant to the aforementioned Act) a actual possibility to perform indirect decisive control over SAZKA Group a.s.
1.2 Principal activity
The principal activity of the Group is the operation of lotteries and other similar games in accordance with applicable legislation, i.e. the operation of instant and numerical lotteries, sports and odds betting and other similar games.
In addition to lottery and betting activities, the Group also operates non-lottery business activities through points of sale and terminals (e.g. telecommunication, payment services etc.). Furthermore, the Group also invests in companies with similar business activities.
1.3 Group companies
Companies included in the consolidated group in 2018 and 2017 and their effective proportions of ownership interest are as follows (divided per main streams of business activities of the Group):
Parent company: Note Country 2018 2017
SAZKA Group a.s. Czech Republic Parent company Parent company
Effective portion of ownership interest at Sazka Group a.s. level
Subsidiaries: Note Country 2018 2017
Austrian Gaming Holding a.s. Czech Republic 100.00% 100.00%
BAIH Beteiligungsverwaltungs GmbH (a) Austria − 100.00%
CAME Holding GmbH Austria 100.00% 100.00%
Emma Delta Finance Plc (b) Cyprus 71.87% 71.87%
Emma Delta Hellenic Holdings Limited (b) Cyprus 71.87% 71.87%
Emma Delta Management Ltd Cyprus 66.70% 66.70%
EMMA DELTA VARIABLE CAPITAL INVESTMENT COMPANY LTD (b) Cyprus 71.87% 71.87%
HELLENIC LOTTERIES S.A. (c) Greece 15.89% 15.89%
HORSE RACES S.A. (c) Greece 23.71% 23.71%
IGH Financing a.s. Czech Republic 100.00% 100.00%
Italian Gaming Holding a.s. Czech Republic 100.00% 100.00%
Kavárna štěstí s.r.o. Czech Republic 100.00% 100.00%
Medial Beteiligungs GmbH Austria 99.66% 29.63%
Minus5 d.o.o. Croatia 51.00% −
Neurosoft S.A. (c) Greece 16.06% 16.06%

51 52CONSOLIDATED ANNUAL REPORT, CONSOLIDATED FINANCIAL STATEMENTS & INDEPENDENT AUDITOR’S REPORT 2018
SAZKA Group a.s. Consolidated financial statements for the year ended 31 December 2018 (in thousands of Euro)
Effective portion of ownership interest at Sazka Group a.s. level
Subsidiaries: Note Country 2018 2017
OPAP CYPRUS LTD (c) Cyprus 23.71% 23.71%
OPAP INTERNATIONAL LTD (c) Cyprus 23.71% 23.71%
OPAP INVESTMENT LTD (c) Cyprus 23.71% 23.71%
OPAP S.A. (c) Greece 23.71% 23.71%
OPAP SERVICES S.A. (c) Greece 23.71% 23.71%
OPAP SPORTS LTD (c) Cyprus 23.71% 23.71%
PUNI BROJ d.o.o. Croatia 67.00% −
RUBIDIUM HOLDINGS LIMITED Cyprus 100.00% 100.00%
SAZKA a.s. Czech Republic 100.00% 100.00%
SAZKA Asia a.s. Czech Republic 100.00% 100.00%
Sazka Asia Vietnam Company Limited Vietnam 100.00% 100.00%
SAZKA Czech a.s. Czech Republic 100.00% 100.00%
Sazka Distribution Vietnam Joint Stock Company Vietnam 100.00% 90.00%
SAZKA FTS a.s. Czech Republic 100.00% 100.00%
SAZKA Group Adriatic d.o.o. Croatia 100.00% −
SAZKA Group Financing a.s. Slovakia 100.00% 100.00%
SAZKA Group Russia LLC Russia 100.00% 100.00%
SPORTLEASE a.s. Czech Republic 100.00% 100.00%
SUPER SPORT d.o.o. Croatia 67.00% −
TORA DIRECT S.A. (c) Greece 23.71% 23.71%
TORA WALLET S.A. (c) Greece 23.71% 23.71%
Vitalpeak Limited Cyprus 100.00% 100.00%
Effective portion of ownership interest at Sazka Group a.s. level
Associates: Note Country 2018 2017
Casinos Austria AG* (d) Austria 38.16% 11.35%
CLS Beteiligungs GmbH* (e) Austria 66.67% 66.67%
LOTTOITALIA S.r.l. Italy 32.50% 32.50%
LTB Beteiligungs GmbH* (f) Austria 66.67% 66.67%
TCB Holdings Ltd* (c) Malta 8.71% −
*The equity method investee comprises a group of entities.
(a) As at 1 January 2018 BAIH Beteiligungsverwaltungs GmbH legally merged with CAME Holding GmbH.
(b) The controlling interest in EMMA DELTA VARIABLE CAPITAL INVESTMENT COMPANY LTD is represented by 100% of voting rights held by parent company. However, the economic interest attributable to the Group is represented by 71.87% of investor shares owned by the company RUBIDIUM HOLDINGS LIMITED.
(c) The Group has de-facto control over the OPAP sub-group. OPAP sub-group includes entities HELLENIC LOTTERIES S.A., HORSE RASES S.A., Neurosoft S.A., OPAP CYPRUS LTD, OPAP INTERNATIONAL LTD, OPAP INVESTMENT LTD, OPAP S.A., OPAP SERVICES S.A., OPAP SPORTS LTD, TORA DIRECT S.A., TORA WALLET S.A. Moreover, OPAP sub-group has acquired interest in TCB Holdings Ltd. in 2018 and this company became an associate (see Note 6, Note 13).
The decision on the Group’s de-facto control over OPAP sub-group represents significant judgement. The Company’s management understands the matter has pervasive effect on the amounts recognized in the financial statements, therefore
devoted adequate care and attention in making this judgement. All available significant facts and circumstances were considered, both supporting and contradicting the final decision.
The matter was formally discussed with the regulator overseeing Czech securities’ market, including financial reporting of the market’s participant (the Czech National Bank). The regulator explicitly concurred with the management’s conclusion.
SAZKA Group holds its interest in OPAP through a 66.7% voting interest in Emma Delta Management Limited ("Emma") which in turn holds an indirect 33% interest in OPAP. The remaining 33.3% voting interest in Emma is held by 3rd party investor. Emma is the manager of, and owner of all voting management shares in, Emma Delta Variable Capital Investment Company Limited which through an intermediate company holds the 33% interest in OPAP.
Under the terms of a shareholders' agreement between the shareholders of Emma, SAZKA Group is entitled to nominate a majority of the directors to the board of Emma, one of whom is to act as chairperson.
Although Emma’s shareholding in OPAP is below 50%, its 33% shareholding is by far the largest individual shareholding in OPAP. The remaining 67% of shares are widely dispersed among numerous public market investors with none holding more than 3% stake. Since Emma acquired stake in OPAP an average shareholders’ attendance on OPAP general meetings was 71% with average Emma’s relative share on present voting rights of 46%, however hundreds of attending shareholders (or more than 35 of all shareholders) would have to get together in order to outvote Emma. All shareholders’ resolutions proposed at general meetings that Emma has voted “in favor of” have been approved.
Apart from the dispersed shareholders’ structure, there are also other barriers, such as regulatory approvals, preventing others from taking over the OPAP’s control.
There are neither potential voting rights nor other contractual arrangements relevant to Emma’s stake in OPAP.
SAZKA Group's appointees making up a majority of the OPAP Board (including in the roles of CEO and Executive Chairman). There are no restrictions of OPAP Board’s authority and power. It can direct OPAP to enter significant transactions (e.g. acquisitions, etc.).
The final conclusion on existence of the Group’s de-facto control over OPAP sub-group stems mainly from the Group’s actual ability to dominate all general meetings held so far, ability to dominate board of directors and ability to direct OPAP’s relevant activities through nomination of key management personnel.
(d) In 2018, the Group increased its interest in Casinos Austria AG via the acquisition of additional shares in Medial Beteiligungs GmbH. After the acquisition, the aggregatee effective interest in Casinos Austria AG sub-group is 38.16% at the Group level.
(e) According to the company´s Articles of Association the company is able to make a decision only with 75% shareholders approval. Therefore the Group considers it as investment in associate and the company is accounted for using the equity method.
Company CLS Beteiligungs GmbH holds share in Lotto-Toto-Holding GmbH, which owns 32% of investors shares in Österreichische Lotterien GmbH (rest is owned by Casinos Austria AG), SAZKA Group a.s. effective share is 11.55% in Österreichische Lotterien GmbH.
(f) According to the company´s Articles of Association the company is able to make a decision only with 100% voting shares. Therefore the Group considers it as investment in associate and the company is accounted for using the equity method.
Company LTB Beteiligungs GmbH holds share in Lotto-Toto-Holding GmbH, which owns 32% of investors shares in Österreichische Lotterien GmbH (the rest is owned by Casinos Austria AG), SAZKA Group a.s. effective share is 11.55% in Österreichische Lotterien GmbH.

53 54CONSOLIDATED ANNUAL REPORT, CONSOLIDATED FINANCIAL STATEMENTS & INDEPENDENT AUDITOR’S REPORT 2018
SAZKA Group a.s. Consolidated financial statements for the year ended 31 December 2018 (in thousands of Euro)
Changes in the Group
In 2018 and 2017 the Group acquired interest in (Note 11), or incorporated, the following companies and groups of companies (the percentage stated below represents the interest acquired in the period):
Company / Group companies 2018 2017 Type of transaction
Date of transaction
EMMA DELTA VARIABLE CAPITAL INVESTMENT COMPANY LTD (a) − 4.82% acquisition 31.5.2017
FSázky a.s. (b) − 100.00% purchase 23.5.2017
PUNI BROJ d.o.o. 100.00% − purchase 26.4.2018
Medial Beteiligungs GmbH (c) 70.03% − purchase 15.1.2018, 5.10.2018
Minus5 d.o.o. 51.00% − purchase 26.4.2018
Neurosoft S.A. − 38.19% purchase 2.8.2017
Sazka Distribution Vietnam Joint Stock Company 10.00% 90.00% purchase 14.3.2018, 28.6.2017
SAZKA Group Adriatic d.o.o. 100.00% − incorporation 30.1.2018
SAZKA Group Financing a.s. − 100.00% incorporation 18.10.2017
SAZKA Group Russia LLC − 100.00% incorporation 29.8.2017
SUPER SPORT d.o.o. 67.00% − purchase 26.4.2018
TCB Holdings Ltd 36.75% − purchase 18.12.2018
The above stated percentages in companies reflect direct share acquired by its parent company.
(a) As at 31 May 2017 the Group acquired an additional 4.82% investors shares in EMMA DELTA VARIABLE CAPITAL INVESTMENT COMPANY LTD. The increase represents an increase in economic share in the company without change of control. This transaction is presented as purchase of non-controlling interest in the consolidated statement of changes in equity for 2017 – effect of change in ownership interests.
(b) FSázky a.s. became part of the consolidated subgroup SAZKA a.s. on 23 May 2017. On 1 December 2017, FSázky legally merged with SAZKA a.s.
(c) The Group held a share of 29.63% (without control) in Medial Beteiligungs GmbH as at 31 December 2017 and therefore the company was accounted for using the equity method. On 15 January 2018 the Group acquired an additional 59.26% share of Medial Beteiligungs-GmbH, obtained control and the company became fully consolidated. On 5 October 2018 the Group acquired an additional 10.77%. This additional purchase was presented as a purchase of non-controlling interest (see Note 6).
There were no disposals of subsidiaries or associates in 2018 and 2017.
1.4 Statutory body and supervisory board
The board of directors as at 31 December 2018:
Chairman of the board of directors: ....................................................Karel Komárek
Member of the board of directors: ......................................................Jiří Šmejc
Member of the board of directors: ......................................................Pavel Šaroch
Member of the board of directors: ......................................................Pavel Horák
Supervisory board as at 31 December 2018:
Chairman of the supervisory board: ....................................................Tomáš Porupka
Member of the supervisory board: ......................................................Jakub Sokol
Member of the supervisory board: ......................................................Radka Blažková
1.5 Shareholders as at 31 December 2018:
KKCG AG ................................................................................................75%
Registered office: Kapellgasse 21, 6004 Luzern, Switzerland
EMMA GAMMA LIMITED .....................................................................25%
Registered office: Esperidon 12, 4th floor, 1087 Nicosia, Cyprus
2. Basis of preparation
(a) Statement of compliance
The consolidated financial statements have been prepared in compliance with International Financial Reporting Standards as adopted by the European Union („IFRS“).
The accounting policies described in Note 3 were used in preparing the consolidated financial statements for the year ended 31 December 2018 and in preparing the comparative information as at 31 December 2017.
These consolidated financial statements were approved by the board of directors on 30 April 2019.
(b) Basis of measurement
The consolidated financial statements have been prepared on a going concern basis, using the historical cost method, unless otherwise stated in the accounting policies.
The Group is consistent in applying the accounting policies described below.
(c) Functional and presentation currency
Items included in the financial statements of each of the group’s entities are measured using the currency of the primary economic environment in which the entity operates (‘functional currency’). The functional currency of the SAZKA Group a.s. is the Czech Crown (CZK). Presentation currency of the Group is Euro (EUR) as the majority of Group’s transactions representing its assets, liabilities and related profit & loss accounts are in EUR.
These IFRS consolidated financial statements are presented in Euro (EUR) for the Group reporting purposes. All financial information is rounded to the nearest thousand, unless stated otherwise.
Any differences between the amounts included in the financial statements and the respective amounts included in the notes are attributed to rounding.
(d) Use of estimates and judgements
When preparing the financial statements, the Company’s management makes estimates, judgements and assumptions that affect the application of accounting policies and the reported amounts of assets, liabilities, revenues and expenses. These estimates, judgements and assumptions are based on past experience and other various factors deemed appropriate as at the date of preparation of financial statements and are used where the carrying amounts of assets and liabilities are not readily available from other sources or where uncertainty exists in applying the individual accounting policies. Impacts of changes in estimates are described in individual notes.
The estimates and underlying assumptions are reviewed on an ongoing basis. Revisions to accounting estimates are recognised in the period in which the estimate is revised, if the revision affects only that period, or in the period of the revision and future period if the revision affects both current and future periods.
The use of estimates affects mainly the following areas:
• Goodwill, trademarks and brands with indefinite useful lives impairments – with sufficient headroom in impairment calculation, no material differences are expected within following 12 months with exception of NEUROSOFT S.A. – Note 4; accounting policy 3c);

55 56CONSOLIDATED ANNUAL REPORT, CONSOLIDATED FINANCIAL STATEMENTS & INDEPENDENT AUDITOR’S REPORT 2018
SAZKA Group a.s. Consolidated financial statements for the year ended 31 December 2018 (in thousands of Euro)
• Provision for litigations – Note 15;
• Jugment with respect of de-facto control over OPAP – Note 1.3.
(e) Measurement of fair values
A number of the Group´s accounting policies and disclosures require the measurement of fair values, for both financial and non-financial assets and liabilities.
Fair value is defined as the price that would be received to sell an asset or paid to transfer a liability in an orderly transaction between market participants at the measurement date under current market conditions regardless of whether that price is directly observable or estimated using another valuation technique. Fair values are obtained, as appropriate, from quoted market prices, discounted cash flow projections and other valuation models.
When measuring the fair value of an asset or a liability, the Group uses market observable data as far as possible. Fair values are categorised into different levels in a fair value hierarchy based on the inputs used in the valuation techniques as follows:
• Level 1: quoted prices (unadjusted) in active markets for identical assets and liabilities.
• Level 2: inputs other than quoted prices included in Level 1 that are observable for the asset or liability, either directly (i.e. as prices) or indirectly (i.e. derived from prices).
• Level 3: inputs for the asset or liability that are not based on observable market data (unobservable inputs).
The Group recognises transfers between levels of the fair value hierarchy at the end of the reporting period during which the change has occurred.
(f) New standards and amendments applicable from 1 January 2018
The Group applied for the first time certain standards and amendments to the standards, which are effective for annual periods beginning on or after 1 January 2018.
Improvements to International Accounting Standards (Cycle 2014−2016)
This improvement is effective for annual periods beginning on or after 1 January 2018.
As part of the annual improvements project, the International Accounting Standards Board issued non-urgent but necessary amendments to IFRS 1 and IAS 28. The adoption of these improvements had no impact on the financial statements of the Group.
Amendment to IFRS 2 “Share-based Payment”: Classification and Measurement of Share-based Payment Transactions
Effective for annual periods beginning on or after 1 January 2018. On 20.6.2016 the International Accounting Standards Board issued an amendment to IFRS 2 with which the following were clarified:
• in estimating the fair value of a cash-settled share-based payment, the accounting for the effects of vesting and non-vesting conditions shall follow the same approach as for equity-settled share-based payments,
• where tax law requires an entity to withhold a specified amount of tax (that constitutes a tax obligation of the employee) that relates to share-based payments and shall be remitted to the tax authority, such an arrangement shall be classified as equity-settled in its entirety, provided that the share-based payment would have been classified as equity-settled had it not included the net settlement feature,
• if the terms and conditions of a cash-settled share-based payment transaction are modified with the result that it becomes an equity-settled share-based payment transaction, the transaction is accounted for as such from the date of the modification.
The adoption of this amendment had no impact on the financial statements of the Group.
International Accounting Standard 40 “Investment Property”: Transfers of Investment Property
Effective for annual periods beginning on or after 1 January 2018.
The International Accounting Standards Board issued an amendment to IAS 40 with which it clarified that an entity shall reclassify a property to, or from, investment property when, and only when, there is a change in use. A change in use occurs when the property meets, or ceases to meet, the definition of investment property and there is evidence of the change in use.
A change in management’s intentions for the use of a property does not provide evidence of a change in use. In addition, the examples of evidence of a change in use were expanded to include assets under construction and not only transfers of completed properties.
The adoption of this standard had no impact on the financial statements of the Group.
IFRIC Interpretation 22 “Foreign Currency Transactions and Advance Consideration”
Effective for annual periods beginning on or after 1 January 2018.
The Interpretation covers foreign currency transactions when an entity recognizes a non-monetary asset or liability arising from the payment or receipt of advance consideration before the entity recognizes the related asset, expense or income. The Interpretation clarified that the date of the transaction, for the purpose of determination of exchange rate to use on initial recognition of the asset, the income or expense, is the date of initial recognition of the non-monetary asset or liability (i.e. advance consideration). Additionally, if there are multiple payments or receipts in advance, the entity shall determine a date of the transaction for each payment or receipt of advance consideration.
The adoption of this interpretation had no impact on the financial statements of the Group.
(g) Standards, interpretations and amendments issued but not yet effective
The following new standards and amendments were not effective for the period ended 31 December 2018 and were not adopted by the Group when preparing these consolidated financial statements.
Other standards, interpretations and amendments to issued standards adopted before 31 December 2018 but not yet effective that are not described below are deemed by the Group as irrelevant.
IFRS 16 Leases
IFRS 16 was endorsed by EU on 31 October 2017 and is effective for annual periods beginning on or after 1 January 2019 with early adoption permitted.
IFRS 16 supersedes IAS 17 Leases and related interpretations. The Standard eliminates the current dual accounting model for lessees and instead requires companies to bring most leases on-balance sheet under a single model, eliminating the distinction between operating and finance leases.
Under IFRS 16, a contract is, or contains, a lease if it conveys the right to control the use of an identified asset for a period of time in exchange for consideration. For such contracts, the new model requires a lessee to recognise a right-of-use asset and a lease liability. The right-of-use asset is depreciated and the liability accrues interest. This will result in a front-loaded pattern of expense for most leases, even when the lessee pays constant annual rentals.
The new Standard introduces a number of limited scope exceptions for lessees which include:
• leases with a lease term of 12 months or less and containing no purchase options, and
• leases where the underlying asset has a low value (‘small-ticket’ leases) up to approximately EUR 4,500 thousand.
Lessor accounting, however, shall remain largely unchanged and the distinction between operating and finance leases will be retained.
The Group will aim for modified retrospective transition option applying the practical expedient of:
• application of a single discount rate to a portfolio of leases with reasonably similar characteristics.
The Group leases the following material types of underlying assets resulting from contractual arrangements that would be in the scope of the new standard (treated as operating lease) as at 31 December 2018:
• Premises
• Cars
• IT equipment
The lease liability which will be recognized by the Group at the date of the initial application will be measured at the present value of the remaining lease payments including those to be made over reasonably certain lease extension periods (when extension options exist) or excluding those in periods covered by lease termination options that are reasonably certain to be exercised (in case termination rights exist) discounted using the Group’s incremental borrowing rate.
At the date of the initial application the Group will also recognize a right of use asset in amount equal to the lease liability and adjusted by the amount of any prepaid or accrued lease payments relating to that lease recognized in the statement of financial position immediately before the date of initial application.
The Group does expect that the new Standard, when initially applied, will have a significant impact on the financial statements. The standard will require the Group to recognise in its statement of financial position assets and liabilities relating to operating leases for which the Group acts as a lessee.
As a result, in the Statement of Financial Position, a significant increase in total assets and liabilities is anticipated on first-time adoption due to the capitalization of right-of-use assets and the recognition of lease liabilities. The nature of expenses related to those leases will also change since IFRS 16 replaces the operating lease expense with a depreciation charge for the right-of-use assets and interest expense on lease liabilities. This will give rise to a significant improvement in EBITDA. Based on
57 58CONSOLIDATED ANNUAL REPORT, CONSOLIDATED FINANCIAL STATEMENTS & INDEPENDENT AUDITOR’S REPORT 2018
SAZKA Group a.s. Consolidated financial statements for the year ended 31 December 2018 (in thousands of Euro)
the analysis performed, the Group would have recognized right-of-use assets of approximately EUR 99,170 thousand and a respective increase of lease liabilities in 2018 consolidated statement of financial position.
The Group’s activities as a lessor are not material and hence the Group does not expect any significant impact on the financial statements.
The following amended standards and interpretations are not expected to have a significant impact on the Group’s consolidated financial statements.
Amendments to IFRS 10 and IAS 28: Sale or Contribution of Assets between an Investor and its Associate or Joint Venture
EU endorsement currently halted. In December 2018 IASB decided to defer the application date of this amendment until such time as the IASB has finalised its research project on the equity method.
The amendments IFRS 10 Consolidated Financial Statements and IAS 28 Investments in Associates and Joint Ventures (2011) clarify the treatment of the sale or contribution of assets from an investor to its associate or joint venture, as follows:
• require full recognition in the investor's financial statements of gains and losses arising on the sale or contribution of assets that constitute a business (as defined in IFRS 3 Business Combinations),
• require the partial recognition of gains and losses where the assets do not constitute a business, i.e. a gain or loss is recognised only to the extent of the unrelated investors’ interests in that associate or joint venture.
These requirements apply regardless of the legal form of the transaction, e.g. whether the sale or contribution of assets occurs by an investor transferring shares in an subsidiary that holds the assets (resulting in loss of control of the subsidiary), or by the direct sale of the assets themselves.
IFRS 9 (Amendments) “Prepayment Features with Negative Compensation”
Effective for annual periods beginning on or after 1 January 2019.
These amendments allow companies to measure particular prepayable financial assets with so-called negative compensation at amortized cost or at fair value through other comprehensive income if a specified condition is met, instead of at fair value through profit or loss.
The amendments are not expected to have an impact on the financial statements of the Group.
IFRIC 23 Uncertainty over Income Tax Treatments (issued by IASB on 7 June 2017)
The interpretation explains how to recognize and measure deferred and current income tax assets and liabilities where there is uncertainty over a tax treatment. IFRIC 23 shall be applied when determining taxable income (tax losses), taxable bases, unutilised tax losses, unutilised tax offsets and tax rates where uncertainty over the accounting for income tax exists.
Effective for annual periods beginning on or after 1 January 2019.
IAS 28 (Amendments) “Long term interests in associates and joint ventures”
Effective for annual periods beginning on or after 1 January 2019.
The amendments clarify that reporting entities should apply IFRS 9 to long-term loans, preference shares and similar instruments that form part of a net investment in an equity method investee before they can reduce such carrying value by a share of loss of the investee that exceeds the amount of investor's interest in ordinary shares.
The amendments are not expected to have an impact on the financial statements of the Group.
IAS 19 (Amendments) “Plan amendment, curtailment or settlement”
Effective for annual periods beginning on or after 1 January 2019.
These amendments clarify the accounting for defined benefit plan amendments, curtailments and settlements.
The amendments are not expected to have an impact on the financial statements of the Group.
Annual Improvements to IFRSs 2015 (2015 – 2017 Cycle)
Effective for annual periods beginning on or after 1 January 2019.
The improvements set out below describe the key changes in the following IFRSs:
• IFRS 3 “Business combinations” The amendments clarify that a company remeasures its previously held interest in a joint operation when it obtains control
of the business.
• IFRS 11 “Joint arrangements” IFRS 11 now explicitly explains that the investor should not remeasure its previously held interest when it obtains joint
control of a joint operation, similarly to the existing requirements when an associate becomes a joint venture and vice versa.
• IAS 12 “Income taxes” The amendments clarify that a company accounts for all income tax consequences of dividend payments in the same way.
• IAS 23 “Borrowing costs” The amendments clarify that a company treats as part of general borrowings any borrowing originally made to develop
an asset when the asset is ready for its intended use or sale.
The improvements are not expected to have an impact on the financial statements of the Group.
The following standards, amendments and interpretations have not yet been endorsed by the EU and are not expected to have a significant impact on the Group’s consolidated financial statements.
IASB effective date 1 January 2020:
• Amendment to IFRS 3: Definition of a business
• Amendments to IAS 1 and IAS 8: Definition of a material
• Amendments to the Conceptual Framework for Financial Reporting (Amendments to IFRS 3, IFRS 11, IAS 12 and IAS 23)
• IFRS 17 Insurance contracts
(h) Changes in accounting policies
The Group used possibility for early adoption of IFRS 9 and IFRS 15 in 2017. There were no significant changes in accounting policies in 2018 and the Group has consistently applied the accounting policies to all periods presented in these consolidated financial statements.
(i) Restatement of comparative financial information
On 2 August 2017 the Group, through its subsidiary OPAP INVESTMENT LTD, acquired 38.19% of NEUROSOFT S.A. at a purchase price of EUR 34,197 thousand and increased its participation from 29.53% to 67.72%.
Acquisition accounting was finalized during 2018, leading to an adjustment (increase) at the fair value of the Company’s net identifiable assets by EUR 4,283 thousand. The amount mostly represents previously unrecognized intangible asset (customer relationships) that met the identification and recognition criteria in the amount of EUR 6,033 thousand and respectiverelated decrease of deferred tax asset of amount EUR 1,750 thousand.
Based on the aforementioned adjustments, the goodwill resulting from the acquisition of NEUROSOFT S.A. was decreased by EUR 2,901 thousand from the initial provisional recognition and is calculated as follows:
Fair value of identifiable assets, liabilities and contingent liabilities (67.72%) 8,513
Fair value of previously held equity interest (29.53%) 11,908
Consideration transferred 34,197
Goodwill 37,592

59 60CONSOLIDATED ANNUAL REPORT, CONSOLIDATED FINANCIAL STATEMENTS & INDEPENDENT AUDITOR’S REPORT 2018
SAZKA Group a.s. Consolidated financial statements for the year ended 31 December 2018 (in thousands of Euro)
As allowed by IFRS 3, the acquisition accounting of NEUROSOFT S.A. was finalized in 2018. As a result, the Group retrospectively adjusted the amounts recognized at the acquisition date in order to reflect new information obtained about facts and circumstances that existed at the acquisition date and affected the measurement of the amounts recognized in 2017 consolidated financial statements. The adjustments of the 2017 consolidated financial statements are presented in following table:
Restated Previously published
Difference
ASSETS
Intangible assets 1,980,572 1,974,662 5,910
Goodwill 620,195 623,096 −2,901
Net effect of deferred tax 3,716 5,430 −1,714
Total Assets 3,908,467 3,907,172 1,295
EQUITY & LIABILITIES
Retained earnings 250,004 250,063 −59
Non−controlling interests 929,072 927,718 1,354
Total equity 1,652,134 1,650,839 1,295
Total liabilities 2,256,333 2,256,333 −
Total Equity & liabilities 3,908,467 3,907,172 1,295
Depreciation, amortization and impairment −95,300 −95,177 −123
Results from operating activities 331,866 331,989 −123
Profit before tax 258,987 259,110 −123
Income tax expense −69,525 −69,561 36
Profit for the period 189,462 189,549 −87
Total comprehensive income net of tax 201,149 201,236 −87
3. Significant accounting policies
The accounting policies set out below have been applied consistently to the accounting periods presented in these financial statements, unless otherwise indicated.
(a) Basis of consolidation
i. Business combinations
Business combinations are accounted for using the acquisition method as at the acquisition date – i.e. when control (see ii) below) is transferred to the Group. Critical assumptions and judgements with respect to new acquisitions are described in Note 11.
Goodwill represents amounts arising on the acquisition of subsidiaries and is measured as the fair value of the consideration transferred including the recognised amount of any non-controlling interest in the acquiree, less the net recognised amount (generally fair value) of the identifiable assets acquired and liabilities assumed, all measured as of the acquisition date. Goodwill is stated at cost less accumulated impairment losses (see accounting policy 3i) and Note 4).
When the excess is negative, a bargain purchase gain is recognised immediately in profit or loss.
Transaction costs are expensed as incurred, except if related to the issue of debt or equity securities (see accounting policy 3e,f,g).
Any contingent consideration is measured at fair value at the date of acquisition and it is remeasured at fair value at each reporting date. Subsequent changes in the fair value of the contingent consideration are recognised in profit or loss.
ii. Subsidiaries
Subsidiaries are entities controlled by the Group. Control exists when the Group is exposed, or has rights, to variable returns from its involvement with the entity and has ability to affect those returns through its power over the entity. In assessing control, only substantive rights and rights that are not protective are taken into account. The Group may have power over an investee even when it holds less than majority of voting power in an investee. In such a case, the Group assesses the size of its voting rights relative to the size and dispersion of holdings of the other vote holders to determine if it has de-facto power over the investee. Protective rights of other investors, such as those that relate to fundamental changes of investee’s activities or apply only in exceptional circumstances, do not prevent the Group from controlling an investee. The financial information of subsidiaries is included in the consolidated financial statements from the date that control commences until the date that control ceases.
iii. Non-controlling interests (Note 13)
The Group evaluates NCI transaction by transaction at the acquisition date. For the acquisitions occurred during the current financial year the Group measures non-controlling interest at the acquisition date at proportionate share of the acquiree´s identifiable net assets or at fair value at the date of acquisition. The choice is made separately for each acquisition.
Changes of the Group´s interest in a subsidiary that do not result in a loss of control are accounted for as equity transactions.
iii. Loss of control
When the Group loses control over the subsidiary, it derecognises the assets and liabilities of the subsidiary, and any related non-controlling interests and other components of equity. Any resulting gain or loss is recognised in profit or loss. Any interest retained in the former subsidiary is measured at fair value when control is lost.
iv. Associates and joint ventures (equity method investees) (Note 6)
Associates are those entities in which the Group has significant influence, but not control, over the financial and operating policies. Significant influence is presumed to exist when the Group holds between 20 and 50 percent of the voting power of another entity. Joint ventures are those entities over whose activities the Group has joint control. Associates and joint ventures are accounted for using the equity method (equity method investees) and are initially recognised at cost. The Group’s investment includes goodwill identified on acquisition less impairment losses. The consolidated financial statements include the Group’s share of profit and other comprehensive income of equity method investees from the date that significant influence or joint control commences until the date that significant influence or joint control ceases. When the Group’s share of losses exceeds its interest in equity method investee, the carrying amount of that interest (including any long-term loans that form part of the net investment) is reduced to nil and the recognition of further losses is discontinued except to the extent that the Group has an obligation to make payments on behalf of the investee.

61 62CONSOLIDATED ANNUAL REPORT, CONSOLIDATED FINANCIAL STATEMENTS & INDEPENDENT AUDITOR’S REPORT 2018
SAZKA Group a.s. Consolidated financial statements for the year ended 31 December 2018 (in thousands of Euro)
v. Acquisitions from entities under common control
Acquisitions from entities under common control are business combinations arising from transfers of interests in entities that are under the control of the shareholder that controls the Group.
Purchases of subsidiaries from parties under common control are accounted for using the predecessor values method. Under this method the consolidated financial statements of the combined entity are presented as if the businesses had been combined from the beginning of the earliest period presented or, if later, the date when the combining entities were first brought under common control. The assets and liabilities of the subsidiary transferred under common control are at the predecessor entity’s carrying amounts.
The predecessor entity is considered to be the highest reporting entity in which the subsidiary’s IFRS financial information was consolidated. Related goodwill inherent in the predecessor entity’s original acquisitions is also recorded in these consolidated financial statements. Any difference between the carrying amount of net assets, including the predecessor entity's goodwill, and the consideration for the acquisition is accounted for in these consolidated financial statements as an adjustment to other funds within equity.
vi. Transactions eliminated on consolidation
Intra-group balances and any unrealised income and expenses arising from intra-group transactions are eliminated in preparing the consolidated financial statements. Unrealised gains arising from transactions with equity method investees are eliminated against the investment to the extent of the Group’s interest in the investee. Unrealised losses are eliminated in the same way as unrealised gains, but only to the extent that there is no evidence of impairment.
(b) Foreign currencies
i. Foreign currency transactions
Transactions in foreign currencies are translated to the respective functional currencies of Group entities at exchange rates at the dates of the transactions. Monetary assets and liabilities denominated in foreign currencies at the end of the reporting period are translated to the functional currency at the exchange rate at that date. Non-monetary assets and liabilities denominated in foreign currencies that are measured at fair value are translated to the functional currency at the exchange rate at the date that the fair value was determined. Foreign currency differences arising on translation are recognised in profit or loss, except for differences arising on the translation of a financial liability designated as a hedge of the net investment in a foreign operation, or qualifying cash-flow hedges, which are recognised in other comprehensive income.
ii. Foreign operations
The assets and liabilities of foreign operations, including goodwill and fair value adjustments arising on acquisition, are translated to the presentation currency of the Group, the Euro, at the closing spot exchange rates at the end of the respective reporting period. The income and expenses of foreign operations are translated to Euro at average exchange rates for the period which are reasonable approximation of the exchange rate at the transaction dates. Foreign currency differences are recognised in other comprehensive income and accumulated in equity as a separate component.
(c) Intangible assets
i. Goodwill
Goodwill is measured as described in Note 4. Goodwill is not amortised but it is tested for impairment annually, or more frequently if events or changes in circumstances indicate that it might be impaired, and is carried at cost less accumulated impairment losses. Gains and losses on the disposal of an entity include the carrying amount of goodwill relating to the entity sold.
The Group use partial goodwill method.
For more information refer to the section 3i.
ii. Licenses (Note 4)
Licenses relate to lottery and betting business. They are carried at acquisition cost less accumulated amortization and impairment losses.
iii. Customer contracts and trademarks and brands (Note 4)
The Group capitalises major customer contracts and trademarks upon the acquisition of the company that concluded the contracts with the customers - unrelated parties - or the company that owns the trademark. The value of these intangible assets was determined based on an expert’s appraisal prepared at the time of the acquisition.
Contracts and trademarks are assets which can be used in the future. Capitalised contracts are amortized on a straight-line basis against revenues arising from such contracts. Capitalised trademarks are stated at acquisition cost and are tested for impairment every year.
Brands are determined as intangible asset with indefinite useful life based on the market strength of the brands and significant contribution to the business. The Group performs impairment testing of the brands annually in line with the Group’s policy (see Note 4).
iv. Software and Other intangible assets (Note 4)
Other intangible assets acquired by the Group, which have finite useful lives, are measured at acquisition cost less accumulated amortisation and impairment losses.
v. Amortisation (Note 27)
Intangible assets, except goodwill and other intangibles with indefinite useful lives, are amortised on a straight-line basis over their estimated useful life from the date they are available for use.
The following table shows the expected useful life of individual classes of intangible assets:
• Software ...........................................................................................................5 –7 years
• Property rights - other .......................................................................................... 6 years
• Appreciable right, licenses ...............................................................................3 –7 years or based on their contractual term
• Distribution network (contracts with providers) ................................................. 20 years
• Other intangible assets ..................................................................................5 –10 years
vi. Subsequent expenditure
Subsequent expenditure is capitalised only when it increases the future economic benefits embodied in the specific asset to which it relates. All other expenditure, such as maintenance costs, is recognised in the statement of comprehensive income as an expense.
(d) Property, plant and equipment
i. Assets owned by the Group (Note 5)
Property, plant and equipment consist of buildings, halls and structures, land, equipment, motor vehicles and other tangible fixed assets. They are stated at cost less accumulated depreciation (see below) and impairment losses (see accounting policy 3i).
The cost of self-manufactured tangible fixed assets includes the cost of materials, wages and a proportion of overheads directly attributable to the construction. Acquisition cost also includes the estimated cost of dismantling and removing the tangible assets as well as the cost of land restoration.
Borrowing costs directly attributable to the acquisition of assets are capitalized until the asset substantially complete or available for use.
Acquisition cost does not include administrative or other general overheads, or initial operating losses.
When parts of an item of property, plant and equipment have different useful lives, they are accounted for as separate items (major components) of property, plant and equipment.
ii. Investment property
Investment property is property held either to earn rental income or for capital appreciation or for both. Investment property is carried at cost less accumulated depreciation and impairment losses.
When the use of a property changes from the owner-occupied to investment property, the property is reclassified from property, plant and equipment to investment property.
63 64CONSOLIDATED ANNUAL REPORT, CONSOLIDATED FINANCIAL STATEMENTS & INDEPENDENT AUDITOR’S REPORT 2018
SAZKA Group a.s. Consolidated financial statements for the year ended 31 December 2018 (in thousands of Euro)
iii. Finance leases
Leases, that transferred substantially all the risks and rewards of ownership are assumed byto the Group, are classified as finance leases. Upon initial recognition the leased assets are recognised at the lower of their fair value and the present value of the minimum lease payments. Subsequently, the leased asssets are carried at the initially recognised amount less accumulated depreciation and impairment losses. Finance lease liabilities measurement is described in Note 3h.
iv. Assets held for sale
Assets that are very likely to be sold within one year from the reporting period are not included in fixed assets and are stated in current assets at the lower of their carrying amount and fair value less costs to sell. Such assets are not depreciated.
v. Depreciation (Note 27)
Tangible fixed assets are depreciated on a straight-line basis. Leased assets are depreciated over the shorter of the lease term and their useful lives unless it is reasonably certain that the Group will obtain ownership by the end of the lease term. Land is not depreciated.
The following table shows the expected useful life of individual groups of fixed assets:
• Appliances and special technical equipment .................................................4 –14 years
• Fixtures and fittings ........................................................................................4 –14 years
• Power and propulsion machinery and equipment .........................................5 –20 years
• Vehicles................................................................................................................. 6 years
• Other constructions............................................................................................ 50 years
• Work machinery and equipment ....................................................................4 –14 years
• Buildings and halls ........................................................................................20 –60 years
• Utility networks ............................................................................................30 –60 years
• Construction improvements to outdoor surfaces ........................................15 –30 years
vi. Subsequent expenditure
Expenditure incurred to replace part of an item of property, plant and equipment is capitalised only if it results in an increase in the future economic benefits generated by the relevant tangible fixed asset. Major overhauls are capitalised as a separate item into the corresponding class of fixed assets at the moment the overhaul is executed. All other expenditure is recognised in the statement of comprehensive income as an expense.
(e) Financial assets at fair value through profit or loss
An instrument is classified as at fair value through profit or loss if it is held for trading or for which the entity’s business model is to manage the financial asset on a fair value basis i.e. to realize the asset through sales as opposed to holding the asset to collect contractual cash flows. This category represents the “default” or “residual” category if the requirements to be classified as amortised cost or fair value through other comprehensive income (“FVOCI”) are not met. Upon initial recognition, attributable transaction costs are recognised in profit or loss when incurred. Financial instruments at fair value through profit or loss are measured at fair value, and changes therein are recognised in profit or loss in net finance income or costs.
(f) Financial assets at fair value through other comprehensive income
Fair value through other comprehensive income is the classification for debt instruments for which an entity has a mixed business model, i.e. the business model is achieved by both holding the financial asset to collect the contractual cash flows and through the sale of the financial assets. The characteristics of the contractual cash flows of instruments in this category must be solely payments of principal and interest.
The changes in fair value of FVOCI debt instruments are recognised in other comprehensive income. Any interest income, foreign exchange gains/losses and impairments are recognised immediately in profit or loss. Fair value changes that have been recognised in OCI are recycled to profit or loss upon disposal of the debt instrument.
On initial recognition, an entity may make an irrevocable election (on an instrument-by-instrument basis) to designate an equity instrument at FVOCI. This option only applies to instruments that are not held for trading and are not derivatives.
Gains or losses recognised in OCI for equity instruments are never reclassified from equity to profit or loss.
(g) Financial derivatives and hedging instruments
The Group uses derivative financial instruments to hedge its exposure to foreign exchange and interest rate risks arising from its operational, financing and investment activities. Derivatives that do not qualify for hedge accounting are accounted for as trading instruments.
The financial effects of derivatives are measured at fair value and stated in separate positions of receivables and payables classified as long-term or short-term ones.
The fair value of interest rate swaps is determined as the present value of the estimated future cash flows based on observable yield curves. The fair value of currency forwards is determined based on the market price as at the date of financial statements and corresponds to the present value of the quoted forward rate.
If a financial derivative hedges the cash flows relating to a reported liability or highly probable transaction, then the portion of the gain or loss that is determined to be an effective hedge is recognised directly in other comprehensive income and accumulated in a separate reserve in equity. If a non-financial item is eventually recognised as a consequence of a hedge of a firm commitment or highly probable purchase transaction, then the cumulative gain or loss is removed from equity and included in the acquisition cost of such asset or liability. Otherwise, the cumulative gain or loss is reclassified from other comprehensive income and reported in the profit or loss together with the hedged transaction.
If the hedging instrument expires or the hedging relationship terminates, while it is still probable that the hedged transaction will occur, then the cumulated gain or loss remains in equity and is recorded as described above at the point when the transaction occurs. If the hedged transaction is no longer expected to occur, then the cumulative unrealised gain or loss recorded in equity shall be immediately charged to the profit or loss.
If a financial derivative hedges the exchange rate risk of recognised monetary assets or liabilities, hedge accounting is not applied and the gain or loss on the hedging instrument is reported in the profit or loss for the period.
If cash flows relating to recognised foreign currency receivables are hedged by other hedging instruments (e.g. designating foreign currency payables as the hedging instruments), the accounting treatment is the same as the treatment for financial derivatives hedging.
The Group decided to apply hedge accounting to report effects of interest rate risk hedging and, consequently, prepared a document describing the hedge relationship between the hedged item and the hedging derivative.
This document contains information about the following:
• hedged items;
• hedging derivatives;
• risks that are being hedged;
• calculation of hedge effectiveness.

65 66CONSOLIDATED ANNUAL REPORT, CONSOLIDATED FINANCIAL STATEMENTS & INDEPENDENT AUDITOR’S REPORT 2018
SAZKA Group a.s. Consolidated financial statements for the year ended 31 December 2018 (in thousands of Euro)
The Group applies hedge accounting if:
• the hedge is in line with the Group’s risk management strategy,
• the hedge relationship is formally documented at the inception of the hedge,
• the hedge relationship is expected to be effective throughout its duration,
• the effectiveness of the hedge relationship can be objectively measured,
• the hedge relationship is effective throughout the accounting period, i.e. changes in the fair value or cash flows of the hedging instruments attributable to the hedged risk are within a range of 80–125% of the changes in the fair value or cash flows of the hedged instruments attributable to the hedged risk, and
• for cash flow hedges, a forecast transaction is highly probable and presents an exposure to variations in cash flows that could affect profit or loss.
Financial derivatives
Gaming contracts: Gaming contracts are considered to be financial derivatives under IFRS 9 if in the transaction, the gaming institution takes a position against its customers. The value of the individual contract is contingent on the outcome of a specified event and the gaming institution is not, therefore, normally guaranteed a specific commission or return. The contracts are financial derivatives and not insurance contracts, even though the underlying variable is specific to a party to the contract. Definition of insurance requires exposure to a pre-existing risk that was present before the contract is concluded, which is not met in the case of gaming bets.
Embedded derivatives in a hybrid contract with a host that is a financial asset are not separated from the host contract. Instead, the hybrid financial instrument as a whole is assessed for classification. The financial asset is carried at fair value through profit or loss if the instrument’s cash flows are not solely payments of principal and interest. Changes in the fair value of such hybrid financial asset are recognised in profit or loss when they occur.
(h) Other non-derivative financial assets (Note 8) and liabilities (Note 16)
i. Key measurement terms
Amortised cost (“AC”) is the amount at which the financial instrument was recognised at initial recognition less any principal repayments, plus accrued interest, and for financial assets less any allowance for expected credit losses (“ECL”). Accrued interest includes amortisation of transaction costs deferred at initial recognition and of any premium or discount to the maturity amount using the effective interest method. Accrued interest income and accrued interest expense, including both accrued coupon and amortised discount or premium (including fees deferred at origination, if any), are not presented separately and are included in the carrying values of the related items in the consolidated statement of financial position.
The effective interest method is a method of allocating interest income or interest expense over the relevant period, so as to achieve a constant periodic rate of interest (effective interest rate) on the carrying amount. The effective interest rate is the rate that exactly discounts estimated future cash payments or receipts (excluding future credit losses) through the expected life of the financial instrument or a shorter period, if appropriate, to the gross carrying amount of the financial instrument. The effective interest rate discounts cash flows of variable interest instruments to the next interest repricing date, except for the premium or discount which reflects the credit spread over the floating rate specified in the instrument, or other variables that are not reset to market rates. Such premiums or discounts are amortised over the whole expected life of the instrument. The present value calculation includes all fees paid or received between parties to the contract that are an integral part of the effective interest rate. For assets that are purchased or originated credit impaired (“POCI”) at initial recognition, the effective interest rate is adjusted for credit risk, i.e. it is calculated based on the expected cash flows on initial recognition instead of contractual payments.
ii. Other non-derivative financial assets
The Group has additionaly the following non-derivative financial assets: trade receivables, other receivables and loans provided.
a. Classification
Trade and other receivables are initially recognized on the date when they are originated and measured at fair value plus any directly attributable transaction costs. Subsequent to initial recognition, they are measured at amortised cost, less any impairment losses, if they are held to collect the cash flows and not expected to be sold.
b. Derecognition
The Group derecognises trade receivables, other receivables and loans provided when the contractual rights to the cash flows from the asset expire, or when it transfers the rights to receive the contractual cash flows in a transaction in which substantially all the risks and rewards of ownership of the financial asset are transferred. Any interest in transferred financial assets that is created or retained by the Group is recognised as a separate asset or liability.
c. Offsetting of financial assets and liabilities
Financial assets and liabilities are offset and the net amount presented in the consolidated statement of financial position when the Group has a legal right to offset the amounts and intends to settle the transaction on a net basis or realise the asset and the liability simultaneously.
iii. Non-derivative financial liabilities
The Group has the following non-derivative financial liabilities: trade and other payables, interest-bearing loans and borrowings, and finance lease liabilities. Financial liabilities, other than financial liabilities at fair value through profit or loss, are classified as subsequently measured at amortised cost using the effective interest method.
The Group classifies as current any part of non-current loans and borrowings that is due within one year after the end of the reporting period.
The Group derecognises a financial liability when its contractual obligations are discharged or cancelled or expire.
(i) Impairment and expected credit loss model
i. Non-financial assets and investments in subsidiaries, joint-ventures and associates
The carrying amounts of the Group’s non-financial assets, other than deferred tax assets, joint-ventures and associates are reviewed at each reporting date to determine whether there is any indication of impairment. If any such indication exists, then the asset’s recoverable amount is estimated. For goodwill, and intangible assets that have indefinite useful lives or that are not yet available for use, the recoverable amount is estimated at least annually at the same time.
The recoverable amount of an asset or cash-generating unit is the higher of its value in use and its fair value less costs to sell. In assessing value in use, the estimated future cash flows are discounted to their present value using a pre-tax discount rate that reflects current market assessments of the time value of money and the risks specific to the asset.
For the purpose of impairment testing, assets that cannot be tested individually are grouped together into the smallest identifiable group of assets that generate cash inflows from continuing use that are largely independent of the cash inflows of other assets or groups of assets (the “cash-generating unit” or CGU”). For the purposes of goodwill impairment testing, CGUs to which goodwill has been allocated are aggregated so that the level at which impairment testing is performed reflects the lowest level at which goodwill is monitored for internal reporting purposes, but is not larger than operating segment. Goodwill acquired in a business combination is allocated to groups of CGUs that are expected to benefit from the synergies of the business combination.
An impairment loss is recognised if the carrying amount of an asset or its CGU exceeds its recoverable amount. Impairment losses are recognised in profit or loss.
Impairment losses recognised in respect of CGUs are allocated first to reduce the carrying amount of any goodwill allocated to the CGU (group of CGUs), and then to reduce the carrying amounts of the other assets in the CGU (group of CGUs) on a pro rata basis.
An impairment loss in respect of goodwill is subsequently not reversed. In respect of other assets, impairment losses recognised in prior periods are assessed at each reporting date for any indications that the loss has decreased or no longer exists. an impairment loss is reversed if there has been a change in the estimates used to determine the recoverable amount. an impairment loss is reversed only to the extent that the asset’s carrying amount does not exceed the carrying amount that would have been determined, net of depreciation or amortisation, if no impairment loss had been recognised.
67 68CONSOLIDATED ANNUAL REPORT, CONSOLIDATED FINANCIAL STATEMENTS & INDEPENDENT AUDITOR’S REPORT 2018
SAZKA Group a.s. Consolidated financial statements for the year ended 31 December 2018 (in thousands of Euro)
ii. Financial assets (including trade and other receivables)
IFRS 9, Financial Instruments, established a new model for recognition and measurement of impairments of financial instruments and contract assets that are measured at Amortized Cost or FVOCI - the so-called “expected credit losses” or “ECL” model.
The Group recognises loss allowances for ECLs on financial assets measured at amortised cost.
Loss allowances for trade receivables and contract assets are always measured at an amount equal to lifetime ECL. When determining whether the credit risk of a financial asset has increased significantly since initial recognition and when estimating ECL, the Group considers reasonable and supportable information that is relevant and available without undue cost or effort. This includes both quantitative and qualitative information and analysis, based on the Group’s historical experience and informed credit assessment and including forward-looking information.
The Group considers a financial asset to be in default when:
• the borrower is unlikely to pay its credit obligations to the Group in full, without recourse by the Group to actions such as realising security (if any is held); or
• the financial asset is more than 90 days past due.
Measurement of ECLs
Trade receivables – simplified approach
For trade receivables against the POS, the Group generally uses the Provisioning Matrix approach. In the provisioning matrix approach, impairment is calculated as a current amount of receivables in a predetermined Days Past Due bucket, multiplied by the historical loss rate associated with that time bucket and adjusted for forward looking information.
Significant receivables are assessed individually using an expert-based approach.
Two approaches are used by the Group to estimate the input parameters:
1. External rating based approach
2. Credit spread based approach
External rating based approach is used for loans to and deposits with counterparties with an external credit rating. Credit spread based approach is used for loans to and deposits with counterparties without an external credit rating.
Significant increase in credit risk is not assessed for trade receivables subject to provisioning matrix approach as they are always measured at Lifetime ECL.
Other financial assets – Standard ECL model
The Group assesses, on a forward-looking basis, the ECL for the exposures arising from loan commitments and for contract assets. The Group measures ECL and recognises Net impairment losses on financial and contract assets at the end of each reporting period. The measurement of ECL reflects: (i) an unbiased and probability weighted amount that is determined by evaluating a range of possible outcomes, (ii) time value of money and (iii) all reasonable and supportable information that is available without undue cost and effort at the end of each reporting period about past events, current conditions and forecasts of future conditions.
Contract assets are presented in the consolidated statement of financial position net of the allowance for ECL. For loan commitments and financial guarantees, a separate provision for ECL is recognised as a liability in the consolidated statement of financial position.
The Group applies a three stage model for impairment, based on changes in credit quality since initial recognition. A financial instrument that is not credit-impaired on initial recognition is classified in Stage 1. Financial assets in Stage 1 have their ECL measured at an amount equal to the portion of lifetime ECL that results from default events possible within the next 12 months or until contractual maturity, if shorter (“12 Months ECL”). If the Group identifies a significant increase in credit risk (“SICR”) since initial recognition, the asset is transferred to Stage 2 and its ECL is measured based on ECL on a lifetime basis, that is, up until contractual maturity but considering expected prepayments, if any (“Lifetime ECL). If the Group determines that a financial asset is credit-impaired, the asset is transferred to Stage 3 and its ECL is measured as a Lifetime ECL. The Group’s definition of credit impaired assets and definition of default is explained below. For financial assets that are purchased or originated credit-impaired (“POCI Assets”), the ECL is always measured as a Lifetime ECL.
Current accounts and term deposits are placed at top credit institutions that are considered to have an investment grade rating, therefore significant increase in credit risk is not considered due to the “low credit risk” exemption and while the counterparties continue to have investment grade rating.
For other financial assets measured at amortized cost, significant increase in credit risk is considered to have occurred if the asset is at least 30 days past due, if the external rating grade has decreased by 2 notches since initial recognition, if the credit spread has increased by 50% since initial recognition or if asset-specific qualitative information that suggest that a significant increase in credit risk has occurred is available.
For purposes of disclosure, the Group fully aligned the definition of default with the definition of credit-impaired assets. The default definition stated above is applied to all types of financial assets of the Group.
Presentation of allowance for ECL in the statement of financial position
Loss allowances for financial assets measured at amortised cost are deducted from the gross carrying amount of the assets. For debt securities at FVOCI, the loss allowance is charged to profit or loss. The revaluation reserve represents the difference between amortised cost, net of ECL, and fair value of the asset.
Write-off
The gross carrying amount of a financial asset is written off (either partially or in full) to the extent that there is no realistic prospect of recovery. This is generally the case when the Group determines that the debtor does not have assets or sources of income that could generate sufficient cash flows to repay the amounts subject to the write-off. However, financial assets that are written off could still be subject to enforcement activities.
(j) Other non-current investments
Other non-current investments are not consolidated and are stated at cost less any impairment loss.
(k) Inventories
Inventories are measured at the lower of cost and net realisable value.
The cost of inventories includes the purchase price, import duties and other taxes (except for those that the Group subsequently reclaims from the tax authorities), freight, handling costs and other expenses directly attributable to the acquisition of finished goods, materials and services. Cost is reduced by trade discounts, rebates and other similar items.
Net realisable value is the estimated selling price in the ordinary course of business, less the estimated costs of completion and the estimated costs necessary to make the sale.
(l) Short-term financial assets
Restricted cash is also included in Short-term financial assets. Restricted cash is cash not available for immediate use. Such cash cannot be used by a Group until a certain point or event in the future.
Restricted cash consist of cash on bank accounts for purpose of guarantees given by game license and for debt service based on facility agreement.
(m) Cash and cash equivalents (Note 10)
Cash is cash on hand and deposits on demand. Cash equivalents are short-term, highly liquid investments that are readily convertible to known amounts of cash and which are subject to insignificant risk of changes in value. Investments normally only qualify as cash equivalent if they have a short maturity of three months or less from the date of acquisition.
(n) Share capital (Note 12)
The issued share capital comprises fully paid shares. Incremental costs directly attributable to the issue of ordinary shares are recognised as a deduction from equity.
(o) Short-term and long-term loans (Note 14)
Short-term and long-term loans are initially recognized at fair value and subsequently are stated at amortised cost. Any part of a long-term loan which is due within one year from the end of the reporting period is considered as a short-term loan.
69 70CONSOLIDATED ANNUAL REPORT, CONSOLIDATED FINANCIAL STATEMENTS & INDEPENDENT AUDITOR’S REPORT 2018
SAZKA Group a.s. Consolidated financial statements for the year ended 31 December 2018 (in thousands of Euro)
(p) Provisions (Note 15)
A provision is recognised in the consolidated statement of financial position if, as a result of a past event, the Group has a present legal or constructive obligation that can be estimated reliably, and it is probable that an outflow of economic benefits will be required to settle the obligation.
Provisions are recognised at the expected settlement amount. Long-term liabilities are recognised as liabilities at the present value of the expenditures expected to be required to settle the liability. Where the effect of discounting is material, the discount rate is a pre-tax rate that reflects current market assessments of the time value of money and the risks specific to the liability. Any additions and the effects of changes in interest rates are recognised as finance income or costs in profit or loss.
Changes in estimated provisions may arise in particular due to variances from the originally estimated expenditures or due to a change in the date of settlement, or in the extent, of the liability. Changes in estimates are generally recognised in the consolidated statement of comprehensive income as at the date that the estimate is changed. Provisions are reviewed on an ongoing basis.
i. Establishment and use of provisions
Additions to provisions are charged to the relevant expense accounts corresponding to the nature of the provision. Unwinding of the discounting of provisions is charged to financial costs as interest expense. The release of provisions is recognized as a decrease in the relevant expense accounts.
ii. Jackpot provision
Jackpot games are games with fixed odds where unpaid winnings are transferred to next draw as a bonus. In next draw there are normal, regular winnings from amounts staked in current draw and bonuses transferred from previous draw. This obligation to transfer the unpaid winnings is determined by the Licence granted by the regulator, specifically in relation to the Gaming Rules („Herní plán loterií SAZKA“) which are an integral part of the Licence. The licence is granted for a limited period of time. At the end of the Licence, if the jackpot is not won in the last draw and the licence is not extended, the jackpot will be paid to a winner or winners from the last draw. The same jackpot pay-out mechanism is also applied if the game is cancelled for any other reason during the licenced period.
iii. Scratch card provision
In this kind of game, there is predetermined payout (in form of % of total card – no matter whether the cards have been sold or not) and the difference between actual and predetermined payouts (which is usually favorable for the Group) is recognized as revenues. Since there is no liability for the undistributed portion of wins, the entity is using historical experience to calculate an approximate payout in order to recognise a provision for wins in relation to cards that were already distributed.
iv. Warranty provision
A warranty provision is recognized upon the sale of a particular product or the provision of a service. The provision is determined based on historical records of warranty provisionscosts, taking into account all possible development scenarios and their probability.
(q) Revenue recognition and accounting for winnings (Note 18)
Revenue is shown net of value added tax and estimated discounts.
i. Revenues from lottery, betting and VLTs
Gaming revenues are reported net after deduction for player winnings as gross gaming revenue (GGR).
Received stakes relating to future lottery periods are recorded as prepaid stakes (“Numerical lottery subscription”) measured at fair value.
Lottery tax, assessed as a percentage (according to specific country legislation) of revenue from stakes less wins in the period, is recognised based on recognised gross gaming revenue in the period.
Prize claims are recognized in the lottery period based on the date of lottery draw and presented as other current payables at the end of reporting period.
Unclaimed prizes (expired winnings that the winners failed to claim) are recognized as revenue after the relevant period to claim the wins expires, otherwise it is reported as a payout obligation to winners in the statement of financial position. In OPAP S.A. Group unclaimed prizes are attributed to the State after the given relevant claim period expires.
ii. Draw based games (numerical lotteries)
There are two types of draw based games – Fixed odds and Pari mutuel (jackpot games).
For Fixed odds, the payout is a fixed amount.
For Pari mutuel games payout pool is created and in case there is no winner in the given draw and the prize is rolled to the next draw as a jackpot, the provision is recognized (on net basis).
Revenue is recognized in the period when bets are made by the customers, net of obligation to pay the game prizes in the future assessed at fair value.
iii. Instant lotteries
Revenues from lottery ticket sale are recognized in the period when the sale of the lottery ticket occurs. Instant lotteries payouts are recognized as the percentage from lottery tickets sales based on historical experience.
iv. Betting (odds bets)
Odds bets are organized, according to a gaming plan, via online (internet based) betting system connected to a central IT system.
Revenue is recognized when the bet event result occurs as amount staked less relevant payout. In case of series of bet events, revenue is recognized, when last bet event result is settled.
v. VLTs
Revenue is defined as the sum of all players’ sessions within a period. a player’s session begins when the player inserts his/her card in the machine and ends when he/she takes the card out. Revenue (GGR) is recognized at the net amount (receipts – winnings) of each player’s game session.
vi. Revenue from sale of goods and sevices
Revenue from sale of goods and services which do not represent the main business includes:
• Mobile virtual network operator
Revenue is recognized when the flow of voice or data services takes place, regardless of when the payment or collection is being made.
Unused voice and data services from prepaid call cards are deferred and recognised as revenue when the prepaid period expires.
• Mobile phone (GSM) top-up service
The company operates as an agent for mobile operator on a “net commission basis” presented as revenues.
Revenues from GSM services are recognized on accrual basis when the transaction is complete (performed).
Based on the terms and conditions agreed with mobile operators the revenue is equal to fixed percentage calculated from the GSM sales revenues. The billing period is once a week.
• Sale of tickets
The company operates as an agent for various events ticket sales on a “net commission basis”. Revenues from sale of tickets are recognised when customer prints or pick up the ticket at the terminal.
• Revenue from commissions
The New Year’s Eve Lottery is issued once a year and the draw is held on New Year’s Eve. Net revenues from this Lottery are attributed to the Greek State. Hellenic Lotteries S.A. produces, operates, distributes, promotes and manages it and receives a 17% management fee on amounts wagered. The fee included all Company costs related to the organisation of the New Year’s Eve Lottery. This commission is recognized once a year, during December.
• Revenue from other services
For most of the other activities, the Group operates as an agent, with revenues being recognized in net amounts when the performance obligation is satisfied by transferring goods or services to the customer.
71 72CONSOLIDATED ANNUAL REPORT, CONSOLIDATED FINANCIAL STATEMENTS & INDEPENDENT AUDITOR’S REPORT 2018
SAZKA Group a.s. Consolidated financial statements for the year ended 31 December 2018 (in thousands of Euro)
(r) Other operating income (Note 31)
Lease income
Income from the lease of non-residential premises, office space and movable assets is recognised in the statement of comprehensive income as other operating income on a straight-line basis over the term of the lease.
(s) Lease payments
Operating lease payments (Note 31)
Payments made under operating leases are recognised in the statement of comprehensive income on a straight-line basis over the term of the lease. Lease incentives received are recognised in the statement of comprehensive income as an integral part of the total lease expense.
Finance lease payments
Each lease payment is allocated between the liability and finance charges so as to achieve a constant rate on the finance balance outstanding. The corresponding rental obligations, net of future finance charges, are included in borrowings. The interest cost is charged to profit or loss over the lease period using the effective interest method.
(t) Interest income, finance income and finance costs (Note 28)
Interest income comprises interest income on funds invested (bank interest and interest on loans provided).
Finance income comprises interest income on funds invested (bank interest and interest on loans provided), dividend income, changes in the fair value of financial assets at fair value through profit or loss, fair value change that have been previously recognised in OCI from the disposal of fair value through other comprehensive income financial assets, foreign exchange gains, and gains on derivative instruments that are recognised in profit or loss.
Finance expenses comprise interest expense on loans and borrowings, unwinding of the discount on provisions, foreign currency losses, changes in the fair value of financial assets at fair value through profit or loss, and losses on hedging instruments that are recognised in profit or loss.
(u) Income tax expense (Note 29)
Income tax expense comprises current and deferred tax. Income tax expense is recognised in profit or loss except to the extent that it relates to items recognised directly in other comprehensive income or directly in equity, in which case it is recognised in other comprehensive income or equity.
Current tax is the expected tax payable on the taxable profit for the year, using tax rates enacted or substantively enacted at the reporting date, and any adjustment to tax payable in respect of previous years.
Deferred tax is recognised using the balance sheet method, providing for temporary differences between the carrying amounts of assets and liabilities for financial reporting purposes and the amounts used for taxation purposes. Deferred tax is not recognised for the following temporary differences: the initial recognition of goodwill, the initial recognition of assets or liabilities in a transaction that is not a business combination and that affects neither accounting nor taxable profit, and differences relating to investments in subsidiaries and jointly controlled entities to the extent that they probably will not reverse in the foreseeable future. Deferred tax is measured at the tax rates that are expected to be applied to the temporary differences when they reverse, based on the laws that have been enacted or substantively enacted by the end of the reporting period.
A deferred tax asset is recognised to the extent that it is probable that future taxable profits will be available against which temporary difference or tax loss carried forward can be utilised. Deferred tax assets are reviewed at each reporting date and are reduced to the extent that it is no longer probable that the related tax benefit will be realised.
Deferred tax assets and liabilities are offset if there is a legally enforceable right to offset current tax liabilities and assets, and they relate to taxes levied by the same tax authority on the same taxable entity, if there is an intention to settle current tax liabilities and assets on a net basis or tax assets and liabilities will be realised simultaneously.
Additional income taxes that arise from the distribution of dividends are recognised at the same time as the liability to pay the related dividend is recognised.
(v) Related parties (Note 35)
A related party is a person or entity that is related to the entity preparing the consolidated financial statements (the “reporting entity”).
A) A person or a close member of that person’s family is related to the reporting entity if that person:
• has control or joint control over the reporting entity;
• has significant influence over the reporting entity; or
• is a member of the key management personnel of the reporting entity or its parent.
B) An entity is related to the reporting entity if any of the following conditions is met:
(I) The entity and the reporting entity are members of the same group (which means that each parent, subsidiary and fellow subsidiary is related to the others).
(II) One entity is an associate or joint venture of the other entity (or an associate or joint venture of a member of a group of which the other entity is a member).
(III) Both entities are joint ventures of the same third party.
(IV) One entity is a joint venture of a third entity and the other entity is an associate of the third entity.
(V) The entity is a post-employment benefit plan for the benefit of employees of either the reporting entity or an entity related to the reporting entity. If the reporting entity is itself such a plan, the sponsoring employers are also related to the reporting entity.
(VI) The entity is controlled or jointly controlled by a person identified in (A).
(VII) A person identified in (I) has significant influence over the entity or is a member of the key management personnel of the entity (or its parent).
(w) Operating segments (Note 34)
Segment information is presented based on the internal management reports and information provided to the Group management consisting of the chief executive officer and the chief financial officer, who examine the Group’s performance both from a product and entity wide information perspective. The segments are defined by separate categories of games or other services offered by Group entities.
The operating segments are:
Numerical lotteries: "Classical lottery games" (draw based games (DBG) pari-mutuel games (lotto) and fixed odds games (keno type). Numerical lotteries are lotteries where the player puts a stake on a combination of figures and the prize of the player is determined after numbers are drawn if he or she has the the winning figures. Depending on the type of the game, the payout ratio of numerical lotteries has a range approximately 50% to 70%.
Instant lotteries: Instant lotteries are lotteries and instant win games where the prizes are pre-drawn and distributed among the winning tickets at the moment of printing and prize of the player is revealed immediately upon opening the game field of the lottery ticket. The Group regularly renews and enriches its offering of scratch cards. Scratch cards require the player to scratch off certain areas hiding numbers or symbols and if the correct items are revealed, it is a winning card. The payout ratio of scratch cards has a typical range approximately 50% to 70%.
Digital games: Digital games consist of games of chance developed specifically for and played via online platforms, either through internet websites or mobile apps. Digital products do not have any physical representation (such as a ticket or card).
Sports Betting: Sports betting business consists of pre-match and live betting on sporting events, both through the Group’s POS and through its online sports-betting platform.
VLTs & gaming machines: VLTs are gaming products with demonstrated popularity in international gaming sectors and generally refer to interactive video displays which provide a wider range of games compared with traditional slot machines. While VLTs are optically similar to the classic slot machines found in casinos, they differ in their gaming mechanism.
Information about all other segments which are not reportable is disclosed in „All other segments“ category.

73 74CONSOLIDATED ANNUAL REPORT, CONSOLIDATED FINANCIAL STATEMENTS & INDEPENDENT AUDITOR’S REPORT 2018
SAZKA Group a.s. Consolidated financial statements for the year ended 31 December 2018 (in thousands of Euro)
2018 Note Licences & property
rights
Brands and
trademarks
Software Intangible assets
not yet available
for use
Other intangible
assets
Goodwill Total
Acquisition cost Balance at 1/1/2018 1,220,706 797,658 45,730 487 10,426 620,195 2,695,202
Business combinations 3(c) ,11 22 55,268 − 94 292,167 347,551
Additions 50 − 32,981 311 6 − 33,348
Transfers −4,380 − 4,587 −209 2 − −
Disposals − − −501 −24 − − −525
Effect of currency translation −35 −442 −84 −4 −17 −2,713 −3,295
Balance at 31/12/2018 1,216,363 852,484 82,713 561 10,511 909,649 3,072,281
Accumulated amortisation Balance at 1/1/2018 −77,627 − −15,795 − −1,013 − −94,435
Amortisation expense −67,219 − −11,046 − −675 − −78,940
Transfers 103 − −105 − 2 − −
Disposals − − 481 − − − 481
Impairment − − −41 − − −17,500 −17,541
Effect of currency translation −19 − 32 − 4 − 17
Balance at 31/12/2018 −144,762 − −26,474 − −1,682 −17,500 −190,418
Net book value at 1/1/2018 1,143,079 797,658 29,935 487 9,413 620,195 2,600,767
Net book value at 31/12/2018 1,071,601 852,484 56,239 561 8,829 892,149 2,881,863
4. Intangible assets and goodwill 2017 Note Licences & property
rights
Brands and
trademarks
Software Intangible assets
not yet available
for use
Other intangible
assets
Goodwill Total
Acquisition cost Balance at 1/1/2017 1,216,205 793,644 21,646 − 7,286 561,937 2,600,718
Business combinations 3(c), 11 4 − 4,210 − 6,033 37,592 47,839
Additions 4,227 − 16,495 348 3 − 21,073
Transfers − − 3,680 124 −3,094 − 710
Disposals − − −751 − − − −751
Effect of currency translation 270 4,014 450 15 198 20,666 25,613
Restated balance at 31/12/2017* 1,220,706 797,658 45,730 487 10,426 620,195 2,695,202
Accumulated amortisation Balance at 1/1/2017 −8,384 − −8,295 − −493 − −17,172
Amortisation expense −69,225 − −8,046 − −493 − −77,764
Disposals − − 751 − − − 751
Effect of currency translation −18 − −205 − −27 − −250
Restated balance at 31/12/2017* −77,627 − −15,795 − −1,013 − −94,435
Net book value at 1/1/2017 1,207,821 793,644 13,351 − 6,793 561,937 2,583,546
Net book value at 31/12/2017 1,143,079 797,658 29,935 487 9,413 620,195 2,600,767
*The Group used post-acquisition accounting within 12 months period as allowed by IFRS to finalize purchase price allocation related to acquisition of NEUROSOFT S.A. For more details see 2 (i).
Intangible assets primarily comprise intellectual property rights (mainly licenses), brands and trademarks, software and goodwill.
As at 31 December 2018 and 31 December 2017 trademarks with carrying value of EUR 72,768 thousand (as at 31 December 2017: EUR 73,294 thousand) were pledged as collateral. Refer to Note 32.
The most significant additions to intangible assets in 2018 and 2017 were acquisitions of new software for draw based games and sports betting.

75 76CONSOLIDATED ANNUAL REPORT, CONSOLIDATED FINANCIAL STATEMENTS & INDEPENDENT AUDITOR’S REPORT 2018
SAZKA Group a.s. Consolidated financial statements for the year ended 31 December 2018 (in thousands of Euro)
Brands and trademarks 31/12/2018 31/12/2017
SAZKA 72,768 73,294
OPAP 724,364 724,364
SUPER SPORT 55,352 −
Total 852,484 797,658
*For more details see Note 2 (i).
Goodwill 31/12/2018 31/12/2017 Restated*
SAZKA a.s. 374,581 377,294
Emma Delta Management Ltd sub-group 205,309 205,309
NEUROSOFT S.A.* (1) 20,092 37,592
SUPER SPORT d.o.o. sub-group 291,495 −
Minus5 d.o.o. 672 −
Total 892,149 620,195
*The Group finalised business combination accounting for NEUROSOFT S.A.. For more details see 2 (i).
(1) The recoverable amount of NEUROSOFT S.A. was determined using fair value less costs to sell. For the determination of fair value (Level 2 in terms of fair value hierarchy) a number of companies listed on international stock markets that are relatively comparable to NEUROSOFT S.A. (software development and ICT sector), were identified through the Reuters database.
To derive the fair value, the following valuation multiples were calculated, based on comparable companies forward parameters as of 31 December 2019 and 31 December 2020, on which different weights were applied:
• Enterprise Value (EV) / Sales multiple;
• Enterprise Value (EV) / EBIT (Earnings before Interest and Tax) multiple, and;
• Enterprise Value (EV) / EBITDA (Earnings before Interest, Tax, Depreciation and Amortization) multiple.
Moreover, on the valuation results derived from the utilisation of the above mentioned multiples, selling costs of 1% were applied to the derived valuation, as selling expenses, in order to estimate the Fair Value Less Costs to Sell.
The recoverable amount of 67.72% of NEUROSOFT S.A. shares according to the method above using the EV/EBITDA multiple amounting to 11.30 is estimated to be EUR 28,400 thousand. Since its carrying amount is of EUR 45,900 thousand, an impairment amount of EUR 17,500 thousand is recognised.
The sensitivity analysis of the calculation was performed with results that in the event of 10% decrease of EV/EBITDA multiple, the recoverable amount would decrease to EUR 25,600 thousand resulting in imparment increase of EUR 2,800 thousand.
The Group recorded an impairment loss of equivalent amount based on the above study:
Goodwill of NEUROSOFT S.A. at acquisition 37,592
Impairment loss (see Note 34 a) −17,500
Goodwill of NEUROSOFT S.A. at 31 December 2018 20,092
Indefinite-lived intangible assets, goodwill, and impairment testing
Impairment is determined by estimating the recoverable amount of the cash-generating unit to which goodwill and other non-depreciable assets relate.
In accordance with IAS 36, the Group tested the goodwill and indefinite-lived intangible assets (i.e. trademarks and the lottery licence) for impairment in 2018.
Goodwill
The impairment testing is performed on annual basis as at 31 December. The recoverable amount is estimated using the higher of:
1. Value in Use “VIU“ – VIU is derived from forecasts of future cash flows. The forecasts are prepared and updated by the management. Pre tax weighted average cost of capital (WACC) is applied as the appropriate discount rate to estimate net present value of future cash flows attributable to each cash-generating unit. The cash flow forecast is always prepared based on specific expected operating results and a business plan covering a period of at least three years. To reflect continuity of the business beyond the explicit forecasting period a terminal value model (Gordon growth model) is applied.
2. Fair Value Less Costs of Disposal (FVLCD) – i.e. the amount obtainable from the sale of an asset or cash-generating unit in an arm’s length transaction between knowledgeable, willing parties, less the costs of disposal. The estimate of FVLCD is based either on:
a. market price of the asset/cash-generating unit derived from its trading in an active market. Costs of disposal are considered as immaterial.
Market price is used for valuation of OPAP. OPAP shares are publicly traded on Athens Stock Exchange.
b. market multiples method – i.e. a comparison of the tested company with similar publicly traded companies. The Group relied on a peer based EV/EBITDA multiple benchmark to estimate the respective FVLCD. Costs of disposal are considered as immaterial. The Group used following assumptions for impairment testing: a common market participant, 12.12 EV/EBITDA market multiple (11.30 EV/EBITDA market multiple in respect of NEUROSOFT S.A.).
Market multiple method is used for valuation of the Group’s generating units.
The resulting recoverable amount calculated based on FVLCD (market multiple) method exceeded the respective carrying amount, which led to the conclusion that no impairment of the tested assets had to be recognised as at 31 December 2018. In addition, the Group’s management carried out a sensitivity analysis (possible movements in key assumptions and factors) influencing calculation of the recoverable amount. Expectable movements in the mentioned factors do not indicate any impairment of goodwill since no material effects on the results in next year were identified.
Trademarks
Impairment testing of trademarks was carried out by applying the relief from royalty method. Similarly to the paragraphs above, an explicit cash flow forecast was prepared based on a business plan covering a period of at least three years. The budgets have been approved by the management and are valid when the impairment test is performed. These budgets are based on the past experience, as well as on future expectations and market trends. To reflect continuity of the trademarks beyond the explicit forecasting period a terminal value model (Gordon growth model) is applied. a terminal growth rate of 2% is applied (2017: 2%). Net royalties (using royalty rate of 5 %) after tax were discounted using the pre-tax weighted average cost of capital (WACC) with an uplift of 1%p. WACC ranges from 8.8–11.39%. Tax amortization benefit was reflected in the calculation as well.
Resulting recoverable amount exceeded the carrying amount of the trademarks, which led to the conclusion that no impairment of the trademarks had to be recognised as at 31 December 2018. In addition, the Group’s management carried out a sensitivity analysis of factors influencing calculation of the recoverable amount. Expectable movements in the mentioned factors do not indicate any impairment of trademarks
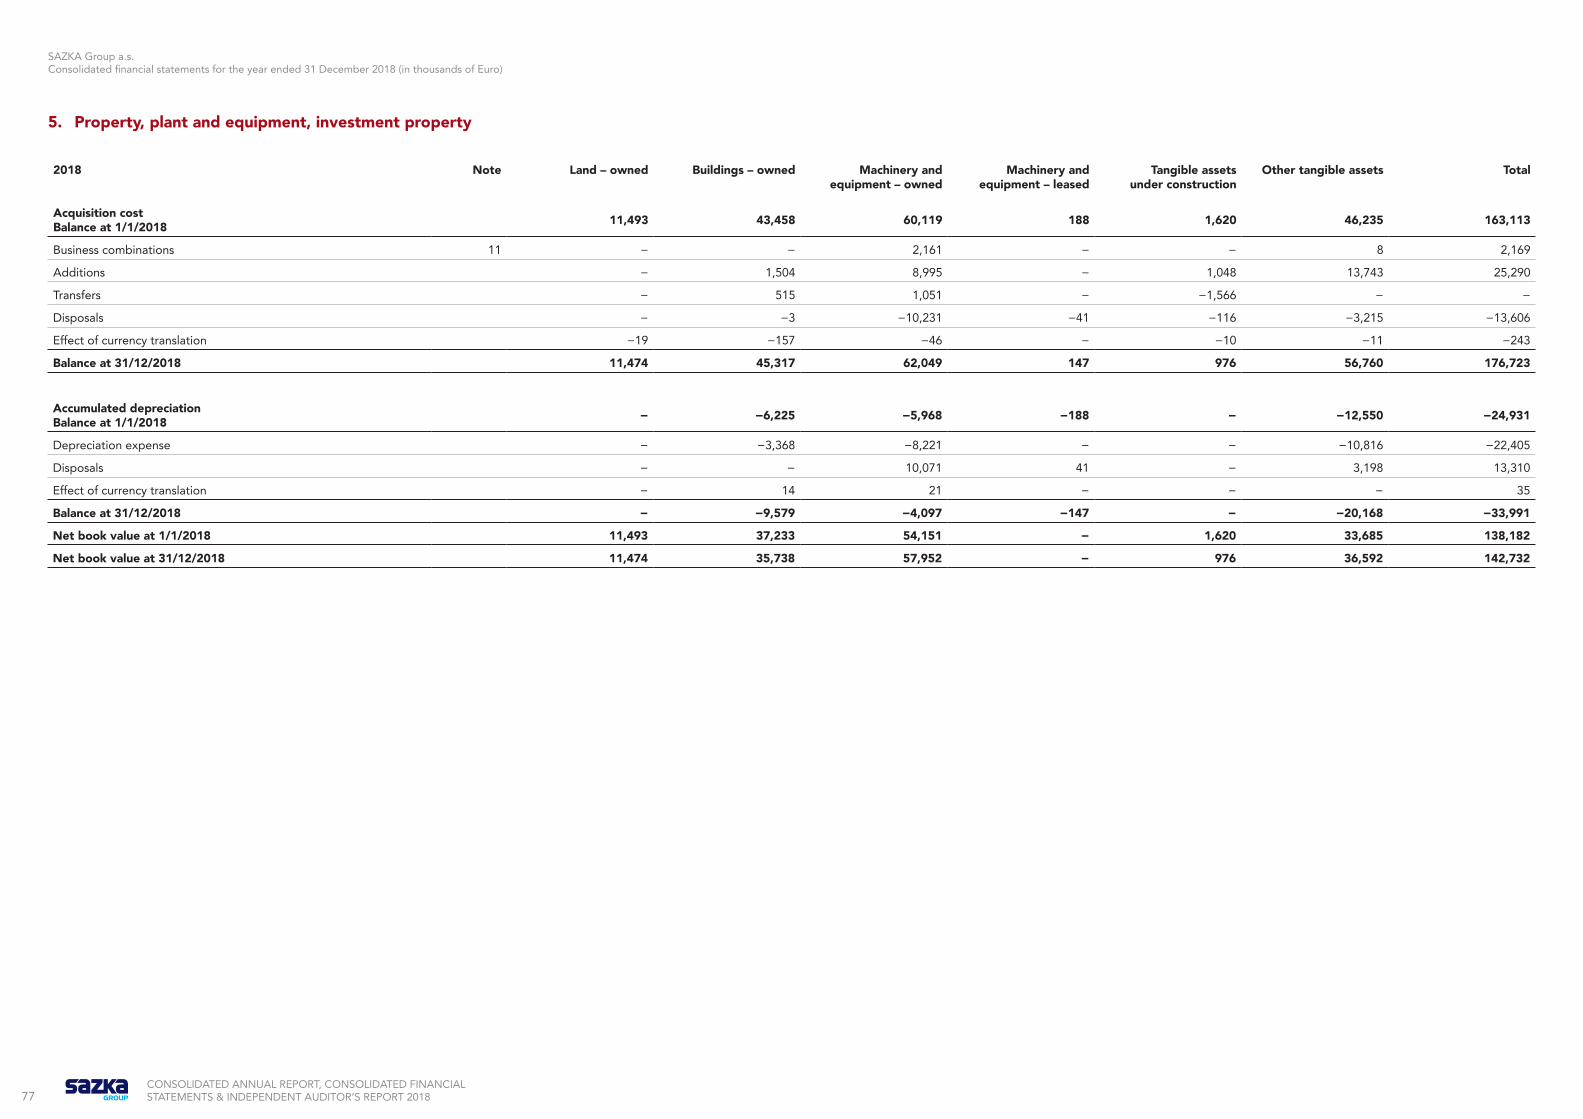
CONSOLIDATED ANNUAL REPORT, CONSOLIDATED FINANCIAL STATEMENTS & INDEPENDENT AUDITOR’S REPORT 201877
SAZKA Group a.s. Consolidated financial statements for the year ended 31 December 2018 (in thousands of Euro)
2018 Note Land – owned Buildings – owned Machinery and equipment – owned
Machinery and equipment – leased
Tangible assets under construction
Other tangible assets Total
Acquisition cost Balance at 1/1/2018 11,493 43,458 60,119 188 1,620 46,235 163,113
Business combinations 11 − − 2,161 − − 8 2,169
Additions − 1,504 8,995 − 1,048 13,743 25,290
Transfers − 515 1,051 − −1,566 − −
Disposals − −3 −10,231 −41 −116 −3,215 −13,606
Effect of currency translation −19 −157 −46 − −10 −11 −243
Balance at 31/12/2018 11,474 45,317 62,049 147 976 56,760 176,723
Accumulated depreciation Balance at 1/1/2018 − −6,225 −5,968 −188 − −12,550 −24,931
Depreciation expense − −3,368 −8,221 − − −10,816 −22,405
Disposals − − 10,071 41 − 3,198 13,310
Effect of currency translation − 14 21 − − − 35
Balance at 31/12/2018 − −9,579 −4,097 −147 − −20,168 −33,991
Net book value at 1/1/2018 11,493 37,233 54,151 − 1,620 33,685 138,182
Net book value at 31/12/2018 11,474 35,738 57,952 − 976 36,592 142,732
5. Property, plant and equipment, investment property

78CONSOLIDATED ANNUAL REPORT, CONSOLIDATED FINANCIAL STATEMENTS & INDEPENDENT AUDITOR’S REPORT 2018
SAZKA Group a.s. Consolidated financial statements for the year ended 31 December 2018 (in thousands of Euro)
2017 Note Land – owned Buildings – owned Machinery and equipment – owned
Machinery and equipment – leased
Tangible assets under construction
Other tangible assets Total
Acquisition cost Balance at 1/1/2017 11,352 40,195 7,720 186 − 41,216 100,669
Business combinations 11 − 288 1,281 − − 257 1,826
Additions − 1,697 47,932 − 1,553 9,622 60,804
Transfers − 147 3,580 − 19 −4,456 −710
Disposals − − −783 − − −499 −1,282
Effect of currency translation 141 1,131 389 2 48 95 1,806
Balance at 31/12/2017 11,493 43,458 60,119 188 1,620 46,235 163,113
Accumulated depreciation Balance at 1/1/2017 − −3,094 −3,018 −186 − −1,856 −8,154
Depreciation expense − −3,039 −3,404 − − −11,074 −17,517
Disposals − − 640 − − 380 1,020
Effect of currency translation − −92 −186 −2 − − −280
Balance at 31/12/2017 − −6,225 −5,968 −188 − −12,550 −24,931
Net book value at 1/1/2017 11,352 37,101 4,702 − − 39,360 92,515
Net book value at 31/12/2017 11,493 37,233 54,151 − 1,620 33,685 138,182
The most significant additions to property, plant and equipment in 2018 mainly concern lottery terminals, printers and monitors as well telecommunication equipment for OPAP network.
The most significant additions to property, plant and equipment in 2017 mainly concern lottery terminals, printers and monitors.
As at 31 December 2018, the net book value of the building and the adjacent land, pledged as a collateral (see Note 32), totals EUR 21,820 thousand (2017: EUR 21,488 thousand).
Machinery and equipment – leased comprise primarily the draw equipment which the Group has acquired under finance lease.
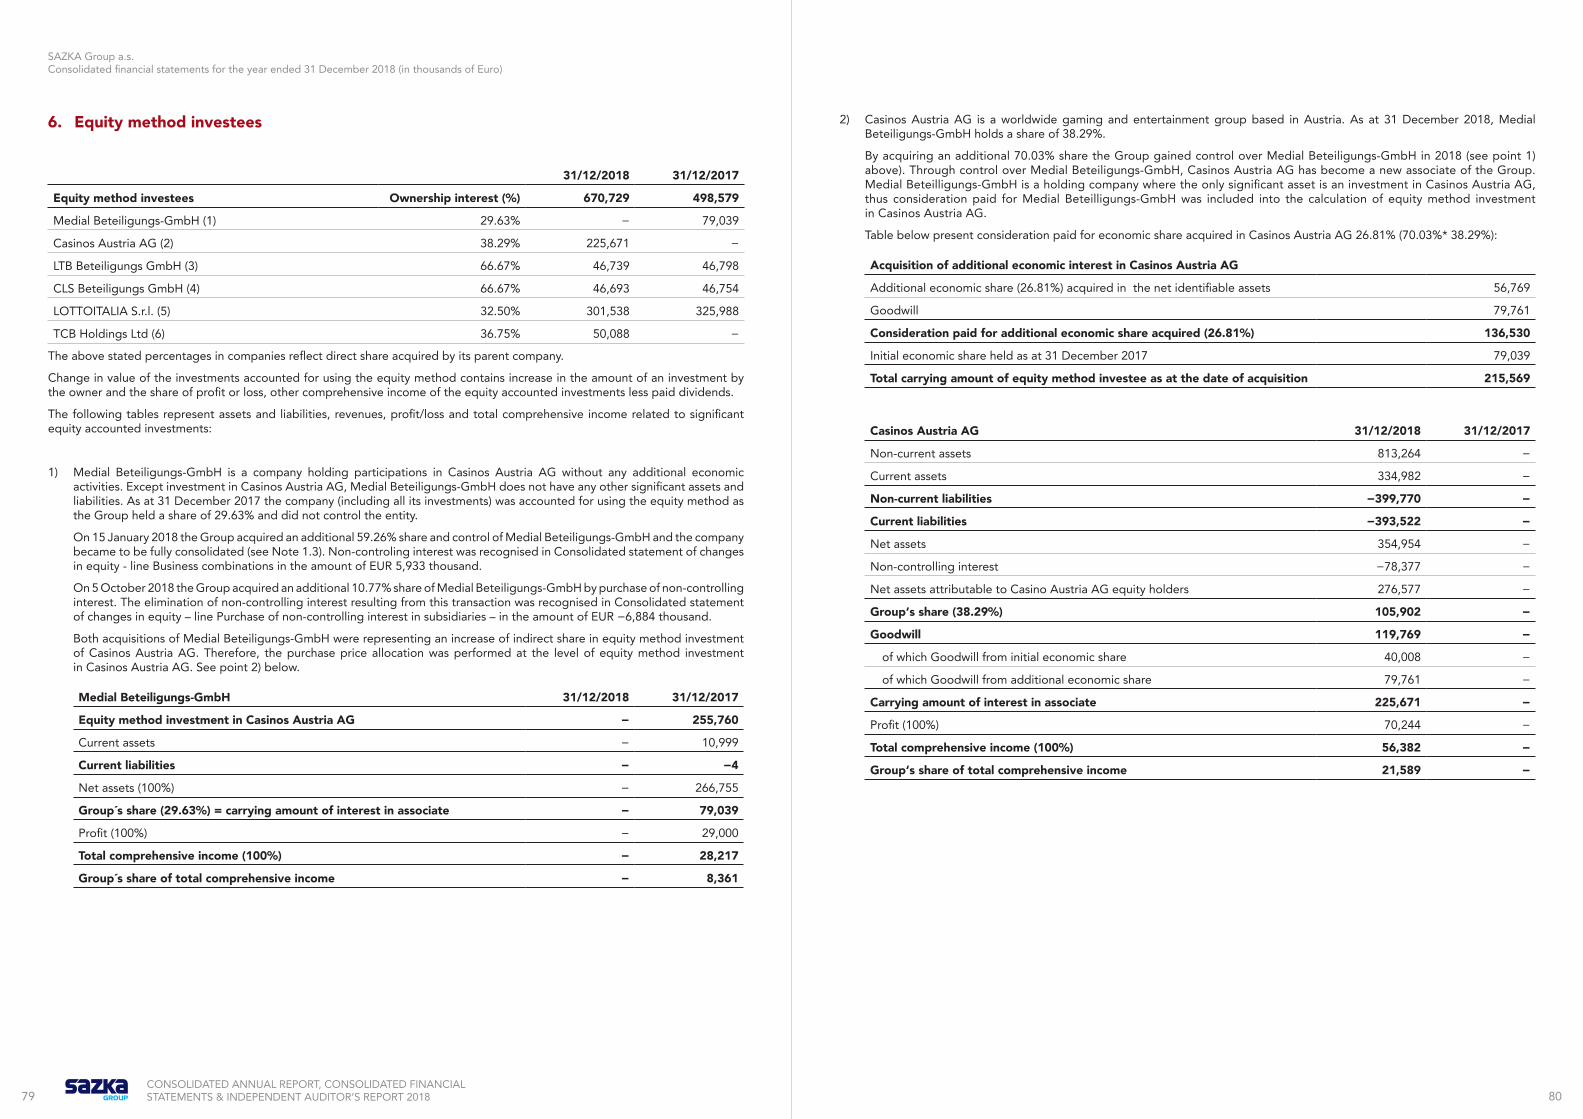
79 80CONSOLIDATED ANNUAL REPORT, CONSOLIDATED FINANCIAL STATEMENTS & INDEPENDENT AUDITOR’S REPORT 2018
SAZKA Group a.s. Consolidated financial statements for the year ended 31 December 2018 (in thousands of Euro)
6. Equity method investees
31/12/2018 31/12/2017
Equity method investees Ownership interest (%) 670,729 498,579
Medial Beteiligungs-GmbH (1) 29.63% − 79,039
Casinos Austria AG (2) 38.29% 225,671 −
LTB Beteiligungs GmbH (3) 66.67% 46,739 46,798
CLS Beteiligungs GmbH (4) 66.67% 46,693 46,754
LOTTOITALIA S.r.l. (5) 32.50% 301,538 325,988
TCB Holdings Ltd (6) 36.75% 50,088 −
The above stated percentages in companies reflect direct share acquired by its parent company.
Change in value of the investments accounted for using the equity method contains increase in the amount of an investment by the owner and the share of profit or loss, other comprehensive income of the equity accounted investments less paid dividends.
The following tables represent assets and liabilities, revenues, profit/loss and total comprehensive income related to significant equity accounted investments:
1) Medial Beteiligungs-GmbH is a company holding participations in Casinos Austria AG without any additional economic activities. Except investment in Casinos Austria AG, Medial Beteiligungs-GmbH does not have any other significant assets and liabilities. As at 31 December 2017 the company (including all its investments) was accounted for using the equity method as the Group held a share of 29.63% and did not control the entity.
On 15 January 2018 the Group acquired an additional 59.26% share and control of Medial Beteiligungs-GmbH and the company became to be fully consolidated (see Note 1.3). Non-controling interest was recognised in Consolidated statement of changes in equity - line Business combinations in the amount of EUR 5,933 thousand.
On 5 October 2018 the Group acquired an additional 10.77% share of Medial Beteiligungs-GmbH by purchase of non-controlling interest. The elimination of non-controlling interest resulting from this transaction was recognised in Consolidated statement of changes in equity – line Purchase of non-controlling interest in subsidiaries – in the amount of EUR −6,884 thousand.
Both acquisitions of Medial Beteiligungs-GmbH were representing an increase of indirect share in equity method investment of Casinos Austria AG. Therefore, the purchase price allocation was performed at the level of equity method investment in Casinos Austria AG. See point 2) below.
Medial Beteiligungs-GmbH 31/12/2018 31/12/2017
Equity method investment in Casinos Austria AG − 255,760
Current assets − 10,999
Current liabilities − −4
Net assets (100%) − 266,755
Group´s share (29.63%) = carrying amount of interest in associate − 79,039
Profit (100%) − 29,000
Total comprehensive income (100%) − 28,217
Group´s share of total comprehensive income − 8,361
2) Casinos Austria AG is a worldwide gaming and entertainment group based in Austria. As at 31 December 2018, Medial Beteiligungs-GmbH holds a share of 38.29%.
By acquiring an additional 70.03% share the Group gained control over Medial Beteiligungs-GmbH in 2018 (see point 1) above). Through control over Medial Beteiligungs-GmbH, Casinos Austria AG has become a new associate of the Group. Medial Beteilligungs-GmbH is a holding company where the only significant asset is an investment in Casinos Austria AG, thus consideration paid for Medial Beteilligungs-GmbH was included into the calculation of equity method investment in Casinos Austria AG.
Table below present consideration paid for economic share acquired in Casinos Austria AG 26.81% (70.03%* 38.29%):
Acquisition of additional economic interest in Casinos Austria AG
Additional economic share (26.81%) acquired in the net identifiable assets 56,769
Goodwill 79,761
Consideration paid for additional economic share acquired (26.81%) 136,530
Initial economic share held as at 31 December 2017 79,039
Total carrying amount of equity method investee as at the date of acquisition 215,569
Casinos Austria AG 31/12/2018 31/12/2017
Non-current assets 813,264 −
Current assets 334,982 −
Non-current liabilities −399,770 −
Current liabilities −393,522 −
Net assets 354,954 −
Non-controlling interest −78,377 −
Net assets attributable to Casino Austria AG equity holders 276,577 −
Group‘s share (38.29%) 105,902 −
Goodwill 119,769 −
of which Goodwill from initial economic share 40,008 −
of which Goodwill from additional economic share 79,761 −
Carrying amount of interest in associate 225,671 −
Profit (100%) 70,244 −
Total comprehensive income (100%) 56,382 −
Group‘s share of total comprehensive income 21,589 −
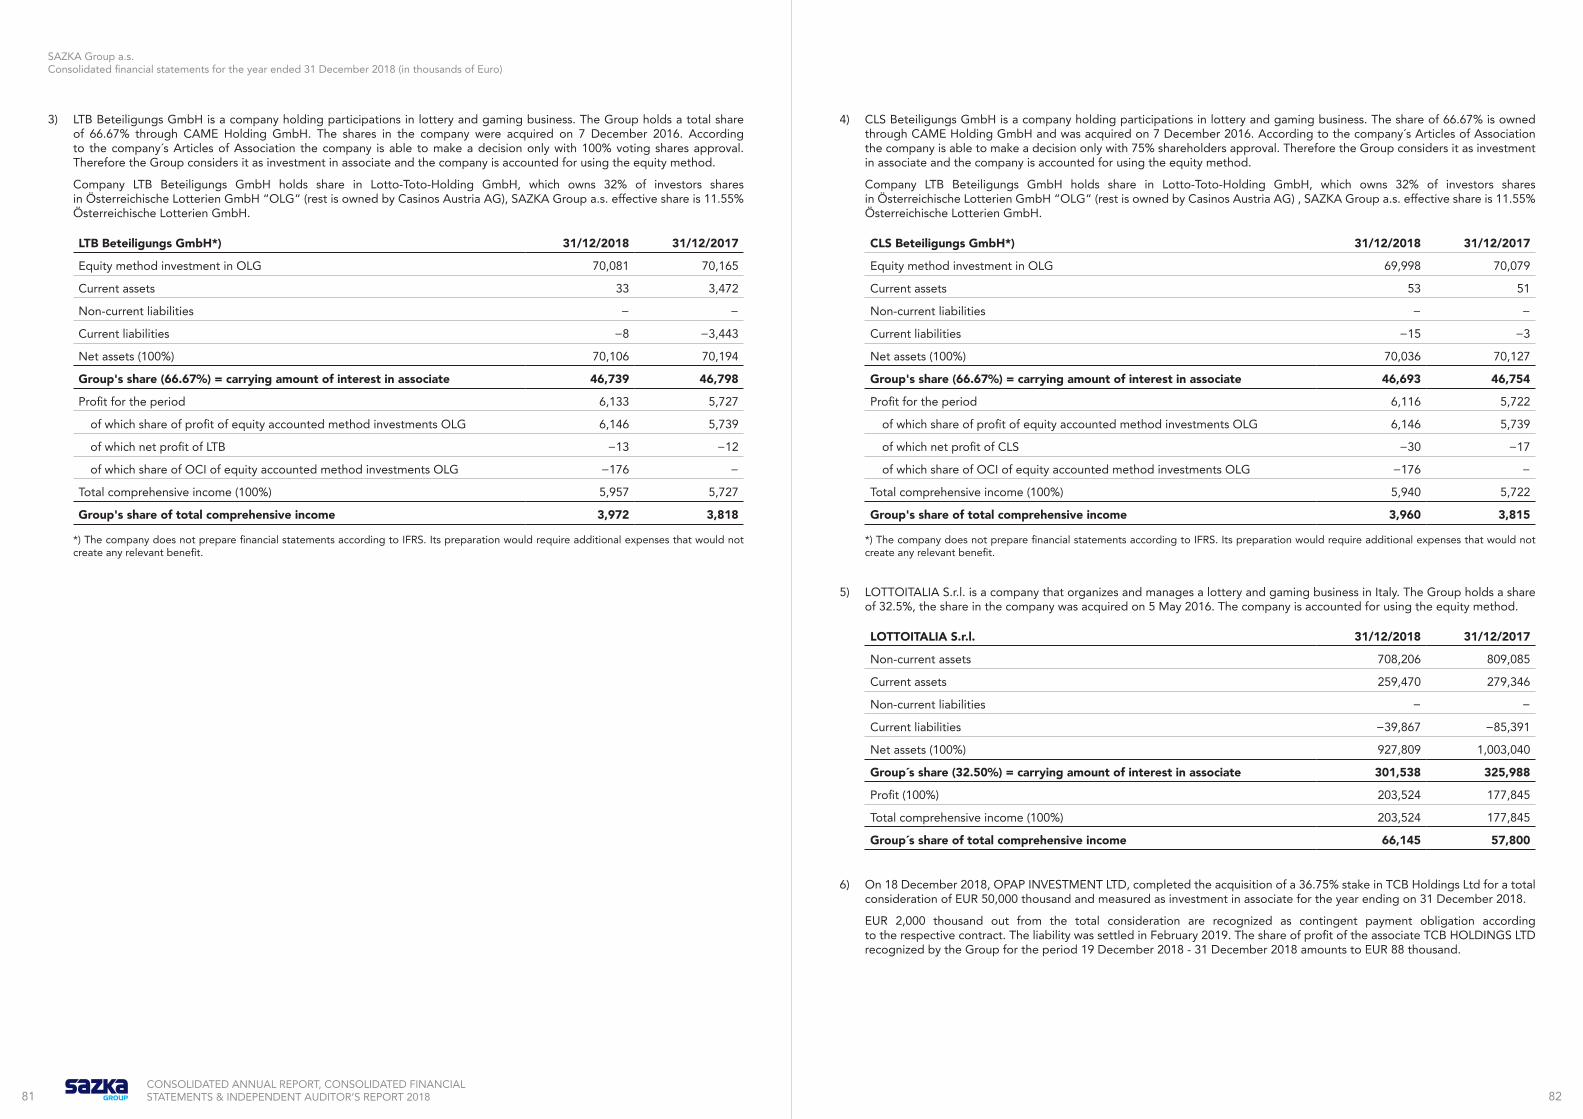
81 82CONSOLIDATED ANNUAL REPORT, CONSOLIDATED FINANCIAL STATEMENTS & INDEPENDENT AUDITOR’S REPORT 2018
SAZKA Group a.s. Consolidated financial statements for the year ended 31 December 2018 (in thousands of Euro)
3) LTB Beteiligungs GmbH is a company holding participations in lottery and gaming business. The Group holds a total share of 66.67% through CAME Holding GmbH. The shares in the company were acquired on 7 December 2016. According to the company´s Articles of Association the company is able to make a decision only with 100% voting shares approval. Therefore the Group considers it as investment in associate and the company is accounted for using the equity method.
Company LTB Beteiligungs GmbH holds share in Lotto-Toto-Holding GmbH, which owns 32% of investors shares in Österreichische Lotterien GmbH “OLG“ (rest is owned by Casinos Austria AG), SAZKA Group a.s. effective share is 11.55% Österreichische Lotterien GmbH.
LTB Beteiligungs GmbH*) 31/12/2018 31/12/2017
Equity method investment in OLG 70,081 70,165
Current assets 33 3,472
Non-current liabilities − −
Current liabilities −8 −3,443
Net assets (100%) 70,106 70,194
Group's share (66.67%) = carrying amount of interest in associate 46,739 46,798
Profit for the period 6,133 5,727
of which share of profit of equity accounted method investments OLG 6,146 5,739
of which net profit of LTB −13 −12
of which share of OCI of equity accounted method investments OLG −176 −
Total comprehensive income (100%) 5,957 5,727
Group's share of total comprehensive income 3,972 3,818
*) The company does not prepare financial statements according to IFRS. Its preparation would require additional expenses that would not create any relevant benefit.
4) CLS Beteiligungs GmbH is a company holding participations in lottery and gaming business. The share of 66.67% is owned through CAME Holding GmbH and was acquired on 7 December 2016. According to the company´s Articles of Association the company is able to make a decision only with 75% shareholders approval. Therefore the Group considers it as investment in associate and the company is accounted for using the equity method.
Company LTB Beteiligungs GmbH holds share in Lotto-Toto-Holding GmbH, which owns 32% of investors shares in Österreichische Lotterien GmbH “OLG“ (rest is owned by Casinos Austria AG) , SAZKA Group a.s. effective share is 11.55% Österreichische Lotterien GmbH.
CLS Beteiligungs GmbH*) 31/12/2018 31/12/2017
Equity method investment in OLG 69,998 70,079
Current assets 53 51
Non-current liabilities − −
Current liabilities −15 −3
Net assets (100%) 70,036 70,127
Group's share (66.67%) = carrying amount of interest in associate 46,693 46,754
Profit for the period 6,116 5,722
of which share of profit of equity accounted method investments OLG 6,146 5,739
of which net profit of CLS −30 −17
of which share of OCI of equity accounted method investments OLG −176 −
Total comprehensive income (100%) 5,940 5,722
Group's share of total comprehensive income 3,960 3,815
*) The company does not prepare financial statements according to IFRS. Its preparation would require additional expenses that would not create any relevant benefit.
5) LOTTOITALIA S.r.l. is a company that organizes and manages a lottery and gaming business in Italy. The Group holds a share of 32.5%, the share in the company was acquired on 5 May 2016. The company is accounted for using the equity method.
LOTTOITALIA S.r.l. 31/12/2018 31/12/2017
Non-current assets 708,206 809,085
Current assets 259,470 279,346
Non-current liabilities − −
Current liabilities −39,867 −85,391
Net assets (100%) 927,809 1,003,040
Group´s share (32.50%) = carrying amount of interest in associate 301,538 325,988
Profit (100%) 203,524 177,845
Total comprehensive income (100%) 203,524 177,845
Group´s share of total comprehensive income 66,145 57,800
6) On 18 December 2018, OPAP INVESTMENT LTD, completed the acquisition of a 36.75% stake in TCB Holdings Ltd for a total consideration of EUR 50,000 thousand and measured as investment in associate for the year ending on 31 December 2018.
EUR 2,000 thousand out from the total consideration are recognized as contingent payment obligation according to the respective contract. The liability was settled in February 2019. The share of profit of the associate TCB HOLDINGS LTD recognized by the Group for the period 19 December 2018 - 31 December 2018 amounts to EUR 88 thousand.
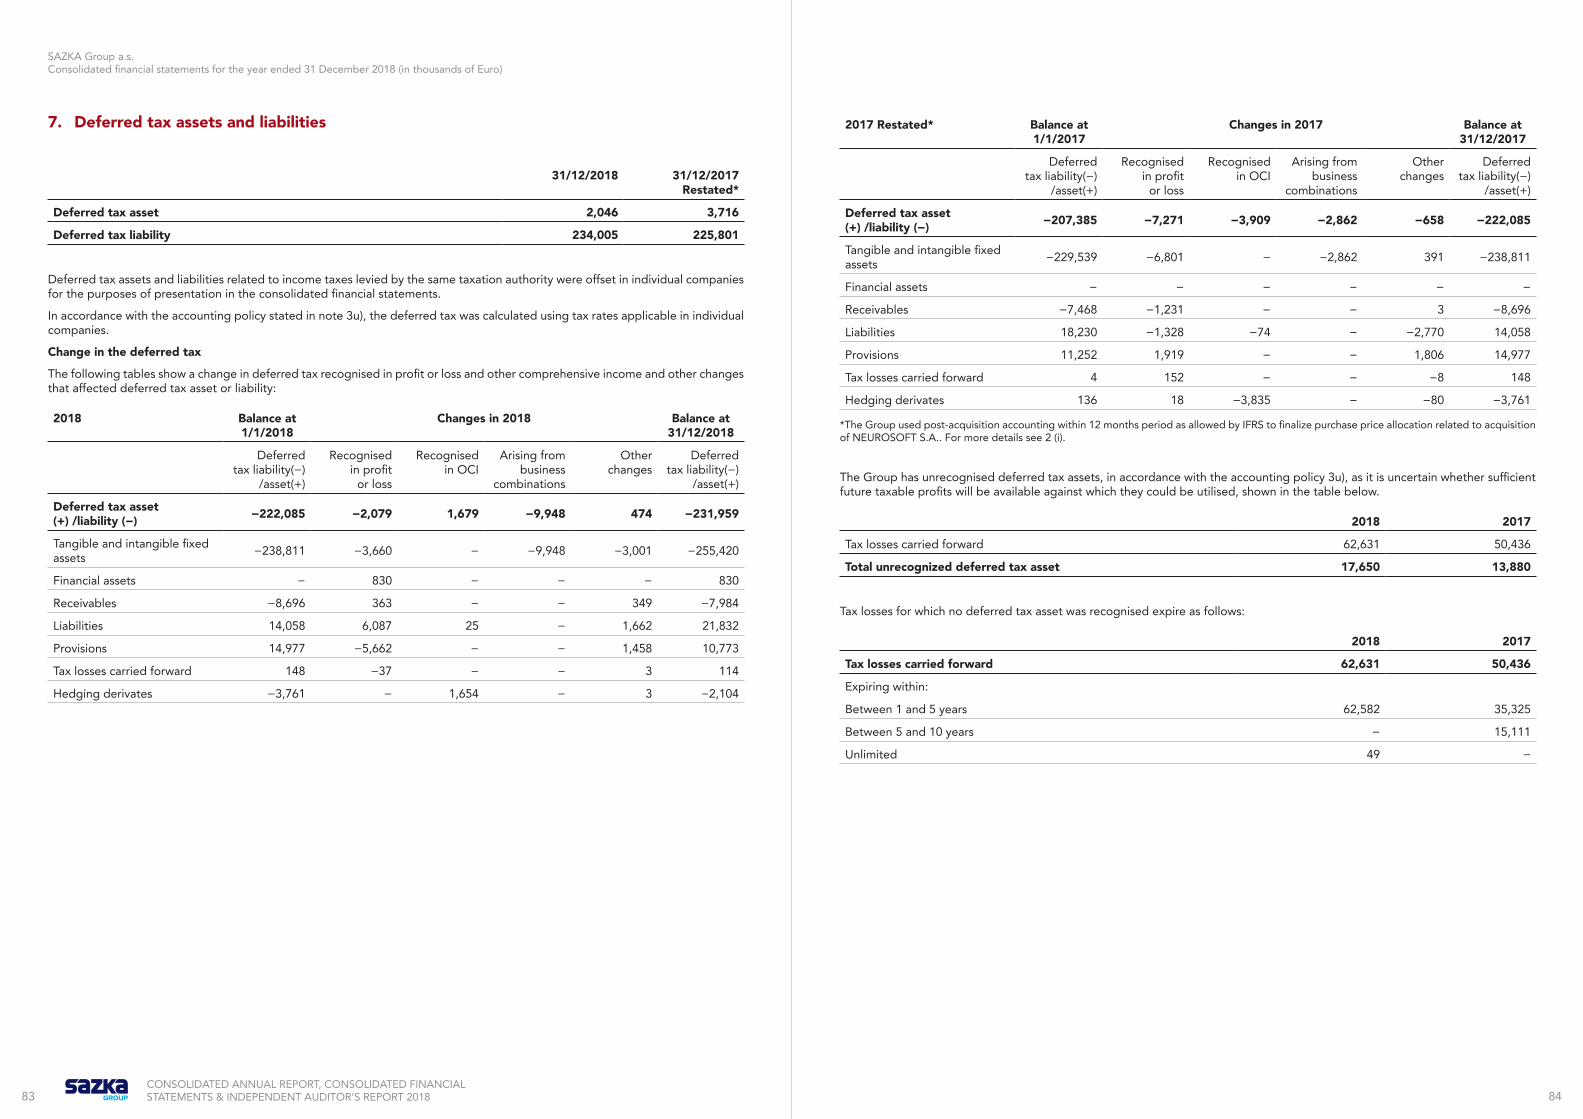
83 84CONSOLIDATED ANNUAL REPORT, CONSOLIDATED FINANCIAL STATEMENTS & INDEPENDENT AUDITOR’S REPORT 2018
SAZKA Group a.s. Consolidated financial statements for the year ended 31 December 2018 (in thousands of Euro)
7. Deferred tax assets and liabilities
31/12/2018 31/12/2017 Restated*
Deferred tax asset 2,046 3,716
Deferred tax liability 234,005 225,801
Deferred tax assets and liabilities related to income taxes levied by the same taxation authority were offset in individual companies for the purposes of presentation in the consolidated financial statements.
In accordance with the accounting policy stated in note 3u), the deferred tax was calculated using tax rates applicable in individual companies.
Change in the deferred tax
The following tables show a change in deferred tax recognised in profit or loss and other comprehensive income and other changes that affected deferred tax asset or liability:
2018 Balance at 1/1/2018
Changes in 2018 Balance at 31/12/2018
Deferred tax liability(−)
/asset(+)
Recognised in profit
or loss
Recognised in OCI
Arising from business
combinations
Other changes
Deferred tax liability(−)
/asset(+)
Deferred tax asset (+) /liability (−) −222,085 −2,079 1,679 −9,948 474 −231,959
Tangible and intangible fixed assets −238,811 −3,660 − −9,948 −3,001 −255,420
Financial assets − 830 − − − 830
Receivables −8,696 363 − − 349 −7,984
Liabilities 14,058 6,087 25 − 1,662 21,832
Provisions 14,977 −5,662 − − 1,458 10,773
Tax losses carried forward 148 −37 − − 3 114
Hedging derivates −3,761 − 1,654 − 3 −2,104
2017 Restated* Balance at 1/1/2017
Changes in 2017 Balance at 31/12/2017
Deferred tax liability(−)
/asset(+)
Recognised in profit
or loss
Recognised in OCI
Arising from business
combinations
Other changes
Deferred tax liability(−)
/asset(+)
Deferred tax asset (+) /liability (−) −207,385 −7,271 −3,909 −2,862 −658 −222,085
Tangible and intangible fixed assets −229,539 −6,801 − −2,862 391 −238,811
Financial assets − − − − − −
Receivables −7,468 −1,231 − − 3 −8,696
Liabilities 18,230 −1,328 −74 − −2,770 14,058
Provisions 11,252 1,919 − − 1,806 14,977
Tax losses carried forward 4 152 − − −8 148
Hedging derivates 136 18 −3,835 − −80 −3,761
*The Group used post-acquisition accounting within 12 months period as allowed by IFRS to finalize purchase price allocation related to acquisition of NEUROSOFT S.A.. For more details see 2 (i).
The Group has unrecognised deferred tax assets, in accordance with the accounting policy 3u), as it is uncertain whether sufficient future taxable profits will be available against which they could be utilised, shown in the table below.
2018 2017
Tax losses carried forward 62,631 50,436
Total unrecognized deferred tax asset 17,650 13,880
Tax losses for which no deferred tax asset was recognised expire as follows:
2018 2017
Tax losses carried forward 62,631 50,436
Expiring within:
Between 1 and 5 years 62,582 35,325
Between 5 and 10 years − 15,111
Unlimited 49 −

85 86CONSOLIDATED ANNUAL REPORT, CONSOLIDATED FINANCIAL STATEMENTS & INDEPENDENT AUDITOR’S REPORT 2018
SAZKA Group a.s. Consolidated financial statements for the year ended 31 December 2018 (in thousands of Euro)
8. Trade and other receivablesLong-term receivables comprise advances and deposits provided that are due in more than 12 months after the reporting date.
31/12/2018 31/12/2017
Long-term receivables and other non-current assets 86,323 23,372
Long-term advances and deposits provided 3,442 1,171
Advances for pension benefits 221 221
Long-term receivables from financial derivatives 72 455
Receivables from VLT vendors 25,223 17,928
Long-term loans provided 54,842 2,928
Other long-term receivables 2,523 669
Receivables from VLT vendors are not interest bearing and the discount is immaterial.
31/12/2018 31/12/2017
Short-term trade receivables and other current assets 206,556 213,522
Short-term receivables from agents 110,127 107,640
Short-term trade receivables 38,857 28,713
Receivables from VAT and other taxes 16,919 23,905
Short-term receivables from financial derivates 6,702 11,652
Short-term loans provided 3,458 8,928
Short-term prepaid expenses 20,553 14,780
Other short-term receivables 9,940 17,904
The Group applies the IFRS 9 simplified approach to measuring expected credit losses which uses a lifetime expected loss allowance for all receivables from agents. The Group receives money from agents on weekly basis (SAZKA) or semi-weekly (OPAP). The agents in order to qualify as a POS must deposit the cash on the Group account, deposit serves as a security, which might be ofsetted against company receivables. The Group uses also direct debit to transfer the money from agents to the Group’s bank account.
Combination of above mentioned methods (very frequent payment of receivables, access to agents account and cash deposited as a security) unpaid receivables and then allowances based on ECL are immaterial.
Short-term prepaid expenses consist mainly of prepayments made to football clubs for advertising and sponsoring services according to the terms of separate contracts with each of those associations. Furthermore, it also includes prepaid consultancy fees, prepaid rent for casinos facilities and storages.
Short-term trade receivables comprise mainly trade receivables of non-gaming entities in the amount of EUR 26,696 thousand (31 December 2017: EUR 19,915 thousand).
9. Short-term financial assetsShort-term financial assets in the amount of EUR 15,010 thousand consist of restricted cash in the amount of EUR 13,801 thousand for the purpose of guarantees for debt services and receivable based on a cashpooling agreement EUR 1,209 thousand (31 December 2017: EUR 8,908 thousand).
10. Cash and cash equivalents
31/12/2018 31/12/2017
Cash and cash equivalents 312,678 410,288
Bank accounts 217,503 267,624
Fixed-term deposits 90,489 131,281
Cash in hand 4,686 11,383
As at 31 December 2018, the Group has pledged bank accounts with a total balance of EUR 39,756 thousand (31 December 2017: EUR 31,538 thousand) under various borrowing facilities.
11. New acquisitionsIn 2018 the Group acquired interest in the following companies or group of companies:
Company Ownership interest Acquisition date Purchase price in th. EUR
SUPER SPORT d.o.o. sub-group (1) 67% 26 April 2018
Minus5 d.o.o. 51% 26 April 2018
Total 334,496
(1) SUPER SPORT d.o.o. sub-group was acquired on 26 April 2018. On 26 April SUPER SPORT d.o.o. acquired Puni broj d.o.o. (see Note 1.3). Consideration paid for SUPER SPORT d.o.o. sub-group includes variable parts that can change in time.
As at 31 December 2017 the company Medial Beteiligungs-GmbH (including all its investments) was accounted for using the equity method. During 2018 the Group acquired additional share of 70.03% which was considered as a step-up acquisition without change of control (see Note 6).

87 88CONSOLIDATED ANNUAL REPORT, CONSOLIDATED FINANCIAL STATEMENTS & INDEPENDENT AUDITOR’S REPORT 2018
SAZKA Group a.s. Consolidated financial statements for the year ended 31 December 2018 (in thousands of Euro)
The acquisitions of investments had the following effect on the Group:
Recognised values on acquisition
SUPER SPORT d.o.o. sub-group
Minus5 d.o.o. Total
Tangible fixed assets 2,140 29 2,169
Brands 55,268 − 55,268
Licenses 18 4 22
Other intangible assets 93 − 93
Short-term receivables 4,201 145 4,346
Cash and cash equivalents 20,500 138 20,638
Other current assets 338 − 338
Deffered tax liability −9,948 − −9,948
Other current liabilities −9,614 −75 −9,689
Net identifiable assets and liabilities 62,996 241 63,237
Goodwill (Note 4)* 291,494 672 292,166
Non-controlling interest acquired −20,789 −118 −20,907
Consideration** 333,701 795 334,496
Consideration paid, satisfied in cash 220,758 795 221,553
Cash acquired −20,500 −138 −20,638
Cash outflow in 2018 200,258 657 200,915
*subject to ongoing acquisition accounting
**Deferred consideration of EUR 92,444 thousand represents a fair value of a liability payable in 2021. The consideration of EUR 20,499 thousand represents the fair value of a contingent consideration payable also in 2021 which is subject to potential change based on a financial performance of the acquired entity. The fair value was estimated by calculating the present value of the future expected cash flows. The estimates are based on a discount rate of 4.35% and assumed probability-adjusted sales of SUPER SPORT d.o.o.
Given the fact that the acquisition accounting is considered incomplete, the Group recognized provisional goodwill due to the pending finalisation of the fair valuation of the acquired intangible assets.
The Group is presenting below the significant assumptions and judgements for each type of assets and liabilities and recognition of following assets and liabilities at fair value at the acquisition date:
• Newly identifiable intangible asset was recognized referring to an internally generated brand (SuperSport). In order to determine the fair value of the brand, the income approach, i.e. relief from royalty method, was applied. This method assumes the fair value of brand is represented by present value of hypothetical royalty fee saved, which would otherwise be paid in the form of licence fee to the licensor. The royalty rate of 5% was applied. Financial projections were performed based on business plans covering a period of five years, followed by a perpetuity, which was used to calculate terminal value. For the calculation of terminal value, the terminal growth model was chosen. Net royalties after tax were discounted using the weighted average cost of capital (WACC) with an uplift of 1%p. The brand was valued at EUR 55,268 thousand.
• The brand was determined as an intangible asset with an indefinite useful life grounded by its establishment in the market and its significant contributions to the business. The Group will perform impairment testing of the brand annually in line with the Group’s policy (see also Note 4).
• Deferred tax liability of EUR 9,948 thousand resulting from the recognition of the brand was recognized. The corporate income tax rate of 18% valid in Croatia was used.
• All of SuperSport’s licences were acquired in the past from the Croatia government at a determined price and for a limited time, with pre-negotiated renewal. The licences are therefore amortised and regularly tested for impairment. As the value of the licences is regularly reviewed, the management considers the book values being approximate for the fair values at acquisition and therefore no revaluation of licences was performed at the acquisition date.
• The Group did not identify any other identifiable intangible assets or liabilities assumed to be recognized. Furthermore, all other acquired assets and liabilities were considered as adequate (the values are approximate to fair values) and are in line with the Group accounting policies and therefore no revaluation adjustment would be required.
Goodwill which was recognized separately as a result of the acquisition is attributable mainly to synergies between operating business of the Group and the acquiree and the value of intangibles not meeting the criteria for recognition, subsumed in the goodwill. Goodwill from the acquisition is not deductible for tax purposes.
The Group revised the acquisitions accounting as at the date of the financial statements and no changes from Purchase Price Allocation analysis were identified.
The acquisition of SuperSport supported the Group’s long term expansion strategy. The acquisition will allow the Group to strengthen its market position and expand further in the lottery and betting industry.
For the period from April to December 2018 SUPER SPORT d.o.o. sub-group contributed consolidated NGR of EUR 70,099 thousand and consolidated profit for the period after tax of EUR 36,809 thousand to the Group’s result. If the acquisition had occurred on 1 January 2018, management estimates that consolidated NGR would have been higher by EUR 30 719 thousand and consolidated profit for the period after tax would have been higher by EUR 20,063 thousand. In determining these amounts, management has assumed that the fair value adjustments, determined provisionally, that arose on the date of acquisition would have been the same as if the acquisition had occurred on 1 January 2018.
For the December 2018 period Minus5 d.o.o. contributed consolidated profit for the period after tax of EUR 128 thousand. If the acquisition had occurred on 1 January 2018, the Group assumes that the impact on consolidated profit would have been immaterial.
In 2017 the Group acquired interest in the following companies or group of companies:
Company Ownership interest
Acquisition date
Purchase price in th. EUR
Fsázky a.s. (1) 100% 23 May 2017
Sazka Distribution Vietnam Joint Stock Company 90% 28 June 2017
Neurosoft S.A. (2) 38.19% 2 August 2017
SAZKA Group Financing a.s 100% 18 October 2017
SAZKA Group Russia LLC 100% 29 August 2017
Total 51,113
(1) Fsázky a.s. was acquired on 23 May 2017. Effective from 1 December 2017 the company merged with Sazka a.s. (see Note 1.3).
(2) The Group owned 29.53% share in Neurosoft S.A. as at 31 December 2016. On 2 August 2017, the Group acquired additional stake of 38.19% in this company and from that date Neurosoft S.A. is fully consolidated (see Note 1.3). The share in the losses of the associate NEUROSOFT S.A. recognized by the Group for the period 1 January 2017 – 31 July 2017 amounted to EUR 267 thousand.
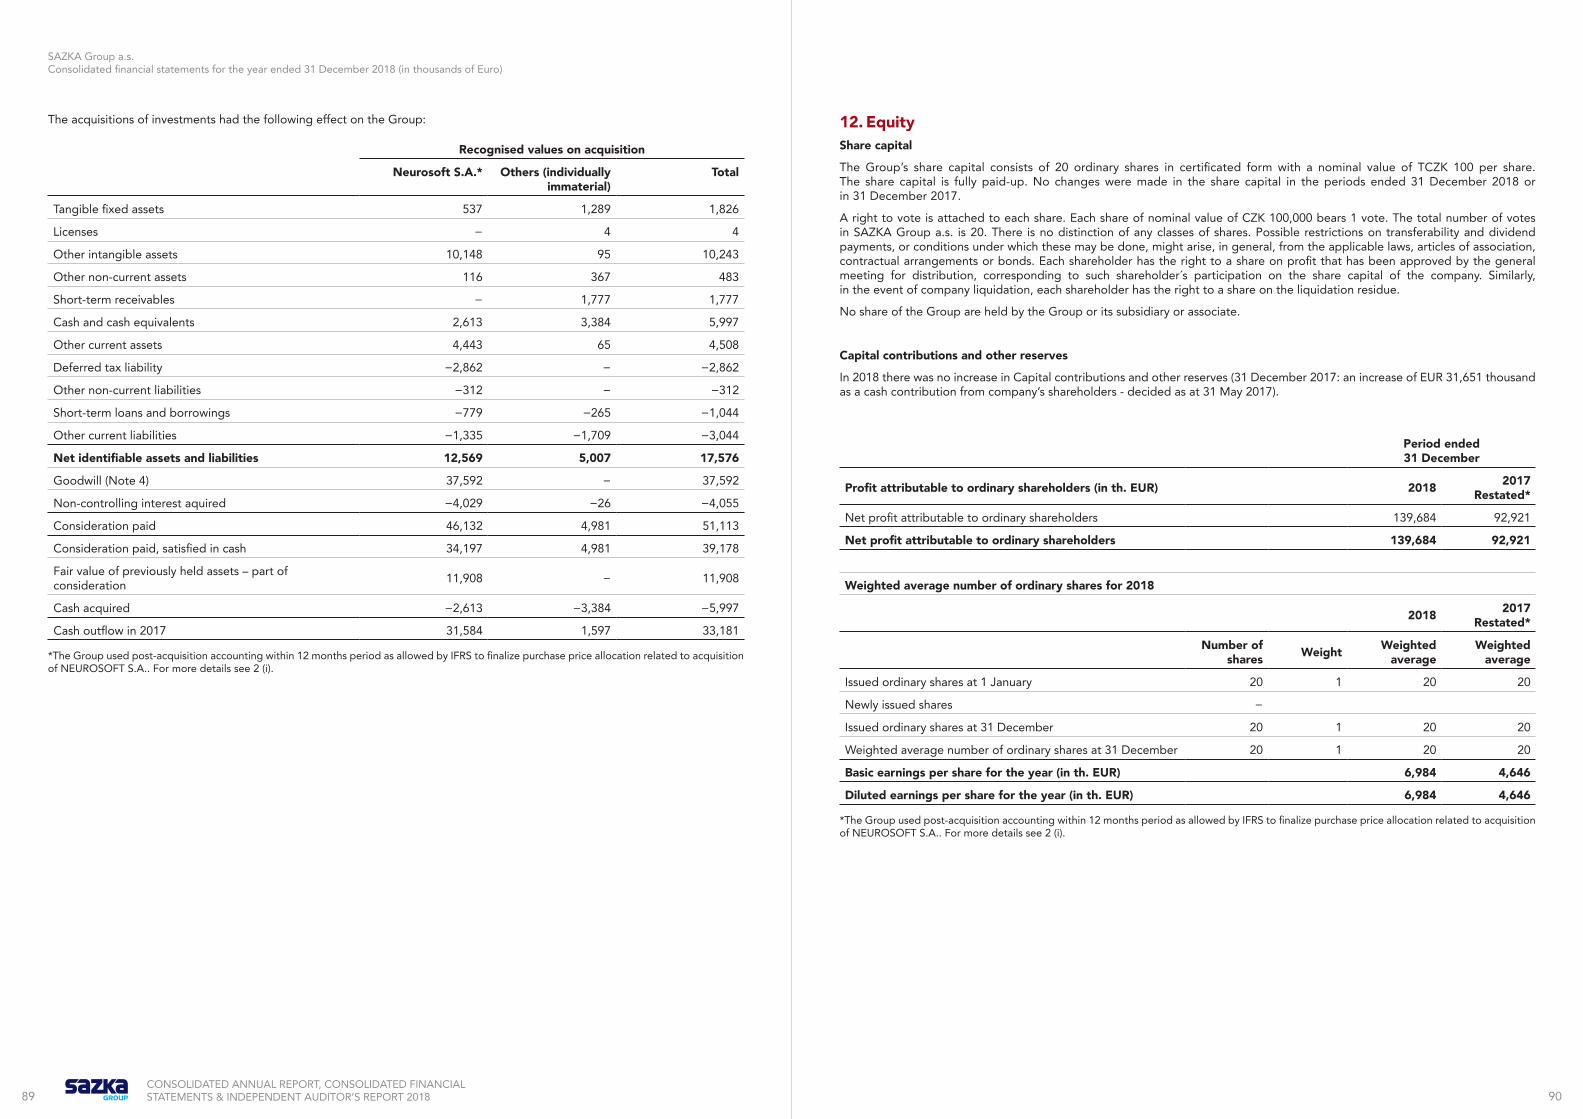
89 90CONSOLIDATED ANNUAL REPORT, CONSOLIDATED FINANCIAL STATEMENTS & INDEPENDENT AUDITOR’S REPORT 2018
SAZKA Group a.s. Consolidated financial statements for the year ended 31 December 2018 (in thousands of Euro)
The acquisitions of investments had the following effect on the Group:
Recognised values on acquisition
Neurosoft S.A.* Others (individually immaterial)
Total
Tangible fixed assets 537 1,289 1,826
Licenses − 4 4
Other intangible assets 10,148 95 10,243
Other non-current assets 116 367 483
Short-term receivables − 1,777 1,777
Cash and cash equivalents 2,613 3,384 5,997
Other current assets 4,443 65 4,508
Deferred tax liability −2,862 − −2,862
Other non-current liabilities −312 − −312
Short-term loans and borrowings −779 −265 −1,044
Other current liabilities −1,335 −1,709 −3,044
Net identifiable assets and liabilities 12,569 5,007 17,576
Goodwill (Note 4) 37,592 − 37,592
Non-controlling interest aquired −4,029 −26 −4,055
Consideration paid 46,132 4,981 51,113
Consideration paid, satisfied in cash 34,197 4,981 39,178
Fair value of previously held assets – part of consideration 11,908 − 11,908
Cash acquired −2,613 −3,384 −5,997
Cash outflow in 2017 31,584 1,597 33,181
*The Group used post-acquisition accounting within 12 months period as allowed by IFRS to finalize purchase price allocation related to acquisition of NEUROSOFT S.A.. For more details see 2 (i).
12. EquityShare capital
The Group’s share capital consists of 20 ordinary shares in certificated form with a nominal value of TCZK 100 per share. The share capital is fully paid-up. No changes were made in the share capital in the periods ended 31 December 2018 or in 31 December 2017.
A right to vote is attached to each share. Each share of nominal value of CZK 100,000 bears 1 vote. The total number of votes in SAZKA Group a.s. is 20. There is no distinction of any classes of shares. Possible restrictions on transferability and dividend payments, or conditions under which these may be done, might arise, in general, from the applicable laws, articles of association, contractual arrangements or bonds. Each shareholder has the right to a share on profit that has been approved by the general meeting for distribution, corresponding to such shareholder´s participation on the share capital of the company. Similarly, in the event of company liquidation, each shareholder has the right to a share on the liquidation residue.
No share of the Group are held by the Group or its subsidiary or associate.
Capital contributions and other reserves
In 2018 there was no increase in Capital contributions and other reserves (31 December 2017: an increase of EUR 31,651 thousand as a cash contribution from company’s shareholders - decided as at 31 May 2017).
Period ended 31 December
Profit attributable to ordinary shareholders (in th. EUR) 2018 2017 Restated*
Net profit attributable to ordinary shareholders 139,684 92,921
Net profit attributable to ordinary shareholders 139,684 92,921
Weighted average number of ordinary shares for 2018
2018 2017 Restated*
Number of shares Weight Weighted
averageWeighted
average
Issued ordinary shares at 1 January 20 1 20 20
Newly issued shares −
Issued ordinary shares at 31 December 20 1 20 20
Weighted average number of ordinary shares at 31 December 20 1 20 20
Basic earnings per share for the year (in th. EUR) 6,984 4,646
Diluted earnings per share for the year (in th. EUR) 6,984 4,646
*The Group used post-acquisition accounting within 12 months period as allowed by IFRS to finalize purchase price allocation related to acquisition of NEUROSOFT S.A.. For more details see 2 (i).

91 92CONSOLIDATED ANNUAL REPORT, CONSOLIDATED FINANCIAL STATEMENTS & INDEPENDENT AUDITOR’S REPORT 2018
SAZKA Group a.s. Consolidated financial statements for the year ended 31 December 2018 (in thousands of Euro)
13. Non-controlling interestsThe Group´s non-controlling interests amount to EUR 961,960 thousand as of 31 December 2018 and relate mainly to OPAP S.A. sub-group with non-controlling interest 67% (including 33% non-controlling interest in its subsidiary HELLENIC LOTTERIES S.A. i.e. EUR 32,755 thousand and 32.28% non-controlling interest in its subsidiary Neurosoft S.A. i.e. EUR 4,026 thousand), where the Group has an economic interest of 33% on its equity.
Other non-controlling interests represent 28.13% on equity of the whole Emma Delta Management Ltd sub-group, 33% on equity of SUPER SPORT d.o.o. sub-group and 49% on equity of Minus5 d.o.o.
The reconciliation of non-controlling interest is presented in table below:
OPAP S.A. sub−group
SUPER SPORT sub−group
Others (individually immaterial)
Non-current assets 2,093,068 57,808
Current assets 381,218 44,557
Non-current liabilities −905,426 −9,963
Current liabilities −295,024 −12,743
Sub-group's non-controlling interest 36,782 −
Net assets attributable to the Group 1,237,054 79,659
Non-controlling interest percentage 67.00% 33.00%
Non-controlling interest calculation 828,826 26,287
Sub-group's non-controlling interest entering into consolidation 36,782
Carrying amount of non-controlling interest 865,608 26,287 70,065*
Net gaming revenue 1,039,935 70,099
Profit 143,251 36,809
Other comprehensive income −873 95
Total comprehensive income 142,378 36,904
Non-controlling interest percentage 67.00% 33.00%
Profit allocated to non-controlling interest 95,978 12,147
Share of profit of sub-group's non-controlling interest entering into consolidation 1,988
Share of other comprehensive income of sub-group's non-controlling interest entering into consolidation 4 32
Total comprehensive income attributable to non-controlling interest 97,970 12,179 11,536
Summarized cash flow information for the year
Net cash from operating activities 253,109 60,740
Cash flows used in investing activities −109,315 −915
Net cash from financing activities −198,441 −20,241
Net inflow / outflow (−) of cash and cash equivalents for the year −54,647 39,584 9,134
*Carrying amount of other non-controlling interest is mainly derived from Emma Delta Management sub-group which holds shares in OPAP S.A. and acquisition margin loan. As a result, net assets of Emma Delta Management sub-group consist mainly of further diluted net assets from OPAP S.A. and respective margin loan.
For dividends paid to NCI during the year refer to statement of cashflow.
The Group´s non-controlling interests amount to EUR 929,072 thousand as of 31 December 2017 and relate mainly to OPAP S.A. sub-group and represent 71.86% on its equity (including 33% non-controlling interest in its subsidiary HELLENIC LOTTERIES S.A. i.e. EUR 40,630 thousand and 32.28% non-controlling interest in its subsidiary Neurosoft S.A. i.e. EUR 4,122 thousand*). Further non-controlling interests represent 28.14% on equity of the whole Emma Delta Management Ltd sub-group.
The reconciliation of non-controlling interest is presented in table below:
OPAP S.A. sub-group
Others (individually immaterial)
Non-current assets 2,082,248
Current assets 440,383
Non-current liabilities −767,001
Current liabilities −481,807
Sub-group's non-controlling interest 44,752
Net assets attributable to the Group 1,229,071
Non-controlling interest percentage 67.00%
Non-controlling interest calculation 823,478
Sub-group's non-controlling interest entering into consolidation 44,752
Carrying amount of non-controlling interest 868,230 60,842*
Net gaming revenue 972,936
Profit 126,162
Other comprehensive income −22
Total comprehensive income 126,140
Non-controlling interest percentage 67.00%
Profit allocated to non-controlling interest 84,529
Share of profit of sub-group's non-controlling interest entering into consolidation 5,387
Share of other comprehensive income of sub-group's non-controlling interest entering into consolidation 36
Total comprehensive income attributable to non-controlling interest 89,952 6,623
Summarized cash flow information for the year
Net cash from operating activities 244,892
Cash flows used in investing activities −123,769
Net cash from financing activities −148,545
Net inflow / outflow (-) of cash and cash equivalents for the year −27,422 −32,631
*Carrying amount of other non-controlling interest is mainly derived from Emma Delta Management sub-group which holds shares in OPAP S.A. and acquisition margin loan. As a result, net assets of Emma Delta Management sub-group consist mainly of further diluted net assets from OPAP S.A. and respective margin loan.
**The Group used post-acquisition accounting within 12 months period as allowed by IFRS to finalize purchase price allocation related to acquisition of NEUROSOFT S.A.. For more details see 2 (i).
For dividends paid to NCI during the year refer to statement of cashflow.
**
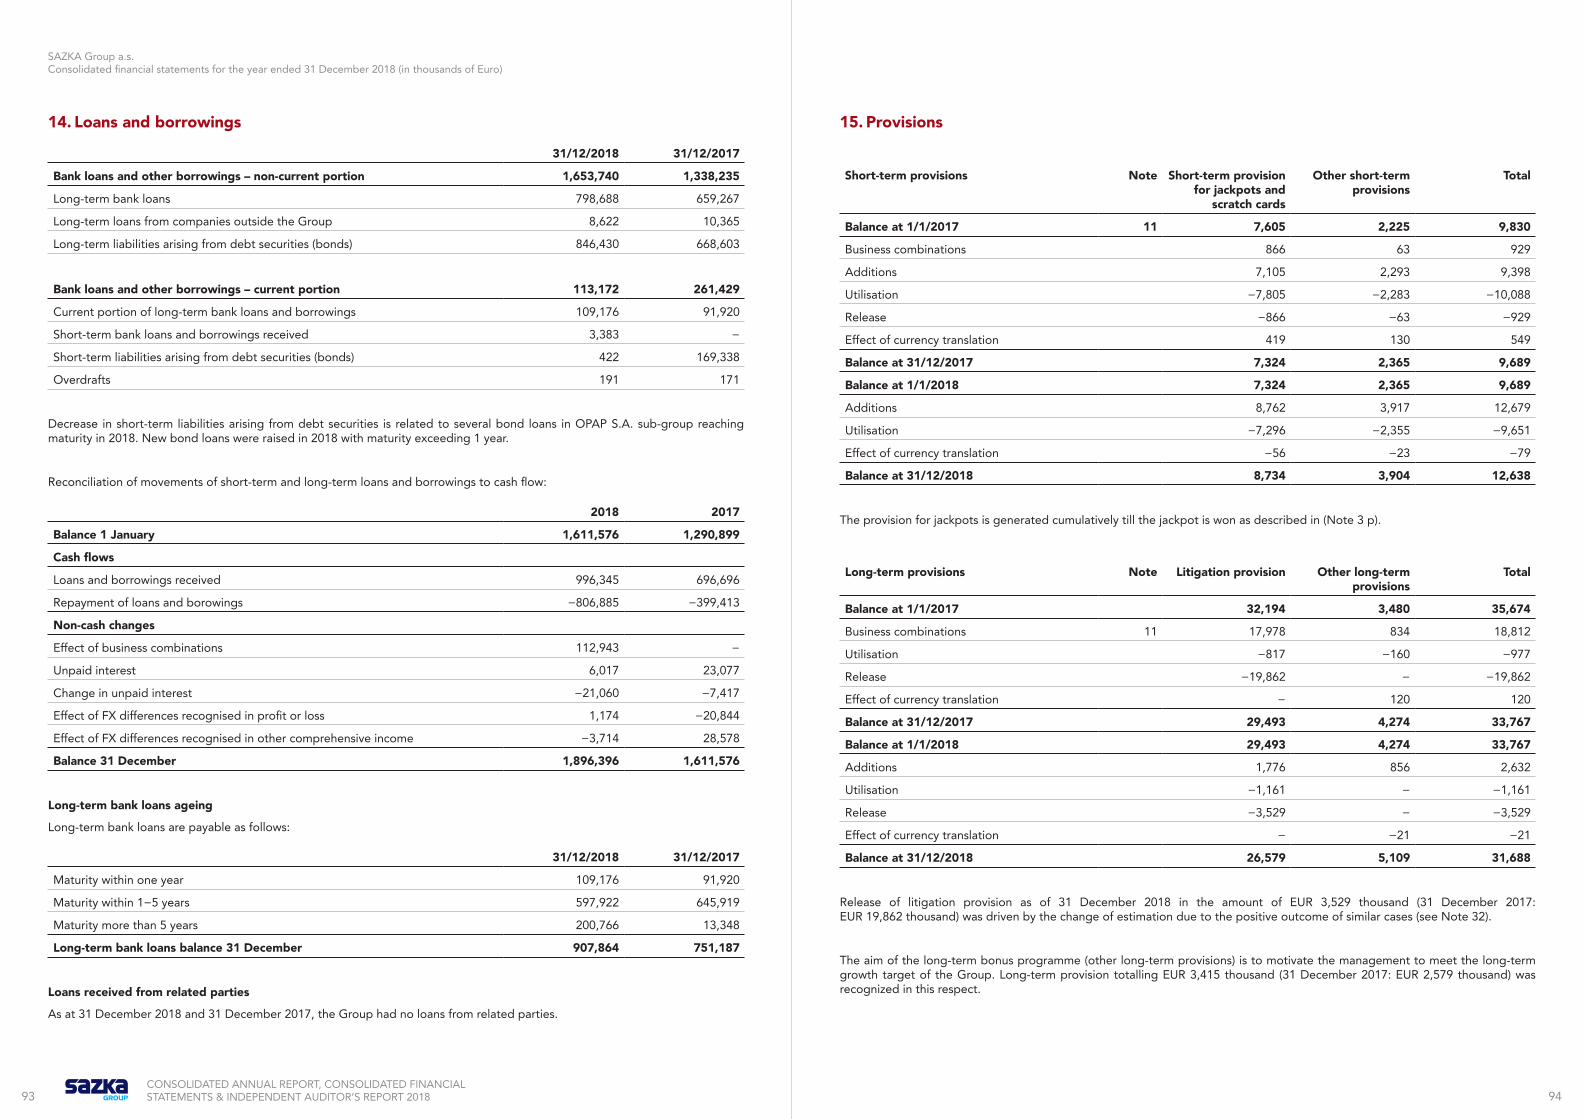
93 94CONSOLIDATED ANNUAL REPORT, CONSOLIDATED FINANCIAL STATEMENTS & INDEPENDENT AUDITOR’S REPORT 2018
SAZKA Group a.s. Consolidated financial statements for the year ended 31 December 2018 (in thousands of Euro)
14. Loans and borrowings
31/12/2018 31/12/2017
Bank loans and other borrowings – non-current portion 1,653,740 1,338,235
Long-term bank loans 798,688 659,267
Long-term loans from companies outside the Group 8,622 10,365
Long-term liabilities arising from debt securities (bonds) 846,430 668,603
Bank loans and other borrowings – current portion 113,172 261,429
Current portion of long-term bank loans and borrowings 109,176 91,920
Short-term bank loans and borrowings received 3,383 −
Short-term liabilities arising from debt securities (bonds) 422 169,338
Overdrafts 191 171
Decrease in short-term liabilities arising from debt securities is related to several bond loans in OPAP S.A. sub-group reaching maturity in 2018. New bond loans were raised in 2018 with maturity exceeding 1 year.
Reconciliation of movements of short-term and long-term loans and borrowings to cash flow:
2018 2017
Balance 1 January 1,611,576 1,290,899
Cash flows
Loans and borrowings received 996,345 696,696
Repayment of loans and borowings −806,885 −399,413
Non-cash changes
Effect of business combinations 112,943 −
Unpaid interest 6,017 23,077
Change in unpaid interest −21,060 −7,417
Effect of FX differences recognised in profit or loss 1,174 −20,844
Effect of FX differences recognised in other comprehensive income −3,714 28,578
Balance 31 December 1,896,396 1,611,576
Long-term bank loans ageing
Long-term bank loans are payable as follows:
31/12/2018 31/12/2017
Maturity within one year 109,176 91,920
Maturity within 1−5 years 597,922 645,919
Maturity more than 5 years 200,766 13,348
Long-term bank loans balance 31 December 907,864 751,187
Loans received from related parties
As at 31 December 2018 and 31 December 2017, the Group had no loans from related parties.
15. Provisions
Short-term provisions Note Short-term provision for jackpots and
scratch cards
Other short-term provisions
Total
Balance at 1/1/2017 11 7,605 2,225 9,830
Business combinations 866 63 929
Additions 7,105 2,293 9,398
Utilisation −7,805 −2,283 −10,088
Release −866 −63 −929
Effect of currency translation 419 130 549
Balance at 31/12/2017 7,324 2,365 9,689
Balance at 1/1/2018 7,324 2,365 9,689
Additions 8,762 3,917 12,679
Utilisation −7,296 −2,355 −9,651
Effect of currency translation −56 −23 −79
Balance at 31/12/2018 8,734 3,904 12,638
The provision for jackpots is generated cumulatively till the jackpot is won as described in (Note 3 p).
Long-term provisions Note Litigation provision Other long-term provisions
Total
Balance at 1/1/2017 32,194 3,480 35,674
Business combinations 11 17,978 834 18,812
Utilisation −817 −160 −977
Release −19,862 − −19,862
Effect of currency translation − 120 120
Balance at 31/12/2017 29,493 4,274 33,767
Balance at 1/1/2018 29,493 4,274 33,767
Additions 1,776 856 2,632
Utilisation −1,161 − −1,161
Release −3,529 − −3,529
Effect of currency translation − −21 −21
Balance at 31/12/2018 26,579 5,109 31,688
Release of litigation provision as of 31 December 2018 in the amount of EUR 3,529 thousand (31 December 2017: EUR 19,862 thousand) was driven by the change of estimation due to the positive outcome of similar cases (see Note 32).
The aim of the long-term bonus programme (other long-term provisions) is to motivate the management to meet the long-term growth target of the Group. Long-term provision totalling EUR 3,415 thousand (31 December 2017: EUR 2,579 thousand) was recognized in this respect.
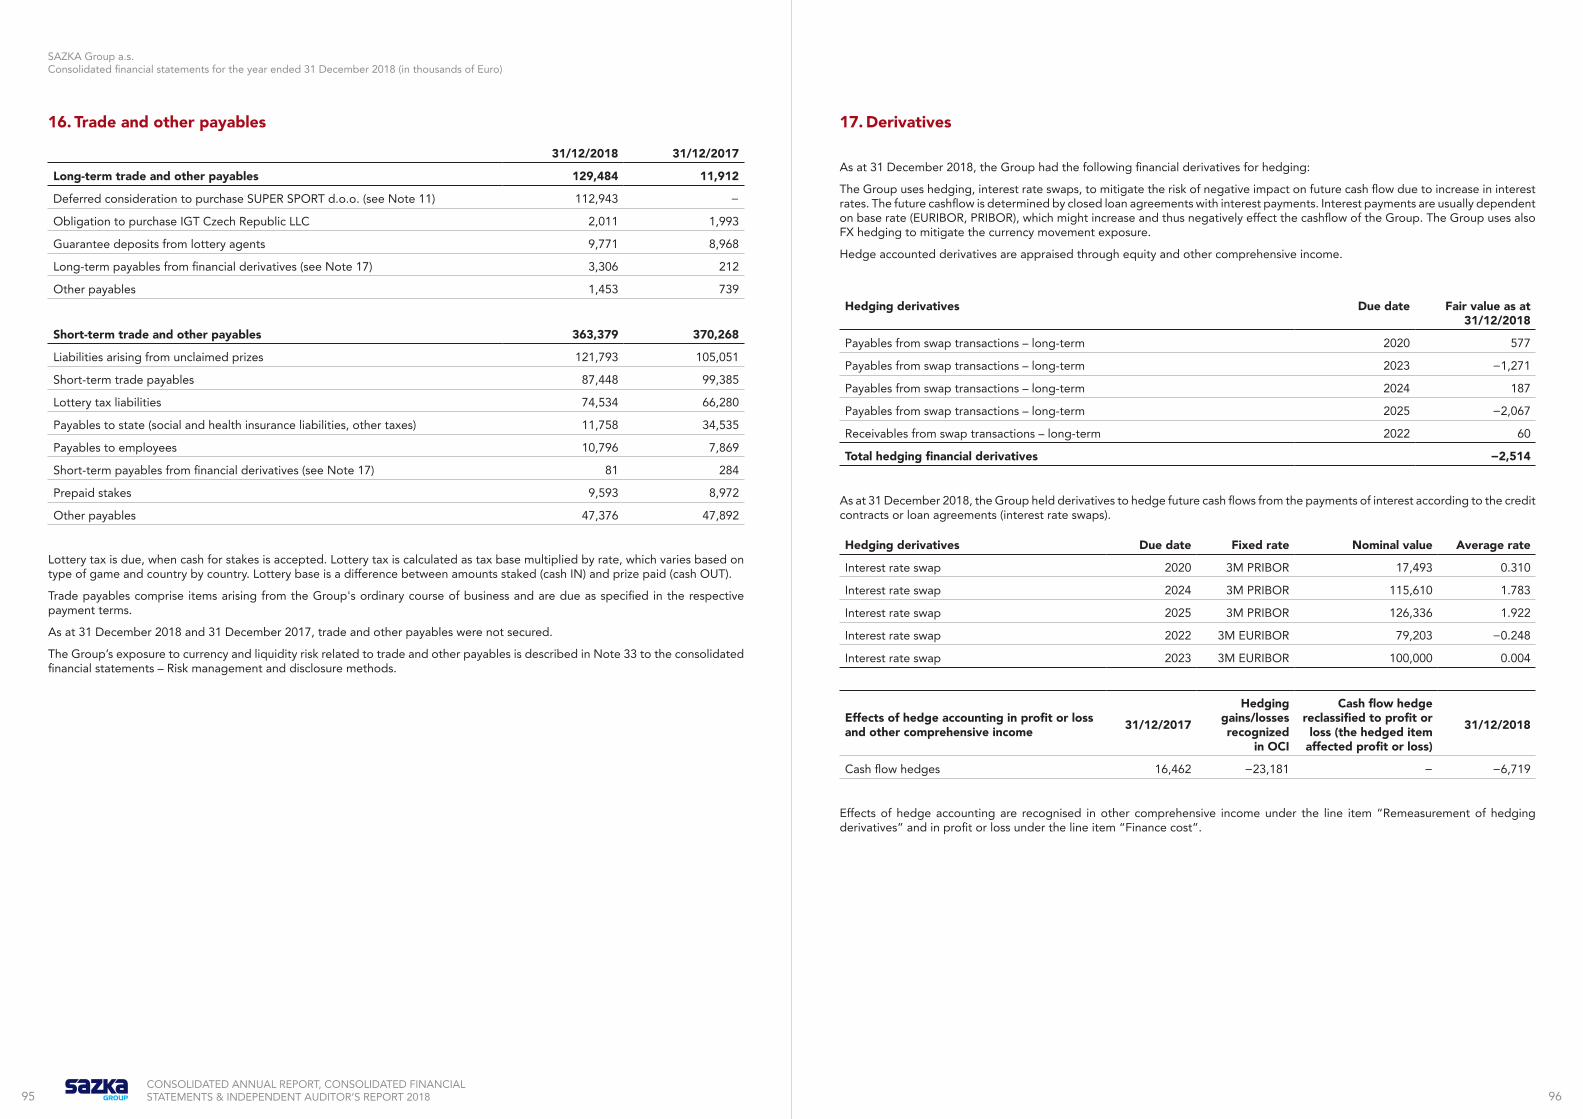
95 96CONSOLIDATED ANNUAL REPORT, CONSOLIDATED FINANCIAL STATEMENTS & INDEPENDENT AUDITOR’S REPORT 2018
SAZKA Group a.s. Consolidated financial statements for the year ended 31 December 2018 (in thousands of Euro)
16. Trade and other payables
31/12/2018 31/12/2017
Long-term trade and other payables 129,484 11,912
Deferred consideration to purchase SUPER SPORT d.o.o. (see Note 11) 112,943 −
Obligation to purchase IGT Czech Republic LLC 2,011 1,993
Guarantee deposits from lottery agents 9,771 8,968
Long-term payables from financial derivatives (see Note 17) 3,306 212
Other payables 1,453 739
Short-term trade and other payables 363,379 370,268
Liabilities arising from unclaimed prizes 121,793 105,051
Short-term trade payables 87,448 99,385
Lottery tax liabilities 74,534 66,280
Payables to state (social and health insurance liabilities, other taxes) 11,758 34,535
Payables to employees 10,796 7,869
Short-term payables from financial derivatives (see Note 17) 81 284
Prepaid stakes 9,593 8,972
Other payables 47,376 47,892
Lottery tax is due, when cash for stakes is accepted. Lottery tax is calculated as tax base multiplied by rate, which varies based on type of game and country by country. Lottery base is a difference between amounts staked (cash IN) and prize paid (cash OUT).
Trade payables comprise items arising from the Group's ordinary course of business and are due as specified in the respective payment terms.
As at 31 December 2018 and 31 December 2017, trade and other payables were not secured.
The Group’s exposure to currency and liquidity risk related to trade and other payables is described in Note 33 to the consolidated financial statements – Risk management and disclosure methods.
17. Derivatives
As at 31 December 2018, the Group had the following financial derivatives for hedging:
The Group uses hedging, interest rate swaps, to mitigate the risk of negative impact on future cash flow due to increase in interest rates. The future cashflow is determined by closed loan agreements with interest payments. Interest payments are usually dependent on base rate (EURIBOR, PRIBOR), which might increase and thus negatively effect the cashflow of the Group. The Group uses also FX hedging to mitigate the currency movement exposure.
Hedge accounted derivatives are appraised through equity and other comprehensive income.
Hedging derivatives Due date Fair value as at 31/12/2018
Payables from swap transactions – long-term 2020 577
Payables from swap transactions – long-term 2023 −1,271
Payables from swap transactions – long-term 2024 187
Payables from swap transactions – long-term 2025 −2,067
Receivables from swap transactions – long-term 2022 60
Total hedging financial derivatives −2,514
As at 31 December 2018, the Group held derivatives to hedge future cash flows from the payments of interest according to the credit contracts or loan agreements (interest rate swaps).
Hedging derivatives Due date Fixed rate Nominal value Average rate
Interest rate swap 2020 3M PRIBOR 17,493 0.310
Interest rate swap 2024 3M PRIBOR 115,610 1.783
Interest rate swap 2025 3M PRIBOR 126,336 1.922
Interest rate swap 2022 3M EURIBOR 79,203 −0.248
Interest rate swap 2023 3M EURIBOR 100,000 0.004
Effects of hedge accounting in profit or loss and other comprehensive income 31/12/2017
Hedging gains/losses recognized
in OCI
Cash flow hedge reclassified to profit or loss (the hedged item
affected profit or loss)
31/12/2018
Cash flow hedges 16,462 −23,181 − −6,719
Effects of hedge accounting are recognised in other comprehensive income under the line item “Remeasurement of hedging derivatives” and in profit or loss under the line item “Finance cost”.

97 98CONSOLIDATED ANNUAL REPORT, CONSOLIDATED FINANCIAL STATEMENTS & INDEPENDENT AUDITOR’S REPORT 2018
SAZKA Group a.s. Consolidated financial statements for the year ended 31 December 2018 (in thousands of Euro)
As at 31 December 2018, the Group had the following financial derivatives for trading:
Hedging derivatives Due date Fair value as at 31/12/2018
Payables from forward transactions – short-term 2019 −81
Payables from swap transactions - long-term 2021 −565
Payables from swap transactions - long-term 2022 −167
Receivables from option transactions - short-term 2019 6,702
Receivables from swap transactions - long-term 2021 12
Total trading financial derivatives 5,901
All financial derivatives were stated at fair value as at 31 December 2018 and categorised to Level 2 in the fair value hierarchy.
As at 31 December 2017, the Group had the following financial derivatives for hedging:
Hedging derivatives Due date Fair value as at 31/12/2017
Payables from swap transactions – long-term 2023 −214
Receivables from swap transactions – long-term 2022 453
Receivables from swap transactions – short-term 2018 2,852
Total hedging financial derivatives 3,091
As at 31 December 2017, the Group held derivatives to hedge future cash flows from the payments of interest according to the credit contracts or loan agreements (interest rate swaps).
Hedging derivatives Due date Fixed rate Nominal value Average rate
Interest rate swap 2020 3M PRIBOR 119,421 0.448
Interest rate swap 2022 3M EURIBOR 82,135 −0.248
Interest rate swap 2023 3M EURIBOR 100,000 0.004
Effects of hedge accounting in profit or loss and other comprehensive income 31/12/2016
Hedging gains/losses recognized
in OCI
Cash flow hedge reclassified to profit or loss (the hedged item
affected profit or loss)
31/12/2017
Cash flow hedges −754 17,216 − 16,462
Effects of hedge accounting are recognised in other comprehensive income under the line item “Remeasurement of hedging derivatives” and in profit or loss under the line item “Finance cost”.
As at 31 December 2017, the Group had the following financial derivatives for trading:
Trading derivatives Due date Fair value as at 31/12/2017
Payables from swap transactions - short-term 2018 −284
Receivables from option transactions - short-term 2018 8,800
Receivables from swap transactions - long-term 2022 2
Total trading financial derivatives 8,518
All financial derivatives were stated at fair value as at 31 December 2017 and categorised to Level 2 in the fair value hierarchy.
The Group strategy is to avoid of risk connected with negative movement in interest rates and curreny appreciation and depreciaton.
18. Revenues and Revenue from sale of goods and services
31/12/2018 31/12/2017
Amount staked 5,501,500 4,967,155
Gross gaming revenues (GGR) 1,885,706 1,664,027
Lottery Tax −582,658 −530,436
Net gaming margin* 1,303,048 1,133,591
Revenue from sale of goods and services 130,874 99,818
Sales of goods 94,934 78,758
Sales of services 35,694 20,747
Revenues from lease of real estates 246 313
* Usually referred to as Net gaming revenue (NGR)
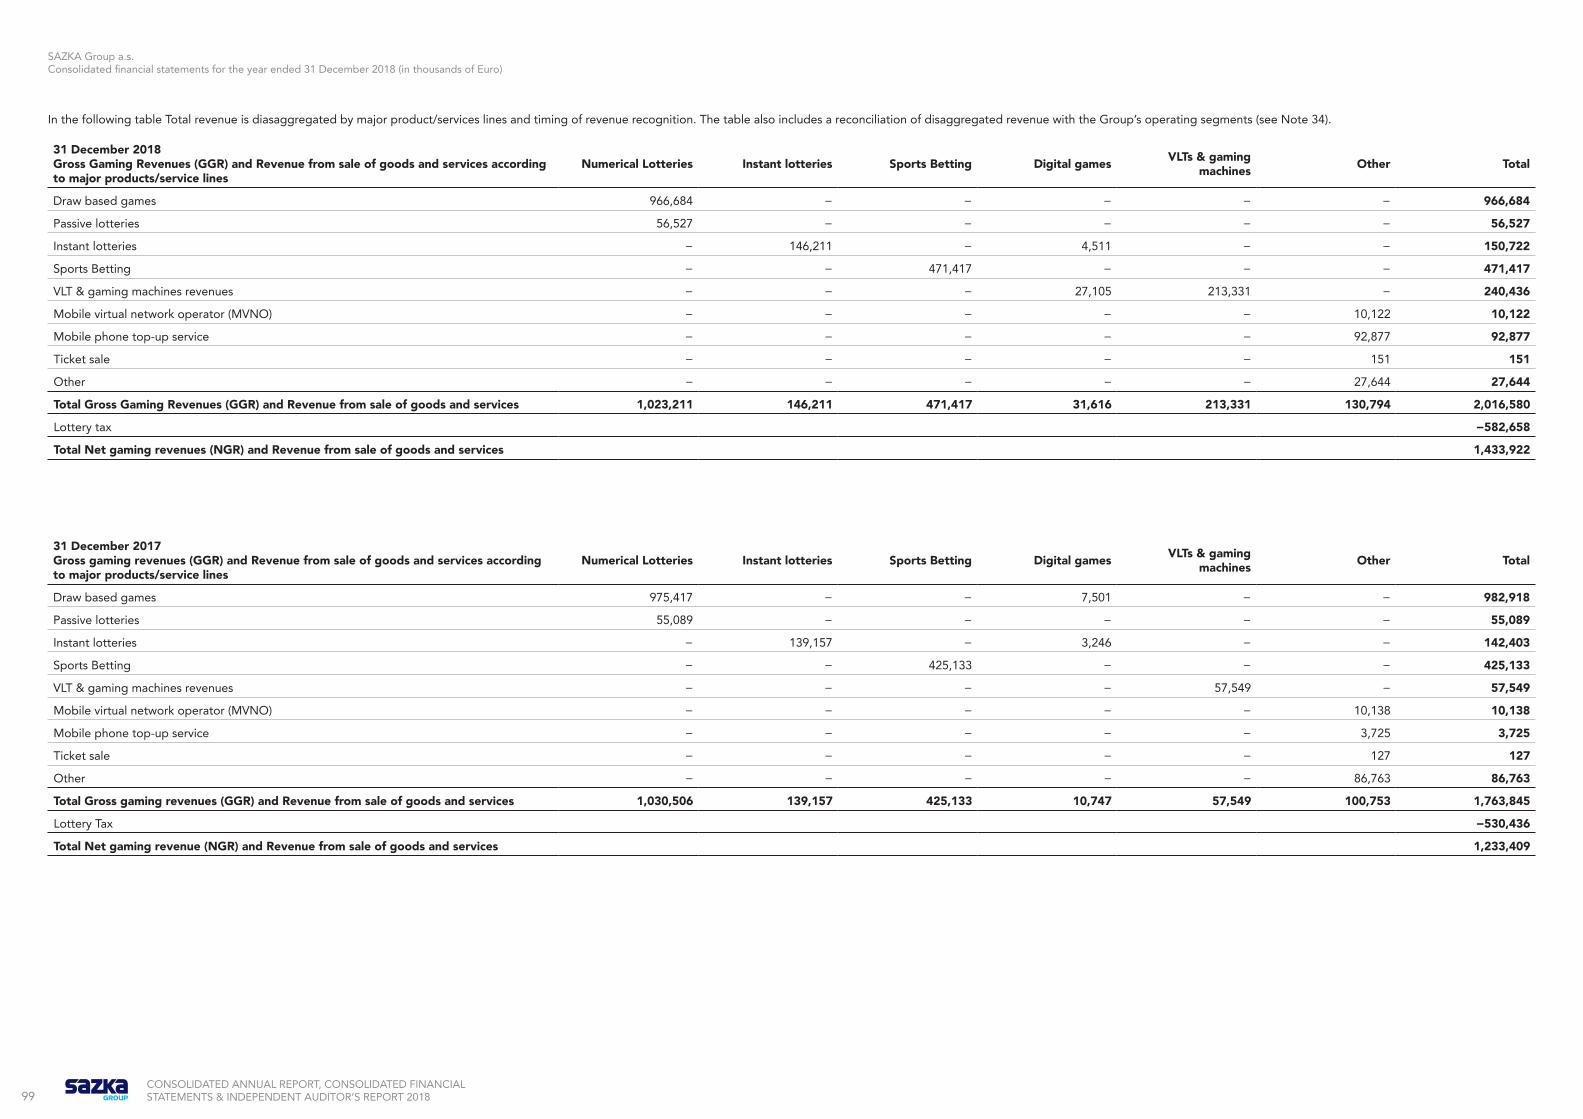
SAZKA Group a.s. Consolidated financial statements for the year ended 31 December 2018 (in thousands of Euro)
99CONSOLIDATED ANNUAL REPORT, CONSOLIDATED FINANCIAL STATEMENTS & INDEPENDENT AUDITOR’S REPORT 2018
In the following table Total revenue is diasaggregated by major product/services lines and timing of revenue recognition. The table also includes a reconciliation of disaggregated revenue with the Group’s operating segments (see Note 34).
31 December 2018 Gross Gaming Revenues (GGR) and Revenue from sale of goods and services according to major products/service lines
Numerical Lotteries Instant lotteries Sports Betting Digital games VLTs & gaming machines Other Total
Draw based games 966,684 − − − − − 966,684
Passive lotteries 56,527 − − − − − 56,527
Instant lotteries − 146,211 − 4,511 − − 150,722
Sports Betting − − 471,417 − − − 471,417
VLT & gaming machines revenues − − − 27,105 213,331 − 240,436
Mobile virtual network operator (MVNO) − − − − − 10,122 10,122
Mobile phone top-up service − − − − − 92,877 92,877
Ticket sale − − − − − 151 151
Other − − − − − 27,644 27,644
Total Gross Gaming Revenues (GGR) and Revenue from sale of goods and services 1,023,211 146,211 471,417 31,616 213,331 130,794 2,016,580
Lottery tax −582,658
Total Net gaming revenues (NGR) and Revenue from sale of goods and services 1,433,922
31 December 2017 Gross gaming revenues (GGR) and Revenue from sale of goods and services according to major products/service lines
Numerical Lotteries Instant lotteries Sports Betting Digital games VLTs & gaming machines Other Total
Draw based games 975,417 − − 7,501 − − 982,918
Passive lotteries 55,089 − − − − − 55,089
Instant lotteries − 139,157 − 3,246 − − 142,403
Sports Betting − − 425,133 − − − 425,133
VLT & gaming machines revenues − − − − 57,549 − 57,549
Mobile virtual network operator (MVNO) − − − − − 10,138 10,138
Mobile phone top-up service − − − − − 3,725 3,725
Ticket sale − − − − − 127 127
Other − − − − − 86,763 86,763
Total Gross gaming revenues (GGR) and Revenue from sale of goods and services 1,030,506 139,157 425,133 10,747 57,549 100,753 1,763,845
Lottery Tax −530,436
Total Net gaming revenue (NGR) and Revenue from sale of goods and services 1,233,409

100 101CONSOLIDATED ANNUAL REPORT, CONSOLIDATED FINANCIAL STATEMENTS & INDEPENDENT AUDITOR’S REPORT 2018
SAZKA Group a.s. Consolidated financial statements for the year ended 31 December 2018 (in thousands of Euro)
19. Other operating income
31/12/2018 31/12/2017
Other operating income 15,191 36,585
Revenue from the operating leases 3,640 2,111
Income from subsidies 522 264
Penalties and default interests 7 185
Proceeds from the sale of material 9 3
The remaining portion of operating income 11,013 34,022
The most significant amount of The remaining portion of operating income of EUR 8,660 thousand relates to income from OPAP S.A. sub-group (2017: EUR 33,208 thousand). The biggest category in 2018 is Construction of VLTs area in OPAP Stores of EUR 2,188 thousand (2017: EUR 4,762 thousand). In 2017 the most significant income was Sale of gaming halls of EUR 15,950 thousand.
20. Agents’ commissionsIn general agent’s commissions are commissions accrued to the agents for their services and they are accounted as a portion of amounts staked, GGR or NGR (depending on operating segment).
21. Materials, consumables and services
31/12/2018 31/12/2017
Materials, consumables and services −337,720 −288,069
Cost of goods sold −97,599 −76,754
Cost of IT and software services −46,099 −58,904
Advisory and other professional services −61,359 −49,636
Fees to system providers −76,310 −35,766
Materials and consumables −3,373 −23,329
Telecommunication services −10,903 −10,968
Cost of operating leases −14,827 −9,731
Scratch card production cost −6,939 −6,862
Other services −20,311 −16,119
The majority of expenses is directly related to revenue from lottery and betting activities.
An increase in materials, consumables and services is attributable to acquisition of SAZKA Group Adriatic sub-group and general increase in Fees to system providers. These represent mainly providers of software, data transfer and processing and technical support for gaming entities.
Due to introduction of new account used for scratch card production cost in 2018 as a result of improvement in mapping, total of materials, consumables and services in 2017 was increased by EUR 4,632 thousand which were reclassified from previously used Other operating expenses caption.
22. Marketing services
31/12/2018 31/12/2017
Marketing services −90,957 −95,404
Advertising −68,324 −66,701
Sponsorship and donations −22,633 −28,703
23. Personnel expenses
31/12/2018 31/12/2017
Personnel expenses −107,209 −81,564
Wages and salaries −84,577 −65,058
Social security and health insurance −17,641 −13,851
Other social expenses −2,727 −2,007
Retirement benefit costs −2,264 −648
Average number of employees in 2018 was 3,110 employees (2017: 1,660).
Overall increase in number of employees and personnel expenses in 2018 is mainly related to acquisition of SUPER SPORT d.o.o. and Minus5 d.o.o. as of 26 April 2018.
Payments to private social security funds are insignificant.
24. Other operating expenses
31/12/2018 31/12/2017
Other operating expenses −50,131 −54,984
Other taxes −13,964 −11,585
Travel expenses −4,347 −3,362
Repair and maintenance −2,342 −2,160
Fees −1,364 −1,355
Insurance premiums −1,088 −754
Loss from the sale of non-current assets −66 −71
The remaining portion of operating expenses −26,960 −35,697
The remaining portion of operating expenses primary comprises expenses related to OPAP sub-group amounting to EUR 19,560 thousand (2017: EUR 30,873 thousand). These contain mainly construction costs related to VLTs in stores, coupons for OPAP stores and bad debts totally amounting to EUR 11,790 thousand (2017: EUR 11,371 thousand). Other items include subscriptions for international organizations of EUR 1,993 thousand (2017: EUR 1,346 thousand) and prizes for horse races of EUR 946 thousand (2017: EUR 1,202 thousand). Other items are individually immaterial.
Due to introduction of new account used for scratch card production cost in 2018 as a result of improvement in mapping, total of materials, consumables and services in 2017 was increased by EUR 4,632 thousand which were reclassified from previously used Other operating expenses caption.

102 103CONSOLIDATED ANNUAL REPORT, CONSOLIDATED FINANCIAL STATEMENTS & INDEPENDENT AUDITOR’S REPORT 2018
SAZKA Group a.s. Consolidated financial statements for the year ended 31 December 2018 (in thousands of Euro)
25. Share of profit equity method investees
31/12/2018 31/12/2017
Share of profit equity method investees (net of tax) 101,297 73,758
As at 31 December 2018 the Group has significant influence in associated companies Casinos Austria AG, LTB Beteiligungs GmbH, CLS Beteiligungs GmbH, and LOTTOITALIA S.r.l., as described in Note 6. None of these companies is publicly traded.
26. Operating EBITDAThe Directors of the Group have presented the performance measure operating EBITDA as they monitor this performance measure at a consolidated level. Operating EBITDA is not a defined performance measure in IFRS.
Operating EBITDA is calculated as profit for the period before income tax expense, other financial costs/income, interest expense, interest income and depreciation and amortization.
27. Depreciation and amortization
31/12/2018 31/12/2017 Restated*
Depreciation and amortization −118,905 −95,300
Depreciation of property, plant and equipment incl. investment property −22,424 −16,339
Amortisation of intangible assets −78,940 −77,764
Impairment of property, plant and equipment − −1,197
Impairment of intangible assets −41 −
Impairment of goodwill −17,500 −
*The Group used post-acquisition accounting within 12 months period as allowed by IFRS to finalize purchase price allocation related to acquisition of NEUROSOFT S.A.. For more details see 2 (i).
28. Interest income, finance income and finance costs
31/12/2018 31/12/2017
Interest income 3,155 2,937
Interest income from loans 2,230 2,931
Income from bonds 925 6
Finance income 2,016 184
Income from ownership of securities 44 34
Other finance income 1,811 150
Foreign exchange gains 161 −
Finance cost −86,134 −76,000
Interest expense −43,475 −46,579
Bond-related interest and expense −32,576 −22,831
Impairment of other assets −95 −
Foreign exchange losses − −346
Other finance expenses −9,988 −6,244
Finance costs, net −80,963 −72,879
29. Income tax expense
31/12/2018 31/12/2017 Restated*
Income tax expense −90,293 −69,525
Current income tax −88,214 −62,254
Deferred income tax −2,079 −7,271
*The Group used post-acquisition accounting within 12 months period as allowed by IFRS to finalize purchase price allocation related to acquisition of NEUROSOFT S.A.. For more details see 2 (i).
Deferred tax is calculated using valid tax rates that are also expected to be valid when the asset is realised or the liability settled. The tax rates are country dependent and following local legislations.
Current income tax is calculated on the basis of the tax laws enacted, or substantively enacted, at the balance sheet date in the countries where the company and its subsidiaries operate and generate taxable income.
Current tax comprises the tax estimate for 2018 and adjustment to the tax estimate for 2017.
Tax rate
Corporate income tax by country/region 2018 2017
Austria 25.00% 25.00%
Croatia 18.00% 18.00%
Cyprus 12.50% 12.50%
Czech Republic 19.00% 19.00%
Greece 29.00% 29.00%
Russia 20.00% 20.00%
Slovakia 21.00% 21.00%
Vietnam 20.00% 20.00%

104 105CONSOLIDATED ANNUAL REPORT, CONSOLIDATED FINANCIAL STATEMENTS & INDEPENDENT AUDITOR’S REPORT 2018
SAZKA Group a.s. Consolidated financial statements for the year ended 31 December 2018 (in thousands of Euro)
Reconciliation of effective tax rate
2018 2017 Restated*
Profit before income tax 352,807 258,987
Income tax using the valid tax rate (a) 19.00% 67,033 19.00% 49,208
Effect of non-deductible expenses 4.72% 16,653 5.25% 13,618
Effect of non-taxable income −1.28% −4,499 −1.26% −3,255
Effect of certain income subject to a special tax rate 0.00% −7 −0.01% −24
Tax credits 0.03% 103 0.00% −
Tax relating to prior periods 0.00% − 0.10% 251
Effect of accumul. tax loss claimed in the current period 0.08% 270 0.17% 446
Effect of not recognised deferred tax assets relating to tax losses of current period 1.26% 4,453 1.69% 4,377
Effect of profit or loss of equity method investees −6.02% −21,242 −5.77% −14,961
Effect of adjustments that do not result in deferred tax 1.84% 6,478 −2.50% −6,479
Effect of different tax rate in comp. within the Group 5.97% 21,051 10.14% 26,344
Income tax expense presented in the consolidated statement of comprehensive income 25.59% 90,293 26.82% 69,525
*The Group used post-acquisition accounting within 12 months period as allowed by IFRS to finalize purchase price allocation related to acquisition of NEUROSOFT S.A.. For more details see 2 (i).
(a) 19% income tax rate was used for reconciliation since it is a domestic tax rate of parent Company.
30. Other comprehensive income/loss for the year
Items that are or may be reclassified to profit or loss: 31/12/2018 31/12/2017
Foreign currency translation differences for foreign operations 2,651 −4,724
Foreign currency translation differences for foreign operations total 2,651 −4,724
Share of OCI of equity method investments −5,542 −232
Share of OCI of equity method investments −5,542 −232
Effective portion of changes in fair value of cash flow hedges, before tax −8,373 20,297
Deferred tax 1,654 −3,835
Effective portion of changes in fair value of cash flow hedges, net of tax −6,719 16,462
Items that will not be reclassified to profit or loss:
Actuarial gain/loss - before tax −101 255
Actuarial gain/loss - deferred tax 25 −74
Actuarial gain/loss, net of tax −76 181
Other comprehensive income/(loss) for the period, net of income tax −9,686 11,687
31. Operating leasesIncome
The Group leases non-residential premises and movable assets under operating leases - see note 3(s). The lease contracts have been concluded either for a fixed term or for an indefinite period with a possibility to give a notice. In 2018, an amount of EUR 3,640 thousand (2017: EUR 2,111 thousand) was recognised as income from operating leases in the statement of comprehensive income. The income is included in Other operating income in Note 19.
The Group will receive the following income from operating lease instalments (long-term contracts only):
2018 2017
Within one year 453 729
From one to five years 2,257 2,112
In more than five years − 2,615
TOTAL 2,710 5,456
Expense
In 2018, an amount of EUR 14,827 thousand (2017: EUR 9,731 thousand) was recognized as an expense on operating leases in the statement of comprehensive income. The expenses are included in Materials, consumables and services in Note 21.
The Group is obliged to pay operating lease instalments as follows (long-term contracts only):
2018 2017
Within one year 13,996 11,678
From one to five years 43,152 38,344
In more than five years 74,849 72,981
TOTAL 131,997 123,003
32. Contingencies Legal matters
The Group estimates legal claims against OPAP S.A., for which a negative outcome is likely and therefore results in a provision, including interest, amounting to EUR 26,579 thousand (2017: EUR 29,493 thousand). Total cummulative provision is analysed below:
31/12/2018 31/12/2017
Labor disputes 5,481 7,110
Lawsuites from individuals or legal entities 21,064 22,315
Total provisions 26,544 29,425
On 24 April 2015, HORSE RACES S.A. signed a concession agreement with the Hellenic Republic Asset Development Fund (HRADF) for the 20-year exclusive license to organise and conduct horse races mutual betting. The final approval was provided by the Greek Parliament on 23 October 2015 and the operations commenced on 8 January 2016.
On May 2017, the Hellenic Republic Asset Development Fund (HRADF) filed a Request for Arbitration against HORSE RACES S.A. before the London Court of International Arbitration. The HRADF alleged that HORSE RACES S.A. had an obligation to pay 10% interest (equal to EUR 2,025 thousand) on the last instalment of the financial consideration (EUR 20,250 thousand) provided for in the Concession Agreement dated 24 April 2015.
The hearing took place on 23−24 April 2018 and the arbitral award was issued on 20 September 2018. The Tribunal ruled in favor of HORSE RACES S.A. and dismissed HRADF’s claim for an allegedly additional financial consideration of approx. EUR 2,000 thousand. HRADF was also ordered to pay all HORSE RACES S.A.’s legal costs (circa EUR 400 thousand). Since positive outcome of this claim was anticipated, no provision was booked for this claim.

106 107CONSOLIDATED ANNUAL REPORT, CONSOLIDATED FINANCIAL STATEMENTS & INDEPENDENT AUDITOR’S REPORT 2018
SAZKA Group a.s. Consolidated financial statements for the year ended 31 December 2018 (in thousands of Euro)
OPAP S.A. has also appealed to the administrative courts, awaiting the hearing, for the imposition in 2014 of additional taxes and surcharges for the fiscal year 2010 of a total amount of EUR 29,568 thousand and at the same time OPAP SERVICES S.A. has also exercised legal right against the imposition of additional taxes and surcharges totaling EUR 2,773 thousand resulting from the tax audit conducted in 2016 for the fiscal year 2012.
According to the Greek Legal Counsel, third party lawsuits against the OPAP S.A. subgroup have been filed of a total claim of EUR 138,459 thousand (2017: EUR 79,135 thousand), for which the outcome is estimated as positive for the subgroup and consequently, no provision is required.
The subsidiary SAZKA a.s. has lodged a claim against its competitor TIPSPORT a.s. for suspicion of unfair competiton practices due to resemblance of issued scratch cards to those of a subsidiary. The directors believe the general clause of unfair competition was breached, particularly the merits of risk of confusion and unfair advantage being taken of the distinctive character or repute of the subsidiary. However, the contingent asset has not been recognised as a receivable at 31 December 2018 as receipt of the amount is dependant on the outcome of the claim.
Off balance sheet items and pledged assets
Off-balance sheet assets 31/12/2018 31/12/2017
Guarantees received (bank and other guarantees) 39,666 40,947
Other − 3,500
Total 39,666 44,447
Pledged assets for the loans received by the company 31/12/2018 31/12/2017
Tangible and intangible fixed assets 94,588 94,782
Securities, shares 1,612,431 1,264,425
Bank accounts 39,756 31,538
The highest portion of pledged tangible and intangible assets represent trademarks with carrying value of EUR 72,767 thousand (2017: EUR 73,294 thousand).
The pledged securities and shares are mainly represented by (all numbers are book values):
• pledge of OPAP shares – as OPAP S.A. is a listed company on stock exchange, disclosed value of pledged shares represents the Group’s stake in OPAP S.A. amounting to EUR 799,526 thousand (2017: EUR 794,789 thousand);
• pledge of LOTTOITALIA shares and enterprise pledge – pledged value of equity method investees represents the share on equity attributable to the Group of EUR 301,538 thousand (2017: EUR 325,988 thousand);
• pledge of Medial Beteiligungs-GmbH shares (company holding participations in Casinos Austria AG without any additional economic activities – for further detail see Note 6.1) – pledged value of its equity method investees represents the share on equity attributable to the Group of EUR 225,670 thousand (2017: EUR 79,040 thousand);
• pledge of SUPER SPORT d.o.o. and Minus5 d.o.o. shares and enterprise pledge – value of pledged shares of EUR 221,554 thousand;
• pledge of SAZKA a.s. shares – value of pledged shares represents book value of the Group’s stake of EUR 64,144 thousand (2017: EUR 64,608 thousand).
33. Risk management and disclosure methods
This section elaborates in detail on the financial and operational risks the Group is exposed to and on its risk management methods. The key financial risks the Group faces comprise credit risk and liquidity risk. Since the Group is burdened with loans, interest rate risk exposure may also be deemed significant.
(a) Credit risk
i. Credit risk exposure
Credit risk represents the risk of loss that the Group companies would incur if the trading counterparty or business customer is unable to fulfil its obligation resulting from payment obligation, obligation to off-take a commodity or service at a certain price and non-delivery of contracted commodity or service.
The Group carries out business predominantly with international financial institutions. The Group follows the principle that all customers willing to carry out business under credit terms are subject to procedures for credit risk assessment. In addition, the balances of receivables are continuously monitored on individual and aggregated level.
The Group is exposed to credit risk primarily as a result of its operating (namely in relation to its trade receivables) and financing activities, including deposits with banks and financial institutions, loans provided to third parties and other financial instruments.
The maximum credit risk exposure regarding financial assets is their carrying amount (if the counterparties fail to meet all their contractual obligations and, at the same time, the guarantees and pledges provided are found to be worthless). As for cash and cash equivalents, the Group has accounts with prestigious banks, which represents minimum risk exposure.
One of key measures to mitigate the credit risk in ordinary business activities are deposits received from partners (intermediaries) see Note 8. Receivables from the partners are monitored by management on regular basis.
The maximum exposure to credit risks at the reporting date by type of counterparty and geographical region is provided in the tables below.
Credit risk by type of counterparty
At 31 December 2018 Companies
(non-financial institutions)
State, government
Financial institutions Individuals Total
Assets
Long-term trade receivables and other non-current assets 37,136 − 2,221 46,966 86,323
Short-term trade receivables and other current assets 163,046 17,381 2,885 23,244 206,556
Short-term financial assets 4,861 − 10,149 − 15,010
Current tax asset − 288 − − 288
Cash and cash equivalents 11,390 − 301,288 − 312,678
Total 216,433 17,669 316,543 70,210 620,855

108 109CONSOLIDATED ANNUAL REPORT, CONSOLIDATED FINANCIAL STATEMENTS & INDEPENDENT AUDITOR’S REPORT 2018
SAZKA Group a.s. Consolidated financial statements for the year ended 31 December 2018 (in thousands of Euro)
Credit risk by type of counterparty
At 31 December 2017Companies
(non-financial institutions)
State, government
Financial institutions Individuals Total
Assets
Long-term trade receivables and other non-current assets 22,385 − 530 457 23,372
Short-term trade receivables and other current assets 90,515 27,450 1,050 94,507 213,522
Short-term financial assets 8,908 − − − 8,908
Current tax asset − 893 − − 893
Cash and cash equivalents 1,249 − 409,039 − 410,288
Total 123,057 28,343 410,619 94,964 656,983
ii. Credit risk by region
Long-term and short-term receivables, Short-term financial assets, Current tax asset and Cash and cash equivalents
31/12/2018 31/12/2017
Czech Republic 106,582 244,241
Greece 350,063 323,406
Croatia 47,347 −
Cyprus 83,786 49,508
Austria 11,209 26,182
Switzerland 1,061 11,868
United Kingdom 20,009 −
Other countries 798 1,778
Total 620,855 656,983
iii. Ageing structure of financial assets
Ageing structure
At 31 December 2018 Current Past due 0–90 days
Past due 91–180
days
Past due 181–365
days
More than one
year
Impairment created (−) Total
Assets
Long-term trade receivables and other non-current assets 86,323 − − − − − 86,323
Short-term trade receivables and other current assets 197,029 8,631 690 1,577 37,342 −38,425 206,844
Short-term financial assets 15,010 − − − − − 15,010
Cash and cash equivalents 312,678 − − − − − 312,678
Total 611,040 8,631 690 1,577 37,342 −38,425 620,855
Ageing structure
At 31 December 2017 Current Past due 0–90 days
Past due 91–180
days
Past due 181–365
days
More than one
year
Impairment created (−) Total
Assets
Long-term trade receivables and other non-current assets 23,372 − − − − − 23,372
Short-term trade receivables and other current assets 201,396 5,845 6,998 573 34,963 −38,857 210,918
Short-term financial assets 8,908 − − − − − 8,908
Cash and cash equivalents 410,288 − − − − − 410,288
Total 643,964 5,845 6,998 573 34,963 −38,857 653,486
Management believes that the unimpaired amounts that are past due are still collectible in full, based on historical payment behaviour and extensive analysis of customer credit risk, including underlying customer´s credit ratings if they are available.
In 2018, movements of impairment allowances created to trade receivables, receivables from agencies, contract assets and lease receivables were as follows:
Impairment alowance Balance at 1/1/2018 Additions Reversals Written off
Effect of currency
translation
Balance at 31/12/2018
to short-term receivables 38,857 3,486 −3,900 −18 −1 38,425
Total 38,857 3,486 −3,900 −18 −1 38,425
The following table shows weighted average loss rates used for creation of impairment allowances in 2018:
Long term receivables Short-term receivables
Weighted average loss
rate
Gross carrying amount
Impairment loss allowance
(–)
Weighted average loss
rate
Gross carrying amount
Impairment loss allowance
(–)
Due 0.0% 86,323 − 0.0% 197,029 −
Past due < 90 days − − − 0.0% 8,631 −
Past due 91–180 days − − − 0.0% 690 −
Past due 181–365 days − − − 68.61% 1,577 −1,082
Past due >365 days − − − 100.00% 37,342 −37,343
Total 0.0% 86,323 − 15.67% 245,269 −38,425
(b) Liquidity risk
Liquidity risk represents the possibility that the company might not be able to fulfil its payment obligations, primarily in respect of covering the amounts due to providers of bank loans and borrowings.
The Group monitors the risk of having insufficient funds by continuously monitoring the liquidity and maturity of investments, other financial assets, projected cash flows from its activities in individual currencies and fulfilment of bank covenants (see Note 8).
The Group maintains free liquidity sources that consist of cash and equivalents and a portfolio of high-quality, liquid investments in currencies in which the future financial needs are expected.
The Group aims to balance its continuous financing facility requirements using bank overdrafts, bank loans and finance leases.
The Group uses proprietary IT tools for liquidity management, market management, valuation of financial instruments and for trading and risk management purposes.
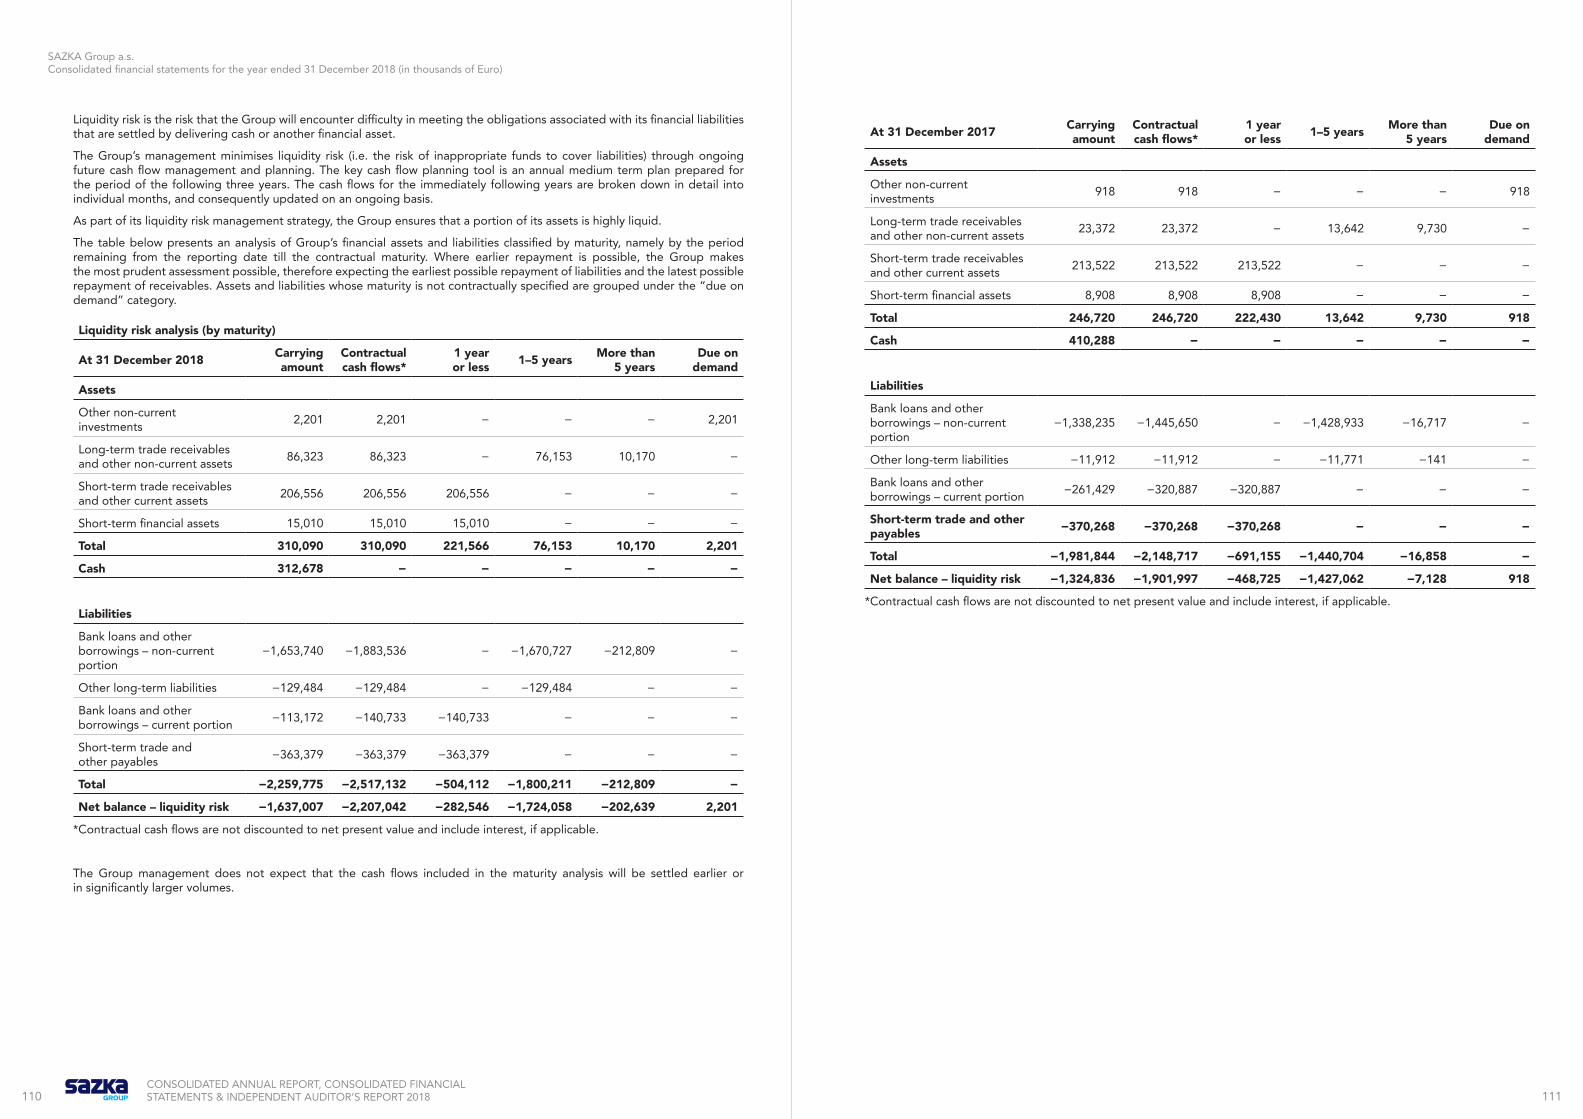
110 111CONSOLIDATED ANNUAL REPORT, CONSOLIDATED FINANCIAL STATEMENTS & INDEPENDENT AUDITOR’S REPORT 2018
SAZKA Group a.s. Consolidated financial statements for the year ended 31 December 2018 (in thousands of Euro)
Liquidity risk is the risk that the Group will encounter difficulty in meeting the obligations associated with its financial liabilities that are settled by delivering cash or another financial asset.
The Group’s management minimises liquidity risk (i.e. the risk of inappropriate funds to cover liabilities) through ongoing future cash flow management and planning. The key cash flow planning tool is an annual medium term plan prepared for the period of the following three years. The cash flows for the immediately following years are broken down in detail into individual months, and consequently updated on an ongoing basis.
As part of its liquidity risk management strategy, the Group ensures that a portion of its assets is highly liquid.
The table below presents an analysis of Group’s financial assets and liabilities classified by maturity, namely by the period remaining from the reporting date till the contractual maturity. Where earlier repayment is possible, the Group makes the most prudent assessment possible, therefore expecting the earliest possible repayment of liabilities and the latest possible repayment of receivables. Assets and liabilities whose maturity is not contractually specified are grouped under the “due on demand” category.
Liquidity risk analysis (by maturity)
At 31 December 2018 Carrying amount
Contractual cash flows*
1 year or less 1–5 years More than
5 yearsDue on
demand
Assets
Other non-current investments 2,201 2,201 − − − 2,201
Long-term trade receivables and other non-current assets 86,323 86,323 − 76,153 10,170 −
Short-term trade receivables and other current assets 206,556 206,556 206,556 − − −
Short-term financial assets 15,010 15,010 15,010 − − −
Total 310,090 310,090 221,566 76,153 10,170 2,201
Cash 312,678 − − − − −
Liabilities
Bank loans and other borrowings – non-current portion
−1,653,740 −1,883,536 − −1,670,727 −212,809 −
Other long-term liabilities −129,484 −129,484 − −129,484 − −
Bank loans and other borrowings – current portion −113,172 −140,733 −140,733 − − −
Short-term trade and other payables −363,379 −363,379 −363,379 − − −
Total −2,259,775 −2,517,132 −504,112 −1,800,211 −212,809 −
Net balance – liquidity risk −1,637,007 −2,207,042 −282,546 −1,724,058 −202,639 2,201
*Contractual cash flows are not discounted to net present value and include interest, if applicable.
The Group management does not expect that the cash flows included in the maturity analysis will be settled earlier or in significantly larger volumes.
At 31 December 2017 Carrying amount
Contractual cash flows*
1 year or less 1–5 years More than
5 yearsDue on
demand
Assets
Other non-current investments 918 918 − − − 918
Long-term trade receivables and other non-current assets 23,372 23,372 − 13,642 9,730 −
Short-term trade receivables and other current assets 213,522 213,522 213,522 − − −
Short-term financial assets 8,908 8,908 8,908 − − −
Total 246,720 246,720 222,430 13,642 9,730 918
Cash 410,288 − − − − −
Liabilities
Bank loans and other borrowings – non-current portion
−1,338,235 −1,445,650 − −1,428,933 −16,717 −
Other long-term liabilities −11,912 −11,912 − −11,771 −141 −
Bank loans and other borrowings – current portion −261,429 −320,887 −320,887 − − −
Short-term trade and other payables −370,268 −370,268 −370,268 − − −
Total −1,981,844 −2,148,717 −691,155 −1,440,704 −16,858 −
Net balance – liquidity risk −1,324,836 −1,901,997 −468,725 −1,427,062 −7,128 918
*Contractual cash flows are not discounted to net present value and include interest, if applicable.

112 113CONSOLIDATED ANNUAL REPORT, CONSOLIDATED FINANCIAL STATEMENTS & INDEPENDENT AUDITOR’S REPORT 2018
SAZKA Group a.s. Consolidated financial statements for the year ended 31 December 2018 (in thousands of Euro)
(c) Interest rate risk
In its business activities, the Group is exposed to the risk of interest rate fluctuation as the interest-bearing assets and liabilities have various maturities or remeasurement dates, or are due or remeasured in different amounts.
The risk to the Group relating to changes in market interest rates is primarily attributable to the Group’s bank loans with floating interest rates. The Group continuously monitors developments in financial markets and, based on the current situation, decides whether loans will be drawn either with a floating or fixed interest rate. During the credit relationship the risk of an increase in interest rates is continuously monitored and the use of standard instruments and hedge accounting to eliminate the risk (interest rate swaps) is considered (see Note 17).
Interest rate risk of long-term loans of the Group concluded with floating interest rates is mainly hedged by interest rate swap contracts.
The table below shows the Group’s exposure to interest rate risk classified by contractual maturity of financial instruments. Non-interest-bearing assets and liabilities or those without specified contractual maturity are grouped under the “undefined maturity” category.
Financial information on interest-bearing and non-interest-bearing assets and liabilities and related contractual maturities at 31 December 2018:
Interest rate risk analysis (by maturity)
At 31 December 2018 Due on demand
1 year or less 1–5 years More than
5 years Total
Assets
Long-term trade receivables and other non-current assets − − 76,153 10,170 86,323
Short-term trade receivables and other current assets − 206,556 − − 206,556
Short-term financial assets − 15,010 − − 15,010
Current tax asset − 288 − − 288
Cash and cash equivalents 312,678 − − − 312,678
Total 312,678 221,854 76,153 10,170 620,855
Liabilities
Bank loans and other borrowings – non-current portion − − −1,452,310 −201,430 −1,653,740
Other long-term liabilities − − −129,484 − −129,484
Bank loans and other borrowings – current portion − −113,172 − − −113,172
Short-term payables from financial instruments − −81 − − −81
Short-term trade and other payables − −363,298 − − −363,298
Current tax liability − −16,600 − − −16,600
Total − −493,151 −1,581,794 −201,430 −2,276,375
Financial information on interest-bearing and non-interest-bearing assets and liabilities and related contractual maturities at 31 December 2017:
Interest rate risk analysis (by maturity)
At 31 December 2017 Due on demand
1 year or less 1–5 years More than
5 years Total
Assets
Long-term trade receivables and other non-current assets − − 13,642 9,730 23,372
Short-term trade receivables and other current assets − 213,522 − − 213,522
Short-term financial assets − 8,908 − − 8,908
Current tax asset − 893 − − 893
Cash and cash equivalents 410,288 − − − 410,288
Total 410,288 223,323 13,642 9,730 656,983
Liabilities
Bank loans and other borrowings – non-current portion − − −1,324,887 −13,348 −1,338,235
Other long-term liabilities − − −11,771 −141 −11,912
Bank loans and other borrowings – current portion − −261,429 − − −261,429
Short-term payables from financial instruments − −284 − − −284
Short-term trade and other payables − −369,984 − − −369,984
Current tax liability − −2,148 − − −2,148
Total − −633,845 −1,336,658 −13,489 −1,983,992
Major interest rate costs are either hedged by interest rate swaps or have fixed interest rate. In relation to unhedged loans increase/decrease in interest rates (EURIBOR, LIBOR and PRIBOR) by 1 percentage point would cause an increase/decrase of interest cost by EUR 4,044 thousand (2017: EUR 9,883 thousand).
Profit or loss Equity, net of tax
Effect in thousands of Euro 100 bp increase + profit/ – loss
100 bp decrease + profit/ – loss
100 bp increase + increase/ – decrease
100 bp decrease + increase/ – decrease
31/12/2018
Variable rate instruments −9,091 9,091 − −
Interest rate swaps 661 −661 4,386 −4,386
Cash flow sensitivity (net) −8,430 8,430 4,386 −4,386
31/12/2017
Variable rate instruments −12,329 12,329 − −
Interest rate swaps 411 −411 2,035 −2,035
Cash flow sensitivity (net) −11,918 11,918 2,035 −2,035

114 115CONSOLIDATED ANNUAL REPORT, CONSOLIDATED FINANCIAL STATEMENTS & INDEPENDENT AUDITOR’S REPORT 2018
SAZKA Group a.s. Consolidated financial statements for the year ended 31 December 2018 (in thousands of Euro)
(d) Currency risk
The Group is exposed to significant risks arising from foreign currency transactions. These risks arise from sales or purchases in currencies other than the functional currency.
Companies in the Group continuously monitor currency risks and evaluate the potential impact of fluctuations in the currency exchange rates on the Group’s operations. Significant part of the foreign exchange exposure is hedged either by natural hedging, e.g. using financing in the same currency as the revenues generated and also incurring revenues and expenses in the same currency, or by using hedge accounting through FX forward and swap contracts.
The management also regularly monitors potential currency risks prior to the conclusion of significant contracts or business transactions.
At 31 December 2018 EUR CZK USD Other Total
Long-term trade receivables and other current assets 82,343 3,980 − − 86,323
Short-term financial assets 14,084 777 − 149 15,010
Short-term trade receivables and other current assets 188,390 13,530 3 4,921 206,844
Cash and cash equivalents 230,290 40,829 225 41,334 312,678
Total assets 515,107 59,116 228 46,404 620,855
Bank loans and other borrowings – non-current portion −1,336,437 −253,927 − −63,376 −1,653,740
Other long-term liabilities −125,820 −1,653 −2,011 − −129,484
Bank loans and other borrowings – current portion −78,520 −23,945 − −10,707 −113,172
Short-term trade and other payables −299,551 −62,682 −3,099 −14,647 −379,979
Total liabilities −1,840,328 −342,207 −5,110 −88,730 −2,276,375
Total −1,325,221 −283,091 −4,882 −42,326 −1,655,520
At 31 December 2017 EUR CZK USD Other Total
Long-term trade receivables and other current assets 23,016 356 − − 23,372
Short-term financial assets 297 8,611 − − 8,908
Short-term trade receivables and other current assets 198,719 15,104 36 556 214,415
Cash and cash equivalents 315,188 94,652 84 364 410,288
Total assets 537,220 118,723 120 920 656,983
Bank loans and other borrowings – non-current portion −1,161,357 −176,878 − − −1,338,235
Other long-term liabilities −9,567 −352 −1,993 − −11,912
Bank loans and other borrowings – current portion −229,873 −31,556 − − −261,429
Short-term trade and other payables −316,288 −53,159 −2,924 −45 −372,416
Total liabilities −1,717,085 −261,945 −4,917 −45 −1,983,992
Total −1,179,865 −143,222 −4,797 875 −1,327,009
A reasonably possible strengthening (weakening) of EUR, CZK and USD against all other currencies as at 31 December 2018 would have affected the measurement of financial instruments denominated in a foreign currency and affected the equity and profit or loss by the amounts shown below. This analysis assumes that all other variables, in particular interest rates, remain constant.
Profit or loss Equity, net of tax
Effect in thousands of Euro10% Euro
strengthening + profit/ – loss
10% Euro weakening
+ profit/ – loss
10% Euro strengthening
+ increase/ – decrease
10% Euro weakening
+ increase/ – decrease
31/12/2018
EUR −12 12 − −
CZK −12,812 12,812 −22,519 22,519
USD 488 −488 − −
31/12/2017
EUR −9 9 − −
CZK −15,163 15,163 −19,738 19,738
USD 490 −490 − −
(e) Capital management
The Group’s aim is to maintain a strong capital base so as to maintain ultimate shareholder, creditor and market confidence and to sustain future development of own business.
Through capital management and debt-to-equity ratio optimisation, the Group aims to ensure the going concern principle prerequisites and to maximise the level of dividends to shareholders.
At the reporting date, the Group recorded the following debt-to-equity ratio:
31/12/2018 31/12/2017
Total liabilities 2,559,513 2,256,333
Less: cash and cash equivalents and short-term financial assets 327,688 419,196
Net debt 2,231,825 1,837,137
Total equity 1,773,082 1,652,134
Debt to equity ratio 1.259 1.112
(f) Regulatory risk
The gaming sector is intensively regulated by state authorities. The authorities have the right to unilaterally alter the legislative and regulatory framework that governs the manner and modus operandi of the games that the Group offers.
The developments drive evolving regulatory challenges for the Group. Changes in the regulatory environment may have a sub-stantial impact, through restricting betting activities or changing compliance costs and taxes. The Group consistently complies with regulatory standards, while understands and addresses changing regulatory requirements in an efficient and effective manner. Additionally, a potential failure on the Group’s part to comply with the governing rules and the regulatory framework, as well as the enactment of new laws or/and further regulatory enforcement could have a negative impact on the Group’s business activities.
Risk of additional charges for OPAP CYPRUS LTD
In October 2017, the Attorney General delivered to the Auditor General and following his request, an opinion by which OPAP CYPRUS LTD supposedly does not pay to the Republic of Cyprus the amounts due under the Bilateral Treaty by making a new interpretation of the Bilateral Treaty, totally different from the interpretation given by the Republic of Cyprus throughout the duration of the Bilateral Treaty since 2003. The General Accountant of the Republic of Cyprus, who is authorized under the Bilateral Treaty to audit the accounts of OPAP CYPRUS LTD, took a different position from the Attorney General supporting the way OPAP CYPRUS LTD calculated its contributions to Republic of Cyprus. No claim has been made to-date against OPAP CYPRUS LTD and OPAP S.A. is convinced, that the interpretation of the Attorney General is unfounded.
No official claim and/or calculation was ever submitted to OPAP CYPRUS LTD.

116 117CONSOLIDATED ANNUAL REPORT, CONSOLIDATED FINANCIAL STATEMENTS & INDEPENDENT AUDITOR’S REPORT 2018
SAZKA Group a.s. Consolidated financial statements for the year ended 31 December 2018 (in thousands of Euro)
(g) Financial instruments and fair values
Financial instruments – categories
The Group’s financial assets comprise long-term and short-term loans and borrowings, trade receivables and other receivables, short-term financial assets, other non-current investments and investments accounted for using the equity method, long-term receivables from financial instruments, and cash and cash equivalents, which are all classified as loans and receivables.
Financial liabilities comprise interest-bearing loans and borrowings, bank loans and trade and other payables, derivatives (liabilities from financial instruments), and short-term tax liabilities.
The Group considers that all carrying amounts are a reasonable approximations of fair values.
The fair values of financial assets and liabilities, together with the carrying amounts shown in the consolidated statement of financial position, are as follows:
Fair values and carrying amounts of financial assets and liabilities
Carrying amount Fair value
31/12/2018 31/12/2017 31/12/2018 31/12/2017
Assets
Other non-current investments 2,201 918 2,201 918
Long-term trade receivables and other non-current assets 86,323 23,372 86,323 23,372
Short-term trade receivables and other current assets 206,556 213,522 206,556 213,522
Short-term financial assets 15,010 8,908 15,010 8,908
Cash and cash equivalents 312,678 410,288 312,678 410,288
Total 622,768 657,008 622,768 657,008
Liabilities
Bank loans and other borrowings – non-current portion −1,653,740 −1,338,235 −1,653,740 −1,338,235
Other long-term liabilities −129,484 −11,912 −129,484 −11,912
Bank loans and other borrowings – current portion −113,172 −261,429 −113,172 −261,429
Short-term trade and other payables −363,298 −369,984 −363,298 −369,984
Short-term liabilities from financial instruments −81 −284 −81 −284
Total −2,259,775 −1,981,844 −2,259,775 −1,981,844
Fair value hierarchy
The Group uses the following hierarchy of valuation techniques to determine and disclose the fair value of financial instruments:
• Level 1: quoted prices (unadjusted) in active markets for identical assets or liabilities
• Level 2: other techniques based on inputs that have a material impact on the reported fair value and that are observable, either directly or indirectly
• Level 3: techniques based on inputs that have a material impact on the reported fair value and that are not based on observable market data
The following table shows the carrying amounts and fair values of financial assets and liabilities, including their levels in the fair value hierarchy. It does not include fair value information for financial assets and financial liabilities not measured at fair value if the carrying amount is a reasonable approximation of fair value:
Carrying amount at 31/12/18
Fair value at 31/12/18
Held-for-trading
Fair value – hedging
instrumentsLevel 1 Level 2 Level 3
Financial assets measured at fair value
Interest rate swaps 12 60 − 72 −
Call option 6,702 − − 6,702 −
Financial liabilities measured at fair value
Interest rate swaps −167 −2,574 − −2,741 −
Currency swap −565 − − −565 −
Currency forward −81 − − −81 −
Carrying amount at 31/12/17
Fair value at 31/12/17
Held-for-trading
Fair value – hedging
instrumentsLevel 1 Level 2 Level 3
Financial assets measured at fair value
Interest rate swaps 2 3,305 − 3,307 −
Call option 8,800 − − 8,800 −
Financial liabilities measured at fair value
Interest rate swaps −284 −214 − −498 −
Fair values as shown in the tables were obtained from financial institutions in which the interest rate swaps are contracted. The Group considers that the carrying amount of the purchase option is reasonable approximation of fair value and therefore not revaluated.
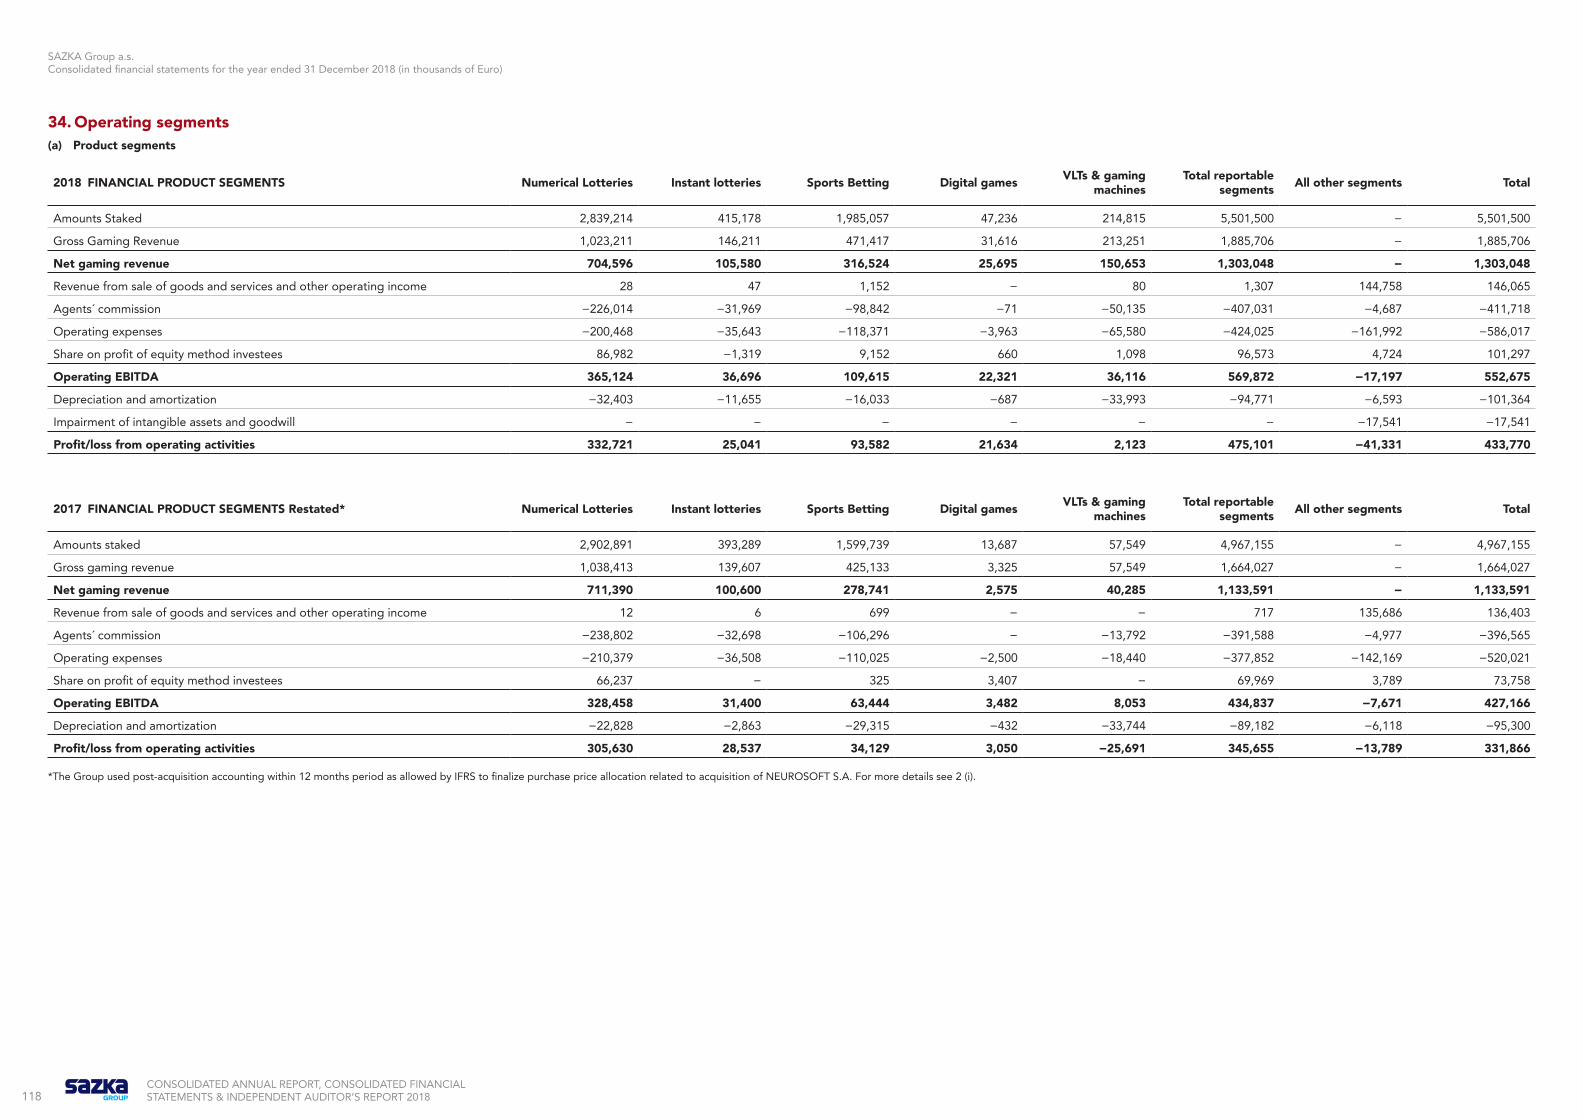
SAZKA Group a.s. Consolidated financial statements for the year ended 31 December 2018 (in thousands of Euro)
118CONSOLIDATED ANNUAL REPORT, CONSOLIDATED FINANCIAL STATEMENTS & INDEPENDENT AUDITOR’S REPORT 2018
34. Operating segments(a) Product segments
2018 FINANCIAL PRODUCT SEGMENTS Numerical Lotteries Instant lotteries Sports Betting Digital games VLTs & gaming machines
Total reportable segments All other segments Total
Amounts Staked 2,839,214 415,178 1,985,057 47,236 214,815 5,501,500 − 5,501,500
Gross Gaming Revenue 1,023,211 146,211 471,417 31,616 213,251 1,885,706 − 1,885,706
Net gaming revenue 704,596 105,580 316,524 25,695 150,653 1,303,048 − 1,303,048
Revenue from sale of goods and services and other operating income 28 47 1,152 − 80 1,307 144,758 146,065
Agents´ commission −226,014 −31,969 −98,842 −71 −50,135 −407,031 −4,687 −411,718
Operating expenses −200,468 −35,643 −118,371 −3,963 −65,580 −424,025 −161,992 −586,017
Share on profit of equity method investees 86,982 −1,319 9,152 660 1,098 96,573 4,724 101,297
Operating EBITDA 365,124 36,696 109,615 22,321 36,116 569,872 −17,197 552,675
Depreciation and amortization −32,403 −11,655 −16,033 −687 −33,993 −94,771 −6,593 −101,364
Impairment of intangible assets and goodwill − − − − − − −17,541 −17,541
Profit/loss from operating activities 332,721 25,041 93,582 21,634 2,123 475,101 −41,331 433,770
2017 FINANCIAL PRODUCT SEGMENTS Restated* Numerical Lotteries Instant lotteries Sports Betting Digital games VLTs & gaming machines
Total reportable segments All other segments Total
Amounts staked 2,902,891 393,289 1,599,739 13,687 57,549 4,967,155 − 4,967,155
Gross gaming revenue 1,038,413 139,607 425,133 3,325 57,549 1,664,027 − 1,664,027
Net gaming revenue 711,390 100,600 278,741 2,575 40,285 1,133,591 − 1,133,591
Revenue from sale of goods and services and other operating income 12 6 699 − − 717 135,686 136,403
Agents´ commission −238,802 −32,698 −106,296 − −13,792 −391,588 −4,977 −396,565
Operating expenses −210,379 −36,508 −110,025 −2,500 −18,440 −377,852 −142,169 −520,021
Share on profit of equity method investees 66,237 − 325 3,407 − 69,969 3,789 73,758
Operating EBITDA 328,458 31,400 63,444 3,482 8,053 434,837 −7,671 427,166
Depreciation and amortization −22,828 −2,863 −29,315 −432 −33,744 −89,182 −6,118 −95,300
Profit/loss from operating activities 305,630 28,537 34,129 3,050 −25,691 345,655 −13,789 331,866
*The Group used post-acquisition accounting within 12 months period as allowed by IFRS to finalize purchase price allocation related to acquisition of NEUROSOFT S.A. For more details see 2 (i).
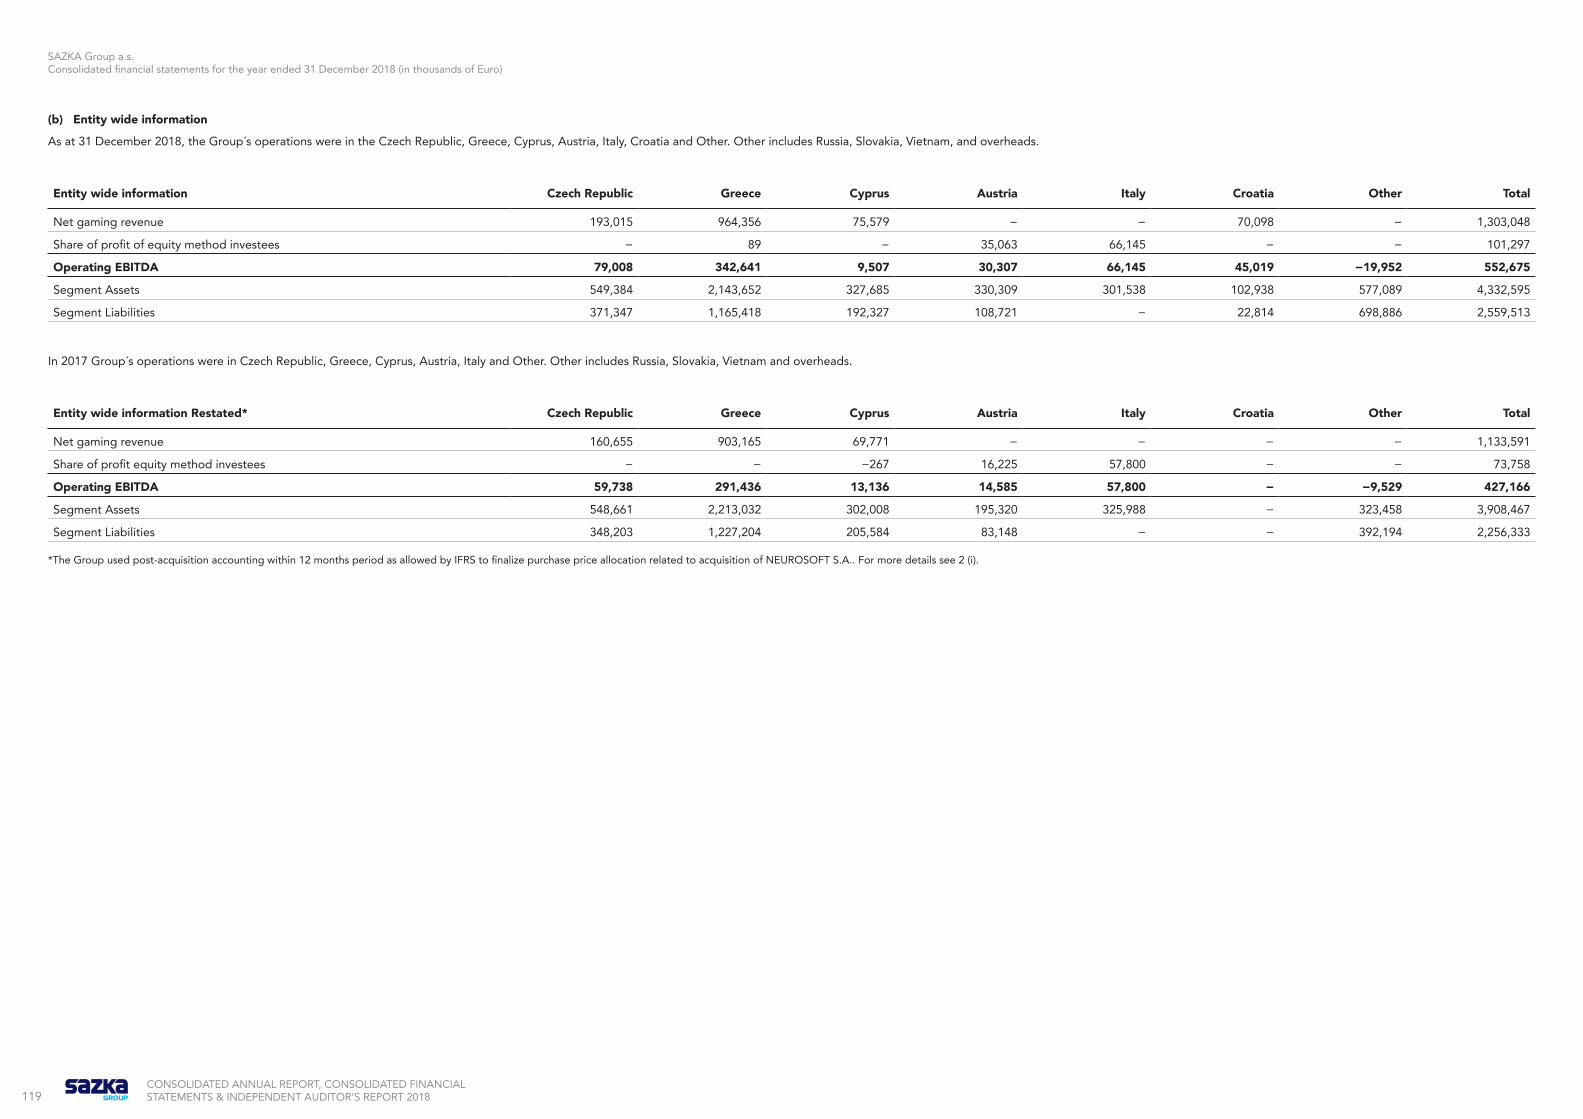
119CONSOLIDATED ANNUAL REPORT, CONSOLIDATED FINANCIAL STATEMENTS & INDEPENDENT AUDITOR’S REPORT 2018
SAZKA Group a.s. Consolidated financial statements for the year ended 31 December 2018 (in thousands of Euro)
(b) Entity wide information
As at 31 December 2018, the Group´s operations were in the Czech Republic, Greece, Cyprus, Austria, Italy, Croatia and Other. Other includes Russia, Slovakia, Vietnam, and overheads.
Entity wide information Czech Republic Greece Cyprus Austria Italy Croatia Other Total
Net gaming revenue 193,015 964,356 75,579 − − 70,098 − 1,303,048
Share of profit of equity method investees − 89 − 35,063 66,145 − − 101,297
Operating EBITDA 79,008 342,641 9,507 30,307 66,145 45,019 −19,952 552,675
Segment Assets 549,384 2,143,652 327,685 330,309 301,538 102,938 577,089 4,332,595
Segment Liabilities 371,347 1,165,418 192,327 108,721 − 22,814 698,886 2,559,513
In 2017 Group´s operations were in Czech Republic, Greece, Cyprus, Austria, Italy and Other. Other includes Russia, Slovakia, Vietnam and overheads.
Entity wide information Restated* Czech Republic Greece Cyprus Austria Italy Croatia Other Total
Net gaming revenue 160,655 903,165 69,771 − − − − 1,133,591
Share of profit equity method investees − − −267 16,225 57,800 − − 73,758
Operating EBITDA 59,738 291,436 13,136 14,585 57,800 − −9,529 427,166
Segment Assets 548,661 2,213,032 302,008 195,320 325,988 − 323,458 3,908,467
Segment Liabilities 348,203 1,227,204 205,584 83,148 − − 392,194 2,256,333
*The Group used post-acquisition accounting within 12 months period as allowed by IFRS to finalize purchase price allocation related to acquisition of NEUROSOFT S.A.. For more details see 2 (i).

120 121CONSOLIDATED ANNUAL REPORT, CONSOLIDATED FINANCIAL STATEMENTS & INDEPENDENT AUDITOR’S REPORT 2018
SAZKA Group a.s. Consolidated financial statements for the year ended 31 December 2018 (in thousands of Euro)
35. Related partiesRelated party transactions are transfers of resources, services or obligations between the reporting entity and related party. Relations between the Group and its related parties include relationships with companies related through common shareholders or directors of the company.
All the transactions disclosed below are related to the Group due to their relationships within KKCG AG group and Emma Gamma Limited group in the reported periods.
All material transactions with related parties were carried out on an arm’s length basis.
There were no material transactions with equity method investees (Note 6) neither in current year nor in prior year period, except for dividends received in the amount of EUR 77,380 thousand in 2018 (2017: EUR 23,492 thousand) and distribution from other funds of equity method investee in the amount of EUR 32,796 thousand (2017: EUR 27,330 thousand).
(a) Outstanding related party balances as at 31 December 2018 and 31 December 2017:
The following table presents outstanding receivables and payables from related parties of the Group as at 31 December 2018 and 31 December 2017:
31/12/2018 31/12/2017
ASSETS
Long-term trade receivables and other non-current assets 1,360 −
Short-term financial assets 1,061 8,908*
Short term trade receivables and other current assets 250 312
LIABILITIES
Short-term trade and other payables 3,073 2,897
*The major items of receivables as at 31 December 2017 were receivables from KKCG Structured Finance AG amounting to EUR 8,908 thousand. In 2018 the loan receivable was repaid.
(b) Transactions with related parties for the year ended 31 December 2018 and 31 December 2017:
The following table presents transactions with related parties of the Group with effect in Consolidated statement of comprehensive income for the periods ended 31 December 2018 and 31 December 2017:
2018 2017
Revenue from sale of goods and services 300 697
Other operating income 39 46
Materials, consumables and services 7,350 4,817
Personnel expenses 21 7
Other operating expenses 1,479 1,101
Finance cost − 3,344
Finance income 62 2
(c) Transactions with members of the Group’s bodies for the period ended 31 December 2018 and 31 December 2017:
In 2018, the Group paid out bonuses to members of the Group entities‘ bodies amounting to EUR 895 thousand (2017: EUR 898 thousand).
Bonuses, remuneration and other personal expenses incurred in respect of members of the board of directors, supervisory board and executive management of the consolidated entities:
2018 2017
Board of directors and
supervisory board
Executive management
Board of directors and
supervisory board
Executive management
Wages and salaries − 10,042 − 13,548
Social and health insurance 107 666 52 2,526
Retirement benefit costs − 1,152 − −
Remuneration of members of statutory bodies 895 − 898 −
Total 1,002 11,860 950 16,074
On top of remuneration expenses, OPAP S.A. sub-group paid-out bonuses amounting to EUR 1,538 thousand directly from retained earnings.

122 123CONSOLIDATED ANNUAL REPORT, CONSOLIDATED FINANCIAL STATEMENTS & INDEPENDENT AUDITOR’S REPORT 2018
SAZKA Group a.s. Consolidated financial statements for the year ended 31 December 2018 (in thousands of Euro)
36. Subsequent eventsDescription of significant subsequent events that occurred after 31 December 2018:
1. KKCG AG and EMMA GAMMA LIMITED have agreed on the split of the assets in the SAZKA Group. The agreement was signed on 14 March 2019 and the transaction is subject to regulatory approval in respective countries. Following completion of the transaction, KKCG will own 100% of the shares in the SAZKA Group with all assets remaining as they are except for the Croatian SuperSport business (SAZKA Group Adriatic d.o.o. entity and all of its subsidiaries, including SUPER SPORT d.o.o., PUNI BROJ d.o.o., and Minus5 d.o.o.). EMMA GAMMA LIMITED will take over the ownership of the SAZKA Group Adriatic d.o.o. entity and all of its subsidiaries upon completion.
2. The Group, through EMMA DELTA HELLENIC HOLDINGS LIMITED, signed a new loan agreement on 14 January 2019 with J.P. MORGAN SECURITIES PLC as Arranger. The new loan in the amount of EUR 250,000 thousand refinanced the previous loan with an outstanding balance of EUR 145,000 thousand.
3. Osterreichische Lotterien GmbH paid a dividend on 21 March 2019 for the financial year 2018 in the amount of EUR 120,000 thousand. The group has an effective share of 11.55% in Osterreichische Lotterien GmbH through companies CLS beteiligungs GmbH and LTB Beteiligungs GmbH (excluding stake held in Osterreichische Lotterien GmbH through Casinos Austria AG).
4. Casinos Austria AG paid a dividend on 26 March 2019 for the financial year 2018 in the amount of EUR 15,000 thousand. The group received its share in the amount of EUR 5,743 thousand through Medial Beteiligungs GmbH.
5. LOTOITALIA S.r.l. paid a dividend on 2 April 2019 for the financial year 2018 and made a distribution to shareholders via a decrease to its share premium on 2 April 2019 and 24 April 2019. The group received its share of these proceeds in the total amount of EUR 98,793 thousand through Italian Gaming Holding a.s.
6. OPAP INVESTMENT LTD, on 3 January 2019, following the conclusion of its due diligence exercise, agreed to acquire a 51% stake of Stoiximan Group’s Greek and Cypriot operations under GML Interactive Ltd, a 100% subsidiary of TCB Holdings Ltd (“TCB”), for a total consideration of EUR 94,860 thousand, plus net cash as of the closing date. The conclusion of this transaction will give OPAP joint control together with two shareholders of TCB in Stoiximan Group’s Greek and Cypriot operations and is subject to clearance by the competent gaming regulatory and anti-trust authorities.
7. OPAP S.A., on 22 January 2019 fully repaid a long term loan of EUR 6,041 thousand in the subsidiary OPAP INVESTMENT.
Except for the above, no other subsequent events that would have a material impact on the consolidated financial statements as at 31 December 2018 occured.
Date:
30 April 2019
Signature of the authorised representatives:
Pavel Šaroch Pavel Horák
Member of the Board of Directors Member of the Board of Directors
37. Independent Auditor’s Report
PricewaterhouseCoopers Audit, s.r.o., Hvězdova 1734/2c, 140 00 Prague 4, Czech Republic T: +420 251 151 111, F: +420 251 156 111, www.pwc.com/cz
PricewaterhouseCoopers Audit, s.r.o., registered seat Hvězdova 1734/2c, 140 00 Prague 4, Czech Republic, Identification Number: 40765521, registered with the Commercial Register kept by the Municipal Court in Prague, Section C, Insert 3637, and in the Register of Audit Companies with the Chamber of Auditors of the Czech Republic under Licence No. 021.
Independent auditor's report to the shareholders of SAZKA Group a.s. Opinion
We have audited the accompanying consolidated financial statements of SAZKA Group a.s., with its registered office at Vinohradská 1511/230, Strašnice, Praha 10 (“the Company”) and its subsidiaries (together “the Group”), prepared in accordance with International Financial Reporting Standards as adopted by the European Union, which comprise the consolidated statement of financial position as at 31 December 2018, consolidated statements of comprehensive income, changes in equity and cash flows for the year ended 31 December 2018 and notes to the consolidated financial statements, which include significant accounting policies and other explanatory information.
In our opinion, the accompanying consolidated financial statements give a true and fair view of the consolidated financial position of the Group as at 31 December 2018, of its consolidated financial performance and its consolidated cash flows for the year ended 31 December 2018 in accordance with International Financial Reporting Standards as adopted by the European Union.
Basis for Opinion
We conducted our audit in accordance with the Act on Auditors and Standards on Auditing of the Chamber of Auditors of the Czech Republic. These standards consist of International Standards on Auditing (ISAs) which may be supplemented and modified by related application guidance. Our responsibilities under those standards are further described in the Auditor's Responsibilities for the Audit of the Consolidated Financial Statements section of our report. We are independent of the Group in accordance with the Act on Auditors and Code of Ethics for Professional Accountants issued by the International Ethics Standards Board for Accountants (IESBA) and accepted by the Chamber of Auditors of the Czech Republic, and we have fulfilled our other ethical responsibilities in accordance with these regulations. We believe that the audit evidence we have obtained is sufficient and appropriate to provide a basis for our opinion.
Other Information
In compliance with Section 2(b) of the Act on Auditors, the other information comprises the information included in the consolidated Annual Report other than the consolidated financial statements and auditor's report thereon. The Board of Directors is responsible for the other information.
Our opinion on the consolidated financial statements does not cover the other information. In connection with our audit of the consolidated financial statements, our responsibility is to read the other information and, in doing so, consider whether the other information is materially inconsistent with the consolidated financial statements or our knowledge about the Group obtained in the audit or otherwise appears to be materially misstated. In addition, we assess whether the other information has been prepared, in all material respects, in accordance with applicable law and regulation, in particular, whether the other information complies with law and regulation in terms of formal requirements and procedure for preparing the other information in the context of materiality, i.e. whether any non-compliance with these requirements could influence judgments made on the basisof the other information.
Based on the procedures performed, to the extent we are able to assess it, we report that:
• The other information describing the facts that are also presented in the consolidated financial statements is,in all material respects, consistent with the consolidated financial statements; and
• The other information is prepared in compliance with applicable law and regulation.
In addition, our responsibility is to report, based on the knowledge and understanding of the Group obtained in the audit, on whether the other information contains any material misstatement of fact. Based on the procedures we have performed on the other information obtained, we have not identified any material misstatement of fact.
Responsibilities of the Board of Directors and Supervisory Board of the Company for the Consolidated Financial Statements
The Board of Directors is responsible for the preparation and fair presentation of the consolidated financial statements in accordance with International Financial Reporting Standards as adopted by the European Union and for such internal control as the Board of Directors determines is necessary to enable the preparation of consolidated financial statements that are free from material misstatement, whether due to fraud or error.
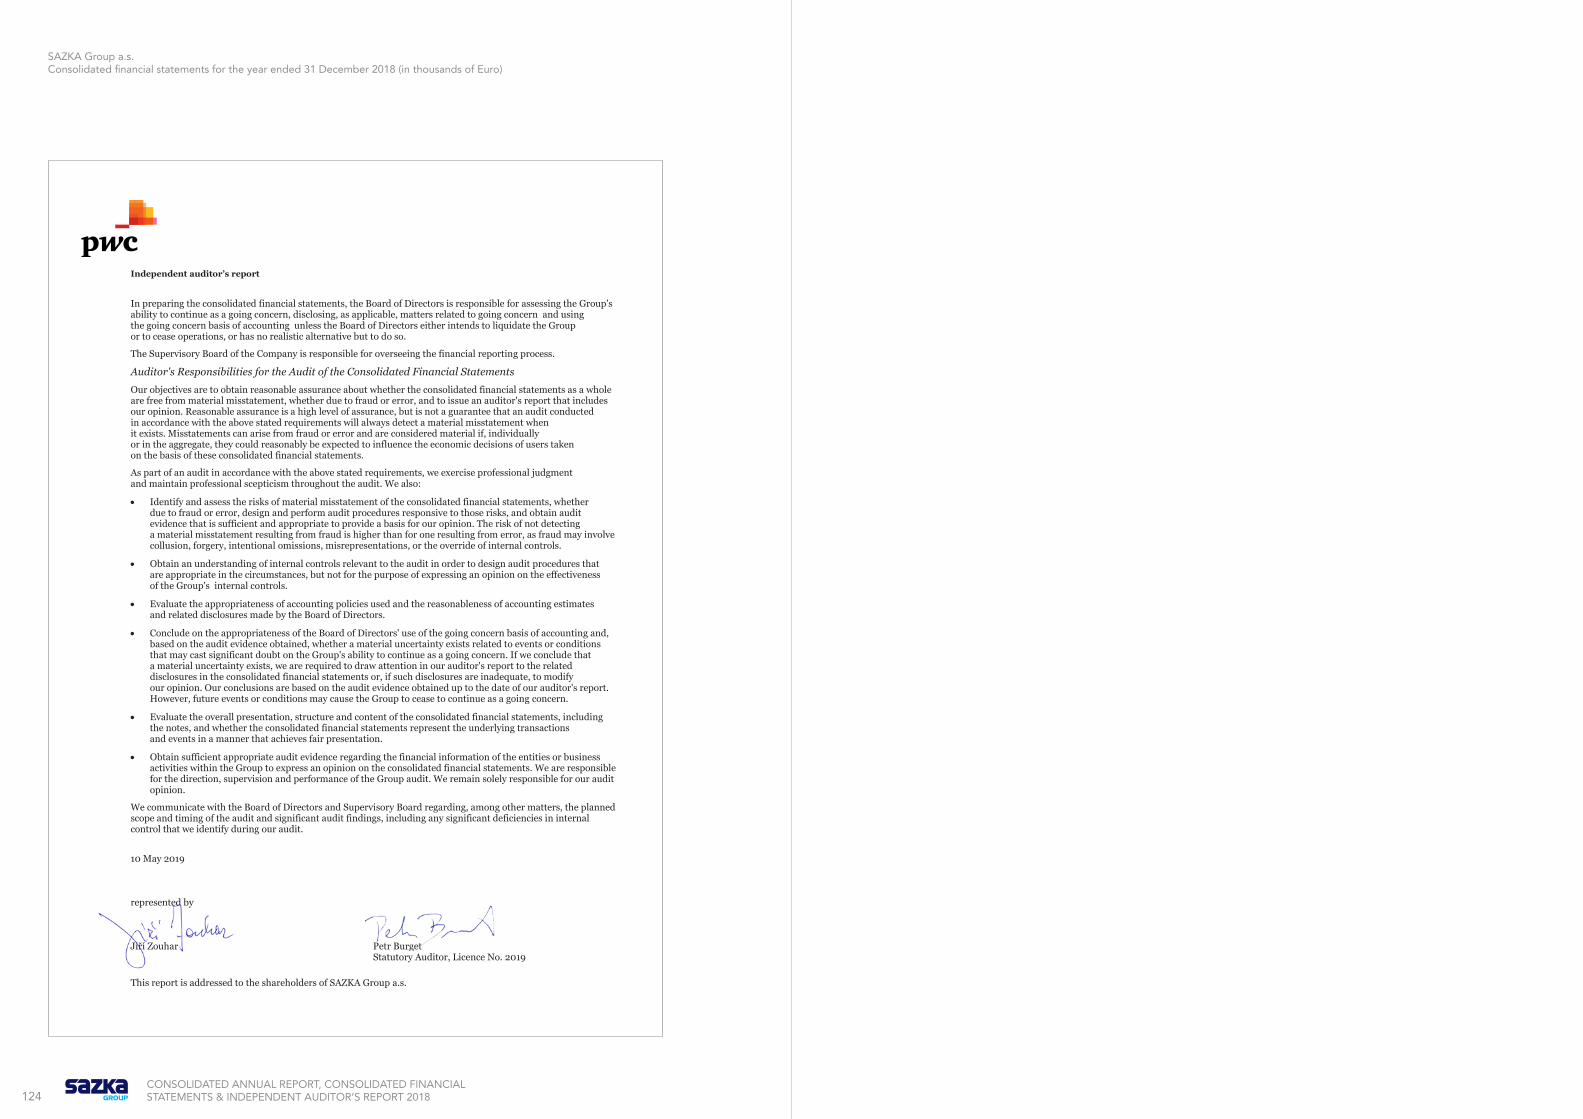
124CONSOLIDATED ANNUAL REPORT, CONSOLIDATED FINANCIAL STATEMENTS & INDEPENDENT AUDITOR’S REPORT 2018
SAZKA Group a.s. Consolidated financial statements for the year ended 31 December 2018 (in thousands of Euro)
Independent auditor’s report
In preparing the consolidated financial statements, the Board of Directors is responsible for assessing the Group's ability to continue as a going concern, disclosing, as applicable, matters related to going concern and using the going concern basis of accounting unless the Board of Directors either intends to liquidate the Group or to cease operations, or has no realistic alternative but to do so.
The Supervisory Board of the Company is responsible for overseeing the financial reporting process.
Auditor's Responsibilities for the Audit of the Consolidated Financial Statements
Our objectives are to obtain reasonable assurance about whether the consolidated financial statements as a whole are free from material misstatement, whether due to fraud or error, and to issue an auditor's report that includes our opinion. Reasonable assurance is a high level of assurance, but is not a guarantee that an audit conducted in accordance with the above stated requirements will always detect a material misstatement when it exists. Misstatements can arise from fraud or error and are considered material if, individually or in the aggregate, they could reasonably be expected to influence the economic decisions of users taken on the basis of these consolidated financial statements.
As part of an audit in accordance with the above stated requirements, we exercise professional judgment and maintain professional scepticism throughout the audit. We also:
• Identify and assess the risks of material misstatement of the consolidated financial statements, whetherdue to fraud or error, design and perform audit procedures responsive to those risks, and obtain auditevidence that is sufficient and appropriate to provide a basis for our opinion. The risk of not detectinga material misstatement resulting from fraud is higher than for one resulting from error, as fraud may involvecollusion, forgery, intentional omissions, misrepresentations, or the override of internal controls.
• Obtain an understanding of internal controls relevant to the audit in order to design audit procedures thatare appropriate in the circumstances, but not for the purpose of expressing an opinion on the effectivenessof the Group's internal controls.
• Evaluate the appropriateness of accounting policies used and the reasonableness of accounting estimatesand related disclosures made by the Board of Directors.
• Conclude on the appropriateness of the Board of Directors' use of the going concern basis of accounting and,based on the audit evidence obtained, whether a material uncertainty exists related to events or conditionsthat may cast significant doubt on the Group's ability to continue as a going concern. If we conclude thata material uncertainty exists, we are required to draw attention in our auditor's report to the relateddisclosures in the consolidated financial statements or, if such disclosures are inadequate, to modifyour opinion. Our conclusions are based on the audit evidence obtained up to the date of our auditor's report.However, future events or conditions may cause the Group to cease to continue as a going concern.
• Evaluate the overall presentation, structure and content of the consolidated financial statements, includingthe notes, and whether the consolidated financial statements represent the underlying transactionsand events in a manner that achieves fair presentation.
• Obtain sufficient appropriate audit evidence regarding the financial information of the entities or businessactivities within the Group to express an opinion on the consolidated financial statements. We are responsiblefor the direction, supervision and performance of the Group audit. We remain solely responsible for our auditopinion.
We communicate with the Board of Directors and Supervisory Board regarding, among other matters, the planned scope and timing of the audit and significant audit findings, including any significant deficiencies in internal control that we identify during our audit.
10 May 2019
represented by
Jiří Zouhar Petr Burget Statutory Auditor, Licence No. 2019
This report is addressed to the shareholders of SAZKA Group a.s.