Asymmetry in the Impact of Encounters with Police -...
28
Asymmetry in the Impact of Encounters with Police Wesley G. Skogan This article examines the impact of personal experience on popular assessments of the quality of police service. Following past research, it addresses the influences of personal and neighbourhood factors on confidence in the police. It then focuses on the additional impact of positive and negative personal experiences with the police. Several studies of police encounters with the public have noted that the relationship between how people recall being treated and their general confidence in the police may be asymmetrical. At its worst, the police may get essentially no credit for delivering professional service, while bad experiences can deeply influence peoples’ views of their performance and even legitimacy. This proposition is tested using survey data on police-initiated and citizen- initiated contacts with police in Chicago. The findings indicate that the impact of having a bad experience is four to fourteen times as great as that of having a positive experience, and the coefficients associated with having a good experience */including being treated fairly and politely, and receiving service that was prompt and helpful */were not statistically different from zero. Another section of the article replicates this finding using surveys of residents of seven other urban areas located in three different countries. The article concludes that this is bad news indeed for police administrators intent on solidifying their support among voters, taxpayers and the consumers of police services. Keywords: Impact Police and Citizen Contacts Introduction You have ten positive encounters with the police and that’s good; but one negative encounter, and all the positives disappear. (Hillard, 2003) Wesley G. Skogan is Professor of Political Science at the Institute for Policy Research, Northwestern University. Correspondence to: Wesley G. Skogan, Institute for Policy Research, Northwestern University, 625 Haven Street, Evanston IL, USA. E-mail: [email protected]. The author is grateful to Robert C. Davis and Joel Miller for access to their data. Tom Tyler and Michael Reisig made helpful comments on early presentations of these findings. ISSN 1043-9463 (print)/ISSN 1477-2728 (online) # 2006 Taylor & Francis DOI: 10.1080/10439460600662098 Policing & Society, Vol. 16, No. 2, June 2006, pp. 99 /126
Transcript of Asymmetry in the Impact of Encounters with Police -...

Asymmetry in the Impact ofEncounters with PoliceWesley G. Skogan
This article examines the impact of personal experience on popular assessments of the
quality of police service. Following past research, it addresses the influences of personal
and neighbourhood factors on confidence in the police. It then focuses on the additional
impact of positive and negative personal experiences with the police. Several studies of
police encounters with the public have noted that the relationship between how people
recall being treated and their general confidence in the police may be asymmetrical. At
its worst, the police may get essentially no credit for delivering professional service, while
bad experiences can deeply influence peoples’ views of their performance and even
legitimacy. This proposition is tested using survey data on police-initiated and citizen-
initiated contacts with police in Chicago. The findings indicate that the impact of having
a bad experience is four to fourteen times as great as that of having a positive experience,
and the coefficients associated with having a good experience*/including being treated
fairly and politely, and receiving service that was prompt and helpful*/were not
statistically different from zero. Another section of the article replicates this finding using
surveys of residents of seven other urban areas located in three different countries. The
article concludes that this is bad news indeed for police administrators intent on
solidifying their support among voters, taxpayers and the consumers of police services.
Keywords: Impact Police and Citizen Contacts
Introduction
You have ten positive encounters with the police and that’s good; but one negative
encounter, and all the positives disappear. (Hillard, 2003)
Wesley G. Skogan is Professor of Political Science at the Institute for Policy Research, Northwestern University.
Correspondence to: Wesley G. Skogan, Institute for Policy Research, Northwestern University, 625 Haven Street,
Evanston IL, USA. E-mail: [email protected]. The author is grateful to Robert C. Davis and Joel Miller for
access to their data. Tom Tyler and Michael Reisig made helpful comments on early presentations of these findings.
ISSN 1043-9463 (print)/ISSN 1477-2728 (online) # 2006 Taylor & Francis
DOI: 10.1080/10439460600662098
Policing & Society, Vol. 16, No. 2, June 2006, pp. 99�/126

This article examines the impact of personal experience on popular assessments of
the quality of police service. This is an important issue for policy and practice.
Research has documented that a broad range of factors influence public confidence in
the police. At the individual level, race and age are among the personal characteristics
that colour people’s views. Neighbourhood-level factors are also important, providing
indirect evidence that people hold police accountable to some degree for the
condition of their community. There is also new research on the impact of the views
of family members and friends, and of the mass media. Finally, there is an emerging
body of evidence concerning the importance of personal experience with the police.
This is of particular interest because, compared to social, economic, media and
environmental factors, what police do when they interact with the public is more
squarely in the hands of police administrators. Through recruitment, training,
supervision and even separation, they can hope to ensure a high standard of
professionalism in their dealings with the public. To the extent to which this makes a
difference in popular confidence in the police, they can hope to sustain the support of
the citizenry*/as taxpayers and voters, as well as consumers of police services.
However, there are hints that this unfortunately may be difficult. Better service may
not automatically produce better results, as measured by public confidence. Several
studies of police encounters with the public have noted that the relationship between
how people are treated and their general confidence in the police may be
asymmetrical , rather than balanced. Good days may not balance out bad days. At
its worst, the police may get essentially no credit for doing a good job, while a bad
experience deeply influences people’s views of their performance and even legitimacy.
Research also documents that this phenomenon extends to government agencies of
many kinds, not just the police, further highlighting the importance of learning in
more detail about the impact of experience on popular assessments of public services.
This article first tests the asymmetry proposition with data on contacts and
evaluations of the police in Chicago. Data from a survey conducted in 2003 are used
to contrast the influence of individual and neighbourhood factors with that of recent
personal experience with police, on people’s general confidence in the police serving
in their neighbourhood. The multivariate findings indicate that, for both police-
initiated and citizen-initiated encounters, the impact of having a bad experience is
four to fourteen times as great as that of having a positive experience. The coefficients
associated with having a good experience*/including being treated fairly and
politely, and receiving service that was prompt and helpful*/were very small and not
statistically different from zero. Because of the importance of this finding, another
section of the article re-examines the issue by replicating the analysis among seven
other samples of residents of urban areas in three different countries. The pattern
remains basically the same. The article concludes that this is bad news indeed for
police administrators intent on solidifying support among their voters and taxpayers
by improving the quality of service they are delivering on the street.
100 W. G. Skogan

Confidence in the Police
This research tests the potentially asymmetric impact of experiences with the police
within the context of a larger model of attitudes toward the police. There is an
immense body of research on opinions of the police, both in the United States and
elsewhere. The review below highlights some of this work, confining its attention to
research that is directly relevant to the issue of asymmetry in the impact of
encounters with police.
Personal Background
The personal attributes of individuals are important because they are directly related
to the extent to which people are stopped by police or call them for assistance, and
often they are linked to how deferentially or harshly they are dealt with when they do
come into contact with the police. All research on American’s views of the police
begins with race. In reviews of the literature, Schafer et al. (2003), Brown and
Benedict (2002), Tuch and Weitzer (1997), and many others conclude that African-
Americans are more sceptical in their views of the police and more often report
negative contacts and even mistreatment by them. They are also disproportionately
stopped by the police (Langan et al., 2001), and they are more likely than whites to be
victimized and subsequently report crimes to the police (Catalano, 2004). Racial
minorities are more likely to believe that police had no legitimate reason for stopping
them (Lundman & Kaufman, 2003; Walker et al., 1972). Many studies also find that
African-Americans are relatively undifferentiated in their views of police. In other
words, compared to whites, black attitudes do not vary much across most other
demographic categories. For blacks, race constitutes a ‘‘master status’’ that seems to
override other factors in their relationship with the police. On the other hand, Cao et
al. (1996) find that the statistical effect of race disappears controlling for perceived
levels of crime and disorder, suggesting that the ‘‘collective insecurity’’ of African-
Americans accounts for much of their dissatisfaction. There is much less research on
racial minorities other than African-Americans, but in Chicago they generally stand
between African-Americans and whites in their views of the police, and closer to the
former than the latter (Skogan & Hartnett, 1997).
Age is another powerful determinant of people’s views of the police. Young people
are more likely to get into trouble of all kinds with the police, including being
stopped and arrested, and they are also more likely to be victims of violent crime.
Reisig and Correia (1997) also propose that age differences in views of the police
reflect the value attached to freedom and autonomy among younger people, versus
safety and security among older people. In Chicago, the frequency of encounters with
police also reflect a strong race-by-age interaction; in 2003, more than 70 per cent of
young African-American males reported being stopped by police in the past 12
months (Skogan & Steiner, 2004), compared to the city average of about 20 per cent.
On the other hand, studies of the effects of gender have found little relationship
Policing & Society 101
between sex and many attitudes about police. This is despite the fact that men are far
more likely than women to have contacts with them, both as victims and perpetrators
of crimes, especially outside the context of traffic enforcement.
There is also research on the effects of socioeconomic status on attitudes
toward the police. Correia (2000) and others think that those with more stakes
in established society are more inclined to support them. On the other hand, lower
income and less educated people are presumed to actually rely more heavily on
police services of all kinds, and to have much more experience with them. Many
hypothesize that police are more deferential toward middle- and upper-class citizens
because police seek positive evaluations and support from influential members
of society, and better-off people will in turn be more favourable in their views.
However, if the asymmetry hypothesis is correct, the positive experiences of people at
either end of the social spectrum would have little impact on their confidence in the
police.
Empirically, research on social standing comes to mixed conclusions. Status is
strongly correlated with other factors that are important in determining an
individual’s attitudes toward the police, including race. Sampson and Jeglum-
Bartusch (1998) find a positive link between socioeconomic status and satisfaction
with police performance net of many other individual and neighbourhood factors.
On the other hand, Weitzer and Tuch (1999) found social class effects among blacks
for general attitudes about the police, but not for their views of neighbourhood
policing. They hypothesize that middle-class African-Americans are more attuned to
racial discrimination as an abstract concept that impedes their class-based aspira-
tions, and that they pay more attention to coverage of the police in the media. Brown
and Benedict (2002) summarize the literature by concluding that confidence in the
police is higher for higher status whites, and lower for higher status African-
Americans, a complex interaction effect.
Neighbourhood Conditions
Does the public hold the police responsible for crime and disorder? Police are
undoubtedly the municipal agency that is most closely watched and criticized by the
general public and the media alike. They are the only local bureaucracy whose annual
statistical reports routinely make front-page news. Of all the problems that we hold
city agencies responsible for somehow solving, crime is probably the most
compelling. Doris Graber’s (1980) content analysis of network and Chicago news
broadcasts revealed that 20 per cent of all local news stories and 10 per cent of all
national stories concerned crime and criminal justice, with the police being
mentioned frequently (and often quite critically). The survey data examined here
were collected in a city where an ongoing publicity campaign has stressed the role of
the police in bringing the crime rate down (cf. Skogan & Steiner, 2004).
Opinion research indicates there is a strong link between neighbourhood
conditions and assessments of the police. In surveys, attitudes toward the police
102 W. G. Skogan
are correlated with perceptions of neighbourhood crime (Maxson et al., 2003; Reisig
& Giacomazzi, 1998), fear of crime (Cao et al., 1996; Smith & Hawkins, 1973), and
perceived neighbourhood disorder (Reisig & Giacomazzi, 1998; Cao et al., 1996).
These studies were all conducted at the individual level, so both attitudes toward
police and perceptions of crime were gathered in the same questionnaires. Studies
that embed survey respondents in their neighbourhood context and include
independent measures of local conditions come to similar conclusions, however. In
studies in different cities, Reisig and Parks (2000) and Sampson and Jeglum-Bartusch
(1998) found that variations in officially recorded neighbourhood homicide rates are
linked to differences in how people assess the police, even when controlling for
important neighbourhood factors (such as poverty) and individual factors (including
race and experience with the police). Cao et al. (1996: 13) concluded that: ‘‘[I]t
appears that citizens hold the police at least partially responsible for the disorder*/
the ‘broken windows’*/in their neighborhoods. . . . Our respondents appear to
perceive the police as the government’s first-line representative, responsible for
controlling neighborhood disorder.’’
Neighbourhood conditions may be linked to people’s views of the police through
other mechanisms. As Weitzer & Tuch (2004) and others have noted, police often act
differently in high-crime, disorderly neighbourhoods. They are likely to be more
aggressive in stopping people there, and more suspicious*/and wary*/of the people
they stop (Terrill & Reisig, 2003; Mastrofski et al., 2002; Smith, 1986). They may
perceive*/often rightly*/that they have fewer friends around. Police do not have a
very good track record of working collaboratively with people from poor and
disenfranchised communities, one of the requirements of community policing
(Skogan, 1988). Furthermore, because of the confluence of drugs and corruption,
police may also be more prone to this abuse of power in poor and minority
neighbourhoods where the business is more likely to be conducted in public view.
Whatever the mechanisms, research is not uniform on the nature of the link
between neighbourhood conditions and attitude toward the police: Brown and
Benedict (2002) found no link between fear of crime and evaluations of the police,
although confidence was lower among those who were personally victimized.
However, Reisig and Correia (1997: 312) more likely have it right when they
conclude: ‘‘In sum, citizens who inhabit low income, inner-city, minority neighbor-
hoods which experience high levels of crime and disorder, where police abuses of
power are widely noted, generally report less favorable evaluations of police
performance.’’
The analysis presented here includes measures of perceived crime and disorder,
fear of crime, and satisfaction with their neighbourhood. In a multi-
variate analysis, measures of people’s personal experience with the police should
pick up the component of confidence in police that is linked to how police behave
rather than the degree to which they are being held responsible for neighbourhood
conditions.
Policing & Society 103

Personal Experience
Research on encounters with police routinely distinguish between citizen-initiated
and police-initiated contacts; Clancy et al. (2001) refer to them as ‘‘sought ‘‘ and
‘‘unsought’’ contacts, which captures their essence. The legitimacy of police
intervention is surer when they are contacted for assistance; police initiated contacts,
on the other hand, may not be entered into voluntarily and are more likely to be of a
suspicious, inquisitorial and potentially adversarial nature. People who have been
arrested typically are less satisfied than others with police, as are those who report
having been the targets of rude or abusive behaviour (Smith & Hawkins, 1973). In
Britain, Southgate and Ekblom (1984) found that being involved in field interroga-
tions and vehicular stops generated three times as much public ‘‘annoyance’’ (as they
measured it) as other kinds of encounters with police. A survey of London using a
satisfaction measure that is very similar to that employed in this study found that a
bare majority of respondents were satisfied with how they were treated when stopped
by the police, compared to two-thirds of those who had contacted the police about a
crime-related matter (Fitzgerald et al., 2002). In an intriguing study, Sced (2004)
distinguished between police-initiated contacts in which members of the public were
singled out and targeted by the police, compared to being stopped but not being a
particular target of their investigations, and to coming into contact with them
informally or seemingly at random. Controlling for other factors, satisfaction rose
across those three categories, with targeted individuals being the most negative.
Differences in personal experience are also linked to race. Jacob (1971) found that a
large proportion of African-Americans’ encounters with police involve the threat of
sanction. He found, for example, that African-Americans in Milwaukee were more
likely than whites to report being arrested, and most whites who ended up in the
arms of the law did so as a result of traffic-related encounters.
There has been a great deal of research on the views of people who contact the
police, including crime victims. One consistent finding is that victims are less
‘‘outcome’’-oriented than they are ‘‘process’’-oriented*/that is, they are less
concerned about someone being caught or (in many instances) getting stolen
property back, than they are in how promptly and responsibly they are treated by the
authorities. Police are judged by what physicians might call their ‘‘bedside manner’’.
Factors like how willing they are to listen to people’s stories and show concern for
their plight are very important, as are their politeness, helpfulness and fairness. Rapid
response has positive effects as well. Studies by Furstenberg and Wellford (1973), Pate
(1976), Percy (1980) and others document the impact of the speed of police response
on victim satisfaction. Information sharing is also very important. Police willingness
to give advice and to notify victims of progress in their case has a great effect on
victim satisfaction, for example (Sunshine & Tyler, 2003; Tyler & Huo, 2002; Skogan,
1989). The bad news is that they may not do so very often; the 1988 British Crime
Survey found 56 per cent of victims complained that police did not keep them
informed about their case. This lack of communication between police and victims
104 W. G. Skogan

was strongly related to general measures of victim dissatisfaction (Mayhew et al.,
1989). Research on police-initiated contacts finds that fair and courteous treatment,
giving people reasons for stopping them, and explaining their rights, all contribute to
satisfaction with encounters (Skogan, 2004; Bland et al., 2000; Bucke, 1997; Quinton
et al., 2000; Reisig & Chandek, 2001; Stone & Pettigrew, 2000).
The Asymmetric Impact of Experience
The hypothesis that the impact of encounters with the police might be ‘‘asymme-
trical’’ (i.e., that favourable and unfavourable experiences may not have comparable
consequences for people’s assessments of the quality of police service) was first
proposed by Herbert Jacob, based on his study in Milwaukee (Jacob, 1971). More
recently, Miller et al. (2004) found comparable asymmetry in a study of police-
initiated encounters in New York City. Leiber et al. (1998) report that positive
contacts with police may not translate into favourable attitudes toward them among
juveniles, and Cheurprakobkit (2000) reports the same for Hispanics. In a recent
sweep of the British Crime Survey, the most favourable attitudes were reported by
those who had no recent contact with police; those who had contacts of any kind
were generally unfavourable (Nicholas & Walker, 2004). Noting this sort of evidence,
Weitzer & Tuch (2004) advance two incommensurate explanations for asymmetry:
that many people may dismiss good experiences as exceptional rather than the norm,
or (to the contrary) that they may expect good service to be the norm and only pay
attention when they do not get it. Their own work only examines the impact of
negative encounters, and only on perceptions of police misconduct.
There are contrary findings. Reisig and Parks (2000) found a significant link
between satisfaction with encounters and the general views of the public regarding
the police, but in their data the link between dissatisfaction and ratings of the police
was much stronger. Comparing the regression coefficients found in their Table 4, the
negative effect of negatively rated stops was about six times that of the positive effect
of positively rated stops, for example. Correia et al. (1996), Jesilow et al. (1995) and
Thurman and Reisig (1996) also report that positive, voluntary interactions enhance
general satisfaction with police and state troopers. The classic studies of police-public
contacts (including Dean, 1980; Poister & McDavid, 1978; Smith & Hawkins, 1973)
all came to the same conclusion*/that positive experiences help at least a bit. The
fairly unsophisticated statistical models employed in most early studies do not readily
yield evidence of the relative impact of negative and positive experiences, however,
and they did not always include multivariate analyses. The effects of one type of
contact may be statistically significant, but overshadowed by the effects of another.
Because there are strong race, age and perhaps class bias in contacts with the police, it
is also important to factor out their influence using multivariate statistical models. A
recent study that satisfied all of these criteria is Schafer et al. (2003), and they find
that under most circumstances both positively rated and negatively rated encounters
with police have only negative outcomes.
Policing & Society 105

Findings of asymmetry in popular assessments of government services are not
confined to the police. In a national study in the United States, Katz et al. (1975)
examined citizens’ contacts with the bureaucracies that influence their lives, ranging
from the Veterans Administration to the Job Corps and the Social Security
Administration, and with important government programmes, such as Medicare
and Workman’s Compensation. They too found that the effect of negative bureau-
cratic encounters outweighed positive ones when people rated the promptness,
fairness and consideration with which government agencies in general treat
Americans. They concluded: ‘‘People’s perceptions of fairness of their own treatment
by a service agency are related to their evaluation of government offices in general,
but only if their own experiences have been unfortunate. Those who report fair
treatment are no more positive in their general evaluation of agencies than those who
have had no experience with public agencies’’ (Katz et al., 1975: 125). They go on to
note: ‘‘It appears . . . that bad experiences with specific agencies lower the individual’s
general appraisal of public offices, but good experiences do not raise it above the
norm’’ (Katz et al., 1975: 126).
Like all of the research above, we assume here that the causal ordering involved is
from particular recent experiences to global attitudes, but the asymmetry phenom-
enon does not depend on this. In a study that directly addressed the issue of causal
direction, Brandl et al. (1994) found that the effect of experience on general attitudes
was not very large, and that a counter effect (that of people’s general views of the
police on how they interpreted their recent experiences) was stronger. In their view,
people stereotype the police and selectively perceive even their own experiences.
Although they do not make the links since their 1994 article social psychologists have
begun to stress the parallel hypothesis that general, pre-existing attitudes shape how
people interpret their experiences. They find that people read their experiences in the
light of their prior expectations perhaps more than specific experiences affect their
general expectations. In this view, general attitudes affect people’s evaluations of the
encounters they find themselves caught up in, rather than the reverse. The possibility
that this process emphasizes either negative or positive predispositions is another
matter, however.
This research in psychology on the impact of experience reveals a strong ‘‘negativity
bias’’ that shapes the interpretation that people give to their day-to-day experiences.
Two reviews of that literature conclude that people give much more weight to negative
experiences (Baumeister et al., 2001; Rosin & Royzman, 2001). Positive attitudes do
not have as much effect on measured behaviours as negative attitudes or affect. In
experiments, objectively equal negative and positive events are weighted differently.
The lessons of bad things are learned more quickly, and forgotten more slowly, than
the lessons of positive experiences. When people are faced with a mix of positive and
negative experiences, the negative ones predominate in shaping both attitudes and
behaviour. They pay more careful attention to negative experiences, and think about
them and recall them later in more elaborate and fine-grained fashion. Baumeister et
al. (2001) also conclude that people simply remember negative events more readily
106 W. G. Skogan
than they do positive ones. The effects of negativity bias are very strong, affecting both
humans and animals, and appear to be innate as well as learned. Negativity bias thus
provides a psychological foundation for possible asymmetry in the consequences of
police activity on the street. It is consistent with Brandl et al.’s (1994) hypothesis that
the impact of general predispositions on people’s rating of specific encounters is
stronger than the obverse impact of encounters on those predispositions, and it adds a
strong directionality to the net impact of the process.
Data and Measures
The Chicago city survey was conducted by telephone in Spanish and English by the
Survey Research Laboratory of the University of Illinois. Sample telephone numbers
were generated at random to ensure that both listed and non-listed number
households were included. An advance letter was sent to all listed households.
Respondents were selected randomly in households with more than one eligible adult
(aged 18 and older). The most conservative measure of the response rate was 35 per
cent. After dropping cases due to missing data, 3,005 of the original 3,141
respondents represented residents of the city. For descriptive purposes, the data are
weighted to adjust for multiple telephone numbers (which increase the chance of a
household being sampled) and the number of adults in the household (which
decreases the chances of each individual being selected). The multivariate analysis
and all tests of significance were conducted using unweighted data. For more
information on the survey and specific questions, see Skogan and Steiner (2004).
Measuring Confidence in the Police
Responses to six questions were used to assess resident’s general views of the police,
all using 4-point scales. Three questions tracked perceived police responsiveness to
community concerns and whether police were dealing with problems that really
concerned residents. There were also questions about ‘‘how good a job’’ police were
doing in preventing crime, keeping order and helping victims. All of the questions
referred to ‘‘police in your neighbourhood’’. The responses were single-factored, the
average inter-item correlation between them was �/0.63 and the reliability
(Cronbach’s alpha) of the resulting measure was 0.91. In the survey, these questions
were asked before respondents were quizzed about possible recent contacts with the
police in order to enhance recall.
Measuring Neighbourhood Conditions
To measure the perceived extent of neighbourhood conditions, respondents were
requested to rate a list of things ‘‘that you may think are problems in your
neighbourhood’’. They were asked to indicate whether ‘‘you think it is a big problem,
some problem or no problem in your neighbourhood’’. Responses to questions about
Policing & Society 107
gang violence and street drug markets dominated their views of neighbourhood crime
problems. Responses to the two measures, which were correlated �/0.73, were
combined to form an index. Perceived problems with neighbourhood social disorder
were measured by responses to questions about public drinking, loitering, and
disruption in and around schools. The combined 3-item scale had a reliability of 0.77.
To measure fear of crime , respondents were asked how safe they would feel alone
outside in their neighbourhood at night and whether worry about crime prevented
them from doing the things they would like to do in their neighbourhood. Responses
to the two questions were correlated �/0.51. Following Reisig and Parks (2000), a
single question was used to measure how satisfied respondents were with their
neighbourhood ‘‘as a place to live’’.
Measuring Contact with Police
Respondents to the 2003 survey were asked a series of nine screening questions to
establish whether they had contacted the police during the 12 months preceding the
interview. They most frequently recalled contacting police to report a crime (26 per
cent of all respondents did so), followed by reporting an accident or some other
emergency (19 per cent). Between 11 and 13 per cent of those interviewed recalled
reporting suspicious persons, suspicious noises or ‘‘things that might lead to a crime’’.
Some 14 per cent described contacting police regarding ‘‘some other neighbourhood
problem’’, 12 per cent gave police information, and 15 per cent reported contacting
police to ask for advice or information. A total of 10 per cent recalled contacting
them about a matter that was not on the list that was read to them. Taking into
account the overlap, 52 per cent of Chicagoans recalled initiating contact with the
police. Combining incidents involving possible and probable crimes, 36 per cent of
adults contacted police about what they thought might be a criminal matter, while 40
per cent approached them about other concerns and problems. This suggests that
popular views of the police are as likely to be affected by how they handle a broad
range of events as by their ‘‘crime fighting’’ activities.
The survey also asked respondents about their involvement in police-initiated
encounters: 19 per cent of those who were interviewed recalled having been stopped
by police during the past year, either while driving or while they were on foot, and 16
per cent recalled a police-initiated traffic encounter during the previous year. An
overlapping 6 per cent of all respondents described being involved in a foot stop.
There was also a substantial overlap between police-initiated and citizen-initiated
encounters. Among those who were stopped by police, 61 per cent also reported
contacting them about some matter during the course of a year.
Assessing Positive and Negative Encounters
Respondents who had contacts with police were asked follow-up questions about
what happened at the time and how satisfied they were with the way police handled
108 W. G. Skogan
the incident. They were asked separately about public-initiated encounters and then
police-initiated contacts. If they recalled more than one contact in each of those
categories, they were asked to consider the encounter that had occurred most
recently. In principle, the most recent of multiple contacts should constitute a
random sample of encounters, and the most recent should be more memorable.
Respondents were asked about the help they received and the politeness and fairness
with which they were treated. The apparent effort that police put into a case was
measured by perceived response time, and the extent to which police showed respect
to respondents was measured by whether they reportedly paid attention to what
respondents had to say. Attempts by police to establish two-way communication were
measured by asking whether police told those who called what actions they were
going to take in response to their complaint. At the end of each sequence, they were
asked to rate how satisfied they were with their experience.
Table 1 summarizes the measures and presents the percentage of respondents who
responded in a favourable manner regarding police actions in their case. In general,
reviews of citizen-initiated encounters were favourable. Overall, 62 per cent of those
who contacted police indicated that they ‘‘came right away’’, scheduled an
appointment to meet with the police (which was also coded a satisfactory police
response) or handled the matter over the telephone. Other aspects of these
encounters were rated using 4-point scales, and those who contacted the police
were very favourable about the politeness with which they were treated (89 per cent
gave police a favourable rating). They were also very positive that the police paid
attention to what they had to say (86 per cent) and were helpful (81 per cent). Police
were least successful at making it clear to the public what they were going to do about
their complaint (71 per cent were favourable on this dimension). Asked to rate how
satisfied they were overall, 78 per cent gave the police positive marks.
Not surprisingly, those who were pulled over or stopped while they were on foot
were less satisfied with their experience. However, even a majority of them responded
on the positive end of each evaluative question. They were positive about the fairness
with which they were treated (68 per cent were favourable) and about the care police
took to explain the situation to them (69 per cent favourable). They were least
satisfied with how politely they were treated (61 per cent) and police attention to
what they had to say on their own behalf (65 per cent). Overall, 58 per cent of those
who were stopped rated their experience as very or somewhat satisfactory.
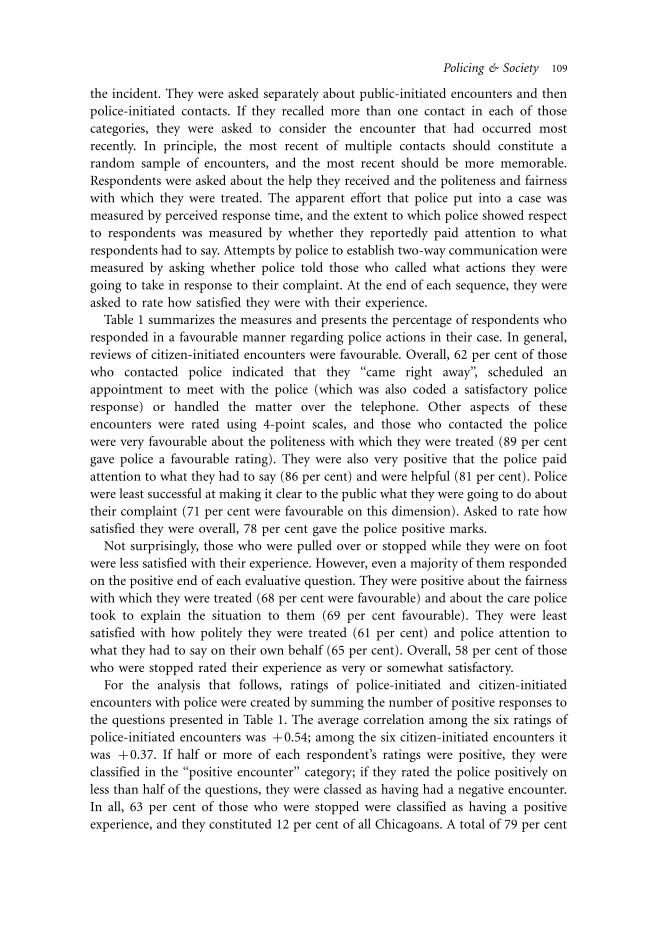
For the analysis that follows, ratings of police-initiated and citizen-initiated
encounters with police were created by summing the number of positive responses to
the questions presented in Table 1. The average correlation among the six ratings of
police-initiated encounters was �/0.54; among the six citizen-initiated encounters it
was �/0.37. If half or more of each respondent’s ratings were positive, they were
classified in the ‘‘positive encounter’’ category; if they rated the police positively on
less than half of the questions, they were classed as having had a negative encounter.
In all, 63 per cent of those who were stopped were classified as having a positive
experience, and they constituted 12 per cent of all Chicagoans. A total of 79 per cent
Policing & Society 109

of those who contacted the police gave them a positive rating, and this was 41 per
cent of all Chicagoans. The reference category in the analysis that follows is persons
who did not have an encounter; they were scored a ‘‘zero’’ on the four dichotomous
measures of positive and negative police and citizen-initiated encounters.1
Analysis
Table 2 presents an OLS regression analysis of the correlates of confidence in the
police, as measured by the six survey questions described above. The left-hand panel
of Table 2 describes the impact of the personal characteristics of respondents, which
proved significantly related to confidence in the police. The personal background
factors are all represented as dichotomies so their coefficients can be compared in
magnitude. Race was represented by dichotomies for the groups listed, with those of
other races (3.3 per cent of respondents) or undetermined race (2.3 per cent)
classified together. Whites made up the ‘‘omitted category’’ against which the effects
of race are benchmarked. Race differences were strong, with both African-Americans
and Latinos expressing more dissatisfaction with policing in their neighbourhood.
Older Chicagoans were more positive about the police, but being a younger person
was significant only in conjunction with race. Being both young and African-
American had an added negative impact, and this was the group in which more than
70 per cent of respondents recalled being stopped in the past year (Skogan & Steiner,
2004). Married-couple households were represented by more optimistic residents.
Table 1 Descriptions of Police Actions
Citizen-initiatedencounters
Percentagefavourable
Police-initiatedencounters
Percentagefavourable
Police came right away,scheduled an appointment orhandled the case by telephone
62 Police clearly explained whythey wanted to talk to them
71
Police paid careful attention towhat they had to say
86 Police paid careful attentionto what they had to say
65
Police clearly explained whataction they would take inresponse, or none wasnecessary
71 Police clearly explained whataction they would take ornone was necessary
69
Police were very or somewhathelpful versus not very helpfulor not at all helpful
81 Police were very orsomewhat fair versussomewhat or very unfair
68
Police were very or somewhatpolite versus somewhat orvery impolite
89 Police were very orsomewhat polite versussomewhat or very impolite
61
Very or somewhat satisfiedversus somewhat or verydissatisfied
78 Very or somewhat satisfiedversus somewhat or verydissatisfied
58
(Unweighted number of cases) (1,539) (Unweighted number ofcases)
(542)
Note: Weighted data; see text.
110 W. G. Skogan

Table 2 Regression Analysis of Confidence in the Police
Personal characteristics Perceived conditions Recent experience
Coefficient Standard error Coefficient Standard error Coefficient Standard error
Intercept 2.91 0.03** 2.64 0.08** 2.72 0.08**
Personal characteristicsAfrican-American �/0.37 0.04** �/0.13 0.03** �/0.12 0.03**Latino �/0.26 0.04** �/0.03 0.03 �/0.04 0.03Other/undetermined race �/0.13 0.06* �/0.04 0.05 �/0.05 0.04Age 60 & older 0.28 0.04** 0.11 0.03** 0.08 0.03**Age 30 or younger 0.03 0.04 �/0.02 0.03 �/0.02 0.03Young & black �/0.19 0.06** �/0.12 0.06* �/0.09 0.05Income over US$40,000 0.02 0.03 �/0.10 0.02** �/0.08 0.02**Married 0.07 0.03** 0.07 0.02** 0.06 0.02**
Perceived conditionsDrug and gang problems �/0.11 0.02** �/0.09 0.02**Social disorder problems �/0.24 0.03** �/0.24 0.03**Fear of crime �/0.04 0.02** �/0.04 0.02*Neighbourhood satisfaction 0.28 0.01** 0.25 0.02**
Recent experiencePositive citizen-initiated 0.02 0.02Negative citizen-initiated �/0.46 0.04**Positive police-initiated 0.06 0.03Negative police-initiated �/0.24 0.04**
R2 0.09 0.35 0.40(Number of cases) (3,005) (3,005) (3,005)
Notes: *pB/0.05; **pB/0.01.
Policin
g&
Society
11
1
Personal factors such as education, having children at home and home ownership
were not significant once this short list of personal factors was taken into account,
and they are not included here. Income played a significant role only when other
factors are taken into account, and neither income nor education had any significant
interactive relationship with race and attitudes concerning the police.
The middle column of Table 2 adds measures of the perceived extent of crime and
disorder problems, fear of crime and neighbourhood satisfaction to the list of
independent variables. These were all significantly related to assessments of the
quality of neighbourhood policing, and they raised the overall R2 from 0.09 to 0.35. It
is important to note that taking neighbourhood conditions into account had a
substantial effect on the coefficients associated with race. Once their perceptions of
neighbourhood crime and disorder, fear of crime and neighbourhood satisfaction
were included, the coefficient for African-Americans dropped by two-thirds, and that
for Latinos by almost 90 per cent. The concentration of these problems in minority
neighbourhoods in Chicago covaries highly with perceptions of the quality of police
service. Conditions tend to be better where older residents are concentrated, and the
coefficient associated with being age 60 and older dropped by half. Income differences
become significant at this point and stay strong, perhaps because those abstract stakes
in the established order discussed earlier do not shine through until objective
conditions are accounted for.
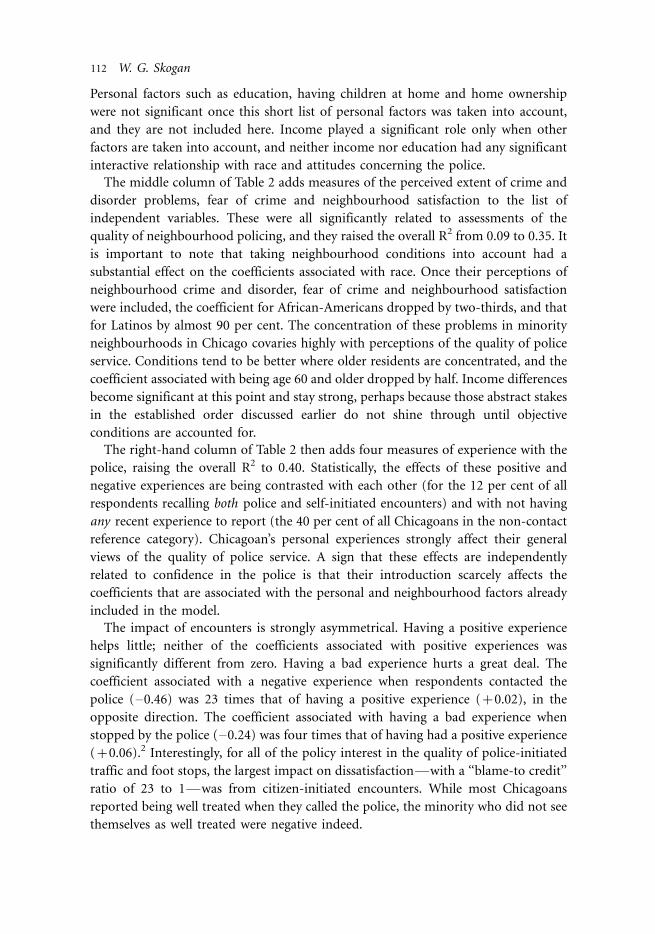
The right-hand column of Table 2 then adds four measures of experience with the
police, raising the overall R2 to 0.40. Statistically, the effects of these positive and
negative experiences are being contrasted with each other (for the 12 per cent of all
respondents recalling both police and self-initiated encounters) and with not having
any recent experience to report (the 40 per cent of all Chicagoans in the non-contact
reference category). Chicagoan’s personal experiences strongly affect their general
views of the quality of police service. A sign that these effects are independently
related to confidence in the police is that their introduction scarcely affects the
coefficients that are associated with the personal and neighbourhood factors already
included in the model.
The impact of encounters is strongly asymmetrical. Having a positive experience
helps little; neither of the coefficients associated with positive experiences was
significantly different from zero. Having a bad experience hurts a great deal. The
coefficient associated with a negative experience when respondents contacted the
police (�/0.46) was 23 times that of having a positive experience (�/0.02), in the
opposite direction. The coefficient associated with having a bad experience when
stopped by the police (�/0.24) was four times that of having had a positive experience
(�/0.06).2 Interestingly, for all of the policy interest in the quality of police-initiated
traffic and foot stops, the largest impact on dissatisfaction*/with a ‘‘blame-to credit’’
ratio of 23 to 1*/was from citizen-initiated encounters. While most Chicagoans
reported being well treated when they called the police, the minority who did not see
themselves as well treated were negative indeed.
112 W. G. Skogan

These findings are bad news for the police, for among the most important
determinants of general satisfaction with what they do are the negative things that
happen when citizens encounter the police. These include police being seemingly
impolite, unhelpful, unfair, inattentive to what they had to say and unwilling to
explain what was going on. The measures of positive and negative experiences
account for 17 per cent of the explained variance described in Table 1. The coefficient
associated with having a negative citizen-initiated encounter was almost four times
that for being an African-American; recalling a bad police-initiated encounter had
twice the impact. This highlights the extreme importance of how people are treated as
the police conduct their routine business. At a time in which there is much discussion
of ‘‘problem-oriented policing’’ and ‘‘intelligence-driven policing’’, there is evidence
pointing to the importance of ‘‘process-oriented policing’’ as well.
Figure 1 illustrates the magnitude of the statistical differences presented in Table 2.
The left-hand panels depict the average confidence scores reported by respondents
recalling positive and negative encounters with police. They are centred at the city
average. The substantial dissatisfaction registered by those recalling a negative
encounter that they had themselves initiated is apparent there, as is the large
difference between the effects of positive and negative encounters generally. Of
course, some of these differences in opinion are due to who was stopped or reached
out for police assistance, so the right-hand panels in Figure 1 depict the distribution
of confidence scores once the other important individual characteristics and
perceived neighbourhood factors listed in Table 1 are taken into account statistically.
The ‘‘residualized’’ differences in views of the police once they are accounted for are
smaller, but still not favourable to the police. Taking into account who police stopped
3.4
3.2
3.3
3.1
aver
age
conf
iden
ce in
pol
ice
3.0
2.9
2.8
2.7
2.6
2.5
2.2
2.3
2.4
2.1
2.0
1.9
1.8
positive contact
negative contact
pos
neg city average confidence
Mean Differences
pos
neg
pos
neg
Residuals
pos
neg
pos
neg
12 control variables
citizen initiated
police initiated
Figure 1 Raw and residualized impacts of experience.
Policing & Society 113

or responded to decreased the apparent magnitude of the impact of negatively rated
encounters (recall that young, African-American males are very likely to be stopped),
but this did not add much on the positive side of the equation.
Among the limitations of this study is the fact that the control variables included in
these calculations do not encompass all of the factors that might influence confidence
in the police. There are no measures of vicarious experience with the police, for
example. This would include knowing about or even talking with other people who
had a tale to tell about an encounter with the police. A 1991Gallup poll found that
African-Americans were far more likely than whites to know someone else who had
been mistreated by police, and to have an abused family member (Gallup
Organization, 1991). Weitzer and Tuch (2004) find a strong independent effect of
knowing other people who have been abused, on a measure of perceived police
misconduct.
There is also no evidence here concerning the possible impact of the media.
Weitzer and Tuch (2004) find that self-reports of the frequency with which people
read about or hear about police misconduct on television has a strong effect on their
perceptions of the extent of misconduct by their neighbourhood police. This effect
was strong for all races, and there was an additional media effect among people who
reported living in high-crime areas. However, patterns of media consumption are
linked to almost every feature of our lives, and it is my judgment that the jury is still
out on media effects. This is an area of research that calls for randomized experiments
that can plausibly rule on the independent impact of both media modalities and
content.
Finally, the Chicago study did not include measures of a wide variety of informal
contacts between police and residents. Maxson et al. (2003) report that encounters at
meetings and events such as those associated with community policing are received
more favourably than emergency calls and stops, but no measures of those are
available here.
Asymmetry across Cities
Is the disproportionate impact of negatively evaluated personal experience with the
police just a Chicago phenomenon, or is it a general one? This is an important
question because of the implications of asymmetry for practice. We saw above that
some studies identified significant effects of positive encounters, although in not
many could the balance of positive and negative effects be interpreted. In order to
examine the jurisdictional generality of this apparent asymmetry in police-public
encounters, I recoded and examined surveys conducted in other places over a ten-
year period. The metric of the measures was similar in every study. The dependent
variable (confidence in the police) was always measured on 4-point scales, so
deviations around city means like those presented in Figure 1 are comparable. The
measurement strategy employed in studies was the same as well. They all screened
separately for recent citizen and police-initiated contacts, then asked follow-up
114 W. G. Skogan
questions that could be used to classify the encounters as positive or negative in
character. I weighted the surveys to accommodate their sampling designs, and to
standardize the sex and (when possible) racial distribution of the data at
approximately Census figures. The Appendix describes the surveys and presents
some general information about the measures; a table detailing the measures used in
each study is available upon request from the author.
These points of convergence do not mean that there were not significant
differences between the studies. They varied in the wording of the questions that
they used to assess popular confidence in the police; they varied in the kinds of
experiences that were included in the screening questions; and they varied in how they
assessed what happened on the scene when people were stopped or had contacted the
police. There was some minor variation in the demographic factors measured by the
surveys, and more in the questions used to assess neighbourhood conditions. The
studies varied a great deal in the number of questions that went into each of the
analytic measures that were developed. Confidence in the police is always measured
using a multi-item scale, but the number of items ranges between two and ten
questions. The screening questions identifying respondents who had contacted the
police ranged from one to nine in number. In some studies, only one question, and in
others as many as six, were used to classify police-initiated encounters as positive or
negative in character. This diversity certainly reduces what we might call the
‘‘mechanical comparability’’ of the studies. However, if the findings are still
comparable*/and they are*/it increases our confidence in their robustness and
generality. That they are comparable across diverse operationalizations of the basic
constructs (police-citizen encounters, perceived quality of treatment and confidence
in the police) may be seen as further evidence of the generality of the asymmetric
impact of experience with the police across time and space.
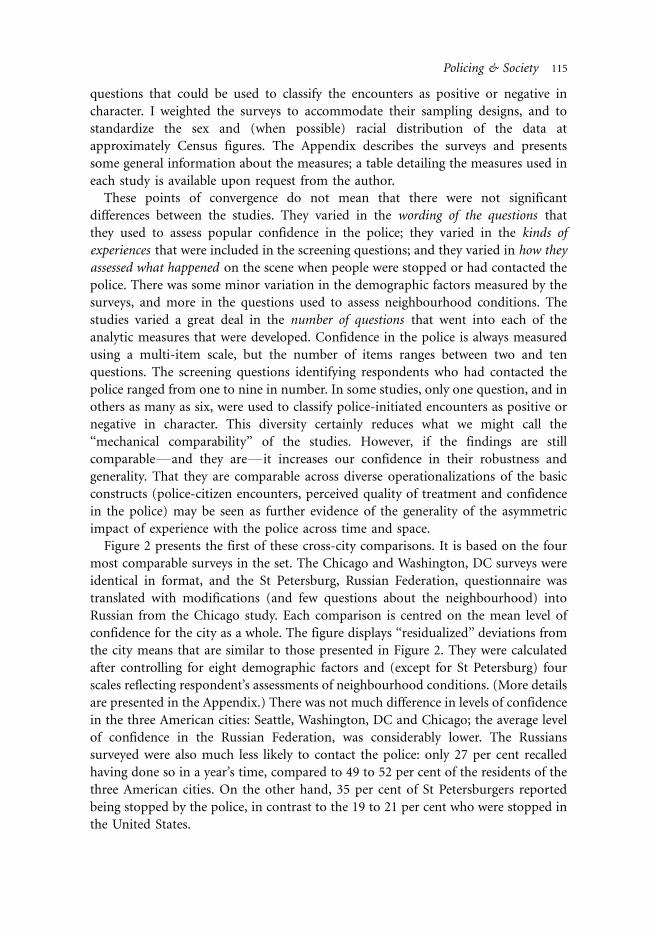
Figure 2 presents the first of these cross-city comparisons. It is based on the four
most comparable surveys in the set. The Chicago and Washington, DC surveys were
identical in format, and the St Petersburg, Russian Federation, questionnaire was
translated with modifications (and few questions about the neighbourhood) into
Russian from the Chicago study. Each comparison is centred on the mean level of
confidence for the city as a whole. The figure displays ‘‘residualized’’ deviations from
the city means that are similar to those presented in Figure 2. They were calculated
after controlling for eight demographic factors and (except for St Petersburg) four
scales reflecting respondent’s assessments of neighbourhood conditions. (More details
are presented in the Appendix.) There was not much difference in levels of confidence
in the three American cities: Seattle, Washington, DC and Chicago; the average level
of confidence in the Russian Federation, was considerably lower. The Russians
surveyed were also much less likely to contact the police: only 27 per cent recalled
having done so in a year’s time, compared to 49 to 52 per cent of the residents of the
three American cities. On the other hand, 35 per cent of St Petersburgers reported
being stopped by the police, in contrast to the 19 to 21 per cent who were stopped in
the United States.
Policing & Society 115

In each case, the negative deviations from the city mean associated with negatively
rated encounters with the police were larger than the positive deviations associated
with positively rated encounters (excepting Seattle, where on average everyone
stopped by the police was unhappy to some degree). The ratio of each pair of
residualized deviations is one measure of the asymmetry in the credit and blame that
is garnered by these contacts. For Chicago, the benchmark city in this study, the
blame-to-credit ratio was 6 to 1 for citizen-initiated encounters and 3 to 1 for police-
initiated contacts. The ratios for Seattle and the District of Columbia were in the 3 to
1 to 8 to 1 range, although police in Seattle actually received no credit at all for
positively rated encounters. Blame-to-credit imbalances were smaller in Russia (about
2 to 1) because police there got a bit more credit when they appeared to be doing a
professional job.
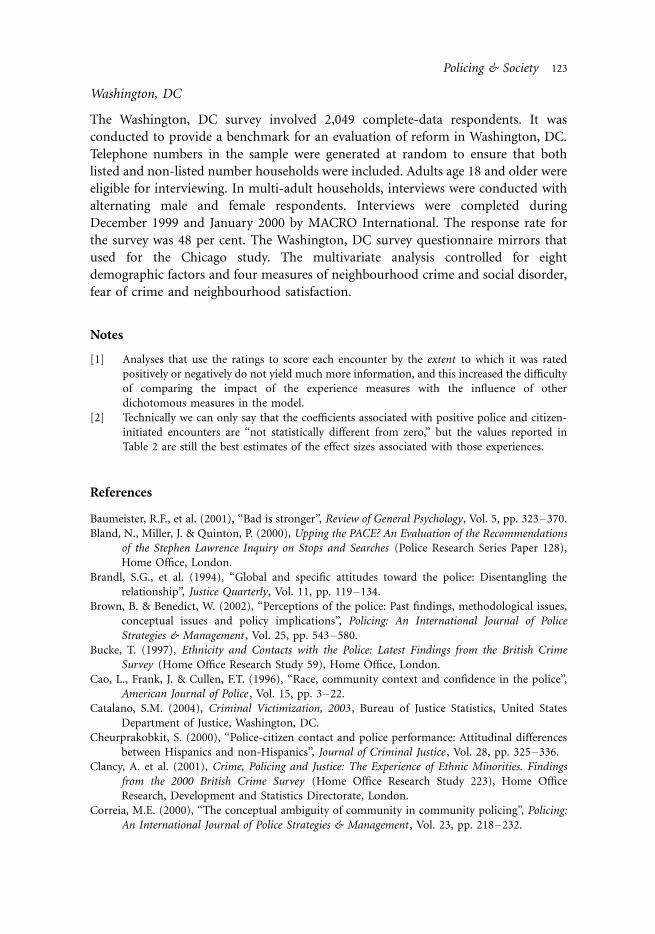
Figure 3 presents data for another group of city comparisons. As detailed in the
Appendix, the surveys in New York City, Indianapolis and St Petersburg, Florida,
used fewer measures to assess the frequency and character of police-citizen contacts,
and generally had fewer measures of confidence in the police. The St Petersburg and
Indianapolis questionnaires were identical, part of the same study. The British Crime
Survey was a national study using a questionnaire that strongly influenced the design
of the Chicago project. For this analysis, I selected only respondents living in urban
areas in England and Wales.
In each case there was again considerable asymmetry in the impact of positive and
negative experiences with the police. The blame-to-credit ratio was large New York
City (for citizen-initiated encounters it was 11 to 1, and for police-initiated contacts it
3.4
3.2
3.3
3.1
aver
age
conf
iden
ce in
pol
ice
3.0
2.9
2.8
2.7
2.6
2.5
2.2
2.3
2.4
2.1
2.0
1.9
1.8
citizen initiated
police initiated positive contact
negative contact
pos
neg city average confidence
Seattle WashingtonDC Chicago
St PetersburgRFpos
pos pospos
pospos
pos
posneg
neg
neg
neg
neg
negneg
neg
deviations controlling for demographic and attitudinal factors
Figure 2 Impact of experience in four cities.
116 W. G. Skogan

was 5 to 1). They were smaller in St Petersburg, Florida: 3 to 1 and 2 to 1. The loss of
confidence associated with negatively rated contacts with police were smaller in
England and Wales, but there was little credit to be had there, so for citizen-initiated
contacts the blame-to-credit ratio was still 5 to 1. No credit at all was allocated to
positively rated police-initiated encounters in England and Wales.
Summary and Conclusions
This article examined the impact of personal experience on popular assessments of
the quality of police service, arguing that it is an important issue for policy and
practice. Past research had made note of a possible asymmetry in the relationship
between experience and attitudes, but in only a few studies could the reader ferret out
interpretable information about the relative strength of positive and negative
encounters, and that was never the central focus of the study. Past research has
indicated that it is also important to take into account the influence of other factors
that are known to have strong impact on attitudes toward the police before
examining the impact of recent experiences. Research in psychology on the impact of
positive and negative experiences has revealed a strong ‘‘negativity bias’’, and this is
consistent with an asymmetry hypothesis. Negative events are given more weight,
people pay more attention to negative cues, the lessons they carry are learned more
quickly and negative experiences have more impact on behaviour. Negativity bias
thus provides a psychological foundation for possible asymmetry in the consequences
of police activity on the street.
3.4
3.2
3.3
3.1
aver
age
conf
iden
ce in
pol
ice
3.0
2.9
2.8
2.7
2.6
2.5
2.2
2.3
2.4
2.1
2.0
1.9
1.8
citizen initiated
police initiated positive contact
negative contact
pos
neg city average confidence
St. PetersburgFL
Indianapolis
New York
pos pos pospos
pos
pos
neg
neg neg
negneg
neg
pospos
neg neg
England& Wales
(urban)
deviations controlling for demographic and attitudinal factors
Figure 3 Impact of experience in four additional cities.
Policing & Society 117

A significant feature of the findings reported here is that asymmetry holds for both
police- and citizen-initiated encounters. These are somewhat different groups; in
Chicago, 20 per cent of residents recalled being stopped, but more than half reported
contacting the police on their own. The latter were contacting them concerning a
wide variety of matters; for about half, their call concerned reporting an accident or
some other emergency, asking for advice or information, or calling the police to give
them information about some non-crime matter. Although many (e.g., Decker, 1981)
have characterized police-initiated and citizen-initiated encounters as fundamentally
different in character, in every case examined here both kinds of contacts showed
strong asymmetry. In most instances, citizen-initiated contacts showed stronger
asymmetry than police-initiated contacts.
The importance of this observation is further justified by the fact that citizen-
initiated encounters are much more common than police-initiated contacts. Only in
the Russian Federation did more people report being stopped by the police than had
contacted them. In the other cities, citizen-initiated contacts were between 2½ and 3
times more frequent than police-initiated encounters. This serves to multiply the
potential consequences of the asymmetry with which publically initiated encounters
were rated.
The multiple replications presented here also document that the asymmetry effect
is robust across time and across countries. Estimates of its magnitude*/the blame to
credit ratio discussed above*/also do not seem to vary systematically with how the
measures are operationalized. There was wide variety in the number and wording of
the measures used to screen for contact with the police, to assess the positive or
negative character of the resulting encounters, and to measure general attitudes
toward the police, but in every case blame exceeded credit by a significant margin,
and in some instances there was no credit allocated at all.
The concept of negativity bias, which is consistent with the evidence presented
here, also supports the general argument advanced by Brandl et al. (1994). It is
consistent with their position that people’s general views of the police have a more
powerful impact on how they interpret their experiences, compared to the impact
that experience has on their general views. They thought of this as stereotyping, but
negativity bias accounts more easily for the heavily one-sided direction of the effect.
Why does all of this matter? Popular opinion matters in part because widespread
confidence in the police makes their work easier and more effective . Tyler (2004)
concludes that the degree to which people view the police as legitimate influences
whether they comply with police orders or requests. People accept their decisions
when they believe the police have acted fairly and openly with them (Tyler & Huo,
2002). Observational studies of on-street encounters find that experiencing disrespect
from the police reduces citizen compliance with their instructions (Mastrofski et al.,
1996; McCluskey et al., 1999). Controlling for other factors, McCluskey (2003) found
that people who were observed receiving respectful treatment were twice as likely to
comply, and those receiving disrespectful treatment were nearly twice as likely to
rebel. Likewise, he found that when police patiently discussed a situation with them,
118 W. G. Skogan

people were more than twice as likely to comply with their requests. There is also
evidence that how people are treated by the police influences their willingness to obey
the law when the police are not around (Sunshine & Tyler, 2003; Tyler, 1990).
Variations in police conduct have been shown to influence later re-offending
(Paternoster et al., 1997; Paternoster, 1987). Favourable views of the police may
influence how ready people are to step forward to help the police by reporting crimes,
identifying offenders and serving as witnesses (Brown & Benedict, 2002), but I wish
the evidence were stronger on this point.
By inference, the large asymmetry we observe in many places*/and in particular
the small credit that most people seem to give to police actions even when they
describe them in generally positive fashion*/could be interpreted as implying that
the quality of service rendered does not matter very much. Few would want to press
that point normatively, however. As a normative question, the answer seems quite
clear: democracies are committed to both equality of treatment and an objectively fair
level of treatment through almost every aspect of their laws and constitutions. Yet the
one-sided interpretation of those efforts remains a huge stumbling block for well-
meaning practitioners. As Katz et al. (1975: 129) concluded thirty years ago in their
study of encounters with bureaucracies: ‘‘It is almost as if agency people can do
nothing to improve the general public image of government officers through
consideration of clients and fairness of treatment, but they can do a great deal to
impair it by unfair and inconsiderate handling of clients.’’ The empirical message is,
unfortunately, ‘‘You can’t win, you can just cut your losses.’’ No matter what you do,
it only counts when it goes against you.
Appendix
This appendix describes the surveys used in this analysis. Detailed tables summarizing
and comparing the questions used in each survey are available upon request from the
author.
Chicago
The 2003 City of Chicago survey involved telephone interviews with 3,005
respondents with complete data for this study. Sample telephone numbers were
generated at random to ensure that both listed and non-listed number households
were included. In households with more than one eligible adult aged 18 and older, the
respondent was selected randomly. The survey was conducted in Spanish and English
by the Survey Research Laboratory of the University of Illinois. The resulting response
rate was 35 per cent. For descriptive purposes, the data were weighted to adjust for
multiple telephone numbers (which increase the chance of a household being
sampled) and the number of adults in the household (which decreases the chances of
each individual being selected). For more information, see Skogan and Steiner
(2004).
Policing & Society 119

British Crime Survey
The 1992 British Crime Survey (BCS) involved personal interviews with households
in England and Wales selected from the Postcode Address file, a national listing of all
postal delivery points. Respondents were chosen to make up a representative sample
of persons 16 years of age and older living in private households. Field work was
conducted from January to March 1992, and the survey’s response rate was 77 per
cent. Weights are used to adjust for the over-sampling of inner-city households and
for differential household size. The analysis examines the subset of 3,138 respondents
living in urban areas who had complete data for this study. The survey uses a robust
ten-item screener for encounters with police. It shared four of Chicago’s seven follow-
up questions about citizen-initiated encounters, and five of six follow-up questions
about the most recent police-initiated encounter. The 7-item dependent variable
includes questions concerning non-enforcement effectiveness (helping and support-
ing crime victims, giving the public crime prevention advice, and working with
groups to solve crime and other problems) and questions about controlling social
disorder, violent crime and motoring offenses. The multivariate analysis controlled
for eight demographic factors and four measures of neighbourhood crime and social
disorder, fear of crime and neighbourhood satisfaction. For more information, see
Skogan (1994).
Indianapolis
The City of Indianapolis survey involved telephone interviews with 4,628 complete-
data respondents. Interviews were conducted during 1996. The data were collected
using separate samples of the fifty patrol beats that make up the city of Indianapolis.
The target number of respondents per beat was 100; this quota was not fully met in
downtown Indianapolis beats. Potential survey households were selected randomly
from residences with listed telephone numbers. Interviews were completed by
telephone with a household respondent selected randomly from among residents 18
years of age and older. The survey response rate was 53 per cent. In this analysis,
weights were used to compensate for the over representation of female respondents
and to readjust the beat samples to reflect their true proportion of the city-wide
population. Two items are used to measure confidence in the police: a rating of the
job police were doing working with people in their neighbourhood to solve local
problems, and respondents’ overall satisfaction with the quality of police services in
their neighbourhood. Two questions screened for citizen-initiated contacts with
police (reporting a crime and calling for assistance), and one for police initiated
contacts (stopped by police, but excluding traffic stops). Responses to two items
measured satisfaction with citizen-initiated encounters (satisfaction and if they took
care of the problem) and one (satisfaction) assessed police-initiated encounters. The
multivariate analysis controlled for seven demographic factors and four measures of
120 W. G. Skogan

neighbourhood crime and social disorder, fear of crime and neighbourhood
satisfaction. For more information, see Reisig and Parks (2000).
New York
The New York City survey involved telephone interviews with respondents living in
five police precincts. The interviews were conducted in nine waves between January
and October 2002, with a target quote of 40 respondents per wave per precinct. A
total of 1,887 complete-data interviews were conducted by the University of
Baltimore’s Schaefer Center for Public Policy. The questionnaire shared four of
Chicago’s six measures of confidence in the police, adding ‘‘promptly respond to calls
for assistance’’. It used one-item measures to screen for citizen and police-initiated
contacts with police, and one-item measures of satisfaction with encounters (in each
case, ‘‘how well were you treated?’’). The multivariate analysis controlled for eight
demographic factors; no perceptual measures of neighbourhood conditions were
included in the survey. For further information, see Miller et al. (2004).
St Petersburg, Florida
The St Petersburg, Florida, survey involved telephone interviews with 1,788
complete-data respondents. Interviews were conducted during 1997. The surveys
were conducted as 12 separate samples of police beats in St Petersburg, plus an
additional four samples in St Petersburg collected to represent the remainder of the
city. The 12 St Petersburg neighbourhoods are a subset of that city’s 48 beats. The
target number of respondents was 100 per beat. Potential survey households were
selected randomly from residences with listed telephone numbers. Interviews were
completed by telephone with a household respondent selected randomly from among
residents 18 years of age and older. The survey response rate was 42 per cent. In this
analysis, weights were used to compensate for the over representation of female
respondents and to readjust the beat samples to reflect their true proportion of the
city-wide population. The questionnaire was identical to the Indianapolis survey. Two
items were used to measure confidence in the police: a rating of the job police were
doing working with people in their neighbourhood to solve local problems, and
respondents’ overall satisfaction with the quality of police services in their
neighbourhood. The survey used two questions to screen for citizen-initiated
contacts with police (reporting a crime and calling for assistance), and one for
police initiated contacts (stopped by police, but excluding traffic stops). Two items
measured satisfaction with citizen-initiated encounters (satisfaction and if they took
care of the problem) and one (satisfaction) assessed police-initiated encounters. The
multivariate analysis controlled for eight demographic factors and four measures of
neighbourhood crime and social disorder, fear of crime and neighbourhood
satisfaction. For more information, see Reisig and Parks (2000).
Policing & Society 121

St Petersburg, Russian Federation
The 2003 City of St Petersburg, Russian Federation, survey involved interviews with
1,788 complete-data respondents. There was considerable missing data for the first
ten questions, which opened the survey by gathering respondent’s attitudes toward
the police, reducing the effective sample size by about 15 per cent. Samples of 200
households each were selected in St Petersburg’s 13 centre-city administrative
districts, and interviews were conducted using a quota sample stratified by sex and
age. The survey questionnaire was translated, with some modifications, from that
used for the Chicago study. Responses to nine questions were used to measure general
confidence in the police. Two questions gauged citizen-initiated contacts with police
(contacted the police and reported a crime), and respondents were asked five follow-
up evaluative questions. Two items screened for police-initiated contacts (stopped
while in a car and stopped on the street), followed by four follow-up questions. The
multivariate analysis controlled for six demographic factors; no perceptual measures
of neighbourhood conditions were included in the survey. The survey was conducted
with support from the Ford Foundations’s Human Rights Project, administered by
the Vera Foundation, and was directed by Professor Yakov Galinski of the St
Petersburg Institute of Sociology.
Seattle
The Seattle survey involved telephone interviews with 1,344 complete-data respon-
dents. Both citywide RDD samples and listed number samples were drawn.
Responding households were screened for race in order to generate a completed
sample consisting of 400 interviews with each of four target ethnic groups: whites,
Asians, Latinos and African-Americans. Interviews were completed from May to July
2003. The survey was conducted in both English and Spanish. In most households
with more than one eligible respondent age 18 and older, the respondent was selected
randomly. No estimates are available of the survey response rate. For the analyses
presented here, weights were used to adjust the sample to represent 2000 Census
figures for Seattle. The survey shared five of Chicago’s six measures of confidence in
the police, adding ‘‘promptly respond to emergency calls for assistance’’. It included
five of Chicago’s nine questions screening for citizen-initiated contacts with the
police, and both screening questions for police-initiated contacts. It shared three of
Chicago’s seven measures of what happened during citizen-initiated encounters,
adding two more (‘‘treated professionally and respectfully’’ and ‘‘kept informed of the
status of the case’’). It shared one of Chicago’s six measures of what happened during
police-initiated encounters, adding four. The multivariate analysis controlled for
seven demographic factors and four measures of neighbourhood crime and social
disorder, fear of crime and neighbourhood satisfaction. For more information, see
Davis et al. (2004).
122 W. G. Skogan
Washington, DC
The Washington, DC survey involved 2,049 complete-data respondents. It was
conducted to provide a benchmark for an evaluation of reform in Washington, DC.
Telephone numbers in the sample were generated at random to ensure that both
listed and non-listed number households were included. Adults age 18 and older were
eligible for interviewing. In multi-adult households, interviews were conducted with
alternating male and female respondents. Interviews were completed during
December 1999 and January 2000 by MACRO International. The response rate for
the survey was 48 per cent. The Washington, DC survey questionnaire mirrors that
used for the Chicago study. The multivariate analysis controlled for eight
demographic factors and four measures of neighbourhood crime and social disorder,
fear of crime and neighbourhood satisfaction.
Notes
[1] Analyses that use the ratings to score each encounter by the extent to which it was rated
positively or negatively do not yield much more information, and this increased the difficulty
of comparing the impact of the experience measures with the influence of other
dichotomous measures in the model.
[2] Technically we can only say that the coefficients associated with positive police and citizen-
initiated encounters are ‘‘not statistically different from zero,’’ but the values reported in
Table 2 are still the best estimates of the effect sizes associated with those experiences.
References
Baumeister, R.F., et al. (2001), ‘‘Bad is stronger’’, Review of General Psychology, Vol. 5, pp. 323�/370.
Bland, N., Miller, J. & Quinton, P. (2000), Upping the PACE? An Evaluation of the Recommendations
of the Stephen Lawrence Inquiry on Stops and Searches (Police Research Series Paper 128),
Home Office, London.
Brandl, S.G., et al. (1994), ‘‘Global and specific attitudes toward the police: Disentangling the
relationship’’, Justice Quarterly, Vol. 11, pp. 119�/134.
Brown, B. & Benedict, W. (2002), ‘‘Perceptions of the police: Past findings, methodological issues,
conceptual issues and policy implications’’, Policing: An International Journal of Police
Strategies & Management , Vol. 25, pp. 543�/580.
Bucke, T. (1997), Ethnicity and Contacts with the Police: Latest Findings from the British Crime
Survey (Home Office Research Study 59), Home Office, London.
Cao, L., Frank, J. & Cullen, F.T. (1996), ‘‘Race, community context and confidence in the police’’,
American Journal of Police , Vol. 15, pp. 3�/22.
Catalano, S.M. (2004), Criminal Victimization, 2003 , Bureau of Justice Statistics, United States
Department of Justice, Washington, DC.
Cheurprakobkit, S. (2000), ‘‘Police-citizen contact and police performance: Attitudinal differences
between Hispanics and non-Hispanics’’, Journal of Criminal Justice , Vol. 28, pp. 325�/336.
Clancy, A. et al. (2001), Crime, Policing and Justice: The Experience of Ethnic Minorities. Findings
from the 2000 British Crime Survey (Home Office Research Study 223), Home Office
Research, Development and Statistics Directorate, London.
Correia, M.E. (2000), ‘‘The conceptual ambiguity of community in community policing’’, Policing:
An International Journal of Police Strategies & Management , Vol. 23, pp. 218�/232.
Policing & Society 123

Correia, M.E., Reisig, M.D. & Lovrich, N. (1996), ‘‘Public perceptions of state police: An analysis of
individual-level and contextual variables’’, Journal of Criminal Justice , Vol. 24, pp. 17�/28.
Davis, R.C., Henderson, N.J. & Cheryachukin, Y. (2004), Assessing Police-Public Contacts in Seattle,
WA , Very Institute of Justice, New York.
Dean, D. (1980), ‘‘Citizen ratings of the police: The difference police contact makes’’, Law and Policy
Quarterly, Vol. 2, pp. 445�/471.
Decker, S. (1981), ‘‘Citizen attitudes toward the police: A review of past findings and suggestions for
future policy’’, Journal of Police Science and Administration , Vol. 9, pp. 80�/87.
Fitzgerald, M., et al. (2002), Policing for London , Willan, Cullompton.
Furstenberg, F.F. & Wellford, C.F. (1973), ‘‘Calling the police: The evaluation of police service’’, Law
& Society Review , Vol. 7, pp. 393�/406.
Gallup Organization (1991), The Gallup Poll: Public Opinion 1991 , Gallup Organization,
Wilmington, DE.
Graber, D. (1980), Crime News and the Public , Praeger, New York.
Hillard, T. (2003), Comments delivered at the Third National Symposium on Racial Profiling,
Center for Public Safety, Northwestern University, Evanston, IL, November.
Jacob, H. (1971), ‘‘Black and white perceptions of justice in the city’’, Law & Society Review , Vol. 6,
pp. 69�/90.
Jesilow, P, Meyer, J. & Namazzi, N. (1995), ‘‘Public attitudes toward the police’’, American Journal of
Police , Vol. 14, pp. 67�/88.
Katz, D., et al. (1975), Bureaucratic Encounters: A Pilot Study in the Evaluation of Government
Services , Institute for Social Research, University of Michigan, Ann Arbor, MI.
Langan, P.A., et al. (2001), Contacts between Police and the Public: Findings from the 1999 National
Survey, Bureau of Justice Statistics, United States Department of Justice, Washington, DC.
Leiber, M.J., Nalla, M.K. & Farnsworth, M. (1998), ‘‘Explaining juveniles’ attitudes toward the
police’’, Justice Quarterly, Vol. 15, pp. 151�/173.
Lundman, R.J. & Kaufman, R.L. (2003), ‘‘Driving while black: Effects of race, ethnicity and gender
on citizen self-reports of traffic stops and police actions’’, Criminology, Vol. 41, pp. 195�/220.
Mastrofski, S., Snipes, J. & Supina, A. (1996), ‘‘Compliance on demand: The public’s responses to
specific police requests’’, Journal of Crime & Delinquency, Vol. 33, pp. 269�/305.
Mastrofski, S., Reisig, M.D. & McCluskey, J.D. (2002), ‘‘Police disrespect toward the public: An
encounter-based analysis’’, Criminology, Vol. 39, pp. 519�/552.
Maxson, C., Hennigan, K. & Sloane, D.C. (2003), Factors That Influence Public Opinion of the Police ,
National Institute of Justice, United States Department of Justice, Washington, DC.
Mayhew, P., Elliott, D. & Dowds, L. (1989), The 1988 British Crime Survey (Home Office Research
Study 111), HMSO, London.
McCluskey, J. (2003), Police Requests for Compliance: Coercive and Procedurally Just Tactics , LFB,
New York.
McCluskey, J., Mastrofski, S. & Parks, R. (1999), ‘‘To acquiesce or rebel: Predicting citizen
compliance with police requests’’, Police Quarterly, Vol. 2, pp. 389�/416.
Miller, J., et al. (2004), Public Opinion of the Police: The Influence of Friends, Family and New Media ,
Vera Foundation, New York.
Nicholas, S. & Walker, A. (2004), Crime in England and Wales, 2002/2003. Supplementary Volume 2:
Crime, Disorder and the Criminal Justice System*/Public Attitudes and Perceptions , Home
Office Research, Development and Statistics Directorate, London.
Pate, A. (1976), Police Response Time: Its Determinants and Effects , Police Foundation, Washington,
DC.
Paternoster, R. (1987), ‘‘The deterrent effect of the perceived certainty and severity of punishment’’,
Justice Quarterly, Vol. 4, pp. 173�/217.
Paternoster, R., et al. (1997), ‘‘Do fair procedures matter?’’, Law & Society Review, Vol. 31, pp. 163�/
204.
124 W. G. Skogan

Percy, S. (1980), ‘‘Response time and citizen evaluation of police’’, Journal of Police Science &
Administration , Vol. 8, pp. 75�/86.
Poister, T.H. & McDavid, J.C. (1978), ‘‘Victims’ evaluation of police performance’’, Journal of
Criminal Justice , Vol. 6, pp. 133�/149.
Quinton, P., Bland, N. & Miller, J. (2000), Police Stops: Decision-making and Practice (Police
Research Series Paper 130), Home Office, London.
Reisig, M.D. & Chandek, M.S. (2001), ‘‘The effects of expectancy disconfirmation on outcome
satisfaction in police-citizen encounters’’, Policing: An International Journal of Police Strategies
& Management , Vol. 21, pp. 88�/99.
Reisig, M.D. & Correia, M.E. (1997), ‘‘Public evaluation of police performance: An analysis across
three levels of policing’’, Policing: An International Journal of Police Strategies & Management ,
Vol. 20, pp. 311�/325.
Reisig, M.D. & Giacomazzi, A. (1998), ‘‘Citizen perceptions of community policing: Are attitudes
toward police important’’, Policing , Vol. 21, pp. 547�/561.
Reisig, M.D. & Parks, R.B. (2000), ‘‘Experience, quality of life and neighborhood context: A
hierarchical analysis of satisfaction with police’’, Justice Quarterly, Vol. 17, pp. 607�/630.
Rosin, P. & Royzman, E.B. (2001), ‘‘Negativity bias, negativity dominance and cognition’’,
Personality & Social Psychology Review, Vol. 5, pp. 296�/320.
Sampson, R.J. & Jeglum-Bartusch, D. (1998), ‘‘Legal cynicism and (subcultural?) tolerance of
deviance: The neighborhood context of racial differences’’, Law & Society Review, Vol. 32, pp.
777�/804.
Schafer, J.A., Huebner, B.M. & Bynum, T.S. (2003), ‘‘Citizen perceptions of police services: Race,
neighborhood context and community policing’’, Police Quarterly, Vol. 6, pp. 440�/468.
Sced, M. (2004), Public Satisfaction with Police Contact. Part I: Police-initiated Contacts (Current
Commentary 8). Australasian Center for Policing Research, Adelaide.
Skogan, W.G. (1988), Community organizations and crime, in: Tonry, M. & Morris, N. (eds) Crime
and Justice: An Annual Review, 8 , University of Chicago Press, Chicago, IL.
Skogan, W.G. (1989), The impact of police on victims, in: Viano, E. (ed.) Crime and Its Victims ,
Hemisphere, New York.
Skogan, W.G. (1994), Contacts Between Police and The Public: A British Crime Survey Report (Home
Office Research Study 135), HMSO, London.
Skogan, W.G. (2004), ‘‘Citizen satisfaction with police encounters’’, Police Quarterly, Vol. 6, pp. 1�/
24.
Skogan, W.G. & Hartnett, S.M. (1997), Community Policing, Chicago Style , Oxford University Press,
New York.
Skogan, W.G. & Steiner, L. (2004), Community Policing in Chicago: Year Ten , Criminal Justice
Information Authority, Chicago, IL.
Smith, D. (1986), The neighborhood context of police behavior, in: Tonry, M. & Morris, N. (eds)
Crime and Justice: An Annual Review, Vol. 8 , University of Chicago Press, Chicago, IL.
Smith, P.E. & Hawkins, R.O. (1973), ‘‘Victimization, types of citizen-police contacts and attitudes
toward the police’’, Law & Society Review, Vol. 8, pp. 135�/152.
Southgate, P. & Ekblom, P. (1984), Contacts between Police and Public (Home Office Research Study
77), HMSO, London.
Stone, V. & Pettigrew, N. (2000), The Views of the Public on Stops and Searches (Police Research
Series Paper 129), Home Office, London.
Sunshine, J. & Tyler, T.R. (2003), ‘‘The role of procedural justice and legitimacy in shaping public
support for policing’’, Law & Society Review , Vol. 37, pp. 513�/548.
Terrill, W. & Reisig, M.D. (2003), ‘‘Neighborhood context and police use of force’’, Journal of
Research in Crime & Delinquency, Vol. 40, pp. 291�/321.
Thurman, Q.C. & Reisig, M.D. (1996), ‘‘Community-oriented research in an era of community-
oriented policing’’, American Behavioral Scientist , Vol. 39, pp. 570�/586.
Policing & Society 125

Tuch, S.A. & Weitzer, R. (1997), ‘‘The polls: Racial differences in attitudes toward the police’’, Public
Opinion Quarterly, Vol. 61, pp. 642�/663.
Tyler, T.R. (1990), Why People Obey the Law, Yale University Press, New Haven, CT.
Tyler, T.R. (2004), ‘‘Enhancing police legitimacy’’, Annals of the American Academy of Political &
Social Science , Vol. 593, pp. 84�/99.
Tyler, T.R. & Huo, Y.J. (2002), Trust in the Law, Russell Sage Foundation, New York.
Walker, D., et al. (1972), ‘‘Contact and support: An empirical assessment of public attitudes toward
the police and the courts’’, North Carolina Law Review , Vol. 51, pp. 43�/79.
Weitzer, R. & Tuch, S.A. (1999), ‘‘Race, class and perceptions of discrimination by the police’’, Crime
& Delinquency, Vol. 45, pp. 494�/507.
Weitzer, R. & Tuch, S.A. (2004), ‘‘Race and perceptions of police misconduct’’, Social Problems , Vol.
51, pp. 305�/325.
126 W. G. Skogan