Asymmetric Rivalry Between Strategic Group
33
Strategic Management Journal Strat. Mgmt. J., 26: 713–745 (2005) Published online 7 June 2005 in Wiley InterScience (www.interscience.wiley.com). DOI: 10.1002/smj.471 ASYMMETRIC RIVALRY BETWEEN STRATEGIC GROUPS: RESPONSE, SPEED OF RESPONSE AND EX ANTE VS. EX POST COMPETITIVE INTERACTION IN THE SPANISH BANK DEPOSIT MARKET FRANCISCO J. M ´ AS-RUIZ,* JUAN L. NICOL AU-GONZ ´ ALBEZ and FELI PE RUIZ-MORENO Facul tad de Ciencias Econ ´ omicas y Empresariales, University of Alicante, Alicante, Spain The objectiv e of this study is to examine asymmetri c rivalry between strategi c groups in a given industry. Two research hypotheses argue for the existence of asymmetric rivalry in the sense that strategic groups of small companies have a greater degree of response but a slower speed of response to the actions of strategic groups of large companies, than vice versa. To test this, we use an ex post approach that examines the news releases published on the strategic actions and reactions of firms. A third hypothesis compares ex ante competitive expectations with ex post asymmetric rivalry between strategic groups. To test this, we compare ex post news on actions/reactions with an ex ante approach that estimates conjectural variations. The empirical application carried out on bank deposits in the Spanish market defines strategic groups in terms of size due to the historical and institutional conditions of the industry (deregulatory change). The results obtained show that rivalry patterns between strategic groups in terms of company size can be predicted as asymmetric in the sense that smaller bank strategic groups have a greater degree of response (Stackelberg ‘leader–follower’ competitive interaction), and a slower speed of response to the actions of larger bank strategic groups than is found the other way around. Moreover, ex ante expectations of aggressiveness on the part of larger strategic groups characterize greater ex post reactions from the smaller-size strategic groups. Therefore, the size distribution of strategic groups is valuable to research on complex industries with deregulation changes. Copyright 2005 John Wiley & Sons, Ltd. INTRODUCTION The notion of a strategic group refers to a group of compan ies tha t use simila r stra teg ies to com- pe te in a gi ve n indu st ry , whic h is de fined in the theoretical framework developed from scheme structure–conduct–performance of Industrial Eco- nomic s. Caves and his disci ples started the modi fi- cation of the traditional theories of Mason (1939) Keywo rds: asymmetri c riva lry; strat egic group s; size; banking; deregulation; conjectural variation *Corr espond ence to: Franc isco J. M´ as-Ru iz, Departamento de Econom´ ıa Financ iera, Contabilidad y Marke ting, Facultad de Ciencias Econ´ omicas y Empresariales, University of Alicante, Campus de San Vicente del Ras pei g, PO Box 99, E-03080 Alicante, Spain. E-mail: [email protected] and Bain (1956) on the structure and performance of industry. They incorporated the different posi- tio nin g ado pte d by compan ies on an ind ivi dua l bas is and used this to start res earc h on strategic groups of companies. In particular, they used this concept to demonstrate intra-industry heterogene- ity and the differences in performance produced. They also explained the competition observed. Hunt (1972) fir st coined the term when tr y- ing to explain competition obs erved in a hig hly concentrated, but highly competitive industry. He corroborated the exi stence of beh avi ora l dif fer - ences among the companies of an industry, which imp ede d the dev elopme nt of a wide oli gop oli s- ti c consensus, as pr edicted by the cl assi c the- ory of Indus trial Economics . Similarly, Newman Copyright 2005 John Wiley & Sons, Ltd. Received 27 March 2002 Final revision received 3 February 2004
-
Upload
henry-dong -
Category
Documents
-
view
214 -
download
0
Transcript of Asymmetric Rivalry Between Strategic Group

8/14/2019 Asymmetric Rivalry Between Strategic Group
http://slidepdf.com/reader/full/asymmetric-rivalry-between-strategic-group 1/33
Strategic Management JournalStrat. Mgmt. J., 26: 713–745 (2005)
Published online 7 June 2005 in Wiley InterScience (www.interscience.wiley.com). DOI: 10.1002/smj.471
ASYMMETRIC RIVALRY BETWEEN STRATEGICGROUPS: RESPONSE, SPEED OF RESPONSE AND EX
ANTE VS. EX POST COMPETITIVE INTERACTION IN
THE SPANISH BANK DEPOSIT MARKET
FRANCISCO J. MAS-RUIZ,* JUAN L. NICOLAU-GONZALBEZ and FELIPERUIZ-MORENOFacultad de Ciencias Econ ´ omicas y Empresariales, University of Alicante, Alicante,Spain
The objective of this study is to examine asymmetric rivalry between strategic groups in a givenindustry. Two research hypotheses argue for the existence of asymmetric rivalry in the sensethat strategic groups of small companies have a greater degree of response but a slower speed of response to the actions of strategic groups of large companies, than vice versa. To test this,we use an ex post approach that examines the news releases published on the strategic actionsand reactions of firms. A third hypothesis compares ex ante competitive expectations with ex
post asymmetric rivalry between strategic groups. To test this, we compare ex post news onactions/reactions with an ex ante approach that estimates conjectural variations. The empiricalapplication carried out on bank deposits in the Spanish market defines strategic groups in termsof size due to the historical and institutional conditions of the industry (deregulatory change).The results obtained show that rivalry patterns between strategic groups in terms of companysize can be predicted as asymmetric in the sense that smaller bank strategic groups have agreater degree of response (Stackelberg ‘leader–follower’ competitive interaction), and a slower speed of response to the actions of larger bank strategic groups than is found the other wayaround. Moreover, ex ante expectations of aggressiveness on the part of larger strategic groupscharacterize greater ex post reactions from the smaller-size strategic groups. Therefore, the sizedistribution of strategic groups is valuable to research on complex industries with deregulationchanges. Copyright 2005 John Wiley & Sons, Ltd.
INTRODUCTION
The notion of a strategic group refers to a group
of companies that use similar strategies to com-
pete in a given industry, which is defined in
the theoretical framework developed from scheme
structure–conduct–performance of Industrial Eco-
nomics. Caves and his disciples started the modifi-cation of the traditional theories of Mason (1939)
Keywords: asymmetric rivalry; strategic groups; size;banking; deregulation; conjectural variation*Correspondence to: Francisco J. Mas-Ruiz, Departamento deEconomıa Financiera, Contabilidad y Marketing, Facultad deCiencias Economicas y Empresariales, University of Alicante,Campus de San Vicente del Raspeig, PO Box 99, E-03080Alicante, Spain. E-mail: [email protected]
and Bain (1956) on the structure and performance
of industry. They incorporated the different posi-
tioning adopted by companies on an individual
basis and used this to start research on strategic
groups of companies. In particular, they used this
concept to demonstrate intra-industry heterogene-
ity and the differences in performance produced.
They also explained the competition observed.
Hunt (1972) first coined the term when try-
ing to explain competition observed in a highly
concentrated, but highly competitive industry. He
corroborated the existence of behavioral differ-
ences among the companies of an industry, which
impeded the development of a wide oligopolis-
tic consensus, as predicted by the classic the-
ory of Industrial Economics. Similarly, Newman
Copyright 2005 John Wiley & Sons, Ltd. Received 27 March 2002Final revision received 3 February 2004

8/14/2019 Asymmetric Rivalry Between Strategic Group
http://slidepdf.com/reader/full/asymmetric-rivalry-between-strategic-group 2/33
714 F. J. M´ as-Ruiz, J. L. Nicolau-Gonz´ albez and F. Ruiz-Moreno
(1978) demonstrated that the existence of strate-
gic groups prejudices tacitly expected collusion
between companies, which reduces the explana-tory power of the traditional model of Industrial
Economics. Porter (1979) and Caves and Porter
(1977) demonstrated that the existence of groups
impedes the ability to make inferences about the
market power at an industry level. In summary,
this early research considered strategic groups as a
dimension of the structure of the industry, which
could enrich the traditional models of Industrial
Economics.
Over time, the literature on strategic groups has
expanded on the aspects of rivalry and has pro-
duced a series of deductions on the competitiveinteraction of companies and their performance.
In accordance with the above, the authors dis-
tinguish the nature of intra- and between-group
rivalry,1 along with the impact of factors such as
the number and size distribution of groups, the dis-
tance between them and their interdependency in
the market. However, there is no consensus with
respect to the different propositions put forward
with respect to intra- and between-strategic groups
rivalry (see the next section).
Our study is centered on the observation that
there is competition between strategic groups (Por-
ter, 1985; Putsis and Dhar, 1998), with the aim of
determining whether this inter-group competition
could be structured in a systematic and predic-
tive way in terms of asymmetry— an aspect of
asymmetry which has been suggested by the fol-
lowing research areas: (1) the cognitive perspec-
tive (Reger and Huff, 1993), which indicates the
need to enlarge the theory of strategic groups to
include complex industries whose group structure
muddies the characteristic idea of symmetry of
strategic groups; and (2) the groups of reference
approach (Fiegenbaum and Thomas, 1995), which
demonstrates the need to find alternative points of
1 Literature makes a distinction between the concept of inter-company ‘rivalry,’ which stresses the behavior of individualcompanies, and the general concept of ‘competition,’ which iscentered on the properties of the industry or market structure(Baum and Korn, 1996; Caves, 1984; Hannan and Freeman,1989; Jacobson, 1992; Chen, 1996). Our study uses the conceptof rivalry, as it considers individual competitive movements asa unit of analysis, through the examination of the exchangeof actions and responses (Caves, 1984; Porter, 1980; Smith,Grimm, and Gannon, 1992) and of the estimation of conjecturalvariations (Amit, Domowitz, and Fershtman, 1988)— defined asthe degree to which companies perceive their interdependenceand its use in the formulation of their actions (Bowley, 1924).
reference for all the competitors, such as the mar-
ket leader; particularly in markets with a dominant
leader. To do this, we start with the work of Chenand Hambrick (1995), which analyzes asymmetric
rivalry of companies according to size and pro-
poses that the smallest companies show a lesser
degree of response and greater speed of response
to competitive actions than do their larger rivals.
Our work, however, assumes the opposite (the
next section presents the theoretical argumenta-
tion), that is, that small company strategic groups
have a greater degree of response and a slower
speed of response to competitive actions of large
company groups than vice versa. Moreover, our
work compares ex ante competitive expectationswith ex post asymmetric rivalry among groups (see
the next section).
Basically, our proposal is based on the iden-
tification of the strategic groups of an industry
in terms of company size. Company size consti-
tutes the a priori criterion used in the original
research to define strategic groups. The work of
Porter (1974, 1979), Lahti (1983), Primeaux (1985,
1987), and Caves and Pugel (1980) which identify
leader and follower companies stands out. In fact,
authors like Amit et al. (1988) justify this tradi-
tion, which derivates from Industrial Organization,
insofar as the scope of companies constitutes the
distinctive feature of an industry with a homoge-
neous product, and company size is an appropri-
ate dimension of scope. However, it can be said
that, in principle, the identification of strategic
groups is always somewhat problematic and can
even become arbitrary (Peteraf, 1993), so Cool and
Schendel (1987) only allow a multidimensional
approach to identify valid strategic groups, form-
ing company groups according to differences in
their scope and resources commitments.
Underlying all this is the existing debate in the
literature of strategic groups in relation to the lack of any theory on their formation and evolution.
Along this line, our paper follows the institu-
tional/historical approach of the industry to sup-
port the definition of size-based strategic groups
in Spanish banking. This is due to the following
aspects:
1. One of the more widely accepted theoreti-
cal explanations for the formation of strate-
gic groups is the history of the industry,
originally proposed by Porter (1979). From
the perspective of company resources, Barney
Copyright 2005 John Wiley & Sons, Ltd. Strat. Mgmt. J., 26: 713–745 (2005)

8/14/2019 Asymmetric Rivalry Between Strategic Group
http://slidepdf.com/reader/full/asymmetric-rivalry-between-strategic-group 3/33
Asymmetric Rivalry between Strategic Groups 715
(1991) shows that, the unique historical con-
ditions of an industry can generate resources
which are not perfectly imitable. Peteraf andShanley (1997) propose that historical factors
let us know initial company endowments, the
path which describes the accumulation of its
assets, and the development of its capabili-
ties. They also propose that institutional anal-
ysis gives a complementary perspective of the
evolution of the structure of the industry, as
this evolution is understood as being a socially
constructed process which, over time, creates
norms of behavior that affect competition. At an
empirical level, a large number of studies, most
importantly those of Smith and Grimm (1987),Corsi and Grimm (1989), Corsi et al. (1991),
Zajac and Shortell (1989), and Peteraf (1993),
among others, follow this institutional/historical
approach and analyze the impact of deregula-
tion on company strategy and/or performance.
2. Following this institutional/historical approach,
various authors recommend the use of a priori
theoretical criteria in the identification of strate-
gic groups in an industry. Dranove, Peteraf, and
Shanley (1998) recommend that researchers
identify groups a priori based on a deep institu-
tional knowledge of the industry, which would
allow them to search for barriers to mobility
and define the limits of the groups in a temporal
period. Peteraf (1993) accepts that if the indus-
try’s legal regulations lead to a certain strategic
group structure it will be possible, following
an a priori theoretical approach, to identify
different company classes that are sufficiently
different in their scope, resources, and strategic
profile to constitute separate strategic groups
(Thomas and Venkatraman, 1988).
3. In the case of the Spanish banking industry,
it has been subject to very significant struc-
tural changes in the period 1989–92 (Manas,1992; Gual, 1992, 1993) in response to the pro-
cesses of deregulation and European integration
which it has faced (historical conditions are fur-
ther detailed in the section ‘Sample, data and
variables’) and which have influenced the con-
figuration of strategic groups. These regulatory
changes have brought about strong restructur-
ing characterized by a process of mergers and
acquisitions, which has affected competition. In
particular, mergers and acquisitions are due to a
desire to increase size in order to compete in the
European market and preserve market power, or
to solve the problems of savings banks relating
to: (a) the freedom of geographical implanta-
tion through expansion enjoyed by the largesaving banks and the smaller saving banks,
which defend themselves by forming geograph-
ical groups; and (b) internal problems deriving
from lack of resources or from the type of activ-
ities developed (Gual and Vives, 1991). Conse-
quently, size constitutes a fundamental dimen-
sion in the Spanish banking industry, which
explains why it has been used to identify strate-
gic groups (Espitia, Polo, and Salas, 1991b).
The proposal of this study is to test asymmet-
ric rivalry between size-defined strategic groupsof an industry. Two research hypotheses argue for
the existence of asymmetric rivalry in the sense
that small company groups have a greater degree
of response and a slower speed of response to
the actions of large company groups than vice
versa. To test this, we use an ex post approach that
examines the competitive actions and responses of
the members of the group (Porter, 1980) found
in newspapers and specialist magazines (Smith,
Grimm, and Wally, 1997). A third hypothesis com-
pares ex ante competitive expectations with ex post
asymmetric rivalry between strategic groups. To
test this, we compare ex post news on actions/
reactions with an ex ante approach that estimates
conjectural variations (Amit et al., 1988). The
empirical application is carried out on the Spanish
bank deposit market in 1994, based on the iden-
tification of banking strategic groups in terms of
company size, given their historical and institu-
tional conditions.
The paper is organized in the following way:
first, we offer a panorama of rivalry in the theory of
strategic groups, and propose research hypotheses
on asymmetric rivalry between groups; second,
we revise the empirical work undertaken in thefinancial sector on this topic; third, we justify the
proposed methodology; fourth, we define sample,
data collection, and variables; fifth, we present the
results, and finally we make our conclusions.
RIVALRY IN THE FIELD OFSTRATEGIC GROUPS AND RESEARCHHYPOTHESES
The existence of strategic groups has direct impli-
cations on the behavior of companies and their
Copyright 2005 John Wiley & Sons, Ltd. Strat. Mgmt. J., 26: 713–745 (2005)

8/14/2019 Asymmetric Rivalry Between Strategic Group
http://slidepdf.com/reader/full/asymmetric-rivalry-between-strategic-group 4/33
716 F. J. M´ as-Ruiz, J. L. Nicolau-Gonz´ albez and F. Ruiz-Moreno
competitive interaction. These implications are dis-
cussed in the literature, which defines the nature of
intra- and between-strategic group rivalry (Porter,1976, 1979; Peteraf, 1993; Cool and Dierickx,
1993) and the influence of diverse factors (Porter,
1980).
It is suggested that intra-group rivalry is rare
because a group’s members are able to recognize
their mutual dependency with greater ease. They
steer their competitive behavior towards activi-
ties which create mobility barriers and respond in
a similar way to environmental changes (Porter,
1979). This proposition is supported by the the-
ory of resources, in the sense that the members of
a group have similar allocations of resources, andtherefore act and respond in a similar way to envi-
ronmental discontinuities. Members can even have
common suppliers and clients, something which
facilitates greater communication and coordination
in the industry (Peteraf, 1993).
It is also suggested that the high level of
rivalry between groups, due to the fact that
differences between groups imply the existence of
heterogeneous resources and different competitive
behavior patterns, makes it difficult to predict
and coordinate the actions of rivals through the
groups (Porter, 1980). This argument, along with
that of intra-group mutual dependency, implies
that rivalry between groups is greater than that
of intra-group. This has been shown empirically
by Peteraf (1993) and Porac et al. (1995). Even
Nohria and Garcıa-Pont (1991) point out that
strategic alliances between companies are more
probable within a group and less probable between
groups.
However, the literature criticizes some previous
approaches, holding that intra-group rivalry can be
greater than between-group rivalry. This proposi-
tion is put forward by Cool and Dierickx (1993),
who show that, through time, rivalry can pass frombeing intra-group to being between-group. In this
way, the following arguments are put forward.
First, the requisite for mutual dependency is hard
to find as it is difficult to establish and maintain
agreements between companies in a group, espe-
cially when they are of a similar size (Kwoka and
Ravenscraft, 1986; Porac et al., 1995), when they
increase their numbers (Scherer and Ross, 1990;
Barney and Hoskisson, 1990), when there is a lack
of history or leadership among members (Scherer
and Ross, 1990), and when there is high interde-
pendency in the market (Duysters and Hagedoorn,
1995). If the implicit agreements of a group are
broken, members of a group can invade the market
segments of companies of the same group (Cooland Dierickx, 1993). Therefore, a company in the
group can worry the other group members more
than outside companies. According to the theory
of resources, greater intra-group rivalry can be
derived from the homogeneity of resources of its
members (McGee and Thomas, 1992; Bogner and
Thomas, 1994), because they are all trying for the
same objectives but they do not have the resources
or unique isolating mechanisms to give them a
competitive advantage.
Second, between-group rivalry can be affected
by three factors (Porter, 1980):
1. Interdependency in the market or the degree to
which groups compete for the same clients or
for clients in very different market segments.
Behavioral differences between groups will not
have important consequences on rivalry, except
when the interdependency of the groups in the
market is pronounced.
2. The number and relative size of the groups.
In situations where there are a great number of
groups of equal size, a greater strategic asym-
metry facilitates rivalry between the groups.
The inverse applies when a group constitutes animportant portion of an industry, with another
group having only a small portion. In this case,
strategic asymmetry has very little impact on
the rivalry between the two groups given the
slight influence of the smaller over the larger
group.
3. Strategic distance. If behavioral asymmetry
grows, mutual dependency cannot be easily
found and greater rivalry is found between
strategic groups. If behavioral asymmetry de-
creases, the opposite applies (Porter, 1979).
Dooley, Fowler, and Miller (1996) evenconsider that there are three levels in
the relationship between strategic distance
and rivalry: a reduced strategic distance
(homogeneity) implies the development of
mutual dependence, whereas when strategic
differentiation is so great that markets are
not contestable by members of another group
(heterogeneity) the companies in the groups
distance themselves from the competitive
struggle (Hatten and Hatten, 1987). An
intermediate situation somewhere between ho-
mogeneity and heterogeneity, defined as a
Copyright 2005 John Wiley & Sons, Ltd. Strat. Mgmt. J., 26: 713–745 (2005)

8/14/2019 Asymmetric Rivalry Between Strategic Group
http://slidepdf.com/reader/full/asymmetric-rivalry-between-strategic-group 5/33
Asymmetric Rivalry between Strategic Groups 717
moderate increase in strategic distance, carries
with it an increase in between-group rivalry,
which supersedes intra-group rivalry.
However, Hatten and Hatten (1987) suggest that
it is difficult to conclude that a decrease in strate-
gic distance diminishes between-group rivalry. On
the contrary, a decrease in asymmetry of resources
would bring about a situation in which prod-
uct/market positions could be more contestable.
Companies with similar resources are more capa-
ble of contesting for the market/product positions
of others than companies in other situations. This
implies that potential rivalry increases as strategic
distance decreases.To sum up, although the existence of strate-
gic groups has direct implications on the conduct
of companies and their competitive interactions,
there is no consensus with respect to the dif-
ferent propositions put forward with respect to
intra- and between-strategic groups rivalry. Alter-
natively, Smith et al. (1997) consider that the fun-
damental question may not be the comparison of
intra- and between-group rivalry, as suggested by
literature on strategic groups, but the way in which
groups act competitively with each other. Along
these lines, our study is centered on the observationthat there is competition between strategic groups
(Porter, 1985; Putsis and Dhar, 1998), in order to
determine whether this inter-group competition is
structured systematically and predictably in terms
of asymmetry.
Hypotheses of asymmetric rivalry between
size-defined strategic groups
Originally, and from an individual human behavior
point of view, Tversky (1977) challenged the basic
hypothesis of underlying symmetry in all the theo-retical treatments of similarity. This author empir-
ically shows asymmetric similarities and argues
theoretically that the similarity between two ob-
jects should not be treated as a symmetrical rela-
tionship.
Tversky’s theory is equally applicable to com-
petitive behavior at a company level (Chen, 1996),
as a company’s specific conceptualization of com-
petitors suggests that the competitive relationship
between a pair of companies can be asymmetric,
depending on which competitor is under consider-
ation. If A is the main competitor of B, it does not
necessarily follow that B is the main competitor
of A.
At a strategic group level,2 the first referencesto asymmetric competition are made by Porter
(1979) and Hatten and Hatten (1987) when they
indicate that mobility barriers and the resulting pat-
terns of rivalry may not be symmetrical. Recently,
the literature has suggested competitive asymmetry
in company groups defined by size or dominance.
It should not be forgotten that the reference point
theory considers that a company’s strategic deci-
sions can usually be compared to or take as a
reference those of the industry leaders (Fiegen-
baum and Thomas, 1995; Fiegenbaum, Hart, and
Schendel, 1996). In this way, we propose the iden-tification of asymmetric rivalry in the following
contexts.
Asymmetric rivalry in term of competitive
responses
Various studies propose that small companies show
a lesser degree of response to the competitive
actions of their larger rivals than vice versa (see
Table 1). The theoretical argumentation of this
proposal is the following.
The Game Theory of the Economy of Indus-
trial Organization distinguishes asymmetric pat-terns in competitive interaction, among which
‘dominant–fringe’ behavior stands out. This con-
cerns the case of the competitive strategies of
companies which show the following opposing
directions (Putsis and Dhar, 1998; Raju and Roy,
1997): a ‘fringe’ company behaves cooperatively,
while a ‘dominant’ company competes in a non-
cooperative fashion. In other words, a company
simply follows the actions of a stronger rival.
In this way, the weaker (or ‘fringe’) company
might not want to compete directly with the domi-
nant company, so it accommodates the competitiveefforts of its larger rival. In return, companies
with a dominant share position fiercely defend
their market position, taking a non-cooperative
stance. This type of interaction, which intensifies
the advantage of large companies (large companies
2 In industries characterized by companies with different combi-nations of scope and competitive assets, it could be unnecessaryor impractical to consider the competitive reactions of all rivals.Thus the analysis could be centered on strategic groups or, inother words, on one of the competitors of each group that basesits business strategy on a similar competitive advantage (Amitet al., 1988).
Copyright 2005 John Wiley & Sons, Ltd. Strat. Mgmt. J., 26: 713–745 (2005)
8/14/2019 Asymmetric Rivalry Between Strategic Group
http://slidepdf.com/reader/full/asymmetric-rivalry-between-strategic-group 6/33
718 F. J. M´ as-Ruiz, J. L. Nicolau-Gonz´ albez and F. Ruiz-Moreno
T a b l e 1 . T h e o r e t i c a l b a s i s o f a s y m m e t r i c r i v a l r y b e t w e e n s i z e - d e fi n e d s t r a t e g i c g r o u p s i n t e r m s o f r e s p o n s e s
P e r s p e c t i v e
T h e o r e t i c a l b a s
i s
A u t h o r s
M a j o r fi n d i n g s
S m a l l c o m p a n i e s s h o w l e s s d e g r e e
o f r e s p o n s e t o c o m p e t i t i v e
a c t i o n s t h a n t h e i r l a r g e r r i v a l s
I n
d u s t r i a l
E c o n o m y
( G a m e
T h e o r y )
C o m p e t i t i v e i n t e r a c t i o n
‘ d o m i n a n t – f r i n g e ’
P u t s i s a n d D h a r
( 1 9 9 8 )
3 7
a s y m m e t r i c c o m p e t i t i v e i n t e r a c t i o n s
‘ d o m i n a n t – f r i n g e ’ ( o f a t o t a l o f 1 2 3
e x a m i n e d i n t h e fi e l d o f m a r k e t i n g
i n s t r u m e n t s ) b e t w e e n n a t i o n a l b r a n d s a n d
p r i v a t e l a b e l s
E f fi c i e n t c o m p a n i e s e n
j o y c o s t
a d v a n t a g e s o f e x c l u s i v e
p r o d u c t i o n f a c t o r s , o r f r o m
e c o n o m i e s o f s c a l e a n d
s c o p e l i n k e d t o s i z e
a n d
p r o d u c t r a n g e
D e m s e t z ( 1 9 7 3 )
B a u m o l ( 1 9 6 7 )
S t r a t e g i c
M a n a g e m e n t
L a r g e c o m p a n y s l a c k r e s o u r c e s
f a c i l i t a t e t h e i r g r e a t e r d e g r e e
o f r e s p o n s e ; l a r g e c o m p a n y
r e p u t a t i o n p r o m o t e s
t h e i r
g r e a t e r d e g r e e o f r e s p o n s e
C h e n a n d H a m b r i c k
( 1 9 9 5 )
U . S . s m a l l a i r l i n e s b e t w e e n 1 9 8 5 a n d 1 9 8
6
w e r e l e s s r e s p o n s i v e t o c o m p e t i t i v e a t t a c k s
t h a n t h e i r l a r g e r r i v a l s
R i v a l r y b e t w e e n s i z e - d e fi n e d
s t r a t e g i c g r o u p s i s a s y m m e t r i c
a n d o f t h e ‘ l e a d e r – f o l l o w e r ’
t y p e o f S t a c k e l b e r g , i n t h e s e n s e
t h a t t h e g r o u p s o f s m a l l e r
c o m p a n i e s s h o w a g r e a t e r
d e g r e e o f r e s p o n s e t o t h e
c o m p e t i t i v e a c t i o n s o f t h e
g r o u p s o f l a r g e r c o m p a n i e s t h a n
v i c e v e r s a ( H y p o t h e s i s 1 )
I n
d u s t r i a l
E c o n o m y
( G a m e
T h e o r y )
C o m p e t i t i v e i n t e r a c t i o n
‘ l e a d e r – f o l l o w e r ’
( S t a c k e l b e r g )
P u t s i s a n d D h a r
( 1 9 9 8 )
T h
e m o s t c o m m o n f o r m o f a s y m m e t r i c
c o m p e t i t i v e i n t e r a c t i o n ( 8 6 o b s e r v a t i o n s )
b e t w e e n n a t i o n a l b r a n d s a n d p r i v a t e l a b e l s
( f o r e a c h o f 5 8 c a t e g o r i e s a n d f o u r
m a r k e t i n g i n s t r u m e n t s i n 1 9 9 2 ) i s t h a t o f
‘ l e a d e r - f o l l o w e r ’
S m a l l c o m p a n i e s ( ‘ p u p p y
d o g s ’ ) a r e p r i c e a g g r e s s i v e i n
o r d e r t o e s t a b l i s h c l i e n t s a n d
l a r g e c o m p a n i e s ( ‘ f a t c a t s ’ )
e x p l o i t t h e i r c l i e n t b
a s e
F a r r e l l a n d S h a p i r o
( 1 9 8 7 )
D e m o n s t r a t e s t h a t s m a l l c o m p a n i e s h a v e a n
i n c e n t i v e t o b e h a v e a g g r e s s i v e l y i n p r i c i n g
i n o r d e r t o e s t a b l i s h c l i e n t e l e , w h e r e a s
l a r g e
c o m p a n i e s t e n d t o e x p l o i t t h e i r c l i e n t b
a s e
Copyright 2005 John Wiley & Sons, Ltd. Strat. Mgmt. J., 26: 713–745 (2005)

8/14/2019 Asymmetric Rivalry Between Strategic Group
http://slidepdf.com/reader/full/asymmetric-rivalry-between-strategic-group 7/33
Asymmetric Rivalry between Strategic Groups 719
R e l a x i n g o f l e g a l b a r r i e r s t o
e n t r y a f f e c t s t h e
‘ d o m i n a n t – f r i n g e ’
i n t e r a c t i o n , r e d u c i n g
t h e
r e t a l i a t i o n s o f t h e d o m i n a n t
o v e r t h e f r i n g e
S p i l l e r a n d F a v a r o
( 1 9 8 4 )
T h
e e n t r y t h r e a t f r o m n e w fi n a n c i a l e n t i t i e s
a f t e r t h e 1 9 7 0 s r e l a x a t i o n o f e n t r y b a r r i e r s i n
t h e U r u g u a y a n b a n k i n g s e c t o r l e d t h e s
m a l l
b a n k g r o u p t o e x p e c t n o r e a c t i o n f r o m
t h e
l a r g e b a n k g r o u p
J u d o E c o n o m i c s : s t r a t e g y
( r e s t r i c t e d c a p a c i t y a n d l o w
p r i c e ) a f f e c t s t h e
‘ d o m i n a n t – f r i n g e ’
i n t e r a c t i o n , m a k i n g
t h e
d o m i n a n t s ’ r e t a l i a t i o
n s
e x p e n s i v e
G e l m a n a n d S a l o p
( 1 9 8 3 )
A
f r i n g e c o m p e t i t o r p a r t i a l l y o f f s e t s i t s d e m a n d
d i s a d v a n t a g e b y e n g a g i n g i n c a p a c i t y
l i m i t a t i o n a n d d i s c o u n t p r i c i n g . T h i s s t r a t e g y
c r e d i b l y r e d u c e s t h e t h r e a t p o s e d t o t h e
d o m i n a n t fi r m a n d m a k e s r e t a l i a t i o n m o r e
e x p e n s i v e .
S t r a t e g i c
M a n a g e m e n t
J u d o s t r a t e g y ( l e v e r a g e ) t u r n s a
s t r o n g o p p o n e n t s o w
n
s t r e n g t h a g a i n s t i t s e l f a n d
d o e s n o t i n v i t e r e s p o n s e
Y o f fi e a n d C u s u m a n o
( 1 9 9 9 )
L e
v e r a g e i s a k e y e l e m e n t f r o m j u d o s t r a t e g y
i n t h e c o m p e t i t i o n b e t w e e n N e t s c a p e ( D
a v i d )
a n d M i c r o s o f t ( G o l i a t h ) . L e v e r a g e w i l l
m a k e
a d o m i n a n t c o m p a n y h e s i t a t e t o s t r i k e b a c k
L a r g e c o m p a n i e s d o n o t
r e c o g n i z e o r d i s r e g a
r d t h e
t h r e a t o f w e a k e r o p p o n e n t s
C h e n ( 1 9 9 6 )
T h
e r e w a s m y o p i a i n s o m e c o m p e t i t o r s i n t h e
U . S . a e r o n a u t i c i n d u s t r y i n 1 9 8 9 , w h o
c o n s i d e r e d o t h e r p l a y e r s t o b e i n s i g n i fi c a n t ;
a l t h o u g h t h e l a t t e r c o n s i d e r e d t h e f o r m e r t o
b e t h e i r s i n g l e m o s t i m p o r t a n t c o m p e t i t o r
a n d , t h u s , t h e i r p r i m a r y t a r g e t o f a t t a c k
o r
c o u n t e r - a t t a c k
S l a c k r e s o u r c e s o f l a r g
e
c o m p a n i e s f o m e n t t h e i r
i n s u l a r i t y a n d l a c k o
f
r e s p o n s e
M i l l e r a n d C h e n
( 1 9 9 4 )
N o e v i d e n c e i n t h e U . S . a e r o n a u t i c i n d u s t r y
b e t w e e n 1 9 7 9 a n d 1 9 8 6 t h a t c o m p e t i t i v
e
i n e r t i a ( l e v e l o f a c t i v i t y t h a t a fi r m e x h
i b i t s
w h e n a l t e r i n g i t s c o m p e t i t i v e s t a n c e i n
d i f f e r e n t a r e a s ) i s p o s i t i v e l y r e l a t e d t o
c o m p a n y s i z e
Copyright 2005 John Wiley & Sons, Ltd. Strat. Mgmt. J., 26: 713–745 (2005)

8/14/2019 Asymmetric Rivalry Between Strategic Group
http://slidepdf.com/reader/full/asymmetric-rivalry-between-strategic-group 8/33
720 F. J. M´ as-Ruiz, J. L. Nicolau-Gonz´ albez and F. Ruiz-Moreno
have the option of competing with small compa-
nies, but small companies cannot always recipro-
cate), is explained by the hypothesis of efficiency(Demsetz, 1973). The most efficient companies
have cost advantages linked to the possession of
exclusive productive factors (e.g., management tal-
ent) or the classic economies of scale and scope
corresponding, respectively, to size and product
range (Baumol, 1967).
Chen and Hambrick (1995), from Strategic Man-
agement, make their arguments through two fac-
tors: (1) slack resources—large companies gener-
ally have more slack resources, so they tend to
respond with more probability; in contrast, the
resource constraints of smaller companies preventthem from retaliating, even when they want to;
(2) reputation—large companies have a better rep-
utation and are sometimes propelled to respond to
attacks in order to protect their reputations. Small
companies, however, do not lose their credibility if
they abstain from responding to their adversaries’
actions.
Despite this, our study proposes that small/weak
company strategic groups can respond with more
vigor to large/advanced strategic groups than vice
versa. At an empirical level and as examples of
this type of competitive situation are the follow-
ing: the gradual invasion of the global market by
Japanese multinationals in recent decades, which
gives us an excellent lesson on the potential threat
of seemingly insignificant competitors (Hamel and
Prahalad, 1990); The hard lesson learned by brand
leaders in many consumer product markets after
the substantial losses in market share inflicted
on them by their private-label rivals (Glemet and
Mira, 1993); the aggressive competition aimed at
multinationals by small manufacturing companies
from developing countries (Vachani, 1990; Cortes,
Berry, and Ishaq, 1987; Little, Mazumdar, and
Page, 1987).At a theoretical level, this type of asymmet-
ric behavior is based on the following argumen-
tation (see Table 1): from the point of view of
the Game Theory of Industrial Organization Eco-
nomics, Putsis and Dhar (1998) and Raju and
Roy (1997) highlight behavior known as ‘leader–
follower’ (Stackelberg), which implies that a ‘fol-
lower’ company reacts to changes to the actions of
its rivals, while a ‘leader’ company does not react.
This means that a company that acts as a leader
does not react to the actions of its rival whereas
its rival follows the strategic behavior changes of
the leader. Farrell and Shapiro (1987) and Farrell
and Klemperer (2001) explain this interaction by
arguing that small companies (called ‘puppy dogs’by Fudenberg and Tirole, 1984) have an incen-
tive to compete aggressively on prices in order to
establish a client base, while large companies (‘fat
cats’) do not compete aggressively as they tend to
exploit their existing client base.
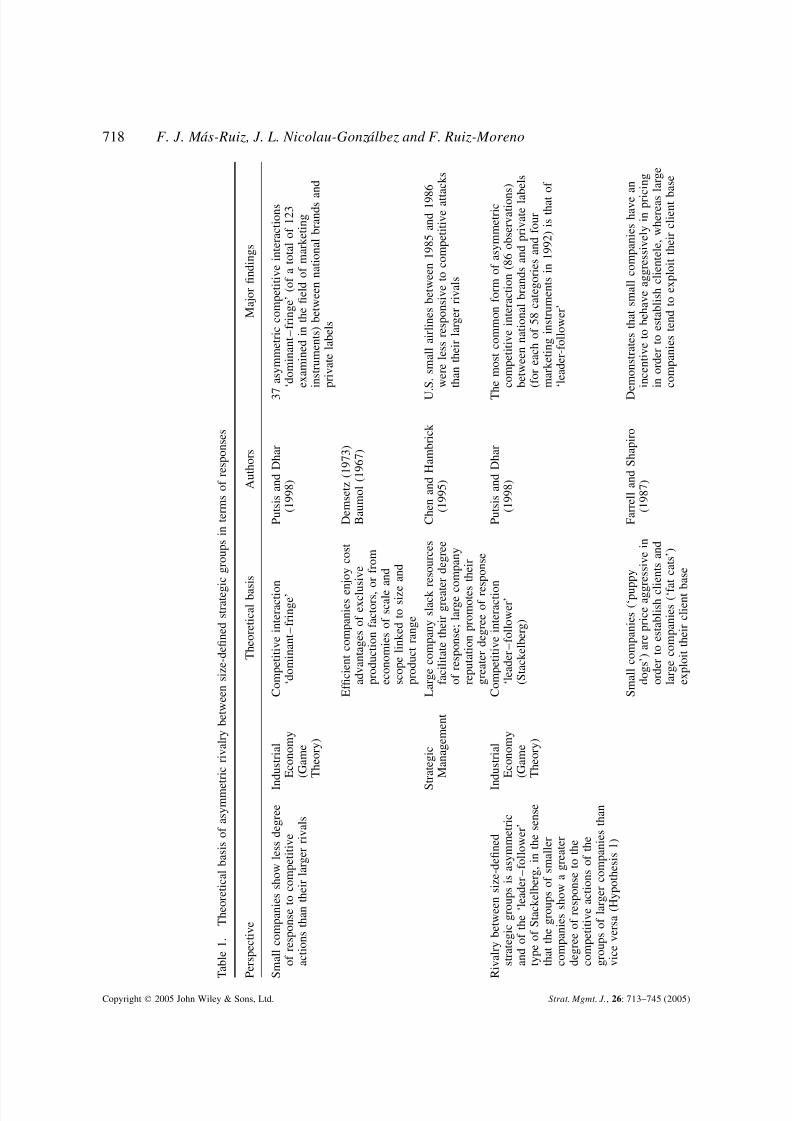
In the same way, certain legal changes, such as
the relaxation of entry barriers (deregulation) to an
industry, can affect competitive interaction of the
‘dominant– fringe’ type, reducing the retaliations
that the fringe group expects from the dominant
companies (Spiller and Favaro, 1984). This elimi-
nation of entry barriers to an industry affects ‘dom-inant–fringe’ competitive interaction in the sense
that the entry threats of new companies constitute
a greater worry for dominant companies, which
implies that fringe companies expect fewer retalia-
tions from dominant companies. Therefore, Spiller
and Favaro (1984) are unable to reject the idea that
the type of competitive interaction becomes that of
Stackelberg (‘leader– follower’).
Within this field of ‘dominant–fringe’ strategic
interaction, Judo Economics (Gelman and Salop,
1983) also describes a strategy which credibly
reduces the threat posed to the dominant company
and makes its retaliations more expensive (becom-
ing a Stackelberg ‘leader– follower’ interaction).
Basically, this strategy induces a large incumbent
to accommodate the entry of a new player when
the credibility of the new entrant’s commitment to
remaining small persuades the incumbent that it
is not worth the effort to make retaliations. This
entrant strategy is based on low price and limited
capacity, which make the accommodation of the
entrant more profitable than a retaliation from the
dominant incumbent from the following two per-
spectives: (1) the capacity limitation of the entrant
restricts the loss of market share suffered by theincumbent if it accommodates the entrant; and
(2) the low price of the entrant would increase the
losses of the incumbent if it adjusted its prices.
Therefore, the small company uses the large size
of its rival to its own advantage.
From the perspective of Strategic Management,
Yoffie and Cusumano (1999) show that the judo
strategy goes a step further: the judo strategy
clearly threatens the dominant company but also
supposes an incentive for large companies not to
respond to the actions of smaller companies. In
order to do this, the judo strategy has to find
Copyright 2005 John Wiley & Sons, Ltd. Strat. Mgmt. J., 26: 713–745 (2005)

8/14/2019 Asymmetric Rivalry Between Strategic Group
http://slidepdf.com/reader/full/asymmetric-rivalry-between-strategic-group 9/33
Asymmetric Rivalry between Strategic Groups 721
sources of leverage to make a dominant company
hesitate at the moment of responding to an attack
by a smaller company. Among these leveragesources, which use an opponent’s own strength
and weight against itself, are any commitments
and strategic investment of the opponent, as well
as cooperation with other companies which have
been threatened by the success of the opponents.
Finally, the Maryland school and the work of
Chen and colleagues, aimed at competitive actions
and responses, also put forward the following
arguments that defend an asymmetric competi-
tion in which small companies show a greater
degree of response to competitive actions than
large companies do. First, Miller and Chen (1994),in line with Wright (1979), indicate that man-
agers of large companies can come to believe that
they are powerful enough to ignore threats from
their weaker rivals. Thus, Chen (1996) shows that
stronger companies can consider certain companies
as non-key competitors to which they can concede
a wide latitude of action without retaliation; and
that stronger rivals could be unaware of threats
from weaker opponents, while weaker companies
consider powerful companies to be their main tar-
gets. Consequently, these weaker companies can
be disregarded or not recognized despite the dam-age they could cause.
Second, Miller and Chen (1994) propose that
size supposes a restriction to action, as March
(1981) associates large size with an abundance of
slack resources that buffer large companies from
competition and promote insularity. Conversely,
smaller, more vulnerable companies have to be
constantly on the lookout for threats and opportu-
nities (Aldrich and Auster, 1986), which prevents
them from stagnating.
In the particular case of the Spanish bank-
ing industry, the specific conditions of the 1994growth in market share of the large-size strategic
group following the price war which came after
the deregulatory change support the hypothesis of
a greater reaction by small-size group than vice
versa, in terms of the argumentation of exploita-
tion of a large client database (Farrell and Shapiro,
1987) and of Judo Economics (Gelman and Salop,
1983). Gual and Vives (1991) indicate that, in
1989, at the moment of interest rate liberalization,
but before the introduction of ‘super accounts’ by
the large banks, there were the following main
strategies. The large banks maintained a wide
client base with low-yielding accounts and free ser-
vices. High-interest deposits were only offered to
important clients or to those who showed them-selves to be well informed on market conditions.
In contrast, medium and small-size banks, all with
limited branch networks, openly promoted high-
yielding accounts. Therefore, the large banks were
‘fat cats’ (Farrell and Shapiro, 1987; Fudenberg
and Tirole, 1984): their wide client base made
them non-aggressive in their deposit capturing,
given that they were conscious that an open offer
of high-yielding accounts would entail significant
cost increases, from not only new accounts, but
also as existing depositors would demand the same
treatment. The medium and small-size banks offer-ing these high-interest accounts were ‘puppy dogs’
as they maintained a limited capacity for deposit
capturing and therefore did not pose a threat to the
large institutions (Judo Economics).
The situation changes towards the end of 1989
with the introduction of the ‘super accounts’ by the
large banks, which transforms them from ‘fat cats’
to ‘top dogs.’ The Banco de Santander, initially,
and later the Banco BBV, launch themselves into
the capture of new clients with a massive promo-
tional campaign for a high-yielding account mar-
keted as ‘super account’ (‘Supercuenta’), which
explicitly incites clients to change banks—a directthreat to the market share of the other large banks.
Faced with this new strategy there was no place
for the pacific attitude of a ‘fat cat’ and they had
to assume the aggressive attitude of a ‘top dog.’
This was the response of the other financial enti-
ties that joined the price war. Of particular note
was the strategy of attacking the traditional market
segment of the savings banks (small and medium-
size deposits of unsophisticated consumers) by the
BBV, as it opened a new front in the competition
for deposits by attempting to obtain the advantage
of being the first; similarly the Banco de Santanderwith large deposits.
Thus, the 4-year period 1989–92 is character-
ized by an open battle for deposits (Freixas, 1996).
However, once the most aggressive entities (‘top
dogs’) had managed to substantially increase their
deposit market share through the price war they
began to have incentives to moderation, as they
had ‘fattened up’3 and the cost of maintaining high
interest rates would be very high (Gual and Vives,
3 In the Spanish bank deposit market Freixas (1996) observesan increase in the market share of the large banks (banks and
Copyright 2005 John Wiley & Sons, Ltd. Strat. Mgmt. J., 26: 713–745 (2005)

8/14/2019 Asymmetric Rivalry Between Strategic Group
http://slidepdf.com/reader/full/asymmetric-rivalry-between-strategic-group 10/33
722 F. J. M´ as-Ruiz, J. L. Nicolau-Gonz´ albez and F. Ruiz-Moreno
1991). Therefore, we return to the initial situation
where the large banks are ‘fat cats’ and the medium
and small are ‘puppy dogs.’Given that in 1994 there was a return to the
initial situation in which the large banks acted
as ‘fat cats’ exploiting a large client base (Far-
rell and Shapiro, 1987), and that small company
price and capacity limitation strategy reduces the
threat of the dominant companies and makes their
retaliations more expensive (Judo Economics), we
propose the following hypothesis:
Hypothesis 1: Rivalry between size-defined
strategic groups is asymmetric and of the
leader/follower type of Stackelberg in the sensethat strategic groups of smaller companies show
a greater degree of response to the competitive
actions of larger company strategic groups than
vice versa.
Asymmetric rivalry in term of speed of response
Another aspect which allows us to characterize
asymmetric rivalry between size-defined strategic
groups is response speed. Basically, the Strategic
Management literature suggests that small firms
will execute responses faster than their largerrivals, which can be explained in the following
way (see Table 2).
First, judo strategy proposes rapid movements
by small companies to new markets, avoiding
head-to-head combat with large companies (Yoffie
and Cusumano, 1999).
Second, Chen and Hambrick (1995), from the
perspective of competitive actions and reactions,
indicate that:
1. Small companies should be able to respond
more quickly than large companies due to theirflexibility, in order to maximize the impact
of guerrilla counter-attacks (MacMillan, 1980).
Conversely, the structural and information-pro-
cessing complexities of the large companies
restrict their execution speed (Galbraith, 1977).
2. Large companies often need to analyze and
coordinate many markets to implement effec-
tive and coherent responses, whereas small
companies are often niche players and do not
savings banks) which is combined with a decrease in the shareof the small and medium-size banks between 1990 and 1994.
need to use responses which affect the whole
market of an industry (Porter, 1980).
However, our study proposes that small company
strategic groups respond more slowly to large
strategic groups than vice versa. This is defended
in the following way:
1. Large size is associated with an abundance of
slack resources (March, 1981), and firms with
ample slack resources may instantly order over-
time work to hasten an implementation (Smith
et al., 1991). Conversely, firms without those
resources may have to take time to develop a
resource base to finance their response. Empir-ically, Meyer (1982) found that organizations
with slack resources responded faster to envi-
ronmental crisis than organizations with lim-
ited resources; and Chen, Smith, and Grimm
(1992) support that an action which requires
more effort (resources) to execute is associated
with a longer response lag.
2. When competitors’ key markets are strongly
threatened, they tend to retaliate slowly (Chen
and MacMillan, 1992). These competitors may
respond cautiously to major threats for fear of
precipitating escalation retaliation. Therefore,they will react decisively, but slowly, for fear
of the initiator’s retaliation. The fear may come
from the fact that the initiator is a powerful or
credible player, for example in terms of size, in
the markets where the battle is engaged (Chen
et al., 1992).
In the specific case of Spanish banking, the small
and medium-size companies, apart from their lim-
ited resources, have a fundamentally local/regional
operating area (see section ‘Sample, data, and vari-
ables’), given the traditional restrictions to the geo-
graphical expansion of the savings banks (Gual and
Vives, 1991). Therefore, it is possible that an attack
from the large banks on these key local markets
would generate a strong response from the small
banks, which would be slower than a large bank to
respond for fear of precipitating escalation retalia-
tion. In virtue of the above mentioned, we propose
the following hypothesis:
Hypothesis 2: Rivalry between size-defined stra-
tegic groups is asymmetric in the sense that
groups of smaller companies show a slower
Copyright 2005 John Wiley & Sons, Ltd. Strat. Mgmt. J., 26: 713–745 (2005)

8/14/2019 Asymmetric Rivalry Between Strategic Group
http://slidepdf.com/reader/full/asymmetric-rivalry-between-strategic-group 11/33
Asymmetric Rivalry between Strategic Groups 723
T a b l e 2 . T h e o r e t i c a l b a s i s o f a s y m m e t r i c r i v a l r y b e t w e e n s i z e - d e fi n e d s t r a t e g i c g r o u p s i n t e r m s o f s p e e d o f r e s p o n s e
P e r s p e c t i v e
T h e o r e t i c a
l b a s i s
A u t h o r s
M a j o r fi n d i n g s
S m a l l c o m p a n i e s s h o w a
f a s t e r s p e e d o f r e s p o n s e
t o c o m p e t i t i v e a c t i o n s
t h a n t h e i r l a r g e r r i v a l s
S t r a t e g i c
M a n a g e m e n t
J u d o s t r a t e g y s u g g e s t s t h a t s m a l l e r
c o m p a n i e s m a y
m o v e r a p i d l y t o
n e w m a r k e t s a v
o i d i n g
h e a d - t o - h e a d c o m b a t
Y o f fi e a n d
C u s u m a n o
( 1 9 9 9 )
W i t h s p e e d a n d fl e x i b i l i t y , N e t s c a p e
( D a v i d ) c o u l d c o m p e t e s u c c e s s f u l l y
w i t h
M i c r o s o f t ( G o l i a t h )
S m a l l c o m p a n i e s
a r e m o r e fl e x i b l e
a n d a r e n i c h e p
l a y e r s , w h e r e a s
l a r g e c o m p a n i e s h a v e m o r e
s t r u c t u r a l c o m p
l e x i t y a n d t r a d e
i n m a n y m a r k e t s
C h e n a n d
H a m b r i c k
( 1 9 9 5 )
N o e v i d e n c e t h a t t h e l a r g e s t 2 8 U . S .
a e r o n a u t i c c o m p a n i e s b e t w e e n 1 9 8 5
a n d
1 9 8 6 h a d a g r e a t e r r e s p o n s e s p e e d t h a n
s m a l l c o m p a n i e s t o l a r g e c o m p a n y
a c t i o n s
R i v a l r y b e t w e e n
s i z e - d e fi n e d s t r a t e g i c
g r o u p s i s a s y m m e t r i c i n
t h e s e n s e t h a t s m a l l e r
c o m p a n y g r o u p s s h o w a
s l o w e r s p e e d o f r e s p o n s e
t o t h e c o m p e t i t i v e a c t i o n s
o f t h e l a r g e r c o m p a n y
s t r a t e g i c g r o u p s t h a n v i c e
v e r s a ( H y p o t h e s i s H 2 )
S t r a t e g i c
M a n a g e m e n t
F i r m s w i t h o u t a m
p l e s l a c k
r e s o u r c e s n e e d
t i m e t o d e v e l o p
r e s o u r c e s t o fi n
a n c e t h e i r
r e s p o n s e .
W h e n c o m p e t i t o r s a r e a t t a c k e d i n
t h e i r k e y m a r k e t s , t h e y r e s p o n d
w i t h c a u t i o n ( s l o w l y ) , f o r f e a r
o f p r e c i p i t a t i n g
e s c a l a t i o n
r e t a l i a t i o n f r o m
t h e p o w e r f u l
i n i t i a t o r ( l a r g e s i z e )
S m i t h e t a l .
( 1 9 9 1 )
C h e n e t a l .
( 1 9 9 2 )
C h e n e t a l .
( 1 9 9 2 )
A w e a k n e g a t i v e r e l a t i o n s h i p f o r t h e 3
2
l a r g e s t U . S . a e r o n a u t i c a l c o m p a n i e s
b e t w e e n s l a c k r e s o u r c e s a n d r e s p o n s e l a g
A n a c t i o n w h i c h r e q u i r e s m o r e e f f o r t
( r e s o u r c e s ) t o e x e c u t e i s a s s o c i a t e d w i t h a
l o n g e r r e s p o n s e l a g
A p o s i t i v e r e l a t i o n s h i p f o r t h e 3 2 l a r g e s t
U . S . a e r o n a u t i c a l c o m p a n i e s b e t w e e
n
1 9 7 9 a n d 1 9 8 6 b e t w e e n r e s p o n s e l a g o f
d e f e n d e r a n d s i z e o f t h e i n i t i a t o r i n
t h e
m a r k e t s w h e r e a n a c t i o n i s t a k e n
Copyright 2005 John Wiley & Sons, Ltd. Strat. Mgmt. J., 26: 713–745 (2005)

8/14/2019 Asymmetric Rivalry Between Strategic Group
http://slidepdf.com/reader/full/asymmetric-rivalry-between-strategic-group 12/33
724 F. J. M´ as-Ruiz, J. L. Nicolau-Gonz´ albez and F. Ruiz-Moreno
speed of response to the competitive actions of
larger company strategic groups than vice versa.
Interaction between asymmetric rivalry ex ante
and ex post
Some authors argue that the lack of consensus with
respect to the propositions of intra- and between-
strategic groups rivalry could be due to operational
problems such as those derived from the hetero-
geneity of methods used to measure rivalry (Smith
et al., 1997). Along this line, a series of studies fol-
lows a cognitive approach to estimate rivalry from
a subjective point of view. As a starting point,
they use the perceptions of decision-makers inthe sector, whether they are of response strategies
(Vachani, 1990), or of the company’s direct com-
petitors (Gripsrud and Gronhaug, 1985; Easton,
1988; Porac and Thomas, 1994; Porac et al., 1995;
Lant and Baum, 1995).
Another current of research uses objective mea-
surements of available data sources. Among these,
we want to highlight, first, direct measurement
of competitive interaction, which uses news items
published in specialist publications and has a
multidimensional character as it considers strate-
gic company actions and responses (Smith et al.,
1997). Second, indirect measurements, which usu-ally employ one-dimensional indicators of rivalry,
such as price/cost (Peteraf, 1993), Herfindahl index
(Cool and Dierickx, 1993), conjectural variation
(Amit et al., 1988), and the coefficient of inter-
dependency in Gompertz models (Carroll and
Swaminathan, 1992).
Faced with this lack of consensus on the most
appropriate methodology for the measurement of
rivalry, authors such as Reger and Huff (1993),
Thomas and Venkatraman (1988), and Porac and
Thomas (1994) defend the need to carry out multi-
method confirmation studies to validate empiri-cal results. Following this approach, our study
applies two alternative methodologies: (1) the ex
post approach, based on examination of the com-
petitive actions and responses of members of the
group (Porter, 1980) found in newspapers and spe-
cialist magazines (Smith et al., 1997); and (2) the
ex ante expectations approach, based on the esti-
mation of conjectural variations between strategic
groups (Amit et al., 1988).
Basically, news reports on competitive actions
and responses found in newspapers examine ex
post whether or not the repositioning realized is
affected by the actions of competitors (Smith et al.,
1997). This methodology is centered (in the termi-
nology of Caves, 1984) on the rivalry movementsbetween the implicated companies. Rivalry can be
defined as the interchange of competitive move-
ments between the companies of a market (Porter,
1980), and Smith et al. (1997) propose the exam-
ination of competitive actions and responses as an
alternative to the study of competitive interaction.
It should not be forgotten that the way in which
a company acts and responds in a market deter-
mines its performance (Porter, 1980). Smith et al.
(1997) define (from Schumpeter, 1950) ‘compet-
itive actions’ as specific and detectable competi-
tive movements, such as price cuts, the introduc-tions of new products, expansion into new markets,
and special promotions, initiated by a company to
defend or better its relative competitive position. A
‘competitive response’ is a discernible and observ-
able competitive movement of counterattack (to an
initial competitive action), undertaken by a com-
pany with respect to one or more competitors to
defend or better its position (Porter, 1980).
For its part, conjectural variation constitutes an
important ex ante element in the decision-making
process of a company (Gollop and Roberts, 1979).
Conjectural variation reflects the expectations thatagents have of the different strategic behavior
of entities, and are generated through time as
a function of past experience through a process
of adaptative expectations. Conjectural variation
can be estimated for different strategic dimensions
(Putsis and Dhar, 1998). For example, for the
output capacity decision, the conjectural variation
constitutes a subjective estimation by an agent of
the effect of a 1 percent increase in the amount
offered over the increase in the amount offered by
another agent (Freixas, 1996).
In this way, conjectural variation constitutes ameasurement of the capabilities of a company from
the point of view of a rival. This means that a
company must examine its rival’s decision-making
process in order to find out the perception the rival
has of the first company’s response profile. This
measure will be later incorporated into the profit-
maximizing behavior of the rival, which in turn
will be considered in the original company’s deci-
sion making. In sum, conjectural variation itself
may be viewed as a reflection of a strategic asset,
namely the reputation of a firm. Reputation here
relates exclusively to the aggressiveness of firms
Copyright 2005 John Wiley & Sons, Ltd. Strat. Mgmt. J., 26: 713–745 (2005)

8/14/2019 Asymmetric Rivalry Between Strategic Group
http://slidepdf.com/reader/full/asymmetric-rivalry-between-strategic-group 13/33
Asymmetric Rivalry between Strategic Groups 725
in responding to changes in rivals’ policies (out-
put, prices, etc.). Therefore, the conjecture mea-
sures the aggressiveness of a company (Amit et al.,1988).
Our use of both ex ante and ex post approaches
in this paper is due to the fact that their rela-
tionship or interaction is of great interest to the
literature of strategic groups. In fact, Reger and
Huff (1993) suggest the existence of interaction
between ex ante expectations and ex post real-
izations, as expectations can influence subsequent
competitive reactions (economic realities). As
strategists scrutinize other firms within an indus-
try and develop mental frameworks for interpreting
what they see, they come to expect certain behav-ior and act on these expectations. Therefore, the
result is to further homogenize the repertoire of
strategic responses taken. Expectations, thus, are
another force for channeling firms into a limited
repertoire of behavior.
In general, the literature of strategic groups has
paid little attention to the link between ex ante
expectations and ex post rivalry behavior (see
Table 3). One research thread defended by Amit
et al. (1988) indicates that situations can arise in
which a company believes that a competitor will be
very aggressive in their response to a competitive
action and that a further similar reaction could
result in an undesirable war (ex ante), so it would
not respond (ex post ) to the original competitive
action. Conversely, if it believes that the other
company will be passive, it believes (ex ante)
that the company will not start a war and will,
therefore, respond (ex post ) to the competitive
action.
However, our paper proposes interaction be-
tween ex ante expectations and ex post actions/
responses between strategic groups (size-defined)
in the sense that expectations (ex ante) of aggres-
siveness in output quantity (bank deposits) of thelarge-size strategic group characterize ex post reac-
tions from the small-size groups in terms of greater
response to actions of the large-size group. This
proposal is supported by the following argumenta-
tion.
Reger and Huff (1993) indicate that, if a firm
is classified (ex ante) as aggressive, small changes
in its strategy will be given increased importance
and retaliatory responses (ex post ) are more likely.
Similar actions by another firm, perceived to be
following a less aggressive path, will be taken less
seriously. In fact, Amit et al. (1988) observe that
the study of Gollop and Roberts (1979) obtains
a negative parameter for the conjectural variation
(output quantity) of the large-size strategic group;in other words, this group anticipates (ex ante) that
aggregate output from all other firms will fall in
response to a planned increase in its own output
(larger size group). Consequently, these authors
expect a relatively large response (ex post ) of
smaller-size strategic groups.
In the specific case of the Spanish banking
industry, its conditions reveal that:
1. Output quantity decisions are of a strategic type
(Gual and Vives, 1991) as shown by Chen et al.
(1992) in that they involve significant invest-
ment in fixed assets and/or people/structure. In
fact, competition in the area of deposit cap-
ture (output) is characteristic of the Spanish
banking system in the 1980s (Gual and Vives,
1991) and the first half of the 1990s (Freixas,
1996); capture of deposits through competi-
tion in branches, in other words, through over-
investment in services and client/branch net-
work proximity.
2. Traditional limitations to the geographical ex-
pansion of the saving banks have created a
Spanish banking sector in which the entities(banks and saving banks) have an operating
area that is either national, regional or local, as
the limitations to the geographical expansion
of the saving banks have made markets with
local or regional character. Moreover, the geo-
graphical freedom enjoyed by the savings banks
since 1989 has created an aggressive expansion
policy on the part of the large entities that, in
turn, has provoked a defensive movement by
the smaller entities, which have formed geo-
graphical groupings (Gual and Vives, 1991).
In this context, there are ex ante expectationsof large entity aggression in terms of deposit
quantities (strategic decision to expand branch
network), and it can be assumed, following
Reger and Huff (1993), that any action, either
strategic (for example, mergers, market entries,
agreements, and investments) or tactical (for
example products and prices), of the large-size
strategic group will be of great importance to
the small-size groups as they affect their local
and/or regional markets, which means that they
will effect greater ex post competitive responses
than vice versa.
Copyright 2005 John Wiley & Sons, Ltd. Strat. Mgmt. J., 26: 713–745 (2005)

8/14/2019 Asymmetric Rivalry Between Strategic Group
http://slidepdf.com/reader/full/asymmetric-rivalry-between-strategic-group 14/33
726 F. J. M´ as-Ruiz, J. L. Nicolau-Gonz´ albez and F. Ruiz-Moreno
Table 3. Theoretical basis of asymmetric rivalry between size-defined strategic groups in terms of interaction betweenex ante expectations and ex post rivalry behavior
Perspective Theoretical basis Authors
Ex ante expectations of aggressiveness from onecompany characterize ex post reactions from another interms of non-response to thecompetitive action of theformer
StrategicManagement
If a firm is classified asaggressive (ex ante), theactions of the othercompany coulddegenerate ex ante intowar, meaning that thesecond company will notrespond ex post
Amit et al.(1988)
Expectations influence ex post asymmetric rivalry betweensize-defined strategic groups,in the sense that the
conjectural variations inaggressiveness in the outputquantity of large-size groupscharacterize the ex post reactions of the small-sizegroup in terms of greaterresponse to large-size groupactions than vice versa(Hypothesis 3)
CognitiveStrategicManagement
If a firm is classified asaggressive (ex ante),small changes in itsstrategy will be given
increased importance andretaliatory responses (ex
post ) are more likely
Reger and Huff (1993)
In virtue of the above, we propose the following
hypothesis of interaction between ex ante expec-
tations and ex post asymmetric rivalry between
size-defined strategic groups:
Hypothesis 3: Expectations influence ex post
asymmetric rivalry between size-defined strate-
gic groups in the sense that the conjectural vari-
ations of aggressiveness in output quantity of the
large size groups characterize the ex post reac-
tions of the small-size groups in terms of greater
response to actions of the large-size group than
vice versa.
PREVIOUS EMPIRICAL FINDINGS INTHE FINANCIAL SECTOR
Different analyses of rivalry in the financial indus-
try have been carried out, in Spain as in other
countries, from a strategic group perspective.
On an international level, we want to highlight
a line of investigation that, using data from indi-
vidual entities, analyzes the market power with
oligopolistic models of competition with homoge-
neous product and estimates agents’ output behav-
ior parameters. This behavior is represented by
conjectural variation at the level of strategic groups
of banking entities defined by size. This means it
is assumed that the conjectures of a company on
the responses of another depend on their relative
sizes in the market (Gollop and Roberts, 1979). In
this line, we find the work of Spiller and Favaro
(1984) in the Uruguayan credit market, and of
Berg and Kim (1994) in the Norwegian credit and
deposit market. However, only the work of Spiller
and Favaro (1984) analyzes asymmetric rivalry,
finding that the form of interaction known as ‘dom-
inant–fringe’ becomes one of ‘leader–follower’ in
a situation of deregulation.
Another current of research, defended by Burke
(1990), analyzes the asymmetric rivalry between
strategic groups in Californian banking. She
defines strategic groups according to their scope
(statewide, metropolitan, and local) as proxies for
size. Burke uses a regression analysis to find
the impact on performance and finds, in line
with Strategic Management (Chen and Hambrick,
1995), that competitive influence flows downwards
through the statewide– metropolitan – local hierar-
chy. In other words, a ‘dominant–fringe’ interac-
tion.
Various empirical studies have been carried out
on Spanish financial institutions, in which differ-
ent approaches have been noted. One current of
Copyright 2005 John Wiley & Sons, Ltd. Strat. Mgmt. J., 26: 713–745 (2005)
8/14/2019 Asymmetric Rivalry Between Strategic Group
http://slidepdf.com/reader/full/asymmetric-rivalry-between-strategic-group 15/33
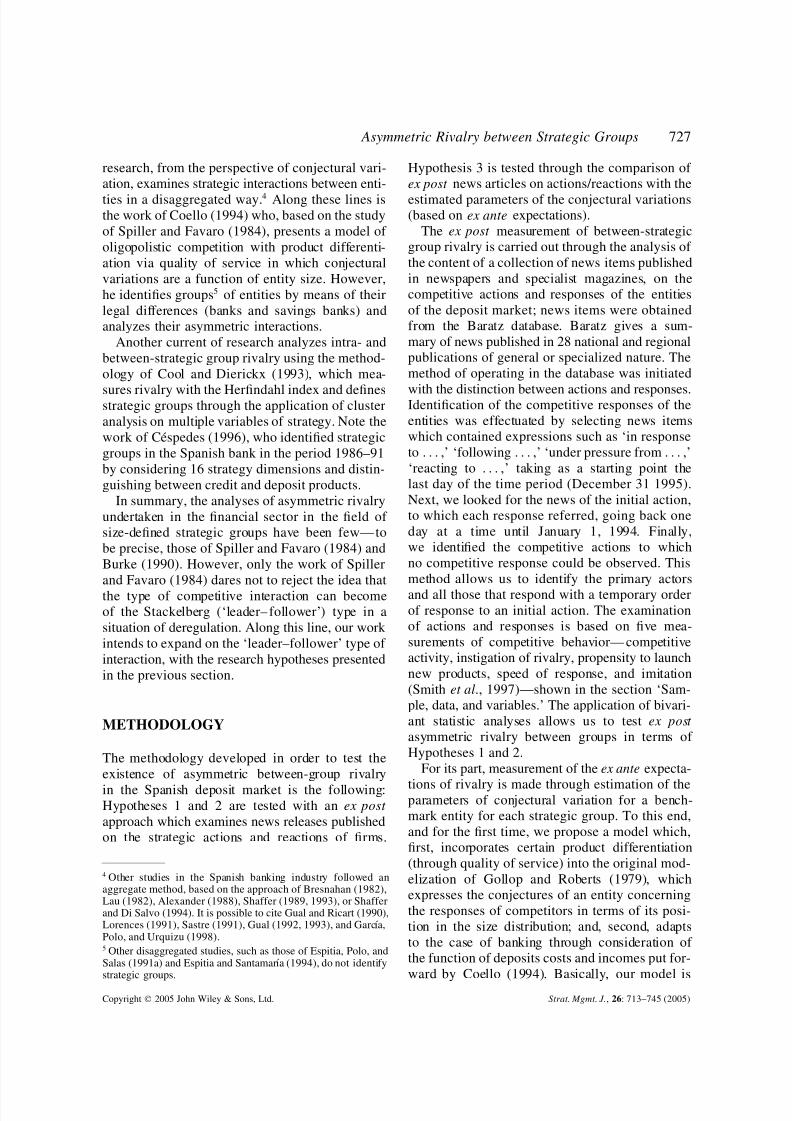
Asymmetric Rivalry between Strategic Groups 727
research, from the perspective of conjectural vari-
ation, examines strategic interactions between enti-
ties in a disaggregated way.4 Along these lines isthe work of Coello (1994) who, based on the study
of Spiller and Favaro (1984), presents a model of
oligopolistic competition with product differenti-
ation via quality of service in which conjectural
variations are a function of entity size. However,
he identifies groups5 of entities by means of their
legal differences (banks and savings banks) and
analyzes their asymmetric interactions.
Another current of research analyzes intra- and
between-strategic group rivalry using the method-
ology of Cool and Dierickx (1993), which mea-
sures rivalry with the Herfindahl index and definesstrategic groups through the application of cluster
analysis on multiple variables of strategy. Note the
work of Cespedes (1996), who identified strategic
groups in the Spanish bank in the period 1986–91
by considering 16 strategy dimensions and distin-
guishing between credit and deposit products.
In summary, the analyses of asymmetric rivalry
undertaken in the financial sector in the field of
size-defined strategic groups have been few— to
be precise, those of Spiller and Favaro (1984) and
Burke (1990). However, only the work of Spiller
and Favaro (1984) dares not to reject the idea that
the type of competitive interaction can become
of the Stackelberg (‘leader– follower’) type in a
situation of deregulation. Along this line, our work
intends to expand on the ‘leader–follower’ type of
interaction, with the research hypotheses presented
in the previous section.
METHODOLOGY
The methodology developed in order to test the
existence of asymmetric between-group rivalry
in the Spanish deposit market is the following:Hypotheses 1 and 2 are tested with an ex post
approach which examines news releases published
on the strategic actions and reactions of firms.
4 Other studies in the Spanish banking industry followed anaggregate method, based on the approach of Bresnahan (1982),Lau (1982), Alexander (1988), Shaffer (1989, 1993), or Shafferand Di Salvo (1994). It is possible to cite Gual and Ricart (1990),Lorences (1991), Sastre (1991), Gual (1992, 1993), and Garcıa,Polo, and Urquizu (1998).5 Other disaggregated studies, such as those of Espitia, Polo, andSalas (1991a) and Espitia and Santamarıa (1994), do not identifystrategic groups.
Hypothesis 3 is tested through the comparison of
ex post news articles on actions/reactions with the
estimated parameters of the conjectural variations(based on ex ante expectations).
The ex post measurement of between-strategic
group rivalry is carried out through the analysis of
the content of a collection of news items published
in newspapers and specialist magazines, on the
competitive actions and responses of the entities
of the deposit market; news items were obtained
from the Baratz database. Baratz gives a sum-
mary of news published in 28 national and regional
publications of general or specialized nature. The
method of operating in the database was initiated
with the distinction between actions and responses.Identification of the competitive responses of the
entities was effectuated by selecting news items
which contained expressions such as ‘in response
to . . . ,’ ‘following . . . ,’ ‘under pressure from . . . ,’
‘reacting to . . . ,’ taking as a starting point the
last day of the time period (December 31 1995).
Next, we looked for the news of the initial action,
to which each response referred, going back one
day at a time until January 1, 1994. Finally,
we identified the competitive actions to which
no competitive response could be observed. This
method allows us to identify the primary actors
and all those that respond with a temporary order
of response to an initial action. The examination
of actions and responses is based on five mea-
surements of competitive behavior— competitive
activity, instigation of rivalry, propensity to launch
new products, speed of response, and imitation
(Smith et al., 1997)—shown in the section ‘Sam-
ple, data, and variables.’ The application of bivari-
ant statistic analyses allows us to test ex post
asymmetric rivalry between groups in terms of
Hypotheses 1 and 2.
For its part, measurement of the ex ante expecta-
tions of rivalry is made through estimation of theparameters of conjectural variation for a bench-
mark entity for each strategic group. To this end,
and for the first time, we propose a model which,
first, incorporates certain product differentiation
(through quality of service) into the original mod-
elization of Gollop and Roberts (1979), which
expresses the conjectures of an entity concerning
the responses of competitors in terms of its posi-
tion in the size distribution; and, second, adapts
to the case of banking through consideration of
the function of deposits costs and incomes put for-
ward by Coello (1994). Basically, our model is
Copyright 2005 John Wiley & Sons, Ltd. Strat. Mgmt. J., 26: 713–745 (2005)
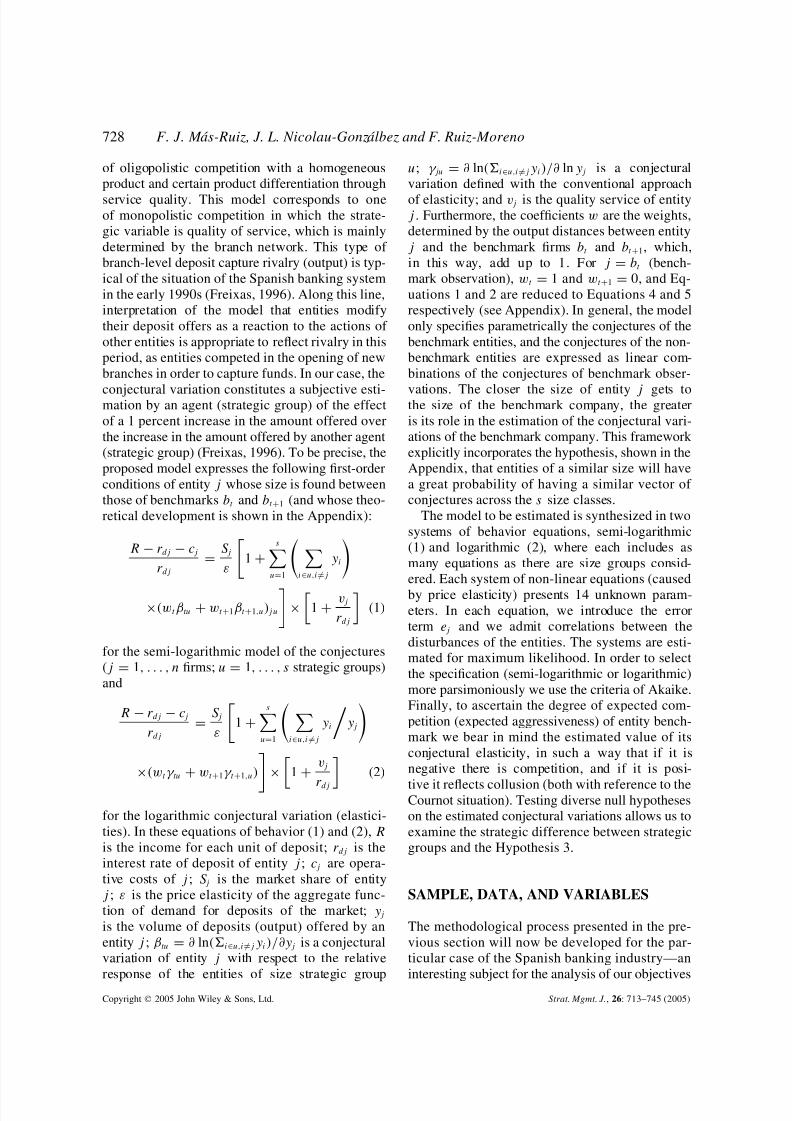
8/14/2019 Asymmetric Rivalry Between Strategic Group
http://slidepdf.com/reader/full/asymmetric-rivalry-between-strategic-group 16/33
728 F. J. M´ as-Ruiz, J. L. Nicolau-Gonz´ albez and F. Ruiz-Moreno
of oligopolistic competition with a homogeneous
product and certain product differentiation through
service quality. This model corresponds to oneof monopolistic competition in which the strate-
gic variable is quality of service, which is mainly
determined by the branch network. This type of
branch-level deposit capture rivalry (output) is typ-
ical of the situation of the Spanish banking system
in the early 1990s (Freixas, 1996). Along this line,
interpretation of the model that entities modify
their deposit offers as a reaction to the actions of
other entities is appropriate to reflect rivalry in this
period, as entities competed in the opening of new
branches in order to capture funds. In our case, the
conjectural variation constitutes a subjective esti-mation by an agent (strategic group) of the effect
of a 1 percent increase in the amount offered over
the increase in the amount offered by another agent
(strategic group) (Freixas, 1996). To be precise, the
proposed model expresses the following first-order
conditions of entity j whose size is found between
those of benchmarks bt and bt +1 (and whose theo-
retical development is shown in the Appendix):
R − rdj − cj
rdj
=S j
ε
1+
su=1
i∈u,i=j
yi
×(wt βtu +wt +1βt +1,u)j u
×
1 +
vj
rdj
(1)
for the semi-logarithmic model of the conjectures
(j = 1, . . . , n firms; u = 1, . . . , s strategic groups)
and
R − rdj − cj
rdj
=S j
ε
1 +
su=1
i∈u,i=j
yi
yj
×(wt γ tu +wt +1γ t +1,u)× 1 +vj
rdj (2)
for the logarithmic conjectural variation (elastici-
ties). In these equations of behavior (1) and (2), R
is the income for each unit of deposit; rdj is the
interest rate of deposit of entity j ; cj are opera-
tive costs of j ; S j is the market share of entity
j ; ε is the price elasticity of the aggregate func-
tion of demand for deposits of the market; yj
is the volume of deposits (output) offered by an
entity j ; βtu = ∂ ln(i∈u,i=j yi )/∂yj is a conjectural
variation of entity j with respect to the relative
response of the entities of size strategic group
u; γ ju = ∂ ln(i∈u,i=j yi )/∂ ln yj is a conjectural
variation defined with the conventional approach
of elasticity; and vj is the quality service of entityj . Furthermore, the coefficients w are the weights,
determined by the output distances between entity
j and the benchmark firms bt and bt +1, which,
in this way, add up to 1. For j = bt (bench-
mark observation), wt = 1 and wt +1 = 0, and Eq-
uations 1 and 2 are reduced to Equations 4 and 5
respectively (see Appendix). In general, the model
only specifies parametrically the conjectures of the
benchmark entities, and the conjectures of the non-
benchmark entities are expressed as linear com-
binations of the conjectures of benchmark obser-
vations. The closer the size of entity j gets tothe size of the benchmark company, the greater
is its role in the estimation of the conjectural vari-
ations of the benchmark company. This framework
explicitly incorporates the hypothesis, shown in the
Appendix, that entities of a similar size will have
a great probability of having a similar vector of
conjectures across the s size classes.
The model to be estimated is synthesized in two
systems of behavior equations, semi-logarithmic
(1) and logarithmic (2), where each includes as
many equations as there are size groups consid-
ered. Each system of non-linear equations (caused
by price elasticity) presents 14 unknown param-
eters. In each equation, we introduce the error
term ej and we admit correlations between the
disturbances of the entities. The systems are esti-
mated for maximum likelihood. In order to select
the specification (semi-logarithmic or logarithmic)
more parsimoniously we use the criteria of Akaike.
Finally, to ascertain the degree of expected com-
petition (expected aggressiveness) of entity bench-
mark we bear in mind the estimated value of its
conjectural elasticity, in such a way that if it is
negative there is competition, and if it is posi-
tive it reflects collusion (both with reference to theCournot situation). Testing diverse null hypotheses
on the estimated conjectural variations allows us to
examine the strategic difference between strategic
groups and the Hypothesis 3.
SAMPLE, DATA, AND VARIABLES
The methodological process presented in the pre-
vious section will now be developed for the par-
ticular case of the Spanish banking industry—an
interesting subject for the analysis of our objectives
Copyright 2005 John Wiley & Sons, Ltd. Strat. Mgmt. J., 26: 713–745 (2005)

8/14/2019 Asymmetric Rivalry Between Strategic Group
http://slidepdf.com/reader/full/asymmetric-rivalry-between-strategic-group 17/33
Asymmetric Rivalry between Strategic Groups 729
insofar as it has experienced significant structural
changes in response to the processes of deregula-
tion and European integration (Manas, 1992; Gual,1992, 1993). This has influenced the configuration
of the strategic groups.
The deregulation experienced by Spanish bank-
ing since the end of the 1970s has been a long
and far-reaching process, which culminated in the
period 1989–92 with the reform and reduction of
the coefficient of obligatory reserves (which con-
trols the volume of liquid assets of the banking
system), and the growing liberalization towards
the entry of foreign competitors. As a whole,
the deregulatory measures have affected both the
behavior of entities (liberalization of interest rates,commissions, etc.), and the structure of the sector
(entry of new competitors, elimination of the artifi-
cial separation of the different subsectors—banks
and savings banks—of the financial sector, etc.).
The integration of European banking markets
was brought about by various community direc-
tives which affected the banking sector, but in
particular by the liberalization of capital move-
ments and by the Second Banking Directive, which
introduced the principle of mutual recognition of
financial entities. These measures, and their antici-
pation on the part of banking entities, have brought
about the growing integration of European banking
markets (Gual, 1993).
As a consequence of these two large regulatory
changes (Spanish deregulation and European inte-
gration), the sector has been subjected to strong
restructuring characterized by a process of merg-
ers and acquisitions (Gual, 1993), which are due
to a wish to increase size in order to compete
in the European market and to preserve market
power (Gual and Vives, 1991). To be precise, this
restructuring of the sector comes down to certain
tendencies (Gual, 1993). First, the concentration
of the sector—mergers and acquisitions augmentthe degree of concentration, although the strong
growth of medium-size entities and the entry
of new competitors tend to diminish it. Second,
restructuring has only involved Spanish entities,
which have merged in order to find economic effi-
ciency through national economies of scale. More-
over, this exclusive involvement of Spanish enti-
ties is understood from a political perspective, in
that public authorities could have limited the entry
of foreign entities in order to maintain national
control over a ‘strategic’ sector. Third, restructur-
ing allows a rationalization of the sector, in relation
to networks (elimination of redundant offices once
price competition begins) and to secondary brands
(small entities of a functionally or geographicallyspecialized character, which are controlled by large
banks, are put up for sale, which often constitutes
the entry or expansion vehicle for foreign entities
moving into Spain). Fourth, there have not been
any large transnational or Europe-wide mergers,
but geographical expansion through the acquisition
of small or medium-size entities in neighboring
countries.
From the specific perspective of savings banks,6
mergers and acquisitions—i.e., the objective of
size—have also been used to solve some of the
particular problems of these entities, such as thoserelated to their scarce resources, their internal
restrictions on types of activity, and their freedom
of geographical movement. Basically, the freedom
of geographical placement of the savings banks,
in place since December 1988,7 creates, on the
one hand, an expansion policy on the part of the
large savings banks through the acquisition of the
commercial networks of other entities and, on the
other hand, defensive action on the part of smaller
savings banks, which begin to form geographical
groups. This is achieved by an accelerated process
of mergers and acquisitions, mainly by savings
banks operating in the same markets (Gual and
Vives, 1991).
Apart from the above, the traditional limitations
to the geographical expansion of the savings banks
has created a Spanish banking sector in which the
entities (banks and savings banks) have an oper-
ating area which is either national, regional, or
6 The Spanish banking system is made up of two entity typeswith different legal natures. Private banks, which must be limitedcompanies; and savings banks, which, whether privately orpublicly owned, are non-profit making and operate in the public
interest. Despite their different legal nature, since 1977 theoperative capacity of the savings banks has been equal to thatof the banks. Before 1977, the savings banks could not makediscount of drafts nor take part in foreign activity. Moreover,today banks and savings banks can carry out practically all theoperations pertaining to the business of banking. In fact, in 1988the prohibition was lifted that prevented banks and savings banksfrom leasing and issuing mortgage bonds, which has allowedboth entity types to develop a model of universal banking (Gualand Vives, 1991).7 Before this date, the possibilities for savings banks to makestrategic geographical choices were limited to a choice betweenregional or local markets, with national being excluded from thechoice. For banks, however, the options regarding the geograph-ical dimension of their market had no limits. In summary, thesavings banks were incapable of competing with the banks byexpanding beyond their limits (Espitia et al., 1991b).
Copyright 2005 John Wiley & Sons, Ltd. Strat. Mgmt. J., 26: 713–745 (2005)

8/14/2019 Asymmetric Rivalry Between Strategic Group
http://slidepdf.com/reader/full/asymmetric-rivalry-between-strategic-group 18/33
730 F. J. M´ as-Ruiz, J. L. Nicolau-Gonz´ albez and F. Ruiz-Moreno
local, as the previously mentioned limitations to
the geographical expansion of the savings banks
has made markets with local or regional characters.In fact, the operating of some banks is also fun-
damentally local and/or regional (Gual and Vives,
1991; Carbo, Lopez, and Rodrıguez, 2003). To be
precise, the structure of the local or regional mar-
ket8 constitutes the differential characteristic of the
Spanish banking sector of the 1990s (Pita, 1999;
Pillof, 1999).
The Spanish banking industry, therefore, is com-
posed of three, size-defined, strategic groups: large
banks (national scope),9 whose distinctive charac-
teristic is their extensive branch network; medium-
size banks (regional scope), which have a signifi-cant presence in a few local markets; and smaller
banks which are to a greater or lesser extent func-
tionally or geographically specialized in one local
market. For the latter two, the relevant market
is the Autonomous Community and the Province
respectively (Gual and Vives, 1991).
To sum up, the extensive restructuring of the
Spanish banking sector and, in particular, the big
mergers, could be interpreted as a defensive reac-
tion to profit losses caused by the new, more
aggressive, behavior occasioned by deregulation
and the entry of new competitors (Gual, 1993).
8 The different nature and complexity of the markets (andregions) where they compete and the greater or lesser presenceof an entity in each territory configures a different financial con-text and market structure for each individual institution. There-fore, large-size financial intermediaries with offices in numer-ous regions face a different (and more diversified) competitivestructure and socioeconomic reality than entities which oper-ate in only one territory. In any case, technological advances intelecommunications and its relative cheapness in recent yearshave allowed the appearance and increased use of new dis-tribution channels (telephone, Internet) which are reducing therelative importance of physical distance (Moore, 1998), althoughthe weight of bank branches, their role as basic business units,and their geographical distribution are still very important inthe banking industry and, therefore, the regional/local approachis still pertinent in the definition of the relevant market (Carboet al., 2003).9 Boeker (1991) and Burke (1990) both illustrate the parallelismbetween company size and company classification according togeographical spread. In the case of banks, company size iscorrelated with geographical distribution (and the number of markets served) of a bank and with the combination of retail andcommercial financial services offered (Burke, 1990). Statewideentities are usually larger than those with an intermediary scope,while these are usually larger than local entities. In summary,given the general correlation between size and geographicalscope, the strategic groups identified through the examination of different-size companies should reflect inter-group differences intheir geographical strategies (Burke, 1990).
Insofar as the processes of deregulation and Euro-
pean integration have changed the focus of bank-
ing strategy, transforming collusion in competi-tive behavior (Gual and Vives, 1991), it is use-
ful to analyze the asymmetric competition existing
between strategic groups.
Time period
The time horizon, which is considered in order
to estimate conjectural variation, is of one year.
In reality, conjectures vary over time and are cer-
tainly formed as a part of a process of adaptative
expectations. However, we do not model that more
general process. Instead, we follow Gollop andRoberts (1979), so our model characterizes ratio-
nal producer behavior at a point of time. While the
conjectures are certainly a function of past experi-
ence, we assume the firm has a given and fixed set
of expectations at a particular point in time, and
the firm maximizes its objective function subject
to its expectations.
We selected the year 1994 (being after the period
of deregulation 1998–92) as it marked a change in
the economic cycle of the country with the start of
a period of recovery, and therefore is a significant
landmark for the Spanish banking system. This
time-specific change is fundamental to the study of
competition between financial intermediaries, as it
allows us to identify the two determining factors
of the strategies and performance of the sector:
economic situation and competition. During peri-
ods of recession, both aspects influence margins in
the same way. However, in periods of recovery,
like that which started in 1994, situational aspects
and competitive pressure have the opposite effect
on margins, which allows us to better estimate the
impact of competitive erosion and to obtain more
precise results than those generated by previous
analyses (Freixas, 1996). Moreover, the selectionof the year 1994 allows us to make comparisons
with the conclusions on rivalry obtained by Coello
(1994) on the increase in competitive intensity in
the deposit market for the time period immediately
preceding (1990–93). We should bear in mind that
the methodologies of both studies differ, although
they share the majority of input variables.
In addition, the study of rivalry in the 1994
deposit market allows for a clearer distinction
between competitive situational effects than a
study of the credit market, given that the economic
recovery of 1994 had different effects on these
Copyright 2005 John Wiley & Sons, Ltd. Strat. Mgmt. J., 26: 713–745 (2005)

8/14/2019 Asymmetric Rivalry Between Strategic Group
http://slidepdf.com/reader/full/asymmetric-rivalry-between-strategic-group 19/33
Asymmetric Rivalry between Strategic Groups 731
markets, growth in saving in 1994 was greater than
growth in investment, holding up the credit market
and expanding the deposit market (Freixas, 1996).Consequently, our study analyzes if, in 1994, enti-
ties compete for market share in the deposit market
by modifying the quantity of deposits solicited, and
will make models of conjectures on the quantities
of this output.
Finally, the time period considered in the anal-
ysis of news items on competitive actions and
responses is delimited by the financial year 1994–
95 with the aim of reflecting the ex post situation,
where a company’s market share will be affected,
ex post , by the actions of its competitors. This is
in contraposition to conjectural variation, whichconstitutes a significant ex ante element in the
decision-making process of a company and whose
modeling tries to characterize the rational behavior
of the producer in 1994.
Sample
The study is centered exclusively on the deposit
market, which is empirically possible because, of
the three markets (inter-bank, deposits, and credits)
of Spanish financial entities, the inter-bank market
is in a situation of perfect competition (a single
entity cannot influence the price of the market).
This, along with an assumption of separable costs
in the other two oligopolistic markets of credit and
deposit, allows us to work in each one indepen-
dently (Coello, 1994).
We have included 52 savings banks and 94
banks in 1994. The former constituted 99.9 per-
cent of their market, while the latter represented
96 percent of the Spanish bank deposit market.
We have included virtually all the entities in the
sector, which facilitates analysis of the structure of
the market. We have excluded credit cooperatives
because of their residual participation, entities withabnormal values, and those in liquidation.
The consideration of banks and savings banks
is because the significant transformations experi-
enced by the Spanish banking industry through
the development of the deregulation process have
led to greater homogeneity in the competitive atti-
tudes of both entity types. In fact, a good number
of studies in Spain, in particular those of Pastor
(1995), Perez, Maudos, and Pastor (1998), Mau-
dos, Pastor, and Perez (2002), and Maudos and
Pastor (2003), include banks and savings banks
after verifying that a consideration of subsamples
based on institutional differences is not adequate.
The homogeneity produced in recent years in the
specialization and regulation of the two types of institution indicates that they compete more and
more with each other, in both credit and deposit
product areas (Pastor, 1995).
In fact, the panorama of the Spanish deposit
market has changed recently with the abolition of
territorial restrictions to the expansion of savings
banks and the liberalization of interest rates; mov-
ing from a situation of double segmentation (geo-
graphical, due to restrictions on territorial expan-
sion, and functional, with savings banks centered
exclusively on retail banking and the banks ded-
icated to retail and wholesale banking), to a sit-uation where the division is not so clear. There-
fore, the degree of competition between entities is
potentially much greater and more homogeneous
(Coello, 1994). Moreover, certain events that have
occurred in retail banking, such as the ‘deposit
war,’ in which certain savings banks actively par-
ticipated, the taking over of small banks by certain
savings banks, and the significant growth of the
savings banks in the deposit market, show the
necessity of including this new competitive real-
ity between banks and savings banks in modeling
the Spanish deposit market (Coello, 1994).
Variables
Variables can be classified as follows:
1. Defining variables of strategic groups. We apply
the size of the company, defined as the vol-
ume of deposits at the end of 1994. In this
study, as in others on the sector, the three afore-
said groups are considered (e.g., Freixas, 1996).
The limits of separation are established with a
view to finding a certain homogeneity of sizein each category, which are as follows: large
(deposits > 2 billion pesetas), medium
(415,000 million pesetas < deposits < 2 billion
pesetas), and small (deposits < 415,000 million
pesetas).
2. Variables in the modeling of conjectural vari-
ation. Following Coello (1994), we have first
considered variables related to income per de-
posit unit: the inter-bank interest rate (rb) for
3-month operations, the average remuneration
of the coefficient of obligatory reserves (rr ), and
the legal level of the coefficient of obligatory
Copyright 2005 John Wiley & Sons, Ltd. Strat. Mgmt. J., 26: 713–745 (2005)

8/14/2019 Asymmetric Rivalry Between Strategic Group
http://slidepdf.com/reader/full/asymmetric-rivalry-between-strategic-group 20/33
732 F. J. M´ as-Ruiz, J. L. Nicolau-Gonz´ albez and F. Ruiz-Moreno
reserves (λ). These were obtained from statis-
tical and economic bulletins from the Bank of
Spain.The interest rate rdj paid by entity j for its
deposits is estimated with an average deposit
cost using financial costs and the volume of
deposits. This is due to the lack of information
about interest rates individualized by type of
operation and entity. With the aim that the
definition of deposit volume yj is consistent
with the measurement of rdj , we use a wide
concept of deposits,10 which is defined as the
sum of balance entries ‘debits to clients,’ ‘debits
represented by negotiable shares,’ and ‘other
debits.’ The marginal cost of exploitation ismeasured, assuming constant returns to scale,
using operating costs (costs of personnel, other
administrative costs including building costs
and depreciation) reflected in the profit and loss
account, calculated pro rata for the volume of
current liability from the entity.
Finally, quality of service (vj ) brings together
those characteristics of entity j whose combina-
tion represents the implicit interest rate that a
depositor obtains by choosing the said entity.
It is defined as a linear function (vj = α0 +
α1x
1+ · · · + α
nx
n) dependent on the dimen-
sions whose combination is more significant
in the estimation of the system of equations.
Among them are considered offices by km2,
employees per office, and deposits per office.
These are taken from the annual statistics of
the private banks and the confederated savings
banks.
3. Variables representing ex post competitive be-
havior. These are obtained from news items on
the actions and responses found in the Baratz
database.
(a) Competitive activity. This is defined by the
number of competitive movements (including
actions and responses) of an entity in one
year.
(b) Rivalry instigation. This is given by the ratio
of ‘number of primary movements of a com-
pany in a year/total number of movements it
had’ (it is assumed that a company does not
instigate a competitive war when it does not
10 In fact, the concept of deposits corresponds with the balanceentrance of ‘savings deposits.’
make the first move, given that it acts as a fol-
lower). A high ratio would be an indicator of
rivalry instigation, while a low ratio suggeststhat the company is a ‘reactor.’
(c) Propensity to launch new products. This
shows if a company is inclined to introduce
new products. It is measured as ‘percentage
of movements of new product launch (actions
and responses)/total number of movements of
an entity in a year,’
(d) Speed of response. This indicates the time
that a company takes to respond to the action
of a competitor. It is defined as the aver-
age delay time, in days, of the responses of
an entity to the actions of its competitors ina year. However, response time varies with
the type of initial action (for example, com-
plex, time-consuming actions tend to evoke
complex, time-consuming responses). To con-
trol for these effects, Chen and Hambrick
(1995) propose first regressed (OLS) response
time on type of action for all years and com-
panies. The resulting residual indicated how
much a company’s rating differed from the
value we predicted on the basis of the action
type. They then use the average residual of
all a company’s responses in a given year as
that company’s response time for that year.(e) Imitation of a response to an action. This
reflects the degree of duplication implied in
each response. It is measured with a dummy
that assigns a 1 when both coincide and a 0
in the opposite case.
RESULTS AND DISCUSSION
Test of Hypothesis 1 of asymmetric rivalry
between strategic groups in terms of response
To begin, it is convenient to characterize thestrategic groups of financial entities in 1994. The
first group (G.I) contains the big six, represent-
ing 41.04 percent of the total market. The second
group (G.II) has 27 medium-size entities; it makes
up 35.64 percent of the market. The 113 remaining
make up the third group (G.III) of small entities,
which account for 21.12 percent of the deposit
market.
This section examines ex post asymmetric com-
petitive behavior between strategic groups in the
Spanish deposit market in the years 1994 and 1995,
through the use of news items on the competitive
Copyright 2005 John Wiley & Sons, Ltd. Strat. Mgmt. J., 26: 713–745 (2005)

8/14/2019 Asymmetric Rivalry Between Strategic Group
http://slidepdf.com/reader/full/asymmetric-rivalry-between-strategic-group 21/33
Asymmetric Rivalry between Strategic Groups 733
T a b l e 4 . A n a l y s i s o f s t r a t e g i c b e h a v i o
r b e t w e e n s t r a t e g i c g r o u p s ( s t a n d a r d e r r o r s i n p a r e n t h e s e s )
V a r i a b l e s o f b e h a v i o r
M e a n
C o r r e l a t i o n s
S t r a t e g i c g r o u p s
F
C A
R I
P L N P
S R
G . I
G . I I
G . I I I
C o m p e t i t i v e A c t i v i t y ( C . A . )
1 . 8 4 ( 2 . 9 9 )
7 . 5 8 ( 5 . 6 1 )
1 . 7 0 ( 2 . 0 7 )
0 . 8 7 ( 1 . 0 8 ) 2 2
. 8 9 ∗
R i v a l r y I n s t i g a t i o n ( R . I . )
0 . 3 9 ( 0 . 2 6 )
0 . 3 5 ∗
0 . 6 7 ( 0 . 1 8 )
0 . 3 0 ( 0 . 2 4 )
0 . 3 9 ( 0 . 2 6 ) 4
. 7 6 ∗ ∗
P r o p e n s i t y t o l a u n c h n e w p r o d u c t s ( P . L
. N . P . )
0 . 0 8 ( 0 . 1 7 )
0 . 2 5 ∗ ∗ ∗
0 . 2 2 ∗ ∗ ∗
0 . 1 0 ( 0 . 1 3 )
0 . 1 0 ( 0 . 1 7 )
0 . 0 6 ( 0 . 1 8 ) 0
. 4 1
S p e e d o f r e s p o n s e ( S . R . )
2 6 9 . 1 4 ( 1 6 7 . 6 ) − 0 . 2 9 ∗ ∗ ∗
− 0 . 2 4
− 0 . 3 1 ∗ ∗ ∗
2 5 2 . 1 ( 1 3
6 . 4 ) 2 8 3 . 5 ( 1 8 8 . 0 ) 2 6 2 . 5 ( 1 6 8 . 6 ) 0
. 0 8
I m i t a t i o n o f a r e s p o n s e t o a n a c t i o n
0 . 7 2 ( 1 . 1 5 )
0 . 9 2 ∗
0 . 1 2
0 . 2 6 ∗ ∗
− 0 . 3 1 ∗ ∗ ∗
2 . 9 1 ( 2 . 2 0 )
0 . 7 9 ( 0 . 7 7 )
0 . 2 8 ( 0 . 3 9 ) 2 4
. 0 7 ∗
M A N O V A
3
. 5 0 ∗
∗ P r o b . <
0 . 0 1 ; ∗ ∗ P r o b . <
0 . 0 5 ; ∗ ∗ ∗ P r o b . <
0 . 1 0
Copyright 2005 John Wiley & Sons, Ltd. Strat. Mgmt. J., 26: 713–745 (2005)

8/14/2019 Asymmetric Rivalry Between Strategic Group
http://slidepdf.com/reader/full/asymmetric-rivalry-between-strategic-group 22/33
734 F. J. M´ as-Ruiz, J. L. Nicolau-Gonz´ albez and F. Ruiz-Moreno
responses to the initial actions (Table 4) of the 146
financial entities of the sample. In any case, we
carry out a preliminary analysis of the informationobtained.
First, we detected 126 actions (38 of which
provoked at least one response) and 82 responses.
Second, Table 4 shows the descriptive statis-
tics and the relationship between the five vari-
ables of competitive behavior. It shows a certain
degree of correlation between practically all of
them and with the expected sign; in other words,
positive correlation for all variables except speed
of response. Therefore, a lower number of days
before response (speed of response) is associated
with greater competitive activity, rivalry instiga-tion, propensity to launch new products, and imi-
tation of a response to an action.
The MANOVA test (see Table 4) shows a signif-
icant F -statistic, which suggests that the patterns
of competitive behavior or way of competing differ
significantly between strategic groups. The uni-
variate ANOVAs also show these significant rela-
tionships of strategic groups with respect to com-
petitive activity (frequency of movements), degree
of rivalry instigation (the first to move instigates
rivalry), and the level of action/response imitation.
In particular, the differences between the strate-
gic groups of entities with respect to the variables
of competitive behavior are manifested by the fact
that large-sized companies (G.I) present higher lev-
els of competitive action, rivalry instigation, and
imitation of rivals from other groups. The group
of small-sized companies (G.III) shows the least
degree of competitive activity and imitation. The
medium-sized entities (G.II) offer the lowest indi-
cator of rivalry instigation. In addition, it should
be pointed out that G.II and G.III are character-ized by lower levels of rivalry instigation, which
indicates that they are ‘reactors.’ However, the
propensity to launch new products (in proportion
to other types of movement) and the speed of
response (response delay in days) do not differ
significantly between the groups. Consequently, it
can be indicated that the nature of competition
varies significantly between the strategic groups
because there is a significant difference in the way
in which a company deals with one or the other
at the moment of competing. In this sense, it is
necessary to analyze asymmetric between-groupcompetitive interaction.
Third, Table 5 classifies measurements corre-
sponding to the news of action and response
between entities and distinguishes the groups by
size. Following Smith et al. (1997), we apply the
χ 2 test in order to test whether between-group
rivalry is greater than intra-group rivalry. The lack
of significance in the results does not allow any
conclusions on whether between-group rivalry is
higher than intra-group; this suggests, in line with
Smith et al. (1997), that the fundamental question
may not be the comparison of the level of intra-and between-group rivalry, as suggested by the lit-
erature on strategic groups, but the way in which
the different groups act competitively in relation to
other groups. In line with this, our study is centered
on between-group competition, in order to deter-
mine whether the responses can be systematically
Table 5. Measurement of asymmetric rivalry between strategic groups in terms of responses
Actions taken by the Responses from the companies
companiesG.I
Large entitiesG.II
Medium entitiesG.III
Small entitiesTotal of
rows
G.I Large entities 26 21 10 57% rows 45.6% 36.8% 17.5% 69.5%% columns 74.3% 75.0% 52.6%G.II Medium entities 3 3 4 10% rows 30.0% 30.0% 40.0% 12.2%% columns 8.6% 10.7% 21.1%G.III Small entities 6 4 5 15% rows 40.0% 26.7% 33.3% 18.3%% columns 17.1% 14.3% 26.3%Total of columns 35 28 19 82% rows 42.7% 34.1% 23.2% 100.0%
χ 2 3.60
Copyright 2005 John Wiley & Sons, Ltd. Strat. Mgmt. J., 26: 713–745 (2005)

8/14/2019 Asymmetric Rivalry Between Strategic Group
http://slidepdf.com/reader/full/asymmetric-rivalry-between-strategic-group 23/33
Asymmetric Rivalry between Strategic Groups 735
and predictably structured in terms of asymmetry
(Hypothesis 1).
A detailed examination of the horizontal andvertical percentages of Table 5 allows clarification
of the nature of the between-group competitive
asymmetry assumed in Hypothesis 1. In princi-
ple, the low mobility barriers of any group when
responding to the competitive actions of entities
from other strategic groups suggests the impor-
tance of research into asymmetric between-group
rivalry using entity responses to the competitive
actions of entities from different strategic groups.
It is observed that three (30%) of the G.II
actions are responded to by G.I, while 21 (36%)
of the G.I actions are responded to by G.II. Ata response level (percent vertical), there is a high
percentage of G.II reaction (75%) to G.I actions as
opposed to a low percentage (8%) of G.I reaction
to G.II actions. In other words, it seems that G.II
tends to respond with more ease to G.I than vice
versa. These results would support Hypothesis 1 of
greater reaction of small entities strategic groups
to the competitive actions of large entities strategic
groups than vice versa.
On the other hand, 40 percent of G.II actions
are replicated by G.III, while 26 percent of G.III
actions are counterattacked by G.II. With regard
to responses (percent vertical), there is a high
percentage of G.III reaction (21%) to G.II actions
with a low percentage of G.II reaction (14%) to
G.III actions. Therefore, G.III responds more to
G.II than vice versa. This proves Hypothesis 1 of
greater small company strategic groups reaction to
large company strategic groups action than vice
versa.
Finally, 10 G.I actions are replicated by G.III,
while only six G.III actions are counterattacked by
G.I. In terms of responses (percent vertical), there
is a high percentage of G.III reactions (52%) to
G.I actions as opposed to a low percentage of G.Ireactions (17%) to G.III actions. It seems that G.III
tends to respond with more ease to G.I than vice
versa, therefore continuing to support Hypothesis
1 of greater small entity strategic groups reac-
tion to the competitive actions of large entities
strategic groups than vice versa. All of this could
indicate that asymmetric competitive interaction
between strategic groups in the Spanish banking
deposit market is characterized by the ‘insular-
ity’ of the strongest companies (Miller and Chen,
1994), which consider small companies to be non-
key competitors (Chen, 1996).
Gual and Vives (1991) indicate, in line with
Farrell and Shapiro (1987) and Farrell and Klem-
perer (2001), that in Spanish banking small enti-ties have an incentive to compete aggressively on
price in order to gain clients, whereas large com-
panies tend to exploit their existing client base.
In other words, large banks invest in a large
branch network to have a large stable client base
(risk adverse), with few external opportunities,
and to establish a reputation for solvency. This
would allow them to be non-aggressive in terms
of price (‘fat cats’) (Fudenberg and Tirole, 1984),
and they would enjoy large margins. In contrast,
small and medium-size banks opt for limited net-
works, aggressive pricing and working with lessrisk-adverse and better-informed clients. They act
like ‘puppy dogs’ by promising to remain small
(Gual and Vives, 1991). In fact, this small com-
pany price and capacity limitation strategy reduces
the threat of the dominant companies and makes
their retaliations more expensive, as predicted by
the Judo Economics of Gelman and Salop (1983).
This strategy, therefore, represents a source of
leverage for the small banks that is based on the
commitments and strategic investments of their
stronger rivals, which are used against themselves
(Yoffie and Cusumano, 1999).Finally, it seems that small entities have also put
into practice a judo strategy using other leverage
sources that cause dominant companies to hesitate
before responding to attacks from small compa-
nies. Among these leverage sources, which allow
the use of an opponent’s own strength and weight
against itself, are cooperation with other compa-
nies that have been threatened by the success of
the opponents (Yoffie and Cusumano, 1999). Thus,
savings banks have developed many collaboration
agreements that have allowed them to join with
various entities with the object of achieving a jointsize which gives access to banking and banking-
related activities that would otherwise be impossi-
ble. This type of agreement has grouped geograph-
ically disperse entities and has been instrumented
through the creation of shared companies (Gual
and Vives, 1991).
In summary, the results obtained allow us to
characterize the size-defined strategic groups of
Spanish banking system as having a Stackelberg
‘leader – follower’ type of asymmetrical competi-
tive interaction, following the classification of Put-
sis and Dhar (1998).
Copyright 2005 John Wiley & Sons, Ltd. Strat. Mgmt. J., 26: 713–745 (2005)

8/14/2019 Asymmetric Rivalry Between Strategic Group
http://slidepdf.com/reader/full/asymmetric-rivalry-between-strategic-group 24/33
736 F. J. M´ as-Ruiz, J. L. Nicolau-Gonz´ albez and F. Ruiz-Moreno
Test of Hypothesis 2 of asymmetric rivalry
between strategic groups in terms of speed of
response
This section examines asymmetric behavior
between strategic groups in the Spanish deposit
market in terms of speed of competitive responses
of the financial entities of the sample. Table 6
classifies measurement of average speed of
response of the companies of one group to the
actions of competitor groups and distinguishes the
groups by size.
An ANOVA11 (F = 5.045; prob. = 0.035)
allows us to infer the existence of significant differ-
ences in response speed at a level below 5 percent
between strategic groups G.I and G.II. In otherwords, entities of G.II responded more slowly
(259.1 days) to actions from G.I than the enti-
ties of G.I (224.6 days) to actions from G.II. This
supports Hypothesis 2 that groups of smaller com-
panies show a slower speed of response to the
competitive actions of groups of larger companies
than vice versa.
On the other hand, an ANOVA (F = 1.265;
prob. = 0.304) shows that the speed of response
does not differ significantly between groups II
and III, leading to a rejection of Hypothesis 2
in this situation. In any case, Table 6 shows thatthe response speed of G.III (209.7 days) to G.II
actions is slower than that of G.II (182.2 days)
to G.III actions, although it is not significant.
This implies that there is a certain tendency for
small company groups to have a slower speed
of response to the competitive actions of large
company groups than vice versa.
Finally, an ANOVA (F = 0.084; prob. = 0.776)
does not detect significant differences in response
11 Mann–Whitney tests were also conducted, and the results were
identical. The ANOVA and Mann–Whitney test are calculatedwith the residuals of the regressions (following the proceduredetailed in the section ‘Sample, data, and variables’), whereasthe data in Tables 4 and 6 are shown in number of days as it ismore intuitive.
speeds between G.I and G.III, which rejects Hypo-
thesis 2 in this situation. The actions of G.I are
replicated more slowly by G.III (290.1 days) thanthose of G.III by G.I (212.5 days), although this
is not significant. This result also reflects a cer-
tain tendency for small company groups to have a
slower speed of response to the competitive actions
of large company groups than vice versa.
This lack of significance of the differences in
response speeds between groups G.I and G.III
and between G.II and G.III can be explained, fol-
lowing Smith et al. (1991), by the fact that the
relationship between slack resources and response
speed is affected by absorbed and unabsorbed slack
resources, as well as by the use given to absorbedresources (factors on which we have no informa-
tion). In reality, with regard to absorbed and unab-
sorbed slack, we would only expect slow response
from companies with a high level of absorbed slack
as they have few extra resources with which to
make a quick response. With regard to the factor of
‘use given to absorbed resources,’ firms may invest
some absorbed slack in mechanisms that help them
respond quickly by helping them obtain more and
richer information.
In summary, the results obtained could indicate
that asymmetric competitive interaction between
strategic groups in the Spanish banking depositmarket in terms of speed of response is only
characteristic of G.I and G.II in the following
way: an attack by the large entities (G.I) on the
key local and/or regional markets of the medium-
size entities (G.II) generates a decisive response
which, however, is slower than vice versa, for fear
of precipitating escalation retaliation (Chen and
MacMillan, 1992; Chen et al., 1992).
Test of Hypothesis 3 of interaction between ex
ante and ex post asymmetric rivalry between
strategic groups
This section examines the interaction betweenex ante and ex post asymmetric rivalry between
Table 6. Measurement of asymmetric rivalry between strategic groups in terms of speed of response
Actions taken by the Average speed of response from the companies
companiesG.I Large entities G.II Medium entities G.III Small entities
G.I Large entities 216.6 (161.9) 259.1 (195.8) 290.1 (161.9)G.II Medium entities 224.6 (77.2) 210.3 (183.7) 209.7 (221.4)G.III Small entities 212.5 (177.3) 182.2 (164.5) 157.6 (74.8)
Copyright 2005 John Wiley & Sons, Ltd. Strat. Mgmt. J., 26: 713–745 (2005)

8/14/2019 Asymmetric Rivalry Between Strategic Group
http://slidepdf.com/reader/full/asymmetric-rivalry-between-strategic-group 25/33
Asymmetric Rivalry between Strategic Groups 737
strategic groups. We analyze asymmetric competi-
tive ex ante expectations between strategic groups
in the Spanish deposit market in 1994 throughthe estimation for maximum likelihood of two
systems, semi-logarithmic (1) and logarithmic (2),
with three behavioral equations relative to the
strategic groups and with respect to size. We con-
sider reasonable the use of the exogenous estima-
tion realized by Coello (1994) of the price elastic-
ity of the aggregate demand function for deposits
of ε = 0.01 for the 8-year period (1985– 93) imme-
diately before 1994. Table 7 shows the estima-
tion of the parameters of the semi-logarithmic
and logarithmic specifications of the system. By
using the Akaike Information Criterion, the firstis selected for later analysis (AIC = 353.1, for the
semi-logarithmic; and AIC = 365.1, for the loga-
rithmic), given its greater parsimony.
Starting with conjectures of the benchmark enti-
ties, we can evaluate the pattern of interdepen-
dency between them in the Spanish deposit mar-
ket. The benchmark entities in each group, on
which the conjectures are specified, include the
entity of the greatest size in each group (observa-
tions 1, 7, and 34) and the smallest in the sample
(observation 146), which represent 9.45 percent,
2.38 percent, 0.65 percent, and 0.00006 percent of
total deposits respectively. To be precise, the sys-
tem used shows the significance of the coefficients
of rivalry between groups I and II. The quantita-
tive level of the parameters β and γ determines
the expected aggressiveness of each entity, and
the later realization of statistical tests (test of the
ratio of likelihood) allows us to demonstrate the
existence of strategic differences (ex ante) between
strategic groups.
The results obtained from comparing the agents
of the two different groups show that the conjec-
tural variation (−0.00025) that entities of large
size (G.I) have over the medium-sized (G.II) isless than conjectural variation (−0.00004) that the
medium-sized (G.II) have over the large-sized enti-
ties (G.I). This behavior can be collated with the
test H0: β1,II = β7,I, which is rejected (χ 20.01(2) =
56.9; p = 0.000), suggesting that there is an inter-
group strategic difference. In other words, the
benchmark entity 1 in the largest size class (G.I)
anticipates that aggregate output from all other
firms in the medium-size class (G.II) will fall
(−0.00025), largely in response to a planned
increase in the output of company 1 rather than
the fall in the output (−0.00004) of the large-size
class (G.I) anticipated by the benchmark company
7 in GII from an increase in the output of company
7. We show, therefore, that the large-size strategicgroup G.I has a more aggressive attitude (ex ante)
towards the medium-size group G.II than G.II has
towards G.I.
When we compare this result of ex ante expec-
tations of G.I aggressiveness in terms of deposit
quantities (output) with that of the previous section,
of greater ex post reaction of the small-size groups
to G.I actions than vice versa, we accept Hypoth-
esis 3. In other words, the expectations of aggres-
siveness in output quantity by the large-size group
characterize the greater ex post reactions of the
smaller-size groups to the actions of the large-size group than vice versa, in line with Reger and
Huff (1993). Consequently, there would seem to
be interaction between ex ante expectations and
ex post behavior in the area of asymmetric rivalry
between size-defined strategic groups.
In summary, these results could indicate that
interaction between expectations and ex post be-
havior in the Spanish banking deposit market is
manifested in the following way: decisions on
output quantity are important because the cap-
ture of funds is made through competition around
branches in the first half of the 1990s—competi-
tion which generates ex ante expectations of a
more aggressive attitude on the part of the large
entities due to the impulse they give to their
expansion policy and the subsequent defensive
movements of the smaller entities in their local
and/or regional markets (Gual and Vives, 1991).
These expectations lead to smaller entities giving
great importance to any strategic or tactical action
by large entities which affects their local/regional
markets and they, therefore, make greater ex post
responses than vice versa (Reger and Huff, 1993).
As far as the parameters of quality of service
are concerned, both of them are significant. α1 ispositive, as in Coello (1994), which suggests that
the depositors are bearing in mind the network
of offices of entities when investing their funds
in the deposit market; so they tend to minimize
the costs of displacement incurred when they have
to recover their funds. To sum up, we stress the
idea that increases in the ratio offices/km2 suppose
increments in the quality of service, and the entity
can reduce the interest rate it pays on its deposits.
However, the intercept α0 is negative, representing
the elements that lower the quality of service of the
depositors due to unobservable characteristics.
Copyright 2005 John Wiley & Sons, Ltd. Strat. Mgmt. J., 26: 713–745 (2005)

8/14/2019 Asymmetric Rivalry Between Strategic Group
http://slidepdf.com/reader/full/asymmetric-rivalry-between-strategic-group 26/33
738 F. J. M´ as-Ruiz, J. L. Nicolau-Gonz´ albez and F. Ruiz-Moreno
T a b l e 7 . E s t i m a t i o n o f c o n j e c t u r a l v a r
i a t i o n s ( e x
a n t e
e x p e c t a t i o n s ) i n t h e s y s t e m o f e q u a t i o n s o f b e h a v i o r . ( s t a n d a r d
e r r o r s i n p a r e n t h e s e s )
S e m i - l o g a r i t h
m i c s p e c i fi c a t i o n
L o g a r i t h m i c s p e c i fi c a t i o n
C o n j e c t u r a l
v a r i a t i o n s
w i t h i n g r o u p
A s y m m e t r i c
c o n j e c t u r a l
v
a r i a t i o n s
b e t w
e e n g r o u p s
S e r v i c e
q u a l i t y
C o n j e c t u r a l
v a r i a t i o n s
w i t h i n g r o u p
A s y m m e t r i c
c o n j e c t u r a l
v a r i a t i o n s
b e t w e e n g r o u p s
S e r v i c e
q u a l i t y
β 1 , I
0 . 0 0 0 2 3 ∗
( 0 . 1 E - 7 )
β 1 , I I
− 0 . 0 0 0 2 5 ∗
( 0 . 1 E - 7 )
α 0
− 0 . 0 0 3 ∗
( 0 . 1 E - 5 )
γ 1 , I
1 . 0 9 2 ∗
( 0 . 1 E - 6 )
γ 1 , I I
− 1 . 2 7 3 ∗
( 0 . 1 E - 6 )
α 0
− 0 . 0 7 0 ∗ ( 0 . 5 E - 8 )
β 7 , I I
− 0 . 0 0 0 0 9 ∗
( 0 . 2 E - 8 )
β 7 , I
− 0 . 0 0 0 0 4 ∗
( 0 . 6 E - 9 )
α 1
0 . 0 8 4 ∗
( 0 . 1 E
- 4 )
γ 7 , I I
− 0 . 1 4 9 ∗
( 0 . 1 E - 7 )
γ 7 , I
− 0 . 0 4 9 ∗
( 0 . 1 E - 7 )
α 1
2 . 5 3 8 ∗
( 0 . 1 E - 5 )
L o g - l i k e l i h o o d f u n c t i o n =
− 1 5 8 . 5 9
L o g - l i k e l i h o o d f u n c t i o n =
− 1 6 4
. 5 9
α 0 =
i n t e r c e p t ; α 1 =
p a r a m e t e r o f o f fi c e / k m 2 .
E s t i m a t i o n o f t h e c o e f fi c i e n t s o f G . I I I i s n o t p o s s i b l e b e c a u s e o f s i n g u l a r i t y p r o b l e m s .
∗ P r o b . <
0 . 0 1
Copyright 2005 John Wiley & Sons, Ltd. Strat. Mgmt. J., 26: 713–745 (2005)

8/14/2019 Asymmetric Rivalry Between Strategic Group
http://slidepdf.com/reader/full/asymmetric-rivalry-between-strategic-group 27/33
Asymmetric Rivalry between Strategic Groups 739
CONCLUSIONS
The implication that between-strategic group com-
petition in an industry can be structured system-
atically and predictably in terms of asymmetry
in responses, speed of response, and ex ante vs.
ex post competitive interaction has permitted an
analysis of this phenomenon in the Spanish bank
deposit market of 1994.
The hypotheses of asymmetric rivalry in the
sense that strategic groups of small companies
have a greater degree of response but a slower
speed of response to groups of large companies
than vice versa are tested through an ex post
approach that examines the news releases pub-
lished on the strategic actions and reactions of
firms. The last hypothesis of interaction between
ex ante and ex post asymmetric rivalry between
groups is tested by comparing ex post news arti-
cles on actions/reactions with an ex ante approach
that estimates conjectural variations.
The empirical application showed that there is
asymmetric rivalry between size-defined strategic
groups. In summary, smaller bank groups have
greater but slower responses (competitive interac-
tion of the ‘leader–follower’ type of Stackelberg)
to the competitive actions of larger bank groupsthan vice versa. Likewise, the ex ante expectations
of large-size group aggressiveness are linked with
greater ex post reactions on the part of the smaller-
size groups.
The implications to company management of
these results of asymmetric competition between
strategic groups are as follows.
First, and expanding the proposal of Chen
(1996), managers should analyze their competitive
environment from the point of view of each
competitor group. A given group of competitors
could appear to be insignificant from the point of view of a particular group, but the group itself
could consider the other group to be its most
important competitor and, therefore, its primary
target of attack and counter-attack. In this way,
the most important challenge for strategists would
be to create a competitive asymmetry and use it to
obtain advantage for their company (Chen, 1996).
Second, the findings should ultimately be valu-
able to practicing strategies. Following Chen et al.
(1992), a key question for an initiator is whether an
action can be designed so as to avoid the increase
in the number of responses and/or delay responses.
The attributes of size-defined groups may provide
a useful frame of reference.
Third, with the object of evaluating the impactor effectiveness of a strategy change, managers
should know the ultimate effect of any compet-
itive action (Leeflang and Wittink, 1992), which
would imply a consideration of a rival’s proba-
ble response in terms of its size (Chen and Ham-
brick, 1995). Once the type of asymmetric compet-
itive interaction occurring in an industry is known
(‘leader–follower’ or ‘dominant–fringe’), models
can be applied to find the optimal strategic behav-
ior and the optimal company reactions given the
rival’s most probable response (Putsis and Dhar,
1998).As limitations of the study, we should point
out, first, that although the analysis of news con-
tent allows a more complete panorama of Span-
ish banking as it covers all the groups in our
study, it could be affected by the quantity of news
items published on financial entities in the printed
press—a quantity that falls as company size falls.
Second, estimation of the parameters of the model
of oligopolistic competition is restricted, in our
case, to the first two groups, given the problems
of singularity that prevented the estimation of the
coefficients corresponding to G.III. Third, we do
not consider the strategic importance of different
markets to the industry’s companies, which would
influence rivalry through motivation (Bergen and
Peteraf, 2002); nor do we consider the growth
rates of the markets, which define their attrac-
tiveness and affect rivalry (Porter, 1979, 1980);
nor a possible Spanish market segmentation into
geographical zones, in line with Gual (1993). How-
ever, according to Coello (1994), the existence of
national banks, competing throughout the national
territory with no difference in interest rates accord-
ing to geographical zone, is what provokes the
transmission of indirect competition between enti-ties operating in different regions, thus eliminating
the need for market segmentation. In any case, this
study constitutes an additional contribution to the
study of asymmetric rivalry in the field of strategic
groups.
Finally, among future research directions are,
first, the characterization of multi-market compe-
tition (Gimeno and Woo, 1996, 1999; Gimeno,
1999) through the patterns of asymmetric inter-
action in terms of size; second, the inclusion in
the modelization (which explains ex ante asym-
metric rivalry between groups) of interdependence
Copyright 2005 John Wiley & Sons, Ltd. Strat. Mgmt. J., 26: 713–745 (2005)

8/14/2019 Asymmetric Rivalry Between Strategic Group
http://slidepdf.com/reader/full/asymmetric-rivalry-between-strategic-group 28/33
740 F. J. M´ as-Ruiz, J. L. Nicolau-Gonz´ albez and F. Ruiz-Moreno
among the groups, their number and relative size
and strategic distance (Porter, 1980); and third,
the distinction of asymmetric competitive interac-tion according to different instruments or strate-
gies such as marketing (Putsis and Dhar, 1998).
Finally, in line with Chen (1996), it would be use-
ful for researchers to carry out longitudinal studies
of behavior to develop a deeper understanding of
asymmetric competition over time.
REFERENCES
Aldrich H, Auster E. 1986. Even dwarfs started small:
liabilities of size and age and their strategicimplications. In Research in Organizational Behavior ,Vol. 8, Straw B, Cummings L (eds). JAI Press:Greenwich, CT; 165–198.
Alexander DL. 1988. The oligopoly solution tested. Economic Letters 28: 361–364.
Amit R, Domowitz I, Fershtman C. 1988. Thinking onestep ahead: the use of conjectures in competitor anal-ysis. Strategic Management Journal 9(5): 431–432.
Bain J. 1956. Barriers to New Competition. HarvardUniversity Press: Cambridge, MA.
Barney JB. 1991. Firm resources and sustained competi-tive advantage. Journal of Management 17: 99 –120.
Barney JB, Hoskisson RE. 1990. Strategic groups:untested assertions and research proposals. Manage-
rial and Decision Economics 11: 187–198.Baum J, Korn H. 1996. Competitive dynamics of
interfirm rivalry. Academy of Management Journal 39:255–291.
Baumol W. 1967. Business Behavior, Value and Growth ,Harcout Brace & World: New York.
Berg SA, Kim M. 1994. Oligopolistic interdependenceand the structure of production in banking: anempirical evaluation. Journal of Money, Credit, and
Banking 26(2): 309–322.Bergen M, Peteraf M. 2002. Competitor identification
and competitor analysis: a broad-based managerialapproach. Managerial and Decision Economics 23:157–169.
Boeker W. 1991. Organizational strategy: an ecological
perspective. Academy of Management Journal 34(3):613–635.
Bogner W, Thomas H. 1994. Core competence andcompetitive advantage: a model and illustrativeevidence from the pharmaceutical industry. InCompetence-Based Competition , Hamel G, Heene A(eds). Wiley: Chichester; 111– 144.
Bowley AL. 1924. The Mathematical Groundwork of Economics. Clarendon Press: Oxford.
Bresnahan TF. 1982. The oligopoly solution concept isidentified. Economic Letters 10: 361–364.
Burke L. 1990. Geographic scope strategy, marketstructure and interfirm rivalry: strategic groups inCalifornia banking, 1978– 1985. Dissertation thesis,University of California, Berkeley.
Carbo S, Lopez R, Rodrıguez, F. 2003. Medicion dela competencia en mercados bancarios regionales.
Revista de Econom ıa Aplicada 32(XI): 5 –33.Carroll GR, Swaminathan A. 1992. The organizational
ecology of strategic groups in the American brewingindustry from 1975 to 1990. Industrial and CorporateChange 1: 65–97.
Caves RE. 1984. Economic analysis and the quest forcompetitive advantage. In Papers and Proceedings of the 96th Annual Meeting of the American Economic
Association, May; 127–132.Caves RE, Porter M. 1977. From entry barriers to
mobility barriers. Quarterly Journal of Economics91(2): 421–441.
Caves R, Pugel T. 1980. Intra-industry differences inconduct and performance: viable strategies in U.S.manufacturing industries. Working paper, New York
University.Cespedes J. 1996. Strategic groups en la banca privada
espanola. Informaci´ on Comercial Espa˜ nola 753:106–124.
Chen MJ. 1996. Competitor analysis and interfirmrivalry: toward a theoretical integration. Academy of
Management Review 21(1): 100–134.Chen MJ, Hambrick DC. 1995. Speed, stealth, and
selective attack: how small firms differ fromlarge firms in competitive behavior. Academy of
Management Journal 38(2): 453–482.Chen M, MacMillan I. 1992. Non response and delayed
response to competitive moves: the roles of competitordependence and action irreversibility. Academy of
Management Journal 35(3): 539–570.
Chen M, Smith KG, Grimm CM. 1992. Action charac-teristics as predictors of competitive responses. Man-agement Science 38(3): 439–455.
Coello J. 1994. Son las cajas y los bancos estrategica-mente equivalentes? Investigaciones Econ´ omicas18(2): 313–332.
Cool K, Dierickx I. 1993. Rivalry, strategic groupsand firm profitability. Strategic Management Journal14(1): 47–59.
Cool K, Schendel D. 1987. Strategic group formationand performance: the case of the U.S. pharmaceuticalindustry, 1963– 1982. Management Science 33(9):1–23.
Corsi TM, Grimm CM. 1989. Strategies and performancein the truckload general freight segment before
and after deregulation. Journal of the Transportation Research Forum 30(1): 92–97.
Corsi T, Grimm C, Smith K, Smith R. 1991. Deregula-tion, strategic change, and firm performance amongLTL motor carriers. Transportation Journal Fall:4–13.
Cortes M, Berry A, Ishaq A. 1987. Success in Smalland Medium-Scale Enterprises: The Evidence fromColombia. Oxford University Press: New York.
Demsetz H. 1973. Industry structure, market rivalry, andpublic policy. Journal of Law and Economics 16:1–10.
Dooley R, Fowler D, Miller A. 1996. The benefits of strategic homogeneity and strategic heterogeneity:theoretical and empirical evidence resolving past
Copyright 2005 John Wiley & Sons, Ltd. Strat. Mgmt. J., 26: 713–745 (2005)

8/14/2019 Asymmetric Rivalry Between Strategic Group
http://slidepdf.com/reader/full/asymmetric-rivalry-between-strategic-group 29/33
Asymmetric Rivalry between Strategic Groups 741
differences. Strategic Management Journal 17(3):293–305.
Dranove D, Peteraf M, Shanley M. 1998. Do strategicgroups exist? An economic framework for analysis.Strategic Management Journal 19(11): 1029–1044.
Duysters G, Hagedoorn J. 1995. Strategic groups andinter-firm networks in international high-tech indus-tries. Journal of Management Studies 32(3): 359–381.
Easton G. 1988. Competition and marketing strategy. European Journal of Marketing 22(2): 31 –69.
Espitia M, Polo Y, Salas V. 1991a. Estructura de losmercados geograficos: comportamiento y resultadosde las cajas de ahorros en Espana. Investigaciones
Econ´ omicas 15(3): 671–700.Espitia M, Polo Y, Salas V. 1991b. Strategic groups y
resultados en el sector bancario espanol. Informaci´ onComercial Espa˜ nola 690: 189–212.
Espitia M, Santamarıa R. 1994. Estrategia competitivay resultados de las cajas de ahorros en Espana.
EKONOMIAZ 28: 100–115.Farrell J, Klemperer P. 2001. Coordination and lock-in:
competition with switching costs and network effects.Working paper, Department of Economics, Universityof California, Berkeley.
Farrell J, Shapiro C. 1987. Dynamic competition withlock-in. Working paper 8727, Department of Eco-nomics, University of California, Berkeley.
Fiegenbaum A, Hart S, Schendel D. 1996. Strategicreference point theory. Strategic Management Journal17(3): 219–235.
Fiegenbaum A, Thomas H. 1995. Strategic groups asreference groups: theory, modelling and empirical
examination of industry and competitive strategy.Strategic Management Journal 16(6): 461–476.
Freixas X. 1996. Los l´ ımites de la competencia en labanca espa˜ nola. Fundacion BBV: Bilbao.
Fudenberg D, Tirole J. 1984. The fat cat effect, thepuppy dog ploy and the lean and hungry look.
American Economic Review, Papers and Proceedings74: 361–368.
Galbraith Jr. 1977. Organization Design . Addison-Wesley: Reading, MA.
Garcıa N, Polo Y, Urquizu P. 1998. Diferencias en lasvariables explicativas de los resultados obtenidospor los bancos y las cajas de ahorros espanolas.Perspectivas del Sistema Financiero 63–64: 103–116.
Gelman JR, Salop SC. 1983. Judo economics: capacity
limitation and coupon competition. Bell Journal of Economics, Autumn: 315–325.
Gimeno J. 1999. Reciprocal threats in multimarketrivalry: staking out ‘spheres of influence’ in the U.S.airline industry. Strategic Management Journal 20(2):101–128.
Gimeno J, Woo CY. 1996. Hypercompetition in amultimarket environment: the role of strategicsimilarity and multimarket contact on competitive de-escalation. Organization Science 7: 322–341.
Gimeno J, Woo CY. 1999. Multimarket contact, econo-mies of scope, and firm performance. Academy of
Management Journal 42: 239–259.Glemet F, Mira R. 1993. The brand leader’s dilemma.
McKinsey Quarterly, Summer: 3 –16.
Gollop F, Roberts M. 1979. Firm interdependence inoligopolistic markets. Journal of Econometrics 10:
313–331.Gripsrud G, Gronhaug K. 1985. Structure and strategy in
grocery retailing: a sociometric approach. Journal of Industrial Economics 33: 339–347.
Gual J. 1992. La Competencia en el Sector Bancario Espa˜ nol . Fundacion BBV: Bilbao.
Gual J. 1993. La competencia en el mercado espanol dedepositos bancarios. Moneda y Cr ´ edito 196: 143–179.
Gual J, Ricart JE. 1990. Poder de mercado en la captacionde depositos a plazo del sector bancario espanol. InConcentraci´ on Empresarial y Competitividad: Espa˜ naen la CEE . Ariel: Barcelona.
Gual J, Vives X. 1991. Ensayos Sobre el Sector Bancario Espa˜ nol . FEDEA: Madrid.
Hamel G, Prahalad C. 1990. Strategic intent. McKinsey
Quarterly, Spring: 36 –61.Hannan M, Freeman J. 1989. Organizational Ecology .
Harvard University Press: Cambridge, MA.Hatten KJ, Hatten ML. 1987. Strategic groups, asym-
metrical mobility barriers and contestability. Strategic Management Journal 8(4): 329–342.
Hunt M. 1972. Competition in the major home applianceindustry, 1960– 1970. PhD dissertation, HarvardUniversity.
Jacobson R. 1992. The Austrian school of strategy. Academy of Management Review 17: 782–807.
Kwoka JE, Ravenscraft DJ. 1986. Cooperation vs.rivalry: price– cost margins by line of business.
Economica 53: 351–363.Lahti A. 1983. Strategy and Performance of a Firm: An
Empirical Investigation in the Knitwear Industry inFinland in 1969–81 . Helsinki School of Economics:Helsinki.
Lant T, Baum J. 1995. Cognitive sources of sociallyconstructed competitive groups. In The InstitutionalConstruction of Organizations , Scott R, Christensen S(eds). Sage: London; 15–38.
Lau L. 1982. On identifying the degree of competitive-ness from industry price and output data. Economic
Letters 10: 93–99.Leeflang P, Wittink D. 1992. Diagnosing competitive
reactions using (aggregated) scanner data. Interna-tional Journal of Research in Marketing 9: 39–57.
Little I, Mazumdar D, Page J. 1987. Small Manufac-turing Enterprises: A Comparative Analysis of India
and Other Economies . Oxford University Press: NewYork.
Lorences J. 1991. Grado de monopolio y monopsoniode la banca espanola: un avance de resultados.Documento de Trabajo 9107, Fundacion EmpresaPublica.
MacMillan I. 1980. How business strategists can useguerrilla warfare tactics. Journal of Business Strategy1(3): 63–65.
Manas L. 1992. El sector financiero espanol ante suintegracion en el mercado unico. In La Econom´ ıa
Espa˜ nola ante el Mercado Unico Europeo, Vinals J(ed.). Alianza Economıa: Madrid; 463–548.
March JG. 1981. Decision in organizations and theoriesof choice. In Perspectives on Organization Design and
Copyright 2005 John Wiley & Sons, Ltd. Strat. Mgmt. J., 26: 713–745 (2005)
8/14/2019 Asymmetric Rivalry Between Strategic Group
http://slidepdf.com/reader/full/asymmetric-rivalry-between-strategic-group 30/33
742 F. J. M´ as-Ruiz, J. L. Nicolau-Gonz´ albez and F. Ruiz-Moreno
Behavior , Van de Ven A, Joyce W (eds). Wiley: NewYork; 200–225.
Mason E. 1939. Price and production policies of large-scale enterprises. American Economic Review 29:61–74.
Maudos J, Pastor JM, Perez F. 2002. Competition andefficiency in the Spanish banking sector: theimportance of specialization. Applied Financial
Economics 12: 505–516.Maudos J, Pastor JM. 2003. Cost and profit efficiency
in the Spanish banking sector (1985–1996): a non-parametric approach. Applied Financial Economics13: 1–12.
McGee J, Thomas H. 1992. Strategic groups andintra-industry competition. In International Reviewof Strategic Management , Hussey D (ed). Wiley:Chichester; 77–98.
Meyer A. 1982. Adapting to environmental jolts. Administrative Science Quarterly 27: 515–537.
Miller D, Chen MJ. 1994. Sources and consequences of competitive inertia: a study of the U.S. airline industry.
Administrative Science Quarterly 39: 1–23.Moore RR. 1998. Concentration, technology, and market
power in banking: is distance dead? Financial IndustryStudies, Federal Reserve Bank of Dallas, December:1–24.
Newman HH. 1978. Strategic groups and the structureperformance relationship. Review of Economics and Statistics 60: 376–383.
Nohria N, Garcıa-Pont C. 1991. Global strategic linkagesand industry structure. Strategic Management Journal ,
Summer Special Issue 12: 105–124.Pastor JM. 1995. Eficiencia, cambio productivo y cambiotecnico en los bancos y cajas de ahorro espanolas:un analisis de la frontera no parametrico. Revista
Espa˜ nola de Econom´ ıa 12(1): 35– 73.Perez F, Maudos J, Pastor JM. 1998. Sector Bancario
Espa˜ nol (1985–1997). Cambio Estructural y Compe-tencia, Caja de Ahorros del Mediterraneo: Alicante.
Peteraf M. 1993. Intra-industry structure and the responsetoward rivals. Managerial and Decision Economics14: 519–528.
Peteraf M, Shanley M. 1997. Getting to know you:a theory of strategic group identity. Strategic
Management Journal, Summer Special Issue 18:165–186.
Pillof S. 1999. Multimarket contact in banking. Reviewof Industrial Organization 14: 163–182.
Pita P. 1999. Multimarket competition in banking, withan example from the Portuguese market. International
Journal of Industrial Organization 17: 335–352.Porac JF, Thomas H. 1994. Cognitive categorization and
subjective rivalry among retailers in a small city. Journal of Applied Psychology 79: 54–66.
Porac JF, Thomas H, Wilson F, Paton D, Kanfer A.1995. Rivalry and the industry model of Scottishknitwear producers. Administrative Science Quarterly40: 203–227.
Porter M. 1974. Consumer behavior, retailer power, andmarket performance in consumer goods industries.
Review of Economics and Statistics 56: 419–436.
Porter M. 1976. Interbrand Choice, Strategy, and Bilateral Market Power , Harvard University Press:
Cambridge, MA.Porter M. 1979. The structure within industries and
companies’ performance. Review of Economics and Statistics 61: 214–227.
Porter M. 1980. Competitive Strategy: Techniques for Analyzing Industries and Competitors. Free Press:New York.
Porter M. 1985. Competitive Advantage: Creating and Sustaining Superior Performance. Free Press: NewYork.
Primeaux WJ Jr. 1985. A method for determiningstrategic groups and life cycle stages of an industry.In Strategic Marketing and Management , Thomas H,Gardner DM (eds). Wiley: Chichester; 315–327.
Primeaux WJ Jr. 1987. The interdependence of the
life cycle and strategic group concepts: theoryand evidence. Advances in Financial Planning and Forecasting 2: 67–85.
Putsis W, Dhar R. 1998. The many faces of competition. Marketing Letters 9(3): 269–284.
Raju JS, Roy A. 1997. Understanding competitiverelationships. In Wharton on Dynamic CompetitiveStrategy , Day GS, Reibstein DJ (eds). Wiley: NewYork; 220–233.
Reger R, Huff A. 1993. Strategic groups: a cognitiveperspective. Strategic Management Journal 14(2):103–124.
Sastre MT 1991. La determinacion de los tipos de interesactivos y pasivos de bancos y cajas de ahorro. Estudios
Econ´ omicos 45, Banco de Espana.Scherer FM, Ross D. 1990. Industrial Market Struc-ture and Economic Performance. Houghton-Mifflin:Boston, MA.
Schumpeter JA. 1950. Capitalism, Socialism and Democ-racy. Harper: New York.
Shaffer S. 1989. Competition in the U.S. bankingindustry. Economic Letters 29: 321–323.
Shaffer S. 1993. A test of competition in Canadianbanking. Journal of Money, Credit, and Banking 25(1):49–61.
Shaffer S, DiSalvo J. 1994. Conduct in a bankingduopoly. Journal of Banking and Finance 18:1063–1082.
Smith KG, Grimm CM. 1987. Environmental variation,
strategic change and firm performance: a study of railroad deregulation. Strategic Management Journal8(4): 363–376.
Smith KG, Grimm CM, Gannon MJ, Chen M. 1991.Organizational information processing, competitiveresponses, and performance in the U.S. domesticairline industry. Academy of Management Journal34(1): 60–85.
Smith KG, Grimm CM, Gannon MJ. 1992. Dynamics of Competitive Strategy . Sage: Newbury Park, CA.
Smith KG, Grimm CM, Wally S. 1997. Strategic groupsand rivalrous firm behavior: towards a reconciliation.Strategic Management Journal 18(2): 149–157.
Spiller PT, Favaro E. 1984. The effects of entryregulation on oligopolistic interaction: the Uruguayan
Copyright 2005 John Wiley & Sons, Ltd. Strat. Mgmt. J., 26: 713–745 (2005)

8/14/2019 Asymmetric Rivalry Between Strategic Group
http://slidepdf.com/reader/full/asymmetric-rivalry-between-strategic-group 31/33
Asymmetric Rivalry between Strategic Groups 743
banking sector. Rand Journal of Economics 15(2):244–254.
Thomas H, Venkatraman N. 1988. Research on strategicgroups: progress and prognosis. Journal of Manage-ment Studies 25: 527–555.
Tversky A. 1977. Features of similarity. Psychological Review 84: 327–352.
Vachani S. 1990. Strategic responses of multinationalsto competition from developing-country cottage firms.
International Marketing Review 7(3): 31–47.Wright P. 1979. On a Clear Day You Can See General
Motors. Avon: New York.Yoffie DB, Cusumano MA. 1999. Judo strategy: the
competitive dynamics of Internet time. Harvard Business Review 77(1): 70–81.
Zajac E, Shortell S. 1989. Changing generic strategies:likelihood, direction, and performance implications.
Strategic Management Journal 10(5): 413–430.
APPENDIX
To be precise, the proposed model considers the
deposit market to be made up of n banking entities
which produce a homogeneous output, and is faced
with an inverse demand function for deposits:
P = D(Y) = D
j
yj
, j = 1, . . . , n
with D(Y) > 0; where P is the price, Y the market
output (volume of deposits), and yj the output of
entity j . Along the lines of Coello (1994), the
function D(Y) represents the cost of opportunity
of the deposits or the returns that the depositor can
obtain in an alternative market of equal liquidity
and risk (a secure financial asset market (national
debt)).
In addition, certain output differentiation
between the entities is quantified in monetary terms
through the variable vj , which is the quality of
service and which brings together the individual
characteristics of the entities, and represents theimplicit interest rate obtained by the depositor
when choosing entity j . Given a volume of
deposits yj offered by an entity j , its cost will
be rdj = (D(Y) − vj ), where rdj is the interest
rate of the deposits. This relationship reflects the
idea of substitutability between vj and rdj , because
when an entity j has a financial product of greater
quality, it can remunerate its deposits less as its
depositors obtain the additional benefit of quality
of service (Coello, 1994).
The profits of entity j are given by πj (yj ) =
P yj − cj yj = [R − rdj ]yj − cj yj ; j = 1, . . . , n,
where R is the income for each unit of deposit.
R consists of remuneration of obligatory reserves
(rr λ) and of the remuneration of the rest of the deposits in the inter-bank market (rb(1 − λ));
where rr is the remuneration fixed for bank-
ing reserves, λ is the coefficient of obligatory
reserves, and rb is the inter-bank interest rate.
Therefore, R = rr λ+ rb(1− λ), where rr , λ, and
rb are exogenous variables for the banking entity.
Likewise, quality of service vj is considered as
given and the entity only chooses the quantity
of deposits desired (the analysis is short term)
(Coello, 1994). Finally, with respect to operative
costs, it is assumed that the entities have constant
returns to scale, so that the average cost and themarginal cost coincide and are constant (cj ).
The first-order conditions for entity j can be
expressed as follows:
∂πj
∂yj
= P + yj
∂p
∂Y
1 +
i=j
∂yi
∂yj
− cj = 0;
j = 1, . . . , n (3)
Operating this we arrive at the following expres-
sion, which relates the operational margin of
the entity with variables of market structure andbehavior:
P − cj
D(Y)=
S j
ε
1+
i=j
∂yi
∂yj
; j = 1, . . . , n
where S j = (yj /Y ) is the market share of entity
j, cj is the operational marginal cost (∂Cj /∂yj ), ε
is the price elasticity of the aggregate function of
demand for deposits of the market (∂Y/∂D(Y))
(D(Y)/Y), and (∂yi /∂yj ) is the conjectural vari-
ation of entity j or expectations that it has about
the response of entity i to an initial change of out-put of entity j . It should be pointed out that if
the financial sector is in a perfectly competitive
situation, then limn→∞(yj /Y ) = 0, limn→∞(εj ) =
∞, and (∂yi /∂yj ) = 0, in which case the previ-
ous equation becomes the familiar condition of
equality between value of output price and its
marginal cost. If the sector were organized monop-
olistically, i.e., n = 1, then yj = Y , εj = ε, and
(∂yi /∂yj ) would be undefined. Therefore, only in
an oligopolistic financial sector are the first-order
conditions of each entity affected by conjectures
as to the competitors’ reactions.
Copyright 2005 John Wiley & Sons, Ltd. Strat. Mgmt. J., 26: 713–745 (2005)

8/14/2019 Asymmetric Rivalry Between Strategic Group
http://slidepdf.com/reader/full/asymmetric-rivalry-between-strategic-group 32/33
744 F. J. M´ as-Ruiz, J. L. Nicolau-Gonz´ albez and F. Ruiz-Moreno
If our objective was to test only for the existence
of oligopolistic interdependence, it would be suf-
ficient to estimate the aggregate output responseof the remaining n− 1 entities anticipated by
company j (∂(i=j yi )/∂yj ) (Gollop and Roberts,
1979). Alternatively, the proposal of our study is to
analyze the existing pattern of oligopolistic inter-
dependence. Therefore, it is especially important
to distinguish between the n− 1 conjectures of
entity j . However, estimation of the significant
number of conjectural variations (n− 1) which, in
the limit, any entity could have, would be affected
by the availability of degrees of freedom. To avoid
this, it is assumed that retaliations expected by
companies in an oligopolistic market depend on thesize of the rival (Spiller and Favaro, 1984). Conse-
quently, the conjectures of an entity concerning the
responses of competitors can be modeled in terms
of the position of the competitors in the size dis-
tribution. Therefore, the n entities can be ranked
by output size and, in accordance with Gollop and
Roberts (1979), formed into s mutually exclusive
groups with T s = u (u = 1, . . . , s ) entities in each
group—the number of companies (u) in each sub-
group need not be equal; and the number of groups
s and the members of each one are determined by
a size distribution of the companies in the selectedindustry.
One of the objectives of the work is to test
whether the conjectures of an entity vary across
the size classes of its rivals. However, it is not
intended to estimate differences in the expecta-
tions of a company based on pure size differentials
in the productive capacity of rivals.12 This means
that we isolate discrepancies in conjectures which,
although they are a function of size, are indepen-
dent of any differences which are purely technical
or of competitors’ physical capacity to respond.
This implies the following transformation of the
first-order conditions to express the conjectures in
relative terms:
P − cj
D(Y)=
S j
ε
1+
su=1
i∈u,i=j
yi
βju
;
j = 1, . . . , n
12 Differences in conjectures due to variations in the productivecapacity of rivals are found in a modelization of the conjecturesspecified as absolute responses: ∂( i∈u,i=j yi /∂yj ) (Gollop andRoberts, 1979).
where βju = ∂ ln(i∈u,i=j yi )/∂yj is defined as the
conjectural variation of entity j with respect to
relative response of the entities of size class u.Given that rdj = D(Y) − vj , the expression can be
rewritten as follows:
R − rdj − cj
rdj
=S j
ε
1+
su=1
i∈u,i=j
yi
βj u
×
1+
vj
rdj
; j = 1, . . . , n (4)
Likewise, the conjectures can be defined with the
conventional approach of elasticity, which requires
a transformation of the first-order conditions to thefollowing:
R − rdj − cj
rdj
=S j
ε
1+
su=1
i∈u,i=j
yi
yj
γ j u
×
1 +
vj
rdj
; j = 1, . . . , n (5)
where γ ju = ∂ ln(i∈u,i=j yi )/∂ ln yj .
In these formulations, the conjectural variations
of a determinate entity j could vary across the size
classes of its competitors, and the conjectures with
respect to a response of a given size class can alsovary across the n entities. However, the estimation
of these parameters would still be affected by
the availability of degrees of freedom. This can
be avoided by considering that all the companies
in a given size class have an identical vector
of conjectures across size classes (Gollop and
Roberts, 1979).
In any case, this scheme of working has the
undesirable property that two companies of nearly
equal size, but assigned to different size classes,
would have conjectures more like those of the
other members of their classes than those of eachother. In other words, unless the size distribution
of companies is unusually clustered around the
s sizes of the companies, the previous hypothe-
sis of homogeneity conflicts with the continuous
nature of the data. A possible solution to this prob-
lem is to adopt a less restrictive algorithm, which
entails choosing an arbitrary number r (1 r n)
of benchmark observations (companies) bt (t =
1, 2, . . . , r ) and expressing the equations of behav-
ior of the n companies in terms of the conjectures
of the neighboring benchmark companies (Gol-
lop and Roberts, 1979). A requirement of Gollop
Copyright 2005 John Wiley & Sons, Ltd. Strat. Mgmt. J., 26: 713–745 (2005)

8/14/2019 Asymmetric Rivalry Between Strategic Group
http://slidepdf.com/reader/full/asymmetric-rivalry-between-strategic-group 33/33
Asymmetric Rivalry between Strategic Groups 745
and Roberts (1979) is that the smallest and largest
entities are included as benchmark observations.
Moreover, r is limited in practice by the availabledegrees of freedom, in such a way that r increases
by one as the number of conjectural parameters
increases by the number of s size classes. There-
fore, the first-order conditions of entity j whose
size is found between those of benchmark bt andbt +1, are expressed as (1) and (2) (see ‘Methodol-
ogy’ section).
Copyright 2005 John Wiley & Sons, Ltd. Strat. Mgmt. J., 26: 713–745 (2005)