Asymmetric Information and Temporal Profitability in … and Cox.pdf · Asymmetric Information and...
26
Asymmetric Information and Temporal Profitability in the Long-Term Care Insurance Market Yanling Ge Larry A. Cox School of Business Administration The University of Mississippi P.O. Box 1848 University, MS 38677-1848 (662) 915-5475 FAX: (662) 915-7903 e-mail: [email protected] [email protected]
Transcript of Asymmetric Information and Temporal Profitability in … and Cox.pdf · Asymmetric Information and...

Asymmetric Information and Temporal Profitability in the Long-Term Care Insurance Market
Yanling Ge
Larry A. Cox
School of Business Administration The University of Mississippi
P.O. Box 1848 University, MS 38677-1848
(662) 915-5475 FAX: (662) 915-7903
e-mail: [email protected] [email protected]

1
Asymmetric Information and Temporal Profitability in the Long-Term Care Insurance Market
Introduction
Economists have long recognized that insurance buyers’ private knowledge of their risk
confounds predictions based on equilibrium models of complete markets with full information
(see, e.g., Pauly, 1968, 1974; Rothschild and Stiglitz, 1976). With asymmetric information and
adverse selection, the paradigm of perfect competition either fails to produce market equilibrium
or, if equilibrium is reached, it may not be efficient (Akerlof, 1970). Various market mechanisms
arise to counteract adverse selection and to improve efficiency (see, e.g., Akerlof, 1970; Spence,
1973; Stiglitz and Weiss, 1981; Harris and Holmstrom, 1982). In insurance markets, for example,
insurers offer menus of contracts with nonlinear pricing to induce self-selection by insurance
buyers so that unobservable risk information is voluntarily revealed through contract choice
(Rothschild and Stiglitz, 1976). In a dynamic setting, long-term contracts with ex post price
adjustment via experience rating also can induce buyers to reveal their true risk levels (Dionne,
1983; Dionne and Lasserre, 1985; Cooper and Hayes, 1987; Gal and Landsberger, 1988).
Cooper and Hayes (1987) specifically demonstrate that a menu of short-term contracts
coupled with experienced-rated, long-term contracts can effectively sort insurance buyers
according to their true risk. Insurers’ commitments to experience rating on long-term contracts
provide disincentives to high risks for misclassifying themselves by choosing long-term policies
and incentives to low risks for revealing themselves by selecting long-term policies. The Cooper-
Hayes model indicate that low risks will tend to choose experienced-rated, long-term contracts,
while high risks will choose short-term contracts without experience rating. A price highballing

2
pattern emerges that allows insurers to initially earn positive profits from their low-risk customers
followed by periods of lower prices and profits. In a related study by Dionne and Doherty (1994),
the authors also obtain such temporal pricing and profit outcome under more general assumptions
about the extent of firm commitment to long-term contracts.
Alternatively, Kunreuther and Pauly (1985) and Nilssen (2000) show that in the absence of
firm commitment, it becomes difficult to obtain a separating equilibrium using the contract menus
suggested by Cooper and Hayes. Allowing insurers to observe private information about their
existing customers’ risk characteristics, these studies show that the equilibrium outcome will be
characterized by full pooling initially. In subsequent periods, experience rating occurs, but with
price distortions because insurers’ private information makes it possible to lock in low risks and
thereby capture informational rents. Consequently, the models developed by Kunreuther and Pauly
(1985) and Nilssen (2000) imply a lowballing pricing pattern in which insurers initially incur
losses on their new businesss but are able to extract quasi-rents from existing policyholders in
future periods.
The contrasting predictions about the distribution of temporal pricing suggest that a direct
examination of policy performance over time can be promising for purposes of discriminating
between competing multi-period models of insurance pricing under adverse selection. Because
policy- level pricing data are not publicly available, researchers have focused on the profitability of
specific insurance lines with inconsistent results (D’Arcy and Doherty, 1990; Dionne and Doherty,
1994).
One problem with the previous empirical work is that the tested data are aggregated over
policies written on a wide range of risk classes based upon observable risk characteristics. More
valid empirical tests of adverse selection models can be devised using policy-specific experience

3
data on cohorts of policyholders with comparable, observable risk.1 In addition, estimation of
adverse selection in a multiperiod setting requires data with both time-series and cross-sectional
dimensions, i.e. panel data, for given cohorts of policies. A panel data model is necessary to
produce reliable estimates. In this study, we are able to utilize unique data from health insurance
markets that allow us to conduct a panel data analysis of cohort-specific experience while
controlling for heterogeneity in observable risk.
In our study we examine the profitability of policy cohorts, which are initially written on
relatively homogenous individuals, over the life these contracts. We specifically test cohort-
specific data for virtually the universe of insurers issuing long-term care (LTC) insurance in the
U.S. We find that loss ratios decline significantly with policy age, all else being constant. Our
evidence is consistent with the lowballing pricing behavior implied by the Kunreuther-Pauly and
Nilssen models, as well as the empirical evidence of D’Arcy and Doherty (1990).
In the next section, we review the adverse selection literature, focusing on models of
multiperiod insurance pricing under conditions of asymmetric information. We then describe our
research design and, in the final two sections, present our empirical findings, a summary, and
concluding remarks.
Literature Review
Since the seminal work of Akerlof (1970), the issue of adverse selection caused by private
information has become one of the most heavily researched areas in information economics. Our
understanding of the effects of informational inefficiencies can be traced to the works of Spence
1 Chiappori and Salanié (2000) stress the importance of proper control of observable risks when estimating the impact of adverse
selection.

4
(1973) and Harris and Holmstrom (1982) on labor market signaling and contracting, Rothschild
and Stiglitz (1976) on insurance market signaling, and Jaffee and Russell (1976) and Stiglitz and
Weiss (1981) on banking credit. For insurance markets in particular, important contributions to the
adverse selection literature include, among others, Rothschild and Stiglitz (1976), Stiglitz (1977),
Wilson (1977), Spence (1978), Riley (1979), Dionne (1983), Dionne and Lasserre (1985), Cooper
and Hayes (1987), Dionne and Doherty (1994), and Nilssen (2000). These studies show that
insurers can separate insurance buyers, ex ante, by offering contract menus that exhibit
characteristics such as nonlinear prices, incomplete coverage, state-contingent terms (i.e.
experience rating), and firm commitment to long-term contracts.
In what follows, we first discuss static adverse selection models and related empirical
studies that test for the effects of adverse selection. We then move to multiperiod adverse selection
models, which are the primary focus of this study, the competing empirical implications, and
related empirical results. We conclude this section by discussing the empirical work needed to
document systematic evidence on the effects of adverse selection.
Adverse Selection in Insurance Markets: Theory and Empirical Evidence
Akerlof’s “lemons” principal is applied to competitive insurance markets by Rothschild
and Stiglitz (1976). Specifically they show that informationally disadvantaged insurers can design
incentive-compatible schemes in their contracts so that observably similar buyers will separate
themselves into distinct risk classes by choosing particular contracts consistent with their risk
levels. One such self-selection mechanism is a menu of contracts with a convex pricing schedule.
In equilibrium, risk separation occurs in which contracts with more comprehensive coverage are
chosen by individuals with higher expected insurance costs at higher unit prices while low risks
only can optimize by selecting partial insurance coverage.

5
Following Rothschild and Stiglitz’s original insight, researchers have devoted a great deal
of effort identifying the existence of market equilibrium under adverse selection and characterizing
the conditions and mechanisms allowing separation (Stiglitz, 1977; Miyazaki, 1977; Wilson, 1977;
and Cho and Kreps, 1987). Collectively, their models generate important testable implications for
insurance markets subject to imperfect information about buyers’ risks.Two primary implications
emerge from the literature. One is that among the menu of contracts offered to indistinguishable
buyers, those with greater insurance coverage will tend to be purchased by high-risk individuals
and those with higher deductibles and less comprehensive coverage will be bought by low risks. A
second prediction is that the marginal costs of insurance are increasing in the amount of coverage.
Empirical studies have provided somewhat ambiguous evidence about the impact of
adverse selection in insurance markets. Evidence of significant adverse selection in automobile
insurance markets is provided by Dahlby (1983) and Puelz and Snow (1994). Cawley and
Philipson (1999) find no such impact in life insurance markets and neither do Chiappori and
Salanié (2000) in automobile insurance markets, which directly rebuts Puelz and Snow.
Multiperiod Insurance Markets with Adverse Selection
In a multiperiod setting with repeated transactions between the contracting parties,
Townsend (1982) demonstrates ex ante efficiency gains to multiperiod contracting in the presence
of private information. Rubinstein and Yaari (1983) specifically show that using long-term
contracts in which temporal prices depend on past experience can eliminate inefficiencies
associated with moral hazard in insurance markets.
The subject of designing and pricing insurance contracts in a dynamic setting to overcome
adverse selection and market inefficiencies has been explored in detail by Dionne(1983), Dionne
and Lasserre (1985), Cooper and Hayes (1987), Hosios and Peters (1989), Dionne and Doherty

6
(1994), and Nilssen (2000). While these studies generally show an outcome of a separating
equilibrium, they differ in many other ways including the timing of the separation, the specific
design of incentive contracts, and the extent of allocative efficiency.
Dionne (1983) and Dionne and Lasserre (1985) show that a Pareto-optimal outcome with
risk separation can occur in an infinite, repeated contracting relationship if long-term contracts are
binding on both a monopolistic insurer and an insured who are committed to period-by-period ex
post renegotiation. Cooper and Hayes (1987) explore finite-period adverse selection models under
the assumption that long-term contracts are binding on both the insurer and policyholders. They
show that a separating equilibrium occurs in the first period if the contract menu consists of a
Rothschild-Stiglitz short-term contract designed for high risks and an experience-rated, long-term
contract for low risks. This result holds for both monopolistic and competitive market conditions,
with the difference being the impact on insurers’ expected long-run profits because, in the latter
case, insurers’ long-run profits are constrained to zero.
Although firm commitment between insurers and insureds is frequently assumed in
multiperiod models, such a binding contract for the policyholder is generally considered too strong
to impose (Dionne and Doherty, 1994). When firms are assumed to be bound to long-term
contracts while policyholders are free to switch in any given period, second-period competition and
the possibility of ex post renegotiation complicate the information mechanism in the multiperiod
setting. Cooper and Hayes (1987) suggest that to counteract the incentive problem created by the
presence of second-period competition -- i.e. high risks can pretend to be low risk in the first period
and then switch to rival firms in the second period -- an additional incentive-compatible scheme
needs to be built into Rothschild-Stiglitz contracts. They show that a multiperiod separating
equilibrium can be obtained if contracts designed for low risks contain a premium that increases

7
the costs for high risks pretending to be low risks. In equilibrium, high risks choose short-term
contracts with complete coverage and low risks purchase front-loaded, long-term contracts with
partial coverage and experience rating. A multiperiod separating equilibrium occurs with additional
costs imposed on low risks so that insurers initially realize profits on their long-term contracts. If
long-run profits are constrained to zero by competition, losses should be realized in the second
period. D’Arcy and Doherty (1990) use the term “price highballing” to describe the pricing pattern
suggested by this model.
Dionne and Doherty (1994) relax the renegotiation prohibitions underlying the Cooper-
Hayes model, allowing for ex post renegotiation if it is mutually beneficial to insurers and insureds.
They show that a menu consisting of first-period, semi-pooling contracts with experience rating
and second-period Rothschild-Stiglitz separating contracts makes the semi-pooling contracts
renegotiation-proof so that the ex ante efficiency gains from commitment are retained.
Consequently, the equilibrium outcome is characterized by semi-pooling of all the low risks and a
proportion of the high risks, followed by second-period risk separation through self-selection.
Although Dionne and Doherty (1994) extend the Cooper-Hayes model to allow for the possibility
of renegotiation, they conclude that the temporal profit pattern of price highballing still applies.
Kunreuther and Pauly (1985) and Nilssen (2000) examine the effects of adverse selection
in competitive insurance markets assuming no commitments by buyers or sellers to long-term
contracts. Only single-period contracts are considered. Kunreuther and Pauly posit that pooling
contracts will be offered in the first period, but then insurers will adjust prices in subsequent
periods based on Bayesian updates of each insured’s loss experience. Nilssen suggests that risks
can be separated in the second period by either a menu of Rothschild-Stiglitz contracts or a cross-
subsidizing menu or both, depending on the information observed during the first period. With the

8
Kunreuther-Pauly model, prices will be adjusted upward for those who incur claims, while prices
for the better risks will not fully reflect their favorable loss record as insurers extract quasi-rents.
With the Nilssen model, this is a possible, but not absolutely necessary, conclusion.
The key result that differentiates these models from the previously discussed
“commitment” models is the possibility of a virtually opposite pricing and profit pattern. In
particular, losses are anticipated in the initial periods while profits are realized in subsequent
periods as long-run profits are constrained to zero. This pattern of pricing adjustment is referenced
as “price lowballing” (D’Arcy and Doherty, 1990).
Empirical Evidence on Multiperiod Adverse Selection Models
Because alternative models predict contrasting profit patterns over time, empirical
examination of the financial performance for cohorts of insurance contracts can serve to
discriminate between the models. Two previous studies explicitly test data from the automobile
insurance markets to assess temporal pricing by insurers. Based upon survey data collected from a
sample of seven insurers, D’Arcy and Doherty (1990) examine the average profitability of policies
classified by policy age.2 They find that mean loss ratios decline steadily with policy age. In
addition, the study shows that insurers’ aggregate loss ratios also decline over time and converge to
the industry mean as the company ages. D’Arcy and Doherty conclude that their findings are
consistent with the adverse selection model of Kunreuther and Pauly (1985), in which insurance
buyers and sellers do not commit to long-term contracts and engage in price lowballing.
In contrast, the results obtained in Dionne and Doherty (1994) show a temporal profit
pattern consistent with the price highballing implication of the firm commitment models (e.g.,
2 As noted by D’Arcy and Doherty, their definition of policyholder cohort combines individuals of different classes of observable
risk.

9
Cooper and Hayes, 1987; Dionne and Doherty, 1994). Dionne and Doherty examine a sample of
more than eighty insurers writing auto insurance in California for the period 1985 through 1988.
Using aggregate premium growth rate as the proxy for the average age of all existing policies
issued by an insurer, the authors find a significantly negative relation between policy age and loss
ratios for insurers who tend to select and insure lower risks. They observe no significant relation
between policy age and loss ratios for those insurers with more mixed risk classes and a weak
positive relation for those who insure higher risks. They conclude that their results are strongly
consistent with their own semicommitment model as well as the Cooper-Hayes commitment
model, both of which predict price highballing.
The studies of adverse selection in insurance markets generally have been hampered by
limited data. Direct tests of alternative multiperiod adverse selection models require data for the
contractual characteristics and pricing of insurance over time. Such data are not publicly available,
however. Consequently, researchers have turned to indirect tests by examining the average
profitability for groups of different contracts aggregated together. Such aggregation bundles
together contracts designed for different risk classes based on observable risk characteristics.
Adverse selection theory calls for performance measures to be applied to contracts observably
similar insureds, however. Given the data problems, researchers should not be surprised that the
limited empirical evidence gleaned from auto insurance markets presents a contrasting picture. In
our study, we turn to the long-term care insurance markets, for which cohorts of profitability data
are available for virtually the universe of U.S. insurers. In doing so, we are able to examine cleaner
cohort data and generate results that will add insight into the debate about which adverse selection
models best describe the temporal pricing behavior of insurers.

10
Research Design
In this study we investigate the financial performance for cohorts of LTC insurance
contracts to test the implications of competing adverse selection models with respect to pricing.
Our study differs from previous studies because we examine time-series variation as well as cross-
sectional variation to draw inferences about the appropriate pricing mechanism. We also use a
unique dataset that allows cohort-specific analysis of contract performance. Specifically, we are
able to track a given cohort of policyholders insured under the same policy form for a number of
years. By doing so, we can at least partially mitigate biases inherent in previous studies because of
the aggregation of data for insureds with observably different risk characteristics.
Data
Our data are collected from the InfoPro database of Long-Term Care Insurance Reporting
Forms, which is compiled by the National Association of Insurance Commission (NAIC). The
NAIC’s long-term care (LTC) insurance database includes the annual reports filed by all insurers
admitted to sell long-term insurance policies in the U.S. Insurers file direct experience reports,
before reinsurance ceded or assumed, for each policy form. A policy form is defined by the NAIC
as a type of policy issued to individuals with substantially similar risk classes and for which similar
underwriting standards apply. All policy forms that meet the requirements of the NAIC Long-Term
Care Insurance Model Act, or the similar laws and regulations of individual states, are included in
the database. Policies sold to policyholders residing outside the United States are excluded.
For each policy form, the LTC data are further classified by the year in which a contract
was first written. All contracts initially written in the same year are treated as a cohort and cohort-
specific experience is reported. Calendar duration, defined as the year for which experience is
reported for a particular contract less its year of initial issue, indicates how long a cohort of

11
policyholders have been insured under a particular policy form. For example, a cohort with a
calendar duration of five in statement year 1995 first purchased these contracts in 1990. In
addition, we know that because individuals were initially insured under the same policy form, they
were considered to be in the same risk class at the time of initial issue.
In the NAIC database, the values of calendar duration increase by one each year through
the first five years. Subsequently, the cohorts that have been with the current insurer for six to ten
years are aggregated, and those in existence for over ten years are placed in a single classification.
In each time period a new cohort is moved into the 6-10 calendar duration category and an existing
cohort is moved out and into the 10+ category, so we combine all policyholders in these two
calendar durations as well as the cohort falling under duration 5 category and treat them as one
cohort for matching purposes. This practice allows us to track the results for all policyholders
throughout the sample period.
Consider, for example, the cohort under calendar duration 5 category in 1995. By reporting
year 1996, this group of policyholders no longer exists as a separate group in the database because
their experience is reported together with other groups in duration 6-10 category. Likewise, those
having an actual duration of 10 are moved out of category 6-10 and into the 10+ category by 1996.
For tractability we need to merge these three different duration categories. Although any such
aggregation unavoidably combines cohorts with some heterogeneous risk characteristics, it should
not create serious limitations because the aggregation takes place within the same policy form.
The sample data encompass the period 1995 through 2000 because these currently are the
first and last years for which the data from LTC reporting forms are available from the NAIC. Our
raw sample contains all life and health insurers that submitted information required by the state
12
insurance commissions and departments. Financial data, such as measures of risk-based capital, are
collected from the NAIC Annual Statement Report, also available from the NAIC.
The Empirical Model
In previous studies of auto insurance markets an insured’s probability distribution of losses
is implicitly assumed to be constant over time (D’Arcy and Doherty, 1990; Dionne and Doherty,
1994). Temporal variations in the financial performance of policy cohorts consequently are
deemed attributable to price adjustments made by insurers as they gain new information from their
insureds’ loss experience. For LTC insurance, however, such a probabilistic scenario is unlikely.
Over time, as both the insured and the contracts age, the probability distribution should shift to the
right. Losses should rise as policy cohorts age. Therefore, to isolate adverse selection effects, we
must carefully control for time effects on insurer prices and profitability.
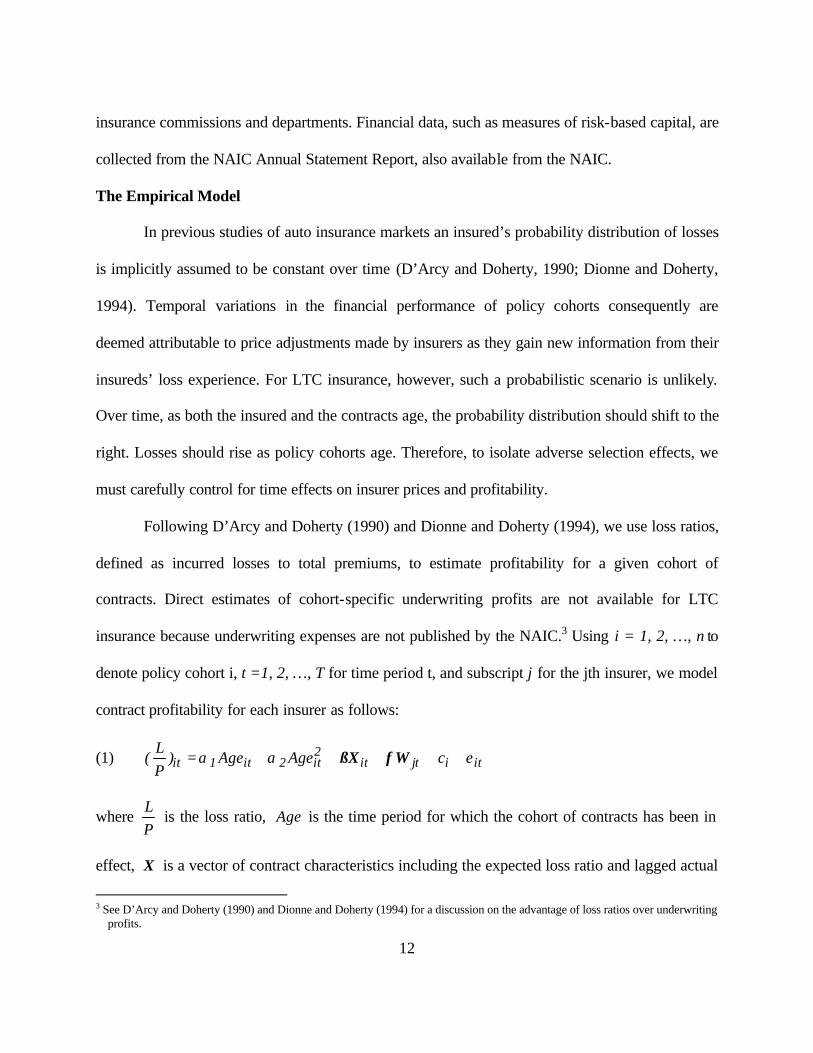
Following D’Arcy and Doherty (1990) and Dionne and Doherty (1994), we use loss ratios,
defined as incurred losses to total premiums, to estimate profitability for a given cohort of
contracts. Direct estimates of cohort-specific underwriting profits are not available for LTC
insurance because underwriting expenses are not published by the NAIC.3 Using i = 1, 2, …, n to
denote policy cohort i, t =1, 2, …, T for time period t, and subscript j for the jth insurer, we model
contract profitability for each insurer as follows:
(1) itijtit2it2it1it cAgeAge)
PL
( εαα +++++= f WßX
where PL
is the loss ratio, Age is the time period for which the cohort of contracts has been in
effect, X is a vector of contract characteristics including the expected loss ratio and lagged actual
3 See D’Arcy and Doherty (1990) and Dionne and Doherty (1994) for a discussion on the advantage of loss ratios over underwriting
profits.
13
loss ratio, 1t,i)PL
( − , W is a vector of firm-specific characteristics, such as firm size and
organizational structure, c is the contract-specific individual effect, and the error term ε is
assumed to have a mean of zero.
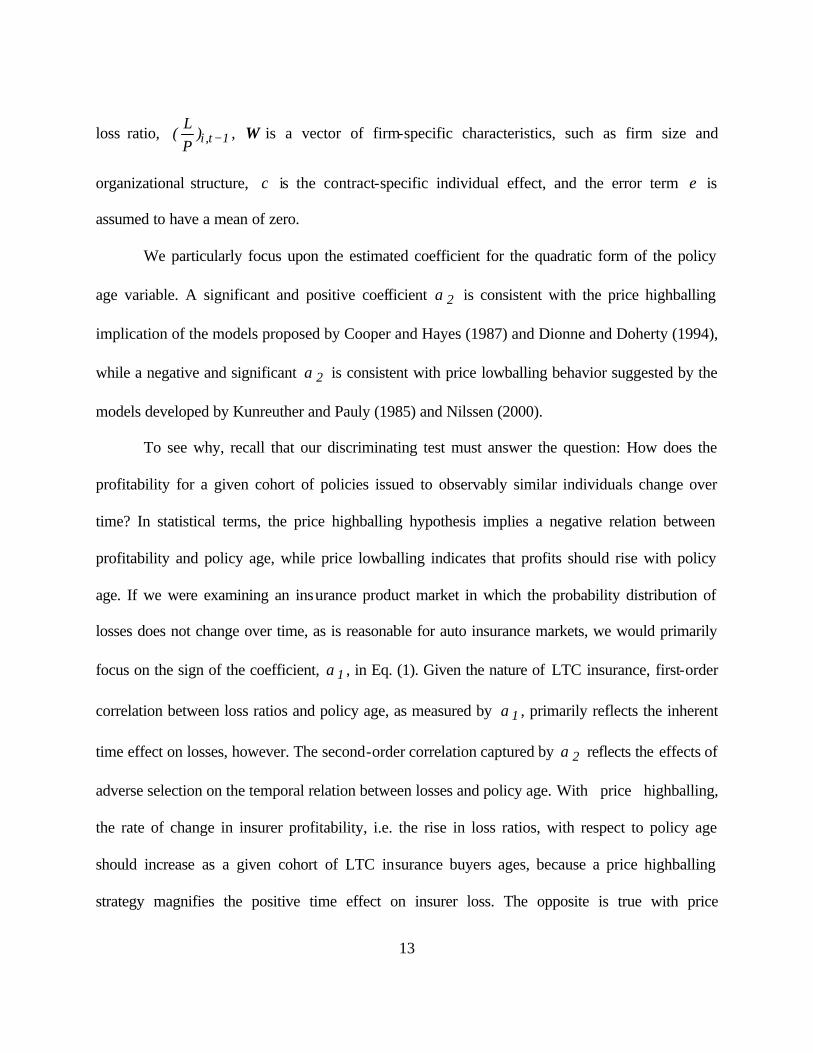
We particularly focus upon the estimated coefficient for the quadratic form of the policy
age variable. A significant and positive coefficient 2α is consistent with the price highballing
implication of the models proposed by Cooper and Hayes (1987) and Dionne and Doherty (1994),
while a negative and significant 2α is consistent with price lowballing behavior suggested by the
models developed by Kunreuther and Pauly (1985) and Nilssen (2000).
To see why, recall that our discriminating test must answer the question: How does the
profitability for a given cohort of policies issued to observably similar individuals change over
time? In statistical terms, the price highballing hypothesis implies a negative relation between
profitability and policy age, while price lowballing indicates that profits should rise with policy
age. If we were examining an insurance product market in which the probability distribution of
losses does not change over time, as is reasonable for auto insurance markets, we would primarily
focus on the sign of the coefficient, 1α , in Eq. (1). Given the nature of LTC insurance, first-order
correlation between loss ratios and policy age, as measured by 1α , primarily reflects the inherent
time effect on losses, however. The second-order correlation captured by 2α reflects the effects of
adverse selection on the temporal relation between losses and policy age. With price highballing,
the rate of change in insurer profitability, i.e. the rise in loss ratios, with respect to policy age
should increase as a given cohort of LTC insurance buyers ages, because a price highballing
strategy magnifies the positive time effect on insurer loss. The opposite is true with price

14
lowballing as the marginal effect of policy age on loss ratios should be a declining function of
policy age because price lowballing mitigates the positive time effect on insurer loss.
Contract-Specific Variables
We include two contract-specific variables to allow for other factors that systematically
affect policy loss ratios. They are the expected loss ratio, itExpLoss , and the lagged actual loss
ratio, 1t,iP
L
−. The data for expected loss ratios are reported by insurers for each policyholder
cohort insured under a given policy form. The ratio is the anticipated policy losses as a percentage
of earned premiums without adjustment for changes in policy reserves. Variations in loss ratios
across cohorts are likely to reflect differences in observable risk characteristics. We therefore
assume that cohort-specific expected loss ratios impound the risks of individual policyholders in
the cohort that are observable to the insurer. We expect a positive relation between expected losses
and actual losses.
The lagged dependent variable, 1t,iP
L
−, is included in our model to capture short-run
departures from equilibrium. It can capture temporary effects such as those arising from slow price
adjustments, possibly because of adjustment costs or regulatory delay. 4 Consequently, we
anticipate that any costs or delays, as captured by the lagged loss ratio, will be positively related to
the current-period loss ratio.
Firm-Specific Variables
In order to produce reliable measures of the relation between policy age and profitability,
we must control for differences in policy risk characteristics across insurers’ portfolios. These
4 See, e.g., Dahlby (1992), for a test of auto insurance price rigidity when price adjustments are costly.

15
differences can be captured by incorporating firm characteristics that reflect the propensity of
insurer managers to accept risk. More aggressive managers will tend to underwrite policies for
customers with observably higher risk. Two firm-specific characteristics are considered here:
organizational structure (Stock ) and risk-based capital (RBC ). Agency theory suggests that
managers of stock firms are less averse to risk. Risk-based capital reflects managerial willingness
to accept financial risk. We expect positive relations between loss ratios and both of these
measures of risk preference. Likewise, firm size can be associated with greater expertise and
resources in screening and sorting risks (Kroner and West, 1995). We therefore expect a negative
relation between firm size and loss ratios. To fully describe our test model, we rewrite equation (1)
as follows:
(1´) it1t,i2it12it2it1it )
PL
(ExpLossAgeAge)PL
( −+++= ββαα
itijt3jt2j1 cSizeRBCStock εφφφ +++++
We apply equation (1´) using four different model specifications and estimation procedures, as
shown in Table 1. Detailed descriptions are provided subsequently as we present the estimates for
each model.
[Table 1 about here]
Results
The model is fitted to 1995-2000 data. Standard screens for missing observations and
outliers are applied to our raw sample data. Considering that in any given time period a large
proportion of newly issued and younger policies do not incur losses during the first few years
because of initial underwriting effects and the long-term nature of LTC insurance claims, we

16
exclude policy cohorts with calendar durations less than four years. This sample selection
procedure creates a priori bias against price lowballing effects. Our final sample consists of a panel
of 100 insurers for which there are a total of 359 policyholder cohorts that are insured under
different policy forms for the sample period. A total of 1035 cohort-year observations remain.
Table 2 contains summary statistics of the variables used in the regression analysis. To give
a feel of the data we report the mean values and standard deviations as well as pairwise correlation
coefficients, all computed using 1035 cohort-year observations contained in the final sample. The
mean cohort age is nine years and the maximum is twenty-one, with a standard deviation equal to
2.64. We also observe a wide range of actual loss ratios, varying from zero to as high as 670
percent with a standard deviation at about 70 percent. Also note that while the coefficient of
correlation between expected loss ratios and cohort age is .397, the contemporaneous correlation
between actual losses and cohort age is .167 (.137 is shown in the table for that between cohort age
and lagged losses).
[Table 2 about here]
Table 3 contains regression results for the empirical models specified in Table 1. Using
generalized least squares (GLS), we first estimate equation (1´) without including the lagged loss
ratio as a control variable. We obtain an estimated autocorrelation coefficient of .444. The first-
order autoregressive form, AR(1), is thus specified for the disturbance process. Subsequently, the
estimates are corrected for serial correlation as well as heteroscedasticity using White’s robust
covariance estimators. In regression (2), which corresponds to specification (B) in Table 1, we
specify an autoregressive model by including the lagged dependent variable. As discussed earlier,
the lagged dependent variable is expected to capture temporary departure from long-run
equilibrium when adjustment costs or regulatory factors lead to slow price adjustment. Hatanaka’s

17
two-step instrumental method is used to obtain the estimates for regression (2).5 In regression (1)
and (2) we assume no individual effects in our panel data.
Column (3) contains the estimates of a random effects model (REM) because Hausman’s
test fails to reject the null hypothesis that individual effects are uncorrelated with other regressors.
In column (4), we report the results obtained with a dynamic panel model method. As is well
known, the standard transformation to eliminate individual effects is insufficient to obtain
consistent estimators in a dynamic panel model. Instrumental variable (IV) methods can be used to
obtain consistent estimators (Greene, 2000). Because of the relatively short time series for our
unbalanced panel, we obtain our estimators with a two-step IV approach as developed in Ge and
Cox (2002).
[Table 3 about here]
As expected, the coefficients for the Age variable indicate a consistent and significantly
positive time effect on incurred losses for LTC insurance policies. Under the four different model
specifications, the estimated coefficients for the key variable, 2Age , is consistently negative and
statistically significant. This evidence of a decreasing marginal effect of policy age on loss ratios is
consistent with the price lowballing hypothesis. That is, while loss ratios rise over time because of
the nature of long-tailed claims for LTC insurance, they do so at a decreasing rate, which suggests
that insurers use lowballing pricing strategies.
Among the other control variables, the estimated coefficients for the expected loss ratio
( ExpLoss ) and the lagged actual loss ratio (1tP
L−
) have the expected positive sign and are
consistently significant. This means that actual losses generally are higher for policies written on
5 See Greene (2000) on the efficiency of Hatanaka’s estimators relative to standard IV methods in an autoregressive model.
18
groups of individuals with greater observable risk. The coefficients for the lagged dependent
variable obtained using Hatanaka’s IV approach and random effects estimation are comparable,
while the dynamic panel model method yields a substantially smaller adjustment coefficient. Firm
size ( Size ) and organizational structure ( Stock ) effects, though not significant, are in the expected
direction. If stock firms tend to take more risks than mutual insurers, higher losses are expected
across their polices. Similarly, a negative relation between size and loss ratio is expected if larger
firms are better at screening and sorting risks due to their experience and expertise. We measure
firm size alternatively by the log of insurer’s total admitted assets and by LTC market share, but
the results are quite similar. The estimates reported in Table 3 are obtained using insurers’ LTC
market share as the size measure. The estimated coefficients for risk-based capital ( RBC ) do not
indicate any specific explanatory power and they appear to be somewhat unstable over different
model specifications. When we drop RBC in all specifications, we obtain very similar results for
the other variables.
Summary and Conclusions
Multiperiod adverse selection models applied to insurance markets have produced very
different implications. Models built on assumptions of firm commitment to long-term contracts
indicate that equilibrium can be characterized as full separation or semipooling followed by
separation. Consistent with temporal price movement described as “price highballing,” these
models imply that insurer profitability for a given cohort of observably similar insureds will fall
over time because of temporal rent redistribution. Alternatively, models built on assumptions of no
long-term commitments between buyers and sellers and insurer retention of private information

19
indicate price lowballing as insurers extract informational rents from existing policyholders.
Consequently, insurer profitability for a given cohort of policyholders should rise over time.
In this study we use cohort-specific data for long-term care (LTC) insurance to test the two
competing propositions concerning insurers’ temporal profit patterns. Our results show that while
the loss ratio on a given cohort of policyholders rises over time in a pattern consistent with the
nature of long-tail claims for LTC insurance, the rate at which loss ratios increase with policy age
declines significantly over time. This decreasing marginal effect of policy age is consistent with the
rising temporal profit pattern characterized as price lowballing. Our evidence from the LTC
insurance markets therefore is more supportive of the Kunreuther-Pauly and Nilssen models, which
indicate that multiperiod equilibria in markets with asymmetric information involve risk pooling
and subsequent price distortions. Our findings are also in line with the empirical results of D’Arcy
and Doherty (1990). Considering that a potential upward bias in the estimated coefficient for
cohort age is likely given our sample selection procedure, our results probably underestimate the
positive relation between policy age and loss ratios, which implies even stronger support for price
lowballing.
As in previous studies, our research design focuses on the temporal profit implications of
multiperiod adverse selection models. Hopefully, researchers will be able to more directly examine
insurance prices, as well as firm- and contract-specific risk characteristics, to test temporal price
adjustment issues in the future. Another possible issue relates to the maturity of the markets tested.
While the automobile insurance markets tested by other researchers presumably are well-
established and mature, we examine the relatively young, dynamically changing LTC insurance
market. The impact of financial innovation on temporal pricing patterns strikes us as an issue
worthy of further investigation by researchers.
References
Akerlof, G. A., 1970, “The Market for ‘Lemons’: Quality Uncertainty and the Market Mechanism,” Quarterly Journal of Economics 84 (3): 488-500.
Altman, D., D.M. Cutler, and R.J. Zeckhauser, 1998, “Adverse Selection and Adverse Retention,”
American Economic Review Papers and Proceedings, May 1998, vol. 88, no. 2, 122-126. Cawley, J., and T. Philipson, 1999, “An Empirical Examination of Information Barriers to Trade in
Insurance,” American Economic Review 89 (4): 827-846. Chiappori, P. A., 2000, “Econometric Models of Insurance under Asymmetric Information,” in G.
Dionne ed., Handbook of Insurance. Chiappori, P. A., and B. Salanié, 2000, “Testing for Asymmetric Information in Insurance
Markets,” Journal of Political Economy 108 (1): 56-78. Cho, I. K., and D. M., Kreps, 1987, “Signaling Games and Stable Equilibria,” Quarterly Journal of
Economics 102: 179-221. Cooper, R., and B. Hayes, 1987, “Multi-Period Insurance Contracts,” International Journal of
Industrial Organization 5: 211-231. Dahlby, B. G., 1983, “Adverse Selection and Statistical Discrimination: An Analysis of Canadian
Automobile Insurance,” Journal of Public Economics 20: 121-130. Dahlby, B. G., 1992, “Price Adjustment in an Automobile Insurance Market: A Test of the
Sheshinski-Weiss Model,” Canadian Journal of Economics 25 (3): 564-583. D’Arcy, S. P., and N. A. Doherty, 1990, “Adverse Selection, Private Information, and Lowballing
in Insurance Markets,” Journal of Business 63: 145-164. Dionne, G., 1983, “Adverse Selection and Repeated Insurance Contracts,” Geneva Papers on Risk
and Insurance 8: 316-333. Dionne, G., and P. Lasserre, 1985, “Adverse Selection, Repeated Insurance Contracts and
Announcement Strategy,” Review of Economic Studies 52: 719-723. Dionne, G., and N. A. Doherty, 1994, “Adverse Selection, Commitment, and Renegotiation:
Extension to and Evidence from Insurance Markets,” Journal of Political Economy 102, no. 2, 209-235.
Gal, S., and M. Landsberger, 1988, “On ‘Small Sample’ Properties of Experience Rating Insurance
Contracts,” Quarterly Journal of Economics 103: 233-243.
Ge, Y., and L. A. Cox, 2002, “Financial Innovation and Firm Performance in the Long-Term Care Insurance Markets,” working paper.
Greene, W. H., 2000, Econometric Analysis, 4th Edition. New York: Macmillan. Greenwald, B. C., 1986, “Adverse Selection in the Labor Market,” Review of Economic Studies 53
(3): 325-347. Harris, M., and B. Holmstrom, 1982, “A Theory of Wage Dynamics,” Review of Economic Studies
49 (3): 315-333. Hosios, A. J., and M. Peters, 1989, “Repeated Insurance Contracts with Adverse Selection and
Limited Commitment,” Quarterly Journal of Economics 104: 229-253. Jaffee, D. M., and T. Russell, 1976, “Imperfect Information, Uncertainty, and Credit Rationing,”
Quarterly Journal of Economics 90: 651-666. Klemperer, P., 1987, “The Competitiveness of Markets with Switching Costs,” Rand Journal of
Economics 18: 138-150. Kroner, K. F., and D.S. West, 1995, “The Relationship between Firm Size and Screening in an
Automobile Insurance Market,” Journal of Risk and Insurance 62 (1): 12-29. Kunreuther, H., and M. Pauly, 1985, “Market Equilibrium with Private Knowledge: An Insurance
Example,” Journal of Public Economics 26: 269-288. Miyazaki, H., 1977, “The Rate Race and Internal Labor Market,” Bell Journal of Economics 8:
394-418. Nilssen, T., 2000, “Consumer Lock-in with Asymmetric Information,” International Journal of
Industrial Organization 18: 641-666. Pauly, M. V., 1968, “The Economics of Moral Hazard: Comments,” American Economic Review
58: 531-536. Pauly, M. V., 1974, “Overinsurance and the Public Provision of Insurance: The Role of Moral
Hazard and Adverse Selection,” Quarterly Journal of Economics 88: 44-62. Puelz, R., and A. Snow, 1994, “Evidence on Adverse Selection: Equilibrium Signaling and Cross-
Subsidization in the Insurance Market,” Journal of Political Economy 102 (2): 236-257. Riley, J. G., 1979, “Informational Equilibrium,” Econometrica 47: 331-359. Rothschild, M., and J. E., Stiglitz, 1976, “Equilibrium in Competitive Insurance Markets: An Essay
on the Economics of Imperfect Information,” Quarterly Journal of Economics 90: 629-649.
Rubinstein, A., and M. E. Yaari, 1983, “Repeated Insurance Contracts and Moral Hazard,” Journal of Economic Theory 30: 74-97.
Spence, M., 1973, “Job Market Signaling,” Quarterly Journal of Economics 87: 355-379. Spence, M., 1978, “Product Differentiation and Performance in Insurance Markets,” Journal of
Public Economics 10: 427-447. Stiglitz, J. E., 1977, “Monopoly, non- linear Pricing and Imperfect Information: The Insurance
Markets,” Review of Economic Studies 44: 407-430. Stiglitz, J. E., and A. Weiss, 1981, “Credit Rationing in Markets with Imperfect Information,”
American Economic Review 71 (3): 393-410. Townsend, R. M., 1982, “Optimal Multiperiod Contracts and the Gain from Enduring
Relationships under Private Information,” Journal of Political Economy 90 (6): 1166-1186. Wilson, C., 1977, “A Model of Insurance Markets with Incomplete Information,” Journal of
Economic Theory 16: 167-207.

Table 1
Regression Models of the Effects of Cohort Age and Observable Risk Characteristics on Cohort Loss Ratios This table shows four model variations. In specifications (A) and (B), we assume no individual effects in our panel data. Specifications (C) and (D) are unrestricted panel data models. We include the lagged dependent variable in (B) and (D) to impound dynamics in price adjustment. The dependent variable is the ratio of losses to premiums. Age is the number of years a given cohort of policyholders has been with the current insurer. ExpLoss is the policy-specific expected loss ratio. Stock is a binary indicator equal to one if an insurer is a mutual firm and four if it is a stock firm. RBC is the ratio of adjusted capital to risk-based capital. Size is, alternatively, a measure of firm asset size or its LTC insurance market share.
Model
Model Specification
A Restricted Panel Model (no lagged dependent variable)
itjt3jt2j1it12it2it10
itSizeRBCStockExpLossAgeAge
PL εφφφβααα +++++++=
B Restricted Panel Model (with lagged dependent variable)
itjt3jt2j11it
2it12it2it10
itSizeRBCStock
PLExpLossAgeAge
PL εφφφββααα ++++++++=
−
C Unrestricted Panel Model (no dynamic effects)
itijt3jt2j1it12it2it1
itcSizeRBCStockExpLossAgeAge
PL εφφφβαα +++++++=
D Dynamic Panel Model itijt3jt2j1
1it2it1
2it2it1
itcSizeRBCStock
PLExpLossAgeAge
PL εφφφββαα ++++++++=
−

Table 2
Summary Statistics for the Variables Tested in the Regression Analyses
The statistics are computed based on 1035 cohort-year observations in our panel data sample for the period 1995-2000. Age is the number of years a given cohort of policyholders has been with the current insurer. ExpLoss is the policy-specific expected loss ratio. MS is the insurer’s share of the LTC insurance market. Stock is binary indicator equal to one if an insurer is a mutual firm and four if it is a stock firm. RBC is the ratio of adjusted capital to risk-based capital. L/P is the actual loss ratio for a given cohort of policies, and (L/P)t-1 is its lagged value.
Cohort Age
(Age)
Expected
Loss Ratio % (ExpLoss)
Market Share %
(MS)
Organizational
Structure (Stock )
Risk-Based
Capital (RBC)
Actual
Loss Ratio % (L/P)
Mean
9.127
80.575
2.335
3.559
1.073
70.487
S.D. 2.641 41.542 4.214 1.103 .0256 67.825
Min. 5 22.000 .0007 1 .984 0.000
Max. 21 297.700 24.50 4 1.502 666.525
Correlation Coefficients
Age
ExpLoss
(L/P)t-1
MS
Stock
RBC
Age .397 .137 .056 -.144 .031
ExpLoss .238 .071 .066 .042
(L/P)t-1 -.043 .063 .052
MS .021 -.259
Stock -.003

Table 3
Regression Estimates of the Effects of Cohort Age and Observable Risk Characteristics on Cohort Loss Ratios This table contains regression estimates of cohort-specific loss ratios on cohort age and other proxies of cohorts’ observable risk characteristics. Columns (1)-(4) correspond to the four model specifications given in Table 1. The results are based on a panel of 359 policy cohorts with 1035 cohort-year observations for the period 1995 to 2000. Standard errors are corrected for heteroscedasticity using White’s robust covariance estimators and in parentheses. GLS and IV/GLS are generalized estimates of panel data models assuming no individual effects and REM denotes a random effects model. Superscripts ***, **, and * indicate statistical significance at 1%, 5%, and 10% level, respectively. The test on Age2 is one tailed. Dependent Variable
(L/P) GLS
(1)
IV/GLS
(2)
REM
(3)
Dynamic Panel Model
(4)
Constant
-38.89*** (21.22)
-17.76*** (17.59)
-11.46*** (16.84)
-40.04*** (28.62)
Cohort age (Age)
11.48*** (3.978)
6.948** (3.367)
5.995** (3.253)
12.395*** (5.27)
Cohort age squared (Age2)
-.464*** (.189)
-.282** (.157)
-.231* (.153)
-.450** (.233)
Expected loss ratio (ExpLoss)
.419*** (.063)
.205*** (.049)
.222*** (.048)
.299*** (.067)
Organization structure (Stock )
3.892 (2.453)
.852 (1.694)
.948 (1.746)
.108 (2.534)
Risk-based capital (RBC)
-.008 (.202)
.0004 (.012)
.0002 (.012)
-.005 (.020)
Firm size (Size)
-.557 (.619)
-.274 (.436)
-.391 (.438)
-.181 (.606)
Lagged loss ratio (L/P)t-1
.482*** (.027)
.418*** (.025)
.172*** (.067)
ρ : AR (1)
.444*** (.027)
.070** (.031)
D.W.
2.125
2.022
R2
.077
.335
.325
.08