Asymmetric Information and Imperfect Competition … Nicola paper.pdfWe measure the consequences of...
52
Asymmetric Information and Imperfect Competition in Lending Markets * Gregory S. Crawford † , Nicola Pavanini ‡ , Fabiano Schivardi § May 2016 Abstract We measure the consequences of asymmetric information and imperfect competition in the Italian market for small business lines of credit. We provide evidence that a bank’s optimal price response to an increase in adverse selection varies depending on the degree of competition in its local market. More adverse selection causes prices to increase in competitive markets, but can have the opposite effect in more concentrated ones, where banks trade off higher markups and the desire to attract safer borrowers. This implies both that imperfect competition can moderate the welfare losses from an increase in adverse selection, and that an increase in adverse selection can moderate the welfare losses from market power. Exploiting detailed data on a representative sample of Italian firms, the population of medium and large Italian banks, individual lines of credit between them, and subsequent defaults, we estimate models of demand for credit, loan pricing, loan use, and firm default to measure the extent and consequences of asymmetric information in this market. While our data include a measure of observable credit risk available to a bank during the application process, we allow firms to have private information about the underlying riskiness of their project. This riskiness influences banks’ pricing of loans as higher interest rates attract a riskier pool of borrowers, increasing aggregate default probabilities. We find evidence of adverse selection in the data, and increase it with a policy experiment to evaluate its importance. As predicted, in the counterfactual equilibrium prices rise in more competitive markets and decline in more concentrated ones, where we also observe an increase in access to credit and a reduction in default rates. Thus market power may serve as a shield against the negative effects of an increase in adverse selection. * We thank Daniel Ackerberg, Jeff Campbell, Pierre-André Chiappori, Lorenzo Ciari, Valentino Dardanoni, Ramiro de Elejalde, Liran Einav, Rocco Macchiavello, Gregor Matvos, Carlos Noton, Tommaso Oliviero, Steven Ongena, Ariel Pakes, Andrea Pozzi, Pasquale Schiraldi, Matt Shum, Michael Waterson, Chris Woodruff, Ali Yurukoglu, Christine Zulehner and seminar participants at Warwick, PEDL, Barcelona GSE Banking Summer School, EUI, Tilburg, Zürich, Bocconi, 2014 Winter Marketing-Economics Summit in Wengen, IO session of the German Economic Association in Hamburg, St. Gallen, Barcelona 2014 Summer Forum, EARIE 2014, Toulouse, DIW Berlin, NBER 2015 Winter IO Meeting, and UCL for helpful comments. We thank for financial support the Research Centre Competitive Advantage in the Global Economy (CAGE), based in the Economics Department at University of Warwick. We thank Rafael Greminger for excellent research assistance. † University of Zürich, CEPR and CAGE, [email protected] ‡ University of Zürich, [email protected] § Bocconi, EIEF and CEPR, [email protected] 1
Transcript of Asymmetric Information and Imperfect Competition … Nicola paper.pdfWe measure the consequences of...

Asymmetric Information and Imperfect Competition in Lending
Markets∗
Gregory S. Crawford†, Nicola Pavanini‡, Fabiano Schivardi§
May 2016
Abstract
We measure the consequences of asymmetric information and imperfect competition in the Italianmarket for small business lines of credit. We provide evidence that a bank’s optimal price response toan increase in adverse selection varies depending on the degree of competition in its local market. Moreadverse selection causes prices to increase in competitive markets, but can have the opposite effect inmore concentrated ones, where banks trade off higher markups and the desire to attract safer borrowers.This implies both that imperfect competition can moderate the welfare losses from an increase in adverseselection, and that an increase in adverse selection can moderate the welfare losses from market power.Exploiting detailed data on a representative sample of Italian firms, the population of medium and largeItalian banks, individual lines of credit between them, and subsequent defaults, we estimate modelsof demand for credit, loan pricing, loan use, and firm default to measure the extent and consequencesof asymmetric information in this market. While our data include a measure of observable credit riskavailable to a bank during the application process, we allow firms to have private information about theunderlying riskiness of their project. This riskiness influences banks’ pricing of loans as higher interestrates attract a riskier pool of borrowers, increasing aggregate default probabilities. We find evidence ofadverse selection in the data, and increase it with a policy experiment to evaluate its importance. Aspredicted, in the counterfactual equilibrium prices rise in more competitive markets and decline in moreconcentrated ones, where we also observe an increase in access to credit and a reduction in default rates.Thus market power may serve as a shield against the negative effects of an increase in adverse selection.
∗We thank Daniel Ackerberg, Jeff Campbell, Pierre-André Chiappori, Lorenzo Ciari, Valentino Dardanoni, Ramiro de Elejalde,Liran Einav, Rocco Macchiavello, Gregor Matvos, Carlos Noton, Tommaso Oliviero, Steven Ongena, Ariel Pakes, Andrea Pozzi,Pasquale Schiraldi, Matt Shum, Michael Waterson, Chris Woodruff, Ali Yurukoglu, Christine Zulehner and seminar participantsat Warwick, PEDL, Barcelona GSE Banking Summer School, EUI, Tilburg, Zürich, Bocconi, 2014 Winter Marketing-EconomicsSummit in Wengen, IO session of the German Economic Association in Hamburg, St. Gallen, Barcelona 2014 Summer Forum,EARIE 2014, Toulouse, DIW Berlin, NBER 2015 Winter IO Meeting, and UCL for helpful comments. We thank for financialsupport the Research Centre Competitive Advantage in the Global Economy (CAGE), based in the Economics Department atUniversity of Warwick. We thank Rafael Greminger for excellent research assistance.†University of Zürich, CEPR and CAGE, [email protected]‡University of Zürich, [email protected]§Bocconi, EIEF and CEPR, [email protected]
1

1 Introduction
Following the seminal work of Akerlof (1970) and Rothschild and Stiglitz (1976), a large theoretical liter-ature has stressed the key role of asymmetric information in financial markets. This literature has shownthat asymmetric information can generate market failures such as credit rationing, inefficient provision, mis-spricing of risk and, in the limit, market breakdown.1 Indeed, the recent financial crisis can be seen as anextreme manifestation of the problems that asymmetric information can cause. In fact, following the defi-nition by Mishkin (2012), a financial crisis is a nonlinear disruption to financial markets in which adverseselection and moral hazard problems become much worse. Deepening our understanding of the extent andcauses of asymmetric information is key for the design of a regulatory framework that limits their negativeconsequences.
Although the basic theoretical issues are well understood, empirical work is fairly rare. Asymmetric infor-mation is by definition hard to measure. If a financial intermediary, such as a lender, has an information dis-advantage with respect to a potential borrower, it is very unlikely that such a disadvantage can be overcomeby the researcher. While one cannot generally construct measures of the ex-ante unobserved characteristicsdetermining riskiness, it is often possible to observe ex-post outcomes, such as defaulting on a loan. Theempirical literature has been built on these facts, analyzing how agents with different ex-post outcomes selfselect ex-ante into contracts (if any) with different characteristics in terms of price, coverage, deductiblesetc. (Chiappori and Salanié (2000), Abbring, Chiappori, Heckman and Pinquet (2003), Lustig (2011), Einav,Jenkins and Levin (2012), Starc (2014)).2
We measure the consequences of asymmetric information and imperfect competition in the Italian marketfor small business lines of credit. We exploit detailed, proprietary data on a representative sample of Italianfirms, the population of medium and large Italian banks, individual lines of credit between them, and sub-sequent individual defaults. While our data include a measure of observable credit risk comparable to thatavailable to a bank during the application process, in our model we allow firms to have private informationabout the underlying riskiness of the project they seek to finance. The market is characterized by adverseselection if riskier firms are more likely to demand credit. As shown by Stiglitz and Weiss (1981), in thissetting an increase in the interest rate exacerbates adverse selection, inducing a deterioration in the quality ofthe pool of borrowers. We formulate and structurally estimate a model of credit demand, loan use, default,and bank pricing based on the insights in Stiglitz and Weiss (1981) and Einav et al. (2012) that allows us toestimate the extent of both adverse selection and moral hazard in the market, and to run counterfactuals thatapproximate economic environments of likely concern to policymakers.
One key contribution of our paper is that we study adverse selection in an imperfectly competitive market.This differs from most of the previous literature, that, due to data limitation or to specific market features,has assumed either perfectly competitive markets, or imperfectly competitive markets subject to significantregulatory oversight. Assuming perfect competition in the market for small business loans is not desirable,
1See, for example, Banerjee and Newman (1993), Bernanke and Gertler (1990), DeMeza and Webb (1987), Gale (1990),Hubbard (1998), Mankiw (1986), Mookherjee and Ray (2002).
2 See Einav and Finkelstein (2011), Einav, Finkelstein and Levin (2010), and Chiappori and Salanié (2013) for extensive surveysof the this literature.
2

given the local nature of small business lending and the high degree of market concentration at the locallevel, the latter due to entry barriers in the Italian banking sectors that persisted into the 1990s. We showthat the degree of competition can have significant consequences on the equilibrium effects of asymmetricinformation. Intuitively, with perfect competition banks price at average costs (e.g. Einav and Finkelstein(2011)). When adverse selection increases, the price also rises, as a riskier pool of borrowers implies higheraverage costs in the form of more defaults. When banks exert market power, however, greater adverseselection can lower prices, as it implies a riskier pool of borrowers at any given price, lowering infra marginalbenefits of price increases in the standard (e.g. monopoly) pricing calculus. As a consequence, a bankwith market power facing an increase in adverse selection will also increase its market share and improvethe quality of its borrowers, as a lower price attracts marginal borrowers, which are safer under adverseselection. This implies both that imperfect competition can moderate the welfare losses from an increase inadverse selection and that higher adverse selection can moderate the welfare losses of market power. Lester,Shourideh, Venkateswaran and Zetlin-Jones (2015) and Mahoney and Weyl (2014) provide an intuitivetheoretical foundation for this result, consistent with our findings.
To analyze these questions, we construct a model where banks offer standardized contracts to observa-tionally equivalent firms. Loan contracts and banks are differentiated products in terms of, among othercharacteristics, the amount granted, a bank’s network of branches, the years a bank has been in a market,and distance from the closest branch. Banks compete Bertrand-Nash on interest rates, which also act as ascreening device as in Stiglitz and Weiss (1981). Firms seek lines of credit to finance the ongoing activitiesassociated with a particular business project, the riskiness of which is private information to the firm. Firmschoose the preferred loan, if any, according to a mixed logit demand system. They also choose how much ofthe credit line to use. Finally, they decide if to repay the loan or default. The degree of adverse selection isdetermined by two correlations: that between the unobservable determinants of the choice to take up a loanand default (the extensive margin) and that between unobserved determinants of how much of that loan touse and default (the intensive margin). For a given interest rate, firms’ expected profits are increasing withrisk due to the insurance effect of loans: banks share a portion of the costs of unsuccessful projects. As a re-sult, higher-risk firms are more willing to demand higher-rate loans. This, in turn, influences the profitabilityof rate increases by banks.3 We show with a Monte Carlo simulation that imperfect competition can indeedmitigate the effects of an increase in adverse selection. The effects of asymmetric information on pricesdepends on market power. When markets are competitive, more adverse selection always leads to higherrates and less credit. As banks’ market power increases, this relationship becomes weaker and eventuallyturns negative. Last, we also show the causal effect of a change in interest rates on default, controlling forselection, and interpret it as moral hazard.
We estimate the model on highly detailed microdata covering individual loans between firms and banksbetween 1988 and 1998. There are two key elements of this data. The first, from the Italian Central CreditRegister (Centrale dei Rischi), provides detailed information on all individual loans extended by the 90
3 Handel (2013), Lustig (2011), and Starc (2014) find similar effects of adverse selection and imperfect competition in US healthinsurance markets. Each of these focuses on the price-reducing effect of asymmetric information in the presence of imperfectcompetition. None articulates the non-monotonicity of these effects depending on the strength of competition, an empiricallyrelevant result in our application.
3

largest Italian banks (which account for 80% of the loan market), including the identity of the borrowerand interest rate charged. It also reports whether the firm subsequently defaulted. The second, from theCentrale dei Bilanci database, provides detailed information on borrowers’ balance sheets. Critically, thissecond dataset includes an observable measure of each firm’s default risk (SCORE). Combining them yieldsa matched panel dataset of borrowers and lenders. While the data span a 11-year period and most firmsin the data take out multiple loans, in our empirical analysis we only use the first year of each firm’s mainline of credit. This avoids the need to model the dynamics of firm-bank relationships and the inferencesavailable to subsequent lenders of existing lines of credit.4 We define local markets at the level of provinces,administrative units roughly comparable to a US county that, as discussed in detail by Guiso, Pistaferri andSchivardi (2013), constitute a natural geographical unit for small business lending. We estimate individualfirms’ demand for credit, banks’ pricing of these lines, firm’s loan use and subsequent default. We extend theeconometric approach taken by Einav et al. (2012) to the case of multiple lenders by assuming unobservedtastes for credit independent of the specific bank chosen to supply that credit. We combine this frameworkwith the literature on demand estimation for differentiated products (Berry 1994, Berry, Levinsohn andPakes 1995, Goolsbee and Petrin 2004). Data on default, loan use, demand, and pricing separately identifythe distribution of private riskiness from heterogeneous firm disutility from paying interest.
We provide reduced form evidence of adverse selection along both the intensive and the extensive margin.For the former, we run a positive correlation test as in Chiappori and Salanié (2000). For the latter, weestimate a Heckman selection model. We also provide rough evidence of imperfect competition, showingthat interest rates are positively correlated with concentration in local markets. In the structural model,we find that the choice to borrow, the amount used and the decision to default depend on observables asexpected. In particular, a higher interest rate and higher distance from branches reduce the probability thata firm borrows. Among other observables, firms with more cash flow are both less likely to demand credit,arguably because they have more internally generated funds, use a smaller share of their loan, and less likelyto default. In terms of correlation of unobservables, we find a positive correlation both between the choice toborrow and default, and between how much loan to use and default. We interpret this as evidence of adverseselection. We also find a positive effect of interest rates on default, which we interpret as evidence of moralhazard.
We run a counterfactual to quantify the extent of adverse selection and understand its interaction with im-perfect competition. In this policy experiment we increase the degree of adverse selection, identified by thecorrelation between both demand and default and loan use and default unobservables, and look at how equi-librium prices, demand, and defaults vary in response to this. The economic motivation for this exercise canbe thought as the possible consequences of a credit crunch, where risky firms become more exposed to fi-nancial distress than safe ones and demand more credit. This counterfactual delivers two important findings.First, there is a heterogeneous response of equilibrium prices, market shares, loan use, and defaults to anincrease in adverse selection. Second, these variations are correlated with banks’ market power, measuredby their estimated markup at the year-province-borrower level. We find that banks with higher markupsdecrease prices as adverse selection increases, and consequently increase their share of borrowers and de-
4 A similar approach is followed, among others, by Chiappori and Salanié (2000). We model the dynamics of firm-bankrelationships in a companion paper (Pavanini and Schivardi (2016)).
4

crease their share of defaulters. This implies that banks with higher markups have a counter-cyclical effecton credit supply, responding to an increase in adverse selection with a reduction in prices and an increase inquantity lent. We show that one standard deviation increase in markup reduces the counterfactual variationin bank’s prices by 4.3 percentage points, increases its variation in demand probability by 0.2 percentagepoints and in loan use by around 8,200 euros, and reduces its variation in borrowers’ default probability by2.2 percentage points.
This paper contributes to two main strands of empirical work. The first is the literature on empirical modelsof asymmetric information, so far mainly focussed on insurance markets. We look at the less developed areaof credit markets, where the most recent applications have followed both experimental (Karlan and Zinman(2009)) and structural (Einav et al. (2012)) approaches. Our novelty is to introduce imperfect competition.We show that this is important, as the impact of asymmetric information depends crucially on the natureof competition in the market. The second field we contribute to is the literature on empirical banking,where we are not aware of any structural model that seeks to measure the consequences of asymmetricinformation and the role competition plays in mediating its effects. Nonetheless, several reduced form paperson Italian banking provide motivation for a model that structurally combines these two effects. For example,Bofondi and Gobbi (2006) show that new banks entering local markets experience higher default ratesthan incumbents, as the latter have superior information about borrowers and local economic conditions.Gobbi and Lotti (2004) claim that there is a positive correlation between branching and markets with lowproprietary information services, and that interest rate spreads are positively related to entry of de novobanks, but not of banks existing in other markets. Finally, Panetta, Schivardi and Shum (2009) show thatmergers enhance pricing of observable risk, as merged banks achieve a better match of interest rates anddefault risk, mainly due to better information processing.
The structure of the paper is the following. In Section 2 we describe the dataset and the market, in Section3 we present the reduced form tests of adverse selection and imperfect competition, Section 4 outlines thestructural model, and Section 5 describes the econometric specification of demand, loan use, default andsupply. The estimation and the results are in Section 6, the counterfactuals are in Section 7, Section 8concludes.
2 Data and Institutional Details
We use a unique dataset of small business credit lines, previously used in Panetta et al. (2009).5 It is based onthree main sources of data. Interest rate data and data on outstanding loans are from the Italian Centrale deiRischi, or Central Credit Register. Firm-level balance sheet data are from the Centrale dei Bilanci database.Banks’ balance-sheet and income-statement data are from the Banking Supervision Register at the Bank ofItaly. By combining these data, we obtain a matched panel dataset of borrowers and lenders extending overan eleven-year period, between 1988 and 1998. We also collected data on bank branches at the local level
5For reasons that will be explained below, in this paper we only use on a subset of the original data. This section focusses onthe description of this subset, referring the interested reader to Panetta et al. (2009) for descriptive statistics of the full dataset.
5

since 1959.6
The Central Credit Register (hereafter CR) is a database that contains detailed information on individualbank loans extended by Italian banks. Banks must report data at the individual borrower level on the amountgranted and effectively utilized for all loans exceeding a given threshold,7 with a breakdown by type ofthe loan (credit lines, financial and commercial paper, collateralized loans, medium and long-term loansand personal guarantees). Banks also report if they classify a loan as bad, meaning that they attach a lowprobability to the event that the firm will be able to repay the loan in full. We define a default as a loanbeing classified as bad.8 In addition, a subgroup of around 90 banks (accounting for more than 80 percentof total bank lending) have agreed to file detailed information on the interest rates they charge to individualborrowers on each type of loan.
We restrict our attention to short-term credit lines, which have ideal features for our analysis. First, the bankcan change the interest rate at any time, while the borrower can close the credit line without notice. Thismeans that differences between the interest rates on loans are not influenced by differences in the maturityof the loan. Second, the loan contracts included in the CR are homogeneous products, so that they can bemeaningfully compared across banks and firms. Third, they are not collateralized, a key feature for ouranalysis, as adverse selection issues become less relevant for collateralized borrowing. Fourth, short termbank loans are one of the main source of borrowing of Italian firms. According to our data, trade creditrepresents around 48% of firms’ debt, short term bank credit 28%, and long term bank credit 9%. We definethe interest rate as the ratio of the payment made in each year by the firm to the bank to the amount of theloan used. The interest payment includes the fixed expenses charged by the bank to the firm (e.g. whichencompass the cost of opening the credit line or the cost of mailing the loan statement).
We focus on a subsample of the available data, namely on the main credit line of the first year a firm opensat least one credit line. Considering only the first year is a common assumption in static empirical models ofinsurance with asymmetric information, starting from Chiappori and Salanié (2000). This is done to avoidmodeling heterogenous experience ratings among borrowers and loan renegotiation, challenging topics, andones that we leave for future research. Moreover, we focus on the main new credit line because it accountson average for around 75% of the total share of new yearly credit (both usable and used),9 even if in Italymultiple relationship banking is widely used by firms to reduce liquidity risk (Detragiache, Garella andGuiso (2000)). This means that we restrict our attention only to the first year in which we observe a firmin our data.10 This reduces the sample size from around 90,000 firms to over 40,000.11 Table 1, Panel Areports the loan level information that we use in the empirical analysis. Out of around 27,000 firms, 69%take up a loan in our sample period, and use on average 67% of the amount granted. Of these, around 6%
6 Detailed descriptives on the branch data are in Ciari and Pavanini (2014).7 The threshold was 41,000 euros (U.S. $42,000) until December 1995 and 75,000 euros thereafter.8 We do not observe if a loan actually reverts to not being bad. However, this seems to be a rather unlikely event. Moreover,
classifying a loan as bad has a negative impact on bank accounting ratios, even before the firm formally defaults. So this is clearlya costly event in itself for the bank. See section 2.1 for a complete definition of default.
9 The main line is defined as the line for which the amount used, regardless of the amount granted, is the highest. For cases inwhich multiple lines have the same amount used, then the one with the lowest price is chosen.
10 To avoid left censoring issues we drop the first year of our sample (1988) and just look at new relationships starting from 1989.11 We estimate our structural model on a subset of the original dataset, mostly for computational and institutional reasons
explained in Section 6. This reduces the sample to around 27,000 firms.
6

end up being classified as bad loans within our sample.12 The average amount granted is around 370,000euros, and the average interest rate charged is 14.5%.
Panel B of Table 1 shows summary statistics for the 90 reporting banks. The average total asset level isalmost 11 billion, they employ 3,200 employees and have a share of bad loans over total loans of 6%. Theaverage bank is present in 34 provinces out of 95, but with great variation across banks.
The Centrale dei Bilanci (hereafter CB) collects yearly data on the balance sheets and income statementsof a sample of about 35,000 Italian non-financial and non-agricultural firms. This information is collectedand standardized by the CB, that sells these data to banks for their lending decisions. The unique feature ofthe CB data set is that, unlike other widely used data sets on individual companies (such as the Compustatdatabase of US companies), it has wide coverage of small and medium enterprises; moreover, almost all thecompanies in the CB sample are unlisted. The coverage of these small firms makes the data set particularlywell suited for our analysis, because informational asymmetries are potentially strongest for these firms.Initially, data were collected by banks themselves and transmitted to the CB. In time, the CB has increasedthe sample size drawing from balance sheets deposited with the chambers of commerce (limited liabilitycompanies are obliged to file their balance sheets to the chambers of commerce, that make them availableto the public). The database is fairly representative of the Italian non-financial sector. The firms in the CBsample represent about 49.4% of the total sales reported in the national accounting data for the Italian non-financial, non-agricultural sector. In addition to collecting the data, the CB computes an indicator of the riskprofile of each firm, which we refer to in the remainder of this paper as the SCORE. The SCORE representsour measure of a firm’s observable default risk. It takes values from 1 to 9 and is computed annuallyusing discriminant analysis based on a series of balance sheet indicators (assets, rate of return, debts etc.)according to the methodology described in Altman (1968) and Altman, Marco and Varetto (1994).
We define a borrowing firm as one that shows up as a borrower in the CR database. Non borrowing firmsare defined according to two criteria: they are not in the CR database and report zero bank borrowingin their balance sheets. We use the second definition to exclude firms that are not in our CR databasebut are still borrowing from banks, either from one of the non-reporting banks or through different loancontracts.13 Table 1, Panel C reports descriptive statistics for the sample of borrowing and non-borrowingfirms. Borrowing firms seem to have larger assets and sales. In terms of bank relations, borrowing firmshave on average around 3.5 credit lines active every year. They open one new line every year and close 0.6.Note that these firms are mostly new borrowers, so they are more likely to be in the process of expandingtheir number of relationships. The share of credit used from the main line is 72%, and it goes up to 76%when a firm borrows for the first year. This shows that focusing on the main line captures most of the creditthat firms borrow, especially for new firms.
There is ample evidence that firms, particularly small businesses like the ones in our sample, are tied totheir local credit markets. For instance, Petersen and Rajan (2002) and Degryse and Ongena (2005) showthat lending to small businesses is a highly localized activity as proximity between borrowers and lendersfacilitates information acquisition. Segmentation of local credit markets is thus very likely to occur. In our
12 See Section 2.1 for a complete definition of default.13 This implies that we exclude from our sample around 27,000 firms that borrow from banks not included in our sample, or
borrow from the banks in our sample but using a different type of loan.
7
market definition we will use provinces as our geographical units. Provinces are administrative unit roughlycomparable to a US county. They are a proper measure of local markets in banking for at least three reasons.First, this was the definition of a local market used by the Bank of Italy to decide whether to authorize theopening of new branches when entry was regulated. Second, according to the Italian Antitrust authoritythe ”relevant market” in banking for antitrust purposes is the province. Third, the bankers’ rule of thumbis to avoid lending to a client located at more than 1.4 (Degryse and Ongena (2005)) or 4 (Petersen andRajan (2002)) miles from the branch. In our data firms are on average 3.19 km (1.98 miles) far from thebranch of their main bank. At the time of our data, there were 95 provinces. We report summary statisticsof markets (defined more precisely below) in Panel D of Table 1, which shows that there are around 8 banksper province-year in our sub-sample, each bank has on average almost 14 branches per province, with amarket share of 7% for branches and 9% for loans.14 On average a bank has been in a province for at least21 years.15
Even though our dataset includes both borrowing and non-borrowing firms, we have no information onbanks’ rejections of applicants. For this reason we need to assume that all firms are offered an interestrate, or know the interest rate that each bank in their choice set would charge them, and then decide whichbank is their best alternative. In our model, a bank that classifies a firm as very risky will not reject it,but will be likely to offer it a very high interest rate. Combined Credit Register datasets of loans and loanapplication have only recently become available to researchers, as in Jiménez, Ongena, Peydró and Saurina(2014) for the case of Spain, but to the best of our knowledge there is no paper using loan applicationsfor our sample period in Italy. Albertazzi, Bottero and Sene (2014) was one of the first papers making useof loan applications in Italy for the 2003-2012 period. In that data a loan application is identified by anenquiry advanced by a bank to the Credit Register to obtain information on the current credit position of anew potential borrower, not currently borrowing from the bank. The authors classify a loan application to beapproved if a new loan is granted within three months since the information request, and rejected if no loanis granted. According to this definition, they find that 21% of the applications result in a new loan withinthe 3 months window. They also show that each firm in their sample receives on average 0.91 rejectionsin the 6 months prior to each information request. This definition of rejection doesn’t however rule outthe case of firms refusing to accept the bank’s offer, presented to the firm once the bank has obtained theinformation from the Credit Register and has decided on the interest rate to charge. Hence, this data doesn’tallow to distinguish between banks’ rejections and firms’ offer refusal, so it is hard to know with certaintyhow relevant actual rejections are in our context.
2.1 Default Definition
Following Panetta et al. (2009), the definition of default in our data includes firms in liquidation or otherbankruptcy proceedings, and those that have not paid repayment installments on loans for at least six months.This corresponds to a default warning that any bank can file to the Italian Credit Register for any of its
14 The market share of the outside option, defined by the firms that choose not to borrow, is on average around 30%.15 We start counting the years from 1959, which is the first year that we observe in the branching data.
8

Table 1: Summary Statistics
Variable Obs Mean Std. Dev. Obs Mean Std. Dev.
Panel A: Demand 27,128 0.69 0.46Loan Level Loan Use 18,820 246.5 442.6
Default 18,820 0.06 0.24Amount Granted 18,820 368.9 474.8Interest Rate 18,820 14.49 4.62
Panel B: Total Assets 900 10,727 16,966Bank Level Employees 896 3,180 4,583
Bad Loans 893 6.2 6.3Number of Provinces 861 34.54 30.19
Panel C: Borrowing Firms Non-Borrowing FirmsFirm Level Total Assets 18,820 11,244 19,139 8,308 3,553 8,105
Intangible/Tot Assets 18,820 0.16 0.22 8,308 0.21 0.28Profits 18,820 1,028 3,052 8,308 288 1,438Cash Flow 18,820 670 2,187 8,308 260 1,221Sales 18,820 14,174 22,927 8,308 4,901 11,247Trade Debit 18,820 1,676 3,397 8,308 754 3,161Firm’s Age 18,820 12.75 12.68 8,308 10.69 11.96Score 18,820 5.37 1.79 8,308 4.76 2.16Branch distance (km) 18,820 3.19 7.22Number of Lenders 72,573 3.45 2.55Lines Opened 72,573 1.15 1.69Lines Closed 72,573 0.64 1.25Share of Main Line 58,848 0.72 0.26Share of Main New Line 14,732 0.76 0.25
Panel D: Number of Banks 666 7.93 3.99Market level Number of Branches 5,284 13.82 21.21
Share of Branches 5,284 0.07 0.09Years in Market 5,284 21.38 14.23Market Shares 5,284 0.09 0.09
Note: In Panel A an observation is a firm for the first variable and a loan contract for the others. Demand is a dummy for takinga loan or not, loan use is the amount of loan used in thousands of euros, default is a dummy for a firm having any of its loansclassified as bad within the next three years, amount granted is in thousands of euros. In Panel B an observation is a bank-year.Employees is the number of employees at the end of the year. Bad loans is a percentage of total loans. In Panel C an observationis a firm for the first 9 variables and a firm-year for the others. The Score is the indicator of the risk of the firm computed eachyear by the CB (higher values indicate riskier companies). Number of Lenders is the number of banks from which the firm borrowsthrough these credit lines. The last two variables represent the ratio of credit utilized from the main line over total credit utilized,when credit utilized is non-zero. In Panel D an observation is year-province for the Number of Banks, and bank-year-province forthe other variables. Number and Share of Branches are per bank-province-year, Years in Market are the number of years a bank hasbeen in a province for since 1959. Market Shares are in terms of number of borrowers.
9

borrowers. This warning cannot be filed for a single loan overdue, but it’s rather the result of a negativeevaluation that a bank has of the borrower’s overall financial situation, even prior to a legally certifiedbankruptcy status.16 This implies that banks classify these firms’ loans as irrecuperable, defaulting firmsare unable to repay all of their loans and end up exiting the credit market. We find that 80% of the firmsthat default within our sample exit the sample in the same year, and 16% in the following year.17 There isinstitutional and anecdotal evidence18 that when one bank sends this kind of default warning to the CreditRegister it has a ”domino effect” on all other loans with any other bank that the defaulting firm has. Mostimportantly, according to the Italian Civil Code, this default warning remains in the Credit Register as publicinformation available to all banks for the following 10 years, compromising a defaulting firm’s access tocredit from any bank for that period of time.
Among the new borrowers that we focus on, we find that 54% of the firms that end up defaulting receive adefault warning and exit the credit markets within 2 years of their first loan, and another 24% within 4 years.Given the low number of defaulters per year, and the short time period between the first loan and subsequentdefault, we choose to focus just on the first year of a loan and classify as defaulter a firm that will eventuallydefault within 3 years in our sample. We choose the 3 years limit because we can trace a firm’s default until2001, 3 years after the end of our loans’ sample, reducing issues connected with right censoring of our datafor firms that start borrowing towards the end of our sample.
2.2 Price Construction
A crucial empirical challenge that we face when connecting the dataset we use to our model set up concernsprice prediction. On one hand, we don’t observe prices for loans in a firm’s choice set that didn’t take place,so we need to predict those interest rates based on the observables we have. On the other hand, one of themain determinants of loan prices is borrowers’ riskiness perceived by banks, which is predicted by lendersfrom a combination of hard information, which we observe in the data, and soft information, which we don’tobserve. As a consequence, we cannot assume with certainty that we have the same information set as eachbank about each borrower.
Whether the information gap between us and the lenders becomes a problem for our findings depends onhow much soft information matters, relative to hard information, for banks to price risk. We adopt severalstrategies to limit the extent of this problem. First of all, we just consider the first year in which a firm bor-rows in the sample, excluding the initial year in our data (1988). The advantage of this approach, introducedin the insurance context by Chiappori and Salanié (2000) among others, is that it limits the information gapbetween the econometrician and the lender, as we just consider borrowers that approach a bank for the firsttime. The second point is to select the best model for price prediction among a variety of alternatives,19
based on institutional and anecdotal evidence, and to test the statistical and economic significance of theresiduals of this pricing regression as explanatory variable in a default equation. This allows us both to
16 Source: Bank of Italy’s informative note (Circolare) n. 139 of 11/02/1991.17 The remaining within 4 years.18 Source: www.tuttocentraledeirischi.it, support web page for borrowers dealing with the Credit Register.19 For alternative ways of predicting prices see Gerakos and Syverson (2015).
10

identify the hard information that best predicts prices, and to investigate how much this hard informationexplains ex post risk compared to soft information, captured by the residuals of the pricing regression. Thethird point is comparing our findings to the existing literature in corporate finance and empirical bankingon loan pricing models. Last, we discuss the possible implications for our results of an inaccurate priceprediction.
Before describing the modeling strategy we use to predict prices, it is important to give an institutionaloverview of how banks determine interest rates for new borrowers in this market. The datasets we useare the main sources of hard information used by the banks in our sample. The Credit Register providesbanks with information about firms’ financial situation, whereas the Centrale dei Bilanci provides bankswith a detailed archive of firms’ balance sheet information. As described in Cerqueiro, Degryse and Ongena(2011), banks use both hard and soft information to determine their lending policies. The authors show thatfor US data the importance of each factor depends on loan and borrower characteristics, as well as locallending markets, and borrower-lender relationship.
To describe the institutional features of the Italian lending market we rely on the results of a survey con-ducted by the Bank of Italy of over 300 Italian banks in 2007 about banks’ organization of lending, summa-rized in Albareto, Benvenuti, Mocetti, Pagnini and Rossi (2011). Several features of this survey are relevantfor our analysis. First, the survey shows that larger banks, which are the ones we have in our data, are morelikely to use hard information and standardized scoring techniques. Second, large banks have on averagetwice the number of layers of hierarchy between the top management and the branch managers compared tosmall banks. Therefore, large banks tend to give less independence to branch managers in lending policiesdue to the difficulties both in monitoring managers’ actions and in managers’ ability to credibly transmitsoft information about borrowers to the top management. Multiple layers of hierarchy also imply that largebanks allow for shorter terms of office for branch managers, to avoid branch managers to develop relation-ships with local borrowers and derive private benefits from these. Both of these aspects limit the extent towhich soft information can be used by large banks in their lending policies. Last, large banks are asked tolist in order of importance the factors they consider in assessing creditworthiness of a new loan applicant.Banks’ ranking turns out to be the following: (i) Financial statement data (i.e. hard information from Cen-trale dei Bilanci), (ii) Credit relations with the entire system (i.e. hard information from the Credit Register),(iii) Statistical-quantitative methods, (iv) Qualitative information (i.e. bank-specific soft information, codifi-able data), (v) Availability of guarantees, (vi) First hand information (i.e. branch-specific soft information).This ranking portrays the key role played by hard information for large banks when dealing with new bor-rowers. The survey shows that for small banks instead soft information is much more relevant, even thoughstill less important than the first two forms of hard information.
Two other interesting features for our set up emerge from that survey. First, the importance of credit scoringin banks’ lending policies (including pricing), and second, the use by banks of both sales and loan sizeto segment borrowers into size classes. The survey highlights that 70% of large banks are organized bydivisions, with customers segmented by size and typically divided into SMEs and large firms. The variablecommonly used for segmenting firms is sales. Therefore, we control for both Score and sales in our pricingand default regressions.
Our model selection for a loan-pricing model is based on OLS pricing regressions where we progressively
11

include controls from our dataset, as shown in Table 2.20 The subset of the data we use only includes thefirst year in which a firm appears in our sample, and every firm in its first year borrows on average from justbelow 2.8 banks. In the first 3 columns of Table 2 we show the results from progressively including just year,province, and bank fixed effects. We will eventually also allow for the triple interaction of year-province-bank fixed effects. From column (4) onwards we start including firm and loan specific controls, first linearlyas continuous variables and then with fixed effects. The firm-level variables we include in regressions (4)and (5) were the only statistically significant controls that we found. Starting from column (4) we also addthe log of deposit costs.21 We introduce firm fixed effects in the last specification (6).
The only loan level characteristic that we control for is the amount granted, which we assume to be exoge-nous and determined by the liquidity needs a firm expects to have for that specific year. We will discusslater in greater detail this assumption of exogenous amount granted, justified by the non-exclusive natureof these lending contracts. For now, supporting evidence of this claim is given by the negative relation-ship between amount granted and interest rates shown in columns (4) to (6) of Table 2, which implies thatin absence of exclusivity no convex price schedule can be implemented, because if interest rates rise withthe amount borrowed, borrowers can ”linearize” the schedule by opening several credit lines with multiplebanks (Chiappori and Salanié (2013)). We don’t have other loan level information as these contracts areyearly uncollateralized credit lines, and exhibit therefore no heterogeneity in maturity, collateral, covenantsand/or other features. We control for loan amount both linearly and using fixed effects. The decision todiscretize the distribution of amounts granted comes from the empirical distribution of these loans shown inFigure 1, as it appears to have a significant number of observations around a few mass points. For example,over 40% of the loans we consider are of either exactly e50,000, e100,000, or e200,000.
20 We also experimented with using a LASSO regression, but it didn’t improve our results as we mostly rely on fixed effects inour preferred specification.
21 This variable is a proxy for deposit costs that a bank faces in a year-province. It is constructed as a combination of year-regionlevel average deposit rates and the share of branches that each bank has in each province-year.
12

Figure 1: Distribution of Amount Granted
05
10
15
Perc
ent
0 100 200 300 400 500
Amount Granted
Note: Amount Granted is in thousands ofe. 15% of observations abovee500,000 have been excluded to simplify the interpretationof the graph.
13

Table 2: Reduced Form Pricing OLS regressions
Variables (1) (2) (3) (4) (5) (6)Constant 16.09∗∗∗ 15.39∗∗∗ 15.85∗∗∗ 16.29∗∗∗ 15.39∗∗∗ 16.00∗∗∗
(0.07) (0.15) (0.28) (0.17) (0.13) (0.10)Sales - - - -0.10∗∗∗ -0.09∗∗ -
(0.04) (0.04)Total Assets - - - 0.17∗∗∗ 0.19∗∗∗ -
(0.05) (0.06)Net Assets - - - -0.63∗∗∗ -0.65∗∗∗ -
(0.17) (0.19)Short Term Debt - - - -0.76∗∗∗ -0.86∗∗∗ -
(0.21) (0.25)Profits - - - -0.14∗∗∗ -0.11∗ -
(0.06) (0.06)Cash Flow - - - 0.29∗∗∗ 0.26∗∗∗ -
(0.07) (0.08)Leverage - - - -0.04∗∗∗ -0.04∗ -
(0.02) (0.02)Distance to Branch - - - 0.00 0.00 0.00
(0.00) (0.00) (0.00)Log of Deposit Costs - - - 0.10∗∗∗ - 0.11∗∗∗
(0.02) - (0.02)Amount Granted - - - -2.40∗∗∗ -2.42∗∗∗ -
(0.04) (0.05)50,001-100,000 - - - - - -0.91∗∗∗
(0.09)100,001-150,000 - - - - - -1.55∗∗∗
(0.09)150,001-200,000 - - - - - -1.98∗∗∗
(0.10)200,001-300,000 - - - - - -2.18∗∗∗
(0.10)300,001-400,000 - - - - - -2.63∗∗∗
(0.10)400,001-500,000 - - - - - -2.87∗∗∗
(0.11)500,001-1,000,000 - - - - - -3.05∗∗∗
(0.10)1,000,001-3,000,000 - - - - - -3.46∗∗∗
(0.12)Sector FE No No No Yes Yes NoScore FE No No No Yes Yes NoYear FE Yes Yes Yes Yes No NoProvince FE No Yes Yes Yes No NoBank FE No No Yes Yes No YesBank-Year-Province FE No No No No Yes NoFirm FE No No No No No YesR2 0.2025 0.2275 0.2562 0.3029 0.4045 0.7000N obs. 92,602 92,602 92,602 92,596 92,596 92,602
Note: An observation is a firm-bank. This sample only includes the first year that a firm appears in our sample, excluding the firstyear 1988. Standard errors are clustered at the bank-province-year level. Firm controls for regressions (4) and (5) are rescaledto interpret the coefficients more easily: the linear term for Amount Granted is in e10,000, Sales, Total Assets, Net Assets andShort Term Debt are in millions of e, Profits and Cash Flow are in e100,000. Based on statistical significance and sub-sectorhomogeneity, we construct the Sector fixed effects grouping sectors into 3 categories: Primary for primary, minerals’ extraction,chemicals, metals, energy; Manufacturing for food and beverages, textile and clothing, wood and paper and publishing, mechan-ical and electronic machines, production of transport vehicles, other manufacturing, constructions; Commerce and Services forcommerce of transport vehicles, other commerce, hotels and restaurants, transports and storing and communications, real estate,financial intermediaries, public administration.
14

Based on the price regressions presented above, we now investigate whether the unexplained variation inprices is a predictor of subsequent firms’ default. We want to choose the pricing model that minimizesthe part of unexplained price variation which correlates with ex-post risk. For this reason we predict theresiduals from each of the regressions above, and use them as explanatory variable in a default regression.We use a linear probability model for ease of interpretation, but estimates from a discrete choice regressionyield similar results. For each specification we use the same controls as in each pricing equation, apart from(6) as firms default on all lines almost simultaneously, so we have one observation per firm and cannot usefirm fixed effects anymore. As shown in Table 3, we find that in all but one specifications the residuals havea positive and significant effect on default, however this effect is economically very small. In specifications(1) to (5) we find that 1 standard deviation increase in the residuals increases default by a range between7.5% and 4.2% of its standard deviation. These results provide evidence that only the pricing residuals fromthe last specification (6) are uncorrelated with firms’ defaults.
Table 3: Reduced Form Default OLS regressions
Variables (1) (2) (3) (4) (5) (6)Residual 0.004∗∗∗ 0.003∗∗∗ 0.003∗∗∗ 0.003∗∗∗ 0.003∗∗∗ 0.001
(0.000) (0.000) (0.000) (0.000) (0.000) (0.001)Residual t-stat 14.23 12.55 12.41 9.79 7.90 0.94Residual Mean 0.16 0.12 0.11 0.14 0.13 -0.02Residual SD 4.45 4.39 4.32 4.20 3.86 2.17Default Mean 0.06 0.06 0.06 0.06 0.06 0.06Default SD 0.24 0.24 0.24 0.24 0.24 0.241 Residual SD vs % of 1 Default SD 7.4% 5.5% 5.4% 4.6% 4.2% 0.1%
Amount Granted FE No No No No No YesSector FE No No No Yes Yes YesScore FE No No No Yes Yes YesFirm Controls No No No Yes Yes YesYear FE Yes Yes Yes Yes No NoProvince FE No Yes Yes Yes No NoBank FE No No Yes Yes No NoBank-Year-Province FE No No No No Yes Yes
R2 0.0285 0.0504 0.0564 0.0959 0.3219 0.3210N obs. 35,319 35,319 35,319 35,316 35,316 35,316
Note: An observation is a firm-bank. Standard errors are clustered at the bank-province-year level. All the specifications are thesame as in Table 2, apart from column (6).
15

We decide to use regression (6) as our baseline pricing model for three main reasons. First, it has thebest predictive power in terms of R2 among all the models we experimented with. Second, its pricingresiduals are uncorrelated with firms’ default, implying that the price variation unexplained by our modeldoesn’t convey any soft information that the bank uses to price risk. Third, the firm fixed effects in thepricing regression control for any firm-level unobservables that would otherwise cause selection bias. Weshow the overlap of the kernel densities of actual and predicted prices for borrowing firms in Figure 2.Another important dimension to consider to evaluate our price prediction is the comparison with the existingliterature. The dispersion of loan interest rates offered by banks to small and medium enterprises has beendocumented in various papers in the empirical banking literature (Petersen and Rajan (1994), Berger andUdell (1995), Degryse and Ongena (2005)). According to Cerqueiro et al. (2011) it is actually an empiricalregularity that contracted loan rates are typically difficult to predict. The authors estimate a loan-pricingmodel and compare their model fit to various papers that attempted to construct similar models using lender,borrower and contract information. They find an R2 of 25%, whereas Petersen and Rajan (1994) obtainedan R2 of 14.5%. Degryse and Ongena (2005) get an R2 of 22%, but this increases to 67% when they focuson larger loans (above $ 50,000), and decreases to 1% for smaller loans (below $ 5,000). We obtain an R2
of 70%.
Figure 2: Kernel Densities Comparing Actual and Predicted Prices
0.0
5.1
0 10 20 30 40
x
Actual Price Predicted Price
The pricing regression we are running for a firm i borrowing from bank j at price Pij takes the following
16

form:
Pij = γ0 + γ1Z′ij + λj + ωi︸ ︷︷ ︸Pij
+εij , (1)
where ωi and λj are firm and bank fixed effects, and Z ′ij includes amount granted, distance between firmsand banks, and deposit costs. We omit market m and time t subscripts, as each firm appears only in onemarket at one point in time. Using combinations of γ0, γ1, λj , and ωi we are able to predict prices Pij offeredto borrowing firms from banks they ended up not choosing. To predict prices offered to non-borrowing firmswe use propensity score matching, that is we match several borrowing firms to non-borrowing firms that aresimilar in observables’ space, and then randomly assign a borrowing firm’s ωi to a matched non-borrowingfirm. We assign the amount granted to non-borrowing firms using the same approach.22 A similar approachhas also been used in Adams, Einav and Levin (2009).
This method to predict prices and match borrowers to non-borrowers has two potential drawbacks. First, ourpricing model is able to explain around 70% of the variation in loan interest rates. Second, we can matchborrowers to non-borrowers that are similar in terms of observables, but the firm fixed effect we assign tonon-borrowers is a combination of the borrower’s observables and unobservables, and of course we cannotobserve the latter. These drawbacks can generate measurement error in the price, so we want to investigatethe potential direction of the bias in our main coefficients of interest, outlying here a stylized version of ourstructural model. We define a firm i’s utility from demanding (superscript D) from a bank j and defaulting(superscript F ) that just depend on price and unobservables. We decompose prices into what we can andcannot predict, where εij is the price variation unexplained by our regression, and νij is the measurementerror from a potential wrong assignment of firm fixed effects. We identify adverse selection as a positivecorrelation between the unobservables of these two equations:
UDij = αDPij + εDij= αD
[Pij + εij + νij
]+ εDij
= αDPij︸ ︷︷ ︸Hard informationobserved by bank
and econometrician
+ αD(εij + νij)︸ ︷︷ ︸Soft informationobserved by bank
but not econometrician
+ εDij︸︷︷︸Soft information
unobserved by bankand econometrician
UFij =︷ ︸︸ ︷αF Pij +
︷ ︸︸ ︷αF (εij + νij) +
︷︸︸︷εFij .
(2)
One of the features of this set up is a non-classical form of measurement error in prices identified by εij+νij .We observe in our data that εij + νij is uncorrelated with Pij , so following Pischke (2007) this yields toconsistent OLS estimates and correct standard errors. There is another more substantial concern related tothis measurement error in prices, that is the identification of adverse selection. Following the literature,we identify adverse selection with a positive correlation between the unobservables that drive demand anddefault. In this set up these unobservables are αD(εij + νij) + εDij for demand and αF (εij + νij) + εFijfor default. If there was no measurement error, we would interpret a positive correlation between εDij and
22 A detailed description of the matching model is in the Appendix.
17

εFij as adverse selection. As expected, what we find in our structural model is that αD < 0 and αF > 0,which means a negative correlation between αD(εij + νij) and αF (εij + νij). This implies that finding apositive correlation between unobservables in the presence of this kind of measurement error, as we find, isactually underestimating the true extent of adverse selection. Our positive correlation result can thereforebe interpreted as a lower bound to the true value of adverse selection.
3 Reduced Form Evidence
3.1 Asymmetric Information
We conduct some reduced form analysis to test for evidence of asymmetric information and to justify theuse of a structural model. To do so we follow the early empirical literature on positive correlation testsintroduced by Chiappori and Salanié (2000). We propose two tests, one based on the choice to take up aloan and another based on the choice of how much to draw on the credit line. Both tests are based on thecorrelation between the unobservables driving these choices and the unobservables influencing default. Thechoice of these tests gives a flavor of the identification strategy that we will rely on in the structural model,explained in Section 4.
3.1.1 Demand and Default
We start by investigating whether firms that are more likely to demand credit are also more likely to default.The CB dataset includes both firms borrowing and not borrowing, while we only observe default on the loanfor borrowing firms. We can formalize the problem as a two equations selection model:
di = 1(Xdi β + νi > 0)
fi =
{Xfi γ + ηi if di = 1
− if di = 0
(3)
where di is equal to 1 if the firm borrows and fi is equal to one if the borrower is a defaulter. fi is observedonly if di = 1. This is similar to the classical selection model analyzed by Heckman (1979), where weinterpret as adverse selection a positive correlation between ν and η.23 Results of this Heckman selectionmodel are reported in the first two columns (Extensive Margin) of Table 4, where the decisions to borrowand default are regressed on year, province, score, amount granted, and sector fixed effects, as well as ona set of relevant forms’ balance sheet variables. We use as instruments in the selection (i.e. borrowing)equation variables that satisfy the exclusion restriction, having a statistically significant effect on demandbut not on default: the number of banks in a firm’s market, as a proxy for banks’ competition, and age of
23 We estimate default as a linear probability model for ease of interpretation, but estimates from a discrete choice regressionyield similar results.
18

the firm, capturing a firm’s reputation and ability to negotiate with banks. We find a positive and signifi-cant correlation coefficient between the unobservables driving demand and default, which we interpret aspreliminary evidence of adverse selection on the extensive margin.
3.1.2 Loan Use and Default
We then consider the relationship between loan use and default. Differently from the previous subsection, weare not in a selection framework as the same firms are observed in both equations. Still, the idea is the same,as we test for a positive correlation between the unobservables that determine the choice of “coverage” (loanuse) and the occurrence of an “accident” (default), conditional on several firm characteristics. Following theintuition of the previous test, adverse selection should imply that riskier firms use more credit. We set upthe following seemingly unrelated regressions:
`i = Xiβ + εi
fi = Xiγ + ηi(4)
where `i is the amount of loan used, and fi takes value of one if the borrower is a defaulter. The vector ofcontrols Xi is composed of year, province, bank, score, amount granted, and sector fixed effects, as wellas on a set of relevant firms’ balance sheet variables. We specify the distribution of the residuals εi, ηi asjoint normal, with a correlation coefficient ρ. Positive and significant ρ suggests the presence of adverseselection. The results of this test are summarized in the last two columns (Intensive Margin) of Table 4. Weagain find a positive correlation, consistent with adverse selection on the intensive margin.
Based on these suggestive results, we estimate a structural model to measure the extent of adverse selectionin this market and its consequences for market outcomes. The structural framework has two main advan-tages compared to these reduced form tests. First, it has a more flexible residuals’ correlation structure thatallows us to estimate them jointly. Second, jointly with a supply side model we can use it to run counterfac-tual policy experiments to measure the consequences of adverse selection and imperfect competition. Weintroduce this model in Section 4.
19

Table 4: Reduce Form Evidence for Adverse Selection
Extensive Margin Intensive MarginVariables Demand Default Loan Use DefaultCorrelation between Unobservables 0.09∗∗ 0.032∗∗∗
(0.01) (0.000)
Constant -0.99∗∗∗ -0.01 -0.11 -0.06∗∗
(0.14) (0.02) (0.40) (0.03)Intangible Assets -1.44∗∗∗ -0.04∗∗∗ -0.20 -0.04∗∗∗
(0.07) (0.01) (0.14) (0.01)Ratio of Intangible Assets -0.40∗∗∗ 0.02∗∗ -0.12 0.02∗∗
(0.04) (0.01) (0.12) (0.01)Total Assets 0.66∗∗∗ 0.01∗∗∗ 0.32∗∗∗ 0.00∗∗
(0.02) (0.00) (0.03) (0.00)Sales 0.48∗∗∗ -0.00∗∗ -0.09∗∗∗ -0.00∗∗∗
(0.01) (0.00) (0.02) (0.00)Profits 0.45∗∗∗ 0.02∗ 0.58∗∗∗ 0.01
(0.05) (0.01) (0.12) (0.01)Cashflow -0.56∗∗∗ -0.03∗ -2.24∗∗∗ -0.02
(0.08) (0.01) (0.18) (0.01)Trade Credit -0.18∗∗∗ -0.00 -0.05∗∗∗ -0.00
(0.01) (0.00) (0.01) (0.00)Age of Firm 0.48∗∗∗ 0.02 -0.58∗∗∗ 0.01
(0.08) (0.01) (0.20) (0.01)N. of Banks in Market 0.05∗∗∗ - -0.00 0.00
(0.01) (0.02) (0.00)Price - - -0.02∗∗∗ 0.00∗∗∗
(0.01) (0.00)Distance to Branch - - -0.00 -0.00∗∗∗
(0.00) (0.00)
Year FE Yes Yes Yes YesProvince FE Yes Yes Yes YesBank FE No No Yes YesScore FE Yes Yes Yes YesAmount Granted FE Yes Yes Yes YesSector FE Yes Yes Yes Yes
R2 0.2601 0.1046 0.4345 0.1009N Obs. 25,101 18,820 18,820 18,820
Note: In each regression an observation is a firm. We rescale some variables for ease of interpretation. Intangible Assets, Sales,Total Assets, Profits, and Cashflow are in e100,000. Trade Debit is in e1,000,000. Age of Firm is in 100 years.
3.2 Imperfect Competition
We also provide some descriptive statistics on imperfect competition, the other friction in this market thatwe focus on. We construct a concentration index (HHI - Herfindahl-Hirschman Index) based on each bank’s
20

share of credit used within a province-year, and investigate its correlation with interest rates, conditionalon various sets of observables. We use as interest rates the predicted prices described in Section 2.2. Weshow with various specifications, summarized in Table 5, that concentration is positively and significantlycorrelated with interest rates, as expected. In our preferred specification in column 4, we find that a 10%increase in concentration is associated with a 0.05% increase in prices. In the first column we show thatthere is a positive and significant correlation between concentration and price within a year-province, andthat this holds also when controlling for bank fixed effects, as well as for bank-year and bank-province fixedeffects. Finally, the correlation becomes stronger once we control for loan amount and distance betweenfirm and banks, and for firm fixed effects.
Table 5: Reduced Form Evidence of Imperfect Competition
Variables (1) (2) (3) (4)Log HHI 0.004∗∗ 0.004∗∗ 0.004∗∗ 0.005∗∗∗
(0.002) (0.002) (0.002) (0.002)
Year FE Yes No No NoProvince FE Yes No No NoBank FE Yes No No NoBank-Year FE No Yes Yes YesBank-Province FE No Yes Yes YesLoan Controls No No Yes YesFirm FE No No No Yes
R2 0.3140 0.3198 0.4207 0.9416N obs. 285,734 285,734 285,734 285,734
Note: An observation is a firm-year-province-bank. Loan Controls include fixed effects for amount granted and distance betweenfirm and bank.
4 The Model
The framework we construct aims at quantifying the effects of asymmetric information on the demand forand supply of credit for Italian firms. In order to test for this, we assume that each firm i = 1, ..., I is willingto invest in a project and is looking for credit to finance it. Firms in each marketm and period t decide whichbank j = 1, ..., Jmt to borrow from, based on the conditions offered that maximize the expected "profits"24
of their choice. This determines the demand for credit. Conditional on demand, firms decide the amount ofcredit to use and whether to default or not. The supply of credit results from banks’ static Bertrand-Nashcompetition on interest rates, an assumption we motivate later in this section.
24 We will define these profits as utilities later on, to distinguish them from banks’ profits.
21

The theoretical model we develop is based on the following assumptions:
(1) Asymmetric Information: Following Stiglitz and Weiss (1981), we assume that the asymmetry ofinformation is on the riskiness of the firm, known by the firm but not by the bank, whereas thedistribution of riskiness among all firms is known by both. We identify this riskiness with the firm’sprobability of default. We let borrowers and lenders be risk neutral.
(2) First Year of New Loans: We limit our analysis to the first year of newly granted loans. This isa common assumption in empirical models of insurance with asymmetric information, starting fromChiappori and Salanié (2000). This is done to avoid modeling heterogenous experience ratings amongborrowers and loan renegotiation, as the focus of the paper is on first access to credit.
(3) Main New Credit Line: We just consider the choice of the main new credit line that firms open forthe first time within our sample. The main line is defined as the one from which the firm borrows themost. As shown by Detragiache et al. (2000), in Italy, multiple relationship banking is widely used byfirms to reduce liquidity risk. However, the share of the main credit line opened accounts on averagefor over 70% of the total amount of new yearly credit (both usable and used), justifying the choice ofthis simplifying assumption.25
(4) Exogenous Amount of Credit: We limit our analysis to the interest rate as the only screening device,as in Stiglitz and Weiss (1981). Therefore, we assume that the amount of credit granted from bankj to firm i is exogenously given by the firm’s project requirements, and that the bank just offers aposted interest rate for that specific amount to each firm i in each market m. In a standard insuranceor credit market with asymmetric information, insurers or banks are likely to compete not only onprices, but on other clauses of the contract as well. In our context, the amount granted could beanother dimension over which banks compete. In a world with lending exclusivity, banks can offermenus of amounts granted with matched interest rates to reduce the extent of asymmetric information,for example charging rates that increase more than proportionally with the amount granted. However,this is the case only with contract exclusivity, which is not a feature of our setting, where borrowerscan open multiple credit lines with different lenders. As explained in Chiappori and Salanié (2013),in absence of exclusivity no convex price schedule can be implemented, because if interest rates risewith the amount borrowed, borrowers can “linearize” the schedule by opening several credit lines withmultiple banks. Empirical evidence of non-exclusivity results also from the pricing regression in Table2, which presents a negative correlation between interest rates and the amount of credit granted.26 Wealso assume no collateral, as the type of loans we analyze are uncollateralized. We do however allowfor an endogenous amount of loan used.
25 We tried to make use of a borrower’s ranking of its lenders, in terms of amount used, for identification purposes. However,only a subset of the firms in our sample borrows from multiple banks, so we ended up not using this information.
26 We thank Pierre-André Chiappori for his suggestions on this point.
22
4.1 Demand, Loan Use and Default
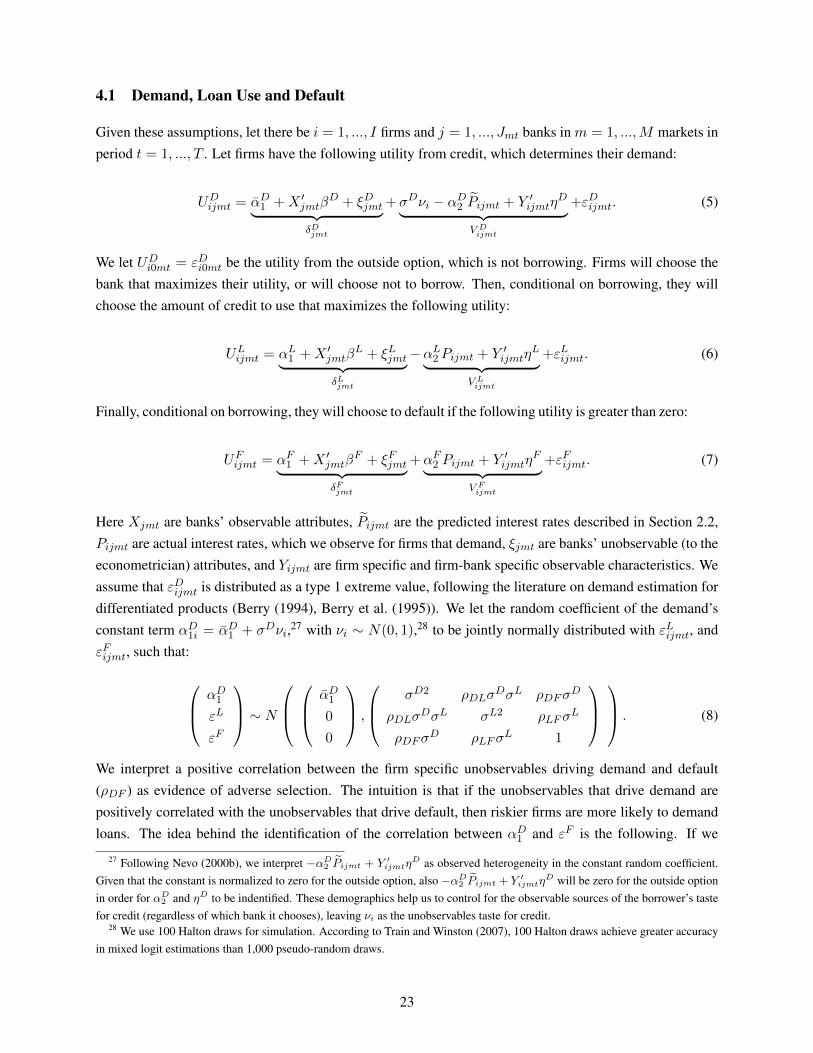
Given these assumptions, let there be i = 1, ..., I firms and j = 1, ..., Jmt banks in m = 1, ...,M markets inperiod t = 1, ..., T . Let firms have the following utility from credit, which determines their demand:
UDijmt = αD1 +X ′jmtβD + ξDjmt︸ ︷︷ ︸
δDjmt
+σDνi − αD2 Pijmt + Y ′ijmtηD︸ ︷︷ ︸
V Dijmt
+εDijmt. (5)
We let UDi0mt = εDi0mt be the utility from the outside option, which is not borrowing. Firms will choose thebank that maximizes their utility, or will choose not to borrow. Then, conditional on borrowing, they willchoose the amount of credit to use that maximizes the following utility:
ULijmt = αL1 +X ′jmtβL + ξLjmt︸ ︷︷ ︸
δLjmt
−αL2Pijmt + Y ′ijmtηL︸ ︷︷ ︸
V Lijmt
+εLijmt. (6)
Finally, conditional on borrowing, they will choose to default if the following utility is greater than zero:
UFijmt = αF1 +X ′jmtβF + ξFjmt︸ ︷︷ ︸
δFjmt
+αF2 Pijmt + Y ′ijmtηF︸ ︷︷ ︸
V Fijmt
+εFijmt. (7)
Here Xjmt are banks’ observable attributes, Pijmt are the predicted interest rates described in Section 2.2,Pijmt are actual interest rates, which we observe for firms that demand, ξjmt are banks’ unobservable (to theeconometrician) attributes, and Yijmt are firm specific and firm-bank specific observable characteristics. Weassume that εDijmt is distributed as a type 1 extreme value, following the literature on demand estimation fordifferentiated products (Berry (1994), Berry et al. (1995)). We let the random coefficient of the demand’sconstant term αD1i = αD1 + σDνi,27 with νi ∼ N(0, 1),28 to be jointly normally distributed with εLijmt, andεFijmt, such that:
αD1εL
εF
∼ N αD1
0
0
,
σD2 ρDLσDσL ρDFσ
D
ρDLσDσL σL2 ρLFσ
L
ρDFσD ρLFσ
L 1
. (8)
We interpret a positive correlation between the firm specific unobservables driving demand and default(ρDF ) as evidence of adverse selection. The intuition is that if the unobservables that drive demand arepositively correlated with the unobservables that drive default, then riskier firms are more likely to demandloans. The idea behind the identification of the correlation between αD1 and εF is the following. If we
27 Following Nevo (2000b), we interpret −αD2 Pijmt + Y ′ijmtηD as observed heterogeneity in the constant random coefficient.
Given that the constant is normalized to zero for the outside option, also −αD2 Pijmt + Y ′ijmtηD will be zero for the outside option
in order for αD2 and ηD to be indentified. These demographics help us to control for the observable sources of the borrower’s tastefor credit (regardless of which bank it chooses), leaving νi as the unobservables taste for credit.
28 We use 100 Halton draws for simulation. According to Train and Winston (2007), 100 Halton draws achieve greater accuracyin mixed logit estimations than 1,000 pseudo-random draws.
23

observe a firm taking out a loan, while the model tells us that this firm should be unlikely to take the loan,then this is a "high αD1 " firm. A positive correlation of αD1 with εF is evidence of adverse selection.
We interpret a positive correlation between the unobservables driving loan usage and default (ρLF ) as otherpossible evidence of adverse selection. The intuition is that if the unobservables that drive the choice of howmuch credit to use are positively correlated with the unobservables that drive default, then riskier firms willuse more credit. With this definition of adverse selection we are trying to capture the case in which a riskyfirm (high εF ), before signing the contract, already knows that due to its high εL it will use a higher share ofthe loan. However, our definition cannot rule out the case in which two ex-ante equally risky firms take thesame loan, and one of them is hit by a negative shock after the contract has been signed. This shock increasesεL for the firm that was hit, forcing it to use more of the loan.29 This is however not a major concern in ourcase, as we just focus on the first year of the firm-bank relationship, when firms are less leveraged as weshow in the next section. The correlation between unobservables driving demand and loan use (ρDL) doesn’thave a clear economic interpretation in terms of asymmetric information, but it’s important to estimate itjointly with the other elements of the variance-covariance matrix, to avoid capturing with ρDF and ρLF anypossible spurious correlation. The joint estimation of these parameters guarantees a better identification ofadverse selection compared to the reduced form estimates, where each correlation coefficient was estimatedseparately. Note that this identification strategy allows us to recover adverse selection parameters that arecommon across banks and markets, not bank or market specific.30
This set up builds on Einav et al. (2012), but differs in the specification of the demand utility. In ourcase, borrowers’ choices follow a multinomial distribution, instead of a binomial. This raises the issue ofcorrelating residuals from the demand model, which vary across borrowers and alternatives (i.e. lenders),to the residuals from the loan use and default models, which instead vary only across borrowers. We followthe approach of Ackerberg and Botticini (2002) and allow the normally distributed random coefficient onthe constant term to be correlated with the residuals from the loan use and default equations. We argue thatthis is a practical and intuitive solution, as it simplifies the problem and allows for a correlation betweenunobservables only at the level of the borrower. This implies that in the presence of adverse selection ariskier firm is more likely to demand from any lender, and not differently across different lenders.
We interpret as possible evidence of moral hazard a positive effect of interest rates on default (αF2 > 0),which implies that an increase in this relevant term of the loan contract makes it more likely for a borrower todefault. We provide this interpretation for αF2 because we use a control function approach that allows us toidentify the causal effect of interest rates on default,31 following Adams et al. (2009), and also because thiseffect is conditional on adverse selection, modeled through the correlation between unobservables.
Last, as usual in structural estimation, our framework is a compromise between tractability and modelingcomplexity. We attempted to introduce more structure into the model, following more closely Stiglitz andWeiss (1981)’s set up, but faced substantial identification problems. We therefore decided to rely moreclosely on the empirical literature on credit markets with selection (Einav et al. (2012)), and on demand for
29 In this case, ρLF could be interpreted as evidence of either adverse selection or moral hazard. See Abbring et al. (2003) fordistinguishing between those sources of asymmetric information.
30Extending the model to allow for heterogeneity across banks is scope for future research.31 See Section 6.2 for a detailed discussion on identification.
24

differentiated products (Berry (1994), Berry et al. (1995)), which also has its recent applications in bankingand finance (Ho and Ishii (2011), Koijen and Yogo (2015), Egan, Hortaçsu and Matvos (2015)). If on onehand our approach is closer to a more reduced form selection model, on the other it offers a good tractabilityand allows us to incorporate both imperfect competition and selection effects in a structural pricing equation.Based on this model we can implement several counterfactual exercises, that can offer relevant guidance forpolicy interventions.
4.2 Alternative Frictions
We interpret a positive correlation between demand for credit and firms’ riskiness as evidence of adverseselection. An alternative explanation is that such correlation arises because of agency issues between equityand debt holders. Jensen and Meckling (1976) show that debt financing gives rise to agency costs, causingfirms to make sub-optimal decisions to serve the shareholders’ interests. In our context this can imply riskshifting by firms with more debt, which in turn decreases the quality of firms’ projects and increases theirdefault probability. Another related plausible explanation for our results follows from Myers (1977), whoargues that firms with more debt are more likely to run into a debt overhang situation, declining to fundgood projects and increasing their default probability. Although theoretically possible, we believe that thesealternative explanations are unlikely to hold in our data for several reasons.
First, we rely on a sample of SMEs, most of which are owned and controlled by an individual or a family.32
In these firms, agency conflicts can only arise between the firm and the bank, as ownership is concentratedand bank debt is the main source of finance (together with trade credit).33 Typically, owners of family firmstend to immobilize a large portion of their overall wealth in the firm itself (Moskowitz and Vissing-Jorgensen(2002)) and, as a consequence, they undertake less risky, more conservative projects than a well diversifiedowner or an external CEO (Michelacci and Schivardi (2013)). Excessive risk taking is therefore unlikely toarise from the financial structure. Second, we focus on the main lender, which therefore has strong incentivesto exert monitoring and spot suboptimal investment choices. Third, we look at the first line of credit. Asshown in Table 6, we consider firms with a level of debt still relatively low, while the theories above applyto firms with a high level of leverage. Fourth, in all our regressions we control for various indicators ofincentives to engage in risk shifting, such as leverage (a measure of financial vulnerability), net worth, cashflows, profits and trade credit. Finally, Myers (1977) also suggests an easy way out from the suboptimalinvestments caused by agency costs, which is shortening debt maturity. He states that permanent debtcapital is best obtained rolling over short maturity debt claims, with continuous and gradual renegotiationthat allows the firm to switch to other sources of debt at any time. In our setting we do focus on a very shortmaturity form of debt. In fact, credit lines can be closed at any time by the bank, so the specific contractwe consider is less likely to give rise to the agency issues discussed above. Indeed, in our data, firms relymostly on short term bank debt and trade credit, which are both short term debts, thus reducing agency
32 Bugamelli, Cannari, Lotti and Magri (2012) show that 85.6% of Italian firms are family businesses, and in 66.3% of these thefamily also manages the firm, compared to the 25.8% in France, 28% in Germany, 35.5% in Spain, and 10.4% in the UK.
33 Barba Navaretti, Bugamelli, Schivardi, Altomonte, Horgos and Maggioni (2011) show that the share of venture capital inItalian firms’ external financing is between 0.35% and 0.52%.
25

concerns.
Table 6: Leverage for New vs Old Borrowers
Sample Obs Mean Std. Dev. 5th Pctile Median 95th Pctile
New Borrowers 54,014 0.503 0.914 0 0.554 0.997Old Borrowers 400,008 0.548 4.670 0 0.596 0.987
Note: An observation is a firm-year. Leverage is defined as a firm’s debt over its liabilities. New borrowers are firms that borrowfor the first year in our sample, old borrowers are firms borrowing from the second year onwards.
Another important aspect that might affect our results is the possibility that firms and banks adjust theirstructure of financing as asymmetric information varies. Again, although theoretically sound, this is unlikelyto play an important role in our data. As already discussed, SMEs finance their operations mostly throughbank loans. Equity markets were very underdeveloped in Italy during the years of our data (Demekas, Potterand Pradhan (1995)). There were less than 400 firms on the stock markets and SMEs where very unlikelyto list. Private equity financing was also very rare and the market of bonds for small firms non existent, alsodue to legal restrictions to bond issuance for SMEs. As such, firms had little alternative to bank debt, sothat it is unlikely that changes in the degree of asymmetric information could lead to substantial changes infirms’ financial choices.
4.3 Supply
On the supply side, we let banks set their interest rates competing à la Bertrand Nash. We assume that bankj’s expected profits from firm i in market m at time t are given by:
Πijmt = (Pijmt −MCijmt)Qijmt(1− Fijmt)−MCijmtQijmtFijmt
= PijmtQijmt(1− Fijmt)−MCijmtQijmt,(9)
where Qijmt and Fijmt are banks’ expectation of each firm’s demand and default. In particular, Qijmt isgiven by the model’s demand probability and the expected loan use, and Fijmt is the expected default ratefor each borrower. Pijmt is the posted price of the loan, and MCijmt are the bank’s marginal costs. It isimportant to note that Fijmt depends on price through two channels. First, equation (7) allows for a directimpact of the interest rate on firms’ default probabilities. Second, a higher interest rate also changes thecomposition of borrowers as stated in Assumption 1: increasing price increases the conditional expectationof αD1 , as low-utility-from-borrowing firms are more likely to self-select out of the borrowing pool. If ρDF >0, this implies that an increase in prices increases the probability of default of the pool of borrowers.
26

The first order conditions of this profit function deliver the following pricing equation:
Pijmt =MCijmt
1− Fijmt − F ′ijmtQijmtQ′ijmt︸ ︷︷ ︸
Effective Marginal Costs
+−(1− Fijmt)QijmtQ′ijmt
1− Fijmt − F ′ijmtQijmtQ′ijmt︸ ︷︷ ︸
Markup
, (10)
Note that the equilibrium price depends on what we define as "effective" marginal costs and on a markupterm. F ′ijmt is the derivative of the expected default with respect to the price, and Q′ijmt is the derivativeof the demand probability with respect to the price. Qijmt
Q′ijmtwould be the markup in a Bertrand-Nash model
with differentiated products and no asymmetric information. In fact if there was no default, i.e. Fijmt =
F ′ijmt = 0, we would be back to a standard equilibrium pricing equation for differentiated firms competingà la Bertrand-Nash as in Berry et al. (1995). We will analyze this equilibrium pricing equation in greaterdetail in the next section.
4.4 Monte Carlo
We construct a simple numerical example to give the intuition underlying the model’s predictions. Wesimulate data for the case of a monopolist bank facing i = 1, ..., I heterogeneous borrowers, observationallyequivalent to the bank. For simplicity, we concentrate on adverse selection between demand and default(ρDF ), setting loan use to 1 and ρDL = ρLF = 0. We keep this data fixed and vary both borrowers’price sensitivity, as a proxy for the strength of the effects of a competitive fringe on the bank’s (residual)demand curve, and the extent of asymmetric information, where ρDF < 0 means advantageous selectionand ρDF > 0 means adverse selection. For each of these cases we compute the bank’s equilibrium pricesbased on our model. Let borrower i have UDi utility from taking credit from the bank, UDi0 utility from notborrowing, and UFi utility from defaulting:
UDi = α1i + α2P + εi,
= α1 + σνi + α2P + εi,
UDi0 = εi0,
UFi = εi,
(11)
where P is the interest rate charged by the bank, εi, εi0 are distributed as type 1 extreme value, and νi ∼N(0, 1). We set σ = 2 and α1 = 1, and allow α1i and εi to be jointly normally distributed, with correlationcoefficient −1 ≤ ρ ≤ 1. We assume that all the borrowers have the same price sensitivity α2 < 0. Ourasymmetric information assumption implies that a bank doesn’t observe its borrowers’ individual defaultprobability, but only its distribution. As a consequence, it only offers one pooling price P for everyone.
27

Given this setup, the demand probability will be given by:
PrDi = Pr(α1i + α2P + εi > εi0)
= exp(α1i+α2P )1+exp(α1i+α2P )
= Λ(α1i + α2P ),
(12)
and we will construct the bank’s market share as S = 1N
∑i PrDi , where N is the number of borrowers of
the bank. Conditional on demand, the default probability is (Wooldridge (2002)):
PrF |D=1i = E
[Pr(F = 1|ν, P )|D = 1, P
]= 1
Λ(α1i+α2P )
∫ ∞−(α1i+α2P )
Φ
(ρν
σ2√1− ρ2
σ2
)φ(ν)dν,
(13)
and we will construct the bank’s share of defaulters as F = 1N
∑i PrFi . Given these probabilities and our
supply side model described in equations (9) and (10), the first order condition will deliver the followingequilibrium pricing equation:
P ∗ =MC
1− F − F ′ 1α2(1−S)︸ ︷︷ ︸
Effective Marginal Costs
+−(1− F ) 1
α2(1−S)
1− F − F ′ 1α2(1−S)︸ ︷︷ ︸
Markup
, (14)
where the first term on the right hand side represents what we define as "effective" marginal cost (EffMC),and the second term represents the markup (MKP). F ′ is the derivative of the expected default rate withrespect to price, and α2(1− S) is the derivative of the market share with respect to price.
The different effects of EffMC and MKP on the equilibrium price is crucial to understanding the interactionbetween asymmetric information and imperfect competition. This is displayed in Figures 3 and 4, wherethe top graph represents EffMC above and negative of the markup below, and the bottom graph showsequilibrium prices for a monopolist bank. We let these three elements vary across different degrees ofadverse selection, measured by ρ, and “competition”, measured by α2. In this example we are capturingcompetition versus the outside option, but we have verified that increasing the number of banks in the modelgives the same qualitative result.
Looking at Figure 3, for a high level of competition (i.e. rightmost point on the figure) an increase inadverse selection (moving to the northwest) causes EffMC to increase, whereas for low competition (pointclosest to the reader, again moving northwest) they remain relatively constant. The intuition for this resultis the following. Higher adverse selection implies higher correlation between borrowers’ willingness topay (WTP) and their riskiness. Hence, with strong competition only firms with high WTP will borrow,whereas with less competition even firms with low WTP will take credit, lowering the average riskiness ofthe pool of borrowers. The opposite happens for the markup curve as we increase adverse selection, becauseit remains nearly constant for high competition (rightmost point, moving to the northwest), but it decreasessubstantially for a low level of competition (closest point to the reader, moving to the northwest). The reasonfor this sharp reduction in markup with low competition as adverse selection increases is that the marginal
28
borrowers become the safest ones, implying a reduction in the banks’ market power to keep them. Finally,what the graph shows is that both an increase in adverse selection and an increase in competition reduces abank’s markup, implying that adverse selection has a mitigating effect on market power.
As shown in Figure 4, the combination of these two factors results in a non-monotonic equilibrium priceresponse to an increase in adverse selection. If on one hand the equilibrium price rises in a very competitiveenvironment (closest point to the reader, moving to the northeast), the opposite happens in a concentratedmarket (leftmost point, moving to the northeast). This is because in the first case the price depends more onEffMC than markup and the increasing EffMC drives the price up. In a highly competitive market wherebanks have a small price-cost margin, a higher price is the only possible response to an increase in adverseselection. In the second case, the price depends more on markup and the declining markup drives the pricedown. Banks with a higher price-cost margin will find it more profitable to reduce the price, as this willallow them to lower the average riskiness to their pool of borrowers.
This effect can be better understood focusing on how the denominator of EffMC and MKP varies differentlyin response to an increase in adverse selection, depending on the measure of competition α2. Higher adverseselection means higher default rates, therefore an increase in both the second (F ) and third (F ′ 1
α2(1−S) )terms of the denominator. On one hand a higher F reduces the denominator, pushing for an increase inprices, but on the other hand a higher F ′ raises the denominator, because α2 < 0. Whether the net effectof higher adverse selection is a higher or lower denominator depends on the relative importance of a bank’smarket power, determined by α2 in our setting. Low market power, or very strong competition with theoutside option (α2 → ∞), means that the effect of F dominates, so prices will increase in response toan increase in adverse selection. High market power, or very weak competition with the outside option(α2 → 0), means that the effect of F ′ dominates, so prices will decrease in response to an increase inadverse selection. In other words, market power weights the relative importance that banks’ give in theirequilibrium pricing to the marginal default response to an increase in prices.
In this simplified example the increase in adverse selection affects the derivative of default with respect toprices (F ′) only through the change in the correlation coefficient. However, in the structural model we willalso allow for another channel to affect F ′, that is the direct effect of prices on default. This effect can beinterpreted as moral hazard, as it measures how interest rates affect the default probability conditional onthe selection effect.
5 Econometric Specification
Following the model presented above, let m = 1, ...,M index a province, t = 1, ..., T a year, i = 1, ..., I
the firm, and j = 1, ..., Jmt be the bank/loan identifier in market m at time t. Let Yijmt be a vector of firmand firm-bank specific characteristics (firm’s balance sheet data, firm’s age, and firm’s distance to the closestbranch of each bank), and Xjmt a vector of bank-province-year specific attributes (number of branches inthe market, years of presence in the market, bank, year, and province fixed effects).
We estimate a system of three equations: demand for credit, amount of loan used, and default. For the
29

Figure 3: Adverse Selection vs Imperfect Competition - Effective Marginal Costs, negative Markups
−0.8−0.6
−0.4−0.2
00.2
0.40.6
0.8 −1
−0.9
−0.8
−0.7
−0.6
−0.5
−0.4
−0.3
−15
−10
−5
0
5
10
Price Sensitivity
Adverse Selection
Mark
up, A
vera
ge C
osts
Note: The vertical axis shows the value of effective marginal costs and of the negative of the markup. The left horizontal axis is levelof adverse selection, increasing towards left. The right horizontal axis is the level of price sensitivity (our measure of competitionwith the outside option), increasing towards the right.
Figure 4: Adverse Selection vs Imperfect Competition - Equilibrium Prices
−1−0.8
−0.6−0.4
−0.20
0.20.4
0.60.8
1
−7
−6
−5
−4
−3
−2
−1
0.5
1
1.5
2
2.5
3
Adverse SelectionPrice Sensitivity
Equili
brium
Prices
Note: The vertical axis shows the level of equilibrium prices. The left horizontal axis is level of price sensitivity (our measureof competition with the outside option), increasing towards the right. The right horizontal axis is the level of adverse selection,increasing towards right. The axis definitions in this figure differ from those in Figure 3 to better display the effects in each.
30

demand model we use a 2-step method based on maximum simulated likelihood and OLS, as in Train (2009).In the first step we estimate the firm-level parameters η = {αD2 , αL2 , αF2 , ηD, ηL, ηF }, bank-level parametersfor loan use and default βLF = {αL1 , αF1 , βL, βF } and the elements of the variance-covariance matrixΣ = {σD, σL, ρDF , ρDL, ρLF } from the firms’ choice probabilities. This specification builds on Einav etal. (2012), but differs from them as we estimate demand using a mixed logit with random coefficients, ratherthan a probit. We also recover the lender-province-year specific constants for the demand model δDjmt usingthe contraction method introduced by Berry et al. (1995).34
The probability that borrower i in market m at time t chooses lender j is given by:
PrDijmt =
∫ [ exp(δDjmt(Xjmt, ξDjmt, α
D1 , β
D) + V Dijmt(Pijmt, Yijmt, σ
D, αD2 , ηD))
1 +∑
` exp(δD`mt(X`mt, ξD`mt, α
D1 , β
D) + V Di`mt(Pi`mt, Yi`mt, σ
D, αD2 , ηD))
]f(αD1i|θ)dαD1i,
(15)
where f(αD1i|θ) is the density of αD1i, and θ are the parameters of its distribution that we want to estimate.Looking at the second equation, the amount of credit used conditional on borrowing, the probability ofobserving a utilization of Lijmt is given by:
PrLijmt,L=L∗|D=1 = E[Pr(Lijmt = δLjmt + V L
ijmt + εLijmt|αD1i)|D = 1]
=
∫ φεLijmt
|αD1i
(Lijmt−δ
Ljmt(Xjmt,ξ
Ljmt,α
L1 ,β
L)−V Lijmt(Pijmt,Yijmt,αD2 ,η
L)−µεLijmt
|αD1i
σεLijmt
|αD1i
)σεLijmt
|αD1i
f(αD1i|θ)dαD1i,
(16)
where εLijmt|αD1i ∼ N(σLρDLνi︸ ︷︷ ︸µεLijmt
|αD1i
, σ2L(1− ρ2DL)︸ ︷︷ ︸
σ2
εLijmt
|αD1i
)
where φ is a standard normal pdf. Finally, the probability of default conditional on taking a loan is:
PrFijmt,F=1|D=1,εLijmt
=
∫ΦεFijmt|α
D1i,ε
Lijmt
(δFjmt(Xjmt, ξ
Fjmt, α
F1 , β
F ) + V Fijmt(Pijmt, Yijmt, αF2 , η
F )− µεFijmt|αD1i,ε
Lijmt
σεFijmt|αD1i,ε
Lijmt
)f(αD1i|θ)dαD1i,
(17)
34 We are unable to use the contraction for loan use and default as we have many zeros in loan use and default lender-province-year specific shares. For this reason, and due to the smaller number of observations in loan use and default compared to demand,we let δLjmt = αL1 + X ′jmtβ
L + ξLj + τLmt and δFjmt = αF1 + X ′jmtβF + ξFj + τFmt, where ξLj , ξ
Fj are bank fixed effects and
τLmt, τFmt are province-year fixed effects.
31

where εFijmt|αD1i, εLijmt ∼ N(AσDνi +BεLijmt︸ ︷︷ ︸µεFijmt
|αD1i,εLijmt
, σ2F − (AρDF +BρLF )︸ ︷︷ ︸σ2
εFijmt
|αD1i,εLijmt
)A = ρDF σ
2L−ρLF ρDLσ2Dσ2L−ρ2DL
B = −ρDF ρDL+ρLF σ2D
σ2Dσ2L−ρ2DL
where the residuals εFijmt are conditional on demand and loan amount unobservables. The joint estimationof these three choice equations through maximum simulated likelihood only delivers the parameters in η,βLF and Σ, based on the following log-likelihood function:
logL =∑i
dijmt{log(PrDijmt) + log(PrLijmt) + fijmt log(PrFijmt) + (1− fijmt) log(PrFijmt)} (18)
where dijmt is the dummy for the choice by firm i of bank j in market m at time t, and fijmt is the dummyidentifying its default.
In the second step, the estimated constants δDjmt are the dependent variables of OLS regressions that recoverthe parameters βD = {αD1 , βD} of the bank specific attributes Xjmt. Following Berry et al. (1995), thecontraction method on the demand side finds the δD that equate predicted market shares SDjmt to actualmarket shares SDjmt. This iterative process is defined by:
δD,r+1jmt = δD,rjmt + ln
(SDjmt
SDjmt(δD,rjmt)
). (19)
The predicted market shares are defined as SDjmt =∑
i PrDijmt/Nmt, where Nmt are the number of firms inmarket m at time t. Given the value of these constant terms, the parameters αD1 , β
D are estimated usingOLS:
δDjmt = αD1 +X ′jmtβD + ξDjmt, (20)
with ξDjmt being the mean zero structural econometric error term.
6 Estimation
6.1 Constructing the Sample
As already mentioned, we focus on the first line of credit that a firm opens (at least within our dataset),excluding the first year (1988) to avoid left censoring. We do this to concentrate on new borrowers, where
32

we expect to find stronger asymmetric information, and because modeling the evolution of the borrower-lender relationship is beyond the scope of this paper.35 Following other papers on Italian local credit markets,like Felici and Pagnini (2008), Bofondi and Gobbi (2006), and Gobbi and Lotti (2004), we identify bankingmarkets as the Italian provinces, also used by Italian supervisory authorities as proxies for the local marketsfor deposits and loans to SMEs.36 Our markets are then constructed as province-year combinations. Weassume that each firm’s choice set is defined by all the banks that are actively lending in its province.37
The observable explanatory variables that determine firm’s demand, loan use and default choices are firmand bank characteristics, previously summarized in Table 1. In the first set of regressors we include firms’total assets, the ratio of intangible over total assets, profits, cash flow, sales, trade debit, firm’s age, distancefrom the closest branch, and interest rates. Trade debit is the debit that the firm has with its suppliers orclients. We also include score, sector, and loan amount fixed effects. In the demand model we estimatebank-year-province fixed effects with the contraction method explained above. In the second group we usebank’s share of branches in the province, number of years the bank had at least one branch in the province.For the second step of the demand model we control for bank, year, and province dummies, whereas in theloan use and default models we allow for bank and year-province fixed effects. We motivate the choice ofthese explanatory variables in Section 6.3.
We estimate our structural model on a subset of the original dataset, mostly for computational and insti-tutional reasons. Cohen and Mazzeo (2007) define a local banking market as a geographic area whereconsumers don’t choose lenders outside their province, that means that the market cannot be too small, andthat doesn’t include distinct or overlapping markets within, implying that the market cannot be too big.Based on this and on our assumption that the choice set of a borrowing firm is given by the banks activelylending in its province, out of an initial sample of 977 year-province combinations we drop approximatelythe first and last decile of their size distribution, in terms of number of observations.38 This leaves us with666 markets, around 66% of the original number of markets.
6.2 Identification
As described in Section 2.2 and in the Appendix, we impute the prices that we don’t observe in the data usingpropensity score matching (PSM), where we match borrowers to non-borrowers based on the probability ofborrowing, defined as:
Pr[Dimt = 1|Mimt] = Φ(Mimtτ), (21)
35 A more extensive description of the construction of the sample is in Appendix A.36 See Ciari and Pavanini (2014) and Guiso et al. (2013) for a detailed discussion on the definition of local banking markets in
Italy.37 As many other papers estimating demand for differentiated products, we face the problem of zero market shares causing the
second stage IV estimation to deliver inconsistent estimates, as described in Gandhi, Lu and Shi (2013). We deal with this excludingfrom the borrowers’ choice set banks with non-zero branches but with zero market shares in a local market.
38 To improve the convergence of the contraction mapping we also eliminate markets with zero or close to zero market share ofthe outside option.
33

where Mimt ⊂ Yijmt is the subset of the firm observables Yijmt that pass the PSM tests for a good match.We then run the following regression to predict prices for firm i with bank j in market m at time t:
Pijmt = γ0 + γ1dij + γ2Lij + γ3Zjmt + λj + ωi︸ ︷︷ ︸Pijmt
+εijmt, (22)
where Pijmt are actual prices, Pijmt are predicted prices, dij is distance from the branch, Lij are dummiesfor the size of the amount granted, Zjmt are deposit costs, λj are bank fixed effects, ωi are firm fixed effects,and εijmt are residuals. We use Φ(Mimtτ) to assign borrowers’ ωi to non-borrowers. We then use predictedprices Pijmt to estimate demand based on the following utility function:
UDijmt = αD1i − αD2 Pijmt + Y ′ijmtηD + δDjmt + εDijmt, (23)
where αD1i = αD1 + σDνi, with ν ∼ N(0, 1), is a random coefficient on the constant and Yijmt includesfirms’ balance sheet information, distance from bank branches, and size of amount granted. In this demandmodel the only identifying variation in Pijmt is given by ωi, because within each firm all of the variation inPijmt is absorbed by dij , Lij , δDjmt, leaving αD2 to be only identified by variation in ωi across firms with thesame observables. A potential endongeneity concern is given by the correlation between ωi and εDijmt. Weovercome this relying on the standard assumption in PSM of conditional independence between treatmentand outcome conditional on the propensity score (Caliendo and Kopeinig (2008)), which in our case meansassuming that ωi and Dimt are independent conditional on Φ(Mimtτ).
We also worry that actual interest rates, which we observe and use for the loan use and default equations,might be correlated with loan use and (in particular) default unobservables. To address this potential endo-geneity concern we use a control function approach, following Train (2009) and Adams et al. (2009). Weuse deposit costs as instruments, as they are correlated with interest rates (see Table 2), but are unlikely to becorrelated with loan use and default unobservables. We proceed regressing interest rates Pijmt on the sameobservables that we use for loan use and default, plus the instruments. We then use the residuals from thispricing regression uijmt as controls in the following utility from choosing how much loan to use and utilityfrom defaulting:
ULijmt = αL1 +X ′jmtβL + αL2Pijmt + αL3 uijmt + Y ′ijmtη
L + δLj + δLmt + εLijmtUFijmt = αF1 +X ′jmtβ
F + αF2 Pijmt + αF3 uijmt + Y ′ijmtηF + δFj + δFmt + εFijmt.
(24)
Once we control for the residuals uijmt, and conditional on the other controls, the remaining price variabilityis attributable to differences in deposit rates, that are independent from the individual decision on how muchto draw and to default on the credit line. Following Adams et al. (2009), the price coefficient in the defaultequation αF2 can be interpreted in terms of moral hazard: it indicates how much the probability of defaultincreases for an increase in price unrelated to firms’ characteristics, including riskiness observed by the bankand priced accordingly.
34

6.3 Results
The estimates of the structural model are presented in Table 7. The three columns of results refer respec-tively to the demand, loan use and default equations. The top part of the table shows the effect of firmcharacteristics, the middle one the effect of bank characteristics, and the bottom one shows the covariancematrix, where we interpret as adverse selection the correlation between unobservables of demand and de-fault (ρDF ) and the correlation between unobservables of loan use and default (ρLF ). We decided to includespecific firm characteristics to control for different measures of firms’ assets, profitability, and debt. Wechose among the wide set of balance sheet variables running various reduced form regressions for demand,loan use, and default. We wanted to control for different measures of firm size, in the form of assets andratio of intangible assets,39 but also for some measures of firms’ current performance, in terms of profits,cash flow, and sales. We also tried to control for other specific forms of finance that firms have access to,such as credit from suppliers.40 We computed the firm’s age and the distance between the city council wherethe firm is located and the city council where the closest branch of each bank in the firm’s choice set is lo-cated.41 We also include fixed effects for the Score of the firm, its sector (primary, secondary, tertiary), theloan amount, and various combinations of bank, year and province dummies.42 Another important variablewe include are the predicted interest rates. Finally, we also included the number and the share of branchesthat a bank has in a market (province-year), as well as the number of years that it has been in the market. Wehave data on branches from 1959, so we can observe banks’ presence in each council for the 30 years beforethe beginning of our loan sample. These variables aim at capturing the level of experience that a bank hasin a market, as well as the density of its network of branches with respect to its competitors, which can bothbe relevant features influencing firms’ decisions.
The estimates present evidence of adverse selection both in the correlation between demand and defaultunobservables, and in the correlation between loan use and default unobservables. This confirms the resultsof the the reduced form test that we presented earlier. Looking at the demand side, we find that distance andprices have a negative impact on demand, as expected. Firms with more cash flow and trade debit are lesslikely to demand credit, but firms with more assets, profits, and sales are more likely to borrow. Older firmsare also more likely to demand. Firms tend to favor banks with a higher share and number of branches, andare more likely to demand form banks with longer experience in a market. The loan used seems to follow thesame logic as demand for most of the relevant variables, such as interest rates, trade debit, cash flow, profitsand assets. For what concerns the default probability, this is increasing in interest rates as expected, anddecreasing in profits and trade debit. We interpret the positive effect of interest rates on default as evidence
39 Albareto et al. (2011) describe the importance of firms’ size in the organization of lending in the Italian banking sector.40 Petersen and Rajan (1995) use the amount of trade credit as a key variable to determine if borrowers are credit constrained, as
it’s typically a more expensive form of credit than banks’ credit lines.41 It is important to include distance as Degryse and Ongena (2005) show evidence of spatial price discrimination in lending
relationship using Belgian data. They find that loan rates decrease with the distance between the borrower and the lender, andincrease with the distance between the borrower and the competing lenders.
42 As explained in Section 5, we estimate the demand model in two steps, and the loan use and default models in one step. Thisimplies that for the demand model we control for bank-year-province fixed effects in the first stage, and then for separate bank, yearand province fixed effects in the second stage. For loan use and default instead we are just able to control for bank and year-provincefixed effects.
35

of moral hazard.
The mean of own and cross price elasticities for the main 5 banks in the sample are reported in Table 8. Wefind that on average a 1% increase in interest rate reduces a bank’s own market share by around 4%, andincreases competitor banks’ shares by about 0.3%.
36

Table 7: Structural Estimates
Variables Demand Loan Use Default
Assets
Total Assets 5.95∗∗∗ 0.08∗∗∗ 0.07∗∗∗
(0.09) (0.00) (0.02)Intangible/Total Assets -0.85∗∗∗ -0.01∗ 0.06∗
(0.06) (0.01) (0.04)
Profitability
Profits 1.14∗∗∗ 0.01∗∗∗ -0.32∗∗∗
(0.06) (0.00) (0.04)1st Stage Cash Flow -0.93∗∗∗ -0.05∗∗∗ 0.03
Firm Level (0.06) (0.00) (0.02)Sales 6.97∗∗∗ -0.03∗∗∗ 0.07∗
(0.08) (0.00) (0.03)
Debt
{Trade Debit -3.21∗∗∗ -0.02∗∗∗ -0.11∗∗∗
(0.05) (0.00) (0.02)
Others
Firm’s Age 0.21∗∗∗ -0.02∗∗∗ 0.03(0.04) (0.00) (0.03)
Distance -1.19∗∗∗ -0.05 -0.06(0.04) (0.10) (0.07)
Interest Rate -0.26∗∗ -0.06∗∗∗ 0.40∗∗∗
(0.02) (0.00) (0.00)Score FE Yes Yes YesSector FE Yes Yes YesLoan Amount FE Yes Yes YesBank-Year-Province FE Yes No No
Number of Branches 0.72∗∗∗ 0.01∗∗ -0.35∗∗∗
2nd Stage (0.06) (0.00) (0.06)Bank Level Share of Branches 1.61∗∗∗ -0.09∗∗∗ -0.00
(0.26) (0.01) (0.02)Years in Market 0.47∗∗∗ 0.02∗∗∗ -0.29∗∗∗
(0.05) (0.00) (0.11)Bank FE Yes Yes YesYear FE Yes No NoProvince FE Yes No NoYear-Province FE No Yes Yes
Observations 312,906 18,820 18,820
Covariance matrix
σD = 0.11∗∗∗
(0.00)ρDL = 0.02∗∗∗ σL = 0.30∗∗∗
(0.00) (0.00)
Adverse SelectionρDF = 0.06∗∗∗ ρLF = 0.09∗∗∗ σF = 1
(0.00) (0.00)
Note: The top panel shows the estimates of the first stage η, γk. The middle panel shows the estimates of the second stageα, β, τt, ξj . The bottom panel shows the estimates of the variance-covariance Σ. The first column of results refers to the demandmodel, the second to the loan use, and the third to the default. Standard errors are in brackets. ∗ is significant at the 10% level,∗∗ at the 5% level, and ∗ ∗ ∗ at the 1% level. First stage standard errors are calculated by the inverse of the Information matrix,obtained providing the solver with analytical gradient and hessian. Second stage standard errors are computed with 200 iteration ofparametric bootstrap.
37

Table 8: Mean across Markets of Own and Cross Price Elasticities for Main Banks
Banks Bank 1 Bank 2 Bank 3 Bank 4 Bank 5Bank 1 -4.06 0.19 0.22 0.20 0.22Bank 2 0.26 -3.77 0.26 0.26 0.25Bank 3 0.31 0.32 -4.31 0.33 0.36Bank 4 0.24 0.23 0.26 -4.20 0.23Bank 5 0.27 0.26 0.30 0.25 -3.81
Note: These are the first 5 banks in terms of national market shares. Elasticities are interpreted as the percentage change in marketshares in response to a 1% increase in prices.
6.4 Fit of the Model
We provide some descriptives on the fit of the model. We choose to focus on the main objects of interest ofthe model, that is demand probabilities, amount of loan used, default probabilities, and equilibrium prices.We compare actual and predicted probabilities, as well as actual prices to those that maximize our profitfunction in equation 9. Summary statistics are presented in Table 9. We follow Nevo (2000a) and recovereach bank’s borrower-specific marginal costs using the pricing equation (10):
MCijmt = Pijmt
[1− Fijmt − F ′ijmt
QijmtQ′ijmt
]+
(1− Fijmt)QijmtQ′ijmt
1− Fijmt − F ′ijmtQijmtQ′ijmt
. (25)
Based on the model fit, we decide to exclude some firm-bank combinations from the sample for the counter-factuals. Even though our model predicts equilibrium prices well,43 there are very few outliers for which themodel gives a poor prediction. These wrong predictions correspond to just around 2% of the prices and canbe easily interpreted based on our model set up. They represent those few cases where a bank’s profit froma loan, based on our profit function assumptions and estimated parameters, are negative under the observedprices. For this reason our profit optimization routine delivers new equilibrium prices that need to be highenough to both reduce the probability of a firm taking out a loan, and to reduce to zero the predicted loanuse. We decide to exclude these few firm-bank observations from our sample for the counterfactuals. Notethat this slight reduction in sample size has almost no effect on the counterfactuals’ results.
The model shows a good fit, as the mean of the four variables of interest predicted by the model is alwaysvery close to the data. However, as expected, the standard deviation of the model’s predictions for demand,loan use, and default is lower than the actual data. The model’s price prediction is instead very accurateonce we exclude the 2% of outliers. Last, we find that effective marginal costs represent on average 78%
43 The median deviation of model predicted prices from actual prices is 0, but we have some outliers. While not perfect, wenote that we do not impose the pricing moment conditions in estimation (as is often done in the empirical literature), which wouldnecessarily improve the model fit at the expense of having an impact on the estimated adverse selection parameters which are ourprimary point of interest.
38

of the price, and effective markups about 22%. Note that the 5th percentile of predicted effective markupsis zero because for around 20% of the credit lines we observe a zero loan use, which in turn implies a zeromarkup for those loans.
In order to validate our model estimates, we investigate whether our predicted marginal costs correlatewith banks’ cost information we have access to. Presumably the main factors that affect a bank’s marginalcosts are the Libor,44 wages and property values in each local market, and deposit rates. We run an OLSregression focussing on the relationship between predicted marginal costs and deposit interest rates, andcontrol for the combined effects of the other factors using province-year fixed effects and bank fixed effects.We concentrate on this element because we only have yearly data, so cannot capture most of daily variationin the Libor, and because banks in the same province-year are likely to face the same labor and propertycosts. We have information instead on deposit interest rates at the bank-year-province level, and find thatconditional on bank and province-year fixed effects they have a positive and significant correlation with ourpredicted marginal costs. According to our estimates, 5 standard deviation increases in deposit rates areassociated with around 1 percentage point increase in predicted marginal costs.
Table 9: Descriptives on Model Fit
Variables Nobs Mean Std. Dev. 5th Pctile 50th Pctile 95th PctileActual Demand 312,906 0.087 0.281 0 0 1Predicted Demand 312,906 0.087 0.163 0.003 0.035 0.418
Actual Loan Use 18,820 246.5 442.6 0 96 1,018Predicted Loan Use 18,820 245.6 295.7 -56.9 160.3 998.7
Actual Default 18,820 0.063 0.244 0 0 1Predicted Default 18,820 0.063 0.106 0 0.016 0.284
Actual Prices 276,205 14.86 4.41 8.83 14.30 22.66Predicted Prices 276,205 14.96 4.42 8.91 14.39 22.79
Predicted MC 276,205 12.86 5.83 5.12 11.99 23.79Predicted Effective MC 276,205 11.56 4.73 5.00 11.00 19.90Predicted Effective Markups 276,205 3.31 1.30 0.00 3.77 4.52
Note: Prices are average prices at the year-province-bank-firm level.
7 Counterfactuals
We run a counterfactual policy experiment to quantify the effects of asymmetric information, as well as tounderstand the relationship between asymmetric information and imperfect competition. We simulate an
44 London Interbank Offered Rate, the most relevant European interest rate for interbank lending in the 1990s, with daily varia-tion.
39

increase in adverse selection, identified by the correlation between unobservables driving both demand anddefault (ρDF ) and loan size and default (ρLF ). We analyze the consequence of this change on equilibriumprices, quantities, and defaults. The rationale for this counterfactual exercise is twofold. First, we want togive an economic interpretation to the effect of the estimated correlation coefficients in terms of relevantoutcome variables. This means looking at how prices, demand, and defaults vary as we increase the corre-lation coefficients, just like we did in the Monte Carlo exercise. Second, an increase in adverse selectionis a distinctive feature of a financial crisis (Mishkin (2012)). During a period of crisis firms’ investmentopportunities contract, affecting differently the borrowing behavior of sound and risky firms. While theformer will borrow less, as they don’t invest but still expect to have a positive cash flow to use as operatingliquidity, the latter will keep borrowing as they expect their cash flow to be an insufficient source of workingcapital. This can be thought as an increase in adverse selection, as it implies a higher correlation betweenborrowers’ willingness to pay and their probability of default.
We simulate a scenario in which we double the estimated correlation coefficients ρDF and ρLF .45 Once werecover the equilibrium outcomes of interest in the new scenario, we investigate whether the variations thatwe observe from the baseline model are correlated with a measure of market power that every bank has witheach of its potential borrowers. We follow Nevo (2000a) assuming that marginal costs remain the same inthe counterfactual scenario. We re-calculate firms-banks’ demand probabilities, loan use and defaults withthe counterfactual level of adverse selection, and derive the new equilibrium prices as:
P ijmt =MCijmt
1− F ijmt − F′ijmt
Qijmt
Q′ijmt
+−(1− F ijmt)
Qijmt
Q′ijmt
1− F ijmt − F′ijmt
Qijmt
Q′ijmt
, (26)
where Qijmt and F ijmt are the new equilibrium quantities and defaults in the counterfactual setting. Wedefine quantities as demand probabilities (QDijmt) multiplied by the predicted amount of loan used (QLijmt),and defaults as the firm’s predicted default probability. Following the non-monotonic price response pre-dicted in the Monte Carlo experiment, we investigate how equilibrium prices, quantities, and defaults varywith respect to the the baseline case.46
We measure these changes at the firm-bank-year-province level and show them in Table 10, where we reportboth percentage variation (%) and percentage point variation (P.P.) for prices (i.e. interest rates), demandprobabilities, and default probabilities.47 Kernel densities of the distributions of these variations are plottedin Figures 5.
45 We have experimented with greater or smaller changes in the correlation coefficients, obtaining similar results scaled up ordown depending on the size of the variation. We increase both correlation coefficients as they are both measures of adverse selection,and from a policy perspective we are more interested in the combined effect rather than in the relative importance of each in drivingthe outcomes that we are finding. To make sure that the variance of εFijmt|αD1i, εLijmt remains positive in the counterfactual weincrease ρLF to 0.22, slightly more than doubling it.
46 We predict prices based on our supply model also for the baseline case. This means that we compare predicted prices underthe estimated correlation coefficients and predicted prices under the counterfactual correlation coefficients.
47 Percentage variation in prices is measured as ∆Pijmt = 100 ∗ P ijmt−Pijmt
Pijmt, and similarly for demand probabilities, loan
use, and default. Percentage point variation in prices is measured as ∆Pijmt = P ijmt − Pijmt, whereas for demand probabilitiesis measured as ∆QDijmt = 100 ∗ (Q
D
ijmt −QDijmt), and similarly for default.
40

The rise in adverse selection causes a median price increase of 26.5%, corresponding to a 3.7 percentagepoints raise in interest rates. Looking at both the descriptive statistics in Table 10 and at the top left panelin Figure 5 we note that there is substantial heterogeneity in these price responses, with some interest ratesraising by 70 percentage points and above, and a few actually declining. We don’t find the very stark increasein some of the prices too surprising, as it represent an implicit way for the model to generate a rejection ofa risky borrower, making sure that a very high interest rates can both minimize the demand probability andthe loan use. As expected, most of the demand probabilities decline, as well as most of the loan uses. Higheradverse selection tends to worsen banks’ pool of borrowers, despite some firms experiencing a very marginalreduction in default probability.
Based on these preliminary patters, we want to investigate how these variations relate to the level of marketpower that each bank has. We use the estimated effective markup term in the baseline case to identifybanks’ market power, that is the last term on the right hand side of equation 10, taken at the firm-bank-year-province level. We run OLS regressions of variations in interest rate, demand probability, loan use,and default at the bank-firm-year-province level on markups and firm fixed effects. Table 11 shows thatthe markup term negatively affects the price variation, positively affects the change in demand probabilityand loan use, and negatively impacts the default probability. This confirms the intuition of the MonteCarlo exercise presented earlier, because banks with higher market power respond to an increase in adverseselection lowering their prices and expanding their credit supply, or increasing their price by less than bankswith low market power. Following Stiglitz and Weiss (1981), the reduction in prices attracts the marginalborrowers, which under adverse selection are safer than the infra-marginal ones, lowering the bank’s shareof defaulters. Looking at the estimated coefficients for the markup term, we find that one standard deviationincrease in effective markup reduces the price variation ∆Pijmt by around 4.3 percentage points, increasesthe variation in demand probabilities ∆QDijmt by 0.2 percentage points and in loan use ∆QLijmt by around8,200 euros, and reduces variation in defaults ∆Fijmt by 2.2 percentage points.
These results highlight several important policy implications. First, an increase in adverse selection causesmost of the prices in our sample to increase, most of the quantities to fall and most of the defaults to rise. Thisimplies that, consistent with the theoretical literature on the adverse effects of asymmetric information, suchasymmetries can severely worsen lending conditions in this market, and suggests that additional policiesto mitigate this market failure would be beneficial. In other words, while market power can soften theadverse effects of asymmetric information, these effects are not sufficient on average. That being said, oursecond implication is that some markets are different: there is substantial heterogeneity in price, quantityand default responses to this rise in adverse selection across banks and markets. It is of crucial importancefor policymakers to understand how some banks and/or markets can absorb these shocks and some otherscannot. We offer one possible explanation for this heterogeneity, which is market power. We show that bankswith higher markups have a counter-cyclical effect on credit supply, responding to an increase in adverseselection with a reduction in prices and an increase in quantity lent. Hence, if on one hand competition inlending markets is beneficial for borrowers as it can reduce interest rates, on the other hand it forces banks tofollow the business cycle and increase rates as adverse selection rises, making borrowing firms more likelyto be credit rationed during this kind of shocks.
41

Table 10: Descriptives Counterfactual % and Percentage Points Variations in Outcomes
Variables Nobs 10th Pctile 50th Pctile 90th Pctile% Price Variation 276,205 0.0 26.5 422.4P.P. Price Variation 276,205 0.00 3.71 72.83
% Demand Variation 276,205 -30.3 0.0 6.0P.P. Demand Variation 276,205 -1.28 0.00 0.33
% Loan Use Variation 275,887 -100.0 -6.8 0.0Loan Use Variation 276,205 -129.4 -9.8 0.0
% Default Variation 276,205 -100.0 -6.2 410.5P.P. Default Variation 276,205 -0.53 0.00 70.66
Note: These variations are at the firm-bank-year-province. Loan Use variations are in thousands of euros. % Loan Use Variationhas a smaller number of observations corresponding to the few cases in which loan use is zero in the baseline case and non-zero inthe counterfactual case.
Figure 5: Kernel Density of Counterfactual Outcome Changes
0.0
2.0
4.0
6.0
8K
ern
el density
−10 0 10 20 30 40Percentage Points Price Change
01
23
4K
ern
el density
−5 0 5Percentage Points Demand Probability Change
0.0
05
.01
.015
.02
Kern
el density
−150 −100 −50 0Loan Use Change
0.1
.2.3
.4K
ern
el density
−10 0 10 20 30Percentage Points Default Change
Note: An observation is a firm-year-province-bank. The vertical axis is the density. The horizontal axis is the percentage pointoutcome variation between the baseline case and the counterfactual scenario for prices, demand probabilities, and default, and it’sthe loan use change in thousands of euros. The graph is trimmed to avoid outliers and excludes the cases of no variation in theoutcomes.
42

Table 11: Regressions of Counterfactual Outcomes’ Variations on Markups
Variables ∆Pijmt ∆QDijmt ∆QL
ijmt ∆Fijmt
Effective Markup -3.32∗∗∗ 0.18∗∗∗ 6.30∗∗∗ -1.66∗∗∗
(0.08) (0.01) (0.16) (0.03)Firm FE Yes Yes Yes Yes
R2 0.761 0.232 0.773 0.781N obs. 276,205 276,205 275,887 276,205
Note: An observation is a firm-year-province-bank. Price, demand probabilities, and default variations are measured in percentagepoints. Loan use is measured in thousands of euros.
8 Conclusion
In this paper we analyzed the interaction between imperfect competition and asymmetric information in theItalian market for small business lines of credit. We have access to a rich dataset with detailed informationabout credit line contracts between firms and banks, including all the main Italian credit institutions anda highly representative sample of firms. Using these data, we provide reduced form evidence of adverseselection in the spirit of the positive correlation test on unobservables by Chiappori and Salanié (2000), aswell as reduced form evidence consistent with imperfect competition.
Based on this evidence, we propose a structural model of firms’ demand for credit, loan use, and default, aswell as of banks’ pricing. We let differentiated banks compete à la Bertrand-Nash on interest rates in localcredit markets, but also use interest rates as a screening device, as in Stiglitz and Weiss (1981). The modelallows for imperfect competition in the lending market, accounting for asymmetric information betweenborrowers and lenders. We assume in fact that firms know the riskiness of their own project, but bankscan only observe the distribution of riskiness of their borrowers, conditional on observable firm characteris-tics. When we introduce asymmetric information, our model of oligopolistic competition predicts differentbanks’ interest rate reactions to an increase in adverse selection, depending on the level of competition.We provide Monte Carlo evidence of a non-monotonic optimal bank’s price response to an increase in ad-verse selection, depending on different measures of competition. More adverse selection causes prices toincrease in competitive markets, but can have the opposite effect in more concentrated ones, where bankscan leverage over their markup to lower prices and attract safer borrowers.
We find evidence of adverse selection in the data, in the form of a positive correlation between unobservablesdetermining demand and default and loan use and default. We provide evidence both with reduced form testsand estimating a structural model. We also provide evidence of moral hazard identified with the causal effectof interest rates on borrowers’ default. We conduct a policy experiment to simulate the effects of a creditcrunch, in which risky firms experience a more severe financial distress and demand more credit, increasing
43

the extent of adverse selection. As predicted, in this counterfactual scenario equilibrium prices rise for morecompetitive markets and decline for more concentrated ones. As a consequence, the share of borrowingfirms increases in more concentrated markets, and default rates fall.
44
References
Abbring, J. H., P. A. Chiappori, J. J. Heckman, and J. Pinquet, “Adverse Selection and Moral Hazard inInsurance: Can Dynamic Data Help to Distinguish?,” Journal of the European Economic Association,2003, 1, 512–521.
Ackerberg, D. A. and M. Botticini, “Endogenous Matching and the Empirical Determinants of ContractForm,” Journal of Political Economy, 2002, 110 (3), 564–591.
Adams, W., L. Einav, and J. Levin, “Liquidity Constraints and Imperfect Information in Subprime Lend-ing,” American Economic Review, 2009, 99 (1), 49–84.
Akerlof, G., “The Market for ‘Lemons’: Quality Uncertainty and the Market Mechanism,” Quarterly Jour-nal of Economics, 1970, 84 (3), 488–500.
Albareto, G., M. Benvenuti, S. Mocetti, M. Pagnini, and P. Rossi, “The Organization of Lending andthe Use of Credit Scoring Techniques in Italian Banks,” The Capco Institute Journal of FinancialTransformation, 2011, 32, 143–157.
Albertazzi, U., M. Bottero, and G. Sene, “Sharing Information on Lending Decisions: An EmpiricalAssessment,” 2014. Temi di discussione (Economic working papers) 980, Bank of Italy.
Altman, E. I., “Financial ratios, discriminant analysis and the prediction of corporate bankruptcy,” Journalof Finance, 1968, 21, 589–609.
, G. Marco, and F. Varetto, “Comporate distress diagnosis: Comparisons using linear discriminantanalysis and neural networks (the Italian experience),” Journal of Banking and Finance, 1994, 18,505–529.
Banerjee, A. and A. Newman, “Occupational Choice and the Process of Development,” Journal of PoliticalEconomy, 1993, 101 (2), 274–298.
Barba Navaretti, G., M. Bugamelli, F. Schivardi, C. Altomonte, D. Horgos, and D. Maggioni, “TheGlobal Operations of European Firms - The Second EIFGE Policy Report,” Brugel Blueprint Series,2011, XII.
Berger, A. N. and G. F. Udell, “Relationship Lending and Lines of Credit in Small Firm Finance,” Journalof Business, 1995, 68 (3), 351–381.
Bernanke, A. and M. Gertler, “Financial Fragility and Economic Performance,” Quarterly Journal ofEconomics, 1990, 105 (1), 87–114.
Berry, S., “Estimating Discrete-Choice Models of Product Differentiation,” The RAND Journal of Eco-nomics, 1994, 25 (2), 242–262.
, J. Levinsohn, and A. Pakes, “Automobile Prices in Market Equilibrium,” Econometrica, 1995, 63(4), 841–890.
Bofondi, M. and G. Gobbi, “Informational Barriers to Entry into Credit Markets,” Review of Finance, 2006,10, 39–67.
Bugamelli, M., L. Cannari, F. Lotti, and S. Magri, “Il Gap Innovativo del Sistema Produttivo Italiano:
45

Radici e Possibili Rimedi,” Bank of Italy Occasional Papers: Questioni di Economia e Finanza, 2012,1 (121).
Caliendo, M. and S. Kopeinig, “Some Practical Guidance for the Implementation of Propensity ScoreMatching,” Journal of Economic Surveys, 2008, 22 (1), 31–72.
Cerqueiro, G., H. Degryse, and S. Ongena, “Rules versus Discretion in Loan Rate Setting,” Journal ofFinancial Intermediation, 2011, 20, 503–529.
Chiappori, P. A. and B. Salanié, “Testing for Asymmetric Information in Insurance Markets,” Journal ofPolitical Economy, 2000, 108 (1), 56–78.
and , “Asymmetric Information in Insurance Markets: Empirical Assessments,” Handbook ofInsurance - Second Edition, 2013, pp. 397–422.
Ciari, L. and N. Pavanini, “Market Structure and Multi Market Contact,” 2014. Working Paper.
Cohen, A. M. and M. Mazzeo, “Market Structure and Competition among Retail Depository Institutions,”The Review of Economics and Statistics, 2007, 89 (1), 60–74.
Degryse, H. and S. Ongena, “Distance, Lending Relationships, and Competition,” Journal of Finance,2005, LX (1), 231–266.
Demekas, D. G., B. Potter, and M. Pradhan, Italy: Background Economic Developments and Issues (IMFStaff Country Report 95/37), International Monetary Fund (IMF), 1995.
DeMeza, D. and D. C. Webb, “Too Much Investment: A Problem of Asymmetric Information,” The Quar-terly Journal of Economics, 1987, 102 (2), 281–292.
Detragiache, E., P. Garella, and L. Guiso, “Multiple versus Single Banking Relationships: Theory andEvidence,” The Journal of Finance, 2000, LV (3), 1133–1161.
Egan, M., A. Hortaçsu, and G. Matvos, “Deposit Competition and Financial Fragility: Evidence from theUS Banking Sector,” 2015. Working Paper.
Einav, L., A. Finkelstein, and J. Levin, “Beyond Testing: Empirical Models of Insurance Markets,” AnnualReview of Economics, 2010, 2, 311–336.
and , “Selection in Insurance Markets: Theory and Empirics in Pictures,” Journal of EconomicPerspectives, 2011, 25 (1), 115–138.
, M. Jenkins, and J. Levin, “Contract Pricing in Consumer Credit Markets,” Econometrica, 2012, 80(4), 1387–1432.
Felici, R. and R. Pagnini, “Distance, Bank Heterogeneity and Entry in Local Banking Markets,” Journalof Industrial Economics, 2008, 53 (3), 500–534.
Gale, W. G., “Federal Lending and the Market for Credit,” Journal of Public Economics, 1990, 42 (2),177–193.
Gandhi, A., Z. Lu, and X. Shi, “Estimating Demand for Differentiated Products with Error in MarketShares,” 2013. CeMMAP Working Paper CWP03/13.
Gerakos, J. and C. Syverson, “Competition in the Audit Market: Policy Implications,” Journal of Account-ing Research, 2015, 53 (4), 725–775.
46

Gobbi, G. and F. Lotti, “Entry Decisions and Adverse Selection: An Empirical Analysis of Local CreditMarkets,” Journal of Financial Services Research, 2004, 26 (3), 225–244.
Goolsbee, A. and A. Petrin, “The Consumer Gains from Direct Broadcast Satellites and the Competitionwith Cable TV,” Econometrica, 2004, 72 (2), 351–381.
Guiso, L., L. Pistaferri, and F. Schivardi, “Credit within the Firm,” The Review of Economic Studies,2013, 80 (1), 211–247.
Handel, B., “Adverse Selection and Switching Costs in Health Insurance Markets: When Nudging Hurts,”American Economic Review, 2013, 103 (7), 2643–2682.
Heckman, J. J., “Sample Selection Bias as a Specification Error,” Econometrica, 1979, 47 (1), 153–161.
Ho, K. and J. Ishii, “Location and Competition in Retail Banking,” International Journal of IndustrialOrganization, 2011, 29 (5), 537–546.
Hubbard, R. G., “Capital Market Imperfections and Investment,” Journal of Economic Literature, 1998,36 (1), 193–225.
Imbens, G. W., “Matching Methods in Practice,” Journal of Human Resources, 2004, 50 (2), 373–419.
and D. Rubin, Causal Inference in Statistics, Social, and Biomedical Sciences, Cambridge UniversityPress, 2015.
Jensen, M. C. and W. H. Meckling, “Theory of the Firm: Managerial Behavior, Agency Costs and Own-ership Structure,” Journal of Financial Economics, 1976, 3, 305–360.
Jiménez, G., S. Ongena, J. L. Peydró, and J. Saurina, “Hazardous Times for Monetary Policy: Whatdo Twenty-three Million Bank Loans Say About the Effects of Monetary Policy on Credit Risk?,”Econometrica, 2014, 82 (2), 463–505.
Karlan, D. and J. Zinman, “Observing Unobservables: Identifying Information Asymmetries with a Con-sumer Credit Field Experiment,” Econometrica, 2009, 77 (6), 1993–2008.
Koijen, R. S. J. and M. Yogo, “An Equilibrium Model of Institutional Demand and Asset Prices,” 2015.Working Paper.
Lester, B., A. Shourideh, V. Venkateswaran, and A. Zetlin-Jones, “Screening and Adverse Selection inFrictional Markets,” 2015. Working Paper.
Leuven, E. and B. Sianesi, “PSMATCH2: Stata module to perform full Mahalanobis and propensity scorematching, common support graphing, and covariate imbalance testing,” 2003. https://ideas.
repec.org/c/boc/bocode/s432001.html.
Lustig, J., “Measuring Welfare Losses from Adverse Selection and Imperfect Competition in PrivatizedMediare,” 2011. Boston University Working Paper.
Mahoney, N. and E. G. Weyl, “Imperfect Competition in Selection Markets,” 2014. NBER Working Paper20411.
Mankiw, N. G., “The Allocation of Credit and Financial Collapse,” Quarterly Journal of Economics, 1986,101 (3), 455–470.
Michelacci, C. and F. Schivardi, “Does Idiosyncratic Business Risk Matter for Growth?,” Journal of the
47

European Economic Association, 2013, 11 (2), 343–368.
Mishkin, F. S., The Economics of Money, Banking, and Financial Markets, Pearson Education, 2012.
Mookherjee, D. and D. Ray, “Contractual Structure and Wealth Accumulation,” American Economic Re-view, 2002, 92 (4), 818–849.
Moskowitz, T. J. and A. Vissing-Jorgensen, “The Returns of Entrepreneurial Investment: A Private EquityPremium Puzzle?,” American Economic Review, 2002, 92 (4), 745.
Myers, S. C., “Determinants of Corporate Borrowing,” Journal of Financial Economics, 1977, 5, 147–175.
Nevo, A., “Mergers with Differentiated Products: the Case of the Ready-To-Eat Cereal Industry,” The RANDJournal of Economics, 2000, 31 (3), 395–421.
, “A Practitioner’s Guide to Estimation of Random-Coefficients Logit Models of Demand,” Journal ofEconomics and Management Strategy, 2000, 9 (4), 513–548.
Panetta, F., F. Schivardi, and M. Shum, “Do Mergers Improve Information? Evidence from the LoanMarket,” Journal of Money, Credit and Banking, 2009, 41 (4), 673–709.
Pavanini, N. and F. Schivardi, “The Value of Information in Relationship Lending,” 2016. Working Paper.
Petersen, M. A. and R. G. Rajan, “The Benefits of Lending Relationships: Evidence from Small BusinessData,” Journal of Finance, 1994, 49 (1), 3–37.
and , “The Effect of Credit Market Competition on Lending Relationships,” The QuarterlyJournal of Economics, 1995, 110, 403–444.
and , “Does Distance Still Matter? The Information Revolution in Small Business Lending,”Journal of Finance, 2002, 57 (6), 2533–2570.
Pischke, S., “Lecture Notes on Measurement Error,” 2007. Spring 2007 Lecture Notes.
Rodano, G., N. Serrano-Velarde, and E. Tarantino, “Lending Standards over the Credit Cycle,” 2015.Working Paper.
Rothschild, M. and J. E. Stiglitz, “Equilibrium in Competitive Insurance Markets: An Essay on the Eco-nomics of Imperfect Information,” Quarterly Journal of Economics, 1976, 90 (4), 630–649.
Rubin, D. B., “Using Propensity Scores to Help Design Observational Studies: Application to the TobaccoLitigation,” Health Services & Outcomes Research Methodology, 2001, 2, 169–188.
Starc, A., “Insurer Pricing and Consumer Welfare: Evidence from Medigap,” RAND Journal of Economics,2014, 45 (1), 198–220.
Stiglitz, J. and A. Weiss, “Credit Rationing in Markets with Imperfect Information,” American EconomicReview, 1981, 71 (3), 393–410.
Train, K. E., Discrete Choice Methods with Simulation, Cambridge University Press, 2009.
and C. Winston, “Vehicle Choice Behavior and the Declining Market Share of U.S. Automakers,”International Economic Review, 2007, 48 (4), 1469–1496.
Wooldridge, J. M., Econometric Analysis of Cross Section and Panel Data, The MIT Press, 2002.
48

A For Online Publication - Appendix A - Constructing the Dataset
We have assembled various datasets from different sources, which are the following:
• Firm Data: Dataset from Centrale dei Bilanci with yearly (1988-1998) balance sheet data for eachfirm, including both firms that take credit and don’t (outside option). This also includes the year ofbirth of each firm and its location at the city council level.
• Score Data: Dataset for each firm with yearly (1982-1998) score data, with also the 6 years preceding1988. We retain from this data the 1982-1987 average, standard deviation, and weighted average(more weight to more recent years) of the score.
• Loan Data: Dataset from Centrale dei Rischi with yearly (1988-1998) firm-bank loan contracts,including amount granted, amount used, interest rate, firm’s default. This is only for the main 94banks and for short term credit lines.
• Bank Data: Dataset with yearly (1988-2002) balance sheet data for each bank, including yearly totalloans that each bank gives in each province, and its share of the total loans granted in each province.
• Branch Data: Dataset with yearly (1959-2005) branches for each bank at the city council level. Thisincludes the population of banks (∼ 1,500 banks).
• Coordinates Data: Based on the ISTAT city council classification, we assign to each city council thegeographic coordinates that will allow us to calculate firm-branch distances.
We first merge the firm and score datasets with the loan data, in order to have all the borrowing and notborrowing firms together. We then take all the banks actively lending in each province and assume thatthose represent the choice set for each firm, regardless of whether they have a branch in that province or not48. We assume that each firm chooses one main credit line among all the banks available in its province. Themain line is defined as the line for which the amount used, regardless of the amount granted, is the highest.For cases in which multiple lines have the same amount used, then the one with the lowest price is chosen.We calculate the distance in km between the city council of each firm and the city council where each bankfrom the choice set has a branch using the geographic coordinates. For each firm-bank pair, we only keepthe branch that is closest to the firm.
A.1 Matching Model
We recover prices and amounts granted for non-borrowing firms using propensity score matching betweenborrowers and non-borrowers, following Imbens (2004), Imbens and Rubin (2015), and Caliendo andKopeinig (2008). We construct an iterative process to appropriately select the relevant variables determiningthe propensity score, and obtain the best possible match. Our choice of covariates for the matching, that is
48 There is evidence in other papers (Bofondi and Gobbi (2006)), as well as in our data, that a few banks lend in some provinceseven if they don’t have a branch there.
49

the variables determining whether a firm borrows or not, is guided by economic theory and knowledge ofthe institutional setting, as well as on the overlap in variables’ distributions, and statistics from the matchingresults.
The final set of variables that we use are all fixed effects for: year, score, geographical area, sales andassets. In line with Caliendo and Kopeinig (2008), we apply the following specific criteria in our selection,to determine both which variables to include and the degree of discretization for the fixed effects. First,we only include controls that influence simultaneously the participation (borrowing vs non-borrowing) andthe outcome (interest rates). Second, variables must be unaffected by participation, or anticipation of it, soshould be either fixed over time or measured before participation. The score respects this rule, the value ofassets is assumed to be persistent overtime, and sales capture demand effects. We choose to only controlfor a score above or below 6, as Rodano, Serrano-Velarde and Tarantino (2015) showed that this is the mostrelevant threshold level for lending standards. Third, for the common support assumption to hold, somerandomness is needed, so some firms with identical characteristics should be observed in each states. Forthis reason we choose a parsimonious set of variables and avoid any over-parametrization.
We summarize in Table 12 the normalized differences in means between treatment (non-borrowers) andcontrol (borrowers) groups.49 Imbens (2004) defines as modest normalized differences below 0.3 in absolutevalue, and all of our differences for the continuous variables used are below that threshold. We implementseveral matching methods and find similar results across them. We choose to focus on the k-nearest neighbormatching, as it allows us to assign several untreated (borrowing) firms to each treated (non-borrowing)one.
We follow the standard literature in performing several statistical tests to assess the quality of the matching.Variables’ selection is based on statistical significance, the ”hit or miss” method (Heckman et al. (1997)),50
and comparisons of several statistics before and after the matching. These includes the Pseudo-R2, theLikelihood Ratio, the mean and median bias, and Rubin’sB andR.51 Caliendo and Kopeinig (2008) explainthat a rule of thumb for a good match is to have mean and median biases below 3% to 5%. According toLeuven and Sianesi (2003), Rubin’s B should be below 25% and Rubin’s R should be between 0.5 and2. Finally, a good matching outcome should deliver Pseudo R2 and Likelihood Ratio tests high in theunmatched case, and very low in the matched case. Our results pass all these statistical tests, as shown inTables 13 and 14. Last, we show a graph of the bias reduction and test the common support of the propensityscore between treated and untreated in Figure 6. Even though there is a large mass at each tail, these figuresshow that the values for both groups span the full range of propensity scores, implying that we have enoughoverlap as long as we allow for replacement.
49 The normalized difference for a variable with mean µ and variance σ2 is given by µT−µC√σ2T+σ2
C/2
, where T stands for treated
(non-borrowing) and C stands for control (borrowing) groups.50 Variables are chosen to maximize the within-sample prediction rates, i.e. maximizing the cases in which the estimated propen-
sity score for each observation is greater than the sample proportion of firms taking the treatment (in our case not borrowing).51 B is the number of standard deviations between the means of the groups, and R is the ratio of treatment variance to control
variance (Rubin (2001)).
50

Table 12: Normalized Differences
Variable Obs Normalized Difference
Score 52,310 -0.294Sales 52,310 -0.076Total Assets 52,310 -0.066
Table 13: Matching Results 1
Unmatched Mean % Bias t-TestVariable vs. Matched Treated Control % Bias Reduction t p>|t|1991-1992 U 0.392 0.132 -33.6 -32.57 0.000
M 0.392 0.392 0.0 100.0 0.00 1.0001993-1994 U 0.333 0.308 5.6 5.90 0.000
M 0.333 0.333 0.0 100.0 -0.00 1.0001995-1996 U 0.249 0.110 37.1 41.82 0.000
M 0.249 0.249 0.0 99.9 0.03 0.9801997-1998 U 0.309 0.245 14.2 15.25 0.000
M 0.309 0.309 -0.0 99.8 -0.02 0.981Score>6 U 0.281 0.358 -16.5 -17.24 0.000
M 0.281 0.281 0.0 100.0 -0.00 1.000North Area U 0.656 0.662 -1.3 -1.35 0.176
M 0.656 0.656 0.0 100.0 -0.00 1.000Sales Category 2 U 0.391 0.114 67.3 77.37 0.000
M 0.391 0.391 0.0 100.0 -0.00 1.000Sales Category 3 U 0.135 0.229 -24.7 -25.17 0.000
M 0.135 0.135 0.0 100.0 0.00 1.000Sales Category 4 U 0.055 0.265 -59.8 -57.30 0.000
M 0.055 0.055 0.0 100.0 0.00 1.000Sales Category 5 U 0.056 0.265 -59.3 -56.92 0.000
M 0.056 0.056 0.0 100.0 -0.00 1.000Assets Category 2 U 0.275 0.166 26.3 28.85 0.000
M 0.275 0.275 0.0 100.0 0.00 1.000Assets Category 3 U 0.132 0.231 -25.9 -26.36 0.000
M 0.132 0.132 0.0 100.0 -0.00 1.000Assets Category 4 U 0.079 0.255 -48.6 -47.59 0.000
M 0.079 0.079 0.0 100.0 0.00 1.000Assets Category 5 U 0.061 0.263 -57.0 -54.94 0.000
M 0.061 0.061 0.0 100.0 0.00 1.000
51

Table 14: Matching Results 2
Sample Pseudo-R2 LR χ2 p > χ2 Mean Bias Median Bias Rubin’s B Rubin’s R
Unmatched 0.367 23,790.6 0.000 34.1 30.0 170.0 1.26Matched -0.000 -0.00 1.000 0.0 0.0 0.0 1.00
Note: A rule of thumb for a good match is to have mean and median biases below 3% to 5%, Rubin’s B below 25% and Rubin’s Rbetween 0.5 and 2.
Figure 6: Matching Graph and Common Support
−50 0 50 100
Standardized % bias across covariates
Unmatched
Matched 0 .2 .4 .6 .8 1Propensity Score
Untreated Treated
52