Asymmetric and nonlinear pass-through of global crude oil ...
13
Full Terms & Conditions of access and use can be found at http://www.tandfonline.com/action/journalInformation?journalCode=rero20 Economic Research-Ekonomska Istraživanja ISSN: 1331-677X (Print) 1848-9664 (Online) Journal homepage: http://www.tandfonline.com/loi/rero20 Asymmetric and nonlinear pass-through of global crude oil price to China’s PPI and CPI inflation Shaobo Long & Jun Liang To cite this article: Shaobo Long & Jun Liang (2018) Asymmetric and nonlinear pass-through of global crude oil price to China’s PPI and CPI inflation, Economic Research-Ekonomska Istraživanja, 31:1, 240-251, DOI: 10.1080/1331677X.2018.1429292 To link to this article: https://doi.org/10.1080/1331677X.2018.1429292 © 2018 The Author(s). Published by Informa UK Limited, trading as Taylor & Francis Group Published online: 07 Feb 2018. Submit your article to this journal Article views: 265 View related articles View Crossmark data
Transcript of Asymmetric and nonlinear pass-through of global crude oil ...

Full Terms & Conditions of access and use can be found athttp://www.tandfonline.com/action/journalInformation?journalCode=rero20
Economic Research-Ekonomska Istraživanja
ISSN: 1331-677X (Print) 1848-9664 (Online) Journal homepage: http://www.tandfonline.com/loi/rero20
Asymmetric and nonlinear pass-through of globalcrude oil price to China’s PPI and CPI inflation
Shaobo Long & Jun Liang
To cite this article: Shaobo Long & Jun Liang (2018) Asymmetric and nonlinear pass-through ofglobal crude oil price to China’s PPI and CPI inflation, Economic Research-Ekonomska Istraživanja,31:1, 240-251, DOI: 10.1080/1331677X.2018.1429292
To link to this article: https://doi.org/10.1080/1331677X.2018.1429292
© 2018 The Author(s). Published by InformaUK Limited, trading as Taylor & FrancisGroup
Published online: 07 Feb 2018.
Submit your article to this journal
Article views: 265
View related articles
View Crossmark data

Economic REsEaRch-Ekonomska istRaživanja, 2018voL. 31, no. 1, 240–251https://doi.org/10.1080/1331677X.2018.1429292
Asymmetric and nonlinear pass-through of global crude oil price to China’s PPI and CPI inflation
Shaobo Longa,b and Jun Liangc
aschool of Public affairs, chongqing University, chongqing, china; bResearch centre for Public Economy & Public Policy, chongqing University, chongqing, china; cschool of Economics, Renmin University, Beijing, china
ABSTRACTWith China’s expanding import demand of crude oil and the gradually relaxing regulation of domestic oil prices, the global oil price is likely to affect China’s price level more closely. Based on an augmented Phillips curve framework, this article employs both the autoregressive distribution lag (ARDL) and nonlinear and asymmetric autoregressive distribution lag (NARDL) model to investigate pass-through effects of crude oil price on China’s producer prices index (PPI) and consumer prices index (CPI) in China. It is found that the impact of global oil price fluctuations to China’s PPI and CPI are asymmetrical in the long-run, and the long-term impacts of the rise in global oil prices on PPI and CPI are greater than the global oil price decline on PPI and CPI. However, the symmetric ARDL model fails to diagnose the impact of oil price to China’s PPI and CPI. Therefore, it is necessary to consider asymmetric relationship in the study of global oil price’s influence on China’s domestic prices.
1. Introduction
The fluctuations of oil prices are exogenous shocks to the economy, and oil price changes are directly related to the production cost of the product, which affects the changing price levels. It is widely accepted that oil price shocks at least partially pass through into inflation (Chen, 2009). With the gap of self-supply and consumption demand of crude oil continues to expand, China is increasingly dependent on imports of oil. In 2012, China’s crude oil import was as high as 0.27 billion tonnes, and dependency on imported oil was increased to 56.4%. As one of the most important resource inputs, the fluctuations of global oil prices are likely to have considerable impact on China’s manufacturing costs, which affects the production producer prices index (PPI) and the consumer prices index (CPI). Moreover, the link between global crude oil prices and domestic oil prices become stronger. Petroleum price regulations in China gradually relaxed and market-orientated oil pricing mechanisms have been confirmed since 1998. In November 2001, China’s refined oil price adjustments
KEYWORDScrude oil prices; asymmetric pass-through; producer prices index (PPi); consumer prices index (cPi); inflation
JEL CLASSIFICATIONSc01; c2; Q4
ARTICLE HISTORYReceived 2 December 2015 accepted 6 February 2017
© 2018 the author(s). Published by informa Uk Limited, trading as taylor & Francis Group.this is an open access article distributed under the terms of the creative commons attribution License (http://creativecommons.org/licenses/by/4.0/), which permits unrestricted use, distribution, and reproduction in any medium, provided the original work is properly cited.
CONTACT shaobo Long [email protected]
OPEN ACCESS

ECONOMIC RESEARCH-EKONOMSKA ISTRAŽIVANJA 241
refer to the average prices of three markets, Singapore, Rotterdam and New York, which strengthen the synchronisation between global crude oil prices and domestic oil prices. Since the beginning of 2009, the refined oil pricing mechanism has been further reformed, and the domestic refined oil prices began to be based on global crude oil prices, coupled with the domestic average processing costs, taxes and reasonable profits. Therefore, the trend of China’s domestic oil prices following global oil prices is more obvious and global oil prices may greatly affect China’s PPI and CPI too.
However, China’s oil market is in an oligopoly situation, and the production, import and wholesale of oil are mainly controlled by three petroleum enterprises. Non-competitive market structures may cause asymmetric price transmission (Meyer & Cramon-Taubadel, 2004). When the global oil price rises, the importing costs of domestic petroleum enter-prises also rise. In order to maintain a certain profit, domestic petroleum enterprises will enhance refined oils prices and to greater extent, will rely on monopoly power. The refined oils are inputs and the raw materials of a variety of industrial products, so production cost of various products will increase and push up PPI to a large extent. It will also increase living costs, because households consume substantial refined oil products, and thus push up CPI. However, when the global crude oil prices decline, in order to make more profit, domestic petroleum enterprises can lower the refined oil prices to a small extent because of their monopoly power. This means the decline of PPI and CPI is also smaller too. Thus, we can assume that the pass-through effect is asymmetric, and the magnitude of crude oil price pass-through to PPI and CPI is greater when crude oil prices rise, rather than when prices decline.
Therefore, it is meaningful to study the asymmetric transmission of crude oil prices to PPI and CPI in China. If the transmission is asymmetrical, people suffer a loss of welfare because of the monopolistic oil market. So, it is necessary to reduce China’s oil industry’s monop-oly power. Moreover, it suggests that the authorities should carry out different strengths of monetary policies in response to global oil prices rise and fall. Our aim is to investigate asymmetric pass-through of global crude oil price to China’s PPI and CPI inflation.
2. Literature review
Since the oil crisis in the 1970s, the pass-through effect of global oil price fluctuations on inflation has been receiving growing attention from many scholars and policymakers. Oil price pass-through effect refers to the influence of changing crude oil prices on domestic aggregate prices, including PPI and CPI.1 Hamilton (1983) argues that, in 1960, all but one crude oil price increase lead to every recession after World War II. However, the degree of oil price pass-through from global oil prices to domestic prices has turned out to be inconclusive (Valcarcel & Wohar, 2013).
Extensive research shows that global crude oil prices affect domestic inflation unambig-uously. Barsky et al. (2002) reveal that oil price is obviously inflationary for output price. LeBlanc and Chinn (2004) estimate the transmission effects of oil price changes to inflation G5 countries and find that the oil price increases have moderate impacts on inflation in the US, Japan and Europe. Cunado and Pérez de Gracia (2005) adopt six Asian countries’ data over the period 1975Q1–2002Q2 and verify that oil prices have significant effects on both economic activities and price indexes. Chou and Tseng (2011) find evidence a significant pass-through effect of oil prices on CPI inflation in emerging Asian countries

242 S. LONG AND J. LIANG
in the long-run. Chou and Lin (2013) verify that oil prices have important pass-through effects on Taiwan’s producer price indices both in the short- and long-run. Sai and Ibrahim (2012) analyse the oil price pass-through into consumer price inflation for Malaysia. They find evidence for a long cointegration of oil prices with aggregate consumer prices and food price indexes. Ibrahim and Chancharoenchai (2014) find the presence of long-run relations between oil prices and aggregate CPI using a cointegration modelling method with Thailand data.
In contrast, some research asserts that the impact of global oil prices on domestic inflation seem to be limited or declining. Hooker (2002) revealed that the impact of oil prices on US inflation were weakened when the sample was extended beyond 1981. Barsky and Kilian (2004) concluded that the consumer price inflations were not always related to oil price shocks in the US. Blanchard and Galí (2007) considered a set of industrialised economies and concluded that the inflationary impact of oil price shocks was consistently smaller over time. De Gregorio et al. (2007) examined 34 developed and developing countries by using quarterly data from1965Q1 to 2005Q1, and found that the relationship between oil price and inflation was decreasing. Killian (2008) argued that the average exogenous oil price shock on inflation was quite small in G7 countries. Chen (2009) investigated the relationship between oil price and inflation using a state space approach and data from 19 industrialised countries, and found the declining pass-through phenomenon for almost all these countries. Álvarez, Hurtado, Sánchez, and Thomas (2011) used the Dynamic Stochastic General Equilibrium model for Spain and the eurozone, then noted that the inflationary impacts of oil price changes were limited. Shioji and Uchino (2011) confirmed the declining pass-through rate, both at the aggregate and sectoral levels for the period 1980–2000. Valcarcel and Wohar (2013) revealed the pass-through effect of oil prices on inflation has been negligible since the 1980s, using US quarterly data spanning 1948Q1 to 2011Q2.
However, the relationship of crude oil and inflation may be asymmetric and neglected by symmetric method (Hamilton, 2009, 2011; Valcarcel & Wohar, 2013). In fact, many studies confirm that the global crude oil prices’ transmissions to domestic prices are asymmetric and nonlinear, and the extent of the influence of global crude oil prices rising and falling on domestic prices are different. Mork (1989) first examined and found the nonlinear and asymmetric responses of inflation to oil price increase and decline in the US. Hamilton and Herrera (2001) documented that there are nonlinear and asymmetric relationships between oil prices and US inflation. Du, Yanan, and Wei (2010) verified that the global oil price has significant effects on China’s economic growth and inflation, and that the impact is non-linear. Chou and Lin (2013) found the significant nonlinear error-correction relationships among the oil price, output and wages and producer prices in Taiwan.
But few studies focus on China’s asymmetric relationship between oil price and inflation in the short- and long-term, let alone calculate asymmetrical transmission coefficients from global oil price to China’s PPI and CPI. Therefore, this article serves to fill this gap by using the nonlinear and asymmetric autoregressive distribution lag (NARDL) model developed by Shin, Yu, and Greenwood-Nimmo (2013) to investigate the asymmetric transmission of the global oil price to China’s major price indexes, PPI and CPI. To the best of our knowledge, this is the first attempt to employ NARDL to model global oil prices and China’s domestic prices. In order to compare differences of asymmetric and symmetric transmission, the symmetric autoregressive distribution lag (ARDL) model will be used too. Because China’s market-orientated oil pricing mechanism reform started in 1998, thus, domestic oil prices

ECONOMIC RESEARCH-EKONOMSKA ISTRAŽIVANJA 243
and global oil prices have been more closely linked since then. Therefore, quarterly data from 1998 are selected for our research, and PPI and CPI are used as proxy for domestic prices.
3. Methodology
The Phillips curve is the most important tool to study the relationship of inflation and output gap. Many previous studies add global crude oil price variables to the framework of the Phillips curve, so as to study the influence of global crude oil prices on inflation (Chen, 2009; Chou & Lin, 2013; Cunado & Pérez de Gracia, 2005; Hooker, 2002; LeBlanc & Chinn, 2004). In this article, we also investigate global oil prices impact on China’s PPI and CPI in the augmented Phillips curve framework. The general augmented Philips curve model with oil cost can be written as:
Where �t = pt − pt−1 = Δpt denotes inflation rate, pt in the log of the PPI or the CPI; UG refers to the gap between unemployment rate and the nature unemployment rate;otpresents the log of global crude oil price(lnoilt); L is the lag operator, �t is the iid error term. According to Okun’s law, UG can be substituted with the output gap, so (1) can be represented as follows:
Where yt and yt refer to output and potential output, so (
yt − yt)
can denote output gap. yt is the log of ouput(GDP) and yt is the Hodrick–Prescott filtered trend of yt. As �t can be substituted with (pt − pt−1) in equation (2), model (2) can be rewritten as:
Therefore, a long-run equilibrium relationship may exist between: pt, otand(
yt − yt)
in equa-tion (3). According to traditional cointegration theory (Engle, 1982; Engle & Granger, 1987), if variables are I(1) and cointegrated, their dynamic relationships can be represented as an error correction model (ECM). While Pesaran and Shin (1999) argued that, as long as variables obeyed I(0) or I(1), variables may be cointegrated and can be presented as an ARDL model based on ECM. They also assert that ARDL is more effective to determine cointegrating relationships when samples are small. Therefore, if price level (p), oil prices(o) and output gap
(
yt − yt)
obeyed I(0) or I(1) and are cointegrated, we can consider an ECM based on ARDL (ARDL-ECM) as follows:
Where ΔSymbol denotes first-order differential operation, and it indicates the change of price level or oil price. Model (4) can express the relationship between price level and oil price in the short- and long-run. The long-run coefficient of oil prices pass-through to price level can be defined as: Loil = −�∕�. However, the rise and fall of global oil prices are likely to have asymmetric and nonlinear influences on price levels in both the short- and long-run (Chou & Lin, 2013; Du et al., 2010; Mork, 1989), so an asymmetric and nonlinear
(1)�t = �(L)�t−i + �UGt + �(L)ot + �t
(2)𝜋t = 𝛽(L)𝜋t−i + 𝛾(yt − yt) + 𝜗(L)ot + 𝜀t
(3)pt = 𝛽�
(L)pt−i + 𝛾(yt − yt) + 𝜗(L)ot + 𝜀t
(4)𝜋t = Δp = 𝜇 + 𝜌pt−1 + 𝜃ot−1 +
m−1∑
i=1
𝜑iΔpt−i +
n−1∑
i=0
𝜏iΔot−i + 𝛾(
yt − yt)
+ 𝜀t

244 S. LONG AND J. LIANG
model is necessary to investigate the nonlinear and asymmetric relationship between oil price and oil price level.
Shin et al. (2013) developed a NARDL which employs positive and negative partial sum decompositions to investigate the asymmetric relationship in both the short- and long-run. We adopt the NARDL model to analyse asymmetric pass-through effects of oil price to price levels, and get both positive Δo+t and negative Δo−t partial sums by decomposition of ot:
where o+t and o−t are partial sum processes of positive and negative changes in ot. Then, we introduce o+t and o−t into symmetric ARDL(m, n) model (4) and the asymmetric ARDL(m, n) model presented as:
where m and n are lag orders for independent variables and dependent variables, respec-tively. We use the bounds-testing procedure suggested by Pesaran, Shin, and Smith (2001) to investigate the cointegration relationships between variables, the joint null of the modified F-test is, � = �+ = �−. Loil+ and Loil− are long-run influence coefficients of oil price rising and falling pass through to price level, respectively, and they can be defined as Loil+ = −�
+/
�, and Loil− = −�
−∕�. The long-run symmetry can be tested by a Wald test of the joint null
hypothesis −�+/
� = −�−∕�. The short-run symmetry can be tested by a standard Wald test
of the joint null hypothesis
If a short-run or a long-run (or both) asymmetry relationship is confirmed in the NARDL model, we can derive and trace the positive and negative cumulative dynamic multiplier effects of a unit change in o+t and o−t on pt, respectively.
(5)o+t =
t∑
j=1
Δo+j =
t∑
j=1
max(Δoj, 0)
(6)o−t =
t∑
j=1
Δo−j =
t∑
j=1
min(Δoj, 0)
(7)
𝜋t = 𝜇 + 𝜌pt−1 + 𝜃+o+t−1 + 𝜃−o−t−1 +
m−1∑
i=1
𝜑iΔpt−i+
n−1∑
i=0
(𝜏+t−1Δo+t−1 + 𝜏−t−1Δo
−t−1) + 𝛾
(
yt − yt)
+ 𝜀t
n−1∑
i=0
�+i =
n−1∑
i=0
�−i fori = 1, 2,… , n − 1.
(8)m+
h=
h∑
j=0
�pt+j
�o+t, and m−
h =
h∑
j=0
�pt+j
�o−t, h = 0, 1, 2…

ECONOMIC RESEARCH-EKONOMSKA ISTRAŽIVANJA 245
When h → ∞, then m+
h→ Loil+ and m−
h → Loil−. Loil+ = −�+/
�, and Loil− = −�+/
� are the positive and negative asymmetric long-run coefficients of oil price to price level, respec-tively, as defined previously.
4. Data and results
Quarterly data from 1998Q1 to 2014Q1 are used in the empirical analysis, all variables are seasonally adjusted and price variables of PPI, CPI and oil price are expressed in natural loga-rithms, lnppi, lncpi and lnoil. The crude oil (petroleum) price is utilised as the proxy indicator of global crude oil price, and the unit is US dollars per barrel. The oil price data are obtained from IMF’s International Financial Statistic (IFS) Database. CPI and PPI data are collected from the databases of BVD-EIU Country data, and both data of CPI and PPI are rebased to 2005=100. As mentioned before, yt is the log of GDP seasonal adjusted by Census X-12 approach, and yt is the Hodrick–Prescott filtered trend of yt, so
(
yt − yt)
is the output gap.Before regression, we apply the Augmented Dickey–Fuller (ADF) test, and Phillips–
Perron (PP) test to investigate the stationary properties of the lnppi, lncpi, (
yt − yt)
, and lnoil, As shown in Table 1, we find that series of lnppi, lncpi and
(
yt − yt)
are I(1). However, variable lnoil is I(0) by ADF test, while I(1) by PP test. Because of the extremely low power of the ADF test, we can consider lnoil as I (1) series, too. Therefore, we can construct ARDL and NARDL model to proceed cointegration tests and identify long-term equilib-rium relationships.
We select PPI and CPI as the proxy variables of domestic price index (p), and estimate symmetric and asymmetric effects of crude oil price fluctuations on PPI and CPI with ARDL and NARDL model, respectively. The empirical results are shown in Table 2. First, we observe the estimation results of oil price pass-through effects on China’s PPI. In the symmetric ARDL model, the FPSS test is not significant statistically at the 5% level, and the long-run coefficient Loil is not statistically significant either. This indicates that, in the symmetric transmission model, no cointegration relationship between global oil price and PPI exists, and that the influence of global oil price fluctuations on Chinese PPI is limited. However, FPSS is significant at the 1% level when we consider the asymmetric effects of global oil prices on PPI in the NARDL model, which denotes a cointegration relationship between global oil prices and PPI exists. Both Coefficients of Loil+ and Loil− are significant statistically at the 1% level, which indicate that increases and declines in global oil prices will bring significant influence to China’s PPI. Specifically, a 100% rise in global oil prices
Table 1. aDF unit root and PP stationarity tests.
notes: (1) the test equation includes both trend and intercept, and the optimal lags are determined using schwarz informa-tion criterion and the maximum lags are 8; (2) p-values of aDF and PP test adopt mackinnon’s (1996) one-sided p-values; (3) ***, **and* denote significance at the 1%, 5% and 10% level, respectively; and (4)the null hypothesis of both the aDF and PP test are the series have a unit root, if the null hypothesis is rejected, we can conclude that the series is stationary.
source: calculated by the authors.
Levels First-order difference
Variables ADF PP ADF PPlnppi −2.712 −2.537 −4.719*** −3.736**lncpi −2.932 −2.442 −4.317*** −4.499***lnoil −3.695** −2.688 −5.974*** −5.219***(yt − yt) −2.808 −2.452 −6.839*** −6.860***

246 S. LONG AND J. LIANG
Tabl
e 2.
sym
met
ric a
nd a
sym
met
ric e
stim
atio
n re
sults
for c
rude
oil
pric
es p
ass-
thro
ugh
to P
Pi a
nd c
Pi.
not
es: (
1) *
**, *
*and
* d
enot
e si
gnifi
canc
e at
1%
, 5%
and
10%
leve
l, re
spec
tivel
y; (2
) max
imum
lag
leng
ths
of m
and
n a
re 5
, and
the
gene
ral-t
o-sp
ecifi
c ap
proa
ch is
use
d to
dei
cide
the
final
spe
ci-
ficat
ions
by
drop
ping
all
insi
gnifi
cant
var
iabl
es; (
3) Loil i
ndic
ates
the
sym
met
ric lo
ng-r
un c
oeffi
cien
t of o
il pr
ice
pass
-thr
ough
; Loil+ a
nd Loil− re
fer t
o po
sitiv
e an
d ne
gativ
e lo
ng-r
un c
oeffi
cien
ts p
ass-
thro
ugh
of o
il pr
ice;
(4) F
PSSin
dica
tes
the
Pase
ran-
shin
-sm
ith F
test
sta
tistic
(Pes
aran
, shi
n, &
sm
ith, 2
001)
, and
follo
win
g sh
in e
t al.
(201
3), t
he c
onse
rvat
ive
of c
ritic
al v
alue
s is
ado
pted
, k =
1, a
nd
the
Upp
er b
ound
test
sta
tistic
s at
10%
, 5%
and
1%
are
4.7
8, 5
.73
and
7.84
, res
pect
ivel
y; (5
) �2 sc, �
2 HET
and
�2 Ramsey d
enot
e Br
eusc
h–G
odfr
ey L
m te
st fo
r ser
ial a
utoc
orre
latio
n, B
reus
ch–P
agan
test
for
hete
rosk
edas
ticity
, and
Ram
sey
REsE
t te
st, r
espe
ctiv
ely;
(6) W
LRre
fers
to th
e W
ald
test
for l
ong
and
shor
t-ru
n sy
mm
etry
, the
rele
vant
join
t nul
l hyp
othe
sis i
s −�+/
�=−�−∕�
, whi
le W
SR re
fers
to th
e
Wal
d te
st o
f sho
rt-r
un sy
mm
etry
and
the
rele
vant
join
t nul
l hyp
othe
sis i
s n−1
∑ i=0
�+ i=
n−1
∑ i=0
�− i
; (7)
p-v
alue
s and
sta
ndar
d Er
ror a
re d
ispl
ayed
in P
aren
thes
es a
nd b
rack
ets,
resp
ectiv
ely;
and(
8)cU
sUm
de
note
the
cUsU
m te
st fo
r sta
bilit
y of
par
amet
ers.
sour
ce: c
alcu
late
d by
the
auth
ors.
OIL→
PPI
OIL→
CPI
Sym
met
ric A
RDL
NA
RDL
Sym
met
ric A
RDL
NA
RDL
lnppi t−
1−0
.078
***(
0.02
6) lnppi t−
1−0
.219
***(
0.04
0) lncpi t−
1−0
.022
(0.0
14)
lncpi t−
1−0
.062
***(
0.02
1) lnoil t−1
0.01
5 (0
.005
) lnoil+ t−
10.
031*
** (0
.006
) lnoil t−1
0.00
7**
(0.0
03)
lnoil+ t−
10.
009*
** (0
.003
) Δlnppi t−
10.
411*
** (0
.083
) lnoil− t−
1−
0.01
8***
(0.0
07)
Δlncpi t−
10.
236*
(0.1
26)
lnoil− t−
1−
0.00
2 (0
.004
) Δlnoilt−1
0.06
9***
(0.0
07)
Δlnppi t−
10.
362*
** (0
.075
) Δlncpi t−
20.
437*
** (0
.137
) Δlncpi t−
20.
392*
** (0
.127
) (
y t−y t)
0.
060
(0.0
46)
Δlnoil+ t
0.08
0***
(0.0
14)
Δlncpi t−
3−
0.41
0***
(0.1
04)
Δlncpi t−
4−
0.40
5***
(0.1
01)
cons
tant
0.30
1***
(0.1
03)
Δlnoil+ t−4
0.02
5* (0
.012
6) Δlnoilt
0.01
9***
(0.0
05)
Δlnoil+ t
0.02
7***
(0.0
10)
Δlnoil− t
0.06
6***
(0.0
10)
Δlnoilt−2
−0.
016*
** (0
.005
) Δlnoil+ t−2
−0.
029*
** (0
.009
) (
y t−y t)
0.15
6**
(0.0
59)
(
y t−y t)
0.01
0 (0
.039
) Δlnoil− t
0.01
7**
(0.0
07)
cons
tant
0.95
9***
(0.1
76)
cons
tant
0.07
6 (0
.056
) (
y t−y t)
0.08
4**
(0.0
40)
cons
tant
0.27
8***
(0.0
92)
FPSS
5.10
* FPSS
10.7
3***
FPSS
3.88
FPSS
7.28
** Loil
0.19
2 Loil+
0.14
3***
Loil
0.31
8 Loil+
0.14
3***
Loil−
0.08
2***
Loil−
0.03
6 W
LR21
.06*
** W
LR11
.3**
* W
SR2.
882*
WSR
1.47
2
Dia
gnos
tic te
sts s
tatis
tics
R20.
7843
R20.
8439
R20.
6544
R20.
6840
adj-R
20.
7654
adj-R
20.
8194
adj-R
20.
6002
adj-R
20.
6271
�2 sc
0.70
4 [0
.402
] �
2 sc1.
376
[0.2
41]
�2 sc
0.00
2 [0
.966
] �
2 sc0.
151
[0.6
98]
�2 HET
0.40
[0.5
25]
�2 HET
0.62
[0.4
31]
�2 HET
0.01
[0.9
21]
�2 HET
0.55
[0.4
579]
�2 Ram
sey
0.62
[0.6
07]
�2 Ram
sey
0.60
[0.6
18]
�2 Ram
sey
1.55
[0.2
15]
�2 Ram
sey
0.30
[0.8
27]
cusu
mst
able
cusu
mst
able
cusu
mst
able
cusu
mst
able

ECONOMIC RESEARCH-EKONOMSKA ISTRAŽIVANJA 247
will bring a 14.3% rise in domestic PPI, and a 100% decline in global oil prices can only cause 8.2% of China’s PPI to fall, so the asymmetric effect is obvious. WSR is only statistically significant at the 10% level, which shows that, in the short-run, the global oil price has only weak asymmetric effect on China’s PPI.
According to the estimation results of ARDL and NARDL models, if we do not consider the asymmetric transmission from crude oil prices to PPI, the asymmetric effects of oil price on China’s PPI may be neglected in the long-run. The R2 of estimation in NARDL model is greater than in ARDL model, which further indicates that estimation results by the NARDL model is better than by the ARDL model, so it is necessary to consider the asymmetric pass-through effects of global oil prices on China’s PPI. In Diagnostic Tests Statistics, the Breusch–Godfrey Lagrange multiplier test the and Breusch–Pagan test indicate that there are no serial autocorrelation and heteroskedasticity in the residuals. The Ramsey Regression Equation Specification Error Test and cumulative sum (CUSUM) tests show that model sets are appropriate and coefficients estimated are stable.
We investigate the effects of global oil prices on China’s CPI. In the estimate of the symmetric ARDL model, FPSS is not significant statistically, which means that no long-term stable relationship between global oil prices and China’s CPI exists. However, in the NARDL model, FPSS test is statistically significant at the 5% level, and this means that if the asymmetric transition effects of global oil price on China’s CPI is taken into account, there is a long-run equilibrium relationship between global oil prices and China’s CPI. WLR is significant statistically at the 1% level, and it denotes the asymmetric effect of global oil prices on the Chinese CPI is remarkable. The long-run coefficient of global oil prices increase impacts on China’s CPI, Loil+ is 0.143, and is significant at the 1% level statistically, indicating that a 100% rise in global oil prices will bring a 14.3% rise to China’s CPI in the long-run. However, Loil− is not significant in statistics, and it denotes that the decline effect of global oil prices to the Chinese CPI is limited. WSR is not significant statistically, so the asymmetric effects of global oil prices to CPI is not significant in the short-term in China. Similarly, the R2 of the NARDL model is greater than that of the ARDL model, which indi-cates that the estimation result of the NARDL model is better than the ARDL model, and that it is necessary to consider the asymmetry impact of global oil price to CPI. In diagnostic tests statistics, we can find that there exists no serial autocorrelation and heteroskedasticity in the residuals, so models sets are good, and coefficient estimates are stable. Therefore, the estimation results of these models are reasonable and credible.
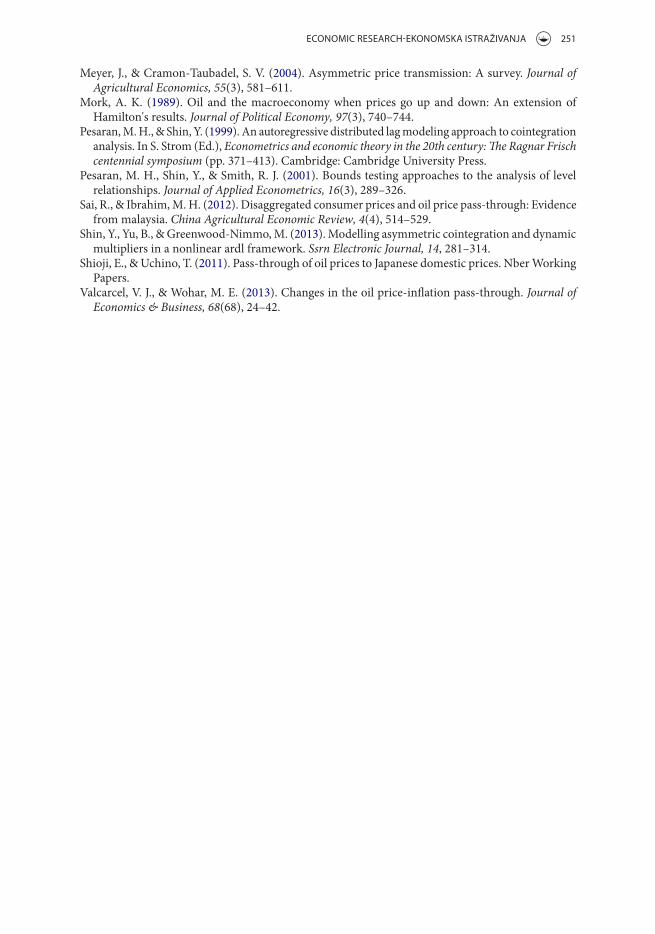
Finally, we trace paths of asymmetric effects of global oil prices rise and fall to China’s PPI and CPI by cumulative dynamic multiplier effects graph. And the bootstrap 95% con-fidence intervals (CI) for asymmetry are estimated too.2
Figure 1 plots the cumulative effect of lnPPI to lnoil (the left graph) and cumulative effect of lnCPI to lnoil (the right graph), and the longest period is selected to 40 period. The initial 1 unit of global oil prices increase will make China’s PPI rise sharply in the short-term, and reach the maximum level of 18% in the fifth period, and then PPI will decrease gradually and reach the stable level of 14.3% in the tenth period. While the initial 1 units of the drop in oil prices will make China’s PPI decline rapidly in the short-run, and reach the minimum level of -10% in the third period, the PPI will increase gradually, and reach the stable value of −8.2% in the tenth period. That is to say, the cumulative effect of global oil prices on China’s PPI is roughly 10 periods in the long-run. The asymmetric effect of global oil price on China’s PPI is quite obvious, and the global oil prices increase

248 S. LONG AND J. LIANG
on China’s PPI is significantly greater than the decline effect of global oil price on PPI. The asymmetric effect of the price of oil on PPI reaches the maximum state in the eighth period, and then gradually declines, and eventually stagnates at a stable level of about 6.1%.
In the graph of the asymmetric cumulative effect of global oil on China’s CPI (the right graph of Figure 1), the unit of positive innovation in global oil prices will make China’s CPI swing up and down in the short-run, and then rise rapidly after fourth period, and ultimately achieve equilibrium at a level of 14.3%. However, unit decline in global oil prices will bring concussion effects on China’s CPI fall in the short-run, and generate decline impacts on CPI from the sixth period, and finally reach a stable level of -3.6%. And the asymmetric effect of global oil price to China’s CPI is very clear. After experiencing four periods of up and down shocks, the asymmetric effects increase dramatically after a long time, and finally reach a new steady state.
5. Conclusion
In this article, we investigate both the symmetrical and asymmetrical impacts of global oil prices on China’s PPI and CPI using the ARDL-ECM and NARDL-ECM model in an augmented Phillips curve framework. The results show that effects of global oil prices on China’s PPI and CPI are asymmetrical. When the asymmetrical impacts are not considered, there exists no long-term equilibrium relationship between global oil prices and China’s price levels (PPI and CPI). While considering the asymmetrical impacts, there exists a stable long-term relationship between oil prices and China’s PPI and CPI, respectively, which means that global oil price fluctuations do affect China’s price levels in the long-run asymmetrically. Therefore, it is necessary to consider the asymmetric effect of oil price on China’s domestic price levels, it also confirms the cointegrating relationship that exists between the positive and negative components of the underlying variables, an effect of ‘hidden cointegration’ (Granger & Yoon, 2002).
-.05
0.0
5.1
.15
0 10 20 30 40Time periods
positive change negative changeasymmetry CI for asymmetry
Cumulative effect of LNOIL on LNCPI-.1
0.1
.2
0 10 20 30 40Time periods
positive change negative changeasymmetry CI for asymmetry
Cumulative effect of LNOIL on LNPPI
Figure 1. asymmetric cumulative effect of oil price to china’s PPi and cPi. source: calculated by the authors.

ECONOMIC RESEARCH-EKONOMSKA ISTRAŽIVANJA 249
The impact of global oil prices increase on China’s PPI or CPI is greater than the decline of oil prices on PPI or CPI, which confirms price transmission is asymmetric, a phenom-enon referred to as ‘rockets and feathers’(Bacon, 1991). At the same time, it shows that the rise in global oil prices will bring China’s price level up significantly, while the decline in global oil price will generate smaller decline effects on China’s price level, so the asym-metric effect is very obvious. There is no doubt that China faces an increase in import demand in global crude oil, and the relationship between China’s prices and global crude oil prices become more closely linked because of market-orientated oil pricing mechanism reforms. However, the government still has a strong control effect on the oil price. Therefore, when global oil prices are rising, the authorities have the cost pressures to adjust domestic oil prices, so that the cost of production and living increase, and oil costs ultimately reflect on the PPI and the CPI. However, when the global oil prices are declining, and authorities and the domestic monopoly enterprises of crude oil imports have no incentive to lower domes-tic oil prices, the decline effects of global oil prices on domestic PPI and CPI are smaller.
With the increasing demand for imported crude oil being driven by China’s rapid eco-nomic growth, and its market reform to reduce oil price controls, the global oil price move-ments will affect the Chinese price level change to a greater extent. Therefore, it is necessary to pay more attention to the changes of global crude oil prices when suppressing inflation and monitoring price level fluctuation. Impacts of global oil price increases and declines on China’s PPI or CPI are different, so the government should adopt different intensity mone-tary policy efforts to deal with the rise and decline of global oil prices. Because of oil price controls and domestic oil giants’ monopolies, the global oil price transmission on PPI and CPI is not smooth and asymmetrical, and will cause welfare loss to production enterprises and resident consumers. The government needs to further relax oil prices control, and reduces monopoly pricing power of the petroleum enterprises. In addition, the government should increase domestic oil exploration and petroleum reserves, find alternative sources of energy, and improve energy efficiency, so as to reduce global oil price impacts on China’s price level fluctuation.
Notes
1. Although there is no consistent definition to oil price pass-through effect, most of literature related to this theme generally researches the extent of inflation changes caused by oil price fluctuation (Hamilton,1983; Hamilton & Herrera, 2001; Barsky, Kilian, & Blanchard, 2002; Blanchard & Galí, 2007; De Gregorio, Landerretche, & Neilson, 2007; Chen, 2009; Chou & Lin, 2013; Ibrahim & Chancharoenchai, 2014).
2. The cumulative dynamic multipliers are estimated by the ordinary least squares (OLS) method according to model (8). For technical details, see Shin, Y., Yu, B., & Greenwood-Nimmo, M. (2013).
Disclosure statement
No potential conflict of interest was reported by the authors.

250 S. LONG AND J. LIANG
Funding
This work was supported by the Fundamental Research Funds for the Central Universities [grant number 2017CDJSK01XK13]; the National Social Science Foundation of China [grant number 16CJL007], the Major Program of Humanities and Social Science Key Research Base of Ministry of Education [grant number 13JJD790036], and Outstanding Innovative Talents Cultivation Funded Programs 2014 of Renmin University of China.
References
Álvarez, L. J., Hurtado, S., Sánchez, I., & Thomas, C. (2011). The impact of oil price changes on Spanish and Euro area consumer price inflation. Economic Modelling, 28(1–2), 422–431.
Bacon, R. W. (1991). Rockets and feathers: The asymmetric speed of adjustment of U.K. retail gasoline prices to cost changes. Energy Economics, 13(3), 211–218.
Barsky, R. B., & Kilian, L. (2004). Oil and the macroeconomy since the 1970s. Journal of Economic Perspectives, 18(4), 115–134.
Barsky, R., Kilian, L., & Blanchard, O. (2002). Comments on do we really know that oil caused the great stagnation? A monetary alternative. NBER Macroeconomics Annual, 16, 183–192.
Blanchard, O. J., & Galí, J. (2007). The macroeconomic effects of oil shocks: Why are the 2000s so different from the 1970s?. Barcelona: Ssrn Electronic Journal.
Chen, S. S. (2009). Oil price pass-through into inflation. Energy Economics, 31(1), 126–133.Chou, K. W., & Lin, P. C. (2013). Oil price shocks and producer prices in Taiwan: An application of
non-linear error-correction models. Journal of Chinese Economic and Business Studies, 11(1), 59–72.Chou, K. W., & Tseng, Y. H. (2011). Pass-through of oil prices to CPI inflation in Taiwan. International
Research Journal of Finance & Economics, 6(69), 73–83.Cunado, J., & Pérez de Gracia, F. (2005). Oil prices, economic activity and inflation: Evidence for
some Asian countries. The Quarterly Review of Economics and Finance, 45(1), 65–83.De Gregorio, J., Landerretche, O., Neilson, C., (2007). Another pass-through bites the dust? Oil prices
and inflation. Working Papers Central Bank of Chile, 417.Du, L., Yanan, H., & Wei, C. (2010). The relationship between oil price shocks and China’s macro-
economy: An empirical analysis. Energy Policy, 38(8), 4142–4151.Engle, R. F. (1982). Autoregressive conditional heteroskedasticity with estimates of the variance of
United Kingdom inflation. Econometrica, 50(4), 987–1007.Engle, R. F., & Granger, C. W. J. (1987). Cointegration and error correction: Representation, estimation
and testing. Econometrica, 55 (2), 251–276.Granger, C. W., & Yoon, G. (2002). Hidden cointegration. U of California, Economics Working
Paper, (2002-02).Hamilton, J. D. (1983). Oil and the macroeconomy since world war II. Journal of Political Economy,
91(2), 228–248.Hamilton, J. D. (2009). Understanding crude oil prices. Energy Journal, 30, 179–206.Hamilton, J. D. (2011). Nonlinearities and the macroeconomic effects of oil prices. Macroeconomic
Dynamics, 15(s3), 364–378.Hamilton, J. D., & Herrera, A. M. (2001). Oil shocks and aggregate macroeconomic behavior: The
role of monetary policy: A comment. Journal of Money Credit & Banking, 36:2(542498), 265–286.Hooker, M. A. (2002). Are oil shocks inflationary? asymmetric and nonlinear specification versus
changes in regime. Journal of Money, Credit, and Banking, 34(2), 540–561.Ibrahim, M. H., & Chancharoenchai, K. (2014). How inflationary are oil price hikes? A disaggregated
look at Thailand using symmetric and asymmetric cointegration models. Journal of the Asia Pacific Economy, 19(3), 409–422(14).
Killian, L. (2008). A comparison of the effects of exogenous oil supply shocks on output and inflation in the G7countries. Journal of the European Economic Association, 6(1), 78–121.
LeBlanc, M., & Chinn, M. D. (2004). Do high oil prices presage inflation? The evidence from G5 countries. Business Economics, 34, 38–48.
ECONOMIC RESEARCH-EKONOMSKA ISTRAŽIVANJA 251
Meyer, J., & Cramon-Taubadel, S. V. (2004). Asymmetric price transmission: A survey. Journal of Agricultural Economics, 55(3), 581–611.
Mork, A. K. (1989). Oil and the macroeconomy when prices go up and down: An extension of Hamilton's results. Journal of Political Economy, 97(3), 740–744.
Pesaran, M. H., & Shin, Y. (1999). An autoregressive distributed lag modeling approach to cointegration analysis. In S. Strom (Ed.), Econometrics and economic theory in the 20th century: The Ragnar Frisch centennial symposium (pp. 371–413). Cambridge: Cambridge University Press.
Pesaran, M. H., Shin, Y., & Smith, R. J. (2001). Bounds testing approaches to the analysis of level relationships. Journal of Applied Econometrics, 16(3), 289–326.
Sai, R., & Ibrahim, M. H. (2012). Disaggregated consumer prices and oil price pass-through: Evidence from malaysia. China Agricultural Economic Review, 4(4), 514–529.
Shin, Y., Yu, B., & Greenwood-Nimmo, M. (2013). Modelling asymmetric cointegration and dynamic multipliers in a nonlinear ardl framework. Ssrn Electronic Journal, 14, 281–314.
Shioji, E., & Uchino, T. (2011). Pass-through of oil prices to Japanese domestic prices. Nber Working Papers.
Valcarcel, V. J., & Wohar, M. E. (2013). Changes in the oil price-inflation pass-through. Journal of Economics & Business, 68(68), 24–42.