ASX Code: AMP Price: $4.82 12 Mth Target Price: $3.97 ... · Business Summary AMP Limited (AMP) is...
2
Business Summary AMP Limited (AMP) is Australia and New Zealand's independent wealth management company, with an international investment management business and a retail banking business in Australia. It serves customers in Australia, New Zealand, Asia, Europe, the Middle East and North America. AMP's business consists of Australian wealth management, AMP Capital, Australian wealth protection, AMP Bank, New Zealand financial services and Australian mature. The Australian wealth management: It provides customers with superannuation, retirement income, investment, SMSF administration and financial planning services (through aligned and owned advice businesses). AMP Capital: It is a diversified investment manager, managing investments across major asset classes including equities, fixed interest, infrastructure, property, diversified funds, multi-manager and multi-asset funds. AMP Bank: It is an Australian retail bank offering residential mortgages, deposits, transaction banking and SMSF products. It also has a portfolio of practice finance loans. AMP Bank distributes through AMPs aligned distribution network as well as third party brokers, and direct to retail customers via phone and online. Australian wealth protection: It comprises individual and group term, disability and income protection insurance products. Products can be bundled with a superannuation product or held independently. The Australian mature: This business comprises of products which are closed to new business and are in run-off. Products within Australian mature include whole of life, endowment, investment-linked, investment account, Retirement Savings Account, Eligible Rollover Fund, annuities, insurance bonds, personal superannuation and guaranteed savings accounts. New Zealand financial services: It provides tailored financial products and solutions to New Zealanders through a network of financial advisers. They provide Risk insurance, wealth management and mature book (traditional participating business), with growth in wealth management driven by KiwiSaver. Latest Research Follow up cut to earnings from fee caps We revisit AMP to further reduce our EPS estimates following the Federal Budget release earlier this month. In our report dated 10 May, titled “Avoid Bottom Fishing” we explored four areas in AMP’s business that we see experiencing a negative outcome following the Federal Budget. One of the areas discussed related to the proposed 3% fee cap on balances less than $6,000 and included a moderate negative EPS adjustment to account for this. After further analysis we believe our previous downgrade was insufficient given the high number of AMP accounts which have a low balance and as explored below. For more information see full research report 29 May 2018. GICS - Div. Financials AMP Limited ASX Code: AMP Price: $3.84 12 Mth Target Price: $3.29 Rating: Sell Important Disclaimer - This may affect your legal rights: Because this document has been prepared without consideration of any specific client's financial situation, particular needs and investment objectives, a Bell Potter Securities Limited investment adviser (or the financial services licensee, or the proper authority of such licensee, who has provided you with this report by arrangement with Bell Potter Securities Limited) should be consulted before any investment decision is made. While this document is based on the information from sources which are considered reliable, Bell Potter Securities Limited, its directors, employees and consultants do not represent, warrant or guarantee, expressly or impliedly, that the information contained in this document is complete or accurate. Nor does Bell Potter Securities Limited accept any responsibility to inform you of any matter that subsequently comes to its notice, which may affect any of the information contained in this document. This document is a private communication to clients and is not intended for public circulation or for the use of any third party, without the prior approval of Bell Potter Securities Limited. This is general investment advice only and does not constitute advice to any person. Disclosure of Interest: Bell Potter Securities Limited receives commission from dealing in securities and its authorised representatives, or introducers of business, may directly share in this commission. Bell Potter Securities and its associates may hold shares in the companies recommended. Snapshot Date Market Cap. Shares on issue 12 Month High 12 Month Low 4 June 2018 $11,207m 2,918.5m $5.49 $3.69 Rating Rating 12 Mth Target Price Capital Gain Gross Yield Implied Total Return Sell $3.29 -14.3% 8.6% -5.8% Investment Fundamentals FYE 31 Dec 2017A 2018F 2019F 2020F Profit $m 1,040.0 936.3 885.3 821.1 Profit (norm)* $m 1,040.0 936.3 885.3 821.1 EPS* ¢ 35.4 31.8 30.1 27.9 EPS Growth % 116.6 -10.0 -5.4 -7.3 P/E* x 10.9 12.1 12.8 13.8 P/E Relative % 0.0 0.0 0.0 0.0 DPS ¢ 29.0 24.0 24.0 23.0 Yield % 7.6 6.2 6.2 6.0 Franking % 90.0 90.0 90.0 90.0 * Adjusted for goodwill and unusual items Source: Based on Bell Potter estimates Share Price Chart Total Return on $10,000 Investment
Transcript of ASX Code: AMP Price: $4.82 12 Mth Target Price: $3.97 ... · Business Summary AMP Limited (AMP) is...

Business SummaryAMP Limited (AMP) is Australia and New Zealand's independent wealthmanagement company, with an international investment managementbusiness and a retail banking business in Australia. It serves customers inAustralia, New Zealand, Asia, Europe, the Middle East and North America.AMP's business consists of Australian wealth management, AMP Capital,Australian wealth protection, AMP Bank, New Zealand financial services andAustralian mature.
The Australian wealth management: It provides customers withsuperannuation, retirement income, investment, SMSF administration andfinancial planning services (through aligned and owned advice businesses).
AMP Capital: It is a diversified investment manager, managing investmentsacross major asset classes including equities, fixed interest, infrastructure,property, diversified funds, multi-manager and multi-asset funds.
AMP Bank: It is an Australian retail bank offering residential mortgages,deposits, transaction banking and SMSF products. It also has a portfolio ofpractice finance loans. AMP Bank distributes through AMPs aligneddistribution network as well as third party brokers, and direct to retailcustomers via phone and online.
Australian wealth protection: It comprises individual and group term,disability and income protection insurance products. Products can be bundledwith a superannuation product or held independently.
The Australian mature: This business comprises of products which areclosed to new business and are in run-off. Products within Australian matureinclude whole of life, endowment, investment-linked, investment account,Retirement Savings Account, Eligible Rollover Fund, annuities, insurancebonds, personal superannuation and guaranteed savings accounts.
New Zealand financial services: It provides tailored financial products andsolutions to New Zealanders through a network of financial advisers. Theyprovide Risk insurance, wealth management and mature book (traditionalparticipating business), with growth in wealth management driven byKiwiSaver.
Latest ResearchFollow up cut to earnings from fee caps
We revisit AMP to further reduce our EPS estimates following the FederalBudget release earlier this month. In our report dated 10 May, titled “AvoidBottom Fishing” we explored four areas in AMP’s business that we seeexperiencing a negative outcome following the Federal Budget. One of theareas discussed related to the proposed 3% fee cap on balances less than$6,000 and included a moderate negative EPS adjustment to account forthis. After further analysis we believe our previous downgrade wasinsufficient given the high number of AMP accounts which have a lowbalance and as explored below.
For more information see full research report 29 May 2018.
GICS - Div. Financials
AMP Limited
ASX Code: AMP Price: $3.84 12 Mth Target Price: $3.29 Rating: Sell
Important Disclaimer - This may affect your legal rights: Because this document has been prepared without consideration of any specific client's financial situation, particular needs and investmentobjectives, a Bell Potter Securities Limited investment adviser (or the financial services licensee, or the proper authority of such licensee, who has provided you with this report by arrangement withBell Potter Securities Limited) should be consulted before any investment decision is made. While this document is based on the information from sources which are considered reliable, Bell PotterSecurities Limited, its directors, employees and consultants do not represent, warrant or guarantee, expressly or impliedly, that the information contained in this document is complete or accurate.Nor does Bell Potter Securities Limited accept any responsibility to inform you of any matter that subsequently comes to its notice, which may affect any of the information contained in this document.This document is a private communication to clients and is not intended for public circulation or for the use of any third party, without the prior approval of Bell Potter Securities Limited. This is generalinvestment advice only and does not constitute advice to any person.Disclosure of Interest: Bell Potter Securities Limited receives commission from dealing in securities and its authorised representatives, or introducers of business, may directly share in thiscommission. Bell Potter Securities and its associates may hold shares in the companies recommended.
Snapshot
DateMarket Cap.Shares on issue12 Month High12 Month Low
4 June 2018$11,207m2,918.5m$5.49$3.69
RatingRating12 Mth Target Price
Capital GainGross Yield
Implied Total Return
Sell$3.29-14.3%8.6%-5.8%
Investment FundamentalsFYE 31 Dec 2017A 2018F 2019F 2020F
Profit $m 1,040.0 936.3 885.3 821.1Profit (norm)* $m 1,040.0 936.3 885.3 821.1
EPS* ¢ 35.4 31.8 30.1 27.9EPS Growth % 116.6 -10.0 -5.4 -7.3P/E* x 10.9 12.1 12.8 13.8P/E Relative % 0.0 0.0 0.0 0.0
DPS ¢ 29.0 24.0 24.0 23.0Yield % 7.6 6.2 6.2 6.0Franking % 90.0 90.0 90.0 90.0* Adjusted for goodwill and unusual itemsSource: Based on Bell Potter estimates
Share Price Chart
Total Return on $10,000 Investment
Profit & Loss ($M)2013A 2014A 2015A 2016A 2017A
Net Earned Premiums 2,070 2,149 2,161 2,640 2,362Claims Expense -1,871 -1,888 -1,860 -1,888 -1,812Underwriting Profit -1,049 -1,044 -1,045 -1,162 -1,366Investment Income 15,382 12,370 8,616 8,567 11,888Unrealised Gains -- -- -- -- --Profit Before Tax 1,486 1,786 2,160 1,188 1,748Income Tax -782 -843 -280 -166 -763Outside Equity Int. -44 -87 -741 -536 -25Profit after Tax 660 856 1,139 486 960Significant Items after Tax 12 28 -167 -830 -112Reported Profit after Tax 672 884 972 -344 848Preference Dividends -- -- -- -- --
Cash Flow ($M)2013A 2014A 2015A 2016A 2017A
Premiums Received 17,702 20,326 19,773 19,072 18,067Outward Reinsurance Paid -- -- -- -- --Claims Paid -- -- -- -- --Reinsurance Received -- -- -- -- --Net Operating Cashflow 858 1,086 1,342 175 -1,398Acquisitions & Investments -5,303 -135 -5,622 -- -293Sale of Invest. & Subsid. -- 2,879 -322 1,463 -2,614Net Investing Cashflow -5,296 2,558 -6,142 1,452 -2,953Proceeds from Issues -- -- -- -- --Dividends Paid -559 -700 -800 -821 -828Net Financing Cashflow 2,197 421 167 577 2,771Net Increase Cash -2,241 4,065 -4,633 2,204 -1,580Cash at Beginning 9,352 7,157 11,232 6,601 8,810Exchange Rate Adjust. 46 10 2 5 -8Cash at End 7,157 11,232 6,601 8,810 7,222
Ratios and Substantial Shareholders2013A 2014A 2015A 2016A 2017A
Profitability RatiosClaims Ratio % 90.39 87.85 86.07 71.52 76.71Expense Ratio % 60.29 60.73 62.29 72.50 81.12Combined Ratio % 150.68 148.58 148.36 144.02 157.83Return on Equity % 8.05 10.21 12.80 6.44 13.18
Safety RatiosSolvency Ratio % 385.51 371.66 376.82 279.66 301.48
Top 5 Substantial ShareholdersHarris Associates L P 5.0%The Vanguard Group,Inc 5.0%
Balance Sheet ($M)2013A 2014A 2015A 2016A 2017A
Cash & Equivalent 2,938 3,581 3,955 3,476 3,602Receivables 2,418 2,518 2,558 1,857 2,103Investments -- -- -- -- --Other Current Assets 433 224 158 147 145Current Assets 5,789 6,323 6,671 5,480 5,850Receivables 13,418 14,590 15,281 17,868 20,252Investments 106,715 106,720 111,003 111,596 116,912PP&E 456 401 423 66 75Other (inc Intangibles) 6,846 6,821 6,330 5,050 4,996Non-Current Assets 127,435 128,532 133,037 134,580 142,235Total Assets 133,224 134,855 139,708 140,060 148,085Trade Creditors 1,910 1,951 2,031 1,840 1,635Unearned Premiums -- -- -- -- --Outstanding Claims -- -- -- -- --Borrowings 15,871 12,078 7,655 13,127 13,844Provisions 504 689 758 531 549Other 1,428 865 225 92 --Total Liabilities 19,713 15,583 10,669 15,590 16,028Unearned Premiums -- -- -- -- --Outstanding Claims -- -- -- 24,225 23,683Borrowings 1,421 5,574 10,680 5,241 7,654Provisions 2,110 2,336 2,076 1,946 2,190Other (inc Creditors) 101,780 102,977 107,388 85,517 91,247Non-Current Liabilities 105,311 110,887 120,144 116,929 124,774Net Assets 8,200 8,385 8,895 7,541 7,283
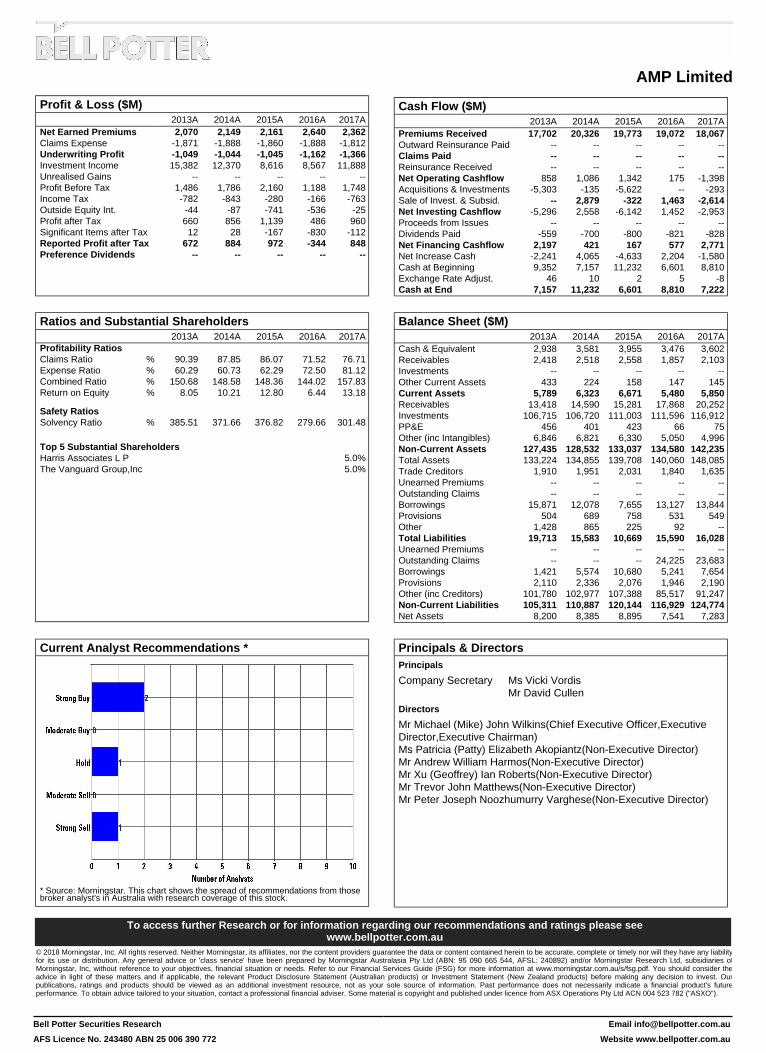
Current Analyst Recommendations *
* Source: Morningstar. This chart shows the spread of recommendations from thosebroker analyst's in Australia with research coverage of this stock.
Principals & DirectorsPrincipals
Company Secretary Ms Vicki VordisMr David Cullen
Directors
Mr Michael (Mike) John Wilkins(Chief Executive Officer,ExecutiveDirector,Executive Chairman)Ms Patricia (Patty) Elizabeth Akopiantz(Non-Executive Director)Mr Andrew William Harmos(Non-Executive Director)Mr Xu (Geoffrey) Ian Roberts(Non-Executive Director)Mr Trevor John Matthews(Non-Executive Director)Mr Peter Joseph Noozhumurry Varghese(Non-Executive Director)
To access further Research or for information regarding our recommendations and ratings please seewww.bellpotter.com.au
© 2018 Morningstar, Inc. All rights reserved. Neither Morningstar, its affiliates, nor the content providers guarantee the data or content contained herein to be accurate, complete or timely nor will they have any liabilityfor its use or distribution. Any general advice or 'class service' have been prepared by Morningstar Australasia Pty Ltd (ABN: 95 090 665 544, AFSL: 240892) and/or Morningstar Research Ltd, subsidiaries ofMorningstar, Inc, without reference to your objectives, financial situation or needs. Refer to our Financial Services Guide (FSG) for more information at www.morningstar.com.au/s/fsg.pdf. You should consider theadvice in light of these matters and if applicable, the relevant Product Disclosure Statement (Australian products) or Investment Statement (New Zealand products) before making any decision to invest. Ourpublications, ratings and products should be viewed as an additional investment resource, not as your sole source of information. Past performance does not necessarily indicate a financial product's futureperformance. To obtain advice tailored to your situation, contact a professional financial adviser. Some material is copyright and published under licence from ASX Operations Pty Ltd ACN 004 523 782 ("ASXO").
AMP Limited
Bell Potter Securities Research
AFS Licence No. 243480 ABN 25 006 390 772
Email [email protected]
Website www.bellpotter.com.au