Astrophysical Interpretation of AMS-02 Leptonic Datanow/now2014/web-content/TALKS/aMon/... · racy...
25
NOW 2014 Conca Specchiulla – 8.09.2014 Nicolao Fornengo Department of Physics (Theory Division) – University of Torino and Istituto Nazionale di Fisica Nucleare (INFN) – Torino Italy fornengo@to.infn.it [email protected] www.to.infn.it/~fornengo www.astroparticle.to.infn.it Torino Astrophysical Interpretation of AMS-02 Leptonic Data Report on: Di Mauro, Donato, NF, Lineros, Vittino, JCAP 04 (2014) 006 [arXiv:1402.0321]
-
Upload
truongthuy -
Category
Documents
-
view
214 -
download
1
Transcript of Astrophysical Interpretation of AMS-02 Leptonic Datanow/now2014/web-content/TALKS/aMon/... · racy...

NOW 2014 Conca Specchiulla – 8.09.2014
Nicolao Fornengo Department of Physics (Theory Division) – University of Torino
and Istituto Nazionale di Fisica Nucleare (INFN) – Torino Italy
[email protected] [email protected]
www.to.infn.it/~fornengo www.astroparticle.to.infn.it
Torino
Astrophysical Interpretation of AMS-02 Leptonic Data
Report on: Di Mauro, Donato, NF, Lineros, Vittino, JCAP 04 (2014) 006 [arXiv:1402.0321]

Cosmic-rays leptons
� Excellent data on cosmic-rays leptons are available from space-borne detectors, from about up 0.5 GeV to few hundreds of GeV
- Flux
- Flux
- Flux
- PF
10 GeV the positron fraction decreases with increasingenergy as expected from the secondary production ofcosmic rays by collision with the interstellar medium.The positron fraction is steadily increasing from 10 to!250 GeV. This is not consistent with only the secondaryproduction of positrons [17]. The behavior above 250 GeVwill become more transparent with more statistics whichwill also allow improved treatment of the systematics.
Table I (see also [13]) also presents the contribution ofindividual sources to the systematic error for different binswhich are added in quadrature to arrive at the total system-atic uncertainty. As seen, the total systematic error at thehighest energies is dominated by the uncertainty in themagnitude of the charge confusion.
Most importantly, several independent analyses wereperformed on the same data sample by different studygroups. Results of these analyses are consistent with thosepresented in Fig. 5 and in Table I (see also [13]).
The observation of the positron fraction increase withenergy has been reported by earlier experiments: TS93[18], Wizard/CAPRICE [19], HEAT [20], AMS-01 [21],PAMELA [22], and Fermi-LAT [23]. The most recentresults are presented in Fig. 5 for comparison. The accu-racy of AMS-02 and high statistics available enable thereported AMS-02 positron fraction spectrum to be clearlydistinct from earlier work. The AMS-02 spectrum has theunique resolution, statistics, and energy range to provideaccurate information on new phenomena.The accuracy of the data (Table I and [13]) enables us to
investigate the properties of the positron fraction withdifferent models. We present here the results of comparingour data with a minimal model, as an example. In thismodel the eþ and e# fluxes,!eþ and!e# , respectively, areparametrized as the sum of individual diffuse power lawspectra and the contribution of a single common sourceof e$:
!eþ ¼ CeþE#!eþ þ CsE
#!se#E=Es ; (1)
!e# ¼ Ce#E#!e# þ CsE
#!se#E=Es (2)
(with E in GeV), where the coefficients Ceþ and Ce#
correspond to relative weights of diffuse spectra for posi-trons and electrons, respectively, and Cs to the weight ofthe source spectrum; !eþ , !e# , and !s are the correspond-ing spectral indices; and Es is a characteristic cutoff energyfor the source spectrum. With this parametrization thepositron fraction depends on five parameters. A fit to thedata in the energy range 1–350 GeV based on the numberof events in each bin yields a "2=d:f: ¼ 28:5=57 and thefollowing: !e# # !eþ ¼ #0:63$ 0:03, i.e., the diffusepositron spectrum is softer, that is, less energetic withincreasing energy, than the diffuse electron spectrum;!e# # !s ¼ 0:66$ 0:05, i.e., the source spectrum isharder than the diffuse electron spectrum; Ceþ=Ce# ¼0:091$ 0:001, i.e., the weight of the diffuse positron fluxamounts to !10% of that of the diffuse electron flux;Cs=Ce# ¼ 0:0078$ 0:0012, i.e., the weight of the com-mon source constitutes only !1% of that of the diffuseelectron flux; and 1=Es ¼ 0:0013$ 0:0007 GeV#1, corre-sponding to a cutoff energy of 760þ1000
#280 GeV. The fit isshown in Fig. 6 as a solid curve. The agreement betweenthe data and the model shows that the positron fractionspectrum is consistent with e$ fluxes each of which is thesum of its diffuse spectrum and a single common powerlaw source. No fine structures are observed in the data. Theexcellent agreement of this model with the data indicatesthat the model is insensitive to solar modulation effects[24] during this period. Indeed, fitting over the energyranges from 0.8–350 GeV to 6.0–350 GeV does not changethe results nor the fit quality. Furthermore, fitting the datawith the same model extended to include different solarmodulation effects on positrons and electrons yields simi-lar results. This study also shows that the slope of the
num
ber o
f tria
ls
number of positrons
posi
tron
frac
tion
(b)(a)
0
5
10
15
450 500 550 6000.11
0.112
0.114
0.116
0.118
0.12
positron fraction0.10 0.11 0.12 0.13
num
ber o
f tria
ls
0
50
100
150
FIG. 4 (color). (a) Stability of the measurement in the energyrange 83.2–100 GeVover wide variations of the cuts fitted with aGaussian of width 1.1%. (b) The positron fraction shows nocorrelation with the number of selected positrons.
1 10 210
AMS-02
-110
PAMELAFermi
FIG. 5 (color). The positron fraction compared with the mostrecent measurements from PAMELA [22] and Fermi-LAT [23].The comparatively small error bars for AMS are the quadraticsum of the statistical and systematic uncertainties (see Table Iand [13]), and the horizontal positions are the centers ofeach bin.
PRL 110, 141102 (2013) P HY S I CA L R EV I EW LE T T E R Sweek ending5 APRIL 2013
141102-7
e�
e+
e+/(e� + e+)
(e� + e+)
PAMELA Collab, Nature 458 (2009) 607 [arXiv:0810.4995] PAMELA Collab, PRL 111 (2013) 081102 [arXiv:1308.0133] PAMELA Collab, PRL 106 (2011) 201101 [arXiv:1103.2880] Fermi LAT Collab, PRL 108 (2012) 011103 [arXiv:1109.0521] Fermi LAT Collab, PRD 82 (2010) 09004 [arXiv:1008.3999] AMS-02 Collab, PRL 110 (2013) 141102 AMS-02 Collab, 33rd ICRC Conference (2013) AMS-02 Collab, 33rd ICRC Conference (2013)
From: AMS-02 Collab, PRL 110 (2013) 141102

Sources of cosmic-rays leptons
� Primaries
- Supernova remnants (SNR): electrons - Pulsar Wind Nebulae (PWN): electrons, positrons
- Exotic sources, like e.g. Dark Matter (electrons, positrons)
� Secondaries
- From cosmic-rays (mostly p and He) interactions in the Galaxy: (electrons, positrons)

In this talk: astrophysical interpretation
� Primaries
- Supernova remnants (SNR): electrons - Pulsar Wind Nebulae (PWN): electrons, positrons
- Exotic sources, like e.g. Dark Matter (electrons, positrons)
� Secondaries
- From cosmic-rays (mostly p and He) interactions in the Galaxy: (electrons, positrons)

Primary electrons from SNR
� Particles accelerated through first-type Fermi mechanism
� Electron source spectrum:
� Normalization estimated from radio data:
� Green catalog: 274 SNR with information on distance, age, radio flux and radio spectral index
Q(E) = Q0
✓E
E0
◆��
exp
✓� E
Ec
◆
Q0 = 1.2 · 1047 GeV�1 (0.79)�
d
kpc
�2 h ⌫
GHz
i(��1)/2
B
100µG
��(�+1)/2 B⌫r
Jy
�
Ec = 2 TeV
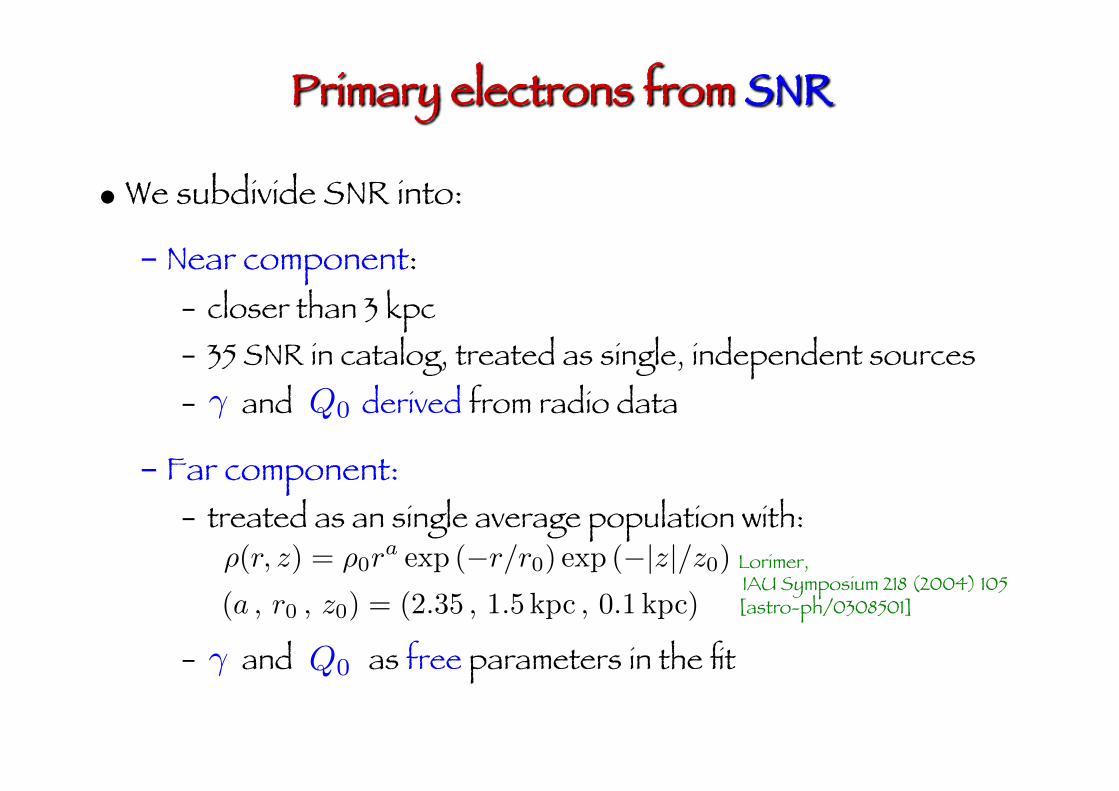
Primary electrons from SNR
� We subdivide SNR into:
- Near component: - closer than 3 kpc - 35 SNR in catalog, treated as single, independent sources - and derived from radio data
- Far component: - treated as an single average population with:
- and as free parameters in the fit
⇢(r, z) = ⇢0raexp (�r/r0) exp (�|z|/z0)
(a , r0 , z0) = (2.35 , 1.5 kpc , 0.1 kpc)
Lorimer, IAU Symposium 218 (2004) 105 [astro-ph/0308501]
�
Q0�
Q0

Primary electrons and positrons from PWN
� Pulsars can be treated as sources of highly-boosted pair-produced electrons and positrons
� Electron/positrons source spectrum:
� Normalization derived from the spin-down energy W0
� ATNF catalog: PWN with information on distance, age and
total emitted power
� Free parameters:
Ec = 2 TeV
Z 1
Emin
dE E Q(E) = ⌘W0 W0 ⇡ ⌧0E
✓1 +
tage⌧0
◆2
Q(E) = Q0
✓E
E0
◆��PWN
exp
✓� E
Ec
◆
PSR decay time ⌧0 ⇠ 10 kyr
�PWN ⌘

Secondary electrons and positrons
(p , He)prim + ISM �! e±
101
102
103
104
100 101 102 103 104
(T)2
Φ [
Ge
V/n
ucl
eo
n m
-2 s
-1 s
r-1]
T [GeV/nucleon]
p and He
p AMS-02He AMS-02
p fitHe fit
IS p fitIS He fit
Dedicated fit on AMS-02 data (*)
(*) Haino (ASM-02 Collab), 33rd ICRC Conference (2013) (*) Choutko (ASM-02 Collab), 33rd ICRC Conference (2013)

Transport equation
diffusion energy losses source term
Geometry: cylindrical diffusive halo (R, L) + thin disk (h = 100 pc)
Diffusion: uniform in the whole (disk + diffusive halo) volume
Energy losses: synchrotron on magnetic fields, inverse Compton on ISRF Transport in the Heliosphere: Force field
K(E) = K0 � (R/1 GV)�
@tN � ~r ·hK(E)~rN
i+ @E
⇥b
loss(E)N⇤= Q(E, ~x, t)
Model L (kpc) � K0 (kpc
2Myr
�1)
MED 4 0.70 0.0112
�

10-3
10-2
10-1
100 101 102 103 104
E3 \ [G
eV2 c
m-2
s-2
sr-1
]
E [GeV]
e-
3m bandII
PWNSNR local
SNR d > 3 kpcTOT IS
TOTAMS-02
PAMELAFERMI
AMS-01AMS02 Prel.
10-4
10-3
10-2
100 101 102 103 104
E3 \ [G
eV2 c
m-2
s-2
sr-1
]
E [GeV]
e+
3m bandII
PWNTOT IS
TOTAMS-02
PAMELAFERMIHEAT
CAPRICEAMS02 Prel.
10-3
10-2
10-1
100 101 102 103 104
E3 \ [G
eV2 c
m-2
s-2
sr-1
]
E [GeV]
e+ + e-
3m bandII
PWNSNR local
SNR d > 3 kpcTOT IS
TOTAMS-02FERMIHESS
AMS02 Prel.
10-2
10-1
100
100 101 102 103
e+ /(e+ +e
- )
E [GeV]
e+/(e++e-)
3m bandII
PWNTOT IS
TOTAMS-02
PAMELAFERMI
AMS-01HEAT
CAPRICEAMS02 Prel.
Fit to AMS-02 data
electrons positrons
sum positron fraction

Fit to AMS-02 data
� Reconstructed parameters (for MED)
- Far SNR:
- PWN:
- Normalization of secondaries:
⌘ = 0.0320± 0.0016�PWN = 1.90± 0.03
Q0 = (2.748± 0.027)⇥ 1050 GeV�1
� = 2.382± 0.004
qsec = 1.080± 0.026
� = (830± 22) MV

The case for pulsars energy cut-off
10-4
10-3
10-2
100 101 102 103 104
E3 Φ
[G
eV
2 c
m-2
s-2
sr-1
]
E [GeV]
e+
II3σ band Ec=1 TeV
3σ band Ec=10 TeVPWN Ec=1 TeV
PWN Ec=10 TeVTOT Ec=1 TeV
TOT Ec=10 TeVAMS-02
PAMELAFERMI
10-2
10-1
100
100 101 102 103
E3 Φ
[G
eV
2 c
m-2
s-2
sr-1
]
E [GeV]
e+/(e++e-)
II3σ band Ec=1 TeV
3σ band Ec=10 TeVPWN Ec=1 TeV
PWN Ec=10 TeVTOT Ec=1 TeV
TOT Ec=10 TeVAMS-02
PAMELAFERMI
positrons positron fraction
Ec = 10 TeVEc = 10 TeV
Ec = 1 TeVEc = 1 TeV
The high-energy window and local sources
� The high-energy sector is dominated by local discrete sources:
- The electron and (electron+positron) fluxes are well compatible with a local SNR remnant contribution
- The positron flux (and the positron fraction) require local positron sources, and PWN from the ATNF catalog can provide a fairly viable solution
� We therefore attempt two additional analyses to study the high-energy positron window (relevant also for DM):
- “Single-source” analysis - “Powerful-sources” analysis

“Single-source” analysis
� We explore the PWN parameter space by injecting positrons from a single PWN-like emitter
� Free parameters: - spectral index - distance - age - emitted power in the e+/e- channel
� Once we find the required properties (if any) of a PWN-like emitter to reproduce the AMS-02 data, we look back into the ATNF catalog
�PWN
dT⌘W0

“Single-source” analysis
101
102
103
104
105
10-1 100
T [
kyr]
d [kpc]
γ = 1.5
ηW0 = [1046,1047] ergηW0 = [1047,1048] ergηW0 = [1048,1049] ergηW0 = [1049,1050] ergηW0 = [1050,1051] ergPWN ATNF cataloguePWN near and young

“Single-source” analysis
101
102
103
104
105
10-1 100
T [ky
r]
d [kpc]
γ = 1.8
ηW0 = [1046,1047] ergηW0 = [1047,1048] ergηW0 = [1048,1049] ergηW0 = [1049,1050] ergηW0 = [1050,1051] ergPWN ATNF cataloguePWN near and young
101
102
103
104
105
10-1 100
T [ky
r]
d [kpc]
γ = 2.0
ηW0 = [1046,1047] ergηW0 = [1047,1048] ergηW0 = [1048,1049] ergηW0 = [1049,1050] ergPWN ATNF cataloguePWN near and young
101
102
103
104
105
10-1 100
T [ky
r]
d [kpc]
γ = 2.2
ηW0 = [1046,1047] ergηW0 = [1047,1048] ergηW0 = [1048,1049] ergPWN ATNF cataloguePWN near and young

“Single-source” analysis: best-fit PWN
Name �fit dfit Tfit ⌘W0,fit �2/dof dcat Tcat W0,cat ⌘fit(kpc) (kyr) (10
49erg) (kpc) (kyr) (10
49erg)
Geminga 1.74 0.24 344.6 0.341 0.68 0.25 342 1.25 0.27
J1741-2054 1.68 0.25 378.0 0.413 0.62 0.25 386 0.47 0.88
B1742-30 1.52 0.19 539.1 0.770 0.54 0.2 546 0.83 0.92
J1918+1541 1.65 0.64 2355 6.48 0.92 0.68 2310 3.4 1.90

“Single-source” analysis: fluxes
10-3
10-2
10-1
100 101 102 103 104
E3 Φ
[G
eV
2 c
m-2
s-2
sr-1
]
E [GeV]
e-
IIGeminga
SNR localSNR d > 3 kpc
TOTAMS-02
PAMELAFERMI
AMS-01HEAT
CAPRICE
10-2
10-1
100
100 101 102 103
e+/(
e++
e- )
E [GeV]
e+/(e++e-)
IIGeminga
TOTAMS-02
PAMELAFERMI
AMS-01HEAT
CAPRICE
10-5
10-4
10-3
10-2
10-1
100 101 102 103 104
E3 Φ
[G
eV
2 c
m-2
s-2
sr-1
]
E [GeV]
e+
IIGeminga
TOTAMS-02
PAMELAFERMIHEAT
CAPRICE
10-3
10-2
10-1
100 101 102 103 104
E3 Φ
[G
eV
2 c
m-2
s-2
sr-1
]
E [GeV]
e++e-
IIGeminga
SNR localSNR d > 3 kpc
TOTAMS-02FERMI
ATICHEAT
CAPRICEBETSHESS
electrons positrons
sum positron fraction
“Powerful-source” analysis
� We identify in the ATNF catalog a limited number of PWN potentially able to sizeably contribute to the local high-energy positron flux
- For definiteness: 5 “most-powerful”sources - Selected by a ranking algorithm, according to their contribution to
the local positron flux
� For each of them, we allow and to vary, and we fit the AMS-02 data
�PWN ⌘
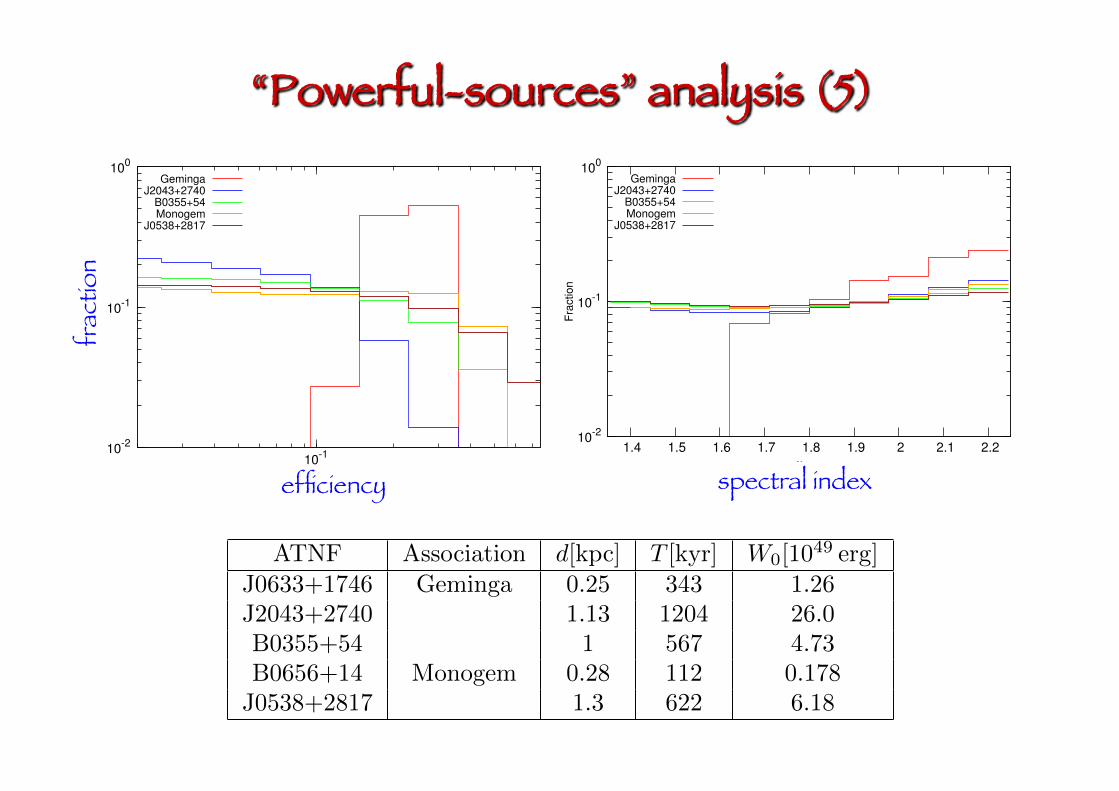
“Powerful-sources” analysis (5)
10-2
10-1
100
10-1
Fra
ctio
n
η
GemingaJ2043+2740
B0355+54Monogem
J0538+2817
10-2
10-1
100
1.4 1.5 1.6 1.7 1.8 1.9 2 2.1 2.2
Fra
ctio
n
γPWN
GemingaJ2043+2740
B0355+54Monogem
J0538+2817
efficiency spectral index
ATNF Association d[kpc] T [kyr] W0[1049
erg]
J0633+1746 Geminga 0.25 343 1.26
J2043+2740 1.13 1204 26.0
B0355+54 1 567 4.73
B0656+14 Monogem 0.28 112 0.178
J0538+2817 1.3 622 6.18
frac
tion
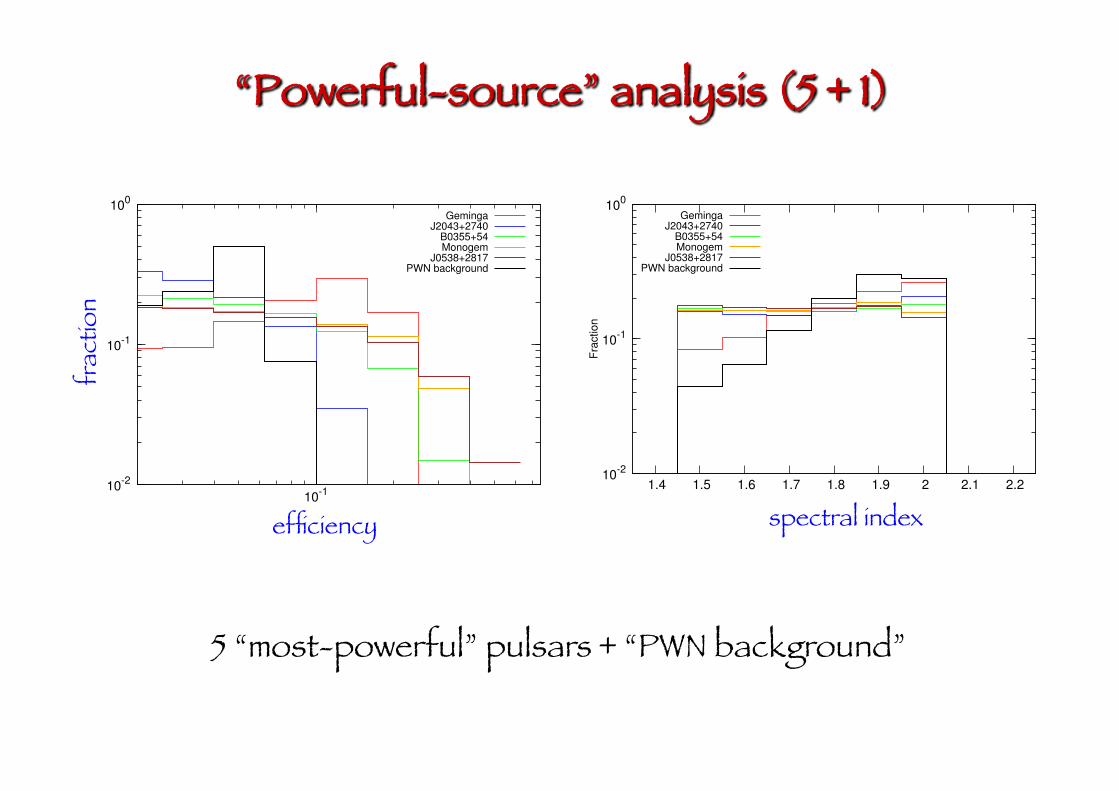
“Powerful-source” analysis (5 + 1)
10-2
10-1
100
10-1
Fra
ctio
n
η
GemingaJ2043+2740
B0355+54Monogem
J0538+2817PWN background
10-2
10-1
100
1.4 1.5 1.6 1.7 1.8 1.9 2 2.1 2.2
Fra
ctio
n
γPWN
GemingaJ2043+2740
B0355+54Monogem
J0538+2817PWN background
efficiency spectral index
frac
tion
5 “most-powerful” pulsars + “PWN background”

“Powerful-source” analysis (5+1)
10-4
10-3
10-2
10-1
100
100 101 102 103 104
E3 Φ
[G
eV
2 c
m-2
s-2
sr-1
]
E [GeV]
e-
IISNR local
SNR d > 3 kpcPWN TotGeminga
J2043+2740B0355+54Monogem
J0538+2817TOT
AMS-02PAMELA
FERMI
10-2
10-1
100
100 101 102 103
e+/(
e++
e- )
E [GeV]
e+/(e++e-)
IIPWN TotGeminga
J2043+2740B0355+54Monogem
J0538+2817TOT
AMS-02PAMELA
FERMI
10-5
10-4
10-3
10-2
10-1
100 101 102 103 104
E3 Φ
[G
eV
2 c
m-2
s-2
sr-1
]
E [GeV]
e+
IIPWN TotGeminga
J2043+2740B0355+54Monogem
J0538+2817TOT
AMS-02PAMELA
FERMI
10-3
10-2
10-1
100 101 102 103 104
E3 Φ
[G
eV
2 c
m-2
s-2
sr-1
]
E [GeV]
e++e-
IISNR local
SNR d > 3 kpcPWN TotGeminga
J2043+2740B0355+54Monogem
J0538+2817TOT
AMS-02FERMI
electrons positrons
sum positron fraction

Summary and Conclusions
� The whole AMS-02 leptonic data have been analysed in a self-consistent theoretical framework - Primary electrons: distant sources ave flux + local SNR in Green catalog - Secondary leptons: from cosmic-rays interactions with the ISM - Primary high-E positrons: PWN from ATNF catalog
� Remarkable agreement with the data for all types of analyses - average contribution from all ATNF catalog PWN - single dominant PWN in ATNF - a few most-powerful PWN in ATNF
� The analysis provides hints on the required properties of emitters, which will require further cross-checks in other channels (like radio or gamma-rays) and theoretical models

Backup slides

103 10410-25
10-24
10-23
10-22
10-21
MDM @GeVDsv@cm
3 êsecD
DM DM Æ mm, Iso profile
PAMELA+ AMS e+
FERMI +HESS e±
FERMI 5oâ 30o
FERMI 3oâ 3o
FERMI Dwarfs
103 10410-25
10-24
10-23
10-22
10-21
MDM @GeVD
sv@cm
3 êsecD
DM DM Æ mm, NFW profile
PAMELA+ AMS e+
FERMI +HESS e±
FERMI 5oâ 30o
FERMI 3oâ 3o
FERMI Dwarfs
Positrons: DM interpretation
Cirelli, Kadastik, Raidal, Strumia, NPB813 (2009) 1 as updated in arXiv:0809.2409v5
bounds from gamma-rays on “positive” interpretation of positron fraction