Aston Martin Lagonda Global Holdings plc
25
1 31 July 2019 Aston Martin Lagonda Global Holdings plc Interim results for the 6 months to 30 June 2019 Balancing growth and brand positioning; Preparing for DBX launch in Q2 2020 £m H1 2019 H1 2018 % change Total wholesale volumes 1 2,442 2,299 6% Revenue 407.1 424.9 (4%) Adjusted EBITDA 2 22.0 105.9 (79%) Adjusted operating (loss) / profit 2 (35.2) 64.4 - Total adjusting items 3 (9.1) - - Operating (loss) / profit (37.7) 64.4 - (Loss) / profit before tax (78.8) 20.8 - Diluted EPS (pence) (28.0) 4.3 - 1 Number of vehicles including specials; 2 Alternative performance measures are defined in the Appendix; 3 Adjusting items are detailed in note 4 of the Interim Financial Statements Dr Andy Palmer, Aston Martin Lagonda President and Group CEO, said: “As described in our trading statement on 24 July, both our retail and wholesale volumes have increased year- on-year. However, we are disappointed that our projections for wholesales have fallen short or our original targets impacted by weakness in two of our key markets as well as continued macro-economic uncertainty. Accordingly, we have taken action to reduce wholesale guidance for 2019. We are also improving efficiency across the business, whilst protecting the brand. Retail growth of 26% in the first half was driven by demand for the Vantage and DBS Superleggera, and sharply increased sales in the US and China reflecting our underlying strength and increasing our overall market share. We have also been encouraged by demand for Specials with the development of the sold out Aston Martin Valkyrie and the oversubscribed Valhalla models. Our preparations for the DBX, our first SUV, remain on track and our new St Athan facility has been commissioned. With the UK’s exit from the European Union imminent, we have enacted our plans to ensure operational readiness for the supply of parts and cars. We remain focused on execution of the Second Century Plan, financial discipline, long-term sustainable growth and ensuring we have the right funding structure in place. The strength of our brand underpins our confidence in the long-term opportunities ahead.” Key results • Retail unit sales +26%, with increased share of luxury market against backdrop of difficult market conditions for the wider auto-industry • Revenues fell to £407m as fewer Specials and core mix (more Vantage) offset growth in wholesale units • Operating profit reduced year-on-year due to the planned costs of expansion, an improved retail financing offer, lower Specials volume and lower Average Selling Price (ASP); In addition to a one-off £19m provision for a doubtful debt relating to the sale of legacy Intellectual Property in the prior year • Core wholesales +9%; Total unit growth +6%, with planned lower Specials volume (36 vs 95) • Continued strength in Americas (+54%) and APAC (+24%), including China (+39%), offset softness in the UK (-17%) and EMEA (-19%) • Core ASP £140k (H1 2018: £146k); Group ASP at £145k (H1 2018: £167k) reflecting increased Vantage mix, improvements to lease offerings and fewer Specials • Net cash from operations at £21m driven by planned £71m inventory build and substantial reversal of c.£90m receivable from December 2018
Transcript of Aston Martin Lagonda Global Holdings plc

1
31 July 2019
Aston Martin Lagonda Global Holdings plc Interim results for the 6 months to 30 June 2019
Balancing growth and brand positioning; Preparing for DBX launch in Q2 2020
£m H1 2019 H1 2018 % change
Total wholesale volumes1 2,442 2,299 6%
Revenue 407.1 424.9 (4%)
Adjusted EBITDA2 22.0 105.9 (79%)
Adjusted operating (loss) / profit2 (35.2) 64.4 -
Total adjusting items3 (9.1) - -
Operating (loss) / profit (37.7) 64.4 -
(Loss) / profit before tax (78.8) 20.8 -
Diluted EPS (pence) (28.0) 4.3 - 1Number of vehicles including specials; 2Alternative performance measures are defined in the Appendix; 3Adjusting items are detailed in
note 4 of the Interim Financial Statements
Dr Andy Palmer, Aston Martin Lagonda President and Group CEO, said:
“As described in our trading statement on 24 July, both our retail and wholesale volumes have increased year-
on-year. However, we are disappointed that our projections for wholesales have fallen short or our original
targets impacted by weakness in two of our key markets as well as continued macro-economic uncertainty.
Accordingly, we have taken action to reduce wholesale guidance for 2019. We are also improving efficiency
across the business, whilst protecting the brand.
Retail growth of 26% in the first half was driven by demand for the Vantage and DBS Superleggera, and
sharply increased sales in the US and China reflecting our underlying strength and increasing our overall
market share. We have also been encouraged by demand for Specials with the development of the sold out
Aston Martin Valkyrie and the oversubscribed Valhalla models. Our preparations for the DBX, our first SUV,
remain on track and our new St Athan facility has been commissioned. With the UK’s exit from the European
Union imminent, we have enacted our plans to ensure operational readiness for the supply of parts and cars.
We remain focused on execution of the Second Century Plan, financial discipline, long-term sustainable growth
and ensuring we have the right funding structure in place. The strength of our brand underpins our confidence
in the long-term opportunities ahead.”
Key results
• Retail unit sales +26%, with increased share of luxury market against backdrop of difficult market conditions for the wider auto-industry
• Revenues fell to £407m as fewer Specials and core mix (more Vantage) offset growth in wholesale units
• Operating profit reduced year-on-year due to the planned costs of expansion, an improved retail financing offer, lower Specials volume and lower Average Selling Price (ASP); In addition to a one-off £19m provision for a doubtful debt relating to the sale of legacy Intellectual Property in the prior year
• Core wholesales +9%; Total unit growth +6%, with planned lower Specials volume (36 vs 95)
• Continued strength in Americas (+54%) and APAC (+24%), including China (+39%), offset softness in the UK (-17%) and EMEA (-19%)
• Core ASP £140k (H1 2018: £146k); Group ASP at £145k (H1 2018: £167k) reflecting increased Vantage mix, improvements to lease offerings and fewer Specials
• Net cash from operations at £21m driven by planned £71m inventory build and substantial reversal of c.£90m receivable from December 2018

2
• Net debt at £732m with adjusted net leverage of 4.7x last 12 months (LTM) adjusted EBITDA (December 2018: £560m, 2.3x LTM adjusted EBITDA); reflects placement of $190m of mirror bonds 1 April 2019, investment in the period (including capex of £162m), and seasonally low cash position
• No change in Q4 weighting to deliveries, both core and Specials (DB4 GT Zagato continuations); Lower fixed cost run-rate in the second half as marketing costs fall and efficiencies are delivered
• Plan reflects continued external uncertainty for remainder of 2019, which we will monitor into 2020
Product expansion continues
• DBX on track with new St Athan facility now commissioned and manufacturing first pre-production cars; DBX dynamic appearance at Goodwood Festival of Speed; Encouraging feedback from customer clinics in key markets of China and the US
• Deliveries of DBS Superleggera Volante begin in Q3 and Vantage AMRs deliver in Q4 2019
• Aston Martin Valkyrie made its dynamic debut at the British Grand Prix in July and its racing sibling is set to campaign at 24 Hours of Le Mans in 2021
• Over-subscribed AM-RB 003 special named as Aston Martin Valhalla; Powered by all new Aston Martin hybrid V6 turbo mid-engine
All metrics and commentary in this announcement exclude adjusting items unless stated otherwise and certain financial data within this announcement have been rounded.
Enquiries Investors and Analysts Charlotte Cowley Director of Investor Relations +44 (0)7771 976764 [email protected] Media Kevin Watters Director of Communications +44 (0)7764 386683 [email protected] Grace Barnie Corporate Communications Manager +44 (0)7880 903490
[email protected] Teneo Tim Burt, Doug Campbell, Haya Herbert-Burns +44 (0)20 7420 3189
• There will be a call for investors and analysts today at 09:00am
• The conference call can be accessed live via a dial-in facility on +44 3333000804; PIN: 37458890#, please find more details on the corporate website https://www.astonmartinlagonda.com/investors/calendar/h1-2019-results
• A replay facility will be available on the website later in the day
No representations or warranties, express or implied, are made as to, and no reliance should be placed on, the accuracy, fairness or completeness of the information presented or contained in this release. This release contains certain forward-looking statements, which are based on current assumptions and estimates by the management of Aston Martin Lagonda Global Holdings plc (“Aston Martin Lagonda”). Past performance cannot be relied upon as a guide to future performance and should not be taken as a representation that trends or activities underlying past performance will continue in the future. Such statements are subject to numerous risks and uncertainties that could cause actual results to differ materially from any expected future results in forward-looking statements. These risks may include, for example, changes in the global economic situation, and changes affecting individual markets and exchange rates. Aston Martin Lagonda provides no guarantee that future development and future results achieved will correspond to the forward-looking statements included here and accepts no liability if they should fail to do so. Aston Martin Lagonda undertakes no obligation to update these forward-looking statements and will not publicly release any revisions that may be made to these forward-looking statements, which may result from events or circumstances arising after the date of this release. This release is for informational purposes only and does not constitute or form part of any invitation or inducement to engage in investment activity, nor does it constitute an offer or invitation to buy any securities, in any jurisdiction including the United States, or a recommendation in respect of buying, holding or selling any securities.

3
FIRST HALF REVIEW
The first half of 2019 has seen Aston Martin Lagonda continue to execute its Second Century Plan. The more
challenging global macro-economic environment is impacting the company, as communicated on 24 July.
However, the successful execution of the Plan will position the Company for long-term sustainable growth
through its diversified and expanded product range, wider geographic footprint and increased manufacturing
capacity.
Strengthened core sports car ranges
The company is currently producing its three core models: the DB11, Vantage and DBS Superleggera. The
two new variants launching in the second half of 2019 made dynamic debuts at Goodwood Festival of Speed
in July. The DBS Superleggera Volante (delivering from Q3) and the manual Vantage AMR, limited to 200
units worldwide (deliveries in Q4). Deliveries of the Vantage Roadster will begin next year.
DBX production trial build progressing well at St Athan
Pre-production builds of the DBX, Aston Martin Lagonda’s first Sport Utility Vehicle (SUV), started as planned
and our new St Athan manufacturing site in Wales has now completed commissioning. The facility is now being
tested and validated for ramp-up to full production in parallel with the extensive dynamic testing of the pre-
production cars. The Take-to-Market plan is in progress with the first public showing at the Goodwood Festival
of Speed clearly demonstrating the car’s sporting credentials. The DBX is also being tested with customers,
receiving encouraging feedback from initial clinics in the US and China. We will start building the order book
from 18 August at the Monterey Car Week, California as part of our ‘Confidential’ prospecting activity. Plans
remain on track for the DBX global reveal in December 2019 and initial deliveries in Q2 2020.
Mid-engined sports cars
The company continued to develop its first four mid-engined sports cars – the Aston Martin Valkyrie, Aston
Martin Valkyrie AMR Pro, Aston Martin Valhalla and the Vanquish Vision Concept – which were showcased at
this year’s Geneva Auto Show. The Aston Martin Valkyrie broke cover in July completing a lap of Silverstone
at the British Grand Prix. The intensive development programme for this, the world’s most extreme road car,
continues ahead of the first car being delivered in Q4 2019. A progressive ramp-up will see deliveries of the
Aston Martin Valkyrie building towards run-rate maturity from Q2 2020. We were also pleased to announce
that the Aston Martin Valkyrie – which is sold out – will mark an historic return for Aston Martin to the pinnacle
of sports car racing when it campaigns at 24 Hours of Le Mans in 2021. Demand for the recently named Aston
Martin Valhalla (a 500-unit coupe special, previously called AM-RB 003), already outstrips planned supply and
development continues on the Vanquish Vision Concept, with the global reveal of the production car scheduled
for 2020.

4
Specials development
Our Specials strategy is a key element of the business and demand for our Specials continues to go from
strength to strength. Deliveries are on track for the fourth quarter of our most expensive new car, the DB4 GT
Zagato Continuation, one half of the Aston Martin DBZ Centenary Collection of 19 pairs, which made its public
debut at Le Mans. The Rapide E, Aston Martin’s first all-electric model, powered by an 800V battery, was
revealed at the Shanghai auto show, and completed its dynamic debut at the Monaco ePrix, before climbing
the Goodwood hill during the Festival of Speed.
Operational discipline
The company is focused on protecting its luxury brand positioning, maintaining discipline on wholesale units
and maintaining the quality of sales. This approach led to the decision announced on 24 July to reduce our
wholesale volume guidance for 2019. The dealer network improvement continues with four new dealerships
opening in the half alongside four terminations, strengthening the footprint in Asia in particular. In terms of the
supply chain we are introducing a more robust and consistent supplier management process to support
improved efficiency and effectiveness of our manufacturing operations, particularly ahead of scaling production
at St Athan in 2020.
Operationally prepared for UK withdrawal from the European Union
In the first quarter, the company successfully tested plans put in place to mitigate the impact on the business
from potential supply chain disruption should the UK withdraw from the European Union without an agreement
or in an unstructured manner. This included deploying additional racking and packaging, and utilising revised
supply chain routes. The company expects to deploy the same operational plan in October. Whilst the wider
potential commercial impacts are currently unknown, we remain confident that operationally the business is
prepared for the UK’s departure from the European Union.

5
Sales & Revenue analysis
Wholesale units by region
H1 2019 H1 2018 % change
UK 565 683 (17%)
Americas 700 454 54%
EMEA ex. UK 490 607 (19%)
APAC 687 555 24%
Total 2,442 2,299 6% Note: Includes specials
Unit sales of core cars, excluding Specials, rose 9% for the period. Total wholesale unit growth was 6%, with
fewer Specials year-on-year as planned, particularly in Q2. The planned Specials cadence for the year is
primarily to support the Aston Martin Valkyrie prototype build and ramp-up, and the development of products
for inclusion in the latest instalment of the James Bond franchise. Retail unit sales (up +26%) were significantly
ahead of wholesales, allowing dealer inventories to return to more normal levels.
Regionally, total wholesales in APAC rose 24% (China up 39%) and the Americas up 54% continues to
outperform, with particular strength in Q2 (up 83%). This growth was offset by continuing softer trends in the
UK (down 17%) and Europe (down 19%), both softening further in Q2. This performance was also impacted
by the higher than usual dealer inventory levels at the start of the year, and the ensuing disciplined approach
to managing supply. This particularly impacted the UK and Europe where deteriorating macro-economic
factors are also now starting to be felt.
Revenue by Category
£m H1 2019 H1 2018 % change
Sale of vehicles 356.1 384.9 (7%)
Sale of parts 32.2 30.3 6%
Servicing of vehicles 5.2 6.9 (25%)
Brand and motorsport1 13.6 2.8 386%
Total 407.1 424.9 (4%) 1H1 2018 excludes £20m of revenue from a significant contract relating to the sale of certain legacy intellectual property reported as
revenue in the first half of 2018, and reclassified as “other income” in the 2018 Financial Statements
First half revenues were lower year-on-year at £407m (H1 2018: £425m), as model mix, driven by significantly
fewer specials and Vantage, drove a lower overall ASP. Revenues from sales of parts and servicing, were
broadly unchanged year-on-year combined as the heritage team focused on DB4 GT Zagato Continuation
builds and cars for the upcoming Bond 25 film. Income from Brands and Motorsport was driven by new Vantage
GT3 and GT4 race car sales.
Total ASP was £145k (H1 2018: £167k) with significantly fewer specials than the prior year (as planned), 36
compared with 95, and reflecting an ASP on core models of £140k (H1 2018: £146k). Core model mix shifted
year-on-year with increased Vantage mix, offsetting the strength in DBS Superleggera.

6
Summary income statement
£m H1 2019 H1 2018
Revenue 407.1 424.9
Cost of sales (259.2) (244.5)
Gross profit 147.9 180.4
Gross margin 36.3% 42.5%
Operating expenses1 (164.1) (136.0)
of which depreciation & amortisation 57.2 41.5
Other (expense) / income (19.0) 20.0
Adjusted operating (loss) / profit (35.2) 64.4
Adjusted operating margin (8.6%) 15.2%
Adjusting operating items (2.5) -
Operating (loss) / profit (37.7) 64.4
Net financing expense (41.1) (43.6)
of which adjusting financing items (6.6) 0.0
(Loss) / profit before tax (78.8) 20.8
Taxation 16.0 (9.3)
Reported net income (62.8) 11.5
Adjusted EBITDA 22.0 105.9
Adjusted EBITDA margin 5.4% 24.9%
Adjusted (loss) / profit before tax (69.7) 20.8
EPS (pence)2 (28.0) 4.3
Adjusted EPS (pence)2 (24.6) 4.3
Note: For definition of alternative performance measures and detail on adjusting items please see the Appendix and note 18 of the
Interim Financial Statements; 1Excludes adjusting items; 2EPS is presented on a diluted basis.
Gross profit was lower year-on-year at £148m with a gross margin of 36% (H1 2018: £180m; 42%). This
reflected the planned decline in the number of specials year-on-year, particularly in Q2, and the core model
mix, which led to a lower core ASP in addition to an improved lease offer.
Total adjusted operating expenses were £164m with:
• planned year-on-year increases in motorsport, DBX and the St Athan plant,
• higher marketing spending across existing and recently launched products,
• increased headcount to support unit growth, and first time PLC related costs.
Depreciation and amortisation of £57m (H1 2018: £42m) was up £16m on the prior year with scale production
of three core models in the period and included a £6m IFRS 16 charge.
The adjusted operating loss in the period was £35m (H1 2018: £64m profit).
Adjusted EBITDA was £22m with a margin of 5% after the £19m provision relating to sales of legacy Intellectual
Property recognised in FY 2018. Excluding this one-off provision, adjusted EBITDA was £41m with a margin
of 10%. Adjusted EBITDA included a £7m foreign exchange benefit, primarily due to USD:Sterling movements,
and a £7m benefit from the first-time adoption of IFRS 16.

7
Adjusting operating items of £3m predominantly relate to pre-IPO long-term employee incentives, as disclosed
previously. These are expected to total £4m for the full year and have no cash impact.
Net financing costs of £41m were down from £44m in the prior year primarily due to the conversion of
Preference Shares to Ordinary Shares at IPO (H1 2018: £21m). The costs in the half included the first-time
interest costs for the new US Dollar bonds issued on 1 April 2019 and a one-off £7m adjusting finance expense
relating to cross currency forward exposures not eligible for hedge accounting. The adjusting financing
expense is split Q1: £8m charge; Q2: £1m credit, an update from at the time of the Q1 results.
Adjusted loss before tax was £70m (H1 2018: £21m profit) and reported loss before tax £79m (H1 2018: £21m
profit).
The effective tax rate for the year is estimated to be c.21%1 which is the rate that has been applied for the half.
The tax credit of £16m reflects tax on adjusting items as appropriate and the loss in the period.
With 228m shares in issue, adjusted diluted EPS was negative 24.6p, diluted EPS negative 28.0p.
Cash flow and net debt
£m H1 2019 H1 2018
Cash generated from operating activities 20.8 62.0
Cash used in investing activities (159.0) (150.1)
Cash inflow / (outflow) from financing activities 121.0 (7.2)
Effect of exchange rates on cash and cash equivalents (0.5) (1.0)
Decrease in net cash (17.7) (96.3)
Cash balance 126.9 71.5
Cash generated from operating activities was £21m (H1 2018: £62m). The decline year-on-year was principally
due to lower EBITDA and planned increases in inventory. A £71m finished goods and stock in plant inventory
build in the period supports wholesale deliveries expected to be significantly weighted to H2. The c.£90m of
receivables associated with the supply chain delays during Q4 2018 have substantially unwound, with c.£7m
outstanding at the end of June. This receivable unwind of c.£83m, was partially offset by some delivery phasing
at the end of the period resulting in a net £41m receivable inflow for the half. Payables increased by £43m with
tight management of supplier payments and continued inflows from Specials deposits as expected.
Capital expenditure was £162m, up on the prior year (£152m) primarily due to the timing of near-term product
launches, investment at St Athan and R&D spending on new programmes. With a small (£3m) interest inflow,
cash used in investing was £159m. The “carry-over-carry-across” (COCA) principle remains a core part of our
engineering process and will drive capex efficiency and improved quality into future generations.
The £121m inflow from financing largely reflects the private placement of $190m on 1 April 2019 of 6.5%
Senior Secured Notes due April 2022 to support investment flexibility, offset by interest payments (£23m).
With a decrease in net cash of £18m, cash at 30 June 2019 was £127m (31 December 2018: £145m).
1 It is currently anticipated that this rate will apply for the year providing there are no significant changes in legislation and provided the geographical contribution to group results stays broadly the same.

8
£m 30-Jun-19 31-Dec-18 30-Jun-18
Senior Secured Notes 734.9 590.9 579.2
Unsecured loans 0.9 1.4 1.4
Bank loans and overdrafts 123.1 111.8 29.7
Preference shares - - 276.6
Gross debt 858.9 704.1 886.9
Cash balance 126.9 144.6 71.5
Net debt1 732.0 559.5 815.4
Preference share adjustment2 - - (276.6)
Net debt adjusted for preference shares 732.0 559.5 538.8
Adjusted leverage3 4.7x 2.3x 2.5x 1Excluding IFRS 16 lease liabilities of £112m at 30 June 2019; 2Preference shares, which were converted into ordinary shares at IPO 3LTM adjusted EBITDA excludes the £7m benefit from first time adoption of IFRS 16 in H1 2019
Net debt at 30 June 2019 was £732m (31 December 2018: £560m). The increase was led by the $190m private
placement, decrease in net cash of £18m discussed above and the currency re-valuation of the US tranche of
Senior Secured Notes. Gross debt includes back-to-back facilities in China (£37m) and a £70m drawdown of
the RCF supporting working capital requirements.
Adjusted leverage was 4.7x last twelve month (LTM) adjusted EBITDA (excluding the £7m benefit from first
time adoption of IFRS 16 in H1 2019), reflecting the impact of the new bonds, ongoing cost growth supporting
new products and future plans along with the seasonality of cashflows.
The company keeps its financing arrangements under regular review to ensure that we have the resources at
hand to support the continued development of the Second Century Plan, as we did in the first half with the
$190m private placement. The Group continues to have flexibility within our existing debt financing
arrangements which have no maintenance covenants. Ensuring we have appropriate funding mechanisms in
place is a key area of focus for management and the Board, and this includes looking on a regular basis
whether additional debt financing or new facilities may be required to maintain flexibility to deliver the Second
Century Plan. The Group continues the process to look at the options available.
Outlook
As previously stated, the second half will benefit from the significant weighting of Specials, DB4GT Zagato
continuations and the first Aston Martin Valkyrie, in the fourth quarter. We expect demand for core cars to
follow a similar profile to prior years, with deliveries of DBS Superleggera Volante beginning in Q3 and Vantage
AMR deliveries in Q4. Both of these factors, in addition to a planned lower fixed cost run rate, benefitting from
seasonality of motor show and motorsport spend, operational efficiencies and a lower intensity of spend
supporting new products, will drive a higher concentration of profits into the second half and notably the fourth
quarter.

9
APPENDICES
FY 2019 guidance
• Wholesales: 6,300-6,500
• Adjusted EBITDA margin: ~20%
• Adjusted operating profit (EBIT) margin: ~8%
• Net financing expense: ~£70m, including the £7m adjusting financing expense in H1 2019 (previously
£63m)
• D&A: ~£140m
• Effective tax rate: ~21%
• Capex and R&D expenditure: ~£300m
Dealerships
30 Jun-19 31 Dec-18
UK 21 21
Americas 44 44
EMEA ex. UK 55 55
APAC 42 42
Total 162 162
Number of countries 53 53
During the first half we continued to strengthen our dealer network, upgrading four dealers in APAC.
Regional wholesale units
Q1-19 Q1-18 Change Q2-19 Q2-18 Change H1-19 H1-18 Change
UK 235 259 (9%) 330 424 (22%) 565 683 (17%)
Americas 250 208 20% 450 246 83% 700 454 54%
EMEA ex. UK 211 219 (4%) 279 388 (28%) 490 607 (19%)
APAC 361 277 30% 326 278 17% 687 555 24%
Total 1,057 963 10% 1,385 1,336 4% 2,442 2,299 6%
Note: Includes specials
Summary financials
£m Q1-19 Q1-18 Q2-19 Q2-18 H1-19 H1-18
Total wholesale volumes1 1,057 963 1,385 1,336 2,442 2,299
Revenue2 196.0 185.4 211.1 239.5 407.1 424.9
Gross profit 82.6 82.3 65.3 98.1 147.9 180.4
Gross margin 42.1% 44.4% 30.9% 41.0% 36.3% 42.5%
Adjusted EBITDA 28.3 43.7 (6.3) 62.2 22.0 105.9
Adjusted EBITDA margin 14.4% 23.6% (3.0%) 26.0% 5.4% 24.9%
Adjusted operating (loss) / profit (2.2) 22.0 (33.0) 42.4 (35.2) 64.4
Adjusted operating profit margin (1.1%) 11.9% (15.6%) 17.7% (8.6%) 15.2%
Adjusting operating items (1.0) (1.5) (2.5)
Adjusting financing items (8.0)3 - 1.4 - (6.6) -
Operating (loss) / profit (3.2) 22.0 (34.5) 42.4 (37.7) 64.4
(Loss) / profit before tax (25.3)3 2.8 (53.5) 18.0 (78.8) 20.8 Note: For definition of alternative performance measures please see Appendix and note 18 of the Interim Financial Statements; 1Number
of vehicles including specials; 22018 excludes £20m of revenue from a significant contract relating to the sale of certain legacy
intellectual property in Q2 2018, now reported as Other income; 3Restated to reflect the charge recognised in relation to hedge
ineffectiveness on FX forwards – see note 4 of the Interim Financial Statements

10
Summary cash flow statement
£m Q1-19 Q1-18 Q2-19 Q2-18 H1-19 H1-18
Cash generated from operating activities
46.6 10.0 (25.8) 52.0 20.8 62.0
Cash used in investing activities (76.3) (87.2) (82.7) (62.9) (159.0) (150.1)
Cash inflow / (outflow) from financing activities
14.6 6.9 106.4 (14.1) 121.0 (7.2)
Effect of exchange rates on cash and cash equivalents
(1.7) (1.8) 1.2 0.8 (0.5) (1.0)
Decrease in net cash (16.8) (72.1) (0.9) (24.2) (17.7) (96.3)
Cash balance 127.8 95.7 126.9 71.5 126.9 71.5
Non-GAAP reconciliation
£m H1 2019 H1 2018
(Loss) / profit for the period (78.8) 20.8
Adjusting operating expense 2.5 -
Adjusting finance expense 6.6 -
Adjusted EBT (69.7) 20.8
Adjusted finance income (3.2) (2.3)
Adjusted finance expense 37.7 45.9
Adjusted EBIT (35.2) 64.4
Reported depreciation 24.7 12.9
Reported amortisation 32.5 28.6
Adjusted EBITDA 22.0 105.9
Alternative performance measures
In the reporting of financial information, the Directors have adopted various Alternative Performance
Measures ("APMs"). APMs should be considered in addition to IFRS measurements. The Directors believe
that these APMs assist in providing useful information on the underlying performance of the Group, enhance
the comparability of information between reporting periods, and are used internally by the Directors to
measure the Group's performance.
• Adjusted EBT is the (loss)/profit before tax and adjusting items (note 4) as shown in the
Consolidated Income Statement.
• Adjusted EBIT is operating (loss)/profit before adjusting items.
• Adjusted EBITDA removes depreciation, loss/(profit) on sale of fixed assets and amortisation from
adjusted EBIT.
• Adjusted Earnings Per Share is (loss)/profit after income tax before adjusting items as shown in the
Consolidated Income Statement, divided by the weighted average number of ordinary shares in
issue during the reporting period.
• Normalised Adjusted Earnings Per Share is (loss)/profit after income tax before adjusting items as
shown in the Consolidated Income Statement, divided by the closing number of ordinary shares in
issue at 31 December 2018.
• Net Debt is current and non-current borrowings less cash and cash equivalents, excluding any
impact of IFRS 16, as shown in the Consolidated Statement of Financial Position.
• Adjusted leverage is represented by the ratio of Net Debt, adjusted for Preference Shares, to the last
12 months (“LTM”) adjusted EBITDA excluding any benefit from the first time adoption of IFRS 16.
Further details and definitions of adjusting items are contained in note 4 of the Interim Financial Statements.

11
Principal risks
The principal risks previously reported on pages 83 to 93 of the 2018 Annual Report have been reassessed
during the period together with consideration of new and emerging risks and opportunities. We have not
identified any new principal risks. The nature, likelihood and potential impact of those risks have been
reviewed. The only significant change that has been identified is an increase in the likelihood rating applied to
the ‘Macro-economic and political instability’ strategic risk. Subject to this the remaining principal risks and
uncertainties that the Company faces for the second half of the year are consistent with those previously
reported as summarised below:
Strategic risks
Macro-economic and political instability: The Group operates in many markets exposing us to changing
economic, regulatory, social and political developments that may impact customer demand, profitability or our
ability to sell within those markets. Adverse macro-economic conditions or country-specific changes to the
operating, regulatory or political environment may lead to an unfavourable business climate and significant
tensions between major trading parties which could impact the Group’s operations. This may include explicit
trade protectionism, differing tax or regulatory regimes, changing public sentiment or reduced disposable
incomes which could affect demand for our vehicles.
Inability to maintain favourable competitive positioning: Maintaining our competitiveness in the high luxury
segment car market is critical to achieving our strategic growth objectives. The Group competes with a number
of other manufacturers with strong brands and reputations and which may have access to greater financial
resources. The high luxury segment is relatively small due to the price at which cars are sold and significant
investment is required to introduce new models to the market, which relies on a sufficient level of demand to
support the growing levels of production and competition.
Brand/reputational damage arising from poor quality, late delivery, product recall or ineffective brand
positioning and awareness: Our brand and reputation are critical in securing demand for our vehicles and in
developing additional revenue streams. Damage to our brand or reputation for any reason could significantly
impact our ability to deliver the volume growth required by the Second Century Plan.
Inability to incorporate automotive technological advancements (e.g. active safety, connected car,
electrification, autonomous driving): Inability to keep pace with changing customer requirements and
expectations with the move towards more advanced technologies due to reliance on third parties for key
components and availability of funds to invest internally on product development. The Group’s current liquidity
position and funding structure may restrict the availability of funds to pursue potential acquisitions, invest in
organic growth projects or exploit emerging business opportunities to maintain our competitiveness in relation
to technological change. In particular, keeping abreast of the development of new technology (e.g. active
safety, connected car, electrification, autonomous driving) in line with changes in trends and customer tastes.
The Group is currently reliant upon certain key suppliers maintaining their pace of technological development
and making this available to the Group in a timely manner.
Operational risks
Failure to attract, develop and retain top talent: Inability to attract, motivate, develop and retain our people to
perform to the best of their ability to meet our strategic objectives. Our performance, operating results and
future growth depend on our ability to attract, motivate and retain talent with the appropriate level of expertise
to deliver our Second Century Plan.
Inability to deliver major programmes: Failure to implement major programmes on time, within budget and to
the right technical specification could jeopardise delivery of the Second Century Plan and have significant
adverse financial and reputational consequences. Successful delivery of significant programmes (including the
new manufacturing facility in St Athan and core (DBX) and special (Valkyrie) vehicle programmes) is
fundamental to the achievement of the Group’s strategic objectives.
Inadequate protection against cyber-attack resulting in potential loss of data, system availability or operational
disruption: Breach of cyber security could result in a system outage, impacting core operations and/or result
in a major data loss leading to reputational damage and financial loss. The Group’s technology environment
is critical to its success. A robust control environment helps decrease the risks to core business operations
and/or major data loss.

12
Potential disruption to the supply chain: Supply chain disruption could result in production stoppages, delays,
quality issues and/or increased costs resulting in adverse operational and financial consequences for the
Group. Potential loss of key Tier 1 supplier or a single-source supplier, or deterioration in quality could seriously
jeopardise production resulting in delayed or lost sales and brand/reputational damage. (See also the principal
risk relating to Brexit).
Compliance risks
Potential non-compliance with laws and regulations: The Group’s operations are subject to a broad spectrum
of national and regional laws and regulations in the various jurisdictions in which we operate. These include
product safety, emissions, trademarks, competition, employee and customer health and safety, data, corporate
governance, employment and tax. Changes to laws and regulations or a major compliance breach could have
a material impact on the business. There are new regulatory requirements which the Group needs to comply
with as a publicly listed company.
Uncertainty surrounding Brexit: Various Brexit scenarios could impact the Group’s financial position, supply
chain and people. The current uncertainty regarding the way the UK leaves the EU makes it very difficult to
plan for, with multiple scenarios having to be considered and addressed.
Financial risks
Potential impairment of capitalised development costs: The value of capitalised development costs continues
to grow as we expand our product portfolio. The carrying value of development costs in our balance sheet is
dependent upon the future profitability of the vehicle platforms to which they are attributed. A significant
reduction in vehicle lifecycle profitability could result in the need to impair the capitalised development
intangible asset.
The risks summarised above, and mitigating actions taken in respect of them, are explained and described in
more detail on pages 83 to 93 of the 2018 Annual Report.

13
CONSOLIDATED STATEMENT OF COMPREHENSIVE INCOME
6 months ended 30 June 2019
6 months ended 30 June 2018 restated*
12 months ended 31 December 2018
Notes Adjusted Adjusting
items Total Adjusted Adjusting
items Total Adjusted Adjusting
items Total
£m £m £m £m £m £m £m £m £m
Revenue 2 407.1 - 407.1 424.9 - 424.9 1,096.5 - 1,096.5
Cost of sales (259.2) - (259.2) (244.5) - (244.5) (660.7) - (660.7)
Gross profit 147.9 - 147.9 180.4 - 180.4 435.8 - 435.8
Selling and distribution expenses (44.8) - (44.8) (45.1) - (45.1) (89.8) - (89.8)
Administrative expenses 4 (119.3) (2.5) (121.8) (90.9) - (90.9) (219.1) (74.1) (293.2)
Other income/(expense) 3 (19.0) - (19.0) 20.0 - 20.0 20.0 - 20.0
Operating (loss)/profit (35.2) (2.5) (37.7) 64.4 - 64.4 146.9 (74.1) 72.8
Finance income 5 3.2 - 3.2 2.3 - 2.3 4.2 - 4.2
Finance expense 4, 6 (37.7) (6.6) (44.3) (45.9) - (45.9) (83.3) (61.9) (145.2)
(Loss)/profit before tax (69.7) (9.1) (78.8) 20.8 - 20.8 67.8 (136.0) (68.2)
Income tax credit/(charge) 7 14.6 1.4 16.0 (9.3) - (9.3) 0.6 10.5 11.1
(Loss)/profit for the period (55.1) (7.7) (62.8) 11.5 - 11.5 68.4 (125.5) (57.1)
Other comprehensive income
Items that will never be reclassified to the Income Statement
Remeasurement of defined benefit liability (1.0) 20.3
5.4
Taxation on items that will never be reclassified to the Income Statement 0.2 (3.4)
(0.9)
Items that are or may be reclassified to the Income Statement
Foreign exchange translation differences 0.2 0.3
0.7
Fair value adjustment on cash flow hedges (2.3) (11.6) (30.5)
Amounts recycled to the Income Statement in respect of cash flow hedges 3.8 1.5
3.5
Taxation on items that may be reclassified to the Income Statement 1.2 1.5 3.5
Other comprehensive income for the period, net of income tax 2.1 8.6 (18.3)
Total comprehensive income for the period (60.7) 20.1
(75.4)
(Loss)/profit for the period attributable to:
Owners of the group (63.8) 8.7
(62.7)
Non-controlling interests 1.0 2.8 5.6
(62.8) 11.5 (57.1)
Total comprehensive income for the period attributable to:
Owners of the group (61.7) 17.3
(81.0)
Non-controlling interests 1.0 2.8 5.6
(60.7) 20.1
(75.4)
Earnings per ordinary share
Basic 9 (28.0p) 4.5p (31.0p)
Diluted 9 (28.0p) 4.3p
(31.0p)
* The comparative 6 month period ended 30 June 2018 has been restated to reflect the re-presentation of other income – see note 3.
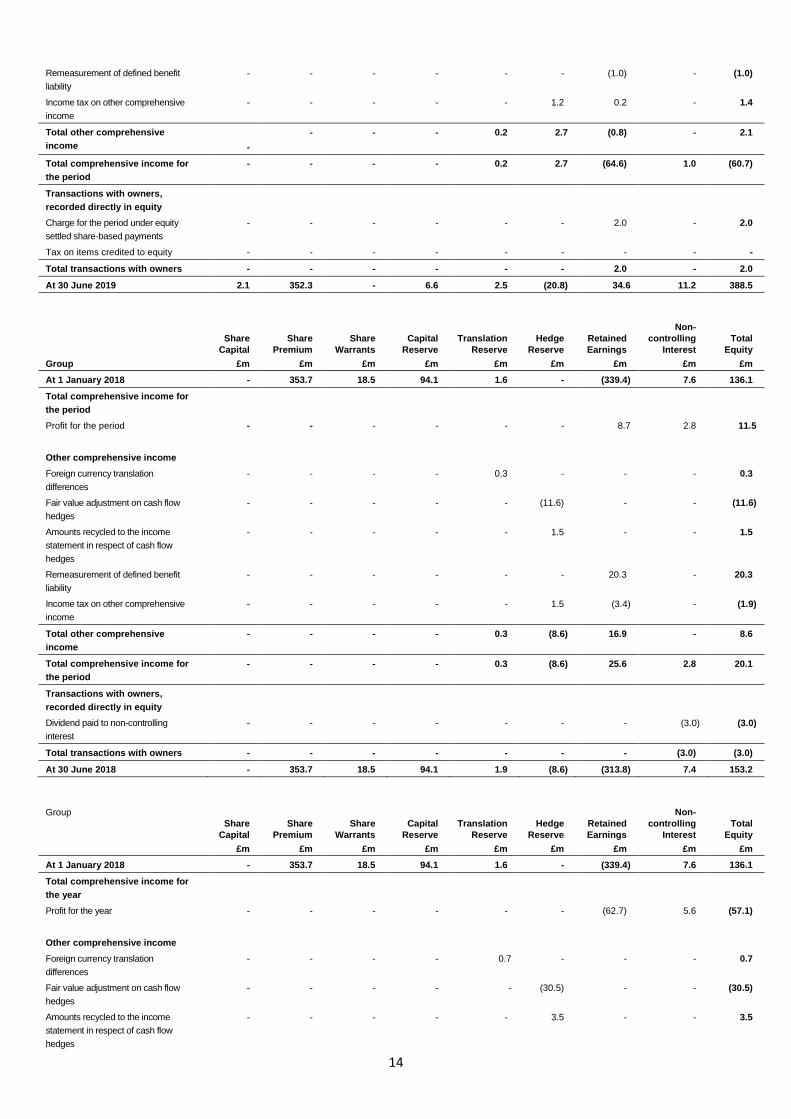
CONSOLIDATED STATEMENT OF CHANGES IN EQUITY
Share
Capital
Share
Premium
Share
Warrants
Capital
Reserve
Translation
Reserve
Hedge
Reserve
Retained
Earnings
Non-
controlling
Interest
Total
Equity
Group £m £m £m £m £m £m £m £m £m
At 1 January 2019 as reported 2.1 352.3 - 6.6 2.3 (23.5) 99.4 10.2 449.4
Adjustment on adoption of IFRS 16
(note 10)
- - - - - - (2.2) - (2.2)
At 1 January 2019 restated 2.1 352.3 - 6.6 2.3 (23.5) 97.2 10.2 447.2
Total comprehensive income for
the period
(Loss)/profit for the period - - - - - - (63.8) 1.0 (62.8)
Other comprehensive income
Foreign currency translation
differences
- - - - 0.2 - - - 0.2
Fair value movement on cash flow
hedges
- - - - - (2.3) - - (2.3)
Amounts recycled to the income
statement in respect of cash flow
hedges
- - - - - 3.8 - - 3.8
14
Remeasurement of defined benefit
liability
- - - - - - (1.0) - (1.0)
Income tax on other comprehensive
income
- - - - - 1.2 0.2 - 1.4
Total other comprehensive
income
-
- - - 0.2 2.7 (0.8) - 2.1
Total comprehensive income for
the period
- - - - 0.2 2.7 (64.6) 1.0 (60.7)
Transactions with owners,
recorded directly in equity
Charge for the period under equity
settled share-based payments
- - - - - - 2.0 - 2.0
Tax on items credited to equity - - - - - - - - -
Total transactions with owners - - - - - - 2.0 - 2.0
At 30 June 2019 2.1 352.3 - 6.6 2.5 (20.8) 34.6 11.2 388.5
Share
Capital
Share
Premium
Share
Warrants
Capital
Reserve
Translation
Reserve
Hedge
Reserve
Retained
Earnings
Non-
controlling
Interest
Total
Equity
Group £m £m £m £m £m £m £m £m £m
At 1 January 2018 - 353.7 18.5 94.1 1.6 - (339.4) 7.6 136.1
Total comprehensive income for
the period
Profit for the period - - - - - - 8.7 2.8 11.5
Other comprehensive income
Foreign currency translation
differences
- - - - 0.3 - - - 0.3
Fair value adjustment on cash flow
hedges
- - - - - (11.6) - - (11.6)
Amounts recycled to the income
statement in respect of cash flow
hedges
- - - - - 1.5 - - 1.5
Remeasurement of defined benefit
liability
- - - - - - 20.3 - 20.3
Income tax on other comprehensive
income
- - - - - 1.5 (3.4) - (1.9)
Total other comprehensive
income
- - - - 0.3 (8.6) 16.9 - 8.6
Total comprehensive income for
the period
- - - - 0.3 (8.6) 25.6 2.8 20.1
Transactions with owners,
recorded directly in equity
Dividend paid to non-controlling
interest
- - - - - - - (3.0) (3.0)
Total transactions with owners - - - - - - - (3.0) (3.0)
At 30 June 2018 - 353.7 18.5 94.1 1.9 (8.6) (313.8) 7.4 153.2
Group
Share
Capital
Share
Premium
Share
Warrants
Capital
Reserve
Translation
Reserve
Hedge
Reserve
Retained
Earnings
Non-
controlling
Interest
Total
Equity
£m £m £m £m £m £m £m £m £m
At 1 January 2018 - 353.7 18.5 94.1 1.6 - (339.4) 7.6 136.1
Total comprehensive income for
the year
Profit for the year - - - - - - (62.7) 5.6 (57.1)
Other comprehensive income
Foreign currency translation
differences
- - - - 0.7 - - - 0.7
Fair value adjustment on cash flow
hedges
- - - - - (30.5) - - (30.5)
Amounts recycled to the income
statement in respect of cash flow
hedges
- - - - - 3.5 - - 3.5

15
Remeasurement of defined benefit
liability
- - - - - - 5.4 - 5.4
Income tax on other comprehensive
income
- - - - - 3.5 (0.9) - 2.6
Total other comprehensive income - - - - 0.7 (23.5) 4.5 - (18.3)
Total comprehensive income for the
year
- - - - 0.7 (23.5) (58.2) 5.6 (75.4)
Transactions with owners,
recorded directly in equity
Shares issued during the year 2.1 - - - - - - - 2.1
Share premium on shares issued - 352.2 - - - - - - 352.2
Capital reduction - (353.6) - (87.5) - - 441.1 - -
Exercise of share warrants - - (18.5) - - - 18.5 - -
Dividend paid to non-controlling
interest
- - - - - - - (3.0) (3.0)
Charge for the year under equity
settled share-based payments
- - - - - - 24.1 - 24.1
Tax on items credited to equity - - - - - - 13.3 - 13.3
Total transactions with owners 2.1 (1.4) (18.5) (87.5) - - 497.0 (3.0) 388.7
At 31 December 2018 2.1 352.3 - 6.6 2.3 (23.5) 99.4 10.2 449.4
CONSOLIDATED STATEMENT OF FINANCIAL POSITION
Notes
As at 30 June
2019
As at 30 June
2018 restated**
As at 31 December
2018 restated**
£m £m £m
Non-current assets
Intangible assets 1,154.5 993.6 1,071.7
Property, plant and equipment 335.0 291.9 313.0
Right-of-use assets 10 77.0 - -
Other receivables 2.1 1.8 1.8
Deferred tax asset 7 33.0 12.2 32.1
1,601.6 1,299.5 1,418.6
Current assets
Inventories 242.2 169.9 165.3
Trade and other receivables 202.2 177.7 241.6
Other financial assets - 18.3 0.1
Cash and cash equivalents 13 126.9 71.5 144.6
571.3 437.4 551.6
Total assets 2,172.9 1,736.9 1,970.2
Current liabilities
Borrowings 13 113.3 29.7 99.4
Trade and other payables 719.2 537.1 671.0
Income tax payable 3.5 2.6 4.9
Other financial liabilities 6.8 15.5 4.2
Lease liabilities 10 10.6 - -
Provisions 15 7.9 8.0 10.8
861.3 592.9 790.3
Non-current liabilities
Borrowings 13 745.6 857.2 604.7
Trade and other payables 19.4 54.2 49.8
Other financial liabilities 7.1 2.3 4.4
Lease liabilities 10 101.0 - -
Provisions 15 12.0 9.6 12.9
Employee benefits 16 38.0 25.0 38.7
Deferred tax liabilities 7 - 42.5 20.0
923.1 990.8 730.5
Total liabilities 1,784.4 1,583.7 1,520.8
Net assets 388.5 153.2 449.4
Capital and reserves
Share capital 2.1 - 2.1
Share premium 352.3 353.7 352.3
Share warrants - 18.5 -
Capital reserve 6.6 94.1 6.6
Translation reserve 2.5 1.9 2.3
Hedge reserve (20.8) (8.6) (23.5)
Retained earnings 34.6 (313.8) 99.4

16
Equity attributable to owners of the group 377.3 145.8 439.2
Non-controlling interests 11.2 7.4 10.2
Total shareholders' equity 388.5 153.2 449.4
** The comparative periods have been restated to reflect the offset of certain deferred tax assets and deferred tax liabilities in addition to the re-classification of deferred
income and other liabilities – see notes 7, 10 and 15 respectively.
CONSOLIDATED STATEMENT OF CASH FLOWS
Notes
6 months
ended
30 June
2019
6 months
ended
30 June
2018
restated***
12 months
ended
31 December
2018
restated***
£m £m £m
Operating activities
(Loss)/profit for the period (62.8) 11.5 (57.1)
Adjustments to reconcile (loss)/profit for the period to net cash inflow from operating activities
Tax on continuing operations 7 (16.0) 9.3 (11.1)
Net finance costs 33.4 40.8 141.0
Other non-cash movements 9.0 0.4 13.3
Loss/(profit) on sale of property, plant and equipment - - 0.4
Depreciation and impairment of property, plant and equipment 18.9 12.9 32.4
Depreciation of right-of-use assets 10 5.8 - -
Amortisation and impairment of intangible assets 32.5 28.6 67.6
Difference between pension contributions paid and amounts recognised in Income Statement (2.3) (1.5) (3.8)
Increase in inventories (70.9) (42.1) (37.5)
Decrease/(increase) in trade and other receivables 41.2 (73.5) (122.4)
Increase in trade and other payables 43.3 82.8 204.1
Movement in provisions (3.8) (2.5) 3.6
Cash generated from operations 28.3 66.7 230.5
Income taxes paid (7.5) (4.7) (7.9)
Net cash inflow from operating activities 20.8 62.0 222.6
Cash flows from investing activities
Interest received 3.2 2.3 4.2
Payments to acquire property, plant and equipment (40.9) (60.9) (101.9)
Payments to acquire intangible assets (121.3) (91.5) (208.6)
Net cash used in investing activities (159.0) (150.1) (306.3)
Cash flows from financing activities
Interest paid (23.1) (20.4) (42.2)
Proceeds from equity share issue - - 4.6
Dividend paid to non-controlling interest - (3.0) (3.0)
Principal element of lease payments 10 (5.2) - -
Movement in existing borrowings 11.1 - 0.3
New borrowings 13 138.6 16.2 98.1
Transaction fees on new borrowings 13 (0.4) - -
Net cash inflow/(outflow) from financing activities 121.0 (7.2) 57.8
Net decrease in cash and cash equivalents (17.2) (95.3) (25.9)
Cash and cash equivalents at the beginning of the period 12 144.6 167.8 167.8
Effect of exchange rates on cash and cash equivalents (0.5) (1.0) 2.7
Cash and cash equivalents at the end of the period 126.9 71.5 144.6
*** The comparative periods have been restated to reflect the re-classification of deferred income – see note 15.
Notes to the Interim Financial Statements
1. Basis of preparation The results for the 6 month period ended 30 June 2019 have been reviewed by Ernst & Young LLP, the Group's auditor, and a copy of their review report appears at the end of this interim report. The results for the 6 month period ended 30 June 2018 was reviewed by KPMG LLP, the Group's previous auditor as part of the Initial Public Offering in October 2018. The financial information for the year ended 31 December 2018 does not constitute statutory accounts as defined in section 435 of the Companies Act 2006. A copy of the statutory accounts for the year ended 31 December 2018 prepared under International Financial Reporting Standards as adopted by the EU (“IFRS”) have been delivered to the Registrar of Companies. The auditor’s report on those accounts was not qualified, did not include a reference to any matters to which the auditor drew attention by way of emphasis without qualifying the report and did not contain statements under section 498(2) or (3) of the Companies Act 2006. Aston Martin Lagonda Global Holdings plc (the "Company") is a company incorporated and domiciled in the UK. The Consolidated Interim Financial Statements of the Company as at the end of the period ended 30 June 2019 comprise the Company and its subsidiaries (together referred to as the 'Group').

17
On 3 September 2018 the Company obtained control of the entire share capital of Aston Martin Holdings (UK) Limited by way of a share for share exchange with one share in the Company being exchanged for one share in Aston Martin Holdings (UK) Limited. Consequently, the Group incorporated the assets and liabilities of Aston Martin Holdings (UK) Limited at their pre-combination carrying amounts without fair value uplift. The equity balance as of 1 January 2018 and as at 30 June 2018 reflects the equity of Aston Martin Holdings (UK) Limited. The share capital of £2.1m as of 31 December 2018 and 30 June 2019 reflects the share capital of the Company. Although the share for share exchange resulted in a change in legal ownership, in substance these Interim Consolidated Financial Statements reflect the continuation of the pre-existing group headed by Aston Martin Holdings (UK) Limited. The transaction has been accounted for as a reverse acquisition in line with IFRS 3. The comparatives, for the 6 month period ended 20 June 2018 presented in these Interim Financial Statements are the consolidated results of Aston Martin Holdings (UK) Limited. The current year Consolidated Statement of Financial Position presents the legal change in the ownership of the Group. The Consolidated Statement of changes in equity for the full year ended 31 December 2018 explains the impact of these transactions in more detail. The Group meets its day-to-day working capital requirements and medium-term funding requirements through a mixture of Senior Secured Notes ($590m at 6.5% and £285m at 5.75%) which mature in April 2022, a revolving credit facility (£80m) of which £10m was undrawn at 30 June 2019, which matures January 2022, facilities to finance inventory, back-to-back loans and a wholesale vehicle financing facility. The Directors have prepared trading and cash flow forecasts for the 12 month period from the date of approval of these Interim Financial Statements. These forecasts show that the Group has sufficient financial resources to meet its obligations as they fall due for the period of at least 12 months from the date of these Interim Financial Statements. The forecasts make assumptions in respect of future trading conditions and in particular, the launch of future models. The nature of the Group's business is such that there can be variation in the timing of cash flows around the development and launch of new models and the availability of funds provided through the vehicle wholesale finance facility as the availability of credit insurance and sales volumes vary, in total and seasonally. The forecasts take into account the aforementioned factors to an extent which the Directors consider to represent their best estimate of future events, based on the information that is available to them at the time of approval of these Financial Statements. The Group plans to make continued investment for growth in the next 12 months, accordingly funds generated through operations are expected to be reinvested in the business mainly through new model development and other capital expenditure. To a certain extent such expenditure is discretionary and in the event of risks occurring which could have a particularly severe effect on the Group, for instance, an extreme ‘Brexit’ scenario, actions such as constraining capital spending would be taken to safeguard its financial position. Due to these risks and material uncertainties over the short term, including but not limited to the global macro-economic environment, Brexit and other factors the Group has concluded that in a severe, but plausible downturn liquidity could be eroded to the extent that additional financing or new facilities, neither of which are currently committed, may be required and they have concluded that this matter represents a material uncertainty that could cast significant doubt upon the Group’s ability to continue as a going concern. The Group continues the process to look at the options available. Nevertheless, having considered the uncertainties described above, the options available for additional financing or facilities, and after making enquiries, the Directors have a reasonable expectation that the Group has adequate resources to continue in operational existence for the foreseeable future. For these reasons, they continue to adopt the going concern basis in preparing the financial statements. Therefore, these Interim Financial Statements do not include any adjustments that would result if the going concern basis of preparation was inappropriate. Statement of compliance The Interim Financial Statements have been prepared in accordance with International Accounting Standard 34 'Interim Financial Reporting' as endorsed by the European Union. They do not include all the information required for full annual financial statements and should be read in conjunction with the Consolidated Financial Statements of the Group for the year ended 31 December 2018. Significant accounting policies The Interim Financial Statements have been prepared applying the accounting policies and presentation that were applied in the preparation of the Group's published Consolidated Financial Statements for the year ended 31 December 2018 except for the adoption of IFRS 16 - Leases effective from 1 January 2019, details of which are given in note 10.
2. Segmental information
6 months
ended
30 June
2019
6 months
ended
30 June
2018
restated
12 months
ended
31 December
2018
Revenue £m £m £m
Analysis by category
Sale of vehicles 356.1 384.9 1,010.7
Sale of parts 32.2 30.3 61.1
Servicing of vehicles 5.2 6.9 14.6
Brands and motorsport 13.6 2.8 10.1
407.1 424.9 1,096.5
6 months
ended
30 June
2019
6 months
ended
30 June
2018
restated
12 months
ended
31 December
2018
Revenue £m £m £m
Analysis by geographic location
United Kingdom 102.0 113.3 255.4
The Americas 99.1 84.5 305.7
Rest of Europe, Middle East & Africa 84.0 102.9 247.1
Asia Pacific 122.0 124.2 288.3
407.1 424.9 1,096.5
The Group’s revenue, when assessed on an annual basis, is typically weighted toward the second half of the year. In 2018 the period to 30 June accounted for 39% of the Group’s annual revenue. Non-current assets other than financial instruments and deferred tax assets by geographic location

18
As at 30 June 2019
Right-of-use
Assets
Property,
Plant and
Equipment Goodwill
Intangible
Assets
Other
Receivables Total
£m £m £m £m £m £m
United Kingdom 68.0 332.2 84.8 1,051.3 - 1,536.3
The Americas 0.3 0.1 - - - 0.4
Rest of Europe, Middle East & Africa 0.1 2.6 - 18.4 2.1 23.2
Asia Pacific 8.6 0.1 - - - 8.7
77.0 335.0 84.8 1,069.7 2.1 1,568.6
As at 30 June 2018 Property,
Plant and
Equipment Goodwill
Intangible
Assets
Other
Receivables Total
£m £m £m £m £m
United Kingdom 288.6 84.8 888.9 - 1,262.3
The Americas 0.1 - - - 0.1
Rest of Europe, Middle East & Africa 2.7 - 19.9 1.8 24.4
Asia Pacific 0.5 - - - 0.5
291.9 84.8 908.8 1.8 1,287.3
As at 31 December 2018 Property,
Plant and
Equipment Goodwill
Intangible
Assets
Other
Receivables Total
£m £m £m £m £m
United Kingdom 310.1 84.8 967.9 - 1,362.8
The Americas 0.1 - - - 0.1
Rest of Europe, Middle East & Africa 2.7 - 19.0 1.8 23.5
Asia Pacific 0.1 - - - 0.1
313.0 84.8 986.9 1.8 1,386.5
3. Other income/(expense)
6 months
ended
30 June
2019
6 months
ended
30 June
2018
restated
12 months
ended
31 December
2018
£m £m £m
Sale of intellectual property - 20.0 20.0
Loss allowance recognised in relation to the sale of intellectual property (19.0) - -
(19.0) 20.0 20.0
Other income of £20.0m was recognised from the sale of certain legacy intellectual property in the 6 month period ended 30 June 2018. In the current period the recoverability of the outstanding receivable was assessed as doubtful resulting in a loss allowance of £19.0m recognised as a charge to the Income Statement. In the 6 month period ended 30 June 2018, income relating to the sale of certain intellectual property was classified as revenue within the Consolidated Income Statement. Following subsequent review of the recurring nature of the revenue stream, it was decided to reclassify this income to Other Income within the Consolidated Income Statement for the 12 month period ended 31 December 2018. There is no impact on the Consolidated Statement of Financial Position for the 6 month period ended 30 June 2018, earnings per share or retained earnings as a result of this prior period restatement.
4. Adjusting items
6 months
ended
30 June
2019
6 months
ended
30 June
2018
12 months
ended
31 December
2018
£m £m £m
Adjusting operating expenses1:
Staff incentives 2.0 - 61.2
Professional fees 0.5 - 12.9
Adjusting finance expenses: 2.5 - 74.1
Movement on derivatives not qualifying for hedge accounting2 6.6 - -
Premium paid on the redemption of preference shares - - 46.8
Preference share fee write-off - - 15.1
Adjusted items before tax 9.1 - 136.0
Tax credit on adjusting items (1.4) - (10.5)
Adjusted items after tax 7.7 - 125.5
1. Relates to staff incentive and other costs incurred as part of the Initial Public Offering during the year ended 31 December 2018. The costs incurred in the 6 month period ended 30 June 2019 predominantly relate to pre-IPO legacy LTIP costs.
2. In the current period a charge of £6.6m was recognised in relation to fair value movements of derivative financial instruments where there is ineffectiveness in the hedge relationship on FX forwards taken out as part of cash management for expected future payments.

19
5. Finance income
6 months
ended
30 June
2019
6 months
ended
30 June
2018
12 months
ended
31 December
2018
£m £m £m
Bank deposit and other interest income 3.2 2.3 4.2
6. Finance expense
6 months
ended
30 June
2019
6 months
ended
30 June
2018
12 months
ended
31 December
2018
£m £m £m
Bank loans, overdrafts and secured notes 26.9 21.6 44.6
Net interest expense on the net defined benefit liability 0.6 0.6 1.1
Interest on preference shares classified as financial liabilities - 20.7 32.0
Foreign exchange loss 3.7 0.7 -
Interest on long-term deposits held 4.2 2.3 5.6
Interest on lease liabilities 2.3 - -
Finance expense before adjusting items 37.7 45.9 83.3
Adjusting finance expenses (note 4) 6.6 - 61.9
Total finance expense 44.3 45.9 145.2
7. Income tax credit/(charge)
The adjusted effective tax rate for the period ended 30 June 2019 is 21% (period ended 30 June 2018: 45%). This compares to a UK statutory rate of tax 19% applicable
to the group for the period to 30 June 2019 (19% for the period ended 30 June 2018). A reduction in the UK corporation tax rate to 17% (effective 1 April 2020) was
substantively enacted on 6 September 2016. The deferred tax asset at 30 June 2019 has been calculated based on the rate of 17% substantively enacted at the period
end date. In addition to the change in tax rates, permanently disallowable expenditure gives rise to further adjustments to the total tax arising in the periods.
The Statement of Financial Position at 30 June 2018 and 31 December 2018 has been restated to net down certain deferred tax assets and deferred tax liabilities
(£17.7m and £91m respectively) where a right of offset exists. There is no impact on the Consolidated Income Statement for either of the comparative periods, earnings
per share or retained earnings as a result of this restatement.
8. Dividends
No dividends have been declared or paid by Aston Martin Lagonda Global Holdings plc in the 6 month period to 30 June 2019 or by Aston Martin Holdings (UK) Limited in the six month period to 30 June 2018. A dividend of £6m was declared and paid by Aston Martin Works Limited in the 6 month period ended 30 June 2018, a company in which the group has a 50% interest, resulting in a payment of £3m to the non-controlling interests.
9. Earnings per ordinary share
Continuing and total operations
6 months
ended
30 June
2019
6 months
ended
30 June
2018
12 months
ended
31 December
2018
Basic earnings per ordinary share
(Loss)/profit available for equity holders (£m) (63.8) 8.7 (62.7)
Basic weighted average number of ordinary shares (million) 228.0 193.8 202.1
Basic earnings per ordinary share (pence) (28.0p) 4.5p (31.0p)
Diluted earnings per ordinary share
(Loss)/profit available for equity holders (£m) (63.8) 8.7 (62.7)
Diluted weighted average number of ordinary shares (million) 228.0 203.2 202.1
Diluted earnings per ordinary share (pence) (28.0p) 4.3p (31.0p)
30 June
2019
Number
30 June
2018
Number
31 December
2018
Number
Diluted weighted average number of ordinary shares is calculated as:
Basic weighted average number of ordinary shares1 (million) 228.0 193.8 202.1
Adjustments for calculation of diluted earnings per share2:
Options3 - 1.3 -
Warrants - 8.1 -
Long-term incentive plans4 - - -
Weighted average number of ordinary shares and potential ordinary shares (million) 228.0 203.2 202.1
1. Additional ordinary shares issued as a result of the share split conducted in 2018 have been incorporated in the earnings per share calculation in full without any time apportionment.
2. The adjustments made in calculating the weighted average number of ordinary and potential ordinary shares have been increased to reflect the share split in full without any time apportionment in the comparative period.
3. The number of options disclosed in the period ended 30 June 2018 do not include the ordinary shares awarded under the legacy LTIP in 2018 as the vesting condition at period ended 30 June 2018 was not considered probable in accordance with IFRS 2.

20
4. The impact of the Long-term incentive plan (“LTIP”) shares has been excluded from the current period weighted average calculation on the basis of antidilution.
10. Impact of IFRS 16
IFRS 16 leases became effective for annual periods beginning on or after 1 January 2019. The Group applied exemptions for short-term leases and leases of low value items and chose to adopt the modified retrospective transition approach under which, prior to reflecting the impact of lease incentives, the Group evaluated its lease liability using incremental borrowing rates assessed at the date of transition with a right of use assets of equal value. The equity reserves of the Group at 1 January 2019 have been adjusted to reflect the derecognition of legal and other costs associated with lease agreements previously expensed over the lease term. Whilst qualifying costs of this nature incurred would be included in the value of the associated right of use asset on adoption of IFRS 16, under the transition approach adopted this treatment is not followed. There have been no IFRS 16 adjustments made to the Consolidated Income Statements for the periods prior to 1 January 2019. The Group is a party to lease contracts for buildings, plant and machinery and IT equipment. The application of IFRS 16 required the Group to make judgements that affect the valuation of lease liabilities and the valuation of right-of-use assets. These predominantly include determining the contracts that fall under IFRS 16, the contract term and the interest rate used for the discounting of future cash flows. The lease term determined by the Group comprises a non-cancellable period, periods covered by an option to extend if the Group is reasonably certain to exercise the option and periods covered by an option to terminate if the Group is reasonably certain not to exercise that option. The same period is applied to determine the useful economic life and therefore the depreciation rate of the right-of-use assets. For the measurement of the right-of-use assets at the date of first-time adoption, initial direct costs were not taken into account in accordance with IFRS 16. The present value of the lease payment is determined by using the incremental borrowing rates equivalent to the rate of interest applicable for the currency of the lease contract and for a similar tenor, with reference to the credit spread of the Group's rating observed in the period when the lease contract commences or is modified. The weighted average of the incremental borrowing rate applied to the lease liabilities recognised in the Statement of Financial Position at 1 January 2019 was 4.04%. The Group’s undiscounted operating lease commitment under IAS 17 at 31 December 2018 was £124.3m. This reconciles to the Group’s IFRS 16 lease liability at 1 January 2019 of £116.5m by applying discounting (£54.3m), exemptions taken under IFRS 16 (£2.0m), embedded leases (£5.3m) and lease incentives and other changes arising from review of critical lease terms (£43.2m). The movement in the right-of-use asset for the 6 month period ended 30 June 2019 is summarised below.
Right-of-use
Properties
Right-of-use
Plant and
machinery
Right-of-use
IT equipment Total
£m £m £m £m
Cost
Introduced on adoption of IFRS 16 at 1 January 2019 72.7 4.6 5.2 82.5
Additions 0.2 - - 0.2
Effect of movements in exchange rates 0.1 - - 0.1
Balance at 30 June 2019 73.0 4.6 5.2 82.8
Depreciation
Introduced on adoption of IFRS 16 at 1 January 2019 - - - -
Charge for the period 3.6 1.1 1.1 5.8
Balance at 30 June 2019 3.6 1.1 1.1 5.8
Carrying amounts
At 1 January 2019 72.7 4.6 5.2 82.5
At 30 June 2019 69.4 3.5 4.1 77.0
The principal and interest elements of cash payments made during the period ended 30 June 2019 are included in Net movement from financing activities within the Group’s Consolidated Statement of Cash Flows.
30 June
2019
£m
Maturity analysis – contractual discounted cash flows
Less than one year 10.6
One to five years 26.8
More than five years 74.2
Lease liabilities included in the Statement of Financial Position 111.6
Current 10.6
Non-current 101.0
111.6
6 months
ended
30 June
2019
Amounts recognised in the Consolidated Income Statement £m
Interest expense on lease liabilities 2.3
Expenses relating to short-term leases 1.8
21
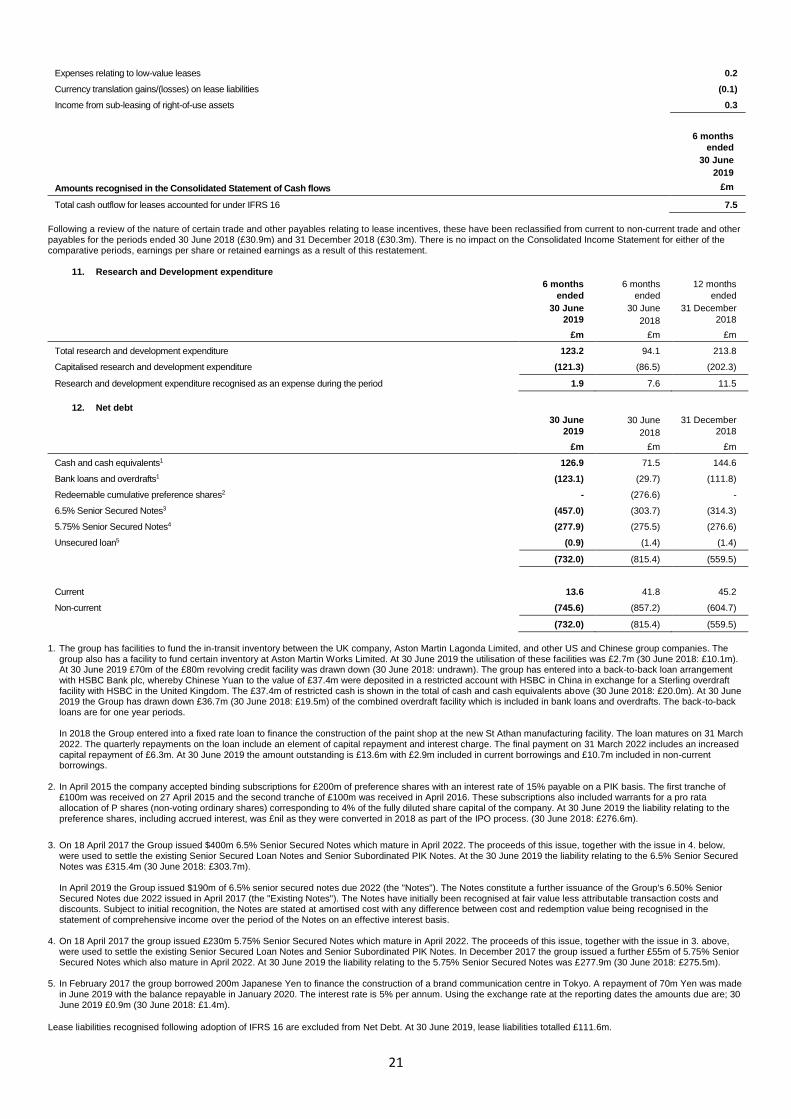
Expenses relating to low-value leases 0.2
Currency translation gains/(losses) on lease liabilities (0.1)
Income from sub-leasing of right-of-use assets 0.3
6 months
ended
30 June
2019
Amounts recognised in the Consolidated Statement of Cash flows £m
Total cash outflow for leases accounted for under IFRS 16 7.5
Following a review of the nature of certain trade and other payables relating to lease incentives, these have been reclassified from current to non-current trade and other payables for the periods ended 30 June 2018 (£30.9m) and 31 December 2018 (£30.3m). There is no impact on the Consolidated Income Statement for either of the comparative periods, earnings per share or retained earnings as a result of this restatement.
11. Research and Development expenditure
6 months
ended
30 June
2019
6 months
ended
30 June
2018
12 months
ended
31 December
2018
£m £m £m
Total research and development expenditure 123.2 94.1 213.8
Capitalised research and development expenditure (121.3) (86.5) (202.3)
Research and development expenditure recognised as an expense during the period 1.9 7.6 11.5
12. Net debt
30 June
2019
30 June
2018
31 December
2018
£m £m £m
Cash and cash equivalents1 126.9 71.5 144.6
Bank loans and overdrafts1 (123.1) (29.7) (111.8)
Redeemable cumulative preference shares2 - (276.6) -
6.5% Senior Secured Notes3 (457.0) (303.7) (314.3)
5.75% Senior Secured Notes4 (277.9) (275.5) (276.6)
Unsecured loan5 (0.9) (1.4) (1.4)
(732.0) (815.4) (559.5)
Current 13.6 41.8 45.2
Non-current (745.6) (857.2) (604.7)
(732.0) (815.4) (559.5)
1. The group has facilities to fund the in-transit inventory between the UK company, Aston Martin Lagonda Limited, and other US and Chinese group companies. The
group also has a facility to fund certain inventory at Aston Martin Works Limited. At 30 June 2019 the utilisation of these facilities was £2.7m (30 June 2018: £10.1m). At 30 June 2019 £70m of the £80m revolving credit facility was drawn down (30 June 2018: undrawn). The group has entered into a back-to-back loan arrangement with HSBC Bank plc, whereby Chinese Yuan to the value of £37.4m were deposited in a restricted account with HSBC in China in exchange for a Sterling overdraft facility with HSBC in the United Kingdom. The £37.4m of restricted cash is shown in the total of cash and cash equivalents above (30 June 2018: £20.0m). At 30 June 2019 the Group has drawn down £36.7m (30 June 2018: £19.5m) of the combined overdraft facility which is included in bank loans and overdrafts. The back-to-back loans are for one year periods. In 2018 the Group entered into a fixed rate loan to finance the construction of the paint shop at the new St Athan manufacturing facility. The loan matures on 31 March 2022. The quarterly repayments on the loan include an element of capital repayment and interest charge. The final payment on 31 March 2022 includes an increased capital repayment of £6.3m. At 30 June 2019 the amount outstanding is £13.6m with £2.9m included in current borrowings and £10.7m included in non-current borrowings.
2. In April 2015 the company accepted binding subscriptions for £200m of preference shares with an interest rate of 15% payable on a PIK basis. The first tranche of £100m was received on 27 April 2015 and the second tranche of £100m was received in April 2016. These subscriptions also included warrants for a pro rata allocation of P shares (non-voting ordinary shares) corresponding to 4% of the fully diluted share capital of the company. At 30 June 2019 the liability relating to the preference shares, including accrued interest, was £nil as they were converted in 2018 as part of the IPO process. (30 June 2018: £276.6m).
3. On 18 April 2017 the Group issued $400m 6.5% Senior Secured Notes which mature in April 2022. The proceeds of this issue, together with the issue in 4. below,
were used to settle the existing Senior Secured Loan Notes and Senior Subordinated PIK Notes. At the 30 June 2019 the liability relating to the 6.5% Senior Secured Notes was £315.4m (30 June 2018: £303.7m). In April 2019 the Group issued $190m of 6.5% senior secured notes due 2022 (the "Notes"). The Notes constitute a further issuance of the Group's 6.50% Senior Secured Notes due 2022 issued in April 2017 (the "Existing Notes"). The Notes have initially been recognised at fair value less attributable transaction costs and discounts. Subject to initial recognition, the Notes are stated at amortised cost with any difference between cost and redemption value being recognised in the statement of comprehensive income over the period of the Notes on an effective interest basis.
4. On 18 April 2017 the group issued £230m 5.75% Senior Secured Notes which mature in April 2022. The proceeds of this issue, together with the issue in 3. above,
were used to settle the existing Senior Secured Loan Notes and Senior Subordinated PIK Notes. In December 2017 the group issued a further £55m of 5.75% Senior Secured Notes which also mature in April 2022. At 30 June 2019 the liability relating to the 5.75% Senior Secured Notes was £277.9m (30 June 2018: £275.5m).
5. In February 2017 the group borrowed 200m Japanese Yen to finance the construction of a brand communication centre in Tokyo. A repayment of 70m Yen was made in June 2019 with the balance repayable in January 2020. The interest rate is 5% per annum. Using the exchange rate at the reporting dates the amounts due are; 30 June 2019 £0.9m (30 June 2018: £1.4m).
Lease liabilities recognised following adoption of IFRS 16 are excluded from Net Debt. At 30 June 2019, lease liabilities totalled £111.6m.

22
13. Movement in net debt
30 June
2019
30 June
2018
31 December
2018
£m £m £m
Cash and cash equivalents 126.9 71.5 144.6
Loans and other borrowings – current (113.3) (29.7) (99.4)
Loans and other borrowings – non-current (745.6) (580.6) (604.7)
Preference shares - (276.6) -
Net debt (732.0) (815.4) (559.5)
Movement in net debt
Net decrease in cash and cash equivalents (17.2) (95.3) (25.9)
Add back cash flows in respect of other components of net debt:
New borrowings (138.6) (16.2) (98.1)
Movement in existing borrowings (11.1) - (0.3)
Transaction fees 0.4 - -
Increase in net debt arising from cash flows (166.5) (111.5) (124.3)
Non-cash movements:
Conversion of preference shares to ordinary shares - - 302.9
Foreign exchange loss on secured loan (4.9) (7.9) (18.4)
Interest added to debt (0.6) (21.9) (49.3)
Exchange and other adjustment (0.5) (1.0) 2.7
(Increase)/decrease in net debt (172.5) (142.3) 113.6
Net debt at beginning of the year (559.5) (673.1) (673.1)
Net debt at the end of the year (732.0) (815.4) (559.5)
14. Financial Instruments
The following tables provide an analysis of financial instruments grouped into Levels 1 to 3 based on the degree to which the value is observable. There were no transfers between levels during the current and comparative periods.
30 June 2019 30 June 2018 31 December 2018
Nominal
Value
Book
Value
Fair
Value
Nominal
Value
Book
Value
Fair
Value
Nominal
Value
Book
Value
Fair
Value
Included in assets £m £m £m £m £m £m £m £m £m
Level 2
Forward foreign exchange contracts - - - - 0.2 0.2 - 0.1 0.1
Structured deposits - - - 12.5 12.5 12.5 - - -
Level 3
Amount due from shareholder - - - 5.6 5.6 5.6 - - -
- - - 18.1 18.3 18.3 - 0.1 0.1
30 June 2019 30 June 2018 31 December 2018
Nominal
Value
Book
Value
Fair
Value
Nominal
Value
Book
Value
Fair
Value
Nominal
Value
Book
Value
Fair
Value
Included in liabilities £m £m £m £m £m £m £m £m £m
Level 1
£285m 5.75% Sterling Senior Secured Notes 285.0 277.9 280.8 285.0 275.7 295.9 285.0 276.6 278.1
$400m 6.5% US Dollar Senior Secured Notes 315.4 315.4 312.9 303.7 303.7 312.3 314.2 314.3 300.7
$190m 6.5% US Dollar Senior Secured Notes 149.8 141.6 148.3 - - - - - -
Level 2
Forward foreign exchange contracts - 13.9 13.9 - 2.7 2.7 - 8.6 8.6
Level 3
Amount due to shareholder - - - 15.1 15.1 15.1 - - -
750.2 748.8 755.9 603.8 597.2 626.0 599.2 599.5 587.4
The forward currency contracts are carried at fair value based on pricing models and discounted cash flow techniques derived from assumptions provided by third party
banks. The Sterling Senior Secured Notes are all valued at amortised cost. The fair value of these Senior Secured Notes at the current and comparative period ends are
determined by reference to the quoted price on The International Stock Exchange Authority in St. Peter Port, Guernsey. For all other receivables and payables, the
carrying amount is deemed to reflect the fair value.
Under IFRS 7, such assets and liabilities are classified by the way in which their fair value is calculated. The interest bearing loans and borrowings are considered to be
level 1 liabilities. Forward foreign exchange contracts and the structured deposit are considered to be level 2 assets and liabilities. IFRS 7 defines level 2 assets and
liabilities as "inputs, other than quoted prices included within level 1, that are observable for the asset or liability, either directly (i.e. as prices) or indirectly (i.e. derived
from prices)". The amounts due to and from the shareholder are considered to be level 3 assets and liabilities.
15. Provisions
30 June
2019
30 June
2018
31 December
2018

23
(restated) (restated)
£m £m £m
Warranty 19.9 17.6 23.7
Current 7.9 8.0 10.8
Non-current 12.0 9.6 12.9
19.9 17.6 23.7
Following a review of the nature of the service plan liability it has been reclassified into current and non-current trade and other payables for the periods ended 30 June 2018 (£2.9m and £5.6m respectively) and 31 December 2018 (£5.2m and £7.3m respectively). There is no impact on the Consolidated Income Statement for either of the comparative periods, earnings per share or retained earnings as a result of this restatement.
16. Pension Scheme The net liability for defined benefit obligations of £38.7m at 31 December 2018 has decreased to a net liability of £38.0m at 30 June 2019. The movement of £0.7m comprises a net actuarial loss of £1.0m in addition to a charge to the Income Statement of £4.0m less contributions of £5.7m. The net liability for defined benefit obligations of £25.0m at 30 June 2018 increased to a net liability of £38.7m at 31 December 2018. The increase arose as a result of a net actuarial gain of £17.4m offset by an asset ceiling adjustment of £32.3m under paragraph 64 of IAS 19. In addition to this there was a charge to the Income Statement of £4.7m offset by contributions of £5.9m.
17. Related party transactions There have been no related party transactions in the 6 month period to 30 June 2019 that have materially affected the financial position or performance of the group and there have been no changes in the nature of related party transactions described in the last annual report that could do so.
18. Alternative performance measures
In the reporting of financial information, the Directors have adopted various Alternative Performance Measures ("APMs"). APMs should be considered in addition to IFRS
measurements. The Directors believe that these APMs assist in providing useful information on the underlying performance of the Group, enhance the comparability of
information between reporting periods, and are used internally by the Directors to measure the Group's performance.
The key APMs that the Group focuses on are as follows:
i) Adjusted EBT is the (loss)/profit before tax and adjusting items (note 4) as shown in the Consolidated Income Statement.
ii) Adjusted EBIT is operating (loss)/profit before adjusting items.
iii) Adjusted EBITDA removes depreciation, loss/(profit) on sale of fixed assets and amortisation from adjusted EBIT.
iv) Adjusted Earnings Per Share is (loss)/profit after income tax before adjusting items as shown in the Consolidated Income Statement, divided by the
weighted average number of ordinary shares in issue during the reporting period.
v) Normalised Adjusted Earnings Per Share is (loss)/profit after income tax before adjusting items as shown in the Consolidated Income Statement,
divided by the closing number of ordinary shares in issue at 31 December 2018.
vi) Net Debt is current and non-current borrowings less cash and cash equivalents, excluding any impact of IFRS 16, as shown in the Consolidated
Statement of Financial Position.
vii) Adjusted leverage is represented by the ratio of Net Debt, adjusted for Preference Shares, to the last 12 months (“LTM”) adjusted EBITDA excluding
any benefit from the first time adoption of IFRS 16.
Income statement
6 months
ended
30 June
2019
6 months
ended
30 June
2018
12 months
ended
31 December
2018
£m £m £m
(Loss)/profit before tax (78.8) 20.8 (68.2)
Adjusting operating expenses 2.5 - 74.1
Adjusting finance expenses 6.6 - 61.9
Adjusted (loss)/profit before tax (EBT) (69.7) 20.8 67.8
Adjusted finance income (3.2) (2.3) (4.2)
Adjusted finance expense 37.7 45.9 83.3
Adjusted operating (loss)/profit (EBIT) (35.2) 64.4 146.9
Reported depreciation 24.7 12.9 32.4
Reported amortisation 32.5 28.6 67.6
Loss on disposal of fixed assets - - 0.4
Adjusted EBITDA 22.0 105.9 247.3
Earnings per share
6 months
ended
30 June
2019
6 months
ended
30 June
2018
12 months
ended
31 December
2018
£m £m £m
Adjusted earnings per ordinary share
(Loss)/profit available for equity holders (£m) (63.8) 8.7 (62.7)
Adjusting items
Adjusting items before tax (£m) 9.1 - 136.0
Tax on adjusting items (£m) (1.4) - (10.5)
Adjusted earnings (£m) (56.1) 8.7 62.8
Basic weighted average number of ordinary shares1 (million) 228.0 193.8 202.1

24
Adjusted earnings per ordinary share (pence) (24.6p) 4.5p 31.1p
Adjusted diluted earnings per ordinary share
Adjusted earnings (£m) (56.1) 8.7 62.8
Diluted weighted average number of ordinary shares1 (million) 228.0 203.2 202.1
Adjusted diluted earnings per ordinary share (pence) (24.6p) 4.3p 31.1p
Normalised adjusted earnings per ordinary share
Adjusted earnings (£m) (56.1) 8.7 62.8
Basic number of ordinary shares as at 31 December2 (million) 228.0 228.0 228.0
Normalised adjusted earnings per ordinary share (pence) (24.6p) 3.8p 27.5p
1. Additional ordinary shares issued as a result of the share split conducted in 2018 have been incorporated in the earnings per share calculation in full without any time apportionment.
2. The basic and diluted number of ordinary shares as at 31 December 2018 and 30 June 2019 have been used as the basis for the current and comparative periods normalised EPS calculation. This represents an indication of the future weighted average number of ordinary shares for evaluating performance of the Group.
Net debt
30 June
2019
30 June
2018
31 December
2018
£m £m £m
Opening cash and cash equivalents 144.6 167.8 167.8
Cash inflow from operating activities 20.8 62.0 222.6
Cash outflow from investing activities (159.0) (150.1) (306.3)
Cash inflow from financing activities 121.0 (7.2) 57.8
Effect of exchange rates on cash and cash equivalents (0.5) (1.0) 2.7
Cash and cash equivalents at the end of the period 126.9 71.5 144.6
Borrowings (858.9) (610.3) (704.1)
Net Debt (732.0) (538.8) (559.5)
Preference shares (re-designated as part of the IPO process) - (276.6) -
IPO and other one-off cash adjustments - - 38.6
Adjusted Net Debt (732.0) (815.4) (520.9)
Adjusted LTM EBITDA3 156.4 219.3 247.3
Adjusted leverage 4.7x 2.5x 2.3x
Adjusted leverage (excluding IPO and other one-off cash adjustments) 4.7x 2.5x 2.1x
3. Adjusted LTM EBITDA for the 6 month period ended 30 June 2019 excludes the impact of IFRS 16.
RESPONSIBILITY STATEMENT The Interim consolidated financial information has been prepared in accordance with IAS 34 adopted by the European Union. We confirm that to the best of our knowledge that the Interim Management Report includes a fair review of the information required by: (a) DTR 4.2.7R of the Disclosure and Transparency Rules, being an indication of important events that have occurred during the first six months of the financial year and their impact on the financial statements; and a description of the principal risks and uncertainties for the remaining six months of the year; and (b) DTR 4.2.8R of the Disclosure and Transparency Rules, being related party transactions that have taken place in the first six months of the current financial year and that have materially affected the financial position or performance of the entity during that period; and any changes in the related party transactions described in the last annual report that could do so. By order of the Board Andy Palmer Mark Wilson President and Group Chief Executive Officer Executive Vice President and Chief Financial Officer 30 July 2019 30 July 2019

25
Independent review report to Aston Martin Lagonda Global Holdings plc Introduction We have been engaged by the Company to review the condensed set of Financial Statements in the Interim Report for the 6 month period ended 30 June 2019 which comprises the Consolidated Statement of Comprehensive Income, the Consolidated Statement of Financial Position, the Consolidated Statement of Changes in Equity, the Consolidated Statement of Cash Flows and notes 1 to 18. We have read the other information contained in the Interim Report and considered whether it contains any apparent misstatements or material inconsistencies with the information in the condensed set of Financial Statements. This report is made solely to the company in accordance with guidance contained in International Standard on Review Engagements 2410 (UK and Ireland) "Review of Interim Financial Information Performed by the Independent Auditor of the Entity" issued by the Auditing Practices Board. To the fullest extent permitted by law, we do not accept or assume responsibility to anyone other than the Company, for our work, for this report, or for the conclusions we have formed. Directors' Responsibilities The Interim Report is the responsibility of, and has been approved by, the Directors. The Directors are responsible for preparing the Interim Report in accordance with the Disclosure Guidance and Transparency Rules of the United Kingdom's Financial Conduct Authority. As disclosed in note 1, the Annual Financial Statements of the Group are prepared in accordance with IFRSs as adopted by the European Union. The condensed set of Financial Statements included in this Interim Report has been prepared in accordance with International Accounting Standard 34, "Interim Financial Reporting", as adopted by the European Union. Our Responsibility Our responsibility is to express to the Company a conclusion on the condensed set of financial statements in the Interim Report based on our review. Scope of Review We conducted our review in accordance with International Standard on Review Engagements (UK and Ireland) 2410, "Review of Interim Financial Information Performed by the Independent Auditor of the Entity" issued by the Auditing Practices Board for use in the United Kingdom. A review of interim financial information consists of making enquiries, primarily of persons responsible for financial and accounting matters, and applying analytical and other review procedures. A review is substantially less in scope than an audit conducted in accordance with International Standards on Auditing (UK) and consequently does not enable us to obtain assurance that we would become aware of all significant matters that might be identified in an audit. Accordingly, we do not express an audit opinion. Material uncertainty related to going concern We draw attention to note 1 in the interim financial statements, which explains that the Group has concluded that in a severe, but plausible downturn liquidity could be eroded to the extent that additional financing or new facilities, neither of which are currently committed, may be required. As stated in note 1, these events or conditions indicate that a material uncertainty exists. This may cast significant doubt on the company’s ability to continue as a going concern. Our conclusion is not modified in respect of this matter. Conclusion Based on our review, nothing has come to our attention that causes us to believe that the condensed set of Financial Statements in the Interim Report for 6 month period ended 30 June 2019 is not prepared, in all material respects, in accordance with International Accounting Standard 34 as adopted by the European Union and the Disclosure Guidance and Transparency Rules of the United Kingdom's Financial Conduct Authority. Ernst & Young LLP Birmingham 30 July 2019