Astigmatism analysis by the Alpins method · 2011-08-31 · Astigmatism analysis by the Alpins...
19
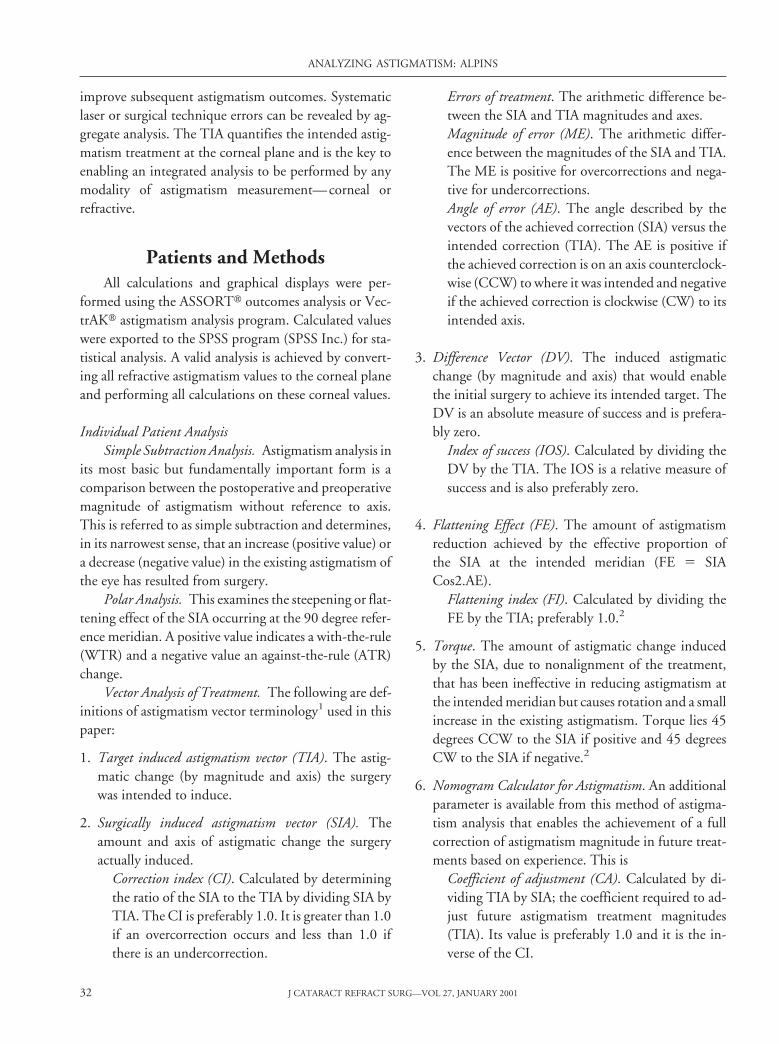
Astigmatism analysis by the Alpins method Noel Alpins, FRACO, FRCOphth, FACS ABSTRACT Purpose: To determine the effectiveness of correcting astigmatism by laser refractive surgery by a vectorial astigmatism outcome analysis that uses 3 fundamental vectors: target induced astigmatism vector (TIAT), surgically induced astigmatism vector, and difference vector, as described by the Alpins method. Methods: A data set of 100 eyes that had laser in situ keratomileusis to correct myopia and astigmatism (minimum preoperative refractive astigmatism 0.75 diopter) was analyzed. The data included preoperative and 3 month postoperative values for manifest refrac- tion and standard keratometry. Using the ASSORTT or VectrAKT analysis program, individual and aggregate data analyses were performed using simple, polar, and vector analysis of astigmatism and an analysis of spherical change. Statistical analysis of the results was used for means and confidence limits, as well as to examine the differences between corneal and refractive astigmatism outcomes. Results: At an individual patient level, the angle of error was found to be significant, suggesting variable factors at work, such as healing or alignment. A systematic error of undercorrection of astigmatism is prevalent in the treatment of these 100 patients by a factor of between 15% and 30%, depending on whether refractive or corneal values are examined. Spherical correction showed systematic undercorrection of 11%, and par- allel indices demonstrated it to be more effective than the astigmatic correction. Conclusion: This method of astigmatism analysis enables the examination of results of astigmatism treatment measured by both refractive and corneal measurements using vector analysis. By examining individual vector relationships to the TIA (ie, the correction index, index of success, and flattening index), a comprehensive astigmatism analysis is completed. Each index provides information necessary for understanding any astig- matic change. Astigmatic outcome parameters are more favorable when measured by subjective refractive than objective corneal methods. J Cataract Refract Surg 2001; 27: 31– 49 © 2001 ASCRS and ESCRS T o determine the effectiveness of correcting astigma- tism by laser refractive surgery, 3 fundamental vec- tors are examined. These are the target induced astigmatism vector (TIAt), surgically induced astigma- tism vector (SIA), and difference vector (DV). 1 From various relationships among the 3 vectors, we are able to examine outcomes of astigmatism treatment. In individ- ual patients, this is achieved by calculating the errors that occurred and gauging the amount of correction and flat- tening induced. The degree of success achieved can be determined using a standardized parameter. The various relationships between the SIA and TIA tell whether the treatment was on axis or off axis and whether too much or too little treatment was applied. This information is also used to adjust nomograms to Accepted for publication October 17, 2000. Reprint requests to Noel Alpins, FRACO, FRCOphth, FACS, 7 Ches- terfield Road, Cheltenham, Victoria 3192, Australia. E-mail: [email protected]. © 2001 ASCRS and ESCRS 0886-3350/01/$–see front matter Published by Elsevier Science Inc. PII S0886-3350(00)00798-7
Transcript of Astigmatism analysis by the Alpins method · 2011-08-31 · Astigmatism analysis by the Alpins...
Astigmatism analysisby the Alpins method
Noel Alpins, FRACO, FRCOphth, FACS
ABSTRACT
Purpose: To determine the effectiveness of correcting astigmatism by laser refractivesurgery by a vectorial astigmatism outcome analysis that uses 3 fundamental vectors:target induced astigmatism vector (TIAT), surgically induced astigmatism vector, anddifference vector, as described by the Alpins method.
Methods: A data set of 100 eyes that had laser in situ keratomileusis to correct myopia andastigmatism (minimum preoperative refractive astigmatism 0.75 diopter) was analyzed.The data included preoperative and 3 month postoperative values for manifest refrac-tion and standard keratometry. Using the ASSORTT or VectrAKT analysis program,individual and aggregate data analyses were performed using simple, polar, and vectoranalysis of astigmatism and an analysis of spherical change. Statistical analysis of theresults was used for means and confidence limits, as well as to examine the differencesbetween corneal and refractive astigmatism outcomes.
Results: At an individual patient level, the angle of error was found to be significant,suggesting variable factors at work, such as healing or alignment. A systematic error ofundercorrection of astigmatism is prevalent in the treatment of these 100 patients by afactor of between 15% and 30%, depending on whether refractive or corneal values areexamined. Spherical correction showed systematic undercorrection of 11%, and par-allel indices demonstrated it to be more effective than the astigmatic correction.
Conclusion: This method of astigmatism analysis enables the examination of results ofastigmatism treatment measured by both refractive and corneal measurements usingvector analysis. By examining individual vector relationships to the TIA (ie, the correctionindex, index of success, and flattening index), a comprehensive astigmatism analysis iscompleted. Each index provides information necessary for understanding any astig-matic change. Astigmatic outcome parameters are more favorable when measured bysubjective refractive than objective corneal methods. J Cataract Refract Surg 2001; 27:31–49 © 2001 ASCRS and ESCRS
To determine the effectiveness of correcting astigma-tism by laser refractive surgery, 3 fundamental vec-
tors are examined. These are the target inducedastigmatism vector (TIAt), surgically induced astigma-tism vector (SIA), and difference vector (DV).1 From
various relationships among the 3 vectors, we are able toexamine outcomes of astigmatism treatment. In individ-ual patients, this is achieved by calculating the errors thatoccurred and gauging the amount of correction and flat-tening induced. The degree of success achieved can bedetermined using a standardized parameter.
The various relationships between the SIA and TIAtell whether the treatment was on axis or off axis andwhether too much or too little treatment was applied.This information is also used to adjust nomograms to
Accepted for publication October 17, 2000.
Reprint requests to Noel Alpins, FRACO, FRCOphth, FACS, 7 Ches-terfield Road, Cheltenham, Victoria 3192, Australia. E-mail:[email protected].
© 2001 ASCRS and ESCRS 0886-3350/01/$–see front matterPublished by Elsevier Science Inc. PII S0886-3350(00)00798-7
improve subsequent astigmatism outcomes. Systematiclaser or surgical technique errors can be revealed by ag-gregate analysis. The TIA quantifies the intended astig-matism treatment at the corneal plane and is the key toenabling an integrated analysis to be performed by anymodality of astigmatism measurement—corneal orrefractive.
Patients and MethodsAll calculations and graphical displays were per-
formed using the ASSORTt outcomes analysis or Vec-trAKt astigmatism analysis program. Calculated valueswere exported to the SPSS program (SPSS Inc.) for sta-tistical analysis. A valid analysis is achieved by convert-ing all refractive astigmatism values to the corneal planeand performing all calculations on these corneal values.
Individual Patient AnalysisSimple Subtraction Analysis. Astigmatism analysis in
its most basic but fundamentally important form is acomparison between the postoperative and preoperativemagnitude of astigmatism without reference to axis.This is referred to as simple subtraction and determines,in its narrowest sense, that an increase (positive value) ora decrease (negative value) in the existing astigmatism ofthe eye has resulted from surgery.
Polar Analysis. This examines the steepening or flat-tening effect of the SIA occurring at the 90 degree refer-ence meridian. A positive value indicates a with-the-rule(WTR) and a negative value an against-the-rule (ATR)change.
Vector Analysis of Treatment. The following are def-initions of astigmatism vector terminology1 used in thispaper:
1. Target induced astigmatism vector (TIA). The astig-matic change (by magnitude and axis) the surgerywas intended to induce.
2. Surgically induced astigmatism vector (SIA). Theamount and axis of astigmatic change the surgeryactually induced.
Correction index (CI). Calculated by determiningthe ratio of the SIA to the TIA by dividing SIA byTIA. The CI is preferably 1.0. It is greater than 1.0if an overcorrection occurs and less than 1.0 ifthere is an undercorrection.
Errors of treatment. The arithmetic difference be-tween the SIA and TIA magnitudes and axes.Magnitude of error (ME). The arithmetic differ-ence between the magnitudes of the SIA and TIA.The ME is positive for overcorrections and nega-tive for undercorrections.Angle of error (AE). The angle described by thevectors of the achieved correction (SIA) versus theintended correction (TIA). The AE is positive ifthe achieved correction is on an axis counterclock-wise (CCW) to where it was intended and negativeif the achieved correction is clockwise (CW) to itsintended axis.
3. Difference Vector (DV). The induced astigmaticchange (by magnitude and axis) that would enablethe initial surgery to achieve its intended target. TheDV is an absolute measure of success and is prefera-bly zero.
Index of success (IOS). Calculated by dividing theDV by the TIA. The IOS is a relative measure ofsuccess and is also preferably zero.
4. Flattening Effect (FE). The amount of astigmatismreduction achieved by the effective proportion ofthe SIA at the intended meridian (FE 5 SIACos2.AE).
Flattening index (FI). Calculated by dividing theFE by the TIA; preferably 1.0.2
5. Torque. The amount of astigmatic change inducedby the SIA, due to nonalignment of the treatment,that has been ineffective in reducing astigmatism atthe intended meridian but causes rotation and a smallincrease in the existing astigmatism. Torque lies 45degrees CCW to the SIA if positive and 45 degreesCW to the SIA if negative.2
6. Nomogram Calculator for Astigmatism. An additionalparameter is available from this method of astigma-tism analysis that enables the achievement of a fullcorrection of astigmatism magnitude in future treat-ments based on experience. This is
Coefficient of adjustment (CA). Calculated by di-viding TIA by SIA; the coefficient required to ad-just future astigmatism treatment magnitudes(TIA). Its value is preferably 1.0 and it is the in-verse of the CI.
ANALYZING ASTIGMATISM: ALPINS
J CATARACT REFRACT SURG—VOL 27, JANUARY 200132
Vector Analysis of Ocular Status. This analysis mea-sures 2 components:
1. Ocular residual astigmatism (ORA). Dioptric measureof the noncorneal component of total refractiveastigmatism; that is, the vector difference betweenrefractive and corneal astigmatism.3 It representsthe amount of corneal astigmatism expected to re-main after treatment using refractive astigmatismvalues.
2. Topographic disparity (TD). A vectorial measure ofirregular astigmatism calculated as the dioptric dis-tance between the displays of superior and inferiortopographical values on a 720 degree double-anglevector diagram (DAVD).4
Analysis of Spherical Change (Corneal Plane). Thisanalysis uses analogous parameters.5
1. Spherical correction index (S.CI):
S.CI 5Spherical equivalent correction achieved
Spherical equivalent correction targeted
2. Spherical difference (SDiff):
SDiff 5 [Spherical equivalent achieved– spherical equivalent targeted] (absolute)
3. Index of success for spherical change (S.IOS):
S.IOS 5Spherical difference
Spherical equivalent correction targeted
To express indices as percentages, use the following cal-culations:
Percentage of astigmatism corrected: CI 3 100Percentage of astigmatism reduction at the intended
axis: FI 3 100Percentage success of astigmatism surgery: (1.0–
IOS) 3 100Percentage of sphere corrected: S.CI 3 100Percentage success of spherical surgery: (1.0 2
S.IOS) 3 100
Aggregate Data AnalysisWhen examining aggregate data of vectorial com-
ponents, such as TIA, SIA, or DV, where magni-tudes and axes are involved, 2 types of analysis arerelevant.
1. An examination can be made of arithmetic meansand the orientation of the vector disregarded to de-termine the mean vector magnitude.
2. Magnitudes of the vectors can be added with regardto each vector’s orientation to determine a summatedvector mean of the group.
The summated vector mean is always less than themean vector magnitude, and the greater the differencebetween the 2 (ie, as the summated vector mean magni-tude approaches zero), the less any overall trend is evi-dent. In this situation, the changes are more likely due torandom events than any discernible factor that may beprevalent. In the display of aggregate analysis, it is help-ful to show the individual vectors (black) and the sum-mated vector mean (red) in the same polar diagram as inFigures 3 to 7. Using this technique the vectors can beexamined as they would appear on the eye, displayed attheir own axes. In this way, when examining the treat-ment of irregular astigmatism, 2 displays can be used sothat both halves of the cornea can be separately exam-ined in a combined hemidivisional analysis of the wholecornea.
Statistical MethodsAll available measures in aggregate analysis were sta-
tistically analyzed by examining the mean and the 95%confidence interval of the mean. The confidence intervalis the span of measures within which one can be 95%confident to find the mean if the sample was taken fromthe population on a second occasion.
A further examination was performed for the corre-lation between analyses of changes between measure-ments by refraction and keratometry. The level ofsignificance was set at a P value of 0.05 or less.
Examination of the distribution of the variablesshowed that all departed considerably from the normaldistribution. They were, therefore, unsuitable for Pear-son’s correlation analysis. Thus, Spearman’s correlation(rho value) was used to evaluate the distribution of thevariables to find the degree of covariation between the 2distributions.
ResultsIndividual Patient Analysis: Patient 25
This patient’s refraction has changed from 29.2520.75 3 15 to 20.50 21.00 3 67 and keratometry
ANALYZING ASTIGMATISM: ALPINS
J CATARACT REFRACT SURG—VOL 27, JANUARY 2001 33

from 43.00/43.75 @ 95 to 38.17/38.83 @ 22. Therewas no significant reduction in astigmatism magnitudes,as shown by a comparison of the magnitude of astigma-tism measured preoperatively and postoperatively (Ta-ble 1). However, by examination of the orientations ofboth pairs of astigmatism measurements preoperativelyand postoperatively, there has been significant astigma-tism change. Examining these astigmatism values alonedoes not assist greatly in revealing the errors.
The treatments were solely determined by refractiveastigmatism values to eliminate myopic sphere and cyl-inder and achieve a plano refraction. The treatment ap-plied to the cornea is the spectacle refraction (in negativecylinder notation) calculated to its corneal plane valueby adjusting for back vertex distance. In this case (Fig-ure 1, patient 25), the preoperative corneal plane refrac-tion is 28.29 20.60 3 15 so that the astigmatictreatment (TIA) is 0.60 3 15, intending to induce 0.60diopter (D) of steepening at the 15 degree corneal me-ridian to achieve a refractive astigmatic target of 0.00 D.The calculated corneal target is 0.28 @ 71 when a TIA of0.60 3 15 is applied to a corneal astigmatism value of0.75 @ 95. The achieved values are the measured post-operative refractive and corneal astigmatism. The SIA isthe calculated vectorial change between postoperativeand preoperative astigmatism and is 1.26 D (refractive)and 1.35 D (corneal).
Figures 1 (refractive) and 2 (corneal) each contain3 graphical displays. The polar diagram of astigma-tism values displays the power meridian of the nega-tive cylinder (which is the positive cylinder axis) forease of comparison with the corneal (steep) astigma-tism values. The DAVDs show these astigmatismmagnitude values as a continuous line at twice theiraxis value and the respective surgical vectors as adashed line connecting these astigmatism displays.The surgical vector polar diagrams show these samesurgical vectors at their actual orientation, as theywould appear on the eye, which is one half of theiraxis value on the DAVD display. The values of thesecalculated surgical vectors are tabulated in the boxadjacent to the display.
The analysis facilitates the determination of the ef-fectiveness of the astigmatism procedure by its individ-ual components. The boxes titled “analysis” in Figures 1and 2 display the AE, ME, CI, and IOS. Both refractive(Figure 1) and corneal (Figure 2) analyses show that
there has been an overcorrection of astigmatism by morethan double. This is evidenced by CI values of 2.11 forrefraction and 2.26 for keratometry. The analysis of sub-jective values of refraction suggests that the treatmentwas off axis CW by 24 degrees but the objective analysisof corneal values (CW by 2 degrees) provides a crosscheck and balance, which indicates that the misalign-ment is likely to have been less than 24 degrees.
The DVs in both refractive (0.98 D) and corneal(0.75 D) cases are relatively large, each exceeding theTIA (0.60 D). An IOS of 0.00 indicates complete suc-cess in astigmatism treatment, a result of 1.00 shows noimprovement on the preoperative status, and greaterthan 1.00 shows a deterioration in the astigmatic state.This result suggests that the astigmatic status postoper-atively was worse than preoperatively by 63% (IOS 51.63) by refraction and 26% (IOS 5 1.26) by cornealmeasurements.
By corneal measurement, the FE at the treatmentmeridian (1.35 D [rounded up]; Table 2) was nearlyequivalent to the SIA (1.35 D; Figure 2). The AE wassmall as treatment was off axis by 2 degrees (Figure 2).Hence, the corneal FI (2.25) was near to the CI (2.26 forkeratometry) (Table 2) and negligible torque was cre-ated. By refractive values, however, the FE (0.83 D;Table 2) was one third less than the SIA (1.26 D; Fig-ure 1) because the treatment was off axis by 24 degrees(AE) (Figure 1). Thus, a significant loss of effect at theintended (15 degree) meridian occurred. This is evi-denced by a reduced FI (1.39; Table 2) compared to CI(2.11; Figure 1) for refraction and a significant pro-portion of the SIA being dissipated as CCW torque(0.95 D). This explains the significant rotation of theexisting refractive astigmatism axis from 15 to 67 de-grees (Figure 1).
Reduction in preoperative WTR astigmatism re-sulted in consistent ATR astigmatic changes in bothmodes by polar analysis (21.20 D for refraction and21.21 D for keratometry; Table 1). This is consistentwith orientation of the SIA at axes of 171 degrees and 13degrees, respectively (ie, close to the 0/180 axis) (Figures1 and 2). Examining the FE at the 90 degree meridianresults in precisely the same values as the polar analysisfor WTR and ATR changes.
An ORA of 0.28 3 161 (Table 2) indicates rela-tively good correlation between preoperative refractive(20.75 3 15) and corneal (0.75 @ 95) astigmatism
ANALYZING ASTIGMATISM: ALPINS
J CATARACT REFRACT SURG—VOL 27, JANUARY 200134
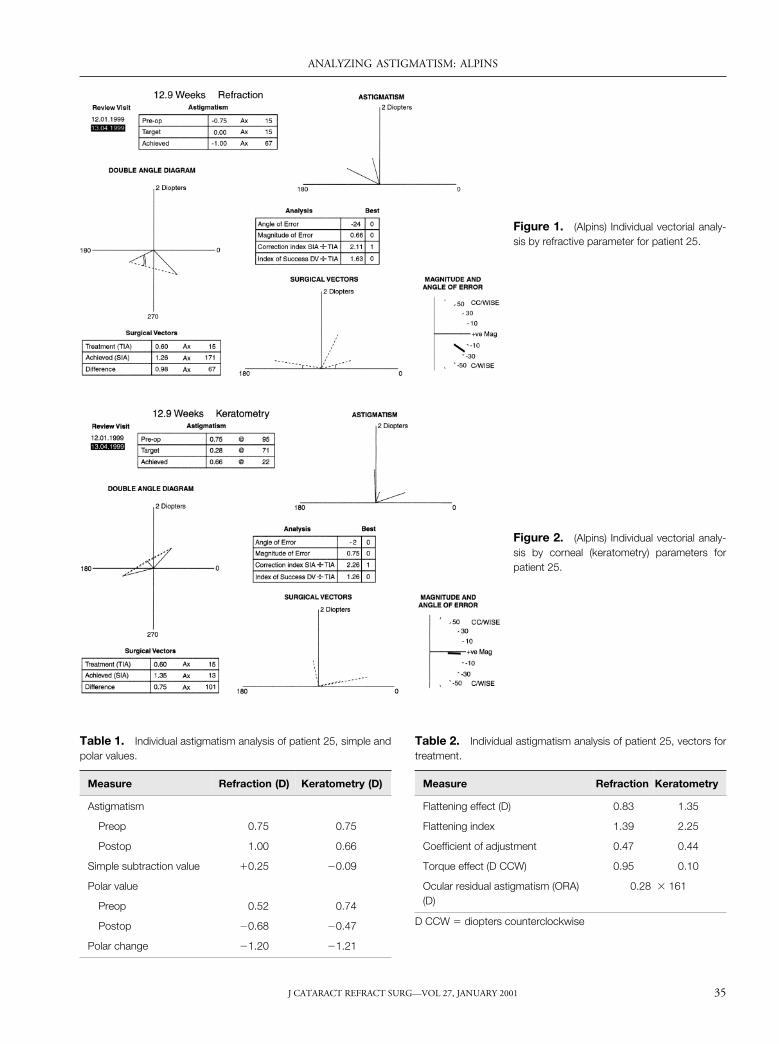
Figure 1. (Alpins) Individual vectorial analy-sis by refractive parameter for patient 25.
Figure 2. (Alpins) Individual vectorial analy-sis by corneal (keratometry) parameters forpatient 25.
Table 1. Individual astigmatism analysis of patient 25, simple andpolar values.
Measure Refraction (D) Keratometry (D)
Astigmatism
Preop 0.75 0.75
Postop 1.00 0.66
Simple subtraction value 10.25 20.09
Polar value
Preop 0.52 0.74
Postop 20.68 20.47
Polar change 21.20 21.21
Table 2. Individual astigmatism analysis of patient 25, vectors fortreatment.
Measure Refraction Keratometry
Flattening effect (D) 0.83 1.35
Flattening index 1.39 2.25
Coefficient of adjustment 0.47 0.44
Torque effect (D CCW) 0.95 0.10
Ocular residual astigmatism (ORA)(D)
0.28 3 161
D CCW 5 diopters counterclockwise
ANALYZING ASTIGMATISM: ALPINS
J CATARACT REFRACT SURG—VOL 27, JANUARY 2001 35
readings. Their corneal plane values (0.60 D and0.75 D) are close to the same, with the separation being10 degrees (Figures 1 and 2). Topographic disparity, thevectorial measure of corneal irregularity, was not as-sessed in this series as only 1 corneal value was availablefor each eye.
The preoperative spherical equivalent (cornealplane) was 28.59 D, which is also the targeted sphericalequivalent of correction as plano was targeted for alleyes. The result was 20.99 D (corneal plane).
When an analogous spherical analysis is performedat the corneal plane (Table 3), the results show an S.CI
of 0.88, indicating an undercorrection of spherical treat-ment by 12%, with the remaining absolute sphere being0.99 D. The treatment shows an S.IOS of 0.12, indicat-ing the spherical correction was 88% successful.
Aggregate Data AnalysisThe following data analysis was performed on a
group of 100 eyes that had laser in situ keratomileusis formyopia and astigmatism. Results are presented in paral-lel for refractive and corneal analysis 3 months after sur-gery. The mean spherical equivalent correction was26.68 D (range 21.75 to 211.88 D) at the spectacleplane. The mean astigmatic correction was 1.24 D(range 0.40 to 3.04 D) at the corneal plane. Statisticalanalysis such as means, 95% confidence intervals, signif-icance level, and Spearman’s correlation (rho) are in-cluded in tables.
Changes in simple analysis of astigmatism values forboth refraction and keratometry are shown in Table 4.Preoperative mean corneal astigmatism (1.57 D) wasWTR and as is usually the case,3 it exceeded mean re-
Table 3. Individual analogous spherical analysis of patient 25.
Measure Refraction
S.CI 0.88
SDiff (D) 0.99
S.IOS 0.12
S.CI 5 spherical correction index; SDiff 5 spherical difference;S.IOS 5 spherical index of success
Table 4. Aggregate data, simple and polar value analysis.
Measure Refraction (D) Keratometry (D)Significance
(Spearman’s Correlation)
Preoperative astigmatism
Mean 6 SD 1.24 6 0.51 1.57 6 0.71 ,.000
Range* 1.23 to 1.25 1.56 to 1.58 (0.529)
Postoperative astigmatism
Mean 6 SD 0.39 6 0.37 0.84 6 0.50 .387
Range* 0.38 to 0.40 0.83 to 0.85 (0.087)
Simple subtraction analysis
Mean 6 SD 20.85 6 0.62 20.73 6 0.60 ,.000
Range* 20.87 to 20.84 20.74 to 20.71 (0.485)
Preoperative polar value
Mean 6 SD 0.81 6 0.99 1.28 6 1.00 ,.000
Range* 0.63 to 0.99 1.09 to 1.47 (0.812)
Postoperative polar value
Mean 6 SD 0.09 6 0.43 0.63 6 0.62 ,.000
Range* 0.03 to 0.17 0.51 to 0.75 (0.454)
Polar analysis
Mean 6 SD 20.72 6 0.88 20.65 6 0.73 ,.000
Range* 20.89 to 20.55 20.80 to 20.51 (0.737)
SD 5 standard deviation*95% confidence interval
ANALYZING ASTIGMATISM: ALPINS
J CATARACT REFRACT SURG—VOL 27, JANUARY 200136
fractive astigmatism (1.24 D) by a factor of 1.27. Asimilar amount of astigmatism reduction occurred byrefractive (0.85 D) and corneal (0.73 D) measures. Post-operative corneal astigmatism (0.84 D) exceeded refrac-tive astigmatism (0.39 D) by an increased factor of 2.15.Astigmatism treatments were calculated using refractiveastigmatism values after conversion to the corneal plane.
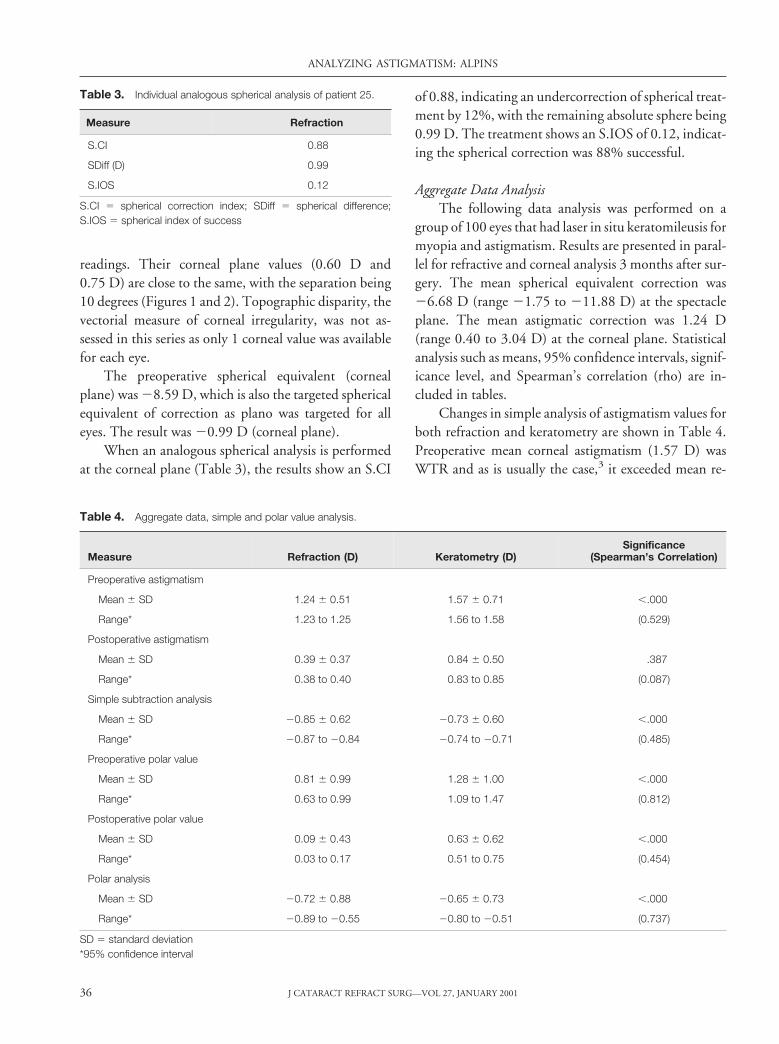
A summated vector mean TIA value of 0.81 3 178shown in surgical vector graph (Table 5, Figure 3) wasattempted, indicating that the overall trend of treatmentwas to induce a net steepening close to the horizontalmeridian, resulting in an ATR change.
Values determined by vector analysis are shown inTable 5. The arithmetic mean SIA magnitude for both
Figure 3. (Alpins) Vectorial display oftargeted astigmatism treatments (TIA)at their own vector axis (of maximumablation), with summated vector meanof group.
Table 5. Aggregate data, surgical vector analysis of treatment.
Measure Refraction KeratometrySignificance
(Spearman’s Correlation)
TIA, arithmetic mean (D)
Mean 6 SD 1.24 6 0.52 —
Range* 1.23 to 1.25
TIA, vector mean (D) 0.81 3 178 —
SIA, arithmetic mean (D)
Mean 6 SD 1.14 6 0.57 1.04 6 0.50 ,.000
Range* 1.13 to 1.15 1.03 to 1.05 (0.509)
SIA, vector mean (D) 0.72 3 179 0.66 3 179 —
DV, arithmetic mean (D)
Mean 6 SD 0.39 6 0.37 0.72 6 0.41 .166
Range* 0.38 to 0.40 0.71 to 0.73 (0.140)
DV, vector mean (D) 0.09 3 172 0.16 3 172 —
DV –vector mean
arithmetic mean
0.23 0.22 —
TIA 5 target induced astigmatism vector; SD 5 standard deviation; SIA 5 surgically induced astigmatism vector; DV 5 difference vector*95% confidence interval
ANALYZING ASTIGMATISM: ALPINS
J CATARACT REFRACT SURG—VOL 27, JANUARY 2001 37
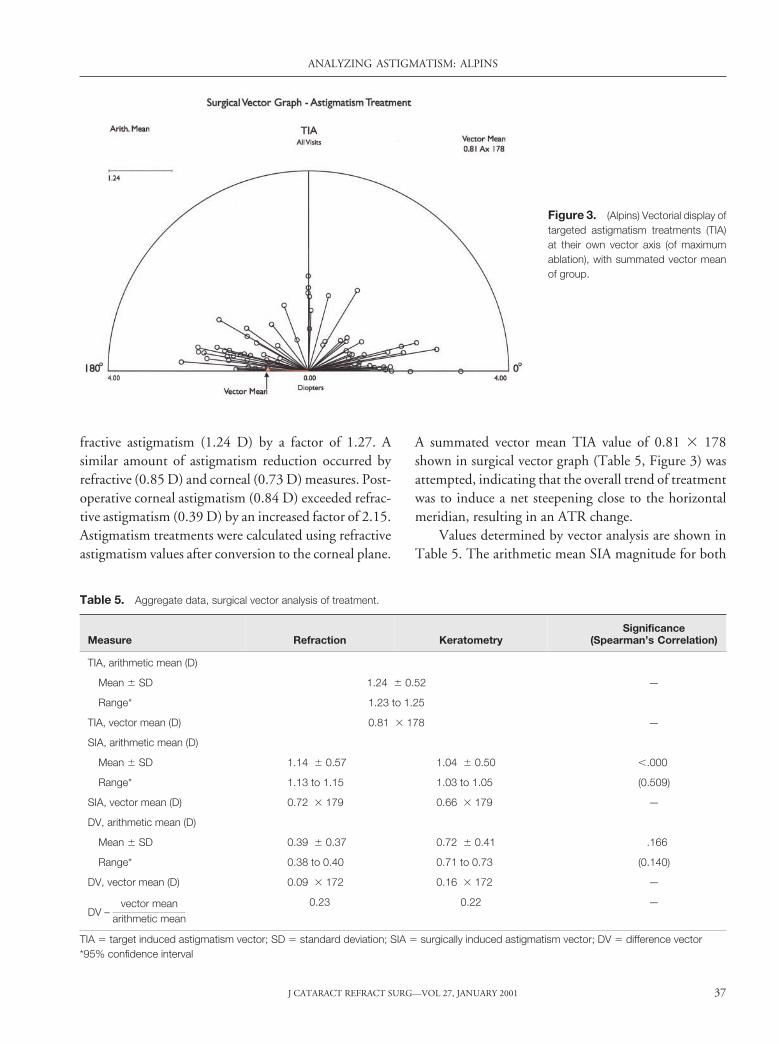
refraction (1.14 D) and keratometry (1.04 D) were lessthan the arithmetic mean TIA (1.24 D); overall under-correction was more pronounced in the corneal than inthe refractive analysis. The SIA surgical vector graphs areshown in Figure 4 for refraction and Figure 5 for kera-tometry. The summated vector mean values of SIA byrefraction (0.72 D) and keratometry (0.66 D) comparedwith the TIA (0.81 D) followed the same trend ofgreater undercorrection by corneal analysis.
Analysis using the difference vector showed consis-tent trends for treatment error in both measurement
modes. The arithmetic mean magnitude of the DV byrefraction (0.39 D) was substantially less than that bykeratometry (0.72 D). A little under 25% of this error(0.09 and 0.16 D) can be attributed to systematic treat-ment error (Table 5) by examining the summated vectormean. Both refraction and keratometry results showsimilar trends when summated vector means of the DVare examined on the surgical vector graphs shown inFigure 6 for refraction and Figure 7 for keratometry.
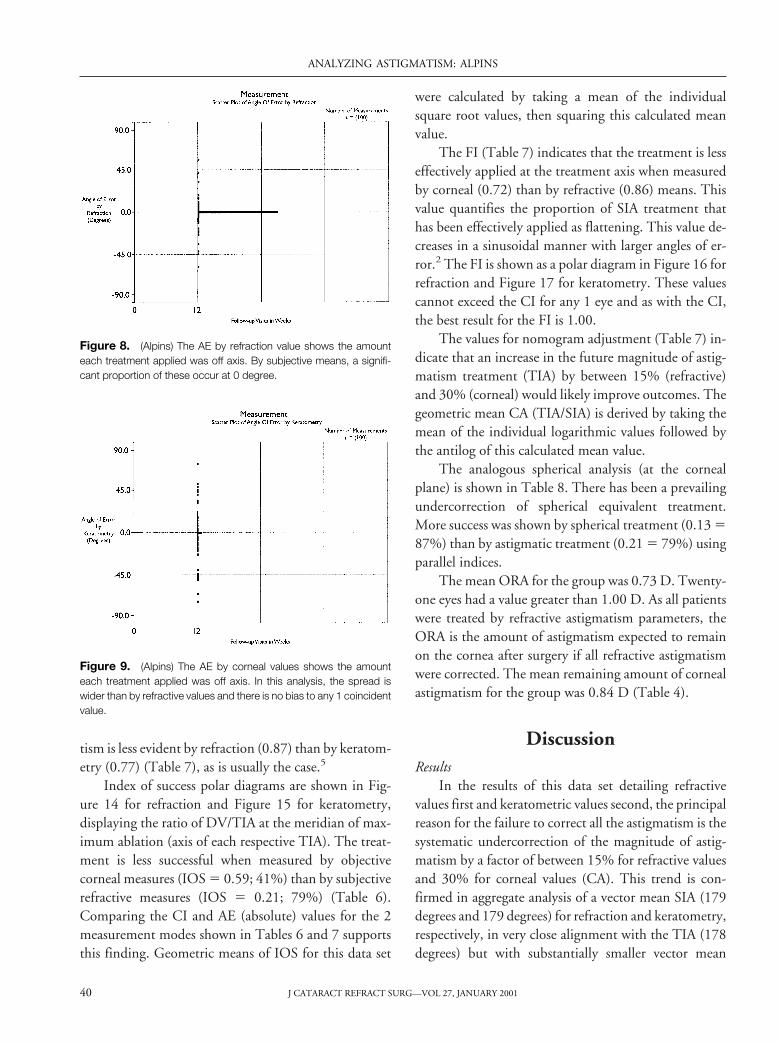
Angle-of-error analysis for refraction (Figure 8) andkeratometry (Figure 9) show that both arithmetic means
Figure 4. (Alpins) Vectorial displayof achieved treatments (SIA) measuredby refractive parameters at their merid-ian of maximum ablation, with the sum-mated vector mean of the group.
Figure 5. (Alpins) Vectorial displayof achieved treatments (SIA) measuredby corneal parameters at their meridianof maximum ablation, with the sum-mated vector mean of the group.
ANALYZING ASTIGMATISM: ALPINS
J CATARACT REFRACT SURG—VOL 27, JANUARY 200138
for the group were slightly CW (21.1 degrees and 20.2degrees) and close to zero (Table 6). However, thespread of results is wide, and by examining the absolutemeans, the objective corneal measure (16.6 degrees)shows a less favorable outcome on alignment with awider spread of results than that of the mean refractivevalue (6.7 degrees). A significant finding reveals thatanalysis for AE of zero was present in 3 eyes by cornealanalysis and in 42 eyes by refractive analysis (Table 6,Figures 8 and 9). The negative MEs (20.11 D refraction
and 20.20 D keratometry), where the mean SIA mag-nitude is less than the mean TIA magnitude, confirm atrend of undercorrection for the group.
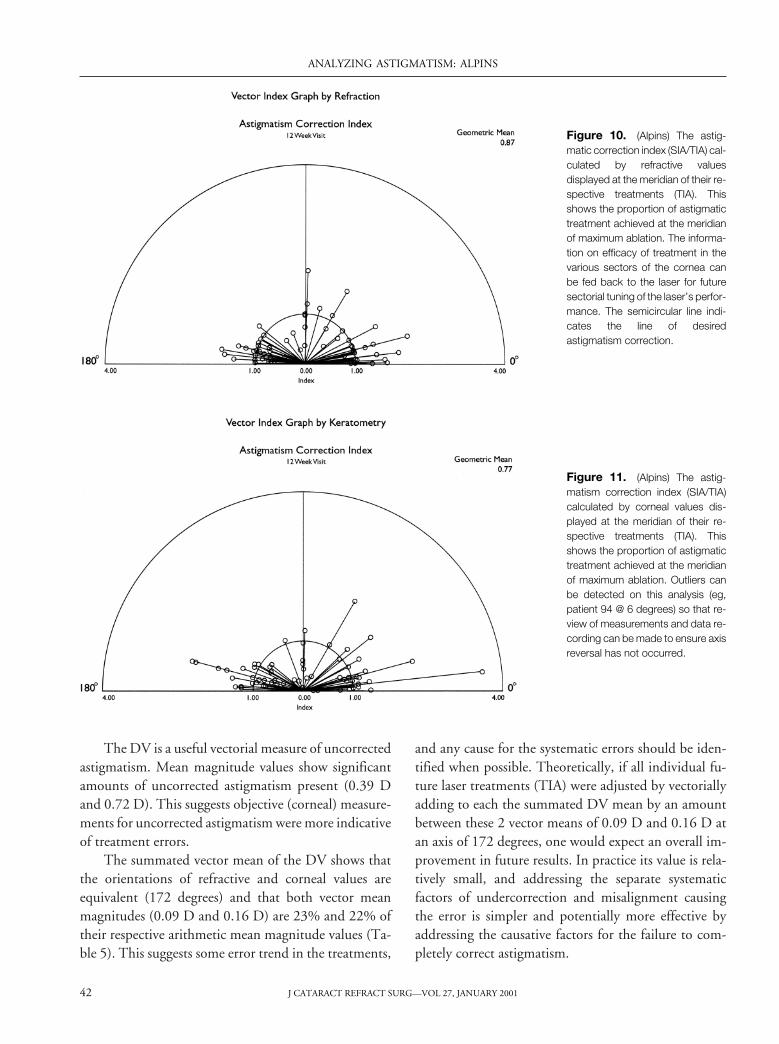
Correction index polar diagrams are shown in Fig-ure 10 for refraction and Figure 11 for keratometry. Theratio of SIA/TIA for each individual treatment is dis-played at the meridian of maximum ablation (axis ofeach respective TIA). Scatter plots of SIA versus TIA areshown in Figure 12 for refraction and Figure 13 forkeratometry. The general undercorrection of astigma-
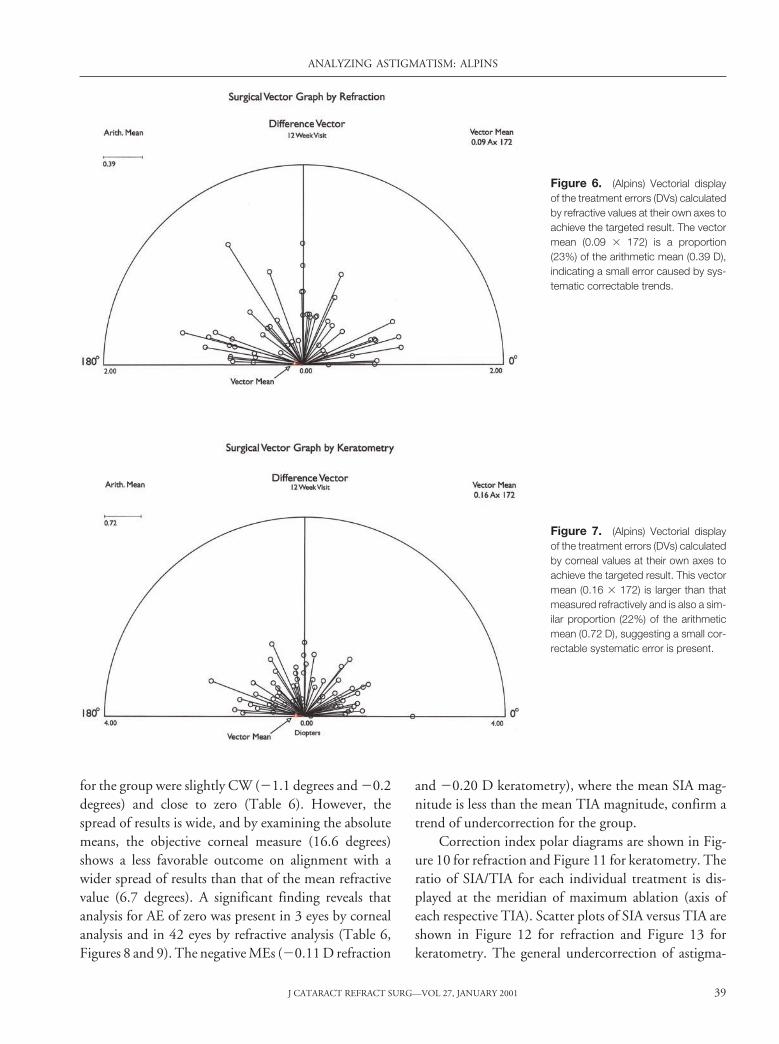
Figure 6. (Alpins) Vectorial displayof the treatment errors (DVs) calculatedby refractive values at their own axes toachieve the targeted result. The vectormean (0.09 3 172) is a proportion(23%) of the arithmetic mean (0.39 D),indicating a small error caused by sys-tematic correctable trends.
Figure 7. (Alpins) Vectorial displayof the treatment errors (DVs) calculatedby corneal values at their own axes toachieve the targeted result. This vectormean (0.16 3 172) is larger than thatmeasured refractively and is also a sim-ilar proportion (22%) of the arithmeticmean (0.72 D), suggesting a small cor-rectable systematic error is present.
ANALYZING ASTIGMATISM: ALPINS
J CATARACT REFRACT SURG—VOL 27, JANUARY 2001 39
tism is less evident by refraction (0.87) than by keratom-etry (0.77) (Table 7), as is usually the case.5
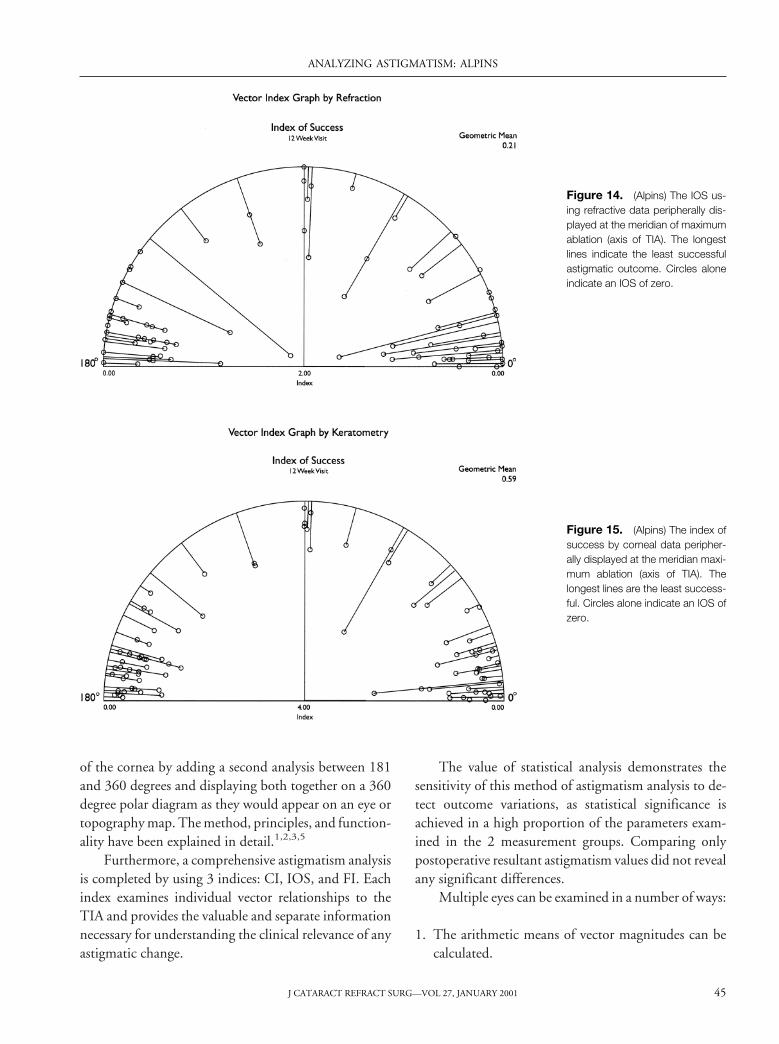
Index of success polar diagrams are shown in Fig-ure 14 for refraction and Figure 15 for keratometry,displaying the ratio of DV/TIA at the meridian of max-imum ablation (axis of each respective TIA). The treat-ment is less successful when measured by objectivecorneal measures (IOS 5 0.59; 41%) than by subjectiverefractive measures (IOS 5 0.21; 79%) (Table 6).Comparing the CI and AE (absolute) values for the 2measurement modes shown in Tables 6 and 7 supportsthis finding. Geometric means of IOS for this data set
were calculated by taking a mean of the individualsquare root values, then squaring this calculated meanvalue.
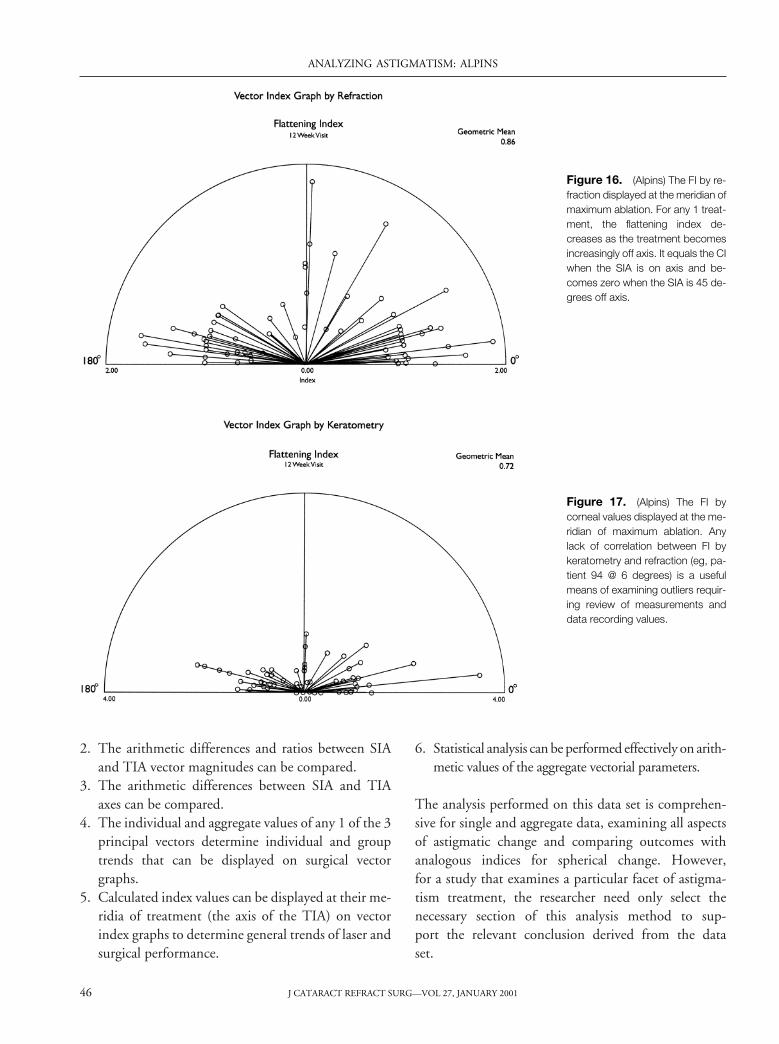
The FI (Table 7) indicates that the treatment is lesseffectively applied at the treatment axis when measuredby corneal (0.72) than by refractive (0.86) means. Thisvalue quantifies the proportion of SIA treatment thathas been effectively applied as flattening. This value de-creases in a sinusoidal manner with larger angles of er-ror.2 The FI is shown as a polar diagram in Figure 16 forrefraction and Figure 17 for keratometry. These valuescannot exceed the CI for any 1 eye and as with the CI,the best result for the FI is 1.00.
The values for nomogram adjustment (Table 7) in-dicate that an increase in the future magnitude of astig-matism treatment (TIA) by between 15% (refractive)and 30% (corneal) would likely improve outcomes. Thegeometric mean CA (TIA/SIA) is derived by taking themean of the individual logarithmic values followed bythe antilog of this calculated mean value.
The analogous spherical analysis (at the cornealplane) is shown in Table 8. There has been a prevailingundercorrection of spherical equivalent treatment.More success was shown by spherical treatment (0.13 587%) than by astigmatic treatment (0.21 5 79%) usingparallel indices.
The mean ORA for the group was 0.73 D. Twenty-one eyes had a value greater than 1.00 D. As all patientswere treated by refractive astigmatism parameters, theORA is the amount of astigmatism expected to remainon the cornea after surgery if all refractive astigmatismwere corrected. The mean remaining amount of cornealastigmatism for the group was 0.84 D (Table 4).
DiscussionResults
In the results of this data set detailing refractivevalues first and keratometric values second, the principalreason for the failure to correct all the astigmatism is thesystematic undercorrection of the magnitude of astig-matism by a factor of between 15% for refractive valuesand 30% for corneal values (CA). This trend is con-firmed in aggregate analysis of a vector mean SIA (179degrees and 179 degrees) for refraction and keratometry,respectively, in very close alignment with the TIA (178degrees) but with substantially smaller vector mean
Figure 8. (Alpins) The AE by refraction value shows the amounteach treatment applied was off axis. By subjective means, a signifi-cant proportion of these occur at 0 degree.
Figure 9. (Alpins) The AE by corneal values shows the amounteach treatment applied was off axis. In this analysis, the spread iswider than by refractive values and there is no bias to any 1 coincidentvalue.
ANALYZING ASTIGMATISM: ALPINS
J CATARACT REFRACT SURG—VOL 27, JANUARY 200140
magnitudes of the SIA (0.72 D for refraction and 0.66 Dfor keratometry) compared to that of the TIA (0.81 D).Undercorrection of astigmatism only occurs when theTIA exceeds the SIA and is not a result of measuredastigmatism remaining after surgery. When off-axistreatment occurs, it does not alter the effective power ofthe SIA magnitude, so that any remaining astigmatismdoes not occur as a result of undertreatment of astigma-tism power.
That the mean AE (21.1 degrees and 20.2 degrees)was close to zero is consistent with the closeness ofthe aggregate vector mean TIA and SIA axes detailedabove, so no significant systematic error of misalignedtreatment is evident. However, at an individual patientlevel, each AE is significant as is shown by mean absolutevalues (6.7 degrees and 16.6 degrees), suggesting vari-able factors at work such as healing or alignment. Themean astigmatic IOSs (0.21 and 0.59) demonstrate
the failure to successfully correct astigmatism on anindividual basis. This becomes more evident whenexamined by corneal (objective) means than by refrac-tive (subjective) means. Either way, the success in spher-ical treatment (S.IOS 0.13), when examined byanalogous means, is greater. The refractive value forIOS (0.21) compares favorably with that in other pub-lished series using the Alpins method of astigmatismanalysis.
The effect of the significant mean absolute AEs (6.7degrees and 16.6 degrees) is a loss of FE of the SIA(reduced to 1.07 D and 0.87 D) and reduced FI (0.86and 0.72). The prevailing undercorrection of astigma-tism also influences these values. When calculated byvector analysis, the proportion of loss of FE is 1.5%when treatment is 5 degrees misaligned, 13.4% when 15degrees, 50% when 30 degrees, and total loss of FE when45 degrees showing a sinusoidal form.2
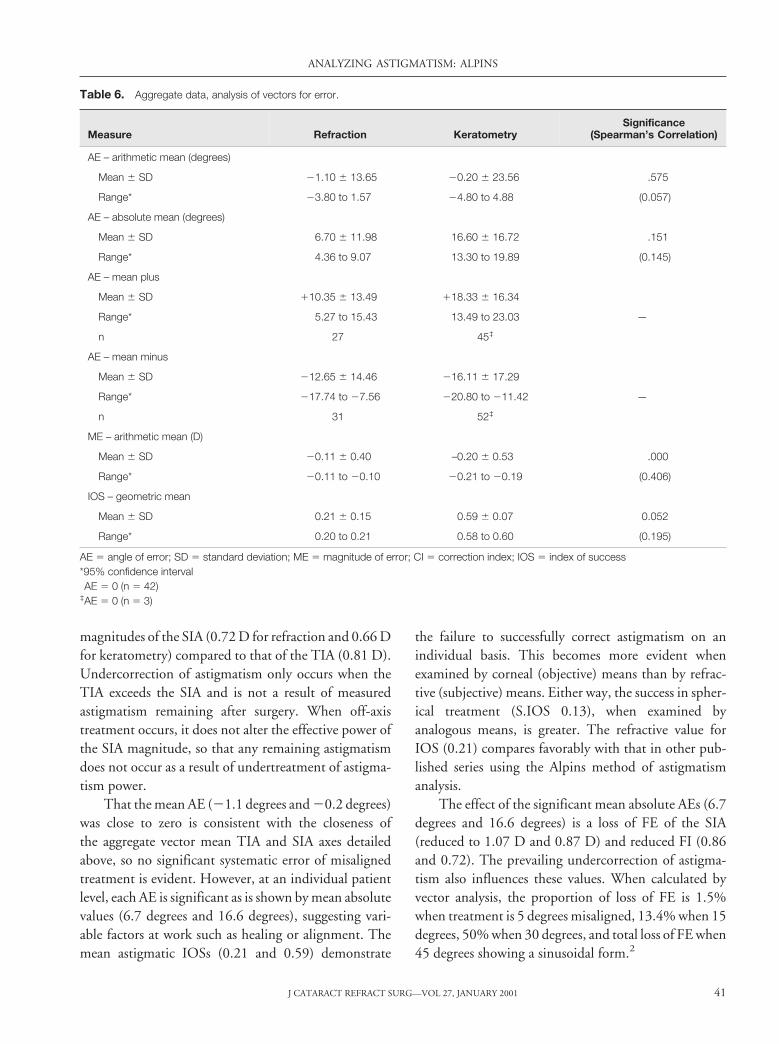
Table 6. Aggregate data, analysis of vectors for error.
Measure Refraction KeratometrySignificance
(Spearman’s Correlation)
AE – arithmetic mean (degrees)
Mean 6 SD 21.10 6 13.65 20.20 6 23.56 .575
Range* 23.80 to 1.57 24.80 to 4.88 (0.057)
AE – absolute mean (degrees)
Mean 6 SD 6.70 6 11.98 16.60 6 16.72 .151
Range* 4.36 to 9.07 13.30 to 19.89 (0.145)
AE – mean plus
Mean 6 SD 110.35 6 13.49 118.33 6 16.34
—Range* 5.27 to 15.43 13.49 to 23.03
n 27† 45‡
AE – mean minus
Mean 6 SD 212.65 6 14.46 216.11 6 17.29
—Range* 217.74 to 27.56 220.80 to 211.42
n 31† 52‡
ME – arithmetic mean (D)
Mean 6 SD 20.11 6 0.40 –0.20 6 0.53 .000
Range* 20.11 to 20.10 20.21 to 20.19 (0.406)
IOS – geometric mean
Mean 6 SD 0.21 6 0.15 0.59 6 0.07 0.052
Range* 0.20 to 0.21 0.58 to 0.60 (0.195)
AE 5 angle of error; SD 5 standard deviation; ME 5 magnitude of error; CI 5 correction index; IOS 5 index of success*95% confidence interval†AE 5 0 (n 5 42)‡AE 5 0 (n 5 3)
ANALYZING ASTIGMATISM: ALPINS
J CATARACT REFRACT SURG—VOL 27, JANUARY 2001 41
The DV is a useful vectorial measure of uncorrectedastigmatism. Mean magnitude values show significantamounts of uncorrected astigmatism present (0.39 Dand 0.72 D). This suggests objective (corneal) measure-ments for uncorrected astigmatism were more indicativeof treatment errors.
The summated vector mean of the DV shows thatthe orientations of refractive and corneal values areequivalent (172 degrees) and that both vector meanmagnitudes (0.09 D and 0.16 D) are 23% and 22% oftheir respective arithmetic mean magnitude values (Ta-ble 5). This suggests some error trend in the treatments,
and any cause for the systematic errors should be iden-tified when possible. Theoretically, if all individual fu-ture laser treatments (TIA) were adjusted by vectoriallyadding to each the summated DV mean by an amountbetween these 2 vector means of 0.09 D and 0.16 D atan axis of 172 degrees, one would expect an overall im-provement in future results. In practice its value is rela-tively small, and addressing the separate systematicfactors of undercorrection and misalignment causingthe error is simpler and potentially more effective byaddressing the causative factors for the failure to com-pletely correct astigmatism.
Figure 10. (Alpins) The astig-matic correction index (SIA/TIA) cal-culated by refractive valuesdisplayed at the meridian of their re-spective treatments (TIA). Thisshows the proportion of astigmatictreatment achieved at the meridianof maximum ablation. The informa-tion on efficacy of treatment in thevarious sectors of the cornea canbe fed back to the laser for futuresectorial tuning of the laser’s perfor-mance. The semicircular line indi-cates the line of desiredastigmatism correction.
Figure 11. (Alpins) The astig-matism correction index (SIA/TIA)calculated by corneal values dis-played at the meridian of their re-spective treatments (TIA). Thisshows the proportion of astigmatictreatment achieved at the meridianof maximum ablation. Outliers canbe detected on this analysis (eg,patient 94 @ 6 degrees) so that re-view of measurements and data re-cording can be made to ensure axisreversal has not occurred.
ANALYZING ASTIGMATISM: ALPINS
J CATARACT REFRACT SURG—VOL 27, JANUARY 200142
Preoperative mean corneal astigmatism (1.57 D)was greater than refractive astigmatism (1.24 D) by afactor of 1.27. This preoperative astigmatism was overallWTR as polar values were positive (10.81 D and11.28 D). The TIA vector mean axis is orientated at178 degrees, inducing the ATR polar change (20.72 Dand 20.66 D) by reducing WTR astigmatism. The ex-isting astigmatism was reduced by refractive and cornealmeans by similar amounts (0.85 D and 0.73 D). Treat-ment parameters emphasized the elimination of refrac-tive astigmatism (target 0.00 D) in this series, so that the
mean target corneal astigmatism is represented by themean ORA (0.73 D). Postoperatively, the mean cornealastigmatism in the group decreased to 0.84 D and re-fractive astigmatism decreased to a mean of 0.39 D.Thus, the resulting mean corneal astigmatism exceededrefractive astigmatism by a factor of 2.15. This trend isopposite to the usual, in which corneal astigmatismtends to exceed refractive astigmatism when WTR pre-vails, and the reverse so that refractive exceeds cornealwhen ATR.3 The change in this ratio is so great thatexamining and comparing the individual keratometry to
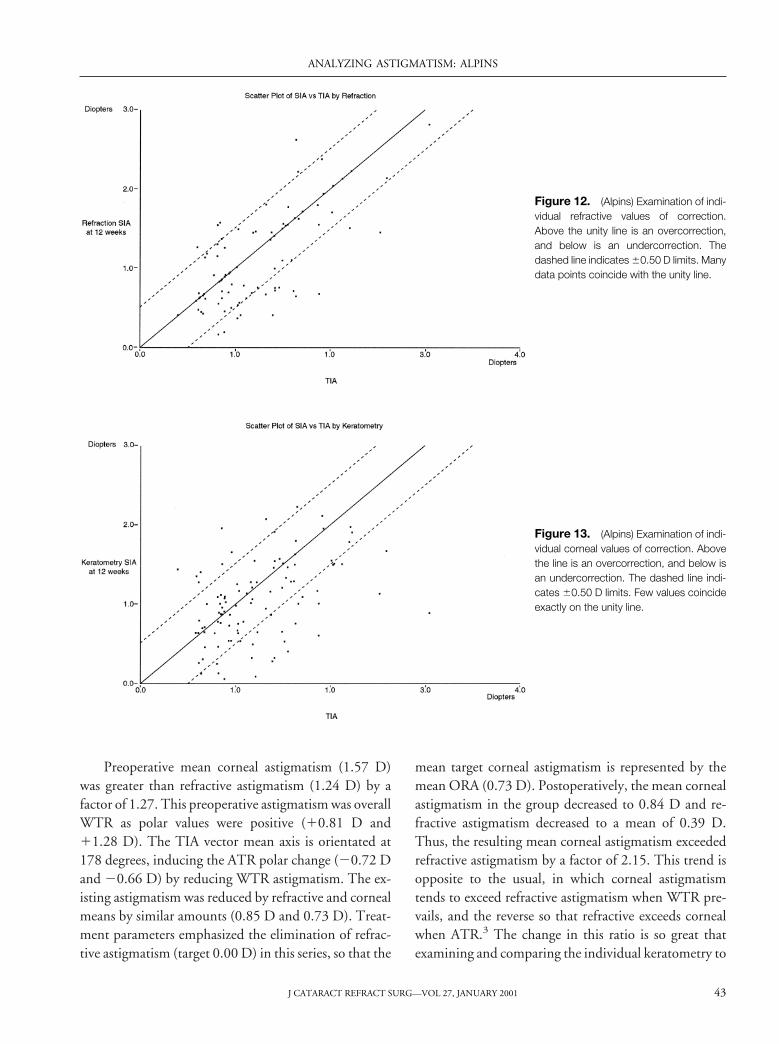
Figure 12. (Alpins) Examination of indi-vidual refractive values of correction.Above the unity line is an overcorrection,and below is an undercorrection. Thedashed line indicates 60.50 D limits. Manydata points coincide with the unity line.
Figure 13. (Alpins) Examination of indi-vidual corneal values of correction. Abovethe line is an overcorrection, and below isan undercorrection. The dashed line indi-cates 60.50 D limits. Few values coincideexactly on the unity line.
ANALYZING ASTIGMATISM: ALPINS
J CATARACT REFRACT SURG—VOL 27, JANUARY 2001 43
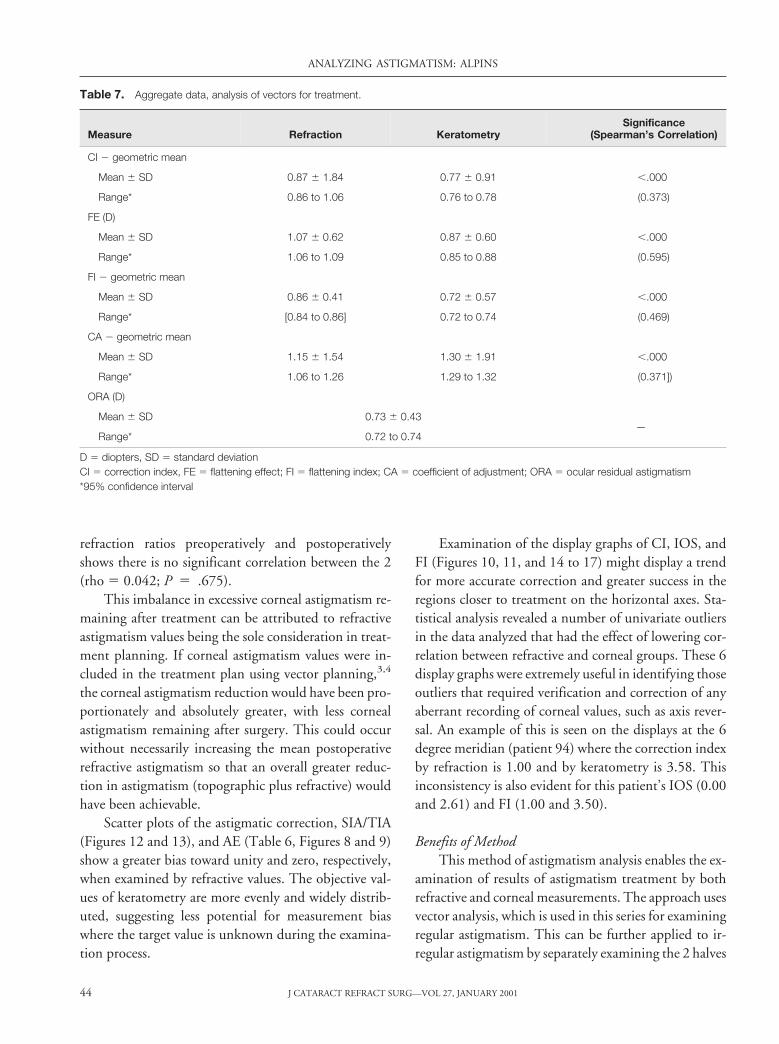
refraction ratios preoperatively and postoperativelyshows there is no significant correlation between the 2(rho 5 0.042; P 5 .675).
This imbalance in excessive corneal astigmatism re-maining after treatment can be attributed to refractiveastigmatism values being the sole consideration in treat-ment planning. If corneal astigmatism values were in-cluded in the treatment plan using vector planning,3,4
the corneal astigmatism reduction would have been pro-portionately and absolutely greater, with less cornealastigmatism remaining after surgery. This could occurwithout necessarily increasing the mean postoperativerefractive astigmatism so that an overall greater reduc-tion in astigmatism (topographic plus refractive) wouldhave been achievable.
Scatter plots of the astigmatic correction, SIA/TIA(Figures 12 and 13), and AE (Table 6, Figures 8 and 9)show a greater bias toward unity and zero, respectively,when examined by refractive values. The objective val-ues of keratometry are more evenly and widely distrib-uted, suggesting less potential for measurement biaswhere the target value is unknown during the examina-tion process.
Examination of the display graphs of CI, IOS, andFI (Figures 10, 11, and 14 to 17) might display a trendfor more accurate correction and greater success in theregions closer to treatment on the horizontal axes. Sta-tistical analysis revealed a number of univariate outliersin the data analyzed that had the effect of lowering cor-relation between refractive and corneal groups. These 6display graphs were extremely useful in identifying thoseoutliers that required verification and correction of anyaberrant recording of corneal values, such as axis rever-sal. An example of this is seen on the displays at the 6degree meridian (patient 94) where the correction indexby refraction is 1.00 and by keratometry is 3.58. Thisinconsistency is also evident for this patient’s IOS (0.00and 2.61) and FI (1.00 and 3.50).
Benefits of MethodThis method of astigmatism analysis enables the ex-
amination of results of astigmatism treatment by bothrefractive and corneal measurements. The approach usesvector analysis, which is used in this series for examiningregular astigmatism. This can be further applied to ir-regular astigmatism by separately examining the 2 halves
Table 7. Aggregate data, analysis of vectors for treatment.
Measure Refraction KeratometrySignificance
(Spearman’s Correlation)
CI 2 geometric mean
Mean 6 SD 0.87 6 1.84 0.77 6 0.91 ,.000
Range* 0.86 to 1.06 0.76 to 0.78 (0.373)
FE (D)
Mean 6 SD 1.07 6 0.62 0.87 6 0.60 ,.000
Range* 1.06 to 1.09 0.85 to 0.88 (0.595)
FI 2 geometric mean
Mean 6 SD 0.86 6 0.41 0.72 6 0.57 ,.000
Range* [0.84 to 0.86] 0.72 to 0.74 (0.469)
CA 2 geometric mean
Mean 6 SD 1.15 6 1.54 1.30 6 1.91 ,.000
Range* 1.06 to 1.26 1.29 to 1.32 (0.371])
ORA (D)
Mean 6 SD 0.73 6 0.43—
Range* 0.72 to 0.74
D 5 diopters, SD 5 standard deviationCI 5 correction index, FE 5 flattening effect; FI 5 flattening index; CA 5 coefficient of adjustment; ORA 5 ocular residual astigmatism*95% confidence interval
ANALYZING ASTIGMATISM: ALPINS
J CATARACT REFRACT SURG—VOL 27, JANUARY 200144
of the cornea by adding a second analysis between 181and 360 degrees and displaying both together on a 360degree polar diagram as they would appear on an eye ortopography map. The method, principles, and function-ality have been explained in detail.1,2,3,5
Furthermore, a comprehensive astigmatism analysisis completed by using 3 indices: CI, IOS, and FI. Eachindex examines individual vector relationships to theTIA and provides the valuable and separate informationnecessary for understanding the clinical relevance of anyastigmatic change.
The value of statistical analysis demonstrates thesensitivity of this method of astigmatism analysis to de-tect outcome variations, as statistical significance isachieved in a high proportion of the parameters exam-ined in the 2 measurement groups. Comparing onlypostoperative resultant astigmatism values did not revealany significant differences.
Multiple eyes can be examined in a number of ways:
1. The arithmetic means of vector magnitudes can becalculated.
Figure 14. (Alpins) The IOS us-ing refractive data peripherally dis-played at the meridian of maximumablation (axis of TIA). The longestlines indicate the least successfulastigmatic outcome. Circles aloneindicate an IOS of zero.
Figure 15. (Alpins) The index ofsuccess by corneal data peripher-ally displayed at the meridian maxi-mum ablation (axis of TIA). Thelongest lines are the least success-ful. Circles alone indicate an IOS ofzero.
ANALYZING ASTIGMATISM: ALPINS
J CATARACT REFRACT SURG—VOL 27, JANUARY 2001 45
2. The arithmetic differences and ratios between SIAand TIA vector magnitudes can be compared.
3. The arithmetic differences between SIA and TIAaxes can be compared.
4. The individual and aggregate values of any 1 of the 3principal vectors determine individual and grouptrends that can be displayed on surgical vectorgraphs.
5. Calculated index values can be displayed at their me-ridia of treatment (the axis of the TIA) on vectorindex graphs to determine general trends of laser andsurgical performance.
6. Statistical analysis can be performed effectively on arith-metic values of the aggregate vectorial parameters.
The analysis performed on this data set is comprehen-sive for single and aggregate data, examining all aspectsof astigmatic change and comparing outcomes withanalogous indices for spherical change. However,for a study that examines a particular facet of astigma-tism treatment, the researcher need only select thenecessary section of this analysis method to sup-port the relevant conclusion derived from the dataset.
Figure 16. (Alpins) The FI by re-fraction displayed at the meridian ofmaximum ablation. For any 1 treat-ment, the flattening index de-creases as the treatment becomesincreasingly off axis. It equals the CIwhen the SIA is on axis and be-comes zero when the SIA is 45 de-grees off axis.
Figure 17. (Alpins) The FI bycorneal values displayed at the me-ridian of maximum ablation. Anylack of correlation between FI bykeratometry and refraction (eg, pa-tient 94 @ 6 degrees) is a usefulmeans of examining outliers requir-ing review of measurements anddata recording values.
ANALYZING ASTIGMATISM: ALPINS
J CATARACT REFRACT SURG—VOL 27, JANUARY 200146

Advantages of MethodAll vectorial calculations and summations are per-
formed using DAVDs. This mode of calculation is anessential part of the process for this method of vectoranalysis of astigmatism. Doubling the astigmatism me-ridian and vector axis values is an analytical and mathe-matical necessity that gains clinical meaning only whenhalved at the conclusion of the analysis. For this reason,all results are displayed on polar (0 to 180 degree) dia-grams. This preferable mode of display is simpler andmore clinically intuitive. A vector, such as the SIA, dis-played in this way indicates the actual meridian of theeye at which maximum ablation effect occurred and theTIA at which maximum ablation was intended.
When examining results of treatment of irregularastigmatism, the whole cornea can be examined in a 360degree display. The unnecessary complexity created bydisplaying vectors at twice their actual position couldcause greater confusion when examining irregular astig-matism outcomes as it would be necessary to display a720 degree view.
The errors and necessary adjustments gleaned from180 degree (or 360 degree) corneal analysis can be per-formed using refractive and corneal data. By examiningboth sets of data, suitable adjustments to correction canbe fed back into the laser algorithm at their correspond-ing corneal orientations to correct and refine treatmentsover time to an increasingly accurate end point. Usingadvanced planning and analysis techniques,1,4 the 2 di-agnostic modalities of corneal topography and wave-front refraction can be combined to provide a single
integrated module to refine the treatment of refrac-tive errors associated with regular and irregularastigmatism.
For incisional surgery, the FE, measured in diopters,is equivalent to the with- and against-the-wound valuesof Holladay and coauthors6 and with- and against-the-power values of Naeser and coauthors7 that have beenused extensively for the analysis of cataract incisions.The astigmatic changes of small incision cataract surgeryare relatively small, and the predominant goal for any 1incision type is constancy of effect seeking astigmaticneutrality or reduction. In this case, the FE varies withthe amount of SIA as well as the amount the incision isplaced off axis (AE).
However, in laser refractive surgery, the TIA islarger and becomes a third variable. Therefore, the FEalso varies according to the amount of astigmatism treat-ment at this intended treatment meridian. For this rea-son, the mean FE (and the 2 equivalent parameters ofHolladay and coauthors6 and Naeser and coauthors7) isless useful when examining average changes induced bymultiple refractive surgeries. Its value lies in examiningindividual patient’s outcomes, but calculating its arith-metic or aggregate mean is of limited interest. This ob-stacle can be overcome by relating the amount offlattening to the attempted change (TIA) by using theFI, which is also influenced only by 2 variables—SIAand AE—but independent of the amount of treatment.
Clinical Relevance of MethodologyEvery parameter used in this methodology has clin-
ical relevance pertinent to the treatment or outcome ofan eye after cataract or refractive surgery. These havebeen discussed comprehensively in this paper to explaintheir relevance to laser in situ keratomileusis. The effectsof incisional cataract surgery can be effectively addressedusing parameters such as AE, FE, and SIA, in addition tosimple and polar value analysis.
Manifest refraction is a subjective test that dependson observer and patient responses. These responses mayvary according to ambient conditions, such as inconsis-tencies in lighting, chart distance, or illumination. Theinadequacy of refraction as the sole measurement pa-rameter for astigmatism is accentuated by the largechanges in spherical equivalents induced by refractivesurgery, which may cause less attention than warrantedto be paid to remaining astigmatic refractive errors.
Table 8. Aggregate data, analogous spherical analysis.
Measure Refraction
S.CI 2 geometric mean
Mean 6 SD 0.89 6 1.19
Range* 0.85 to 0.91
SDiff 2 arithmetic mean (D)
Mean 6 SD 0.75 6 0.66
Range* 0.72 to 0.76
S.IOS 2 geometric mean
Mean 6 SD 0.13 6 0.04
Range* 0.13 to 0.13
S.CI 5 spherical correction index; SD 5 standard deviation; SDiff 5
spherical difference; S.IOS 5 spherical index of success*95% confidence interval
ANALYZING ASTIGMATISM: ALPINS
J CATARACT REFRACT SURG—VOL 27, JANUARY 2001 47
Trends detected through the use of conventional kera-tometry in this series, and corneal topography whenavailable, provide an objective balance to the subjectiveanalyses derived from refractive astigmatism values.When examining astigmatic outcomes, it is valuable tolook at all the modes used to measure astigmatism. Thisyields a more precise examination of the differing treat-ment trends revealed by these parameters.
The measure of intended astigmatic change is theTIA. This induced astigmatism treatment vector is com-mon to all modes of astigmatism measurement for anysingle surgical procedure. The TIA provides the neces-sary link for a valid, integrated astigmatism analysis. Inthis way, all means of measurement, keratometry, to-pography, manifest refraction, and wavefront refractioncan be used to determine success, the errors that areoccurring, and the adjustments that might be necessaryto improve future results.
The DV is a precise vectorial measure of the un-planned astigmatic change. It is a valuable measure ofabsolute success. For aggregate analysis, the summatedvector mean of the DVs can be used to examine theoverall trend for error in a patient group. The CI, IOS,and FI measure the effectiveness of astigmatism surgery;the CA can be used to refine nomograms. All these pa-rameters can be calculated using corneal or refractiveparameters to achieve parallel analyses. Analogousspherical analyses (at the corneal plane) can be per-formed using the S.CI, SDiff, and S.IOS. Inverting theS.CI provides a parameter for spherical nomogram ad-justment analogous to the CA for astigmatism.
Another advantage of the polar display used in thisastigmatism analysis method and the manner in which ithas been displayed in this paper is that it can be used forhemidivisional analysis of the entire cornea. This is nec-essary because most patients display differences in thecorneal topography values, providing 1 astigmatismvalue for each of the 2 halves before and after refractivesurgery. The manifest refraction provides only 1 refrac-tive astigmatism value applicable for both sides of thecornea; however, wavefront refraction, like corneal to-pography, can provide 2 fundamentally important val-ues and, when necessary, many more.
In all cases of corneal irregularity, vector analysis canbe applied separately to each hemidivision of the corneato examine outcomes for each of the 2 asymmetricaltreatments by corneal and refractive means. Further-
more, the irregularity of any cornea can be quantified bythe TD, a vectorial value for magnitude and axis calcu-lating the separation between the 2 opposite semimerid-ian astigmatism values.4 The changes in the TDvalue induced by surgery can also be calculated andobserved.
Refining Future Treatments Using the AnalysisCorneal analysis showed the undercorrection of
astigmatism treatment to be more evident by 30% thanthe refractive 15%. The systematic proportion of theerrors, displayed by the summated DV mean, fell be-tween 22% and 23% of the total error gauged by thearithmetic mean DV magnitude. These 2 pairs of num-bers independently suggest a nomogram adjustment tofuture treatments (TIAs) should be used by an addi-tional factor (CA). The choice of their common mid-point of 22.5% (CA 1.225) would seem appropriate forthe task until the analysis on the next group of treatedeyes is performed to incrementally refine outcomes. Thisis a useful and easily implemented alternative that, inthis series, better serves the same purpose as the vectorialadjustment using the summated DV mean dis-cussed earlier. No axis adjustment for treatment is re-quired in view of the insignificant trend of meanarithmetic AE. Improvement in axis alignment for indi-vidual cases could be achieved as shown by the meanabsolute AE.
Just as corneal values deserve emphasis when exam-ining outcomes and nomogram refinement, they shouldalso be regarded in planning. In my experience, astig-matic outcomes could be improved by reducing theremaining postoperative corneal astigmatism with-out necessarily increasing remaining refractive astigma-tism. This could be achieved by using vector planningto link the preoperative topographic measurementsinto the treatment plan with the refractive values, usingthe method of treatment optimization previously de-scribed.3,4 This inclusion of corneal values into thetreatment plan would redress the imbalance in the plan-ning process commonly practiced and used in thisseries, in which refractive values are employed exclu-sively. The immediate benefit would be less cornealastigmatism after surgery and consequently less overall(topographic plus refractive) astigmatism, as little or anyincrease in resultant refractive astigmatism is likely tooccur.
ANALYZING ASTIGMATISM: ALPINS
J CATARACT REFRACT SURG—VOL 27, JANUARY 200148
One would expect after the treatment adjustmentsand other refinements have been added to the astigma-tism treatment paradigms, the success in treating astig-matism measured by most parameters is likely toimprove and more closely parallel the higher levels ofsuccess achieved in spherical treatment outcomes. Thismay have the additional benefit of reducing the widediscrepancy in outcome scores between corneal and re-fractive values.
Studies of future treatments could confirm the con-trol of systematic treatment errors identified by thisanalysis. Subsequently, these studies could seek othermeans for improving the alignment of treatment, such aspreoperative limbal marking, using a parameter such asAE used for this study, to gauge the effectiveness of thissuggested step.
ConclusionA systematic error of undercorrection of astigma-
tism is prevalent in the treatment of these 100 eyes sothat their outcomes are less favorable than is otherwiseachievable. Other significant problems are a proportion-ate excess of corneal astigmatism remaining over refrac-tive astigmatism and a prevalent AE that appears in aCW or CCW sense, whose arithmetic mean shows noapparent trend. Astigmatic outcome parameters are lessfavorable when measured by objective corneal, than sub-
jective refractive, astigmatism values. The success ofspherical correction is greater than astigmatic correctionwhen using analogous indices for comparison.
References1. Alpins NA. A new method of analyzing vectors for changes
in astigmatism. J Cataract Refract Surg 1993; 19:524–5332. Alpins NA. Vector analysis of astigmatism changes by flat-
tening, steepening, and torque. J Cataract Refract Surg1997; 23:1503–1514
3. Alpins NA. New method of targeting vectors to treat astig-matism. J Cataract Refract Surg 1997; 23:65–75
4. Alpins NA. Treatment of irregular astigmatism. J CataractRefract Surg 1998; 24:634–646
5. Alpins NA, Tabin GC, Adams LM, et al. Refractive versuscorneal changes after PRK for astigmatism. J Refract Surg1998; 14:386–396
6. Holladay JT, Cravy TV, Koch DD. Calculating the surgi-cally induced refractive change following ocular surgery.J Cataract Refract Surg 1992; 18:429–443
7. Naeser K, Behrens JK, Naeser EV. Quantitative assess-ment of corneal astigmatic surgery: expanding the polarvalues concept. J Cataract Refract Surg 1994; 20:162–168
The author has a proprietary interest in the treatment and analysis ofastigmatism and the ASSORTt and VectrAKt computer programs.
Lorraine Adams, Dip App Sci Orth, DOBA, and George Stamatelatos,BSc Optom, provided data presentation; John B. Carragher, BEng,provided programming; Felicity Allen, PhD, provided statistics; Rita vanMunster provided word processing.
ANALYZING ASTIGMATISM: ALPINS
J CATARACT REFRACT SURG—VOL 27, JANUARY 2001 49