
Asthma Therapeutics in Major Developed Markets to 2020 ... · Markets to 2020 – Personalized...
31
THERAPY ANALYSIS Asthma Therapeutics in Major Develope d Markets to 2020 – Personalized Treatment for Severe Asthma to Drive Market Growth despite Patent Expirations Report Code: GBIHC357MR Published: February 2015
Transcript of Asthma Therapeutics in Major Developed Markets to 2020 ... · Markets to 2020 – Personalized...
THERAPY ANALYSIS
Asthma Therapeutics in Major Developed Markets to 2020 – Personalized Treatment for
Severe Asthma to Drive Market Growth despite Patent Expirations
Report Code: GBIHC357MR Published: February 2015
© GBI Research. This is a licensed product and is not to be photocopied
GBIHC357MR / Published FEB 2015 Page 2
GBI Research Report Guidance
Chapter two provides an introduction to asthma, including discussions on disease epidemiology, etiology, pathophysiology, symptoms, diagnosis and treatment. Clinical data for drugs featured in the current treatment algorithm are discussed in detail.
Chapter three provides a comparative analysis of the asthma marketed products landscape. The chapter includes product profiles for the main asthma therapeutics, as well as heat maps comparing safety and efficacy clinical data for these drugs.
Chapter four analyses the asthma pipeline. The chapter includes a breakdown of pipeline molecules by phase of development, molecule type, molecular target and novelty. An analysis of asthma clinical trials by failure rates, duration and size is also provided. The chapter concludes with product profiles and heat maps analyzing some of the most promising asthma pipeline molecules in development.
Chapter five presents forecast projections to 2020 for the eight major markets (US, UK, France, Germany, Italy, Spain, Japan and Canada). Trends in treatment usage patterns, annual therapy costs, and market size are discussed for each of the major markets.
Chapter six analyzes trends in strategic consolidations relating to asthma products. Some of the major co-development and licensing deals are discussed in detail.
© GBI Research. This is a licensed product and is not to be photocopied
GBIHC357MR / Published FEB 2015 Page 3
Executive Summary
New Market Entrants and Rising Prevalence to Help Maintain Marginal Growth
The asthma therapeutics market is forecast to grow marginally over the forecast period across the top eight developed nations, from $XX billion in 2013 to a projected value of $XX billion by 2020 at a Compound Annual Growth Rate (CAGR) of XX%. This is in spite of generic erosion facing the leading brands, and is a consequence of new market entrants and disease prevalence that continues to rise, albeit not at rates as high as have been seen historically.
Some new, costly asthma therapies could be set to enter the asthma therapeutics market, including multiple monoclonal antibodies. These include mepolizumab, reslizumab, lebrikizumab and dupilumab being developed by GlaxoSmithKline (GSK), Teva, Roche and Regeneron in collaboration with Sanofi, respectively. These new products will help to diminish the impact of increased generic competition, which has affected the asthma therapeutics market in recent years and will continue to do so over the forecast period.
The prevalence of asthma in the assessed countries is a prominent contributor towards the size of the market. It is thought that prevalence increased significantly in the 1980s and during the early 1990s in many western nations (Eder et al., 2006). In more recent years, there is continued evidence of growing asthma prevalence (Verlato et al., 2003; Gershon et al., 2010), but evidence has also begun to emerge that suggests prevalence has stabilized (von Hertzen et al., 2005; Eder et al., 2006). Prevalence is therefore forecast to rise steadily across all eight nations, most notably in the UK and US.
Leading Asthma Brands Face Generic Competition
Over the forecast period, the asthma therapeutics market will be strongly characterized by the loss of patent protection for several leading brands: Advair (fluticasone propionate/salmeterol xinafoate), Singulair (montelukast sodium), Symbicort (budesonide/formoterol fumarate) and Xolair (omalizumab).
The patent protecting Singulair expired in 2012, with the Food and Drug Administration (FDA) subsequently granting approval to several drug makers to market generic versions of the drug. Among these companies were Teva, Sandoz and Mylan. As a consequence, sales revenue for Singulair has declined substantially in recent years. The consequences of patent expiration for Advair and Symbicort are less clear due to the difficulty that generic manufacturers experience when attempting to produce an equivalent of the combined active ingredients and inhaler delivery device in Inhaled Corticosteroid/Long-Acting Beta Agonist (ICS/LABA) combination drugs. Despite patent expirations in several of the major markets in recent years, neither Advair nor Symbicort has suffered from substantial generic erosion, as Singulair has. However, it is expected that their market share will eventually fall during the forecast period, following the belated arrival of generic alternatives. The market will be hit by further patent expirations, namely Xolair, mid-to-late forecast period, leaving this highly expensive biologic drug vulnerable to competition from emerging biosimilars.
Biologics Gain Prominence in the Treatment of Asthma
A greater understanding of the cellular and molecular biology underlying asthma has led researchers to believe that biologics targeting pro-inflammatory cytokines and other inflammatory mediators may be of therapeutic benefit (Pelaia et al., 2012).
This is reflected in the asthma pipeline, XX% of which comprises biologics. In particular, monoclonal antibodies seem to be generating a significant degree of interest. The most notable late-stage monoclonal antibodies include mepolizumab, reslizumab, lebrikizumab and dupilumab, which target Interleukins (IL), or IL receptors, and have shown promise in severe forms of eosinophilic asthma, and therefore represent a shift towards personalized therapy within asthma.
These new developments could change the landscape of the asthma market, most notably concerning severe forms of the disease, which are poorly controlled by regular treatment. Although such therapy may only play the role of an alternative treatment in the asthma treatment algorithm, the ability to reduce exacerbation rates holds strong clinical and commercial value. Patients who experience exacerbations often require hospitalization, and therefore place a heavy burden on healthcare services. Any drug that reduces that burden will hold a high value.
© GBI Research. This is a licensed product and is not to be photocopied
GBIHC357MR / Published FEB 2015 Page 4
As novel biologics with the potential to improve disease control and quality of life in the most severe, inadequately controlled forms of asthma, with an associated reduction in the burden of disease on healthcare services, these biologics are expected to be highly priced. Although they are expected to be used in only a minority of patients, the high cost of these drugs will generate considerable market revenue, offsetting the impact of generic erosion for several of the leading asthma brands over the forecast period.

© GBI Research. This is a licensed product and is not to be photocopied
GBIHC357MR / Published FEB 2015 Page 5
1 Table of Contents
1 Table of Contents .............................................................................................................................................5 1.1 List of Tables ......................................................................................................................................... 7 1.2 List of Figures ........................................................................................................................................8
2 Introduction ...................................................................................................................................................... 10 2.1 Disease Introduction .......................................................................................................................... 10 2.2 Epidemiology ...................................................................................................................................... 10 2.3 Etiology.................................................................................................................................................. 11 2.4 Pathophysiology ................................................................................................................................. 12 2.5 Symptoms ............................................................................................................................................ 12 2.6 Diagnosis ............................................................................................................................................. 12 2.7 Assessment of Disease Severity ..................................................................................................... 13 2.8 Treatment ............................................................................................................................................ 15 2.9 Treatment Algorithm .......................................................................................................................... 16 2.10 Treatment Segments ........................................................................................................................ 20
2.10.1 ICS Monotherapy for the Maintenance Treatment of Asthma ......................................... 20 2.10.2 Singulair (montelukast sodium) as First-Line Maintenance Therapy .............................. 22 2.10.3 ICS/LABA Combination Therapy ........................................................................................... 23 2.10.4 Add-on Therapies ..................................................................................................................... 29
3 Marketed Products ........................................................................................................................................ 35 3.1 Overview ............................................................................................................................................. 35 3.2 ICS for the Maintenance Treatment of Asthma ........................................................................... 35
3.2.1 Arnuity (fluticasone furoate) – GSK ....................................................................................... 35 3.3 ICS/LABA Combination Therapy for the Maintenance Treatment of Asthma ....................... 36
3.3.1 Advair (fluticasone propionate and salmeterol xinafoate) – GSK ................................... 36 3.3.2 Symbicort (budesonide and formoterol fumarate) – AstraZeneca, Co-Promotion with
Astellas Pharma .........................................................................................................................37 3.3.3 Dulera (mometasone furoate and formoterol fumarate) – Merck ................................... 38 3.3.4 Relvar/Breo (vilanterol trifenatate and fluticasone furoate) –
GlaxoSmithKline/Theravance ................................................................................................. 39 3.4 Add-on Therapy to ICS or ICS/LABA Therapies for the Maintenance Treatment of Asthma
.............................................................................................................................................................. 40 3.4.1 Xolair (omalizumab) – Novartis and Genentech ................................................................. 40 3.4.2 Singulair (montelukast) – Merck ............................................................................................. 41 3.4.3 Spiriva (tiotropium bromide) – Boehringer Ingelheim ....................................................... 42
3.5 Heat Maps for Marketed Products ................................................................................................. 44 4 Asthma Pipeline ............................................................................................................................................. 46
4.1 Overview ............................................................................................................................................. 46 4.2 Pipeline Analysis by Stage of Development, Molecule Type and Program Type ................ 46 4.3 Pipeline Analysis by Molecular Target .......................................................................................... 48 4.4 Asthma Clinical Trial Landscape .................................................................................................... 55
4.4.1 Clinical Trial Failure Rates ....................................................................................................... 55 4.4.2 Clinical Trial Duration ............................................................................................................... 60 4.4.3 Clinical Trial Size ....................................................................................................................... 64 4.4.4 Comparative Clinical Trial Metrics Analysis .......................................................................... 71
4.5 Promising Pipeline Molecules ..........................................................................................................73 4.5.1 Mepolizumab – GSK .................................................................................................................73 4.5.2 Reslizumab – Teva Pharmaceutical ...................................................................................... 75 4.5.3 Lebrikizumab – Roche/Genentech ........................................................................................ 77 4.5.4 Dupilumab – Regeneron Pharmaceuticals in Collaboration with Sanofi ....................... 79 4.5.5 Masitinib – AB Science ............................................................................................................. 81
4.6 Heat Map and Competitor Matrix for Pipeline Products ............................................................ 83
© GBI Research. This is a licensed product and is not to be photocopied
GBIHC357MR / Published FEB 2015 Page 6
5 Market Forecast to 2020 ............................................................................................................................. 87 5.1 Geographical Markets ...................................................................................................................... 87 5.2 Global Market ..................................................................................................................................... 88 5.3 North America ..................................................................................................................................... 91
5.3.1 Treatment Usage Patterns ....................................................................................................... 91 5.3.2 Annual Cost of Therapy ........................................................................................................... 93 5.3.3 Market Size ................................................................................................................................ 95
5.4 Top Five Countries of Europe ......................................................................................................... 96 5.4.1 Treatment Usage Patterns ...................................................................................................... 96 5.4.2 Annual Cost of Therapy ........................................................................................................... 98 5.4.3 Market Size .............................................................................................................................. 100
5.5 Japan ................................................................................................................................................... 101 5.5.1 Treatment Usage Patterns ...................................................................................................... 101 5.5.2 Annual Cost of Therapy ........................................................................................................... 101 5.5.3 Market Size ...............................................................................................................................102
5.6 Drivers and Barriers for the Asthma Market................................................................................ 103 5.6.1 Drivers ........................................................................................................................................ 103 5.6.2 Barriers ...................................................................................................................................... 103
6 Strategic Consolidations .............................................................................................................................105 6.1 Co-development Deals ...................................................................................................................105
6.1.1 Sepracor Enters into Co-Development Agreement with Nycomed for Ciclesonide.. 110 6.1.2 NeoStem Enters into Agreement with University of California to Develop Human
Regulatory T Cells .................................................................................................................... 110 6.1.3 Amgen Enters into Co-Development Agreement with AstraZeneca for Five
Monoclonal Antibodies ............................................................................................................. 111 6.2 Licensing Deals .................................................................................................................................. 111
6.2.1 Amgen Enters into Licensing Agreement with Kyowa Hakko Kirin – Terminated .... 118 6.2.2 Mundipharma Enters into Licensing Agreement with SkyePharma ............................. 119 6.2.3 MAP Pharmaceuticals Enters into Licensing Agreement with AstraZeneca –
Terminated ................................................................................................................................. 119 6.2.4 Orexo Enters into Licensing Agreement with Janssen Pharmaceuticals – Terminated
...................................................................................................................................................... 119 6.2.5 Aslan Pharma Enters into Licensing Agreement with CSL for CSL-334 .......................120
7 Appendix ......................................................................................................................................................... 121 7.1 All Pipeline Drugs by Phase of Development .............................................................................. 121
7.1.1 Discovery.................................................................................................................................... 121 7.1.2 Preclinical .................................................................................................................................. 122 7.1.3 Phase I ....................................................................................................................................... 123 7.1.4 Phase II ...................................................................................................................................... 124 7.1.5 Phase III ..................................................................................................................................... 125 7.1.6 Pre-registration......................................................................................................................... 125
7.2 Market Forecasts to 2020 .............................................................................................................. 126 7.2.1 Global ......................................................................................................................................... 126 7.2.2 US ............................................................................................................................................... 126 7.2.3 Canada ...................................................................................................................................... 126 7.2.4 UK ............................................................................................................................................... 127 7.2.5 France ........................................................................................................................................ 127 7.2.6 Germany .................................................................................................................................... 127 7.2.7 Italy ............................................................................................................................................. 128 7.2.8 Spain .......................................................................................................................................... 128 7.2.9 Japan.......................................................................................................................................... 128
7.3 References ........................................................................................................................................ 129
© GBI Research. This is a licensed product and is not to be photocopied
GBIHC357MR / Published FEB 2015 Page 7
7.4 Abbreviations .................................................................................................................................... 135 7.5 Research Methodology ................................................................................................................... 136
7.5.1 Secondary Research ............................................................................................................... 136 7.5.2 Marketed Product Profiles ..................................................................................................... 137 7.5.3 Late-Stage Pipeline Candidates ........................................................................................... 137 7.5.4 Comparative Efficacy and Safety Heat Map for Marketed and Pipeline Products...... 137 7.5.5 Product Competitiveness Framework ................................................................................. 137 7.5.6 Pipeline Analysis ...................................................................................................................... 138 7.5.7 Forecasting Model ................................................................................................................... 139 7.5.8 Deals Data Analysis................................................................................................................. 140
7.6 Expert Panel Validation ................................................................................................................... 140 7.7 Contact Us ......................................................................................................................................... 140 7.8 Disclaimer .......................................................................................................................................... 140
1.1 List of Tables
Table 1: Asthma Therapeutics Market, Global, Classification of Asthma Severity in Children of 0–4 Years of Age .........................................................................................................................13
Table 2: Asthma Therapeutics Market, Global, Classification of Asthma Severity in Children of 5–11 Years of Age .........................................................................................................................14
Table 3: Asthma Therapeutics Market, Global, Classification of Asthma Severity in Youths ≥ 12 Years of Age and Adults .......................................................................................................15
Table 4: Management of Chronic Asthma ..........................................................................................17 Table 5: Management of Acute Asthma .............................................................................................19 Table 6: Asthma Clinical Trial Endpoints ............................................................................................20 Table 7: Asthma Therapeutics, Global, All Pipeline Products, Discovery Phase, 2015 ................... 121 Table 8: Asthma Therapeutics, Global, All Pipeline Products, Preclinical Phase, 2015 .................. 122 Table 9: Asthma Therapeutics, Global, All Pipeline Products, Phase I, 2015 .................................. 123 Table 10: Asthma Therapeutics, Global, All Pipeline Products, Phase II, 2015 ................................. 124 Table 11: Asthma Therapeutics, Global, All Pipeline Products, Phase III, 2015 ................................ 125 Table 12: Asthma Therapeutics, Global, All Pipeline Products, Pre-registration Phase, 2015 .......... 125 Table 13: Asthma Therapeutics Market, Global, Market Forecast, 2013–2020 ................................ 126 Table 14: Asthma Therapeutics Market, US, Market Forecast, 2013–2020 ..................................... 126 Table 15: Asthma Therapeutics Market, Canada, Market Forecast, 2013–2020 .............................. 126 Table 16: Asthma Therapeutics Market, UK, Market Forecast, 2013–2020 ..................................... 127 Table 17: Asthma Therapeutics Market, France, Market Forecast, 2013–2020 ............................... 127 Table 18: Asthma Therapeutics Market, Germany, Market Forecast, 2013–2020 ........................... 127 Table 19: Asthma Therapeutics Market, Italy, Market Forecast, 2013–2020 .................................... 128 Table 20: Asthma Therapeutics Market, Spain, Market Forecast, 2013–2020 ................................. 128 Table 21: Asthma Therapeutics Market, Japan, Market Forecast, 2013–2020 ................................ 128
© GBI Research. This is a licensed product and is not to be photocopied
GBIHC357MR / Published FEB 2015 Page 8
1.2 List of Figures
Figure 1: Asthma Therapeutics Market, Global, Heat Map for Marketed Products, 2015 ..................44 Figure 2: Asthma Therapeutics Market, Global, Heat Map for Marketed Products (continued), 2015
...............................................................................................................................................44 Figure 3: Asthma Therapeutics Market, Global, Pipeline, 2015 ..........................................................47 Figure 4: Asthma Therapeutics Market, Global, Pipeline by Molecular Target, 2015 ........................50 Figure 5: Asthma Therapeutics Market, Global, Pipeline by Molecular Target, Breakdown of
Immune/Inflammatory System Targets and Cytokine/Cytokine Receptor Targets, 2015 ...51 Figure 6: Asthma Therapeutics Market, Global, Pipeline by Molecular Target, Breakdown of Enzyme
and Kinase Molecular Targets, 2015 ....................................................................................53 Figure 7: Asthma Therapeutics Market, Global, Pipeline by Molecular Target, Breakdown of
Adrenergic and Cholinergic Receptors, 2015 ......................................................................54 Figure 8: Asthma Therapeutics Market, Global, Clinical Trial Failure Rate, 2006–2014 ....................56 Figure 9: Asthma Therapeutics Market, Global, Clinical Trial Failure Rate by Molecule Type, 2006–
2014 .......................................................................................................................................57 Figure 10: Asthma Therapeutics Market, Global, Clinical Trial Failure Rate by Molecular Target,
2006–2014 ...........................................................................................................................59 Figure 11: Asthma Therapeutics Market, Global, Clinical Trial Duration by Stage of Development and
Molecule Type, (months), 2006–2014..................................................................................61 Figure 12: Asthma Therapeutics Market, Global, Phase I Clinical Trial Duration by Molecular Target
(months), 2006–2014 ............................................................................................................62 Figure 13: Asthma Therapeutics Market, Global, Phase II Clinical Trial Duration by Molecular Target
(months), 2006–2014 ............................................................................................................63 Figure 14: Asthma Therapeutics Market, Global, Phase III Clinical Trial Duration by Molecular Target
(months), 2006–2014 ............................................................................................................64 Figure 15: Asthma Therapeutics Market, Global, Clinical Trial Recruitment Size by Stage of
Development and Molecule Type for Individual Asthma Products (participants), 2006–2014 .......................................................................................................................................65
Figure 16: Asthma Therapeutics Market, Global, Clinical Trial Recruitment Size by Stage of Development and Molecule Type for Individual Asthma Clinical Trials (participants), 2006–2014 ...........................................................................................................................67
Figure 17: Asthma Therapeutics Market, Global, Phase I Clinical Trial Recruitment Size by Molecular Target (participants), 2006–2014 .........................................................................................69
Figure 18: Asthma Therapeutics Market, Global, Phase II Clinical Trial Recruitment Size by Molecular Target (participants), 2006–2014 .........................................................................................70
Figure 19: Asthma Therapeutics Market, Global, Phase III Clinical Trial Recruitment Size by Molecular Target (participants), 2006–2014 .........................................................................................71
Figure 20: Asthma Therapeutics Market, Global, Failure Rate (%), Average Clinical Trial Duration (months) and Average Recruitment Size for Asthma by Molecule Type, 2006–2014 ........72
Figure 21: Asthma Therapeutics Market, Global Failure Rate (%), Average Clinical Trial Duration (months) and Average Trial Recruitment Size (participants) for Asthma by Molecular Target, 2006–2014 ...............................................................................................................72
Figure 22: Asthma Therapeutics Market, Global, Mepolizumab Forecast ($bn), 2015–2020..............75 Figure 23: Asthma Therapeutics Market, Global, Reslizumab Forecast ($bn), 2016–2020 .................77 Figure 24: Asthma Therapeutics Market, Global, Lebrikizumab Forecast ($m), 2018–2020 ...............78 Figure 25: Asthma Therapeutics Market, Global, Dupilumab Forecast ($m), 2018–2020 ...................81 Figure 26: Asthma Therapeutics Market, Global, Masitinib Forecast ($m), 2017–2020.......................83 Figure 27: Asthma Therapeutics Market, Global, Heat Map for Pipeline Products, 2015 ....................84 Figure 28: Asthma Therapeutics Market, Global, Competitor Matrix for Marketed and Pipeline
Products, 2015 ......................................................................................................................85 Figure 29: Asthma Therapeutics Market, Global, Treatment Patterns, 2013–2020 .............................89 Figure 30: Asthma Therapeutics Market, Global, Market Size ($bn), 2013–2020 ................................90 Figure 31: Asthma Therapeutics Market, North America, Treatment Patterns, 2013–2020 ................92 Figure 32: Asthma Therapeutics Market, North America, Annual Cost of Therapy ($), 2013–2020 ....94 Figure 33: Asthma Therapeutics Market, North America, Market Size, 2013–2020 ............................96 Figure 34: Asthma Therapeutics Market, Top Five EU Countries, Treatment Patterns, 2013–2020 ...97
© GBI Research. This is a licensed product and is not to be photocopied
GBIHC357MR / Published FEB 2015 Page 9
Figure 35: Asthma Therapeutics Market, Top Five EU Countries, Annual Cost of Therapy ($), 2013–2020......................................................................................................................................99
Figure 36: Asthma Therapeutics Market, Top Five EU Countries, Market Size, 2013–2020 ............. 100 Figure 37: Asthma Therapeutics Market, Japan, Treatment Patterns, 2013–2020............................ 101 Figure 38: Asthma Therapeutics Market, Japan, Annual Cost of Therapy ($), 2013–2020 ............... 102 Figure 39: Asthma Therapeutics Market, Japan, Market Size ($bn), 2013–2020 .............................. 102 Figure 40: Asthma Therapeutics Market, Global, Co-Development Deals by Region, 2006–2014 .. 106 Figure 41: Asthma Therapeutics Market, Global, Co-Development Deals by Value ($m), 2006–2014
............................................................................................................................................. 106 Figure 42: Asthma Therapeutics Market, Global, Number of Disclosed and Undisclosed Co-
Development Deals by Year, Aggregate Deal Value ($m) and Aggregate Upfront Value ($m), 2006–2014................................................................................................................. 107
Figure 43: Asthma Therapeutics Market, Global, Co-Development Deals by Stage of Development, Deal Value ($m) and Upfront Payment Value ($m), 2006–2014 ....................................... 108
Figure 44: Asthma Therapeutics Market, Global, Co-Development Deals by Molecule Type, Stage of Development and Aggregate Deal Value ($m), 2006–2014 ............................................. 109
Figure 45: Asthma Therapeutics Market, Global, Co-Development Deals by Molecular Target and Aggregate Deal Value ($m), 2006–2014 ........................................................................... 110
Figure 46: Asthma Therapeutics Market, Global, Licensing Deals by Region, 2006–2014 ............... 112 Figure 47: Asthma Therapeutics Market, Global, Licensing Deals by Value ($m), 2006–2014 ......... 113 Figure 48: Asthma Therapeutics Market, Global, Number of Disclosed and Undisclosed Licensing
Deals by Year, Aggregate Deal Value ($m) and Aggregate Upfront Value ($m), 2006–2014 ..................................................................................................................................... 113
Figure 49: Asthma Therapeutics Market, Global, Licensing Deals by Stage of Development, Deal Value ($m) and Upfront Payment Value ($m), 2006–2014 ................................................ 115
Figure 50: Asthma Therapeutics Market, Global, Licensing Deals by Molecule Type, Stage of Development and Aggregate Deal Value ($m), 2006–2014 ............................................. 117
Figure 51: Asthma Therapeutics Market, Global, Licensing Deals by Molecular Target and Aggregate Deal Value ($m), 2006–2014.............................................................................................. 118
© GBI Research. This is a licensed product and is not to be photocopied
GBIHC357MR / Published FEB 2015 Page 10
2 Introduction
2.1 Disease Introduction
Asthma is a common chronic inflammatory disease of the airways. It is characterized by recurrent attacks of breathlessness and wheezing, which vary in frequency and severity from patient to patient. The World Health Organization (WHO) estimates that 235 million people suffer from the disease, which is thought to be the most common chronic condition among children (WHO, 2011).
Variable degrees of airflow obstruction, bronchial hyper-responsiveness and underlying inflammation determine the severity of the disease in each patient. The exact nature of the underlying inflammation reflects different aspects of the disease, such as persistent or intermittent, and chronic or acute symptoms (NHLBI, 2007). Various types of inflammatory cells and other cellular elements mediate disease progression and the inflammatory response that underlies asthma. These may include mast cells, neutrophils, eosinophils, lymphocytes and macrophages.
The goal of current treatment regimens is to maintain asthma control by preventing symptoms, maintain normal pulmonary function, and improve quality of life. It is also important to reduce the risk of asthma exacerbations, which place a substantial burden on patients, their families and healthcare services
The mainstay of asthma long-term therapy is corticosteroids. In the long-term treatment of asthma, Inhaled Corticosteroids (ICS) are the treatment of choice. Oral systemic corticosteroids are also used, either in short courses to gain control of uncontrolled disease or in the long-term treatment of severe persistent asthma. Corticosteroids are known to inhibit the production of pro-inflammatory cytokines.
Another form of medicine commonly prescribed for asthma is Long-Acting Beta Agonists (LABA). These include drugs such as salmeterol and formoterol, which are prescribed in combination with ICSs for the long-term therapy of asthma to control and prevent symptoms in moderate or severe persistent asthma. Indeed, fixed-dose combinations of LABAs and ICSs, that is, two Active Pharmaceutical Ingredients (API) delivered via a single inhaler, including the brands Advair (fluticasone propionate and salmeterol xinafoate) and Symbicort (budesonide and formoterol fumarate), which are the leading brands in the asthma market.
Quick-relief medication includes Short-Acting Beta Agonists (SABA), anticholinergics and systemic corticosteroids. SABAs are the primary option when trying to relieve acute asthma symptoms, and include drugs such as albuterol. Like anticholinergics, they are bronchodilators.
Other long-term treatments include immunomodulators such as omalizumab, an anti-Immunoglobulin E (IgE) monoclonal antibody, used as adjunctive therapy for patients aged 12 and over who have severe persistent asthma.
This market landscape, which has seen incremental developments over past decades, looks set to witness significant diversification in terms of therapeutic options over coming years. Pipeline analysis has confirmed a strong degree of first-in-class innovation throughout the pipeline, and notably, in Phase III development. This innovation aligns with the growing understanding of disease pathophysiology, particularly relating to severe forms of the disease, which is now increasingly seen as being heterogeneous, with different disease sub-types, characterized by varying underlying disease markers. For instance, featuring prominently in late-stage development are biologics targeting Interleukin (IL) components of the inflammatory process in patients with severe, uncontrolled asthma with elevated eosinophil infiltration. Not only are these all first-in-class products, they also represent attempts to treat specific phenotypes of the disease, which currently have poor treatment options.
2.2 Epidemiology
The global prevalence of asthma is significant, and believed to affect approximately 300 million people worldwide. This is a burden predicted to increase over future decades, reaching 400 million by 2025 (Masoli et al., 2004). Asthma is the most common chronic disease among children and young adults (To et al., 2012). The high global prevalence of asthma contributes substantially towards healthcare costs and is a major cause of morbidity.
Asthma is a common chronic inflammatory disease of the airways… characterized by recurrent attacks of breathlessness and wheezing.
© GBI Research. This is a licensed product and is not to be photocopied
GBIHC357MR / Published FEB 2015 Page 13
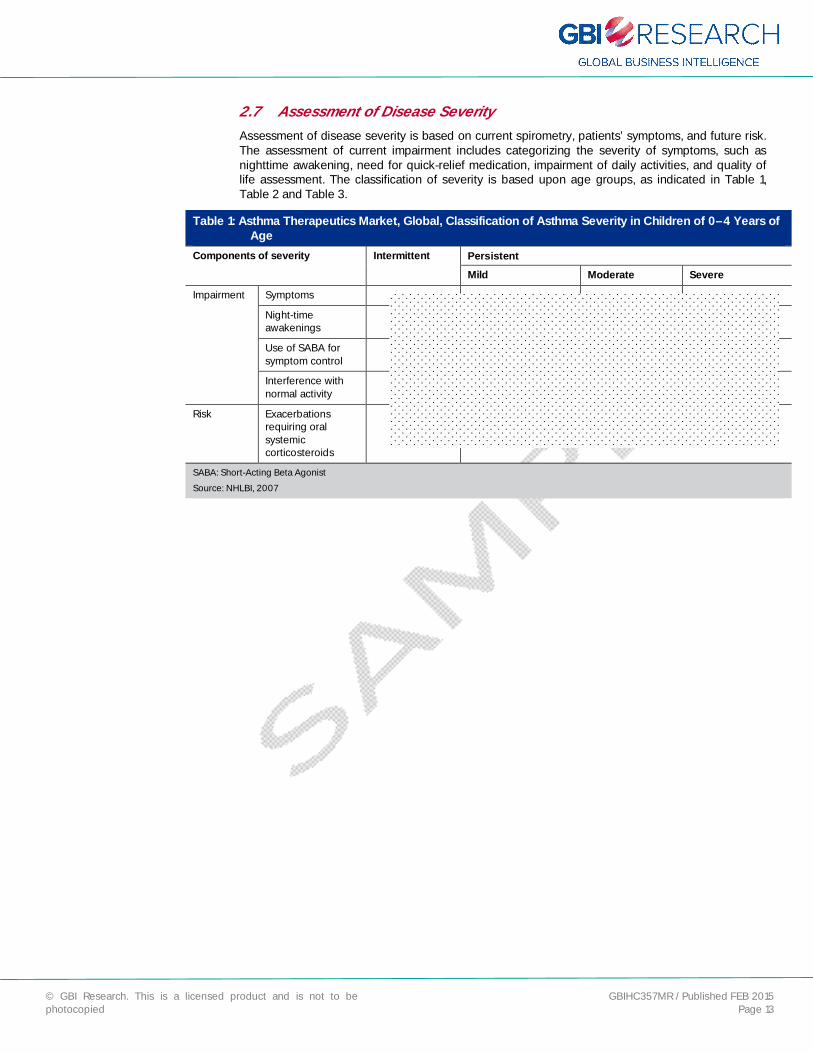
2.7 Assessment of Disease Severity
Assessment of disease severity is based on current spirometry, patients’ symptoms, and future risk. The assessment of current impairment includes categorizing the severity of symptoms, such as nighttime awakening, need for quick-relief medication, impairment of daily activities, and quality of life assessment. The classification of severity is based upon age groups, as indicated in Table 1, Table 2 and Table 3.
Table 1: Asthma Therapeutics Market, Global, Classification of Asthma Severity in Children of 0–4 Years of Age
Components of severity Intermittent Persistent Mild Moderate Severe
Impairment Symptoms
Night-time awakenings
Use of SABA for symptom control
Interference with normal activity
Risk Exacerbations requiring oral systemic corticosteroids
SABA: Short-Acting Beta Agonist
Source: NHLBI, 2007
© GBI Research. This is a licensed product and is not to be photocopied
GBIHC357MR / Published FEB 2015 Page 46
4 Asthma Pipeline
4.1 Overview
The goal of current asthma treatment is to control the symptoms related to the disease and provide rapid relief during exacerbations on an as-needed basis (GINA, 2012). ICS, the cornerstone of asthma treatment, decreases airway hyper-responsiveness, improve lung function, reduce the frequency of exacerbations, and provide overall control of asthma symptoms (Woodcock et al., 2011). Symptoms may also be controlled with inhaled beta 2 agonists in combination with ICS and leukotriene modifiers. Relief during periods of exacerbation is achieved via the use of SABA bronchodilators (GINA, 2012).
However, despite a wide variety of treatment options and guidelines, asthma symptoms sometimes prove difficult to control for patients (Rabe et al., 2004). Much of this difficulty has been associated with complicated, multiple-daily-dose treatment regimens, which result in poor patient adherence (Kandane-Rathnayake et al., 2009). Many of the currently prescribed asthma therapies, such as Flovent (fluticasone propionate) and Qvar (beclomethasone dipropionate), require twice-daily dosing.
In addition to poor adherence to treatment regimens, there is strong evidence that the use of systemic and inhaled glucocorticoids has little benefit in some asthma patients with severe forms of the disease. In such cases, there is a need for alternative anti-asthmatic, anti-inflammatory therapies to control symptoms.
The unmet needs associated with asthma, coupled with a rising global prevalence, have resulted in strong industry interest. The current pipeline therefore consists of strong products, many of which target unmet needs in asthma management, from companies such as Merck, GSK, Novartis and Roche.
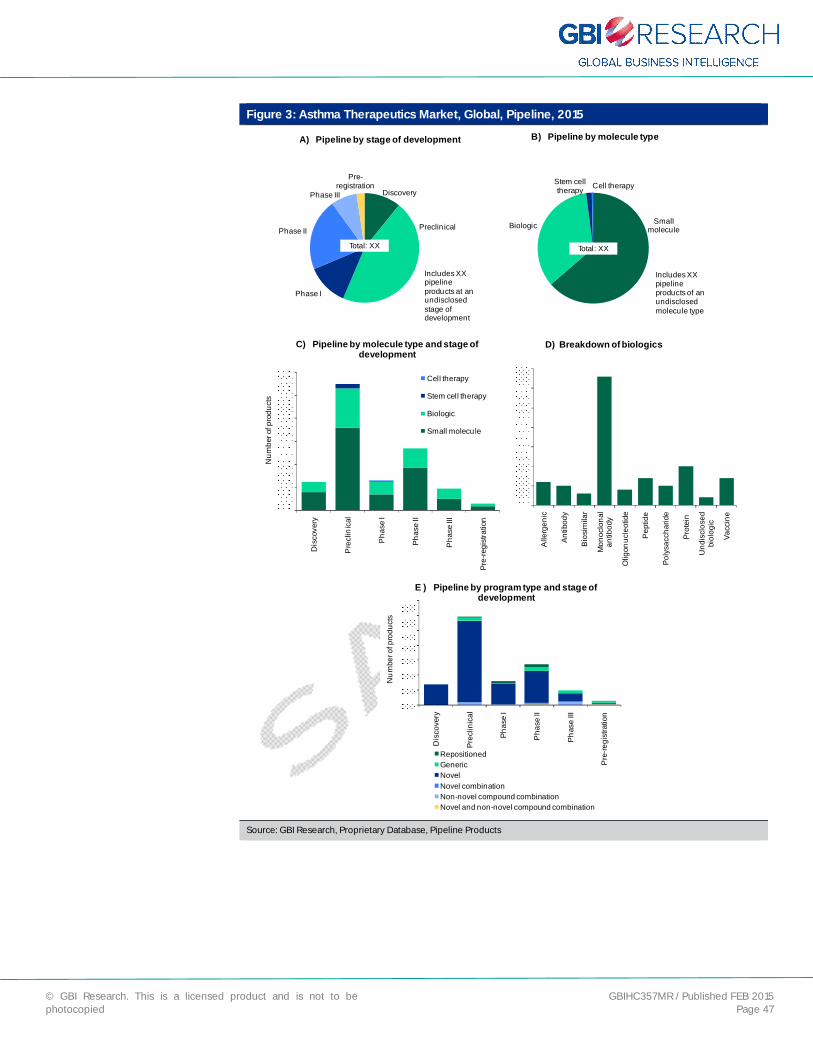
GBI Research analysis confirmed that the asthma pipeline currently consists of XX products in active development. A large proportion of these are in Preclinical development, although there is a strong presence of Phase II molecules, which is indicative of an active pipeline.
4.2 Pipeline Analysis by Stage of Development, Molecule Type and Program Type
The asthma pipeline is relatively large with XX products in active development. As shown in Figure 3A, over half of these products are in the early stages of development: XX (XX%) molecules are at the discovery stage, while XX (XX%) molecules are in the Preclinical stage. There are XX (XX%) molecules in Phase I, XX (XX%) molecules in Phase II and XX (XX%) molecules in Phase III. Additionally, XX (XX%) molecules are at the pre-registration stage of development. Late-stage drug development is highly active, with products in Phase II, Phase III and the pre-registration phase together comprising XX% of the pipeline.
The unmet needs associated with asthma, coupled with a rising global prevalence, have resulted in strong industry interest.
© GBI Research. This is a licensed product and is not to be photocopied
GBIHC357MR / Published FEB 2015 Page 47
Figure 3: Asthma Therapeutics Market, Global, Pipeline, 2015
Discovery
Preclin ical
Phase I
Phase II
Phase III
Pre-registration
A) Pipeline by stage of development
Total: XX
Includes XX pipeline products at an undisclosedstage of development
Small moleculeBiologic
Stem cell therapy Cell therapy
B) Pipeline by molecule type
Total: XX
Includes XX pipeline products of an undisclosedmolecule type
Dis
cove
ry
Pre
clin
ical
Pha
se I
Phas
e II
Pha
se III
Pre-
regi
stra
tion
Num
ber o
f pro
duct
s
C) Pipeline by molecule type and stage of development
Cell therapy
Stem cell therapy
Biologic
Small molecule
Alle
rgen
ic
Antib
ody
Bio
sim
ilar
Mon
oclo
nal
antib
ody
Olig
onuc
leot
ide
Pep
tide
Poly
sacc
harid
e
Prot
ein
Und
iscl
osed
bi
olog
ic
Vacc
ine
D) Breakdown of biologics
Dis
cove
ry
Prec
linic
al
Phas
e I
Pha
se II
Phas
e III
Pre
-regi
stra
tion
Num
ber o
f pro
duct
s
E ) Pipeline by program type and stage of development
RepositionedGenericNovelNovel combination Non-novel compound combinationNovel and non-novel compound combination
Source: GBI Research, Proprietary Database, Pipeline Products
© GBI Research. This is a licensed product and is not to be photocopied
GBIHC357MR / Published FEB 2015 Page 55
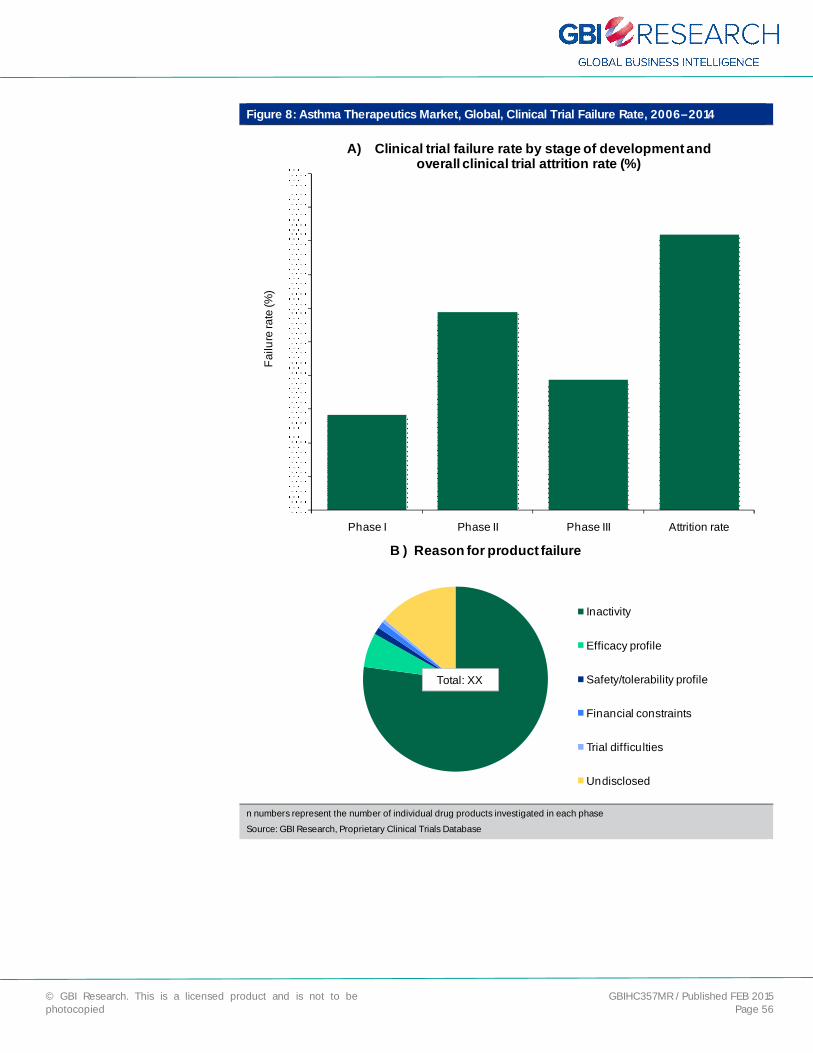
4.4 Asthma Clinical Trial Landscape
The following section discusses key trends in the asthma clinical trial landscape, including clinical trial failure rates, clinical trial duration and clinical trial size, over the 2006–2014 period. Such trends can provide revealing insights into the viability and the associated risk of developing products in the asthma indication and therefore represent important considerations for drug developers.
4.4.1 Clinical Trial Failure Rates
As shown in Figure 8, the failure rates for asthma drug candidates investigated in clinical trials between 2006 and 2014 were XX% in Phase I, XX% in Phase II and XX% in Phase III. The overall attrition rate was XX%, which indicates that asthma drug development is associated with a considerable risk. By comparison, GBI Research analysis conducted for the Chronic Obstructive Pulmonary Disease (COPD) Market to 2019 (GBIHC299MR) report identified that the drug development within COPD is associated with a much lower risk despite similarities in disease pathophysiology and molecular targets. Failure rates of XX%, XX% and XX% were confirmed for Phases I, II and III, respectively, in COPD, with an overall attrition rate of XX%. The considerably higher failure rates observed for the asthma indication may reflect greater innovation within the asthma pipeline, which is associated with higher risk.
Of the XX asthma products that failed, XX (XX%) were identified as being inactive. That is, over a prolonged period, the drug being investigated had not progressed to the next stage of development with no further disclosure and information by the respective companies. Only XX (XX%) products failed due to inadequate efficacy profiles, and only XX (XX%) failed due to inadequate safety and tolerability profiles, which suggests that asthma drugs were well characterized in terms of safety and efficacy prior to investigation in clinical trials. Additionally, XX (XX%) products failed due to financial constraints, XX (XX%) product failed due to trial difficulties, and a further XX (XX%) did not disclose a reason for failure.
© GBI Research. This is a licensed product and is not to be photocopied
GBIHC357MR / Published FEB 2015 Page 56
Figure 8: Asthma Therapeutics Market, Global, Clinical Trial Failure Rate, 2006–2014
Phase I Phase II Phase III Attrition rate
Failu
re ra
te (%
)
A) Clinical trial failure rate by stage of development and overall clinical trial attrition rate (%)
B ) Reason for product failure
Inactivity
Efficacy profile
Safety/tolerability profile
Financial constraints
Trial difficulties
Undisclosed
Total: XX
n numbers represent the number of individual drug products investigated in each phase
Source: GBI Research, Proprietary Clinical Trials Database

© GBI Research. This is a licensed product and is not to be photocopied
GBIHC357MR / Published FEB 2015 Page 90
Figure 30: Asthma Therapeutics Market, Global, Market Size ($bn), 2013–2020
2013 2014 2015 2016 2017 2018 2019 2020
Mar
ket s
ize
($bn
)
Low variance Medium variance High variance Projected
Projected CAGR: XX%Peak CAGR: XX%Low CAGR: XX%
Source: GBI Research, Database
The asthma market across the eight largest developed markets is forecast to grow from $XX billion in 2013 to $XX billion in 2020, at a CAGR of XX%. Growth will be hampered by loss of patent protection over the forecast period. The patent protecting Singulair expired in 2012, with the FDA subsequently granting approval to several drug makers to market generic versions of the drug. Among these companies were Teva, Sandoz and Mylan. As a consequence, sales revenues for Singulair have declined substantially in recent years. The consequences of patent expiration for Advair and Symbicort are less clear, due to the difficulties generic drug makers face when attempting to bring generic ICS/LABA fixed-dose combination treatments to market. Despite patent expirations in recent years, neither Advair nor Symbicort has suffered from substantial generic erosion, as Singulair has. However, it is expected that their market share will eventually fall during the forecast period, following the belated arrival of generic alternatives. The market will be hit by further patent expirations, namely that of SABA/SAMA Combivent (ipratropium bromide/albuterol) in 2015, Xolair in 2017 and Spiriva in 2018.
The impact of patent loss will be offset, however, by the approval of new drugs, notably, the IL-targeting monoclonal antibodies mepolizumab, reslizumab, lebrikizumab and dupilumab, over the forecast period. As novel biologics that address important unmet needs in severe inadequately controlled asthma characterized by high levels of eosinophils, and therefore offering personalized therapy, these drugs are likely to hold high market value and will contribute to market growth, despite limited usage in a minority of patients.
© GBI Research. This is a licensed product and is not to be photocopied
GBIHC357MR / Published FEB 2015 Page 121
7 Appendix
7.1 All Pipeline Drugs by Phase of Development
7.1.1 Discovery
Table 7: Asthma Therapeutics, Global, All Pipeline Products, Discovery Phase, 2015
Product name Company Molecule type Molecular Target
Source: GBI Research

© GBI Research. This is a licensed product and is not to be photocopied
GBIHC357MR / Published FEB 2015 Page 122
7.1.2 Preclinical
Table 8: Asthma Therapeutics, Global, All Pipeline Products, Preclinical Phase, 2015
Product name Company Molecule type Molecular target
Source: GBI Research

© GBI Research. This is a licensed product and is not to be photocopied
GBIHC357MR / Published FEB 2015 Page 123
7.1.3 Phase I
Table 9: Asthma Therapeutics, Global, All Pipeline Products, Phase I, 2015
Product name Company Molecule Type Molecular target
Source: GBI Research
© GBI Research. This is a licensed product and is not to be photocopied
GBIHC357MR / Published FEB 2015 Page 124
7.1.4 Phase II
Table 10: Asthma Therapeutics, Global, All Pipeline Products, Phase II, 2015
Product name Company Molecule type Molecular target
Source: GBI Research
© GBI Research. This is a licensed product and is not to be photocopied
GBIHC357MR / Published FEB 2015 Page 125
7.1.5 Phase III
Table 11: Asthma Therapeutics, Global, All Pipeline Products, Phase III, 2015
Product name Company Molecule type Molecular target
Source: GBI Research
7.1.6 Pre-registration
Table 12: Asthma Therapeutics, Global, All Pipeline Products, Pre-registration Phase, 2015 Product name Company Molecule type Molecular target
Source: GBI Research
© GBI Research. This is a licensed product and is not to be photocopied
GBIHC357MR / Published FEB 2015 Page 126
7.2 Market Forecasts to 2020
7.2.1 Global
Table 13: Asthma Therapeutics Market, Global, Market Forecast, 2013–2020 2013 2014 2015 2016 2017 2018 2019 2020
Prevalence population (million)
Diagnosed population (million)
Treatment population (million)
Projected market size ($bn)
Maximum market size ($bn)
Minimum market size ($bn)
Source: GBI Research
7.2.2 US
Table 14: Asthma Therapeutics Market, US, Market Forecast, 2013–2020 2013 2014 2015 2016 2017 2018 2019 2020
Prevalence population (million)
Diagnosed population (million)
Treatment population (million)
Projected ACoT ($)
Maximum ACoT ($)
Minimum ACoT ($)
Projected market size ($bn)
Maximum market size ($bn)
Minimum market size ($bn)
Source: GBI Research
7.2.3 Canada
Table 15: Asthma Therapeutics Market, Canada, Market Forecast, 2013–2020 2013 2014 2015 2016 2017 2018 2019 2020
Prevalence population (million)
Diagnosed population (million)
Treatment population (million)
Projected ACoT ($)
Maximum ACoT ($)
Minimum ACoT ($)
Projected market size ($m)
Maximum market size ($m)
Minimum market size ($m)
Source: GBI Research

© GBI Research. This is a licensed product and is not to be photocopied
GBIHC357MR / Published FEB 2015 Page 127
7.2.4 UK
Table 16: Asthma Therapeutics Market, UK, Market Forecast, 2013–2020 2013 2014 2015 2016 2017 2018 2019 2020
Prevalence population (million)
Diagnosed population (million)
Treatment population (million)
Projected ACoT ($)
Maximum ACoT ($)
Minimum ACoT ($)
Projected market size ($bn)
Maximum market size ($bn)
Minimum market size ($bn)
Source: GBI Research
7.2.5 France
Table 17: Asthma Therapeutics Market, France, Market Forecast, 2013–2020 2013 2014 2015 2016 2017 2018 2019 2020
Prevalence population (million)
Diagnosed population (million)
Treatment population (million)
Projected ACoT ($)
Maximum ACoT ($)
Minimum ACoT ($)
Projected market size ($m)
Maximum market size ($m)
Minimum market size ($m)
Source: GBI Research
7.2.6 Germany
Table 18: Asthma Therapeutics Market, Germany, Market Forecast, 2013–2020 2013 2014 2015 2016 2017 2018 2019 2020
Prevalence population (million)
Diagnosed population (million)
Treatment population (million)
Projected ACoT ($)
Maximum ACoT ($)
Minimum ACoT ($)
Projected market size ($bn)
Maximum market size ($bn)
Minimum market size ($bn)
Source: GBI Research
© GBI Research. This is a licensed product and is not to be photocopied
GBIHC357MR / Published FEB 2015 Page 128
7.2.7 Italy
Table 19: Asthma Therapeutics Market, Italy, Market Forecast, 2013–2020 2013 2014 2015 2016 2017 2018 2019 2020
Prevalence population (million)
Diagnosed population (million)
Treatment population (million)
Projected ACoT ($)
Maximum ACoT ($)
Minimum ACoT ($)
Projected market size ($m)
Maximum market size ($m)
Minimum market size ($m)
Source: GBI Research
7.2.8 Spain
Table 20: Asthma Therapeutics Market, Spain, Market Forecast, 2013–2020
2013 2014 2015 2016 2017 2018 2019 2020
Prevalence population (million)
Diagnosed population (million)
Treatment population (million)
Projected ACoT ($)
Maximum ACoT ($)
Minimum ACoT ($)
Projected market size ($m)
Maximum market size ($m)
Minimum market size ($m)
Source: GBI Research
7.2.9 Japan
Table 21: Asthma Therapeutics Market, Japan, Market Forecast, 2013–2020 2013 2014 2015 2016 2017 2018 2019 2020
Prevalence population (million)
Diagnosed population (million)
Treatment population (million)
Projected ACoT ($)
Maximum ACoT ($)
Minimum ACoT ($)
Projected market size ($bn)
Maximum market size ($bn)
Minimum market size ($bn)
Source: GBI Research

© GBI Research. This is a licensed product and is not to be photocopied
GBIHC357MR / Published FEB 2015 Page 129
7.3 References
Aerocrine (2013). Annual report. Aerocrine. Available from: http://www.aerocrine.com/Global/pdf/AGM/2014/Aerocrine%20in%20words.pdf
American Lung association (2012). Trends in Asthma Morbidity and Mortality. American Lung Association. Available from: http://www.lung.org/finding-cures/our-research/trend-reports/asthma-trend-report.pdf
Anderson GP (2010). Prospects for an asthma vaccine. Respirology; 15: 902–908
Aubier M, et al. (1999). Salmeterol/fluticasone propionate (50/500 mcg) in combination on a Diskus inhaler (Seretide) is effective and safe in the treatment of steroid dependent asthma. Respiratory Medicine; 93: 876–884
Barnes PJ, et al. (2003). How Do Corticosteroids Work in Asthma? Annals of Internal Medicine; 139: 359–370
Beeh K, et al. (2014). Tiotropium Respimat in asthma: a double-blind, randomised, dose-ranging study in adult patients with moderate asthma. Respiratory Research; 15: 61
Bel EH, et al. (2014). Oral Glucocorticoid-Sparing Effect of Mepolizumab in Eosinophilic Asthma. The New England Journal of Medicine; 371: 1189–1197
Berggren R, et al. (2012). Outlook for the next 5 years in drug innovation. Nature Reviews Drug Discovery; 11: 435–436
Bernstein DI, et al. (2011). Efficacy and onset of action of mometasone furoate/formoterol and fluticasone propionate/salmeterol combination treatment in subjects with persistent asthma. Allergy, Asthma and Clinical Immunology; 7: 21
BNF (2012) British National Formulary. BNF 64. BNF Publications Management.
Bourdin A, et al. (2009). Allergic rhinitis and asthma: united disease through epithelial cells. Thorax; 64: 999–1004
Buist AS (2003). Similarities and differences between asthma and chronic obstructive pulmonary disease: treatment and early outcomes. European Respiratory Journal; 20: 30–35
Busse W, et al. (2001). Omalizumab, anti-IgE recombinant humanized monoclonal antibody, for the treatment of severe allergic asthma. Allergy and Clinical Immunology; 108: 184–190
Castro M, et al. (2011). Reslizumab for poorly controlled, eosinophilic asthma. A randomized, placebo–controlled study. American Thoracic Society; 184: 1125–1132
CDC (2012). National Surveillance of Asthma: United States, 2001–2010. Centers for Disease Control and Prevention. Available from: http://www.cdc.gov/nchs/data/series/sr_03/sr03_035.pdf
CIA (2013). The World Factbook. Japan. Central Intelligence Agency. Available from: https://www.cia.gov/library/publications/the-world-factbook/geos/ja.html [Accessed on July 4, 2013].
Corren J, et al. (2011). Lebrikizumab treatment in adults with asthma. The New England Journal of Medicine; 365: 1088–1098
Dahl R, et al. (2006). EXCEL: A randomised trial comparing salmeterol/fluticasone propionate and formoterol/budesonide combinations in adults with persistent asthma. Respiratory Medicine; 100: 1152–1162
Demoly P, et al. (2009). Prevalence of asthma control among adults in France, Germany, Italy, Spain and the UK. European Respiratory Review; 18: 105–112
Desai D, et al. (2011). Can inhaled corticosteroids prevent asthma exacerbations? Current Opinion in Pulmonary Medicine; 17: 16–22
© GBI Research. This is a licensed product and is not to be photocopied
GBIHC357MR / Published FEB 2015 Page 135
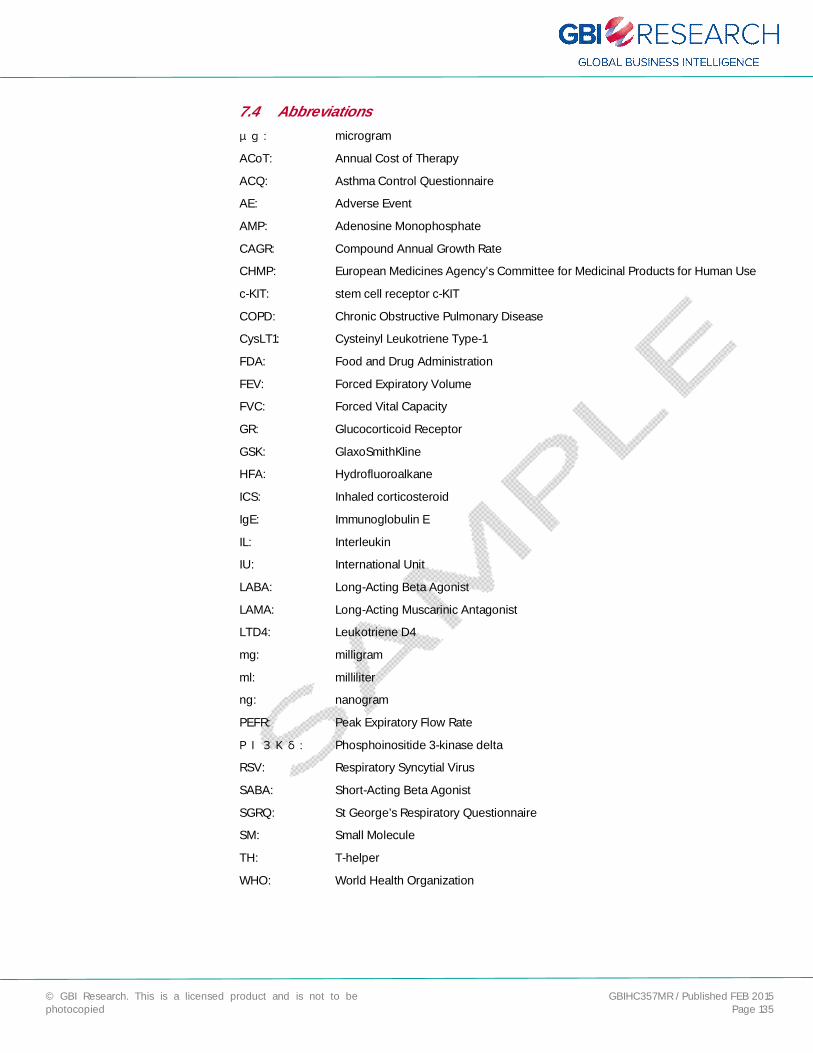
7.4 Abbreviations
µg: microgram
ACoT: Annual Cost of Therapy
ACQ: Asthma Control Questionnaire
AE: Adverse Event
AMP: Adenosine Monophosphate
CAGR: Compound Annual Growth Rate
CHMP: European Medicines Agency’s Committee for Medicinal Products for Human Use
c-KIT: stem cell receptor c-KIT
COPD: Chronic Obstructive Pulmonary Disease
CysLT1: Cysteinyl Leukotriene Type-1
FDA: Food and Drug Administration
FEV: Forced Expiratory Volume
FVC: Forced Vital Capacity
GR: Glucocorticoid Receptor
GSK: GlaxoSmithKline
HFA: Hydrofluoroalkane
ICS: Inhaled corticosteroid
IgE: Immunoglobulin E
IL: Interleukin
IU: International Unit
LABA: Long-Acting Beta Agonist
LAMA: Long-Acting Muscarinic Antagonist
LTD4: Leukotriene D4
mg: milligram
ml: milliliter
ng: nanogram
PEFR: Peak Expiratory Flow Rate
PI3Kδ: Phosphoinositide 3-kinase delta
RSV: Respiratory Syncytial Virus
SABA: Short-Acting Beta Agonist
SGRQ: St George’s Respiratory Questionnaire
SM: Small Molecule
TH: T-helper
WHO: World Health Organization
© GBI Research. This is a licensed product and is not to be photocopied
GBIHC357MR / Published FEB 2015 Page 136
7.5 Research Methodology
GBI Research aims to help clients within the life sciences industries to better understand their business environment, compete successfully within it, and achieve growth.
Our goal is to be the business intelligence partner of choice for companies in the life sciences arena that are looking for meaningful, innovative and evidence-based analysis to inform their key decision-making.
Our coverage extends to the major indications across all therapy areas with a particular focus on oncology, CNS and immunology and a weighting towards indications demonstrating significant innovation in early-stage development. Our complex proprietary data methodologies drive our specialisms in indications with clearly established therapeutic landscapes, significant pipeline activity and a high proportion of approved products with market exclusivity.
Everything we do at GBI Research is rooted in extensive data validation, interrogation and analysis. Our R&A teams are constantly looking for ways to evolve our products in order to provide ever more understanding and transparency around what is really happening in the market.
There are a number of key themes running through all of our product offerings that serve to define our proposition and position in a crowded market:
Data integrity:
GBI Research has full access to comprehensive, market-leading proprietary databases covering marketed and pipeline products, clinical trials, and licensing and co-development deals. In addition to the daily database updates made by that specific team, GBI Research validates all data used in research reports, ensuring an exceptionally high degree of data accuracy.
Data are refreshed immediately prior to publication to ensure the final report reflects any changes that took place during the authoring effort.
Innovative and meaningful analytical techniques and frameworks:
GBI Research recognizes the value of highly accurate raw data, but this is simply the platform.
The entire proposition is built around understanding clients’ needs related to business intelligence, and the ambition to develop novel proprietary data interrogation methodologies to extract meaningful and innovative data sets and provide insightful analyses.
Evidence based analysis and insight:
Proprietary data interrogation methodologies are applied to provide visibility over such vital and tangible data parameters as clinical trial attrition rates versus industry averages, clinical trial endpoint design, product competitiveness benchmarking and multi-scenario forecasting.
7.5.1 Secondary Research
The research process begins with extensive secondary research utilizing proprietary databases and external sources, including qualitative and quantitative information relating to each market.
The secondary research sources that are typically referred to include, but are not limited to:
Company websites, annual reports, financial reports, broker reports, investor presentations and US Securities and Exchanges Commission (SEC) filings
Industry trade journals, scientific journals and other technical literature
Internal and external databases
Relevant patent and regulatory databases
National government documents, statistical databases and market reports
© GBI Research. This is a licensed product and is not to be photocopied
GBIHC357MR / Published FEB 2015 Page 137
Procedure registries
News articles, press releases and web-casts specific to the companies operating in the market
7.5.2 Marketed Product Profiles
The marketed products section provides an overview of the market landscape and gives qualitative profiles of the leading marketed therapies. These profiles describe molecule type, mechanism of action, companies involved in development and marketing, overall clinical and commercial strength, and future prospects. Emphasis is placed on analyzing efficacy and safety data in order to comparatively determine the strongest products available for treatment and assess the clinical and commercial positioning in the current market. In addition, our marketed product profiles assess the clinical and commercial threats and opportunities in the context of late-stage pipeline products in order to provide an evidence-based outlook and perspective for product performance during the forecast period.
Where available, historical revenue data are also provided.
7.5.3 Late-Stage Pipeline Candidates
This section consists of qualitative profiles of drugs in the late stages of the developmental pipeline. The focus here is predominantly on Phase III drugs and, depending on clinical and commercial potential, Phase II drugs.
The profiles cover areas including, but not limited to, a drug’s molecule type and mechanism of action, companies involved in its development, performance in clinical trials specifically relating to efficacy and safety endpoints, and overall clinical and commercial potential. Typically, a revenue forecast for the drug candidate in the covered indication is also provided. This includes peak, medium and low-variance ranges throughout the forecast period, which take into consideration variable factors with a high degree of inherent unpredictability such as marketing approval of pipeline products, clinical uptake and potential competition, drug price inflation rates and many more.
7.5.4 Comparative Efficacy and Safety Heat Map for Marketed and Pipeline Products
The comparative efficacy and safety heat map provides a visual representation of the comparative clinical profile of each marketed product based on available clinical trial data. GBI Research aims to aggregate and integrate all available clinical trial efficacy and safety data, organized by the respective endpoints into heat maps to assist in direct performance benchmarking of each drug.
The heat map uses conditional formatting to color-code the performance of each marketed drug from strongest to weakest. This is applied to each clinical trial endpoint, allowing us to determine the strongest performer in each endpoint category. A dark blue color indicates the strongest performers in that category, whereas light gray colors indicate weaker performers.
7.5.5 Product Competitiveness Framework
The product competitiveness frameworks translate the clinical trial data in heat maps into performance benchmarks that express the comparative efficacy and safety performance as a ratio. The safety and efficacy data by endpoint are aggregated and compared to the strongest marketed product in each parameter. The baseline, as defined by the strongest marketed product on each endpoint, is defined as 1. The performance of all other marketed and pipeline products is expressed as a comparative ratio in comparison to the strongest performing product on that endpoint. Dark blue values indicate strong performers in that category and lighter gray values indicate weaker performers. This includes qualitative assessment of product features that offer meaningful differentiation from competitor’s products, such as route of administration and dosage/administration frequency. Overall, this type of analysis helps to determine the potential impact of a specific new drug on the market, as well as the future competitive landscape.
© GBI Research. This is a licensed product and is not to be photocopied
GBIHC357MR / Published FEB 2015 Page 138
7.5.6 Pipeline Analysis
7.5.6.1 Overall Pipeline
This section analyzes proprietary pipeline data and provides a thorough overview of the current pipeline landscape for the indication in question. Using proprietary data analysis techniques, the pipeline is broken down by stage of development, molecule type, mechanism of action and/or molecular target. Each of these categories is subject to further granulation depending on the level of data available and any observed trends or findings. It is broken down by program type to determine the degree of novelty within the pipeline. Each drug development program is defined as being novel, generic or repositioned using methodologies and processes and drawing upon multiple databases, including market and pipeline datasets. Repositioned drugs are defined as those that are already marketed for another indication and that are now in development for the indication being assessed. Novel products are defined as containing active pharmaceutical ingredients that are currently not approved in the market, whereas generic products include approved compounds that are no longer under patent. The accuracy of the data is validated using external sources such as company websites.
Like all sections within the report, the data analysis provides the basis for in-depth written discussion, which determines the broader implications of the results obtained.
7.5.6.2 Clinical Trials
The clinical trial landscape for each indication is comprehensively profiled using proprietary clinical trial data. The factors assessed include, but are not limited to, clinical trial failure rate, size and duration and endpoint analysis. Each is analyzed by clinical stage of development.
7.5.6.2.1 Failure Rate
Failure rate analysis helps to determine the risk profile associated with drug development for the indication in question. The failure rate is defined as the percentage of products that fail to progress to the next stage of clinical development or reach marketing approval, as in the case for products in Phase III. Inactive development programs are defined as those for which no progress has been made and for which no further updates have been disclosed for over four years.
This analysis is typically subject to further granulation, such as failure rate by Phase, mechanism of action and molecule type, to provide further insight into the risks associated with the development of certain classes of drugs and product technology.
7.5.6.2.2 Clinical Trial Size
Clinical trial size assesses the mean and median subject recruitment size of clinical trials by Phase and compares the respective indications against the wider therapy area or industry benchmarks. This is commonly analyzed further by molecule type and mechanism of action.
7.5.6.2.3 Clinical Trial Duration
Like clinical trial size, clinical trial duration analyzed and disclosed the mean and median duration (in months) of clinical trials by Phase and molecule type/mechanism of action.
7.5.6.2.4 Clinical trial Endpoint Analysis
A clinical trial endpoint is a measure from which a decision can be made to accept or reject the null hypothesis. The primary and secondary endpoints used in clinical trials can be used to provide insight into the patient outcomes driving drug development.
The analysis is designed to extract the primary and secondary outcome measures used across all clinical trials in the indication, whether different safety, efficacy or pharmacokinetic endpoints. These data are then graphically presented to display the most prominent primary and secondary endpoints.
Trends in primary and secondary endpoints are assessed by Phase of development and, when possible, over a specified timeframe to identify any changing patterns in clinical trial design.
© GBI Research. This is a licensed product and is not to be photocopied
GBIHC357MR / Published FEB 2015 Page 139
7.5.7 Forecasting Model
This GBI Research report covers the following major developed markets: the US; Canada; the top five countries in Europe: the UK, Germany, France, Spain, Italy; and Japan. The total market size for each country is provided, which is the sum value of the market sizes of all the indications for that particular country.
Our forecasting model uses an epidemiology-based approach, in which sales for each product are calculated based on the cost of the drug, and the number of patients using it.
Initially, based on peer-reviewed literature, the disease prevalence is calculated and extrapolated with historic trends and any other relevant inputs gathered from the literature. In the same way, the proportion of prevalent patients that are diagnosed and the proportion of diagnosed patients that are ultimately treated are also calculated.
If relevant, the treatment population is then divided into segments using any available inputs from scientific literature. For example, in oncology indications it is common for us to divide the patient population based on the stage of disease. Each drug may appear in more than one segment within this model and, if used as part of a combination of products, revenues are calculated on single product levels across all segments and combinations.
The use of each drug within each segment (as a percentage) is estimated as accurately as possible, primarily using treatment guidelines, primary research and any other relevant peer-reviewed data inputs for each indication. The market penetration of pipeline products in their first few years after approval is estimated based primarily on published clinical trial data, with the safety and efficacy profiles of each pipeline drug being compared against any other competitors in their patient segment(s).
Pipeline products that are expected to fulfill an unmet need and perform better than marketed products are typically given higher distributions than those that are not. While efficacy and safety data are usually the most important criteria for making these estimates, other characteristics such as the route of administration and dosing convenience are weighted more strongly in relevant indications.
The cost of each drug is estimated based on its cost per gram (cost of one unit divided by the size of each unit in grams) and the number of grams taken by each patient in a single year (or a course of therapy). For the purposes of this model, different formulations for a single drug with different dosages (for example, a pediatric and adult formulation) are treated as separate entities.
For pipeline drugs, the cost is estimated based on a benchmark of existing marketed products (typically within the indication). Based on their ability to fulfill unmet needs and compete effectively with marketed products, a percentage markup (or occasionally a markdown) versus its benchmark is assigned. This benchmark may be an individual product (such as a direct competitor) or an average of existing products.
The cost is adjusted to take into account inflation of pharmaceutical products and any estimated effects of patent expiries (with biologics having a slower and weaker price erosion than small molecules following patent expiry). Finally, based on percentage distributions, a weighted average cost of each drug is estimated for all patients treated for the disease. This can then be multiplied by the treatment population to arrive at a sales estimate for that drug, and the total sales of all drugs is then the overall market size.
From this primary forecast, peak and low market sizes and drug sales are estimated based on potential variations and uncertainties in price inflation, patent expiry, distribution shifts, pipeline product market penetration, and drug pricing for pipeline products. Inherently unpredictable events such as policy changes are not modeled directly in the scenarios, but are accounted for in the numeric inputs. These multiple scenarios aim to supplement the primary forecast with an accurate, transparent picture of the inherent uncertainty of the future market, and the likely range of outcomes.

© GBI Research. This is a licensed product and is not to be photocopied
GBIHC357MR / Published FEB 2015 Page 140
7.5.8 Deals Data Analysis
This section includes analysis of GBI Research proprietary strategic deals data relevant to the indication being assessed. The two major deal types analyzed are co-development deals and licensing deals.
When analyzing co-development and licensing deals data, the parameters assessed are often consistent, although there can be some variation depending on data availability. Firstly, deals are analyzed by country, value and year.
Analysis by country includes the use of network charts, which visually represent links between different nations to visualize where companies involved in deals are headquartered and to identify deal hubs.
The deals data are analyzed further to display the number of deals by stage of development, molecule type and mechanism of action. Qualitative analysis of the major deals within the indication is also provided.
7.6 Expert Panel Validation
GBI Research uses a panel of experts to cross verify its databases and forecasts.
GBI Research expert panel comprises marketing managers, product specialists, and international sales managers from pharmaceutical companies, academics from research universities and key opinion leaders from hospitals.
Historical data and forecasts are relayed to GBI Research’s expert panel for feedback and are adjusted in accordance with their feedback.
7.8 Disclaimer
All Rights Reserved.
No part of this publication may be reproduced, stored in a retrieval system or transmitted in any form by any means, electronic, mechanical, photocopying, recording or otherwise, without the prior permission of the publisher, GBI Research.