Asthma in Maricopa County - ASU College of Health … in Maricopa County ... John V. de Guzman,...
39
Asthma in Maricopa County A Report to the Maricopa County Community from Arizona HealthQuery a Community—University Partnership By Center for Health Information & Research A Division of the Seidman Research Institute School of Health Management and Policy Arizona HealthQuery is sponsored by St. Luke’s Health Initiatives and Arizona State University Revised April 2006 Mary E. Rimsza, MD, FAAP Research Professor Amy Bartels, MPH Senior Research Analyst Wade Bannister, MS Data Analytics Manager
Transcript of Asthma in Maricopa County - ASU College of Health … in Maricopa County ... John V. de Guzman,...
Asthma in Maricopa County A Report to the Maricopa County Community from
Arizona HealthQuery
a Community—University Partnership
By
Center for Health Information & Research
A Division of the Seidman Research Institute
School of Health Management and Policy
Arizona HealthQuery is sponsored by
St. Luke’s Health Initiatives and Arizona State University
Revised April 2006
Mary E. Rimsza, MD, FAAP
Research Professor
Amy Bartels, MPH
Senior Research Analyst
Wade Bannister, MS
Data Analytics Manager

{ }
William G. Johnson, PhD. {[email protected]} is a Professor of Economics in SHMP and the Department of Econom-ics at Arizona State University, and the Director of CHIR. He is an Affiliate Professor in the Biomedical Informatics Department of the Ira A. Fulton School of Engineering at Arizona State University. His previous appointments include the economics department at Rutgers University and The Maxwell School of Syracuse University, with affili-ate appointments at the medical schools of Rutgers University, the State University of New York, and the University of Arizona.
Mary Rimsza, MD, FAAP, FSAM. {[email protected]} is Co-Director and Research Professor of CHIR. Currently the Chair of Arizona’s Child Fatality Review Program, Dr. Rimsza previously served as Chair of the Department of Pediatrics at Maricopa Integrated Health System, CEO of MedPro, and Director of Hea lth at ASU. Board-certified in both Pediatric and Adolescent Medicine, Dr. Rimsza is also a Professor of Pediatrics at Mayo Graduate School of Medicine and the University of Arizona College of Medicine. In addition to being Editor of the Pediatric Review and Education Program for the Ameri-can Academy of Pediatrics, she has produced numerous publications on adolescent medicine and collaborates on research projects in pediatric populations in Maricopa and Yuma Counties.
The Center for Health Information & Research
480 965 0122
480 965 5208
Arizona State UniversityPost Office Box 874011Tempe, Arizona 85287–4011
660 South Mill AvenueSuite 312Tempe, Arizona 85281
is a division of the L. William Seidman Research Institute and the School of Health Management and Policy {SHMP} in Arizona State University’s W. P. Carey School of Business. CHIR is a multi-disciplinary team whose focus includes health care, the health care workforce, occupational ill-ness and injury, medical malpractice, health care economics, disability, and clinical quality. CHIR is home of Arizona HealthQuery, a community health data system created by the voluntary par-ticipation of health care insurers and providers in Arizona.

3
Community Partners
AZHQ is made possible by the cooperation of the following members of the Maricopa County community:
Abrazo Health Care Beverly Weber, Senior VP, Operations Deanna Wise, Chief Information Officer
Advanced Urgent Care Renee Biskupski, VP of Operations
Advantage Urgent Care Center Bill Edwards, General Manager
Arizona Association of Community Health Centers(list of centers on following page)
Joseph Coatsworth, CEO
Arizona Department of Health Services Susan Gerard, Director Richard Porter, Bureau Chief
Arizona Health Care Cost Containment System Anthony D. Rodgers, Director Christine Goldberg, Strategic Planning Admin
Banner Health System John Hensing, Senior VP Twila Burdick, System Director
Chandler Regional Hospital Phill Westbrooks, Director of Education
Health Services Advisory Group Herb Rigberg, Chief Executive Officer
Internal Medicine Bruce Bethancourt, Physician John V. de Guzman, Physician Nolawi Mengesha, Physician
Jesse Owens Urgent Care Carlene Danis, CEO and Practice Admin.
John C. Lincoln Health Network Dan Coleman, CEO Rob Israel, Chief Information Officer
Maricopa Integrated Health System Betsy Bayless, CEO
St. Joseph’s Hospital and Medical Center Linda Hunt, President Dennis Laraway, Chief Financial Officer
Scottsdale Healthcare Wendy Lyons, Vice President
Society of Saint Vincent de Paul Janice Ertl, Director, Free Clinic
Sun Health Corporation Lee Peterson, President and CEO Keith Dines, Exec. VP of Strategic Development
ValueOptions of Arizona Angelo Edge, Chief Administrative Officer

4
Arizona Association of Community Health Centers Members
Canyonlands Community Health Care Sarah Allen, CEO
Chiricahua Community Health Centers, Inc. Jennifer Ryan, CEO
Clinica Adelante, Inc. Linda Gorey, CEO
Community Health Center of West Yavapai Peggy Nies, Director
Copper Queen Medical Associates* James Dickson, CEO
Desert Senita Community Health Center Fatima McCasland, CEO
El Rio Community Health Center Kathy Byrne, Executive Director
John C. Lincoln Community Health Center* Eric Santiago, Director
Marana Health Center, Inc* Clarence Vatne, Executive Director
Morenci Healthcare Center John Roach, Executive Director
Mountain Park Health Center Sylvia Stock, President and CEO
Native American Community Health Center, Inc.* Marc Harrison, CEO
North Country Community Health Center Ann Roggenbuck, CEO
St. Elizabeth of Hungary Clinic Nancy Metzger, Executive Director
Sun Life Family Health Center, Inc. Al Gugenberger, CEO
Sunset Community Health Center* David Rogers, Executive Director
United Community Health Center, Inc. Laurie Jurs, Executive Director
* Contracts pending

5
Executive Summary Asthma is a chronic disease affecting both children and adults. The disease is a significant health burden
in the United States; in the past two decades, asthma has been increasing in prevalence and severity.
Some of the largest increases have been seen in urban areas [1, 2]. In 2002, data from the National
Health Interview Survey indicates approximately 20 million Americans currently have asthma [3]. From
1980 to 1999, office visits in the United States (U.S.) for asthma increased from 5.9 million to 10.8 million
per year1 and from 1992 to 1999, the number of emergency department (ED) visits for asthma increased
36% [4].
The information on asthma in Maricopa County presented in this report is generated from the Arizona
HealthQuery (AZHQ), the U.S. Census Bureau and the Centers for Disease Control and Prevention’s
(CDC) Behavioral Risk Factor Surveillance System (BRFSS). The information includes morbidity and
mortality for asthma with analyses by gender, race/ethnicity and age. This report also presents data for a
longitudinal cohort of people who received care for asthma in Maricopa County in 2001, 2002 and 2003.
According to Arizona HealthQuery data, the majority of Maricopa County people seeking health care for
asthma in 2003 were insured by public sources, including both Arizona Health Care Cost Containment
System (AHCCCS) and Medicare. Approximately 9% of people with asthma were uninsured at some time
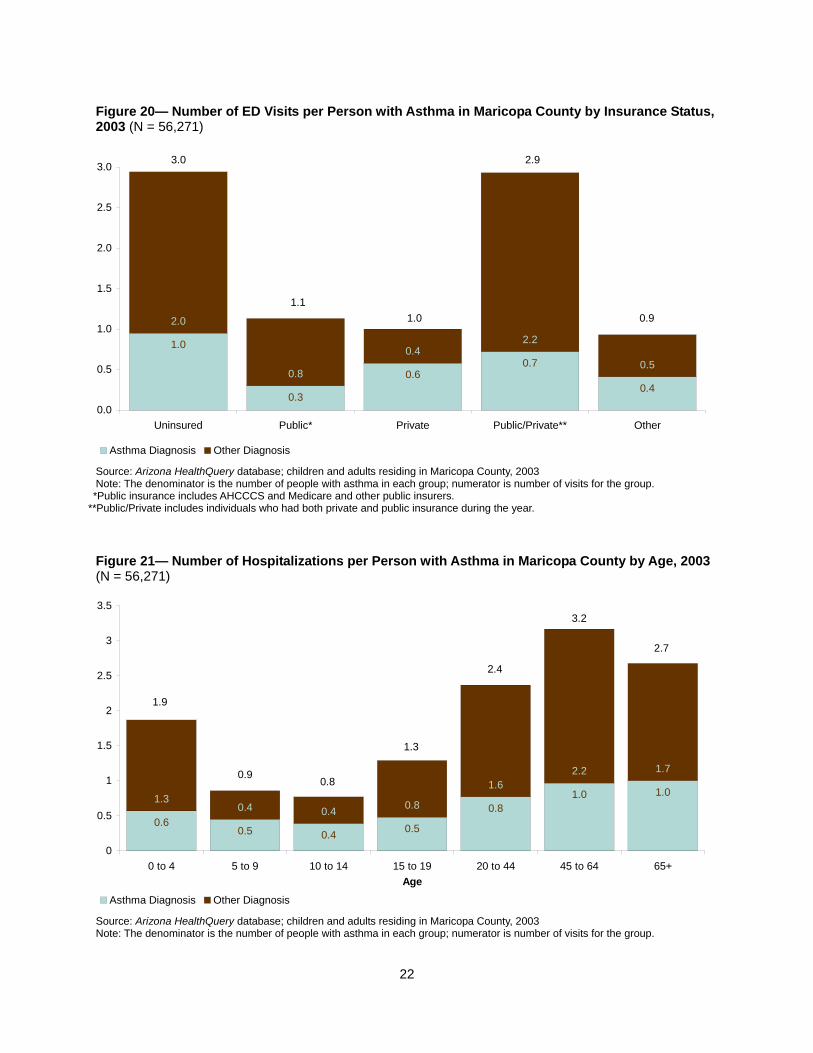
in 2003. Uninsured patients with asthma are likely to rely on the ED for asthma care because of their
limited ability to receive appropriate and timely preventive health care services for asthma. Indeed, we
found that the uninsured patients with asthma had, on average, one visit to the ED in 2003 resulting in a
diagnosis of asthma compared to 0.6 visits for privately insured patients with asthma and 0.3 for asthma
patients with public insurance. Other key findings are:
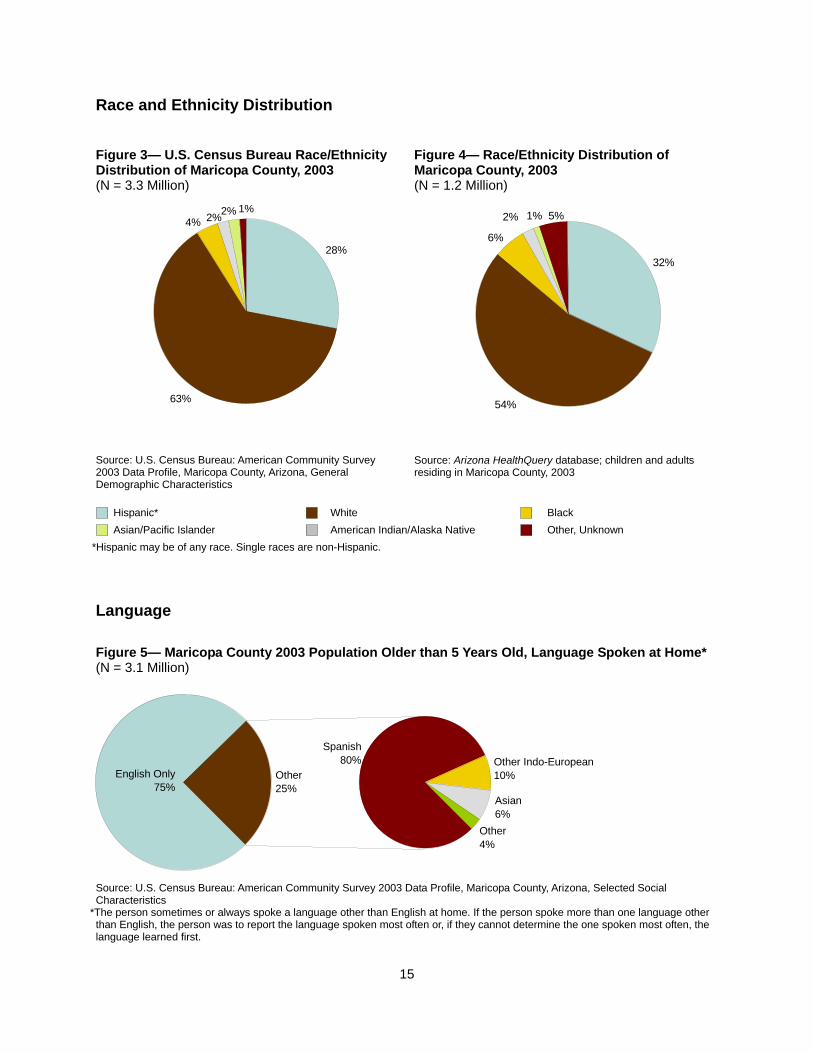
Compared to the overall United States population, the 2003 population of Maricopa
County was younger, had fewer Blacks (3.7% in Maricopa County vs. 11.9% in the U.S.)
and more individuals of Hispanic origin (28.1% in Maricopa County vs. 13.9% in the
U.S.), and more American Indians or Alaska Natives (1.6% in Maricopa County vs. 0.7%
in the U.S.).
The average rate of asthma for people receiving care in Maricopa County was 5%, with a
higher rate of 8% for children ages 5 to 14 years.
Blacks and American Indians had higher rates of asthma than White or Hispanic people
and, on average, Blacks and American Indians with asthma had more visits per person to
emergency departments for asthma than other races with asthma.
1 During 1992-1999, this estimate included both physician office visits and hospital outpatient department visits, with the latter category including approximately one million visits annually.

6
People with asthma, insured both publicly and privately during a year, had higher rates of
health care utilization for asthma than all other insurance groups.
Compared to the zip codes with the lowest rates, the zip codes with high rates of asthma
also had higher rates of poverty (15.5% to 3.5%), a higher percentage of Blacks in the
area (9.6% to 0.9%), and fewer people with a high school education (75.5% to 96.3%).
For children with asthma, birth to 19 years old, 30% to 50% of all ED visits were for
asthma.
Uninsured people with asthma had, on average, more visits to the ED per person for all
diagnoses and for asthma-related diagnoses than people who were continuously insured.
The majority of ED visits (57%) of privately insured people with asthma were for asthma.
Blacks with chronic asthma had the highest proportion of their total ED visits for asthma
(31%).
Among children, boys are more likely to have chronic asthma than girls.
Uninsured individuals with chronic asthma had, on average, the highest number of ED
visits per person for all diagnoses (16.0) while people with chronic asthma covered by
public insurance had the lowest, an average of 4.2 per person for all diagnoses.
The uninsured with asthma had, on average, the highest number of hospitalizations
(21.0) per person for all diagnoses over the three year period 2001-2003.
In Maricopa County, during the years 2000-2004, 188 individuals died with asthma listed
as the cause of death.
Over the four year period of 2000-2004, the rate of deaths attributable to asthma in
Maricopa County decreased from 1.4 per 100,000 people in 2000 to 0.8 per 100,000
people in 2004.

7
Background This report, Asthma in Maricopa County, is one in a series of Community Reports using data from Arizona
HealthQuery (AZHQ). The AZHQ database provides valuable information for the community on the
prevalence of disease across health systems as well as demographic information on the gender, race,
and ages of affected patients. Data from AZHQ is supplemented with information from the U.S. Census
Bureau and the Centers for Disease Control and Prevention’s (CDC) Behavioral Risk Factor Surveillance
System (BRFSS). The AZHQ data system is unique for its ability to provide vast amounts of continuously
updated health care information and link patients across systems and over time. The data is voluntarily
shared with AZHQ by health systems, physician groups, hospitals, and governmental agencies such as
AHCCCS. Each of the data partners maintains control over their data sets. Currently AZHQ contains
information on over 5.2 million people who have obtained health care in Arizona, of which 3.4 million are
residents of Maricopa County.
Asthma Asthma is an inflammation of the lungs that causes intermittent narrowing and blockage of the airways.
Symptoms include coughing, wheezing, chest tightness, and shortness of breath. In 1998, the cost of
asthma care accounted for an estimated $12.7 billion dollars annually. Fifty-eight percent of these costs
were attributable to direct medical expenditures and 42% were for indirect costs [5]. Approximately one-
third of the 20 million people who currently have asthma are children [3]. Childhood asthma is the most
common cause of missed school days, emergency department visits, and hospitalizations in the U.S. On
average, children who have asthma miss one week of school each year due to the disease [6]. Morbidity
from asthma is also substantial among adults. In 2002, adults over the age of 18 who were currently
employed missed 11.8 million work days due to asthma [3] and in 2000, asthmatic adults experienced
impaired physical or mental health 10 days each month on average, nearly double the rate of adults who
never had asthma [7].
8
Data Sources Arizona HealthQuery Data
Arizona HealthQuery (AZHQ) is a community health data system that houses essential and
comprehensive health information for Arizona residents. This data system is located at Arizona State
University and managed by the Center for Health Information and Research (CHIR). AZHQ collects and
houses health care information voluntarily provided by state agencies, hospitals, health care systems,
insurers, physician groups, community health centers, and other ambulatory care centers.
AZHQ serves as a resource for performing analyses directed at improving health and health care costs,
identifying medical service needs of certain populations, providing outcomes evaluations, performing
quality improvement assessments, and conducting cost management analyses as well as operational
analyses for contributing data partners.
This report reviews the data of children and adults in Maricopa County who received care for asthma
during the years 2001, 2002, and 2003. Asthma care is defined as health care utilization by people who
have had a health care encounter with a diagnosis of asthma (ICD9 493.00-493.99). Information on
asthma mortality for the years 2000 through 2004 is presented using data from AZHQ and Arizona
Department of Health Services2.
U.S. Census Bureau Data
The 2003 American Community Survey (ACS) provides general demographic statistics for Maricopa
County. Part of the Census Bureau’s decennial census, the ACS is a nationwide survey administered
each month throughout Arizona and the United States. The survey is limited to the household population
and excludes the population living in institutions, college dormitories, and other group quarters3. Although
2004 data are currently available, 2003 data are used in this report to correspond with AZHQ’s encounter
data. Maricopa County continues to see population growth on an annual basis; however the 2003
population distributions presented in Appendix Table 1 are similar to the 2004 population distributions.
The exception would be the percent unemployed in the civilian labor force. In 2003, the percent
unemployed was 7.3%, whereas in 2004, 5.4% were unemployed.
2 AZHQ includes the Vital Statistics birth and death files from the Arizona Department of Health Services (ADHS). Mortality rates are calculated using the same population denominator for ADHS’s annual Arizona Health Status and Vital Statistics reports.
3 The ACS is conducted primarily through self-report. The questionnaire mailing packages include general information about the ACS and an instruction guide explaining how to compete the questionnaire. Questionnaires and instruction guides are available in both English and Spanish. The ACS provides estimates of demographic, housing, social, and economic characteristics every year for all states, as well as for all cities, counties, metropolitan areas, and population groups at 65, 000 people or more.
9
Behavioral Risk Factor Surveillance System Data
The Behavioral Risk Factor Surveillance System (BRFSS) is a state-based system of health surveys that
generate information about health risk behaviors, clinical preventive practices, and health care access
and use primarily related to chronic diseases and injury. This report uses a subset of BRFSS data, the
Selected Metropolitan/Micropolitan Area Risk Trends (SMART), which has been produced to provide
some local area estimates4. This report includes data from the 2003 and 2004 BRFSS SMART surveys.
The 2003 survey includes two questions about adult asthma:
1) Have you ever been told by a doctor, nurse or other health professional that you had asthma?
2) Do you still have asthma?
The 2004 survey includes the same two questions plus questions on adult asthma history, current
healthcare utilization for asthma and childhood asthma.
4 These local areas are identified counties within metropolitan or micropolitan statistical areas (MMSA) as defined by the Office of Management and Budget. The data set was produced by adding new analysis weights designed to correspond to the 2003 and 2004 population estimates for each eligible county within a selected MMSA. The additional weights were post-stratified to the county-level.

10
Definitions Terms used throughout the text and graphs are defined below:
Race and Ethnicity: In the figures and tables, race and ethnicity are reported together. The term Hispanic
refers to people of Hispanic or Latino origin but they may be of any race. Single races (White, Black,
American Indian/Alaska Native, Asian/Pacific Islander and Other) are non-Hispanic or Latino. Due to
smaller sample sizes, we combined Asians and Pacific Islanders into one category although they are
usually reported separately in U.S. Census reports. In AZHQ, race and ethnicity are included on the
encounter record and are typically self-reported categories. We recognize that the categories are based
on social context and have no biological or genetic basis; not everyone identifies herself or himself by
these categories.
Insurance Status (AZHQ): We created four patterns of health insurance coverage experienced by
individuals utilizing some form of health care in the analysis period. The patterns represent combinations
of three possible states of coverage: uninsured, publicly insured (e.g., AHCCCS, Medicare), or privately
insured (including employment-related coverage). Three of the four patterns are defined by consistent
insurance coverage over the analysis period (public only, private insurance only, and public and private
insurance). The uninsured pattern is defined by periods of either chronic or sporadic spells of
uninsurance. The insurance patterns are:
Uninsured: The patient had at least one gap without insurance during the analysis period.
Public/Private continuously insured: The patient was insured by a combination of public
and private payers during the analysis period with no gaps in insurance.
Public continuously insured: All health care encounters during the analysis period were
for public payers (e.g. AHCCCS and Medicare) with no gaps in insurance or other
coverage.
Private continuously insured: All health care encounters during the analysis period are for
private payers with no gaps in insurance or other coverage.
Other: None of the above categories are applicable.
11
Asthma: When we refer to asthma rates or prevalence from AZHQ in the text and graphs we are referring
to the rate of health care utilization for patients with a diagnosis of asthma (ICD9 493.00 to 493.99 as the
primary or secondary diagnosis). There may be individuals who have been diagnosed with asthma but
are not included in the AZHQ database. The BRFSS prevalence reported is based on self-reported
survey data.
Asthma Rate (AZHQ): Indicates the rate of health care utilization for patients with at least
one health care visit during 2003 with a diagnosis of asthma.
Number of patients who utilized care in 2003 with a diagnosis of asthma
Number of patients who utilized care in 2003
Chronic Asthma Rate (AZHQ): Chronic asthma is defined as having at least one health
care visit per year in each of the years 2001, 2002 and 2003 with a diagnosis of asthma.
Number of patients with at least one visit in 2001, 2002 and 2003 with a diagnosis of asthma
Number of patients with at least one health care visit in 2001, 2002 and 2003
Asthma Rate (BRFSS): Indicates the weighted percentage of respondents who
responded that they have been told at some point they had a diagnosis of asthma and
still have the diagnosis.
Number of respondents who indicate they currently have asthma
Number of respondents completing survey x Maricopa County weight
Results The results are presented in three sections. The first section presents a cross-sectional overview of the
characteristics and utilization behaviors of people who were treated for asthma in Maricopa County in
2003. The second section presents a longitudinal overview of people for whom AZHQ contains three
years of data (2001, 2002, and 2003). Examining individuals with three consecutive years of data permits
us to depict trends over time that are not affected by changes in the underlying population. This
examination also provides a better picture of healthcare utilization by children and adults with chronic
asthma. The final section presents data on asthma-related mortality in Maricopa County for the years
2000 through 2004.
12
Prevalence of Asthma in Maricopa County, 2003
The prevalence of asthma varies across geographic communities, gender, and racial/ethnic groups.
According to the BRFSS in 2003, 8% of Maricopa County adult respondents have been told by a doctor
they currently have asthma. This figure is slightly higher than the national average of 7.5% (Figure 12) [8,
9]. Overall, in 2003, 5% (56,271) of the 1,216,394 Maricopa County residents included in the AZHQ
database received care for asthma. There was a higher prevalence of health care utilization for asthma
for children ages 5 to14 years old than for people of all other age groups (Figure 13). There is a much
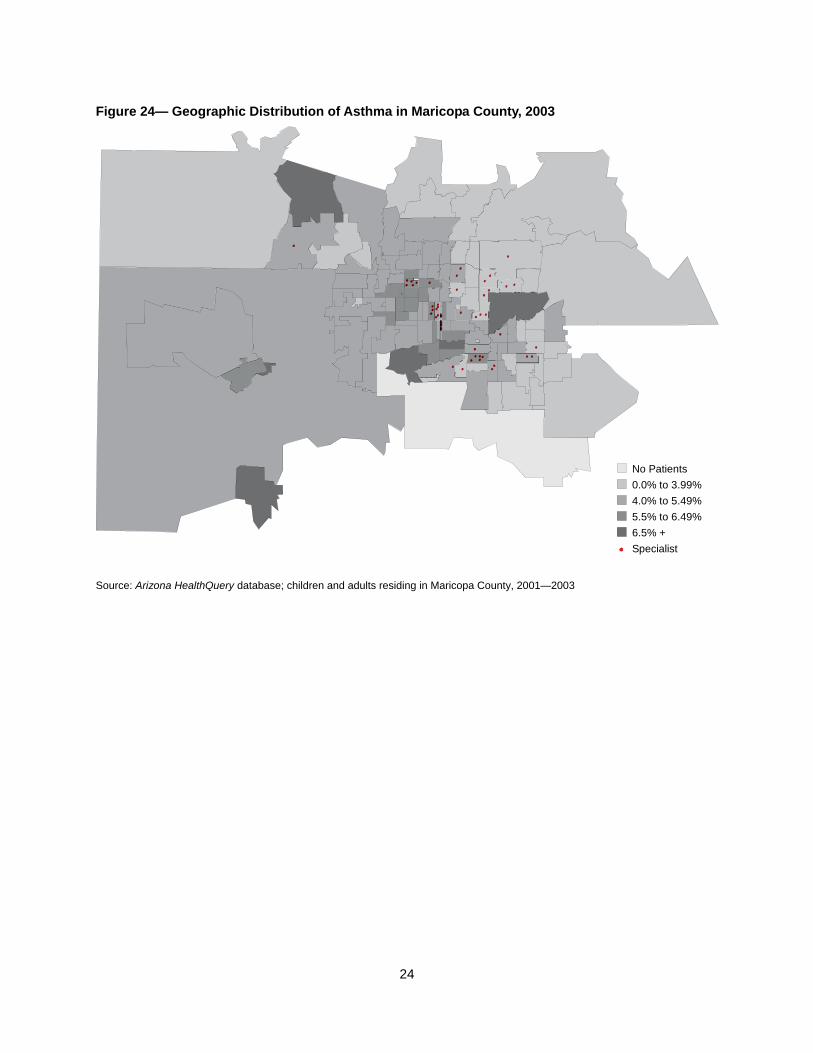
higher prevalence of asthma in some areas of Maricopa County than others (Figure 24 and Table 1). The
reasons for this increased prevalence is not clear but could be due to increased risk factors for asthma in
these communities including poverty, poor housing conditions, greater exposure to allergens, and air
pollution [2, 10]. Using data from the Census 2000, Table 1 compares zip codes with high rates of asthma
to zip codes with low rates of asthma. The zip codes with high rates of asthma also had higher rates of
poverty (15.5% compared to 3.5%), a higher percentage of Blacks in the area (9.6% compared to 0.9%),
and fewer people with a high school education (75.5% compared to 96.3%). There is also research
indicating asthma prevalence, hospitalizations and mortality are higher for Blacks compared to non-
Hispanic Whites [11-14]. Our data indicates that in 2003, Blacks had higher rates of health care utilization
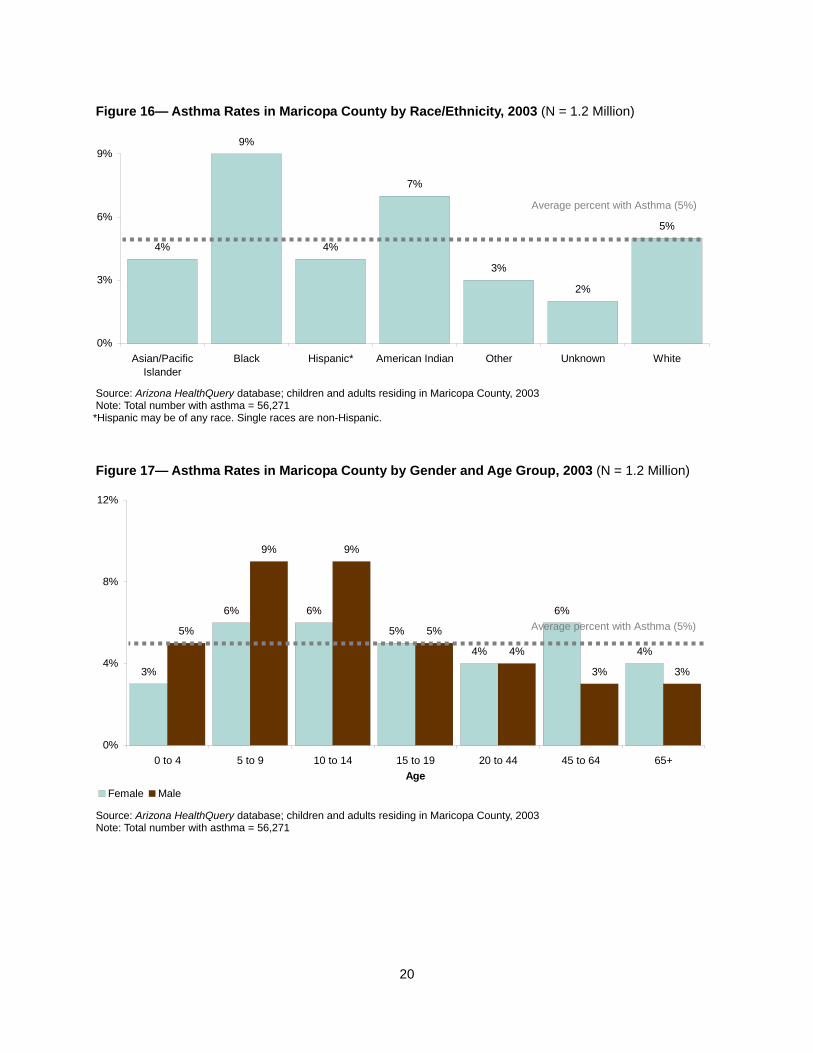
for asthma than members of other racial/ethnic groups (Figure 16).
The other results of the 2003 cross-sectional analysis show:
Approximately 16% of the people living in Maricopa County in 2003 were foreign born
[15]. Among people at least five years old living in Maricopa County in 2003, 25% spoke
a language other than English at home. Of those speaking a language other than English
at home, 80% spoke Spanish and 20% spoke a language other than Spanish or English
(Figure 5).
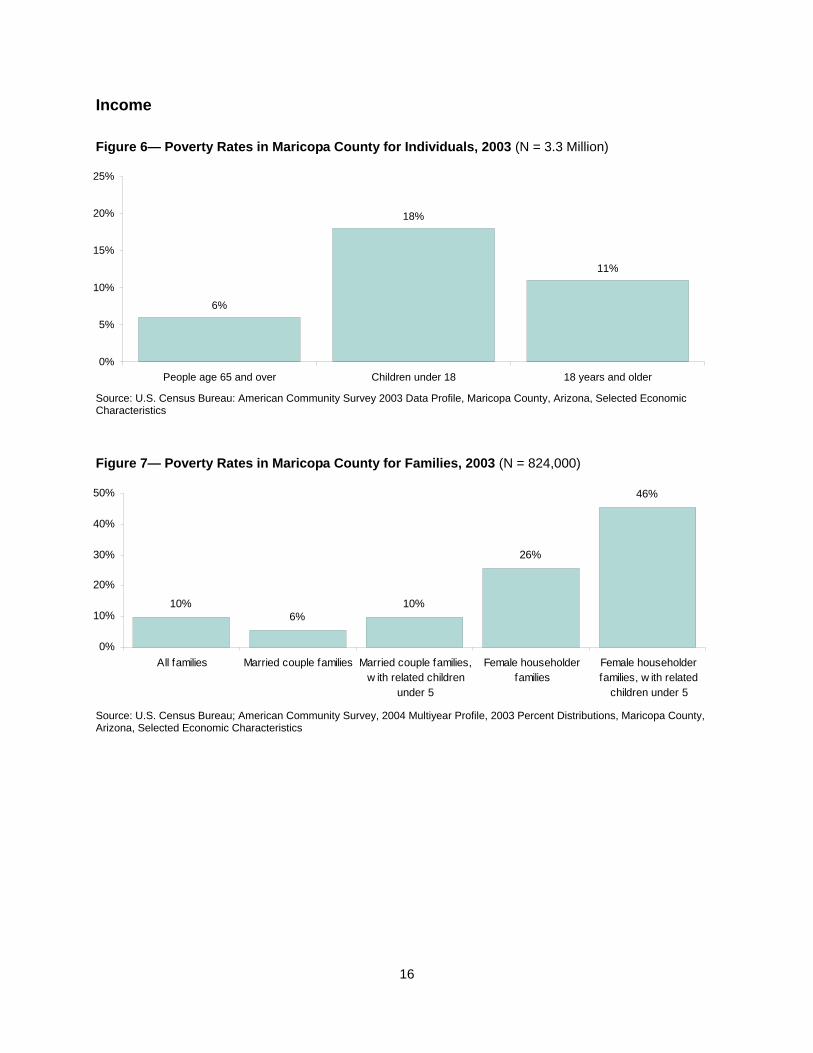
Female householder families have much higher rates of poverty than all families, 26%
compared to 10% for all families. Families with related children under five headed by a
female have more than four times the rate of poverty for married couple families with
related children under five (Figure 7).
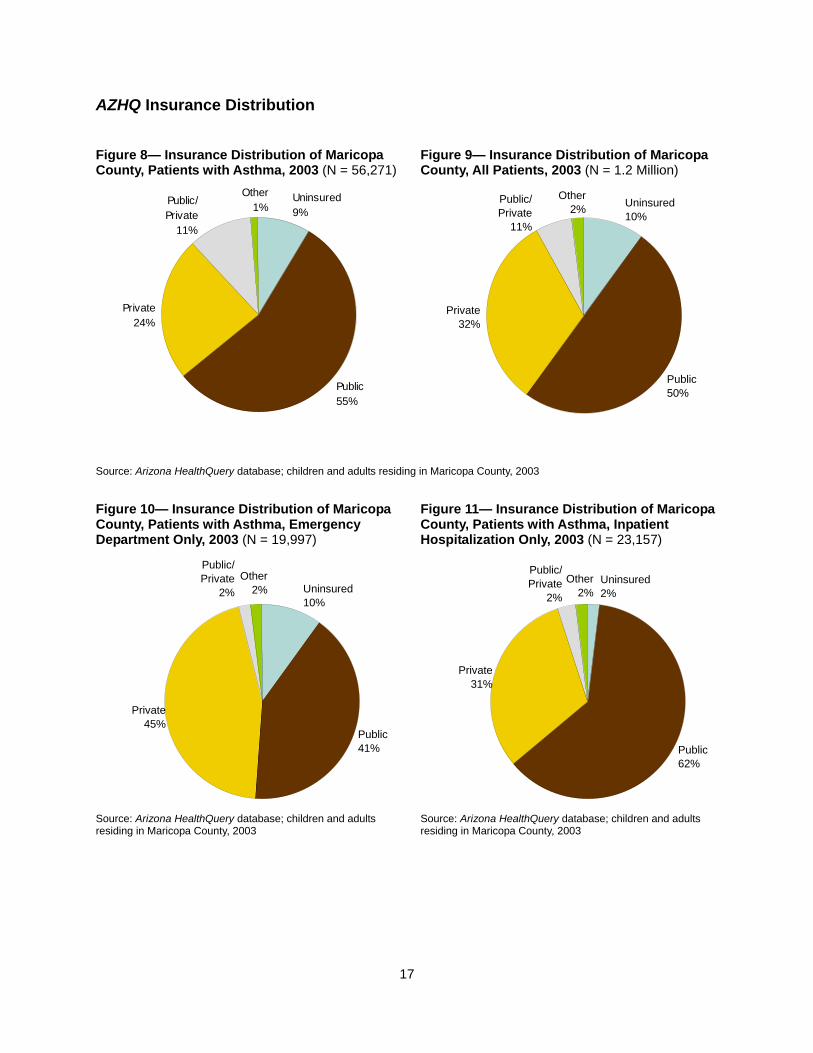
The majority of patients with asthma were continuously insured in 2003.
Approximately 9% of patients with asthma were uninsured at some time in 2003 (Figure
8). This compares to 10% of all patients in AZHQ who are uninsured (Figure 9).
For hospital visits, the majority of patients with asthma were covered by public insurance
(Figure 11). For emergency department visits, 41% of asthma patients were covered by
public insurance and 45% by private insurance (Figure 10).
13
Among adult respondents of the BRFSS with asthma, almost 40% indicate they
experienced no symptoms of asthma in the previous 30 days and 71% had no problems
with sleeping due to asthma. Another 20% experienced symptoms of asthma every day
[9].
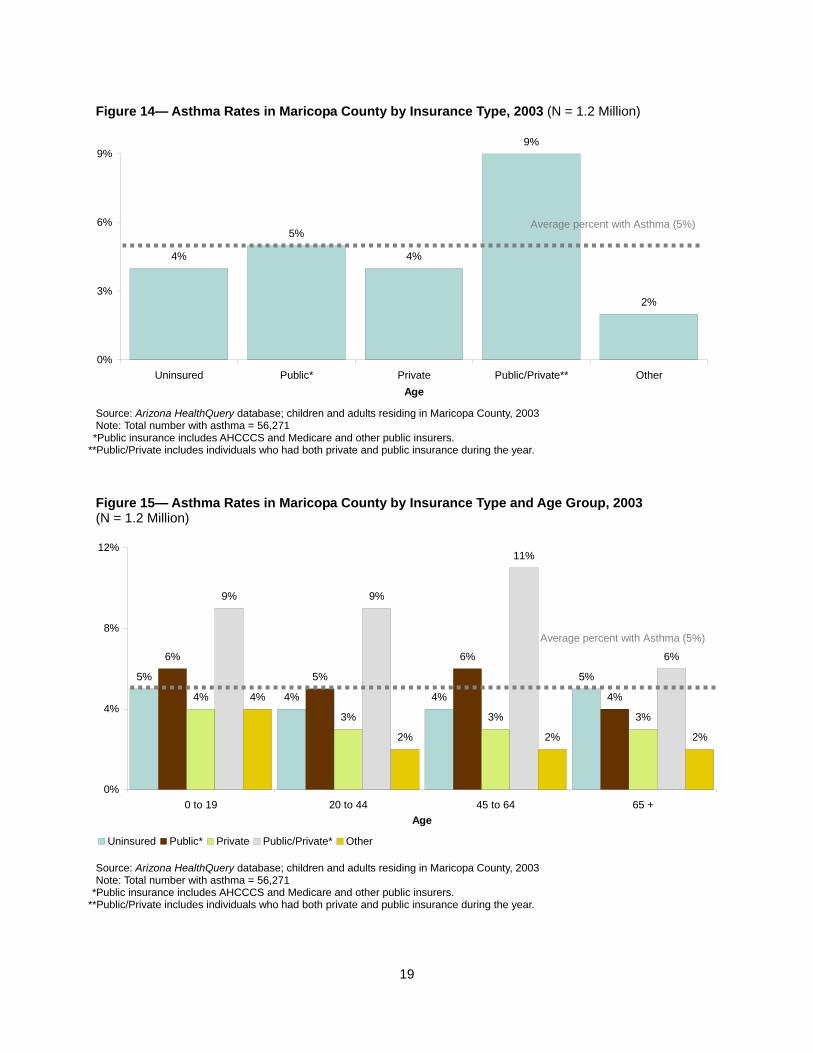
Among people covered by a combination of public and private insurance, the rate of
health care utilization for asthma was more than double the rate for the uninsured,
regardless of age (Figures 14 and 15).
Blacks and American Indians had the highest rates of asthma whereas Hispanics had the
lowest asthma rates (Figure 16).
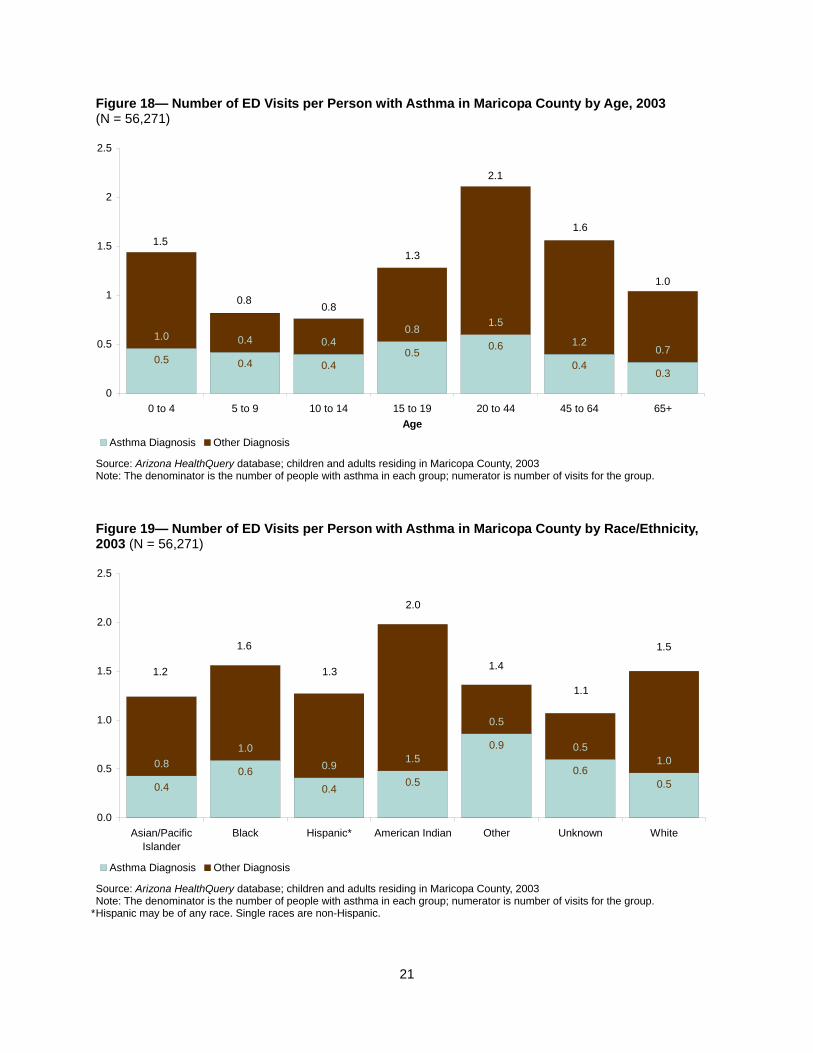
Blacks and American Indians with asthma had a higher number of ED visits per person
on average than other racial/ethnic groups with asthma (Figure 19).
Adults ages 20 to 44 with asthma had more ED visits per person on average than other
age groups with asthma (Figure 18).

14
2003 Maricopa County Demographics
Age Distribution
Figure 1— U.S. Census Bureau Age Distribution of Maricopa County, 2003 (N = 3.3 Million)
65+11%
45-6421%
0-1931%
20-4437%
Source: U.S. Census Bureau: American Community Survey 2003 Data Profile, Maricopa County, Arizona, General Demographic
Characteristics
Figure 2— Age Distribution of Maricopa County, 2003 (N = 1.2 Million)
65+13%
45-6416%
0-1940%
20-4431%
Source: Arizona HealthQuery database; children and adults residing in Maricopa County, 2003
15
Race and Ethnicity Distribution
Figure 3— U.S. Census Bureau Race/Ethnicity Distribution of Maricopa County, 2003 (N = 3.3 Million)
1%2%2%4%
28%
63%
Source: U.S. Census Bureau: American Community Survey 2003 Data Profile, Maricopa County, Arizona, General Demographic Characteristics
Figure 4— Race/Ethnicity Distribution of Maricopa County, 2003 (N = 1.2 Million)
54%
32%
6%
2% 1% 5%
Source: Arizona HealthQuery database; children and adults residing in Maricopa County, 2003
Hispanic* White Black
Asian/Pacific Islander American Indian/Alaska Native Other, Unknown *Hispanic may be of any race. Single races are non-Hispanic.
Language
Figure 5— Maricopa County 2003 Population Older than 5 Years Old, Language Spoken at Home* (N = 3.1 Million)
Other25%
Other4%
Asian6%
Other Indo-European10%
Spanish80%
English Only75%
Source: U.S. Census Bureau: American Community Survey 2003 Data Profile, Maricopa County, Arizona, Selected Social Characteristics
*The person sometimes or always spoke a language other than English at home. If the person spoke more than one language other than English, the person was to report the language spoken most often or, if they cannot determine the one spoken most often, the language learned first.
16
Income
Figure 6— Poverty Rates in Maricopa County for Individuals, 2003 (N = 3.3 Million)
6%
18%
11%
0%
5%
10%
15%
20%
25%
People age 65 and over Children under 18 18 years and older
Source: U.S. Census Bureau: American Community Survey 2003 Data Profile, Maricopa County, Arizona, Selected Economic Characteristics
Figure 7— Poverty Rates in Maricopa County for Families, 2003 (N = 824,000)
10%6%
10%
26%
46%
0%
10%
20%
30%
40%
50%
All families Married couple families Married couple families,w ith related children
under 5
Female householderfamilies
Female householderfamilies, w ith related
children under 5
Source: U.S. Census Bureau; American Community Survey, 2004 Multiyear Profile, 2003 Percent Distributions, Maricopa County, Arizona, Selected Economic Characteristics
17
AZHQ Insurance Distribution
Figure 8— Insurance Distribution of Maricopa County, Patients with Asthma, 2003 (N = 56,271)
Other1%Public/
Private11%
Private24%
Uninsured9%
Public55%
Figure 9— Insurance Distribution of Maricopa County, All Patients, 2003 (N = 1.2 Million)
Other2%
Public/ Private
11%
Private32%
Uninsured10%
Public50%
Source: Arizona HealthQuery database; children and adults residing in Maricopa County, 2003
Figure 10— Insurance Distribution of Maricopa County, Patients with Asthma, Emergency Department Only, 2003 (N = 19,997)
Other2%
Public/ Private
2%
Private45%
Uninsured10%
Public41%
Source: Arizona HealthQuery database; children and adults residing in Maricopa County, 2003
Figure 11— Insurance Distribution of Maricopa County, Patients with Asthma, Inpatient Hospitalization Only, 2003 (N = 23,157)
Other2%
Public/ Private
2%
Private31%
Uninsured2%
Public62%
Source: Arizona HealthQuery database; children and adults residing in Maricopa County, 2003

18
2003 Asthma Results
Figure 12— Current Adult Asthma Prevalence, 2003 BRFSS
8.00%
8.30%
7.50%
7%
8%
8%
9%
Maricopa Arizona National
Source: 2003 BRFSS SMART; adults who have been told they currently have asthma, percentages are weighted
Figure 13— Asthma Rates in Maricopa County by Age, 2003 (N = 1.2 Million)
4%
8%
7%
5%
4%
5%
4%
0%
3%
6%
9%
0 to 4 5 to 9 10 to 14 15 to 19 20 to 44 45 to 64 65+Age
Average percent with Asthma (5%)
Source: Arizona HealthQuery database; children and adults residing in Maricopa County, 2003
Note: Total number with asthma = 56,271
19
Figure 14— Asthma Rates in Maricopa County by Insurance Type, 2003 (N = 1.2 Million)
4%
5%
4%
9%
2%
0%
3%
6%
9%
Uninsured Public* Private Public/Private** OtherAge
Average percent with Asthma (5%)
Source: Arizona HealthQuery database; children and adults residing in Maricopa County, 2003 Note: Total number with asthma = 56,271 *Public insurance includes AHCCCS and Medicare and other public insurers. **Public/Private includes individuals who had both private and public insurance during the year.
Figure 15— Asthma Rates in Maricopa County by Insurance Type and Age Group, 2003 (N = 1.2 Million)
5%
4% 4%
5%
6%
5%
6%
4%4%
3% 3% 3%
9%
11%
6%
4%
2% 2% 2%
9%
0%
4%
8%
12%
0 to 19 20 to 44 45 to 64 65 +Age
Uninsured Public* Private Public/Private* Other
Average percent with Asthma (5%)
Source: Arizona HealthQuery database; children and adults residing in Maricopa County, 2003 Note: Total number with asthma = 56,271
*Public insurance includes AHCCCS and Medicare and other public insurers. **Public/Private includes individuals who had both private and public insurance during the year.
20
Figure 16— Asthma Rates in Maricopa County by Race/Ethnicity, 2003 (N = 1.2 Million)
4%
9%
4%
7%
3%
2%
5%
0%
3%
6%
9%
Asian/PacificIslander
Black Hispanic* American Indian Other Unknown White
Average percent with Asthma (5%)
Source: Arizona HealthQuery database; children and adults residing in Maricopa County, 2003 Note: Total number with asthma = 56,271 *Hispanic may be of any race. Single races are non-Hispanic.
Figure 17— Asthma Rates in Maricopa County by Gender and Age Group, 2003 (N = 1.2 Million)
3%
6% 6%
5%
4%
6%
4%
5%
9% 9%
5%
4%
3% 3%
0%
4%
8%
12%
0 to 4 5 to 9 10 to 14 15 to 19 20 to 44 45 to 64 65+Age
Female Male
Average percent with Asthma (5%)
Source: Arizona HealthQuery database; children and adults residing in Maricopa County, 2003 Note: Total number with asthma = 56,271
21
Figure 18— Number of ED Visits per Person with Asthma in Maricopa County by Age, 2003 (N = 56,271)
0.5 0.4 0.40.5 0.6
0.40.3
1.0 0.4 0.40.8 1.5
1.20.7
0
0.5
1
1.5
2
2.5
0 to 4 5 to 9 10 to 14 15 to 19 20 to 44 45 to 64 65+Age
Asthma Diagnosis Other Diagnosis
1.5
0.8 0.8
1.3
2.1
1.6
1.0
Source: Arizona HealthQuery database; children and adults residing in Maricopa County, 2003 Note: The denominator is the number of people with asthma in each group; numerator is number of visits for the group.
Figure 19— Number of ED Visits per Person with Asthma in Maricopa County by Race/Ethnicity, 2003 (N = 56,271)
0.40.6
0.4 0.5
0.9
0.60.5
0.81.0
0.9 1.5
0.5
0.51.0
0.0
0.5
1.0
1.5
2.0
2.5
Asian/PacificIslander
Black Hispanic* American Indian Other Unknown White
Asthma Diagnosis Other Diagnosis
1.2
1.6
2.0
1.4
1.1
1.5
1.3
Source: Arizona HealthQuery database; children and adults residing in Maricopa County, 2003 Note: The denominator is the number of people with asthma in each group; numerator is number of visits for the group. * Hispanic may be of any race. Single races are non-Hispanic.
22
Figure 20— Number of ED Visits per Person with Asthma in Maricopa County by Insurance Status, 2003 (N = 56,271)
1.0
0.3
0.60.7
0.4
2.0
0.8
0.42.2
0.5
0.0
0.5
1.0
1.5
2.0
2.5
3.0
Uninsured Public* Private Public/Private** Other
Asthma Diagnosis Other Diagnosis
3.0
1.1
2.9
0.91.0
Source: Arizona HealthQuery database; children and adults residing in Maricopa County, 2003 Note: The denominator is the number of people with asthma in each group; numerator is number of visits for the group. *Public insurance includes AHCCCS and Medicare and other public insurers. **Public/Private includes individuals who had both private and public insurance during the year.
Figure 21— Number of Hospitalizations per Person with Asthma in Maricopa County by Age, 2003 (N = 56,271)
0.60.5 0.4 0.5
0.81.0 1.01.3
0.4 0.4 0.8
1.62.2 1.7
0
0.5
1
1.5
2
2.5
3
3.5
0 to 4 5 to 9 10 to 14 15 to 19 20 to 44 45 to 64 65+Age
Asthma Diagnosis Other Diagnosis
1.9
0.90.8
1.3
2.4
3.2
2.7
Source: Arizona HealthQuery database; children and adults residing in Maricopa County, 2003 Note: The denominator is the number of people with asthma in each group; numerator is number of visits for the group.

23
Figure 22— Number of Hospitalizations per Person with Asthma in Maricopa County by Race/Ethnicity, 2003 (N = 56,271)
0.60.7
0.60.7
0.3 0.3
0.81.3
1.21.2
1.8
0.3 0.3
1.4
0.0
0.5
1.0
1.5
2.0
2.5
Asian/PacificIslander
Black Hispanic* American Indian Other Unknown White
Asthma Diagnosis Other Diagnosis
1.9 1.9
2.5
0.6
2.2
1.8
0.6
Source: Arizona HealthQuery database; children and adults residing in Maricopa County, 2003 Note: The denominator is the number of people with asthma in each group; numerator is number of visits for the group. *Hispanic may be of any race. Single races are non-Hispanic
Figure 23— Number of Hospitalizations per Person with Asthma in Maricopa County by Insurance Status, 2003 (N = 56,271)
0.7 0.6 0.6
1.1
0.6
1.6 1.4
3.7
0.10.3
0.0
1.0
2.0
3.0
4.0
5.0
Uninsured Public* Private Public/Private** Other
Asthma Diagnosis Other Diagnosis
2.32.0
4.8
0.70.9
Source: Arizona HealthQuery database; children and adults residing in Maricopa County, 2003 Note: The denominator is the number of people with asthma in each group; numerator is number of visits for the group. *Public insurance includes AHCCCS and Medicare and other public insurers. **Public/Private includes individuals who had both private and public insurance during the year.
24
Figure 24— Geographic Distribution of Asthma in Maricopa County, 2003
No Patients0.0% to 3.99%4.0% to 5.49%5.5% to 6.49%6.5% +Specialist
Source: Arizona HealthQuery database; children and adults residing in Maricopa County, 2001—2003
25
Table 1— Demographic Characteristics of Zip Codes with the High and Low Rates of Asthma, 2003
Average of Six Zip Codes with High Rates
Average of Six Zip Codes with Low Rates
AZHQ Patients N = 61,618 N = 39,121
Number of Patients with Asthma 3,996 937
Asthma Rate 6.5% 2.4%
2000 Census Demographics N = 191,005 N = 134,563
Percent Poverty 15.5% 3.5%
Percentage High School Graduate 75.5% 96.3%
Percent Black 9.6% 0.9%
Percent under 18 years 31.0% 21.6%
Zip Code Locations 85040: E Broadway & 25th St 85256: Indian School & Country Club
(Salt River Pima Maricopa Community)
85302: Olive & 55th Ave
85304: Cactus & 51st Ave
85339: Baseline & 51st Ave 85345: Grand & 67th Ave
85253: Lincoln & Tatum 85255: Pima & Thompson Peak
Parkway 85258: Via Linda & 87th St 85259: Shea & 120th St 85268: Fountain Hills 85331: Cave Creek & 56th St
Source: Arizona HealthQuery database; children and adults residing in Maricopa County, 2003. 2000 Census Demographic Profile, American Fact Finder Note: Each zip code had a minimum of 500 patients utilizing care (denominator) in AZHQ in 2003. Percent of poverty, percentage of high school graduate, percent Black and percent under 18 represents the neighborhood using data from the Census and not necessarily the people with asthma in AZHQ.
26
Chronic Asthma in Maricopa County, 2001–2003
The second set of results highlights the health experiences of 5,062 people in Maricopa County with three
consecutive years of data. These individuals received care for asthma at least once in all three years.
Results for the longitudinal cohort are similar to the results from one year of data although the asthma
rates are lower. For the longitudinal cohort, the chronic asthma rate in Maricopa County was 2%
compared to 5% for the 2003 cohort. Children ages 10 to 14 had the highest rates of asthma at 4%
(Figure 25) with adults over 65 and children younger than four years of age with the lowest rates at 1%.
The key findings regarding these patients who have chronic asthma are:
Blacks and American Indians had a higher rate of chronic asthma compared to other
races and ethnicities (Figure 26).
Whites with chronic asthma had, on average, the highest number of ED visits per person
(7.4) for all diagnoses but Blacks and American Indians with chronic asthma had the
highest number of asthma related visits per person (1.6). Blacks with chronic asthma also
had the highest percentage of total ED visits due to asthma – 31% of all ED visits for
Blacks with chronic asthma were for asthma compared to 19% for Whites with chronic
asthma (Figure 30).
Uninsured individuals with chronic asthma had, on average, the highest number of ED
visits per person for all diagnoses (16.0 visits) and for visits with a diagnosis of asthma
(3.7 visits). People with chronic asthma covered by public insurance had the lowest, an
average of 4.2 per person for all diagnoses and 1.0 per person for visits with an asthma
diagnosis (Figure 31).
The uninsured with chronic asthma also had, on average, the highest number of
hospitalizations (21.0) per person but the percentage of hospitalizations for asthma, 28%,
was similar for individuals with chronic asthma who had public insurance at 30% (Figure
34).
Females with chronic asthma had more emergency room visits than males with chronic
asthma for all diagnoses (Figure 28); for visits where the diagnosis is asthma, however,
there is little difference by gender or by gender and age (Figure 29).
Females with chronic asthma also had on average more hospitalizations than males with
chronic asthma but the percent of visits that were asthma related were higher for males
27
(Figure 32 ), 36% of all hospitalizations for males with chronic asthma were asthma
related compared to 26% for females with chronic asthma.
Figure 25— Chronic Asthma Rates in Maricopa County by Age, 2001-2003 (N = 221,000)
1%
3%
4%
2% 2%
3%
1%
0%
1%
2%
3%
4%
0 to 4 5 to 9 10 to 14 15 to 19 20 to 44 45 to 64 65+Age
Average percent with Asthma (2%)
Source: Arizona HealthQuery database; children and adults residing in Maricopa County, 2001-2003 Note: Total number with asthma = 5,062
Figure 26— Chronic Asthma Rates in Maricopa County by Race/Ethnicity, 2001-2003 (N = 221,000)
2%
4%
2%
3%
2% 2% 2%
0%
1%
2%
3%
4%
Asian/PacificIslander
Black Hispanic* American Indian Other Unknown White
Average percent with Asthma (2%)
Source: Arizona HealthQuery database; children and adults residing in Maricopa County, 2001-2003 Note: Total number with asthma = 5,062 *Hispanic may be of any race. Single races are non-Hispanic.

28
Figure 27— Chronic Asthma Rates in Maricopa County by Gender and Age Group, 2001-2003 (N = 221,000)
1%
2%
3%
2% 2%
4%
1%
2%
4% 4%
3%
2% 2%
1%
0%
1%
2%
3%
4%
0 to 4 5 to 9 10 to 14 15 to 19 20 to 44 45 to 64 65+Age
Females Males
Average percent with Asthma (2%)
Source: Arizona HealthQuery database; children and adults residing in Maricopa County, 2001-2003 Note: Total number with asthma = 5,062; female chronic asthma rate = 2%; male chronic asthma rate = 3%
Figure 28— Number of ED Visits per Person with Chronic Asthma in Maricopa County by Gender, 2001-2003 (N = 5,062)
1.5 1.2
5.5 3.1
0.0
2.0
4.0
6.0
8.0
Female Male
Asthma Diagnosis Other Diagnosis
7.0
4.3
Source: Arizona HealthQuery database; children and adults residing in Maricopa County, 2001-2003 Note: The denominator is the number of people with asthma in each group; numerator is number of visits for the group.
29
Figure 29— Number of Asthma ED Visits per Person with Chronic Asthma in Maricopa County by Gender and Age, 2001-2003 (N = 5,062)
1.2
1.0 1.0 1.0
2.0
1.5
1.11.3
1.0 1.0 1.0
2.2
1.8
0.8
0.0
0.5
1.0
1.5
2.0
2.5
0 to 4 5 to 9 10 to 14 15 to 19 20 to 44 45 to 64 65+Age
Female Asthma Diagnosis Male Asthma Diagnosis
Source: Arizona HealthQuery database; children and adults residing in Maricopa County, 2001 – 2003 Note: The denominator is the number of people with asthma in each group; numerator is number of visits for the group.
Figure 30— Number of ED Visits per Person with Chronic Asthma in Maricopa County by Race/Ethnicity, 2001-2003 (N = 5,062)
1.11.6
1.21.6 1.4
5.03.6 4.6
6.0
3.1
0.0
2.0
4.0
6.0
8.0
Asian/Pacific Islander Black Hispanic* American Indian White
Asthma Diagnosis Other Diagnosis
6.1
5.2
6.2
7.4
4.3
Source: Arizona HealthQuery database; children and adults residing in Maricopa County, 2003 Note: The denominator is the number of people with asthma in each group; numerator is number of visits for the group; other and unknown race/ethnicity is not shown as the number of patients is less than 30
*Hispanic may be of any race. Single races are non-Hispanic.

03
Figure 31— Number of ED Visits per Person with Chronic Asthma in Maricopa County by Insurance Status, 2001-2003 (N = 5,062)
3.7
1.0
3.12.2
12.3
3.27.2
3.7
0.0
4.0
8.0
12.0
16.0
**etavirP/cilbuPetavirP*cilbuPderusninU
Asthma Diagnosis Other Diagnosis
16.0
4.2
9.4
6.8
Source: Arizona HealthQuery database; children and adults residing in Maricopa County, 2001–2003 Note: The denominator is the number of people with asthma in each group; numerator is number of visits for the group; the averagenumber of visits for other insurance is not shown as the number of patients was fewer than 10
*Public insurance includes AHCCCS and Medicare and other public insurers. **Public/Private includes individuals who had both private and public insurance during the year.
Figure 32— Number of Hospitalizations per Person with Chronic Asthma in Maricopa County by Gender, 2001-2003 (N = 5,062)
3.73.1
10.35.5
0.0
5.0
10.0
15.0
elaM elameFAsthma Diagnosis Other Diagnosis
14.0
8.6
Source: Arizona HealthQuery database; children and adults residing in Maricopa County, 2001—2003 Note: The denominator is the number of people with asthma in each group; numerator is number of visits for the group; female chronic asthma rate = 2%;male chronic asthma rate = 3%
31
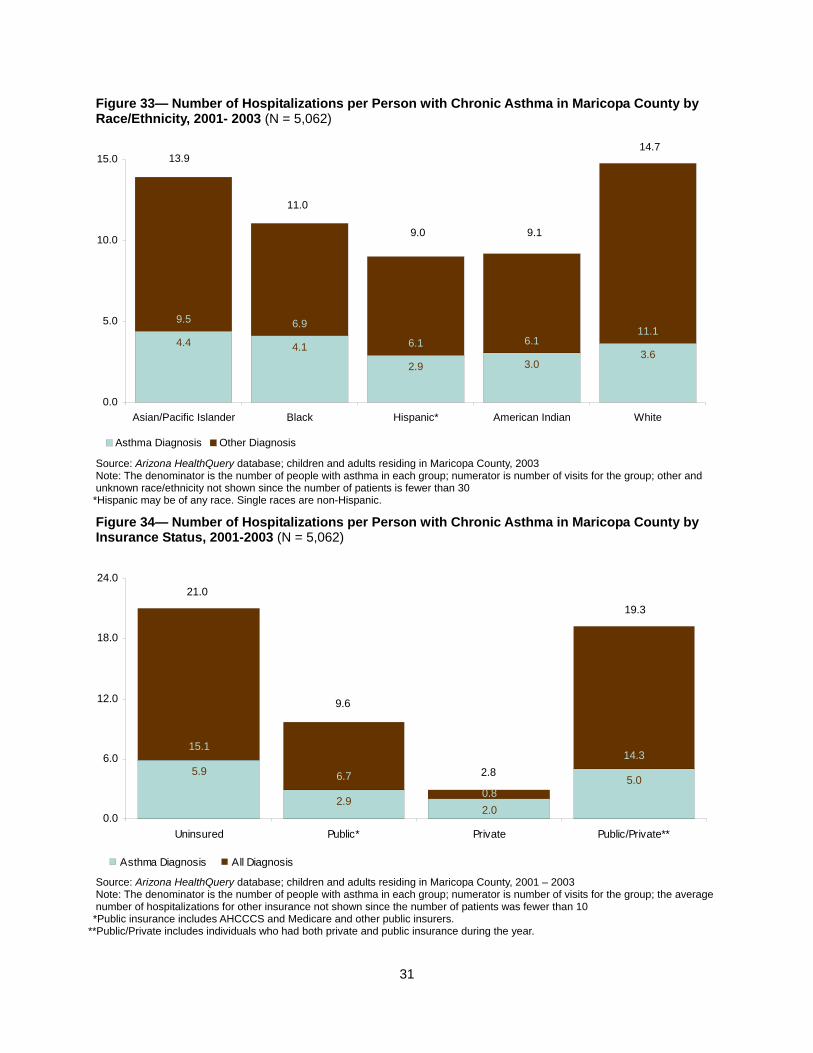
Figure 33— Number of Hospitalizations per Person with Chronic Asthma in Maricopa County by Race/Ethnicity, 2001- 2003 (N = 5,062)
4.4 4.1
2.9 3.03.6
9.5 6.96.1
11.16.1
0.0
5.0
10.0
15.0
Asian/Pacific Islander Black Hispanic* American Indian White
Asthma Diagnosis Other Diagnosis
13.9
11.0
9.1
14.7
9.0
Source: Arizona HealthQuery database; children and adults residing in Maricopa County, 2003 Note: The denominator is the number of people with asthma in each group; numerator is number of visits for the group; other and unknown race/ethnicity not shown since the number of patients is fewer than 30
*Hispanic may be of any race. Single races are non-Hispanic.
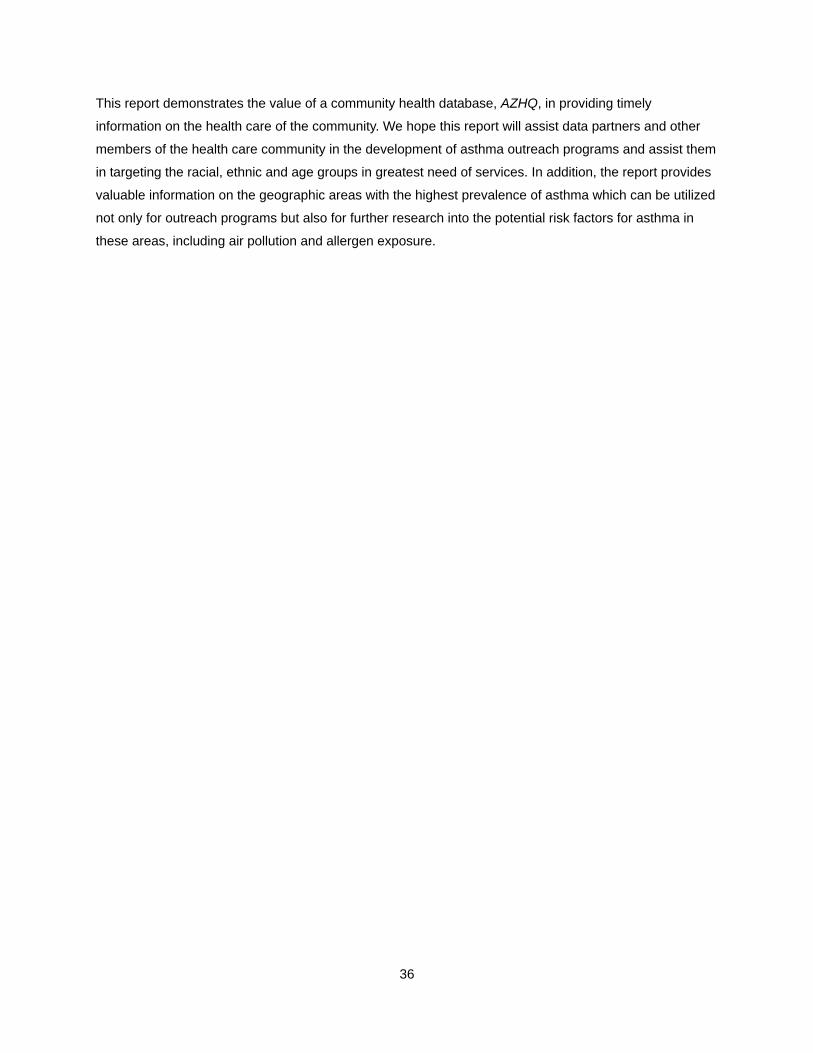
Figure 34— Number of Hospitalizations per Person with Chronic Asthma in Maricopa County by Insurance Status, 2001-2003 (N = 5,062)
5.9
2.92.0
5.0
15.1
6.7
14.3
0.8
0.0
6.0
12.0
18.0
24.0
Uninsured Public* Private Public/Private**
Asthma Diagnosis All Diagnosis
21.0
9.6
19.3
2.8
Source: Arizona HealthQuery database; children and adults residing in Maricopa County, 2001 – 2003 Note: The denominator is the number of people with asthma in each group; numerator is number of visits for the group; the average number of hospitalizations for other insurance not shown since the number of patients was fewer than 10
*Public insurance includes AHCCCS and Medicare and other public insurers. **Public/Private includes individuals who had both private and public insurance during the year.

32
Figure 35— Geographic Distribution of Chronic Asthma, Maricopa County, 2001–2003
No Patients0.0% to 3.99%4.0% to 5.49%5.5% to 6.49%6.5% +Specialist
Source: Arizona HealthQuery database; children and adults residing in Maricopa County, 2001—2003
Asthma Related Mortality in Maricopa County, 2000–2004
In Maricopa County, for the years 2000-2004, approximately 37 deaths per year were attributable to
asthma (ICD10 J45), according to AZHQ. The rate of death from asthma decreased from 1.4 deaths per
100,000 residents in 2000 to 0.8 per 100,000 residents in 2004 (Figure 36). Mortality from asthma reflects
a rare and severe outcome and therefore the reduction of deaths from asthma is one of the Healthy
People 20105 goals. In 2004, Maricopa County reached the Healthy People 2010 goal for asthma deaths
for all age groups6 (Figure 37). Mortality from asthma is higher in some areas of Maricopa County than in
others (Figure 38) but, for the three zip codes with the highest number of deaths, almost all deaths
occurred in individuals over the age of 65. Fifty-two percent of asthma related deaths in the four year
period were for people over age 65 and less than 5% of deaths were for people under age 19. The zip
code with the highest number (10) of deaths, 85205, is located in Mesa and has an older population in
5 Healthy People 2010 is a national initiative designed to promote health and prevent disease. 6 Rates based on small numbers are imprecise and for people under age 34, there were fewer than five deaths attributable to asthma
in any one year.

33
comparison to Maricopa County. The median age in zip code 85205 is 43.0 compared to 34.2 in Maricopa
County and 26.2% of the population is over 65 compared to 11.7% in Maricopa County. The next two zip
codes with the highest number of deaths (7 deaths each) are both located in Sun City, where over 79% of
the population is over age 65.
Figure 36— Asthma Death Rates by Year, Maricopa County, 2000-2004
0.8
1.31.3
1.1
1.4
0.5
1.0
1.5
2000 2001 2002 2003 2004
Dea
ths
per 1
00,0
00 R
esid
ents
Source: Arizona HealthQuery database, 2000–2004, and population denominators used in calculation of rates from Arizona Department of Health Services, http://www.azdhs.gov/plan/report/ahs/index.htm [16]
Figure 37— Asthma Death Rates and Healthy People 2010 Goal by Age Group, Maricopa County, 2004
0.0 0.00.2
0.9
3.7
0 00.2
0.8
4.6
0.1 0.1 0.2
0.9
6.0
0.0
2.0
4.0
6.0
0 to4 5 to 14 15 to 34 35 to 64 65 +Age
Dea
ths
per 1
00,0
00 R
esid
ents
Maricopa Arizona Healthy People 2010
Source: Arizona HealthQuery database, 2000–2004, and population denominators used in calculation of rates from Arizona Department of Health Services, http://www.azdhs.gov/plan/report/ahs/index.htm. [16]

34
Figure 38— Map of Asthma Deaths in Maricopa County, 2000-2004
0 5 10
Specialist
Number of Asthma Related Deaths:
Source: Arizona HealthQuery database; 2000-2004.

35
Summary Asthma is a major health problem in Maricopa County. Approximately 8% of adults in Maricopa County
currently have asthma. The AZHQ database includes over 56,000 adults and children who required health
care for asthma in 2003 (approximately 5% of the AZHQ database). Approximately 37 deaths per year
from 2000-2004 were attributable to asthma; however, the death rate from asthma has declined from
1.4/100,000 to 0.8/100,000 from 2000 to 2004. In Maricopa County, Blacks and American Indians have
the highest rate of asthma and Hispanics have the lowest asthma rates. Blacks and American Indians
with asthma also have higher number of ED visits per person for asthma than other racial/ethnic groups.
Approximately one-third of all ED visits for Blacks who have chronic asthma is for asthma-related disease,
averaging 1.6 visits per person over a three year period.
National studies show that asthma is more prevalent among Blacks, children, and individuals with lower
socioeconomic status. In Maricopa County, asthma rates are higher for children ages 5 to 14 years old
than other age groups. This age group is more likely to be playing outside and, thus, exposed to air
pollutants and allergens than other age groups. Additionally, we found that asthma rates varied by zip
code in Maricopa County. On further analysis, we found that the zip codes with the highest asthma rates
had a higher percentage of children younger than 18 years old, a higher percent of people living in
poverty, and a higher percentage of Blacks than the zip codes with the lowest rates.
The majority of people who received health care for asthma in 2003 had public insurance (e.g., AHCCCS,
Medicare); 9% were uninsured. The uninsured with asthma averaged one ED visit per person for asthma
in 2003 compared to 0.3 ED visits per person for the publicly insured with asthma and 0.6 per person for
the privately insured with asthma. The larger rate for the uninsured may be due to lack of access to
preventive care services and controller medications which must be taken daily to prevent asthma attacks.
The lower rate of ED visits for the publicly insured than for the privately insured suggests that AHCCCS is
providing better preventive services for asthma patients than the private insurers. The highest rate of
health care utilization for asthma was among people who were both publicly and privately insured in
2003. There are many reasons why this particular group may have utilized more health care services for
their asthma than other insurance groups. Asthma is usually a chronic disease that requires frequent
physician visits and daily medications. When patients switch insurers, they may not have access to timely
preventive care services since they must locate a new medical provider who may not be as familiar with
their health care needs and may lack adequate medical records because of delays in transfers of records
from their previous provider. In addition, their treatment regimen may also be disrupted due to formulary
changes and they may be less comfortable contacting their new physician when they are having
difficulties with their asthma. Finally, their insurance coverage may be limited during the first few months
after changing insurers so that they delay seeking preventive care services.
36
This report demonstrates the value of a community health database, AZHQ, in providing timely
information on the health care of the community. We hope this report will assist data partners and other
members of the health care community in the development of asthma outreach programs and assist them
in targeting the racial, ethnic and age groups in greatest need of services. In addition, the report provides
valuable information on the geographic areas with the highest prevalence of asthma which can be utilized
not only for outreach programs but also for further research into the potential risk factors for asthma in
these areas, including air pollution and allergen exposure.
37
References 1. Mannino, D.M., et al., Surveillance for asthma--United States, 1960-1995. MMWR CDC Surveill
Summ, 1998. 47(1): p. 1-27.
2. Eggleston, P.A., et al., The environment and asthma in U.S. inner cities. Environ Health Perspect,
1999. 107 Suppl 3: p. 439-50.
3. National Center for Health Statistics, Asthma Prevalence, Health Care Use and Mortality, 2002
Fact Sheet. 2005.
4. Mannino, D.M., et al., Surveillance for asthma--United States, 1980-1999. MMWR Surveill Summ,
2002. 51(1): p. 1-13.
5. Weiss, K.B. and S.D. Sullivan, The health economics of asthma and rhinitis. I. Assessing the
economic impact. J Allergy Clin Immunol, 2001. 107(1): p. 3-8.
6. Liu, A.H., J.D. Spahn, and D.Y.M. Leung, Childhood Asthma, in Nelson textbook of pediatrics,
R.E. Behrman, R. Kliegman, and H.B. Jenson, Editors. 2004, Saunders: Philadelphia, Pa. p. xlviii,
2618 p., [8] p. of plates.
7. Ford, E.S., et al., Self-reported asthma and health-related quality of life: findings from the
behavioral risk factor surveillance system. Chest, 2003. 123(1): p. 119-27.
8. Centers for Disease Control and Prevention (CDC), Behavioral Risk Factor Surveillance System
Survey Data, U.S. Department of Health and Human Services, Editor. 2003: Atlanta, GA.
9. Centers for Disease Control and Prevention (CDC), Behavioral Risk Factor Surveillance System
Survey Data, U.S. Department of Health and Human Services, Editor. 2004: Atlanta, GA.
10. Gold, D.R. and R. Wright, Population disparities in asthma. Annu Rev Public Health, 2005. 26: p.
89-113.
11. Carr, W., L. Zeitel, and K. Weiss, Variations in asthma hospitalizations and deaths in New York
City. Am J Public Health, 1992. 82(1): p. 59-65.
12. Gwynn, R.C., Risk factors for asthma in US adults: results from the 2000 Behavioral Risk Factor
Surveillance System. J Asthma, 2004. 41(1): p. 91-8.
38
13. Institute of Medicine (U.S.). Committee on the Assessment of Asthma and Indoor Air., Clearing
the air: asthma and indoor air exposures. 2000, Washington, D.C.: National Academy Press. xvi,
438 p.
14. Miller, J.E., The effects of race/ethnicity and income on early childhood asthma prevalence and
health care use. Am J Public Health, 2000. 90(3): p. 428-30.
15. U.S. Census Bureau. American Community Survey 2003 Data Profiles, Maricopa County, Arizona
2003 [cited 2005 December 15]; Available from:
http://www.census.gov/acs/www/Products/Profiles/Single/2003/ACS/AZ.htm.
16. Arizona Department of Health Services. Arizona Health Status and Vital Statistics, Chapter 10,
Population Denominators, Arizona, Table 10B-1. 2000 - 2004 [cited 2006 January 17].

Appendix Table 1: Demographics of Maricopa County, 2003
Maricopa County
Percent of Maricopa County Percent of U.S.
Total Population 3,444,478 282,909,885
Gender
Male Female
1,678,450 1,666,028
50.2% 49.8%
48.9% 51.1%
Age Groups
0 to 4 5 to 9 10 to 14 15 to 19 0 to 19 20 to 44 45 to 64 65 +
281,531 265,455 257,479 216,176
1,020,641 1,262,635
690,334 370,868
8.4% 7.9% 7.7% 6.5%
30.5% 37.8% 20.6% 11.1%
7.0% 7.0% 7.5% 6.7%
28.1% 35.9% 24.0% 12.0%
Race/Ethnicity
White Black or African American American Indian and Alaska Native Asian or Pacific Islander Other Hispanic*
2,103,494 122,453 54,172 86,960 38,008
939,391
62.9% 3.7% 1.6% 2.6% 1.1%
28.1%
67.8% 11.9% 0.7% 4.2% 1.6%
13.9%
Language spoken at home (5 years and over) 3,062,947 263,230,104
English Only Spanish Other
2,303,080 614,555 145,312
75.2% 20.1% 4.7%
81.6% 11.3% 7.1%
Employment Status (civilian labor force) 1,656,038 218,256,211
Civilian Labor Force Unemployed 120,315 7.3% 7.6%
Percentage below poverty level
Individuals 18 years and older 65 years and older Children under 18 years Families All families Married couple families Married couple families with related children under 5 Female householder families Female householder families with related children under 5
11.4% 6.0%
18.2%
9.6% 5.5% 9.6%
25.6% 45.5%
11.0% 9.8%
17.7%
9.8% 4.8% 6.2%
28.3% 46.5%
Households 1,232,841 108,419,506
Female Householder, no husband present 147,748 12.0% 12.6% Source: U.S. Census Bureau, American Community Survey 2003, Maricopa County and U.S. Estimates *Hispanic may be of any race. Single races are non-Hispanic. Other race includes non-Hispanic some other race alone and two or more races.