ASTER MINERAL INDEX PROCESSING USING ERDAS...
1
ASTER MINERAL INDEX PROCESSING USING ERDAS IMAGINE, ER MAPPER, PCI GEOMATICA and EXELIS ENVI ASTER MINERAL INDEX PROCESSING USING ERDAS IMAGINE, ER MAPPER, PCI GEOMATICA and EXELIS ENVI Venessa Bennett Venessa Bennett [email protected] [email protected] WORKFLOW WORKFLOW ASTER DATA ASTER DATA The ASTER sensor is an imaging instrument flown on the Terra satellite which was launched in December 1999. ASTER has been designed to acquire land surface temperature, emissivity, reflectance, and elevation data and is a cooperative effort between NASA and the JapaneseMinistry of Economy, Trade, and Industry (METI)*1. ASTER data consists of 14 data channels that cover ranges of visible, near infrared (VNIR), shortwave infrared (SWIR) and thermal infrared (TIR) regions of the electromagnetic spectrum. It provides higher spatial, spectral, and radiometric resolutions than traditional Landsat data (Gabr et al. 2010). Each ASTER scene covers an area of 60×60 km2. The VNIR bands have a spatial resolution of 15 m, the SWIR bands have a spatial resolution of 30m and the TIR bands have a spatial resolution of 90 m. The ASTER channels are more contiguous in the short wave infrared region than those of Landsat, yielding increased accuracy in the spectral identification of rocks and minerals (Gabr et al. 2010). Figure 3 provides a summary of band and wavelength information for the ASTER sensor. A variety of processed products are available for ASTER data and are outlined https://lpdaac.usgs.gov/ products/aster_products_table. ASTER level 1B products, that were used in this study represent registered radiance at the sensor product and as such contain radiometrically calibrated and geometrically co-registered data for the acquired channels*2. The Level-1B data set is produced by applying the radiometric calibration and geometric correction coefficients to the Level-1A *2. The images are georeferenced to the WGS 84 datum and Universal Transverse Mercator projection*1. A cloud-free Level 1B ortho-rectified ASTER scene was provided in three separate files based on wavelength grouping (VNIR, SWIR and TIR). For this study only the VNIR and SWIR datasets were used. The imagery was acquired on January 24, 2006 and was pre-processed by PhotoSat Inc. The assumption has been made that several key pre- processing steps, including an atmospheric correction to convert radiance to spectral reflectance has been performed on the data set used in this study. A schematic work flow of image processing procedures performed for this study is provided in Figure 4. The scene was subset to a smaller Area of Interest (AOI) encompassing the Erika Property of Tarsis Resources Ltd. Note that Crosstalk is an effect in ASTER imagery caused by signal leakage from band 4 into adjacent bands 5 and 9*3. A cross talk correction (not done is this study) can be applied to the data using a custom tool called ERSDAC Crosstalk 3. Necessary pre-processing of ASTER datasets prior to any band math calculations, includes (i) Resampling to (15 m or 30 m) to match the spatial resolution between the SWIR and VNIR, (ii) Radiance Calibration, (iii) Atmosphere Correction, (iv) Image area subsetting and (v) Vegetation Masking. All steps were conducted with the exception of vegetation masking. Upon review of the NDVI index map for the ASTER image (Fig. 5), only limited areas in the southeastern corner of the study area had any significant vegetation cover (i.e. NDVI >0.2). Vegetation cover during January in this part of Mexico is typically minimal and any addition to surface reflectance values due to dense vegetation is considered minimal. The pre-processed ASTER data for the AOI, then became the input data for the band ratio procedures carried out in this study in the four image processing software packages. IMAGE ANALYSIS – BAND RATIOS and INDICES Band ratio calculation is a technique in which one or more bands are divided by other bands in order to enhance spectral differences and assist in delineation of specified surface units. The band with the higher reflectance is assigned to the numerator and the band with diagnositic absorption trough is assigned to the denominator. In the case of kaolinite and alunite alteration minerals (Fig. 6; Rouskov et al. 2005), bands in which strong absorption occurs (5 and 6; denominator) are divided by bands with high reflectance (4; numerator). The resultant grey-scale image represents a relative band intensity image and areas within the image that appear bright are regions that represent the highest possibility for that specific mineral species to occur. The benefits of band ratio techniques include removal of topographic shading, suppression of albedo effects, and enhancement of relative colour differences (Rencz, 1999). To ensure optimal results from band ratio methods, the dataset must be corrected from system contributions or environmental signals that will add to the DN values measured (Rencz, 1999). Three band ratios were applied to the ASTER scene to test for the presence of Kaolinite, Alunite and Sericite. The band ratios used for the different mineral species include: ASTER BAND INFORMATION Figure 3: Aster/ Landsat Thermal mapper wavelength comparison INTRODUCTION INTRODUCTION Advanced Spaceborne Thermal Emission and Reflection Radiometer (ASTER) dataset have been routinely used for alteration mineral mapping since the launch of the NASA Terra Satellite in December 1999. ASTER datasets are attractive due to the cost, wide coverage and unique series of sensor bands that are sensitive to alteration assemblages commonly associated with mineral deposits. A host of image processing techniques have been developed to improve identification of various minerals, including band ratios, spectral indices, Principal Component Analysis (PCA), spectral matching to reference and custom libraries. The purpose of this study is to: Conduct band ratio calculation techniques on level 1B orthorectified ASTER data in four different image processing software programs, ER MAPPER, ERDAS Imagine 2014, PCI Geomatica and a trial version of Exelis ENVI Compare the workflows/cost and final products derived from image processing in each software suite. The data were provided by Tarsis Resources Ltd and covers a gold-silver prospect in SE Mexico, Guerrero State and have been projected to NAD83 UTM zone 14 N (Fig. 1). The focus of the band ratio and spectral index analysis will be to identify probable areas of Kaolinite, Alunite and Sericite. The greater spectral resolution of ASTER datasets, particularly in the shortwave infrared region, make it possible to identify surface occurrences of such alteration minerals. Several artisanal and commercial Kaolinite (Fig. 2) mines exist in the area of interest (AOI) and provide a coarse assessment of accuracy of the final kaolinite data products generated from band ratios. N N Maxela Coacoyula Coacoyula Maxela Kaolinite workings Kaolinite workings 1 1 2 2 Site location 1: Kaolinite working Site location 1: Kaolinite working Site location 2: Kaolinite working Site location 2: Kaolinite working KAOLINITE MINE WORKINGS LOCATION MAP Figure 1 Figure 2 ASTER DATA PROCESSING - GENERAL WORKFLOW RADIANCE CALIBRATION Rescaling of DN to Top of Atmosphere radiance. IMAGE ROTATION and ORTHORECTIFICATION Conversion of satellite orientation to ground spatial reference frame Projection to desired co-ordinate system NAD 83 UTM z14 DATA IMPORT Single band import and creation of three separate Multispectral layer stacks VNIR, SWIR, TIR CROSSTALK Correlation Stand alone open source software to correct for Signal leakage from band 4 into band 5 and band 9 Obtain ASTER data Free for US, Aust $80.0 per scene international Most typical - Level 1B Format - HDF ATMOSPHERIC CORRECTION/ DARK PIXEL CORRECTION 1. ATCOR correction to convert radiance to spectral reflectance or 2. Dark Pixel correction (min value in each dataset is subtracted from the data) PRE PROCESSING ALREADY COMPLETED BAND RATIO GENERATION Generation of of specific band ratios relevant to problem tobe analysed e.g. alteration mineral ID FINAL MAP PRODUCT Final map product for use in a variety of GIS platforms Masking different image components that will likely generate false analysis results due to mixing of spectral signatures MASKING (Vegetation, Cloud, Water) THRESHOLD DEVELOPMENT Creation of thresholds to identify high zones of high probability of alteration mineral occurrence THIS STUDY Figure 4 NDVI Figure 5: NDVI map for AOI; Values >0.2 vegetation Kaolinite Alunite Kaolinite Alunite Figure 6: Representative ASTER spectral reflectance signatures for Kaolinite and Alunite ( ) from - http://www.isprs.org /proceedings/XXXV/ congress/comm7/ papers/15.pdf Alunite (Advanced Argillic alteration): Band 4/ Band 5 Kaolinite (Intermediate Argillic alteration): Band 4/ Band 6 Sericite (Phyllic alteration): (Band 5 + Band 7)/band 6 ERDAS IMAGINE ERDAS IMAGINE ER MAPPER ER MAPPER GENERAL INFORMATION ER MAPPER represents part of the Hexagon Geospatial suite of software packages of which includes ERDAS Imagine. A single user license costs approximately $CAN5000 (commercial), and was designed initially to focus on needs of image processing for use in mineral exploration. ER Mapper is the least expensive of the four software suites examined and while capable of many of the core image processing tasks (mosaicking, image enhancements, DEM creation, classifications), it lacks some of the high end functionality available in more expensive remote sensing software packages. However, for less experienced users from non-remote sensing backgrounds (i.e. geologists), ER Mapper provides a series of customized wizards to streamline image processing tasks typically used (e.g. geophysics, ASTER processing, simple RADAR data processing). The Interface is appealing due to its' simplicity and intuitive menu structure (Fig. 7). Tasks are made more efficient by quick access menu buttons that activate common wizard tools. BAND RATIO PROCESSING ER Mapper has a specific ASTER Processing Wizard which displays, processes, models and compares different sets of ASTER imagery. The ASTER processing Wizard allows the user to identify individual bands that form the desired ratio (Fig. 8). An additional Wizard, The ASTER Mineral and Vegetation processing wizard, customizes the task a step further and allows the user to specify a particular mineral species they are seeking, rather than selection of band ratios (Fig. 9). Additionally, the tool automatically removes 0 value raster cells from the calculations to ensure there are no zero value denominators during band ratio processing. The drawback of this second wizard is that the band ratios are pre-defined and may not be the selection the user is most interested, as is the case in this study where kaolinite is to be targeting using a band 4 / band 6 ratio, however, the ER mapper automated wizard offers Band 7/ Band 5. Similarly, Alunite is to be mapped with band 4/ band 6, and ER Mapper automated wizard offers Alunite-kaolinite – pyrophyllite spectrum defined by (band 4 + Band 6)/ Band 5. In order to achieve the same band ratios as outlined in the Workflow section above, a combination of the two ASTER processing wizards was utilized. Masking was also not offered in the automated workflow and had to be completed prior to use in ER mapper. ER MAPPER INTERFACE with ASTER PROCESSING WIZARDS Figure 7 ASTER DATA PROCESSING WIZARD - BAND RATIOS Figure 8 ASTER MINERAL & VEGETATION WIZARD Figure 9 After selecting the appropriate bands in ASTER Wizard 1 and Wizard 2, the results are output initially to a temporary blue-red colour ramp image. Each dataset is then permanently saved for final processing and threshold derivation of the data for interpretative purposes. OUTPUT RESULTS Three maps presented in Figure 10 illustrate the distribution of possible occurrences of Kaolinite, Alunite and Sericite for the subset area in Guerrero State, Mexico. The maps have a threshold applied to the data to delineate only those areas representing the highest probability that the mineral of interest may occur at any given location. ER Mapper ASTER band ratio results are rescaled from a floating point value to a 0 – 255 range. The statistical distribution of each dataset was reviewed and the highest 1 % of the dataset were retained for final map output. A comparison of the highest probability occurrences of Kaolinite as mapped by band ratios from the ASTER imagery with known locations of Kaolinite mine workings in the area north of the town of Coacoyula is partly dependent on timing of ASTER data acquisition. A review of Google Earth indicates that at the time the ASTER data was acquired (Jan 24, 2006) the two large Kaolinite mines to the NW of the town were not yet in operation are were characterized by significant vegetation cover. The main kaolinite workings in 2006 were immediately north of the town of Coacoyula and the kaolinite band ratios defined by ER Mapper identify this zone with reasonable accuracy. blue - outline of kaolinite mine red - predicted Kaolinite GENERAL INFORMATION BAND RATIO PROCESSING ER Mapper ALUNITE ER Mapper KAOLINITE ER Mapper SERICITE Figure 10 ERDAS IMAGINE is the second in the suite of software packages from Hexagon Geospatial Inc. evaluated for carrying out ASTER Band ratio calculations. A commercial single use license is in excess of $CAN10 000, however the software offers greatly expanded functionality compared to ER Mapper. It allows processing of most raw image formats and provides various higher end analysis tools (e.g. hyperspectral analysis, photogrammetry, radar interferometry and stereo analyst). Image processing specialists from many different disciplines and remote sensing analysts are the target audience for the ERDAS Imagine. The user interface (Fig. 11) consists of a series of menus with ribbons with ribbons to activate the processing tools. Navigation through the ribbon is somewhat cumbersome, however a search tool is provided to quickly access tools. Erdas Imagine also has inbuilt compatibility for ArcGIS. The band ratio calculations were more involved than the automated functions in ER Mapper as custom spatial models had to be built for each desired ratio (other than the kaolinite model). ERDAS IMAGINE 2014 - Interface Figure 11 ASTER data processing in ERDAS Imagine is not a wizard-driven focus. The user must be familiar with the relevant tools and be able to generate custom spatial models to create the desired band ratios. A general set of band indices models are available within the Indices tool (Fig. 12), which while providing a list of indices and band ratios to choose from is by no means exhaustive. To access the spatial model information, the model must be reviewed to see what processing is carried out on the data (Fig. 13). The clay index illustrated in Figure 13, represents a ratio of band 4 to band 6 and thus represents the ratio used for kaolinite in this study. Similar spatial models were built using the spatial modeler tool for both alunite and sericite. Conditional logic is applied in the model to remove zero values (Figs. 14-15). INDICES TOOL - ASTER CLAY Figure 12 CLAY SPATIAL MODEL - PRE BUILT (Kaolinite) Figure 13 ALUNITE BAND RATIO SPATIAL MODEL Figure 13 Figure 14 SERICITE BAND RATIO SPATIAL MODEL OUTPUT RESULTS Once the models were run, the data were output as floating point data to an .img file. The files were imported into ArcGIS 10.2.2 and conditional statements were applied to extract cells exceeding specific thresholds for each mineral(Fig. 15). Similar to ER Mapper, the Kaolinite band ratio identifies the known kaolinite mines that were operating during the time of ASTER data acquisition. In the case of sericite, the band ratios mostly correspond with water bodies and vegetation, rather than known ground occurrences. ERDAS ALUNITE ERDAS KAOLINITE ERDAS SERICITE Figure 15 Yellow - outline of kaolinite mine red - predicted Kaolinite PCI GEOMATICA PCI GEOMATICA EXELIS ENVI EXELIS ENVI GENERAL INFORMATION GENERAL INFORMATION PCI Geomatica is a third high-end image processing software suite developed in Canada. Similar to ERDAS Imagine, a single commercial license is in excess of $CAN 10000. Various add-in modules to the program increase functionality so that it competes with ERDAS Imagine. PCI Geomatica has inbuilt into the core software the ability to perform atmospheric corrections using the ATCOR series of algorithms, a capacity that is not available in the standard ERDAS Imagine suite (extra add an). The User-interface is a lot simpler than ERDAS Imagine, consisting of a main access toolbar and a workspace (focus) screen (Fig. 16). As a main competitor with ERDAS Imagine, PCI Geomatica is targeting the same market, image processing specialists and remote sensing analysts. The software is geared towards more user interaction through the EASI scripting environment and is considerably less button driven than ERDAS Imagine. PCI GEOMATICS 2014 - Interface Figure 16 BAND RATIO PROCESSING Band ratio calculations of ASTER data can be carried out in several ways in PCI Geomatica. The simplest is to use the raster calculator tool (Fig. 17), which is adequate zero values are removed before performing the calculations. The second tool involves the use of the Ratio Transformation algorithm (Fig. 18), which provides more user input with respect to input and output parameters. A mask area can be defined and conditions can be set with regards to dealing with zero values. A combination of both the raster calculator and the RTR algorithm was used to create the final three band ratios. Band ratio calculations were easier to perform in PCI geomatica due to not have to build custom spatial models and still allowing the capability to handle zero values in the denominator. OUTPUT RESULTS Once the models were run, the data were output as floating point data to an .img file. The files were imported into ArcGIS 10.2.2 and conditional statements were applied to extract cells exceeding specific thresholds for each mineral. The final map results are identicalto those produced from ERDAS imaging and thusare not presented. The coincidence of high probability kaolinite occurrence with known kaolinite mines north of Coacoyula are presented in Figure 19. RASTER CALCULATOR Figure 17 RATIO TRANSFORMATION TOOL Figure 18 KAOLINITE MINES vs. PREDICTED KAOLINITE OCCURRENCES Kaolinite Mine Kaolinite Mine A trial version of Exelis ENVI was acquired to evaluate software functionality. ENVI was originally designed to process and analyse hyperspectral datasets but has evolve to become a high end image processing and analysis software suite. A single-user commercial license is also in well in excess of $CAN 10 000. The software offers several add-ons, including modules for LiDAR and RADAR data processing. In addition to private image processing and analysis companies, the target market for ENVI products also includes the military. Similar to Erdas Imagine, the ENVI software suite have built in compatibility with ArcGIS products. The ENVI interface is similar in appearance to the ArcGIS 10.2 and above interface (Fig. 20). A signifcant drawcard of this software is the searchable toolbox (similar to ArcGIS), that allows rapid searching of required tools EXELIS ENVI - Interface Figure 20 BAND RATIO PROCESSING Band ratio calculations of ASTER data can be carried out using two specific tools in EXELIS ENVI that are used for both simple and complicated raster calculations, Band Ratio (Fig. 21) and Band Math tools (Fig. 22). Both were used to generate the three band ratios for kaolinite, alunite and sericite. The Band math tool allows a series of conditional statements to be written, that can result in a series of different tasks to be included in one statement (for example vegetation, water masking, band ratioing and final threshold definition). A true/false result is converted into binary format, 1 for true and 0 for false. BAND MATH TOOL BAND RATIO TOOL OUTPUT RESULTS Upon calculation of band ratios for sericite, kaolinite and alunite, the data were imported to ArcGIS 10.2.2 and the same thresholding process that was used for the ERDAS and PCI products were applied to the ENVI products. The final output maps are identical to those presented in Figure 15 and are therefore not displayed again. Figure 21 Figure 22 dataset have been routinely used for since the launch of the NASA Terra Satellite in December 1999. ASTER datasets are attractive due to the cost, wide coverage and unique series of sensor bands that are commonly associated with mineral deposits. A host of image processing techniques have been developed to improve identification of various minerals, including band ratios, spectral indices, Principal Component Analysis (PCA), spectral matching to reference and custom libraries. Advanced Spaceborne Thermal Emission and Reflection Radiometer (ASTER) alteration mineral mapping sensitive to alteration assemblages The is to: purpose of this study Conduct on level 1B orthorectified ASTER data in four different image processing software programs, ER MAPPER, ERDAS Imagine 2014, PCI Geomatica and a trial version of Exelis ENVI band ratio calculation techniques Compare the workflows/cost and final products derived from image processing in each software suite. The data were provided by and covers a gold-silver prospect in SE Mexico, Guerrero State and have been projected to NAD83 UTM zone 14 N ( ). The focus of the band ratio and spectral index analysis will be to . The greater spectral resolution of ASTER datasets, particularly in the shortwave infrared region, make it possible to identify surface occurrences of such alteration minerals. Several ( ) mines exist in the area of interest (AOI) and provide a coarse of the final kaolinite data products generated from band ratios. Tarsis Resources Ltd Fig. 1 identify probable areas of Kaolinite, Alunite and Sericite assessment of accuracy artisanal and commercial Kaolinite Fig. 2 Figure 19 This project is a student project and was completed for education purposes. The poster should not be reproduced or distributed in any format. This project is a student project and was completed for education purposes. The poster should not be reproduced or distributed in any format. DISCLAIMER DISCLAIMER REFERENCES REFERENCES *1 http://www.yale.edu/ceo/Documentation/ASTER.pdf *2 https://lpdaac.usgs.gov/products/aster_products_table/ast_l1b *3 http://www.ga.gov.au/webtemp/image_cache/GA7833.pdf - ASTER Mineral Index Processing Manual Rencz, A.N (editor) 1999. Manual of Remote Sensing, Vol. 3: Remote Sensing for the Earth Sciences. Wiley, 202 pp. Gabr, S., Ghulam, A., and Kusky., T. 2010. Detecting Areas of high-potential gold mineralization using ASTER data. Ore Geology Reviews 38: 56 -69. Rouskov, K., Popov, K., Stoykov., S. and Yamaguchi., Y. 2005. Some Applications of the Remote Sensing in Geology by using ASTER Images. Retrieved http://www.space.bas.bg/sens/Ses2005/r5.pdf *1 http://www.yale.edu/ceo/Documentation/ASTER.pdf *2 https://lpdaac.usgs.gov/products/aster_products_table/ast_l1b *3 http://www.ga.gov.au/webtemp/image_cache/GA7833.pdf - ASTER Mineral Index Processing Manual Rencz, A.N (editor) 1999. Manual of Remote Sensing, Vol. 3: Remote Sensing for the Earth Sciences. Wiley, 202 pp. Gabr, S., Ghulam, A., and Kusky., T. 2010. Detecting Areas of high-potential gold mineralization using ASTER data. Ore Geology Reviews 38: 56 -69. Rouskov, K., Popov, K., Stoykov., S. and Yamaguchi., Y. 2005. Some Applications of the Remote Sensing in Geology by using ASTER Images. Retrieved http://www.space.bas.bg/sens/Ses2005/r5.pdf The ASTER sensor is an imaging instrument flown on the Terra satellite which was launched in December 1999. ASTER has been designed to acquire , and is a cooperative effort between NASA and the JapaneseMinistry of Economy, Trade, and Industry (METI)*1. land surface temperature emissivity, reflectance, and elevation data ASTER data consists of that cover ranges of visible, near infrared (VNIR), shortwave infrared (SWIR) and thermal infrared (TIR) regions of the electromagnetic spectrum. (Gabr et al. 2010). Each ASTER scene covers an area of 60×60 km2. The VNIR bands have a spatial resolution of 15 m, the SWIR bands have a spatial resolution of 30m and the TIR bands have a spatial resolution of 90 m. The ASTER channels are more contiguous in the short wave infrared region than those of Landsat, yielding increased accuracy in the spectral identification of rocks and minerals (Gabr et al. 2010). provides a summary of band and wavelength information for the ASTER sensor. 14 data channels It provides higher spatial, spectral, and radiometric resolutions than traditional Landsat data Figure 3 A variety of processed products are available for ASTER data and are outlined https://lpdaac.usgs.gov/ products/aster_products_table. , that were used in this study represent registered radiance at the sensor product and as such contain radiometrically calibrated and geometrically co-registered data for the acquired channels*2. The *2. The images are georeferenced to the WGS 84 datum and Universal Transverse Mercator projection*1. ASTER level 1B products Level-1B data set is produced by applying the radiometric calibration and geometric correction coefficients to the Level-1A A cloud-free was provided in three separate files based on wavelength grouping ( ). For this study only the VNIR and SWIR datasets were used. The imagery was acquired on January 24, 2006 and was pre-processed by PhotoSat Inc. has been performed on the data set used in this study. A schematic work flow of image processing procedures performed for this study is provided in The scene was subset to a smaller Area of Interest (AOI) encompassing the of Tarsis Resources Ltd. Note that Crosstalk is an effect in ASTER imagery caused by signal leakage from band 4 into adjacent bands 5 and 9*3. A cross talk correction (not done is this study) can be applied to the data using a custom tool called ERSDAC Crosstalk 3. Level 1B ortho-rectified ASTER scene VNIR, SWIR and TIR Erika Property The assumption has been made that several key pre- processing steps, including an atmospheric correction to convert radiance to spectral reflectance Figure 4. DATA PREPARATION DATA PREPARATION Necessary datasets prior to any band math calculations, includes (i) to (15 m or 30 m) to match the spatial resolution between the SWIR and VNIR, (ii) , (iii) , (iv) Image area and (v) . All steps were conducted with the exception of vegetation masking. Upon review of the NDVI index map for the ASTER image ( ), only limited areas in the southeastern corner of the study area had any significant vegetation cover (i.e. ). Vegetation cover during January in this part of Mexico is typically minimal and any addition to surface reflectance values due to dense vegetation is considered minimal. The for the AOI, then became the procedures carried out in this study in the four image processing software packages. pre-processing of ASTER NDVI >0.2 pre-processed ASTER data Resampling Atmosphere Correction Vegetation Masking input data for the band ratio Radiance Calibration subsetting Fig. 5 IMAGE ANALYSIS – BAND RATIOS and INDICES is a technique in which in order to enhance spectral differences and assist in delineation of specified surface units. The band with the is assigned to the and the band with trough is assigned to the . In the case of kaolinite and alunite alteration minerals ( ; Rouskov et al. 2005), bands in which strong absorption occurs (5 and 6; denominator) are divided by bands with high reflectance (4; numerator). The resultant grey-scale image represents a relative band intensity image and areas within the image that are regions that represent the highest . The benefits of band ratio techniques include removal of topographic shading, suppression of albedo effects, and enhancement of relative colour differences (Rencz, 1999). To ensure optimal results from band ratio methods, the dataset must be corrected from system contributions or environmental signals that will add to the DN values measured (Rencz, 1999). Band ratio calculation one or more bands are divided by other bands possibility for that specific mineral species to occur higher reflectance numerator appear bright diagnositic absorption denominator Fig. 6 Three band ratios were applied to the ASTER scene to test for the presence of Kaolinite, Alunite and Sericite. The band ratios used for the different mineral species include: Alunite Band 4/ Band 5 (Advanced Argillic alteration): Kaolinite Band 4/ Band 6 (Intermediate Argillic alteration): Sericite (Band 5 + Band 7)/band 6 (Phyllic alteration): GENERAL INFORMATION represents part of the Hexagon Geospatial suite of software packages of which includes ERDAS Imagine. A single user license costs approximately $CAN5000 (commercial), and was designed initially to focus on needs of image processing for use in mineral exploration. ER Mapper is the least expensive of the four software suites examined and while capable of many of the core image processing tasks (mosaicking, image enhancements, DEM creation, classifications), it lacks some of the high end functionality available in more expensive remote sensing software packages. However, for less experienced users from non-remote sensing backgrounds (i.e. geologists), ER Mapper provides a series of image processing tasks typically used (e.g. geophysics, ASTER processing, simple RADAR data processing). The Interface is appealing due to its' simplicity and intuitive menu structure ( ). Tasks are made more efficient by quick access menu buttons that activate common wizard tools. ER MAPPER customized wizards to streamline Fig. 7 BAND RATIO PROCESSING ER Mapper has a specific which displays, processes, models and compares different sets of ASTER imagery. The ASTER processing Wizard allows the user to identify individual bands that form the desired ratio ( ). ASTER Processing Wizard Fig. 8 GENERAL INFORMATION BAND RATIO PROCESSING is the second in the suite of software packages from Hexagon Geospatial Inc. evaluated for carrying out ASTER Band ratio calculations. A commercial single use license is in excess of $CAN10 000, however the software offers greatly expanded functionality compared to ER Mapper. It allows processing of most raw image formats and provides various higher end analysis tools (e.g. hyperspectral analysis, photogrammetry, radar interferometry and stereo analyst). Image processing specialists from many different disciplines and remote sensing analysts are the target audience for the ERDAS Imagine. The user interface ( ) consists of a series of menus with ribbons with ribbons to activate the processing tools. Navigation through the ribbon is somewhat cumbersome, however a search tool is provided to quickly access tools. Erdas Imagine also has inbuilt compatibility for ArcGIS. The band ratio calculations were more involved than the automated functions in ER Mapper as custom spatial models had to be built for each desired ratio (other than the kaolinite model). ERDAS IMAGINE Fig. 11 ASTER data processing in ERDAS Imagine is not a wizard-driven focus. The user must be familiar with the relevant tools and be able to generate custom spatial models to create the desired band ratios. A general set of band indices models are available within the Indices tool ( ), which while providing a list of indices and band ratios to choose from is by no means exhaustive. To access the , the model must be reviewed to see what processing is carried out on the data ( ). The clay index illustrated in , represents a ratio of band 4 to band 6 and thus represents the ratio used for kaolinite in this study. . Conditional logic is applied in the model to remove zero values ( ). Fig. 12 Fig. 13 Figure 13 Figs. 14-15 spatial model information Similar spatial models were built using the spatial modeler tool for both alunite and sericite An additional Wizard, , customizes the task a step further and allows the user to specify a particular mineral species they are seeking, rather than selection of band ratios ( ). Additionally, the tool automatically removes 0 value raster cells from the calculations to ensure there are no zero value denominators during band ratio processing. The drawback of this second wizard is that the band ratios are pre-defined and may not be the selection the user is most interested, as is the case in this study where kaolinite is to be targeting using a band 4 / band 6 ratio, however, the ER mapper automated wizard offers Band 7/ Band 5. Similarly, Alunite is to be mapped with band 4/ band 6, and ER Mapper automated wizard offers Alunite-kaolinite – pyrophyllite spectrum defined by (band 4 + Band 6)/ Band 5. In order to achieve the same band ratios as outlined in the Workflow section above, a . Masking was also not offered in the automated workflow and had to be completed prior to use in ER mapper. The ASTER Mineral and Vegetation processing wizard Fig. 9 combination of the two ASTER processing wizards was utilized After selecting the appropriate bands in ASTER Wizard 1 and Wizard 2, the results are output initially to a temporary blue-red colour ramp image. Each dataset is then permanently saved for final processing and threshold derivation of the data for interpretative purposes. OUTPUT RESULTS Three maps presented in illustrate the distribution of for the subset area in Guerrero State, Mexico. The maps have a threshold applied to the data to delineate only those areas representing the highest probability that the mineral of interest may occur at any given location. ER Mapper ASTER band ratio results are rescaled from a floating point value to a 0 – 255 range. The statistical distribution of each dataset was reviewed and the highest 1 % of the dataset were retained for final map output. Figure 10 possible occurrences of Kaolinite, Alunite and Sericite A comparison of the as mapped by band ratios from the ASTER imagery with in the area north of the town of Coacoyula is partly dependent on timing of ASTER data acquisition. A review of Google Earth indicates that at the time the ASTER data was acquired (Jan 24, 2006) the two large Kaolinite mines to the NW of the town were not yet in operation are were characterized by significant vegetation cover. The main kaolinite workings in 2006 were immediately north of the town of Coacoyula and the kaolinite band ratios defined by ER Mapper identify this zone with reasonable accuracy. highest probability occurrences of Kaolinite known locations of Kaolinite mine workings OUTPUT RESULTS Once the models were run, the data were output as floating point data to an .img file. The files were imported into ArcGIS 10.2.2 and conditional statements were applied to extract cells exceeding specific thresholds for each mineral( ). Similar to ER Mapper, the . In the case of sericite, the band ratios mostly correspond with water bodies and vegetation, rather than known ground occurrences. Fig. 15 Kaolinite band ratio identifies the known kaolinite mines that were operating during the time of ASTER data acquisition GENERAL INFORMATION GENERAL INFORMATION is a third high-end image processing software suite developed in Canada. Similar to ERDAS Imagine, a single commercial license is in excess of $CAN 10000. Various add-in modules to the program increase functionality so that it competes with ERDAS Imagine. PCI Geomatica has inbuilt into the core software the ability to perform atmospheric corrections using the ATCOR series of algorithms, a capacity that is not available in the standard ERDAS Imagine suite (extra add an). The User-interface is a lot simpler than ERDAS Imagine, consisting of a main access toolbar and a workspace (focus) screen ( ). As a main competitor with ERDAS Imagine, PCI Geomatica is targeting the same market, image processing specialists and remote sensing analysts. The software is geared towards more user interaction through the EASI scripting environment and is considerably less button driven than ERDAS Imagine. PCI Geomatica Fig. 16 BAND RATIO PROCESSING Band ratio calculations of ASTER data can be carried out in several ways in PCI Geomatica. The simplest is to use the ( ), which is adequate zero values are removed before performing the calculations. The second tool involves the use of the ( ), which provides more user input with respect to input and output parameters. A mask area can be defined and conditions can be set with regards to dealing with zero values. A combination of both the raster calculator and the RTR algorithm was used to create the final three band ratios. Band ratio calculations were easier to perform in PCI geomatica due to not have to build custom spatial models and still allowing the capability to handle zero values in the denominator. raster calculator tool Fig. 17 Fig. 18 Ratio Transformation algorithm OUTPUT RESULTS Once the models were run, the data were output as floating point data to an .img file. The files were imported into ArcGIS 10.2.2 and conditional statements were applied to extract cells exceeding specific thresholds for each mineral. The final map results are identicalto those produced from ERDAS imaging and thusare not presented. The coincidence of high probability kaolinite occurrence with known kaolinite mines north of Coacoyula are presented in . Figure 19 A trial version of was acquired to evaluate software functionality. ENVI was originally designed to process and analyse hyperspectral datasets but has evolve to become a high end image processing and analysis software suite. A single-user commercial license is also in well in excess of $CAN 10 000. The software offers several add-ons, including modules for LiDAR and RADAR data processing. In addition to private image processing and analysis companies, the target market for ENVI products also includes the military. Similar to Erdas Imagine, the ENVI software suite have built in compatibility with ArcGIS products. The ENVI interface is similar in appearance to the ArcGIS 10.2 and above interface ( ). A signifcant drawcard of this software is the searchable toolbox (similar to ArcGIS), that allows rapid searching of required tools Exelis ENVI Fig. 20 BAND RATIO PROCESSING Band ratio calculations of ASTER data can be carried out using two specific tools in EXELIS ENVI that are used for both simple and complicated raster calculations, ( ) and ( ). Both were used to generate the three band ratios for kaolinite, alunite and sericite. The Band math tool allows a to be written, that can result in a series of different tasks to be included in one statement (for example vegetation, water masking, band ratioing and final threshold definition). A true/false result is converted into binary format, 1 for true and 0 for false. Band Ratio Band Math tools Fig. 21 Fig. 22 series of conditional statements OUTPUT RESULTS Upon calculation of band ratios for sericite, kaolinite and alunite, the data were imported to ArcGIS 10.2.2 and the same thresholding process that was used for the ERDAS and PCI products were applied to the ENVI products. The final output maps are identical to those presented in and are therefore not displayed again. Figure 15 Despite the uncertainty of the thoroughness of the pre-processing procedures completed by PhotoSat Inc. and the lack of any masking procedures, the ASTER band ratios exhibit some important results. The coincidence of high probability kaolinite and alunite occurrences derived from the ASTER dataset with known active kaolinite mines within the AOI indicates the band ratio technique is successful in detected highly anomalous surface zones of kaolinite and alunite. If only the highest threshold values are considered, several anomalous areas can be identified from the dataset. Figure 23 illustrates 3-4 coincident kaolinite-alunite anomalies that are worthy of further scrutiny as they are associated with highly favourable geological features consistent with sediment-hosted gold mineralization. Ground truthing of the preliminary results would be the only way to validate the datasets. The sericite band ratio was not useful for ground targeting purposes as the final output results coincided with water and vegetation, which were not masked prior to data processing. gold-in-soil anomaly gold-in-soil anomaly gold-in-soil anomaly gold-in-soil anomaly Figure 23 ASTER ANOMALIES ASTER + GEOLOGICAL MAP The four image processing software packages all produce very similar results for the three simple band ratios examined in this study. ER Mapper is the simplest and most automated of the four, and ENVI provides the most straightforward method to conduct more complicated raster calculations. ERDAS Imagine provides the option of spatial model generation as opposed to scripted models, although these were more time-consuming to create than the pre-built band ratio tools in PCI Geomatica and Exelis ENVI. ER Mapper produced a 0-255 scaled output whereas the other three provided an option for floating point outputs. Despite the uncertainty of the thoroughness of the pre-processing procedures completed by PhotoSat Inc. and the lack of any masking procedures, the ASTER band ratios exhibit some important results. The derived from the ASTER dataset within the AOI indicates the band ratio technique is successful in detected highly anomalous surface zones of kaolinite and alunite. If only the highest threshold values are considered, several anomalous areas can be identified from the dataset. illustrates 3-4 coincident kaolinite-alunite anomalies that are worthy of further scrutiny as they are associated with highly favourable geological features consistent with sediment-hosted gold mineralization. Ground truthing of the preliminary results would be the only way to validate the datasets. coincidence of high probability kaolinite and alunite occurrences with known active kaolinite mines Figure 23 The sericite band ratio was not useful for ground targeting purposes as the final output results coincided with water and vegetation, which were not masked prior to data processing. The four image processing software packages for the three simple band ratios examined in this study. ER Mapper is the simplest and most automated of the four, and ENVI provides the most straightforward method to conduct more complicated raster calculations. ERDAS Imagine provides the option of spatial model generation as opposed to scripted models, although these were more time-consuming to create than the pre-built band ratio tools in PCI Geomatica and Exelis ENVI. ER Mapper produced a 0-255 scaled output whereas the other three provided an option for floating point outputs. all produce very similar results DISCUSSION DISCUSSION N N N N N N N N N N N N N N N N N N N N N N N N N N # # # #
Transcript of ASTER MINERAL INDEX PROCESSING USING ERDAS...
ASTER MINERAL INDEX PROCESSING USING ERDAS IMAGINE, ER MAPPER, PCI GEOMATICA and EXELIS ENVIASTER MINERAL INDEX PROCESSING USING ERDAS IMAGINE, ER MAPPER, PCI GEOMATICA and EXELIS ENVI Venessa BennettVenessa Bennett [email protected]@nscc.ca
WORKFLOWWORKFLOW
ASTER DATAASTER DATA
The ASTER sensor is an imaging instrument flown on the Terra satellite which was launched in December 1999. ASTER has been designed to acquire land surface temperature, emissivity, reflectance, and elevation data and is a cooperative effort between NASA and the JapaneseMinistry of Economy, Trade, and Industry (METI)*1.
ASTER data consists of 14 data channels that cover ranges of visible, near infrared (VNIR), shortwave infrared (SWIR) and thermal infrared (TIR) regions of the electromagnetic spectrum. It provides higher spatial, spectral, and radiometric resolutions than traditional Landsat data (Gabr et al. 2010). Each ASTER scene covers an area of 60×60 km2. The VNIR bands have a spatial resolution of 15 m, the SWIR bands have a spatial resolution of 30m and the TIR bands have a spatial resolution of 90 m. The ASTER channels are more contiguous in the short wave infrared region than those of Landsat, yielding increased accuracy in the spectral identification of rocks and minerals (Gabr et al. 2010). Figure 3 provides a summary of band and wavelength information for the ASTER sensor.
A variety of processed products are available for ASTER data and are outlined https://lpdaac.usgs.gov/products/aster_products_table. ASTER level 1B products, that were used in this study represent registered radiance at the sensor product and as such contain radiometrically calibrated and geometrically co-registered data for the acquired channels*2. The Level-1B data set is produced by applying the radiometric calibration and geometric correction coefficients to the Level-1A *2. The images are georeferenced to the WGS 84 datum and Universal Transverse Mercator projection*1.
A cloud-free Level 1B ortho-rectified ASTER scene was provided in three separate files based on wavelength grouping (VNIR, SWIR and TIR). For this study only the VNIR and SWIR datasets were used. The imagery was acquired on January 24, 2006 and was pre-processed by PhotoSat Inc. The assumption has been made that several key pre-processing steps, including an atmospheric correction to convert radiance to spectral reflectance has been performed on the data set used in this study. A schematic work flow of image processing procedures performed for this study is provided in Figure 4. The scene was subset to a smaller Area of Interest (AOI) encompassing the Erika Property of Tarsis Resources Ltd. Note that Crosstalk is an effect in ASTER imagery caused by signal leakage from band 4 into adjacent bands 5 and 9*3. A cross talk correction (not done is this study) can be applied to the data using a custom tool called ERSDAC Crosstalk 3.
Necessary pre-processing of ASTER datasets prior to any band math calculations, includes (i) Resampling to (15 m or 30 m) to match the spatial resolution between the SWIR and VNIR, (ii) Radiance Calibration, (iii) Atmosphere Correction, (iv) Image area subsetting and (v) Vegetation Masking. All steps were conducted with the exception of vegetation masking. Upon review of the NDVI index map for the ASTER image (Fig. 5), only limited areas in the southeastern corner of the study area had any significant vegetation cover (i.e. NDVI >0.2). Vegetation cover during January in this part of Mexico is typically minimal and any addition to surface reflectance values due to dense vegetation is considered minimal. The pre-processed ASTER data for the AOI, then became the input data for the band ratio procedures carried out in this study in the four image processing software packages.
IMAGE ANALYSIS – BAND RATIOS and INDICES Band ratio calculation is a technique in which one or more bands are divided by other bands in order to enhance spectral differences and assist in delineation of specified surface units. The band with the higher reflectance is assigned to the numerator and the band with diagnositic absorption trough is assigned to the denominator. In the case of kaolinite and alunite alteration minerals (Fig. 6; Rouskov et al. 2005), bands in which strong absorption occurs (5 and 6; denominator) are divided by bands with high reflectance (4; numerator). The resultant grey-scale image represents a relative band intensity image and areas within the image that appear bright are regions that represent the highest possibility for that specific mineral species to occur. The benefits of band ratio techniques include removal of topographic shading, suppression of albedo effects, and enhancement of relative colour differences (Rencz, 1999). To ensure optimal results from band ratio methods, the dataset must be corrected from system contributions or environmental signals that will add to the DN values measured (Rencz, 1999).
Three band ratios were applied to the ASTER scene to test for the presence of Kaolinite, Alunite and Sericite. The band ratios used for the different mineral species include:
ASTER BAND INFORMATION
Figure 3: Aster/ Landsat Thermal mapper
wavelength comparison
INTRODUCTIONINTRODUCTION
Advanced Spaceborne Thermal Emission and Reflection Radiometer (ASTER) dataset have been routinely used for alteration mineral mapping since the launch of the NASA Terra Satellite in December 1999. ASTER datasets are attractive due to the cost, wide coverage and unique series of sensor bands that are sensitive to alteration assemblages commonly associated with mineral deposits. A host of image processing techniques have been developed to improve identification of various minerals, including band ratios, spectral indices, Principal Component Analysis (PCA), spectral matching to reference and custom libraries.
The purpose of this study is to:
Conduct band ratio calculation techniques on level 1B orthorectified ASTER data in four different image processing software programs, ER MAPPER, ERDAS Imagine 2014, PCI Geomatica and a trial version of Exelis ENVI
Compare the workflows/cost and final products derived from image processing in each software suite.
The data were provided by Tarsis Resources Ltd and covers a gold-silver prospect in SE Mexico,
Guerrero State and have been projected to NAD83 UTM zone 14 N (Fig. 1). The focus of the band ratio and spectral index analysis will be to identify probable
areas of Kaolinite, Alunite and Sericite. The greater spectral resolution of ASTER datasets,
particularly in the shortwave infrared region, make it possible to identify surface occurrences of such
alteration minerals. Several artisanal and commercial Kaolinite (Fig. 2) mines exist in the area of interest
(AOI) and provide a coarse assessment of accuracy of the final kaolinite data products generated from band ratios.
NN
Maxela
CoacoyulaCoacoyula
Maxela
KaoliniteworkingsKaoliniteworkings
1122
Site location 1: Kaolinite working
Site location 1: Kaolinite working
Site location 2: Kaolinite working
Site location 2: Kaolinite working
KAOLINITE MINE WORKINGSLOCATION MAP
Figure 1 Figure 2
ASTER DATA PROCESSING - GENERAL WORKFLOW
RADIANCECALIBRATION
Rescaling ofDN to Top of
Atmosphere radiance.
IMAGE ROTATIONand
ORTHORECTIFICATION
Conversion ofsatellite orientation
to ground spatial reference
frame
Projection to desiredco-ordinate system
NAD 83 UTM z14
DATA IMPORT
Single band importand creation ofthree separate
Multispectral layerstacks
VNIR, SWIR, TIR
CROSSTALKCorrelation
Stand alone opensource software
to correct for Signal leakage fromband 4 into band 5
and band 9
ObtainASTER data
Free forUS, Aust
$80.0 per sceneinternational
Most typical -Level 1B
Format - HDF
ATMOSPHERICCORRECTION/
DARK PIXELCORRECTION
1. ATCOR correctionto convert radiance
to spectral reflectance
or2. Dark Pixel correction
(min value in each datasetis subtracted from the
data)
PRE PROCESSING ALREADY COMPLETED
BANDRATIO
GENERATION
Generation ofof specific band
ratios relevant to problem tobe
analysede.g. alteration
mineral ID
FINAL MAP PRODUCT
Final map product for use in a
variety of GIS platforms
Masking differentimage components that
will likely generatefalse analysis results
due to mixing of spectralsignatures
MASKING(Vegetation,
Cloud, Water)THRESHOLD
DEVELOPMENT
Creation of thresholdsto identify high
zones of high probabilityof alteration mineral
occurrence
THIS STUDY
Figure 4
NDVI
Figure 5: NDVI map for AOI; Values >0.2 vegetation
Kaolinite
Alunite
Kaolinite
Alunite
Figure 6: RepresentativeASTER spectral
reflectance signatures forKaolinite andAlunite (
)
from -http://www.isprs.org/proceedings/XXXV/congress/comm7/
papers/15.pdf
Alunite (Advanced Argillic alteration): Band 4/ Band 5
Kaolinite (Intermediate Argillic alteration): Band 4/ Band 6
Sericite (Phyllic alteration): (Band 5 + Band 7)/band 6
ERDAS IMAGINEERDAS IMAGINEER MAPPERER MAPPER
GENERAL INFORMATION ER MAPPER represents part of the Hexagon Geospatial suite of software packages of which includes ERDAS Imagine. A single user license costs approximately $CAN5000 (commercial), and was designed initially to focus on needs of image processing for use in mineral exploration. ER Mapper is the least expensive of the four software suites examined and while capable of many of the core image processing tasks (mosaicking, image enhancements, DEM creation, classifications), it lacks some of the high end functionality available in more expensive remote sensing software packages. However, for less experienced users from non-remote sensing backgrounds (i.e. geologists), ER Mapper provides a series of customized wizards to streamline image processing tasks typically used (e.g. geophysics, ASTER processing, simple RADAR data processing). The Interface is appealing due to its' simplicity and intuitive menu structure (Fig. 7). Tasks are made more efficient by quick access menu buttons that activate common wizard tools.
BAND RATIO PROCESSING ER Mapper has a specific ASTER Processing Wizard which displays, processes, models and compares different sets of ASTER imagery. The ASTER processing Wizard allows the user to identify individual bands that form the desired ratio (Fig. 8).
An additional Wizard, The ASTER Mineral and Vegetation processing wizard, customizes the task a step further and allows the user to specify a particular mineral species they are seeking, rather than selection of band ratios (Fig. 9). Additionally, the tool automatically removes 0 value raster cells from the calculations to ensure there are no zero value denominators during band ratio processing. The drawback of this second wizard is that the band ratios are pre-defined and may not be the selection the user is most interested, as is the case in this study where kaolinite is to be targeting using a band 4 / band 6 ratio, however, the ER mapper automated wizard offers Band 7/ Band 5. Similarly, Alunite is to be mapped with band 4/ band 6, and ER Mapper automated wizard offers Alunite-kaolinite – pyrophyllite spectrum defined by (band 4 + Band 6)/ Band 5. In order to achieve the same band ratios as outlined in the Workflow section above, a combination of the two ASTER processing wizards was utilized. Masking was also not offered in the automated workflow and had to be completed prior to use in ER mapper.
ER MAPPER INTERFACE with ASTER PROCESSING WIZARDS
Figure 7
ASTER DATA PROCESSING WIZARD - BAND RATIOS
Figure 8
ASTER MINERAL & VEGETATION WIZARD
Figure 9
After selecting the appropriate bands in ASTER Wizard 1 and Wizard 2, the results are output initially to a temporary blue-red colour ramp image. Each dataset is then permanently saved for final processing and threshold derivation of the data for interpretative purposes.
OUTPUT RESULTS Three maps presented in Figure 10 illustrate the distribution of possible occurrences of Kaolinite, Alunite and Sericite for the subset area in Guerrero State, Mexico. The maps have a threshold applied to the data to delineate only those areas representing the highest probability that the mineral of interest may occur at any given location. ER Mapper ASTER band ratio results are rescaled from a floating point value to a 0 – 255 range. The statistical distribution of each dataset was reviewed and the highest 1 % of the dataset were retained for final map output.
A comparison of the highest probability occurrences of Kaolinite as mapped by band ratios from the ASTER imagery with known locations of Kaolinite mine workings in the area north of the town of Coacoyula is partly dependent on timing of ASTER data acquisition. A review of Google Earth indicates that at the time the ASTER data was acquired (Jan 24, 2006) the two large Kaolinite mines to the NW of the town were not yet in operation are were characterized by significant vegetation cover. The main kaolinite workings in 2006 were immediately north of the town of Coacoyula and the kaolinite band ratios defined by ER Mapper identify this zone with reasonable accuracy.
blue - outline of kaolinite mine
red - predicted Kaolinite
GENERAL INFORMATION
BAND RATIO PROCESSING
ER Mapper ALUNITE ER Mapper KAOLINITE ER Mapper SERICITE
Figure 10
ERDAS IMAGINE is the second in the suite of software packages from Hexagon Geospatial Inc. evaluated for carrying out ASTER Band ratio calculations. A commercial single use license is in excess of $CAN10 000, however the software offers greatly expanded functionality compared to ER Mapper. It allows processing of most raw image formats and provides various higher end analysis tools (e.g. hyperspectral analysis, photogrammetry, radar interferometry and stereo analyst). Image processing specialists from many different disciplines and remote sensing analysts are the target audience for the ERDAS Imagine. The user interface (Fig. 11) consists of a series of menus with ribbons with ribbons to activate the processing tools. Navigation through the ribbon is somewhat cumbersome, however a search tool is provided to quickly access tools. Erdas Imagine also has inbuilt compatibility for ArcGIS. The band ratio calculations were more involved than the automated functions in ER Mapper as custom spatial models had to be built for each desired ratio (other than the kaolinite model).
ERDAS IMAGINE 2014 - Interface
Figure 11
ASTER data processing in ERDAS Imagine is not a wizard-driven focus. The user must be familiar with the relevant tools and be able to generate custom spatial models to create the desired band ratios. A general set of band indices models are available within the Indices tool (Fig. 12), which while providing a list of indices and band ratios to choose from is by no means exhaustive. To access the spatial model information, the model must be reviewed to see what processing is carried out on the data (Fig. 13). The clay index illustrated in Figure 13, represents a ratio of band 4 to band 6 and thus represents the ratio used for kaolinite in this study. Similar spatial models were built using the spatial modeler tool for both alunite and sericite. Conditional logic is applied in the model to remove zero values (Figs. 14-15).
INDICES TOOL - ASTER CLAY
Figure 12
CLAY SPATIAL MODEL - PRE BUILT (Kaolinite)
Figure 13
ALUNITE BAND RATIO SPATIAL MODEL
Figure 13
Figure 14
SERICITE BAND RATIO SPATIAL MODEL
OUTPUT RESULTS Once the models were run, the data were output as floating point data to an .img file. The files were imported into ArcGIS 10.2.2 and conditional statements were applied to extract cells exceeding specific thresholds for each mineral(Fig. 15). Similar to ER Mapper, the Kaolinite band ratio identifies the known kaolinite mines that were operating during the time of ASTER data acquisition. In the case of sericite, the band ratios mostly correspond with water bodies and vegetation, rather than known ground occurrences.
ERDAS ALUNITE ERDAS KAOLINITEERDAS SERICITE
Figure 15
Yellow - outline of kaolinite mine
red - predicted Kaolinite
PCI GEOMATICAPCI GEOMATICA EXELIS ENVIEXELIS ENVI
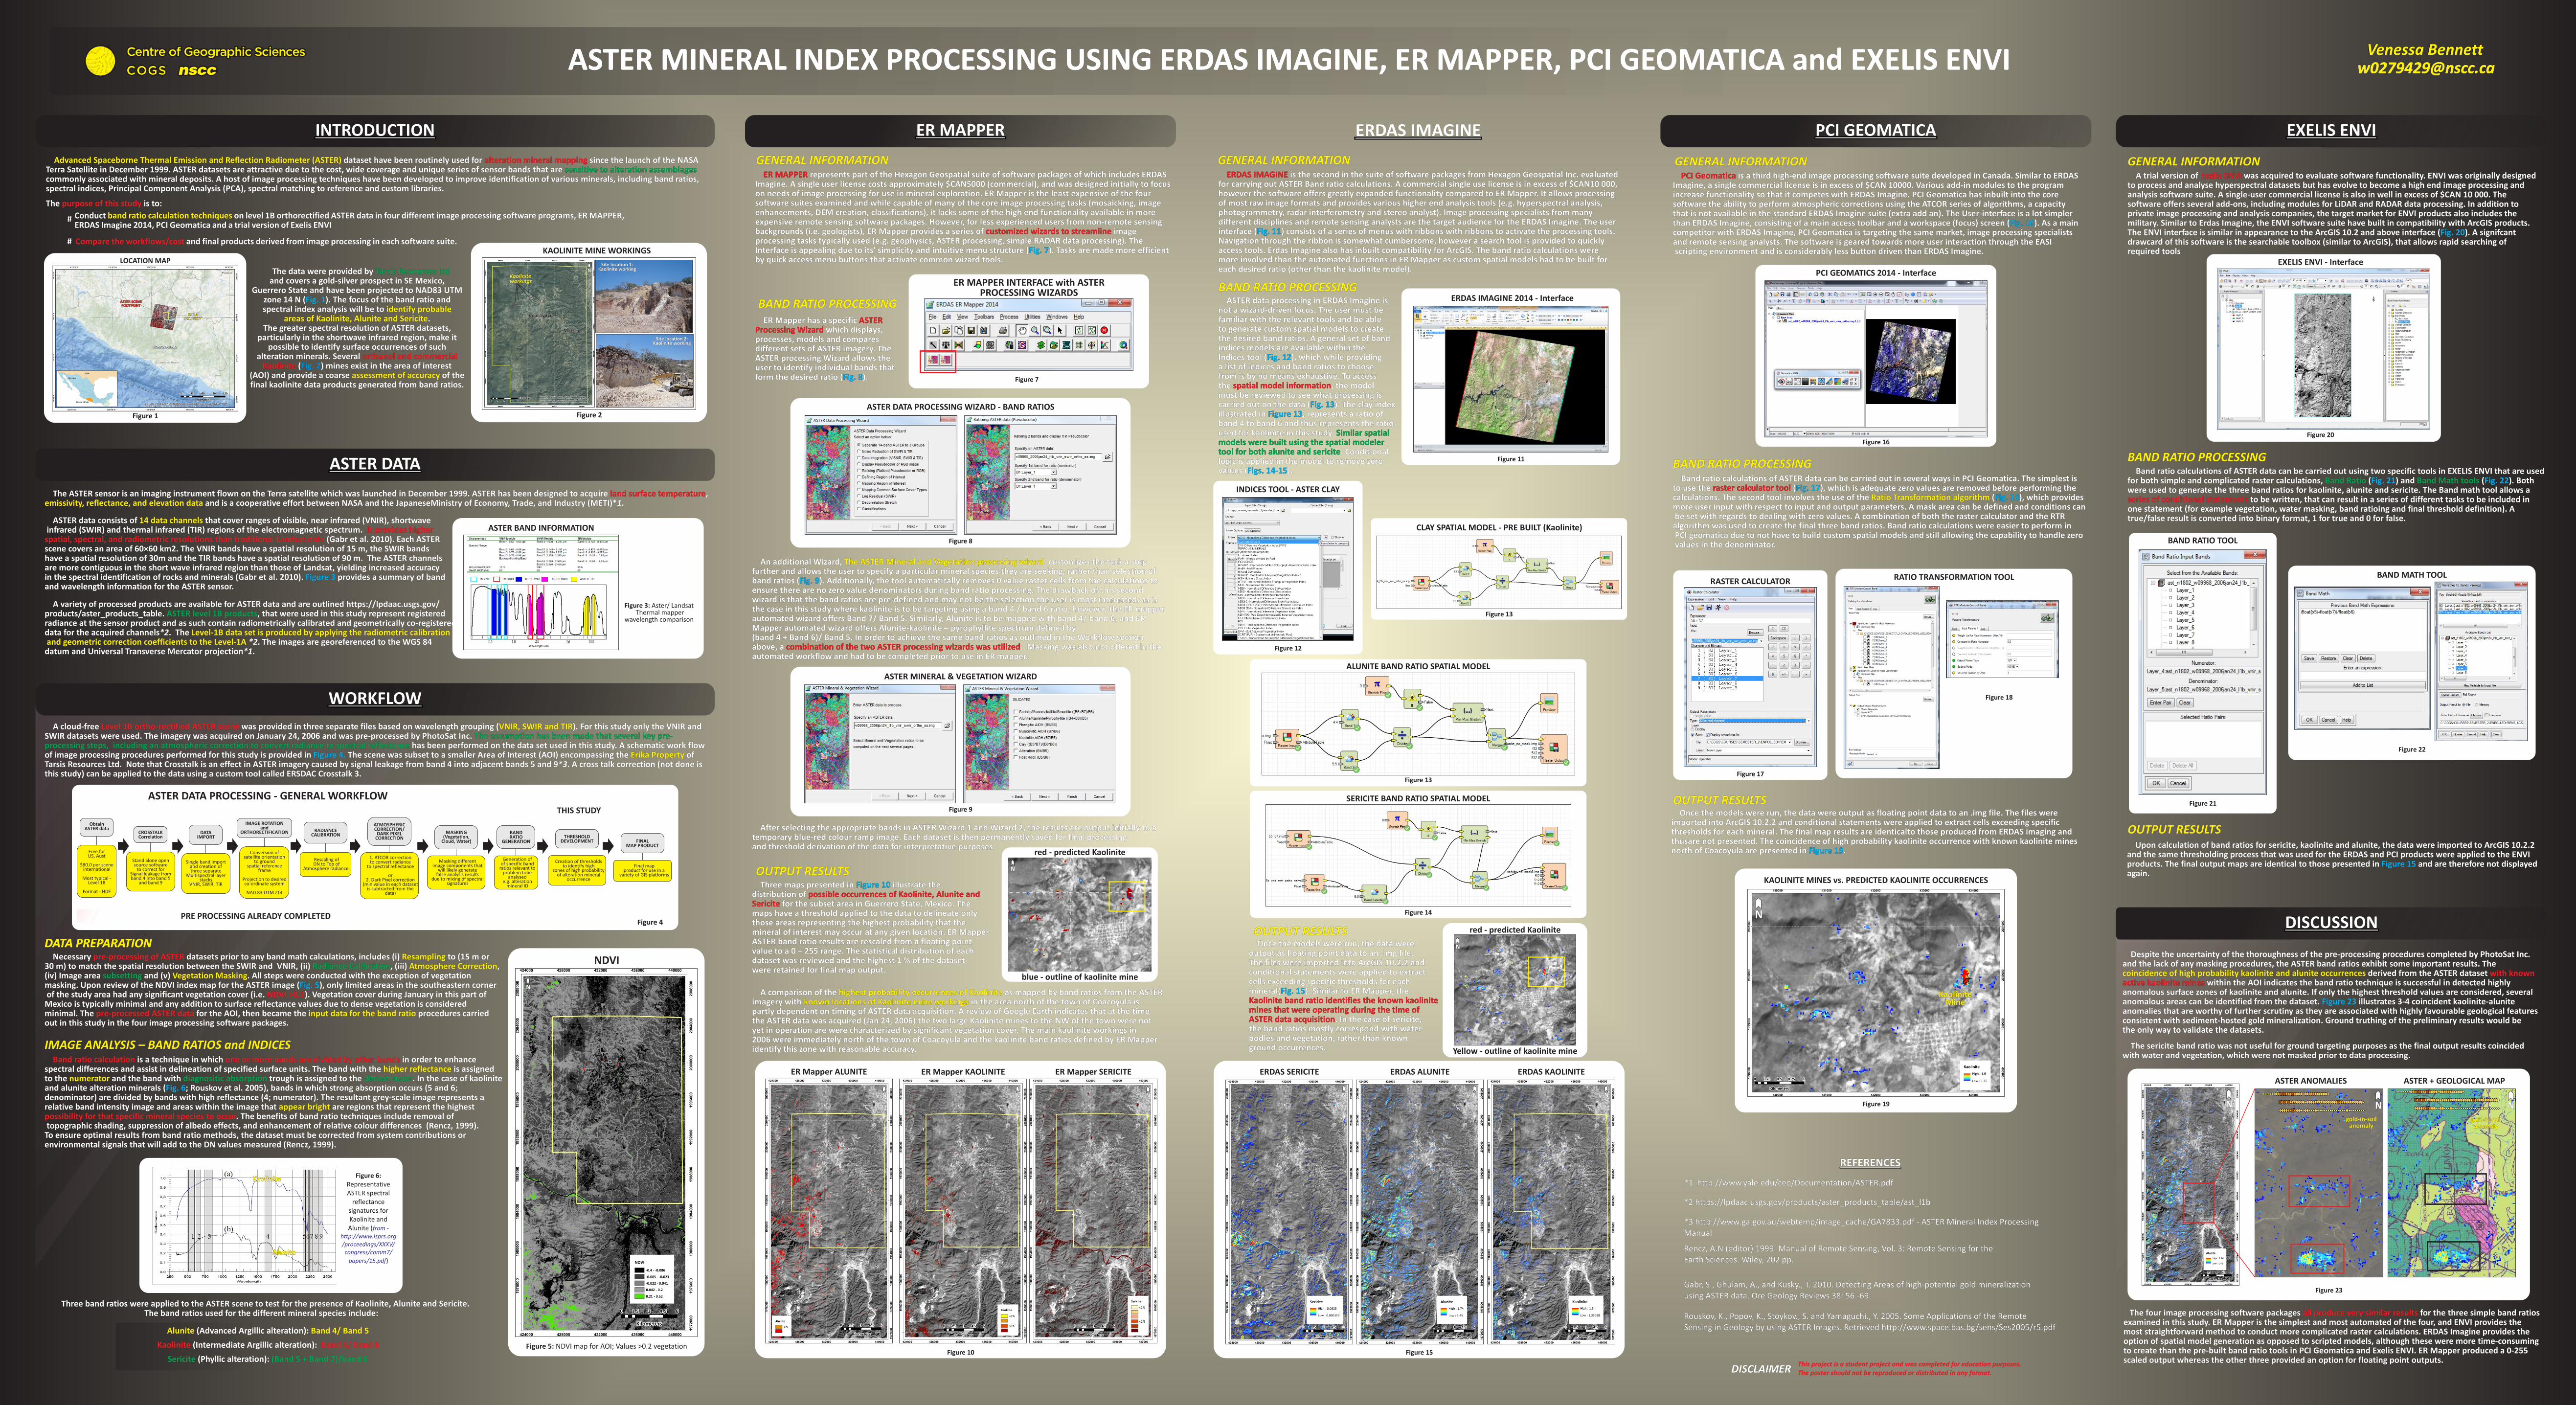
GENERAL INFORMATION GENERAL INFORMATION PCI Geomatica is a third high-end image processing software suite developed in Canada. Similar to ERDAS Imagine, a single commercial license is in excess of $CAN 10000. Various add-in modules to the program increase functionality so that it competes with ERDAS Imagine. PCI Geomatica has inbuilt into the core software the ability to perform atmospheric corrections using the ATCOR series of algorithms, a capacity that is not available in the standard ERDAS Imagine suite (extra add an). The User-interface is a lot simpler than ERDAS Imagine, consisting of a main access toolbar and a workspace (focus) screen (Fig. 16). As a main competitor with ERDAS Imagine, PCI Geomatica is targeting the same market, image processing specialists and remote sensing analysts. The software is geared towards more user interaction through the EASI scripting environment and is considerably less button driven than ERDAS Imagine.
PCI GEOMATICS 2014 - Interface
Figure 16
BAND RATIO PROCESSING Band ratio calculations of ASTER data can be carried out in several ways in PCI Geomatica. The simplest is to use the raster calculator tool (Fig. 17), which is adequate zero values are removed before performing the calculations. The second tool involves the use of the Ratio Transformation algorithm (Fig. 18), which provides more user input with respect to input and output parameters. A mask area can be defined and conditions can be set with regards to dealing with zero values. A combination of both the raster calculator and the RTR algorithm was used to create the final three band ratios. Band ratio calculations were easier to perform in PCI geomatica due to not have to build custom spatial models and still allowing the capability to handle zero values in the denominator.
OUTPUT RESULTS Once the models were run, the data were output as floating point data to an .img file. The files were imported into ArcGIS 10.2.2 and conditional statements were applied to extract cells exceeding specific thresholds for each mineral. The final map results are identicalto those produced from ERDAS imaging and thusare not presented. The coincidence of high probability kaolinite occurrence with known kaolinite mines north of Coacoyula are presented in Figure 19.
RASTER CALCULATOR
Figure 17
RATIO TRANSFORMATION TOOL
Figure 18
KAOLINITE MINES vs. PREDICTED KAOLINITE OCCURRENCES
Kaolinite Mine
Kaolinite Mine
A trial version of Exelis ENVI was acquired to evaluate software functionality. ENVI was originally designed to process and analyse hyperspectral datasets but has evolve to become a high end image processing and analysis software suite. A single-user commercial license is also in well in excess of $CAN 10 000. The software offers several add-ons, including modules for LiDAR and RADAR data processing. In addition to private image processing and analysis companies, the target market for ENVI products also includes the military. Similar to Erdas Imagine, the ENVI software suite have built in compatibility with ArcGIS products. The ENVI interface is similar in appearance to the ArcGIS 10.2 and above interface (Fig. 20). A signifcantdrawcard of this software is the searchable toolbox (similar to ArcGIS), that allows rapid searching of required tools
EXELIS ENVI - Interface
Figure 20
BAND RATIO PROCESSING Band ratio calculations of ASTER data can be carried out using two specific tools in EXELIS ENVI that are used for both simple and complicated raster calculations, Band Ratio (Fig. 21) and Band Math tools (Fig. 22). Both were used to generate the three band ratios for kaolinite, alunite and sericite. The Band math tool allows a series of conditional statements to be written, that can result in a series of different tasks to be included in one statement (for example vegetation, water masking, band ratioing and final threshold definition). A true/false result is converted into binary format, 1 for true and 0 for false.
BAND MATH TOOL
BAND RATIO TOOL
OUTPUT RESULTS Upon calculation of band ratios for sericite, kaolinite and alunite, the data were imported to ArcGIS 10.2.2and the same thresholding process that was used for the ERDAS and PCI products were applied to the ENVI products. The final output maps are identical to those presented in Figure 15 and are therefore not displayed again.
Figure 21
Figure 22
dataset have been routinely used for since the launch of the NASA Terra Satellite in December 1999. ASTER datasets are attractive due to the cost, wide coverage and unique series of sensor bands that are commonly associated with mineral deposits. A host of image processing techniques have been developed to improve identification of various minerals, including band ratios, spectral indices, Principal Component Analysis (PCA), spectral matching to reference and custom libraries.
Advanced Spaceborne Thermal Emission and Reflection Radiometer (ASTER) alteration mineral mappingsensitive to alteration assemblages
The is to:purpose of this study
Conduct on level 1B orthorectified ASTER data in four different image processing software programs, ER MAPPER, ERDAS Imagine 2014, PCI Geomatica and a trial version of Exelis ENVI
band ratio calculation techniques
Compare the workflows/cost and final products derived from image processing in each software suite.
The data were provided by and covers a gold-silver prospect in SE Mexico,
Guerrero State and have been projected to NAD83 UTM zone 14 N ( ). The focus of the band ratio and spectral index analysis will be to
. The greater spectral resolution of ASTER datasets,
particularly in the shortwave infrared region, make it possible to identify surface occurrences of such
alteration minerals. Several ( ) mines exist in the area of interest
(AOI) and provide a coarse of the final kaolinite data products generated from band ratios.
Tarsis Resources Ltd
Fig. 1identify probable
areas of Kaolinite, Alunite and Sericite
assessment of accuracy
artisanal and commercial Kaolinite Fig. 2
Figure 19
This project is a student project and was completed for education purposes. The poster should not be reproduced or distributed in any format.This project is a student project and was completed for education purposes. The poster should not be reproduced or distributed in any format.DISCLAIMERDISCLAIMER
REFERENCESREFERENCES
*1 http://www.yale.edu/ceo/Documentation/ASTER.pdf
*2 https://lpdaac.usgs.gov/products/aster_products_table/ast_l1b
*3 http://www.ga.gov.au/webtemp/image_cache/GA7833.pdf - ASTER Mineral Index Processing Manual
Rencz, A.N (editor) 1999. Manual of Remote Sensing, Vol. 3: Remote Sensing for the Earth Sciences. Wiley, 202 pp.
Gabr, S., Ghulam, A., and Kusky., T. 2010. Detecting Areas of high-potential gold mineralization using ASTER data. Ore Geology Reviews 38: 56 -69.
Rouskov, K., Popov, K., Stoykov., S. and Yamaguchi., Y. 2005. Some Applications of the Remote Sensing in Geology by using ASTER Images. Retrieved http://www.space.bas.bg/sens/Ses2005/r5.pdf
The ASTER sensor is an imaging instrument flown on the Terra satellite which was launched in December 1999. ASTER has been designed to acquire , and is a cooperative effort between NASA and the JapaneseMinistry of Economy, Trade, and Industry (METI)*1.
land surface temperatureemissivity, reflectance, and elevation data
ASTER data consists of that cover ranges of visible, near infrared (VNIR), shortwave infrared (SWIR) and thermal infrared (TIR) regions of the electromagnetic spectrum.
(Gabr et al. 2010). Each ASTER scene covers an area of 60×60 km2. The VNIR bands have a spatial resolution of 15 m, the SWIR bands have a spatial resolution of 30m and the TIR bands have a spatial resolution of 90 m. The ASTER channels are more contiguous in the short wave infrared region than those of Landsat, yielding increased accuracy in the spectral identification of rocks and minerals (Gabr et al. 2010). provides a summary of band and wavelength information for the ASTER sensor.
14 data channels It provides higher
spatial, spectral, and radiometric resolutions than traditional Landsat data
Figure 3
A variety of processed products are available for ASTER data and are outlined https://lpdaac.usgs.gov/products/aster_products_table. , that were used in this study represent registered radiance at the sensor product and as such contain radiometrically calibrated and geometrically co-registered data for the acquired channels*2. The
*2. The images are georeferenced to the WGS 84 datum and Universal Transverse Mercator projection*1.
ASTER level 1B products
Level-1B data set is produced by applying the radiometric calibration and geometric correction coefficients to the Level-1A
A cloud-free was provided in three separate files based on wavelength grouping ( ). For this study only the VNIR and SWIR datasets were used. The imagery was acquired on January 24, 2006 and was pre-processed by PhotoSat Inc.
has been performed on the data set used in this study. A schematic work flow of image processing procedures performed for this study is provided in The scene was subset to a smaller Area of Interest (AOI) encompassing the of Tarsis Resources Ltd. Note that Crosstalk is an effect in ASTER imagery caused by signal leakage from band 4 into adjacent bands 5 and 9*3. A cross talk correction (not done is this study) can be applied to the data using a custom tool called ERSDAC Crosstalk 3.
Level 1B ortho-rectified ASTER scene VNIR, SWIR and TIR
Erika Property
The assumption has been made that several key pre-processing steps, including an atmospheric correction to convert radiance to spectral reflectance
Figure 4.
DATA PREPARATIONDATA PREPARATION Necessary datasets prior to any band math calculations, includes (i) to (15 m or 30 m) to match the spatial resolution between the SWIR and VNIR, (ii) , (iii) , (iv) Image area and (v) . All steps were conducted with the exception of vegetation masking. Upon review of the NDVI index map for the ASTER image ( ), only limited areas in the southeastern corner of the study area had any significant vegetation cover (i.e. ). Vegetation cover during January in this part of Mexico is typically minimal and any addition to surface reflectance values due to dense vegetation is considered minimal. The for the AOI, then became the procedures carried out in this study in the four image processing software packages.
pre-processing of ASTER
NDVI >0.2
pre-processed ASTER data
ResamplingAtmosphere Correction
Vegetation Masking
input data for the band ratio
Radiance Calibrationsubsetting
Fig. 5
IMAGE ANALYSIS – BAND RATIOS and INDICES is a technique in which in order to enhance spectral differences and assist in delineation of specified surface units. The band with the is assigned to the and the band with trough is assigned to the . In the case of kaolinite and alunite alteration minerals ( ; Rouskov et al. 2005), bands in which strong absorption occurs (5 and 6; denominator) are divided by bands with high reflectance (4; numerator). The resultant grey-scale image represents a relative band intensity image and areas within the image that are regions that represent the highest
. The benefits of band ratio techniques include removal of topographic shading, suppression of albedo effects, and enhancement of relative colour differences (Rencz, 1999). To ensure optimal results from band ratio methods, the dataset must be corrected from system contributions or environmental signals that will add to the DN values measured (Rencz, 1999).
Band ratio calculation one or more bands are divided by other bands
possibility for that specific mineral species to occur
higher reflectancenumerator
appear bright
diagnositic absorption denominatorFig. 6
Three band ratios were applied to the ASTER scene to test for the presence of Kaolinite, Alunite and Sericite. The band ratios used for the different mineral species include:
Alunite Band 4/ Band 5 (Advanced Argillic alteration):
Kaolinite Band 4/ Band 6 (Intermediate Argillic alteration):
Sericite (Band 5 + Band 7)/band 6 (Phyllic alteration):
GENERAL INFORMATION represents part of the Hexagon Geospatial suite of software packages of which includes ERDAS Imagine. A single user license costs approximately $CAN5000 (commercial), and was designed initially to focus on needs of image processing for use in mineral exploration. ER Mapper is the least expensive of the four software suites examined and while capable of many of the core image processing tasks (mosaicking, image enhancements, DEM creation, classifications), it lacks some of the high end functionality available in more expensive remote sensing software packages. However, for less experienced users from non-remote sensing backgrounds (i.e. geologists), ER Mapper provides a series of image processing tasks typically used (e.g. geophysics, ASTER processing, simple RADAR data processing). The Interface is appealing due to its' simplicity and intuitive menu structure ( ). Tasks are made more efficient by quick access menu buttons that activate common wizard tools.
ER MAPPER
customized wizards to streamline
Fig. 7
BAND RATIO PROCESSING ER Mapper has a specific
which displays, processes, models and compares different sets of ASTER imagery. The ASTER processing Wizard allows the user to identify individual bands that form the desired ratio ( ).
ASTER Processing Wizard
Fig. 8
GENERAL INFORMATION
BAND RATIO PROCESSING
is the second in the suite of software packages from Hexagon Geospatial Inc. evaluated for carrying out ASTER Band ratio calculations. A commercial single use license is in excess of $CAN10 000, however the software offers greatly expanded functionality compared to ER Mapper. It allows processing of most raw image formats and provides various higher end analysis tools (e.g. hyperspectral analysis, photogrammetry, radar interferometry and stereo analyst). Image processing specialists from many different disciplines and remote sensing analysts are the target audience for the ERDAS Imagine. The user interface ( ) consists of a series of menus with ribbons with ribbons to activate the processing tools. Navigation through the ribbon is somewhat cumbersome, however a search tool is provided to quickly access tools. Erdas Imagine also has inbuilt compatibility for ArcGIS. The band ratio calculations were more involved than the automated functions in ER Mapper as custom spatial models had to be built for each desired ratio (other than the kaolinite model).
ERDAS IMAGINE
Fig. 11
ASTER data processing in ERDAS Imagine is not a wizard-driven focus. The user must be familiar with the relevant tools and be able to generate custom spatial models to create the desired band ratios. A general set of band indices models are available within the Indices tool ( ), which while providing a list of indices and band ratios to choose from is by no means exhaustive. To access the , the model must be reviewed to see what processing is carried out on the data ( ). The clay index illustrated in , represents a ratio of band 4 to band 6 and thus represents the ratio used for kaolinite in this study.
. Conditional logic is applied in the model to remove zero values ( ).
Fig. 12
Fig. 13Figure 13
Figs. 14-15
spatial model information
Similar spatial models were built using the spatial modeler tool for both alunite and sericite
An additional Wizard, , customizes the task a step further and allows the user to specify a particular mineral species they are seeking, rather than selection of band ratios ( ). Additionally, the tool automatically removes 0 value raster cells from the calculations to ensure there are no zero value denominators during band ratio processing. The drawback of this second wizard is that the band ratios are pre-defined and may not be the selection the user is most interested, as is the case in this study where kaolinite is to be targeting using a band 4 / band 6 ratio, however, the ER mapper automated wizard offers Band 7/ Band 5. Similarly, Alunite is to be mapped with band 4/ band 6, and ER Mapper automated wizard offers Alunite-kaolinite – pyrophyllite spectrum defined by (band 4 + Band 6)/ Band 5. In order to achieve the same band ratios as outlined in the Workflow section above, a . Masking was also not offered in the automated workflow and had to be completed prior to use in ER mapper.
The ASTER Mineral and Vegetation processing wizard
Fig. 9
combination of the two ASTER processing wizards was utilized
After selecting the appropriate bands in ASTER Wizard 1 and Wizard 2, the results are output initially to a temporary blue-red colour ramp image. Each dataset is then permanently saved for final processing and threshold derivation of the data for interpretative purposes.
OUTPUT RESULTS Three maps presented in illustrate the distribution of
for the subset area in Guerrero State, Mexico. The maps have a threshold applied to the data to delineate only those areas representing the highest probability that the mineral of interest may occur at any given location. ER Mapper ASTER band ratio results are rescaled from a floating point value to a 0 – 255 range. The statistical distribution of each dataset was reviewed and the highest 1 % of the dataset were retained for final map output.
Figure 10possible occurrences of Kaolinite, Alunite and
Sericite
A comparison of the as mapped by band ratios from the ASTER imagery with in the area north of the town of Coacoyula is partly dependent on timing of ASTER data acquisition. A review of Google Earth indicates that at the time the ASTER data was acquired (Jan 24, 2006) the two large Kaolinite mines to the NW of the town were not yet in operation are were characterized by significant vegetation cover. The main kaolinite workings in 2006 were immediately north of the town of Coacoyula and the kaolinite band ratios defined by ER Mapper identify this zone with reasonable accuracy.
highest probability occurrences of Kaoliniteknown locations of Kaolinite mine workings
OUTPUT RESULTS Once the models were run, the data were output as floating point data to an .img file. The files were imported into ArcGIS 10.2.2 and conditional statements were applied to extract cells exceeding specific thresholds for each mineral( ). Similar to ER Mapper, the
. In the case of sericite, the band ratios mostly correspond with water bodies and vegetation, rather than known ground occurrences.
Fig. 15Kaolinite band ratio identifies the known kaolinite mines that were operating during the time of ASTER data acquisition
GENERAL INFORMATION GENERAL INFORMATION is a third high-end image processing software suite developed in Canada. Similar to ERDAS Imagine, a single commercial license is in excess of $CAN 10000. Various add-in modules to the program increase functionality so that it competes with ERDAS Imagine. PCI Geomatica has inbuilt into the core software the ability to perform atmospheric corrections using the ATCOR series of algorithms, a capacity that is not available in the standard ERDAS Imagine suite (extra add an). The User-interface is a lot simpler than ERDAS Imagine, consisting of a main access toolbar and a workspace (focus) screen ( ). As a main competitor with ERDAS Imagine, PCI Geomatica is targeting the same market, image processing specialists and remote sensing analysts. The software is geared towards more user interaction through the EASI scripting environment and is considerably less button driven than ERDAS Imagine.
PCI Geomatica
Fig. 16
BAND RATIO PROCESSING Band ratio calculations of ASTER data can be carried out in several ways in PCI Geomatica. The simplest is to use the ( ), which is adequate zero values are removed before performing the calculations. The second tool involves the use of the ( ), which provides more user input with respect to input and output parameters. A mask area can be defined and conditions can be set with regards to dealing with zero values. A combination of both the raster calculator and the RTR algorithm was used to create the final three band ratios. Band ratio calculations were easier to perform in PCI geomatica due to not have to build custom spatial models and still allowing the capability to handle zero values in the denominator.
raster calculator tool Fig. 17Fig. 18Ratio Transformation algorithm
OUTPUT RESULTS Once the models were run, the data were output as floating point data to an .img file. The files were imported into ArcGIS 10.2.2 and conditional statements were applied to extract cells exceeding specific thresholds for each mineral. The final map results are identicalto those produced from ERDAS imaging and thusare not presented. The coincidence of high probability kaolinite occurrence with known kaolinite mines north of Coacoyula are presented in . Figure 19
A trial version of was acquired to evaluate software functionality. ENVI was originally designed to process and analyse hyperspectral datasets but has evolve to become a high end image processing and analysis software suite. A single-user commercial license is also in well in excess of $CAN 10 000. The software offers several add-ons, including modules for LiDAR and RADAR data processing. In addition to private image processing and analysis companies, the target market for ENVI products also includes the military. Similar to Erdas Imagine, the ENVI software suite have built in compatibility with ArcGIS products. The ENVI interface is similar in appearance to the ArcGIS 10.2 and above interface ( ). A signifcantdrawcard of this software is the searchable toolbox (similar to ArcGIS), that allows rapid searching of required tools
Exelis ENVI
Fig. 20
BAND RATIO PROCESSING Band ratio calculations of ASTER data can be carried out using two specific tools in EXELIS ENVI that are used for both simple and complicated raster calculations, ( ) and ( ). Both were used to generate the three band ratios for kaolinite, alunite and sericite. The Band math tool allows a
to be written, that can result in a series of different tasks to be included in one statement (for example vegetation, water masking, band ratioing and final threshold definition). A true/false result is converted into binary format, 1 for true and 0 for false.
Band Ratio Band Math toolsFig. 21 Fig. 22
series of conditional statements
OUTPUT RESULTS Upon calculation of band ratios for sericite, kaolinite and alunite, the data were imported to ArcGIS 10.2.2and the same thresholding process that was used for the ERDAS and PCI products were applied to the ENVI products. The final output maps are identical to those presented in and are therefore not displayed again.
Figure 15
Despite the uncertainty of the thoroughness of the pre-processing procedures completed by PhotoSat Inc. and the lack of any masking procedures, the ASTER band ratios exhibit some important results. The coincidence of high probability kaolinite and alunite occurrences derived from the ASTER dataset with known active kaolinite mines within the AOI indicates the band ratio technique is successful in detected highly anomalous surface zones of kaolinite and alunite. If only the highest threshold values are considered, several anomalous areas can be identified from the dataset. Figure 23 illustrates 3-4 coincident kaolinite-alunite anomalies that are worthy of further scrutiny as they are associated with highly favourable geological features consistent with sediment-hosted gold mineralization. Ground truthing of the preliminary results would be the only way to validate the datasets.
The sericite band ratio was not useful for ground targeting purposes as the final output results coincided with water and vegetation, which were not masked prior to data processing.
gold-in-soil anomaly
gold-in-soil anomaly
gold-in-soil anomaly
gold-in-soil anomaly
Figure 23
ASTER ANOMALIES ASTER + GEOLOGICAL MAP
The four image processing software packages all produce very similar results for the three simple band ratios examined in this study. ER Mapper is the simplest and most automated of the four, and ENVI provides the most straightforward method to conduct more complicated raster calculations. ERDAS Imagine provides the option of spatial model generation as opposed to scripted models, although these were more time-consuming to create than the pre-built band ratio tools in PCI Geomatica and Exelis ENVI. ER Mapper produced a 0-255 scaled output whereas the other three provided an option for floating point outputs.
Despite the uncertainty of the thoroughness of the pre-processing procedures completed by PhotoSat Inc. and the lack of any masking procedures, the ASTER band ratios exhibit some important results. The
derived from the ASTER dataset within the AOI indicates the band ratio technique is successful in detected highly
anomalous surface zones of kaolinite and alunite. If only the highest threshold values are considered, several anomalous areas can be identified from the dataset. illustrates 3-4 coincident kaolinite-alunite anomalies that are worthy of further scrutiny as they are associated with highly favourable geological features consistent with sediment-hosted gold mineralization. Ground truthing of the preliminary results would be the only way to validate the datasets.
coincidence of high probability kaolinite and alunite occurrences with known active kaolinite mines
Figure 23
The sericite band ratio was not useful for ground targeting purposes as the final output results coincided with water and vegetation, which were not masked prior to data processing.
The four image processing software packages for the three simple band ratios examined in this study. ER Mapper is the simplest and most automated of the four, and ENVI provides the most straightforward method to conduct more complicated raster calculations. ERDAS Imagine provides the option of spatial model generation as opposed to scripted models, although these were more time-consuming to create than the pre-built band ratio tools in PCI Geomatica and Exelis ENVI. ER Mapper produced a 0-255 scaled output whereas the other three provided an option for floating point outputs.
all produce very similar results
DISCUSSIONDISCUSSION
NN
NN
NN NN NN NN NN NN
NN
NN
NN NN NN
##
##