Assuring Drug Product Quality and Patient Safety … · Assuring Drug Product ... CQA Test Method...
23
Diane M. Paskiet Director of Scientific Affairs West Pharmaceutical Services, Inc. IFPAC - 2014 28 th International Forum January 23, 2014 - Washington, DC Assuring Drug Product Quality and Patient Safety through the Application of QbD to Packaging and Delivery Systems
Transcript of Assuring Drug Product Quality and Patient Safety … · Assuring Drug Product ... CQA Test Method...

Diane M. PaskietDirector of Scientific Affairs
West Pharmaceutical Services, Inc.IFPAC - 2014 28th International Forum
January 23, 2014 - Washington, DC
Assuring Drug Product Quality and Patient Safety through the Application of QbD to Packaging and Delivery Systems
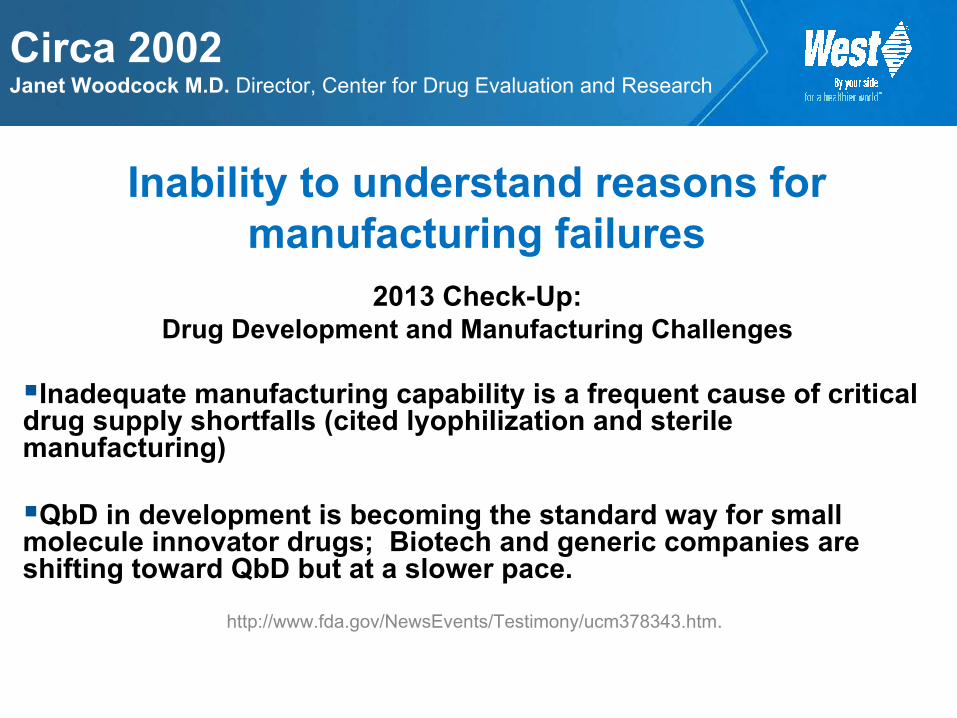
2013 Check-Up: Drug Development and Manufacturing Challenges
Inadequate manufacturing capability is a frequent cause of critical drug supply shortfalls (cited lyophilization and sterile manufacturing)
QbD in development is becoming the standard way for small molecule innovator drugs; Biotech and generic companies are shifting toward QbD but at a slower pace.
http://www.fda.gov/NewsEvents/Testimony/ucm378343.htm.
Inability to understand reasons for manufacturing failures
Circa 2002Janet Woodcock M.D. Director, Center for Drug Evaluation and Research

Justification of QbD for Packaging Components
Proactive Approaches to Pharmaceutical ManufacturingQbD for Component Manufacturing Process
QbD for Plunger Design
Meeting Needs of Patients
Application of QbD to Packaging and Delivery Systems

Science BasedCompatibility
Final product and manufacturing processPerformance
System fit and functionality-fill/finishSafety for Intended Use
Understanding materialProtection
Stability
Appropriate ControlsRisk Management
Critical Control Points
Meeting Needs of Patient/CaregiverCollaborations
Informed Decisions for Suitable Packaging Components

Goals:Pharmaceutical Manufacturing
Improve development capabilitySeamless tech transferEfficient manufacturingReduce atypical productComponent consistencyFacilitates review process
Suitability Evidence Based
Significance:Packaging Component
Support regulatory reviewsRisk managementScience based
Collaborative communicationLifecycle management
Continuous improvement Facilitates investigations/change control/OOS/atypicals
Knowledge managementDesign history
Justification of QbD for Components
Patient CentricPatient Centric

6
Example of Product Requirement Matrix
QTPP Design Inputs Design Outputs Control Strategy Summary Risk
Risk Summary-Rationale for ControlsSupports Investigations and Continuous Improvement
Risk Summary-Rationale for ControlsSupports Investigations and Continuous Improvement
7
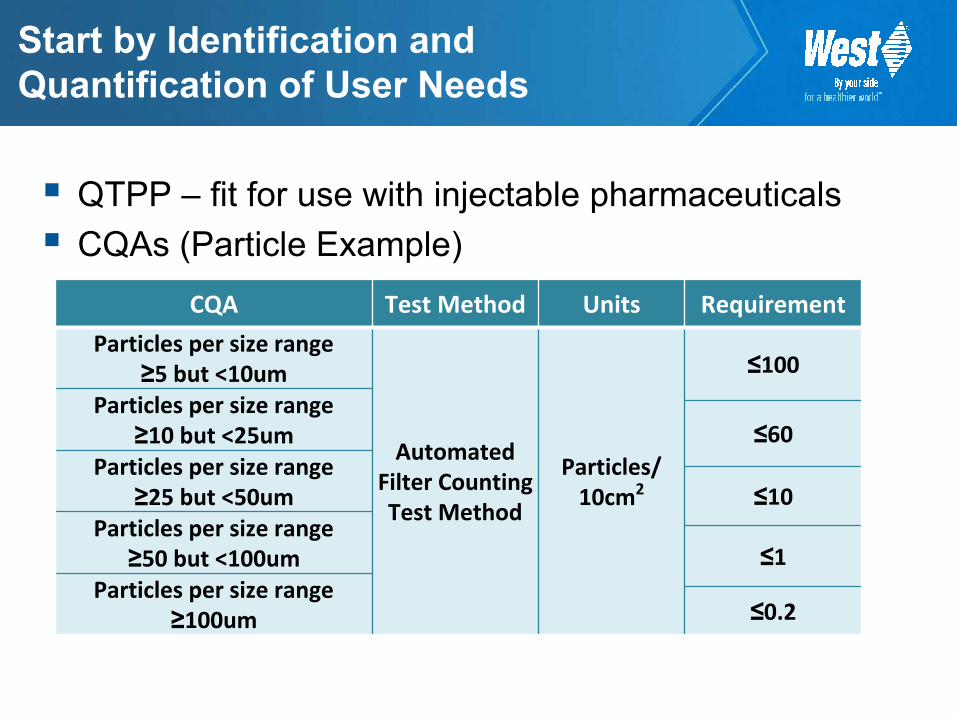
QTPP – fit for use with injectable pharmaceuticalsCQAs (Particle Example)
Start by Identification and Quantification of User Needs
CQA Test Method Units Requirement
Particles per size range ≥5 but <10um
Automated Filter Counting Test Method
Particles/ 10cm2
≤100
Particles per size range ≥10 but <25um ≤60
Particles per size range ≥25 but <50um ≤10
Particles per size range ≥50 but <100um ≤1
Particles per size range ≥100um ≤0.2

8
Every step of the process is examinedReview all documented work instructionsObserve operations on shop floor Includes steps of control strategy
Create a detailed process map Fully defines all aspects of the manufacturing process
Existing Process Baselined as the Basis for Development Work

CQAs
Cause & Effect Analysis
200+ Process parameters in 43 Process steps Ranked

10
Calculate RPN (risk priority number) to rank the risksSeverity X Probability X Detection
Determine actions to mitigate unacceptable risks
Failure Mode and Effects Analysis(FMEA)
Process Description
Potential Failure Mode
Potential Effects of Failure
SEV
Potential Causes
PROB
Current Process Controls
DET
RPN
Recommended action
Trim Line Clearance and Set Up
Dirty trim solution
Bioburden, endotoxin, extractables, particles at unacceptable levels
5 Solution tub not cleaned
2 Product release testing for bioburden, endotoxin, extractables, particles,Training program, SOP
3 30
Review and improve current procedures
Process Improvement

11
Studied particle load throughout the processIdentified process steps that increase and decrease particle loadStopper rinsing showed significant reduction
Targeted for optimization
DOEs Revealed Mitigation Strategy Feeding into of Design Space
Examples for Particles

12
Statistically designed experiment of stopper rinsing process
Three factors were studies at three levelsWash type Rotation speed Drying time
Measured particle countsOptimized rinse cycle developed and confirmed
Rinsing Process Was Optimized for Maximum Particle Reduction

Key Initial Process Steps CQAProcess Parameter
RM Mix Extrude Mold Rinse&Wash
Silicone Inspect Fiber >10um
Line Clearance
< 60
Sheet Dimension
<60
Control Strategy Derived from Product Requirement Matrix
Summary of risk and adequacy of controls Example: Design Input (1.4) Particles
CQA not impacted by parameter or attribute in Process Step (PS)CQA impacted by parameter or attribute in PS but controlled in different step
CQA primary control implemented in PS through input specifications, work instruction or in process controls

Risk Mapping Across the ProcessCapture prior knowledgeRisk identification and prioritization
Outcome: Screening of variables feeding experimental design
FMEA and HACCPUnderstand factors impacting CQAs
Contribution of detectability and in process controls to overall risk reduction.Justify areas for further study
Use of robust methods and screen variables Outcome: ID critical process parameters and control strategy
Component QTPP-CQA Process Understanding-Control Strategy
Evidence Based
QbD for Component Manufacturing Process

15
QbD Plunger Design
2 & 3 RIB
Design Benchmarks
West FluroTec
West uncoated
Competitive
QbD Plan for Concept
Development
Defined design variablesEstablished DOE
Correlation of key attributes
Fabricated cavities
Design Characterization
Define critical specifications
2 Step Molded Styles
Comparison of Average Piston Release and Travel Forces
0.00.51.01.52.02.53.03.54.04.5
0.00 0.20 0.40 0.60 0.80 1.00 1.20 1.40
Distance (in)
Forc
e (lb
f)
CZ 1ml (RT 2m) Hypak 1ml Std.(RT 2m)Hypak 1ml Long (RT 2m)Hypak 3ml (RT 2m)Schott TopPac COC (RT 43d)
Engineering Models (FEA)
Break Loose & Extrusion

16
QbD Manufacturing ProcessInclude Design Features
GeometryFilm lamination
Overcoming variationsDimensionalSilicone oilBreak loose and extrusion forcesParticulate
Quality Risk ManagementContinuous Improvement
QbD Plunger Overarching Goals
FluroTec® technology is licensed from Daikyo Seiko, Ltd.
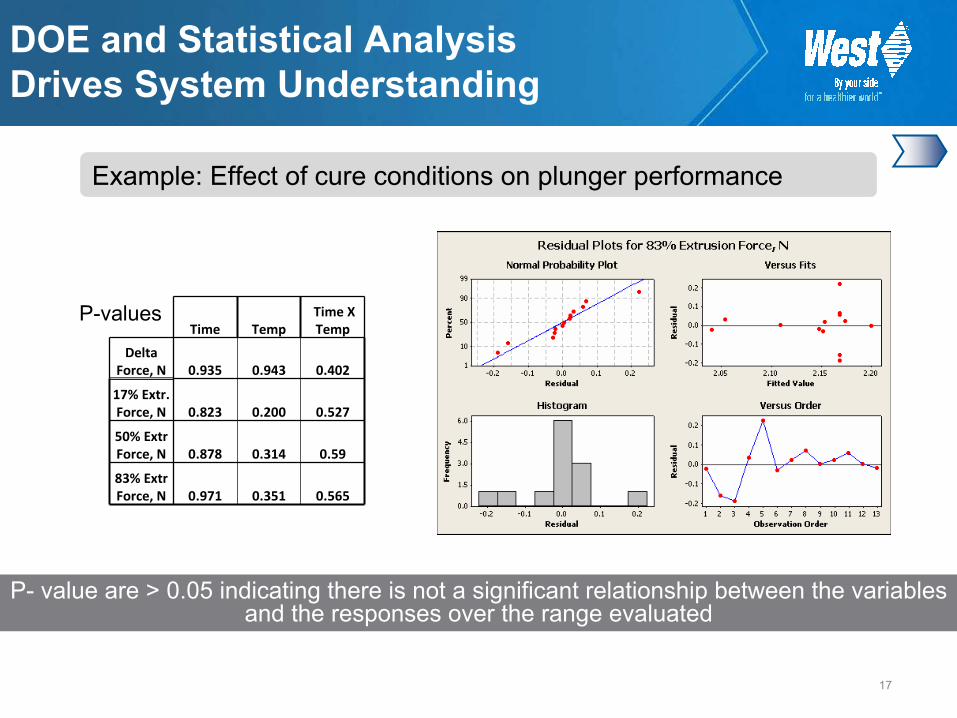
Time TempTime X Temp
Delta Force, N 0.935 0.943 0.402
17% Extr. Force, N 0.823 0.200 0.527
50% Extr Force, N 0.878 0.314 0.59
83% Extr Force, N 0.971 0.351 0.565
P-values
DOE and Statistical Analysis Drives System Understanding
17
Example: Effect of cure conditions on plunger performance
P- value are > 0.05 indicating there is not a significant relationship between the variablesand the responses over the range evaluated

18
Most Consistent Travel Force
1mL long NovaPure compared to standard 1ml long coated plunger – water filled, 25°C/60% RH

19
Break Loose and Extrusion in Various Syringe BarrelsForce required to initiate the plunger movement over time

20
New ComponentsHolistic View of the Manufacturing process
NovaPure® 4432/50 and 4023/50 stoppers (commercial)
Development of QbD Plunger NovaPure 1mL long plunger 4023/50 (commercial), 4432/50 (in development)
Current ComponentsCustomer specific application
NovaChoice™
QbD Component Understanding from Various Perspectives

21
NovaChoiceQTPP and CQAs tailored to customer product and
patient expectationsCollaborative development approach to understand the
complete systemWest Customer Patient
Developed under DA in direct alignment with customerSustainable process for lifecycle management through
knowledge management
Current Products QbD Application

QTPP-CQAsPharmaceutical Manufacturing
EfficiencyProduct compatibility and safety
Quality Risk ManagementDesign Space –Control Strategy Continual Improvement
CollaborationsPatient
Ease of useProtection of product
Patient and Manufacturing Needs
Current and Future

23
Trademarks and registered trademarks are the property of West Pharmaceutical Services, Inc. in the United States and other jurisdictions, unless noted otherwise.
Thank you
Packaging and Delivery SystemsEvidence of Quality