Assssmnt o rs’ vulnrility to pesticide contamination
57
Assessment of areas’ vulnerability to pesticide contamination Master thesis in Physical Geography at Aalborg University By Henriette Rantzau Almtorp
Transcript of Assssmnt o rs’ vulnrility to pesticide contamination

Assessment of areas’ vulnerability to pesticide contamination Master thesis in Physical Geography at Aalborg University
By Henriette Rantzau Almtorp

Page 2 of 57
Assessment of areas’ vulnerability to pesticide contamination

Page 3 of 57
Resumé
Assessment of areas´ vulnerability to pesticide contamination
Project: Synopsis:
Master Thesis
Physical Geography
Project period:
February 2012 – June 2012
Participants:
Henriette Rantzau Almtorp
Supervisors:
Morten Lauge Pedersen
Contact to NIRAS, Jacob Birk
Jensen
Report pages: 57
Number and type of appendix: 5 on a CD
Submission date: 11. June 2012
The content of the report is freely available, but publication (with source reference) may only take place in agreement with the author.
97 % of the Danish drinking water is extracted
from groundwater, and it is therefore a very
important natural resource. However during the
last 30 years an increasing number of
groundwater drillings have been closed down
because of contamination. The use of pesticides
in agriculture and urban use is one of the big
threats to the groundwater quality, and it is of
national importance to focus on the protection
of groundwater.
This master thesis deals with how it is possible
to assess if an area is vulnerable to pesticide
contamination. The thesis investigates which
parameters that are influencing the
vulnerability the most and therefore which are
necessary to focus on.
Aalborg and Herning Municipality are selected
to compare two areas with different geology
and soil types. To assess if an area is vulnerable
to pesticide contamination distributions of
pesticide contaminated groundwater drillings
are found by making histograms in excel on the
basis of the parameters; filter depth, water
types, and aquifers. The distributions of the
contaminated drillings are compared to
distributions of all groundwater drillings.
The distributions are used to point out that QS3
and Limestone are the vulnerable aquifers in
Aalborg Municipality and QS2 and QS3 are the
vulnerable aquifers in Herning Municipality. The
influence of the thickness of clay layers and
groundwater recharge are assessed in the
vulnerable aquifers.
It is assessed that the available data is
insufficient, and that it is necessary to obtain
more detailed data for the pesticide
contaminated groundwater drillings to use to
give an exact assessment of the vulnerability.

Page 4 of 57
Assessment of areas’ vulnerability to pesticide contamination
Page 5 of 57
Resumé
Resumé
I Danmark indvindes 97 % af drikkevandet fra grundvand, og er derfor en livsvigtig resource. I de
sidste 30 år er der et stigende antal af grundvandsboringer, der er blevet lukket på grund af
forurening, og det er derfor nødvendigt at fokusere på at beskytte grundvandet. Et stigende antal
grundvandsboringer er blevet lukket på grund af pesticidforurening, hvilket tyder på, at pesticider
udgør en stor trussel mod grundvandskvaliteten. Grundvandsanalyser for pesticider blev først
påbegyndt i starten af 1990erne, og der er tegn på, at det højeste pesticidniveau endnu ikke er nået,
idet det grundvand som indvindes i dag kan være mellem 5 og 50 år. Der er tegn på, at
pesticidforureningen af grundvandet vil øges de næste 20-30 år, og det er derfor meget vigtigt, at
der fokuseres på, hvilke områder, der er sårbare overfor pesticidforurening. I 2009 blev der fundet
pesticider i 23 % af de aktive grundvandsboringer, og det var især de højtliggende
grundvandsmagasiner, som var påvirkede af pesticidforurening.
Formålet med dette speciale er at finde en metode til at vurdere om et område er sårbart overfor
pesticidforurening. Dette er undersøgt ved at se på, hvilke forskellige parametre, der er gældende,
når en grundvandsboring er pesticidforurenet. Aalborg og Herning kommune er udvalgt som
fokusområder, for at kunne sammenligne to områder med forskellig geologi og jordtyper, da det
forventes, at disse to parametre har inflydelse på, hvor sårbart et område er overfor pesticider. Det
er ligeledes undersøgt, hvordan de pesticidforurenede grundvandsboringer fordeler sig på baggrund
af parametrene: Filterdybden, vandtypen og grundvandsmagasin. Dette er gjort ved at beregne et
histogram, der viser, hvordan de forurenede grundvandsboringer og alle grundvandsboringerne
(forurenede og ikke-forurenede boringer) fordeler sig blandt de tre parametre. Fordelingerne for de
forurenede boringer sammenlignes med alle boringerne, for at undersøge, hvilke parametre, der har
størst indflydelse.
Der er ikke fundet tendenser på, om pesticidforurening forekommer i bestemte jordtyper, og
variationerne er derfor for store til at kunne blive brugt til at vurdere om et område er sårbart
overfor pesticidforurening. Fordelingerne af grundvandsboringerne på baggrund af filterdybden
viser, at jo tættere på overfladen en grundvandsboring er placeret, jo mere sårbar er den overfor
pesticidforurening. Når indflydelsen af dybden på sårbarheden vurderes ud fra, hvilke vandtyper, der
er fundet i de forurenede boringer, er der ikke nogen klar tendens om, at der kun er fundet
overfladenære vandtyper i de forurenede boringer. Der skal derfor tages et forbehold, hvis
vandtyper skal benyttes som parameter til at udpege sårbare områder. I Aalborg Kommune er
grundvandsmagasinerne QS3 og kalk-magasiner vurderet til at være de mest sårbare, og i Herning
Kommune er QS2 og QS3 vurderet til at være mest sårbare.
Diskussionen fokuserer på, om tykkelsen af de beskyttende lerlag placeret over magasinerne har
indflydelse på sårbarheden overfor pesticidforurening. Det undersøges også, hvor stor
grundvandsdannelsen er i de udpegede grundvandsmagasiner, da det antages, at hvis der er en høj
grundvandsdannelse, er magasinet sårbart. De tilgængelige data er på nogle områder begrænsede,
og det medfører, at der forekommer nogle modsigelser, når data bliver benyttet til at finde en
metode til at vurdere om et område er sårbart overfor pesticidforurening. Det optimale ville være at
have data for alle de parametre som er vurderet til at have indflydelse på pesticidforurening for alle
de forurenede grundvandsboringer, således at sammenligningsgrundlaget mellem boringerne er det
samme.

Page 6 of 57
Assessment of areas’ vulnerability to pesticide contamination
Page 7 of 57
Preface
Preface
This master thesis with the title: Assessment of areas´ vulnerability to pesticide contamination is
completed by a master student in Physical Geography at Aalborg University in the period February
2012 to June 2012. The supervisor on this thesis has been Morten Lauge Pedersen, and Jacob Birk
Jensen as the contact from NIRAS. The thesis has been a cooperative project together with the
Water department in NIRAS.
The thesis is focusing on which parameters affect pesticide contamination of groundwater, and from
this which ones it is necessary to take into account when trying to find a method to assess if areas
are vulnerability to pesticide contamination.
Most of the data used in this thesis has been received from NIRAS (Morten Westergaard).
In the report the source reference are given after the Harvard method. The author, year, and in
some cases the page number will appear in the text. If more than one reference has the same author
and year there will be added a letter to be able to distinguish between different references.
Appendices are found on a CD in the back of the report.
Page 8 of 57
Assessment of areas’ vulnerability to pesticide contamination
Page 9 of 57
Preface
Contents Resumé ................................................................................................................................................... 5
Preface .................................................................................................................................................... 7
1. Introduction ...................................................................................................................................... 11
1.1 Method ....................................................................................................................................... 13
2. Groundwater – the necessary natural resource ............................................................................... 17
2.1 Origin and movement of groundwater ....................................................................................... 17
2.2.1 Groundwater recharge......................................................................................................... 19
2.2.2 Aquifers ................................................................................................................................ 20
2.2.3 Water types .......................................................................................................................... 21
3. Use of pesticides ............................................................................................................................... 23
3.1 Loss of pesticides ........................................................................................................................ 23
4. What is affecting pesticide contamination of groundwater? ........................................................... 27
4.1 Description of available data ...................................................................................................... 28
5. Soil layers in the selected areas ........................................................................................................ 31
5.1 Aquifers from the DK-model ....................................................................................................... 32
6. Parameters influencing the vulnerability .......................................................................................... 35
6.1 Aalborg Municipality ................................................................................................................... 35
6.2 Herning Municipality ................................................................................................................... 40
6.3 Recapitulation ............................................................................................................................. 44
6.3.1 Aalborg Municipality ............................................................................................................ 44
6.3.2 Herning Municipality ............................................................................................................ 45
7. Vulnerable areas ............................................................................................................................... 47
7.1 Parameters .................................................................................................................................. 47
7.2 Data limitations ........................................................................................................................... 49
7.3 Solutions to data limitations ....................................................................................................... 50
8. Conclusion ......................................................................................................................................... 51
References ............................................................................................................................................ 53
List of Appendices ................................................................................................................................. 57

Page 10 of 57
Assessment of areas’ vulnerability to pesticide contamination
Page 11 of 57
1. Introduction
1. Introduction
Access to water is a vital human need, whether it is from streams, lakes, springs, direct rainfall or
from groundwater. With increasing industrialization and population, the amounts of human and
industrial waste increase and find the way to our water resources as a threat of contamination
(Skinner et al. 2004, pp. 384). The access to clean drinking water is of crucial importance for human
health and every development in a society (Rosenstand and Marvil 2010).
The groundwater in Denmark is a very important natural resource for drinking water use, since
almost all of our drinking water (97 %) is from extracted groundwater. But contamination is a threat
to the groundwater. In the last 30 years, an increasing number of groundwater drillings have been
closed down because of contamination. It is not always easy to track where the contamination is
coming from or what the source of contamination is. A rule of thumb is that wherever there is
groundwater recharge, there will be vulnerability towards contamination, and the bigger the
groundwater recharge is, the bigger the vulnerability (Amtsrådsforeningen 2002 and GEUS 2010, e).
One of the big threats of contamination against the groundwater quality is the use of pesticides in
agriculture and private gardens. The impact of pesticides on groundwater quality is an issue of
national importance, because the pesticide contamination is a big threat to human and
environmental health (Bicki 1989). Every year more and more groundwater drillings are closing
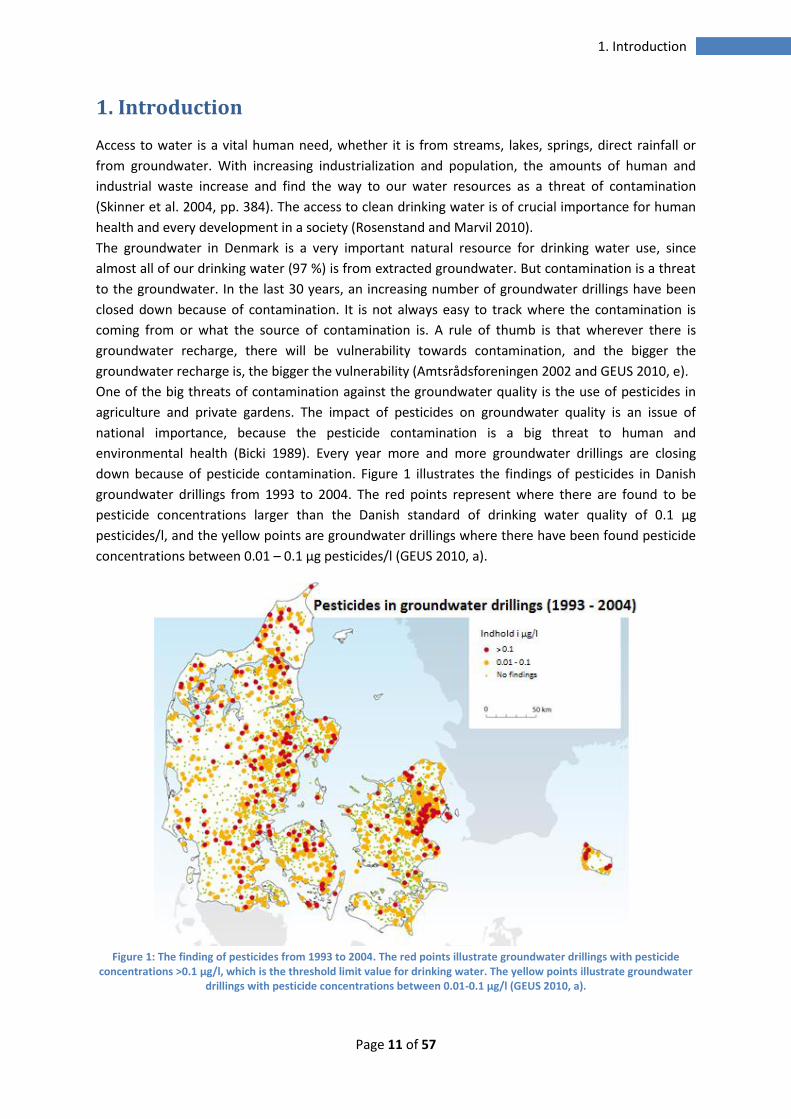
down because of pesticide contamination. Figure 1 illustrates the findings of pesticides in Danish
groundwater drillings from 1993 to 2004. The red points represent where there are found to be
pesticide concentrations larger than the Danish standard of drinking water quality of 0.1 µg
pesticides/l, and the yellow points are groundwater drillings where there have been found pesticide
concentrations between 0.01 – 0.1 µg pesticides/l (GEUS 2010, a).
Figure 1: The finding of pesticides from 1993 to 2004. The red points illustrate groundwater drillings with pesticide
concentrations ˃0.1 µg/l, which is the threshold limit value for drinking water. The yellow points illustrate groundwater drillings with pesticide concentrations between 0.01-0.1 µg/l (GEUS 2010, a).
Page 12 of 57
Assessment of areas’ vulnerability to pesticide contamination
It is especially around the bigger cities where there have been identified high concentrations of
pesticides, which either can be explained by there being a larger density of drillings near and in
bigger cities, or it is because private and urban use of pesticides also is a problem. The threshold
limit value for groundwater has been exceeded in more than every tenth drilling (GEUS 2010, a).
In Denmark pesticides have been used since 1950´s, but it is not possible to say when pesticides
started to appear in the extracted groundwater, because it was first in 1990´s that the analysis of
groundwater for pesticides started (Amtsrådsforeningen 2002).
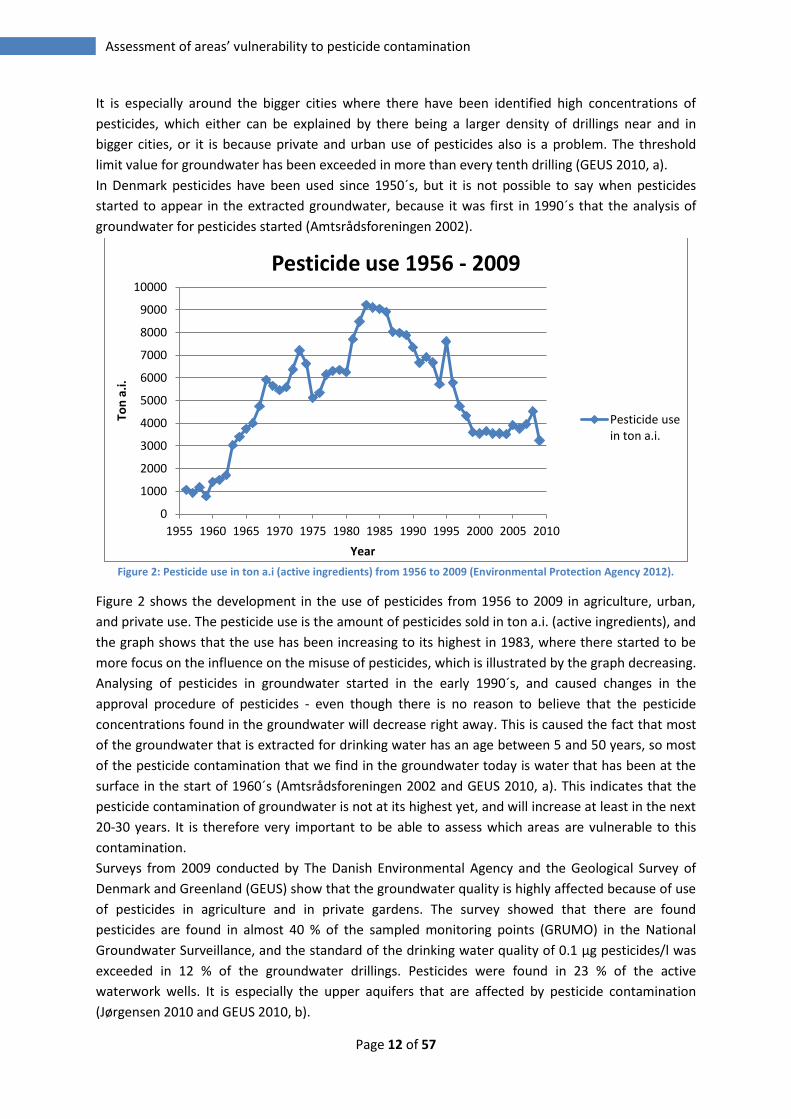
Figure 2: Pesticide use in ton a.i (active ingredients) from 1956 to 2009 (Environmental Protection Agency 2012).
Figure 2 shows the development in the use of pesticides from 1956 to 2009 in agriculture, urban,
and private use. The pesticide use is the amount of pesticides sold in ton a.i. (active ingredients), and
the graph shows that the use has been increasing to its highest in 1983, where there started to be
more focus on the influence on the misuse of pesticides, which is illustrated by the graph decreasing.
Analysing of pesticides in groundwater started in the early 1990´s, and caused changes in the
approval procedure of pesticides - even though there is no reason to believe that the pesticide
concentrations found in the groundwater will decrease right away. This is caused the fact that most
of the groundwater that is extracted for drinking water has an age between 5 and 50 years, so most
of the pesticide contamination that we find in the groundwater today is water that has been at the
surface in the start of 1960´s (Amtsrådsforeningen 2002 and GEUS 2010, a). This indicates that the
pesticide contamination of groundwater is not at its highest yet, and will increase at least in the next
20-30 years. It is therefore very important to be able to assess which areas are vulnerable to this
contamination.
Surveys from 2009 conducted by The Danish Environmental Agency and the Geological Survey of
Denmark and Greenland (GEUS) show that the groundwater quality is highly affected because of use
of pesticides in agriculture and in private gardens. The survey showed that there are found
pesticides are found in almost 40 % of the sampled monitoring points (GRUMO) in the National
Groundwater Surveillance, and the standard of the drinking water quality of 0.1 µg pesticides/l was
exceeded in 12 % of the groundwater drillings. Pesticides were found in 23 % of the active
waterwork wells. It is especially the upper aquifers that are affected by pesticide contamination
(Jørgensen 2010 and GEUS 2010, b).
0
1000
2000
3000
4000
5000
6000
7000
8000
9000
10000
1955 1960 1965 1970 1975 1980 1985 1990 1995 2000 2005 2010
Ton
a.i
.
Year
Pesticide use 1956 - 2009
Pesticide use in ton a.i.
Page 13 of 57
1. Introduction
From a change in the legislation of environmental protection in 2011 it has been possible for the
municipalities on their own initiative to protect the quality of drinking water against the threat from
pesticide contamination (Naturstyrelsen 2011). The municipality of Aalborg has therefore realised
that it is necessary to be able to identify which areas with groundwater drillings that are vulnerable
to pesticide contamination. Aalborg Municipality has hired NIRAS to find a concept that describes
how areas, which are vulnerable to pesticide contamination, can be identified.
The objective of this project is to find a method to assess if areas are vulnerable to pesticide
contamination.
This will be investigated by using data from existing groundwater drillings that are already assessed
to be contaminated by pesticides to find correlations and differences, and then compare these with
all groundwater drillings, contaminated and non-contaminated. In order to answer the following
hypotheses:
Are groundwater drillings located in areas with sand layers vulnerable to pesticide contamination?
Are groundwater drillings that extract water from younger aquifers, i.e. close to the surface and
therefore less protected, more vulnerable towards pesticide contamination?
Will there be a smaller vulnerability to pesticide contamination of the groundwater in areas where
there is a thick protecting clay layer?
To get a quantitative survey it is necessary to look at data from different locations with different
geology. The locations that have been selected are the municipalities of Aalborg and Herning. The
parameters that are necessary to investigate in different areas are: The deposits and soil conditions,
the type of aquifer where the pesticide contamination occurs, the groundwater recharge, the water
age, thickness of protecting clay layers, the depth of the filter and condition of the drill. The results
from the comparison of the parameters are used to determine how to identify vulnerable areas to
pesticide contamination.
1.1 Method This section will account for which considerations and steps it is necessary to perform, when trying
to find a way to assess if an area is vulnerable to pesticide contamination. It is necessary to have
knowledge about the water movement from when it falls on the ground as precipitation, starts
infiltrating down through the soil layers till some of it ends up in the aquifer, how it is affected on
this path and also the fate of pesticides from the application and down through the soil. These are all
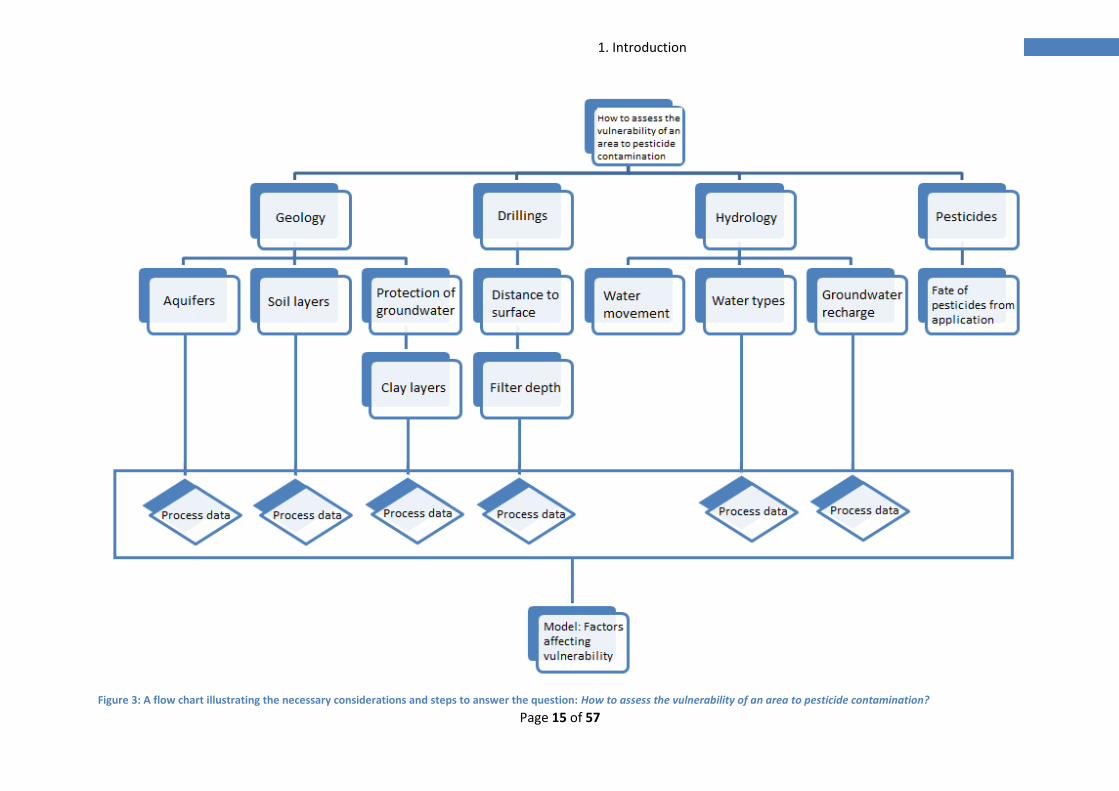
important areas to investigate in connection with pesticide contamination. Figure 3 is a flow chart
illustrating what is necessary to focus on and be aware of when assessing if an area is vulnerable to
pesticide contamination. Parameters affecting the vulnerability to pesticide contamination are:
Geology, drillings, hydrology and pesticides.
How the geology influences the vulnerability to pesticide contamination is represented in the first
hypothesis. Under the geology it is especially aquifers, soil layers, and protection of groundwater,
which are relevant. Knowledge about which aquifer the pesticide contamination occurs in, tells
Page 14 of 57
Assessment of areas’ vulnerability to pesticide contamination
something about how big an influence the deeper geology has on the vulnerability. The vulnerability
to pesticide contamination is influenced by the type of soil layers and by how easy the water can
transport pesticides down to the aquifer. The selected areas that have been chosen to look at in this
thesis are Aalborg Municipality and Herning Municipality, because they have different geologic
deposits and soil layers. These areas are compared so that it is possible to investigate how big an
influence the top soil layers have on the vulnerability to pesticide contamination. How protected an
aquifer is depends on the thickness of the clay layers, which also is an important parameter to take
into consideration.
Knowledge about the drillings is necessary since it tells something about what depth the
groundwater is extracted from, and thereby how long the pesticides have to move down through
the soils before they affect the groundwater. This is presented in the second hypothesis that
concerns whether the depth of where the groundwater is extracted from influences the vulnerability
in an area.
The water movement affects the path of the pesticides down through the soil. The groundwater can
be divided into four different water types, depending on which redox zones the water has flown
through, and how deep the groundwater is located. The groundwater recharge is also important to
focus on since it can give an indication of the amount of groundwater that is affected by pesticide
contamination.
Knowledge about the fate of a pesticide from the application on the soil surface down to the
groundwater is important, since this path partly decide if it will be a threat to the groundwater
quality or not.
How these parameters affect the vulnerability is checked by making histograms to illustrate how the
groundwater drillings, both pesticide contaminated and non-contaminated, are distributed on the
basis of filter depth, aquifers, and water types. Which aquifer the pesticide contamination occurs in
and what water type there is present in that area, also gives an indication of the depth and which
processes have affected the water. The distributions are found by calculating a histogram in
Microsoft Office Excel (See Appendix 1), which shows how many groundwater drillings are found in
each depth interval, aquifer or water type. The distributions are illustrated in a column chart with
the percentage of the drillings on the y-axis and the depth intervals, aquifers or water types on the
x-axis.
A solution to the problem of finding a way to assess which areas are vulnerable to pesticide
contamination could be a model illustrating which parameters that affect the vulnerability the most.
The model should illustrate on a drilling level the parameters which have to be focused on, in an
order showing the most influencing first. The ideal model would be a numeric model, but the
structure of this data is not strong or representative enough to use in a numeric model. The data
basis for this thesis is more suitable to a conceptual model, which is an interpretation with
characteristic and dynamic of processes, model structure, time, scale, boundary conditions, and
water balance (Henriksen and Nyegaard 2003).
Page 15 of 57
1. Introduction
Figure 3: A flow chart illustrating the necessary considerations and steps to answer the question: How to assess the vulnerability of an area to pesticide contamination?

Page 17 of 57
2. Groundwater – the necessary natural resource
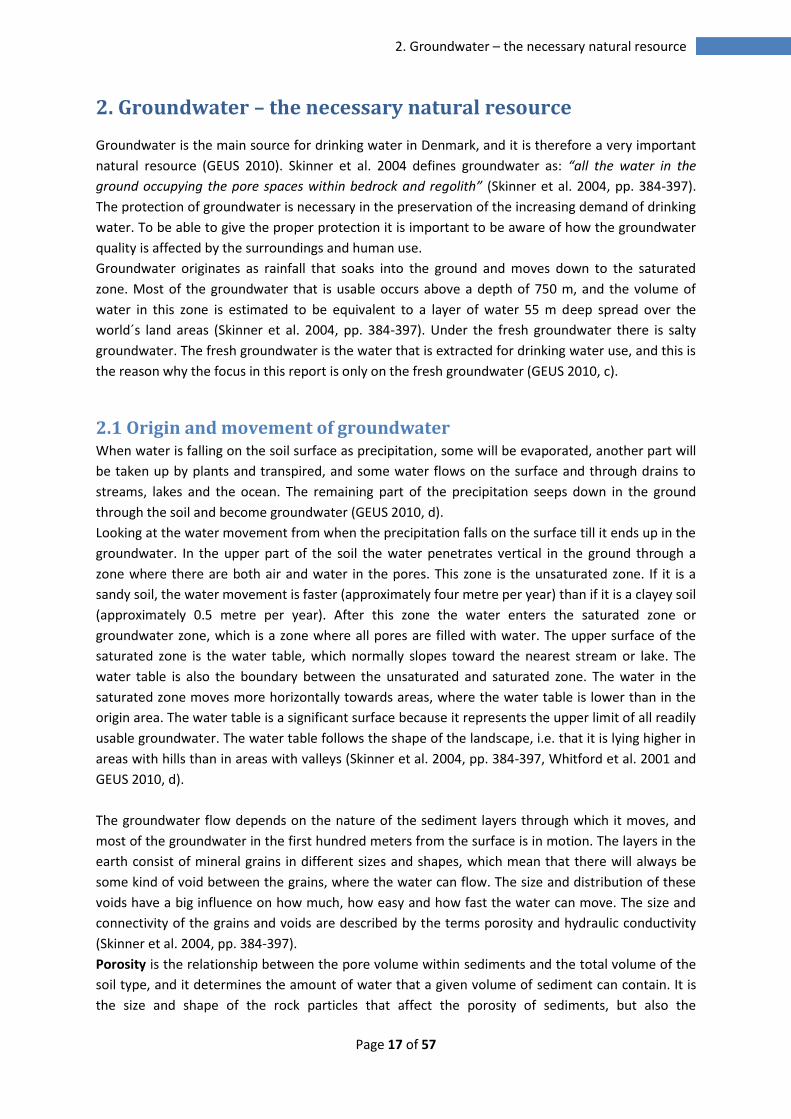
2. Groundwater – the necessary natural resource
Groundwater is the main source for drinking water in Denmark, and it is therefore a very important
natural resource (GEUS 2010). Skinner et al. 2004 defines groundwater as: “all the water in the
ground occupying the pore spaces within bedrock and regolith” (Skinner et al. 2004, pp. 384-397).
The protection of groundwater is necessary in the preservation of the increasing demand of drinking
water. To be able to give the proper protection it is important to be aware of how the groundwater
quality is affected by the surroundings and human use.
Groundwater originates as rainfall that soaks into the ground and moves down to the saturated
zone. Most of the groundwater that is usable occurs above a depth of 750 m, and the volume of
water in this zone is estimated to be equivalent to a layer of water 55 m deep spread over the
world´s land areas (Skinner et al. 2004, pp. 384-397). Under the fresh groundwater there is salty
groundwater. The fresh groundwater is the water that is extracted for drinking water use, and this is
the reason why the focus in this report is only on the fresh groundwater (GEUS 2010, c).
2.1 Origin and movement of groundwater When water is falling on the soil surface as precipitation, some will be evaporated, another part will
be taken up by plants and transpired, and some water flows on the surface and through drains to
streams, lakes and the ocean. The remaining part of the precipitation seeps down in the ground
through the soil and become groundwater (GEUS 2010, d).
Looking at the water movement from when the precipitation falls on the surface till it ends up in the
groundwater. In the upper part of the soil the water penetrates vertical in the ground through a
zone where there are both air and water in the pores. This zone is the unsaturated zone. If it is a
sandy soil, the water movement is faster (approximately four metre per year) than if it is a clayey soil
(approximately 0.5 metre per year). After this zone the water enters the saturated zone or
groundwater zone, which is a zone where all pores are filled with water. The upper surface of the
saturated zone is the water table, which normally slopes toward the nearest stream or lake. The
water table is also the boundary between the unsaturated and saturated zone. The water in the
saturated zone moves more horizontally towards areas, where the water table is lower than in the
origin area. The water table is a significant surface because it represents the upper limit of all readily
usable groundwater. The water table follows the shape of the landscape, i.e. that it is lying higher in
areas with hills than in areas with valleys (Skinner et al. 2004, pp. 384-397, Whitford et al. 2001 and
GEUS 2010, d).
The groundwater flow depends on the nature of the sediment layers through which it moves, and
most of the groundwater in the first hundred meters from the surface is in motion. The layers in the
earth consist of mineral grains in different sizes and shapes, which mean that there will always be
some kind of void between the grains, where the water can flow. The size and distribution of these
voids have a big influence on how much, how easy and how fast the water can move. The size and
connectivity of the grains and voids are described by the terms porosity and hydraulic conductivity
(Skinner et al. 2004, pp. 384-397).
Porosity is the relationship between the pore volume within sediments and the total volume of the
soil type, and it determines the amount of water that a given volume of sediment can contain. It is
the size and shape of the rock particles that affect the porosity of sediments, but also the
Page 18 of 57
Assessment of areas’ vulnerability to pesticide contamination
compactness of the particles and the weight of any overlying material (Skinner et al. 2004, pp. 384-
397).
Hydraulic conductivity, K [m/s], describes the ability of the soil layers to transport water, and it is
defined as the volume of water which per unit time can be transported through a cross-sectional
area [m2] under a hydraulic gradient of 1. The Darcy velocity q [m/s] is defined as the discharge Q
[m3/s] divided by the flow through a cross-sectional area A [m2] (Jensen 2005 pp. 5-1 and 5-2):
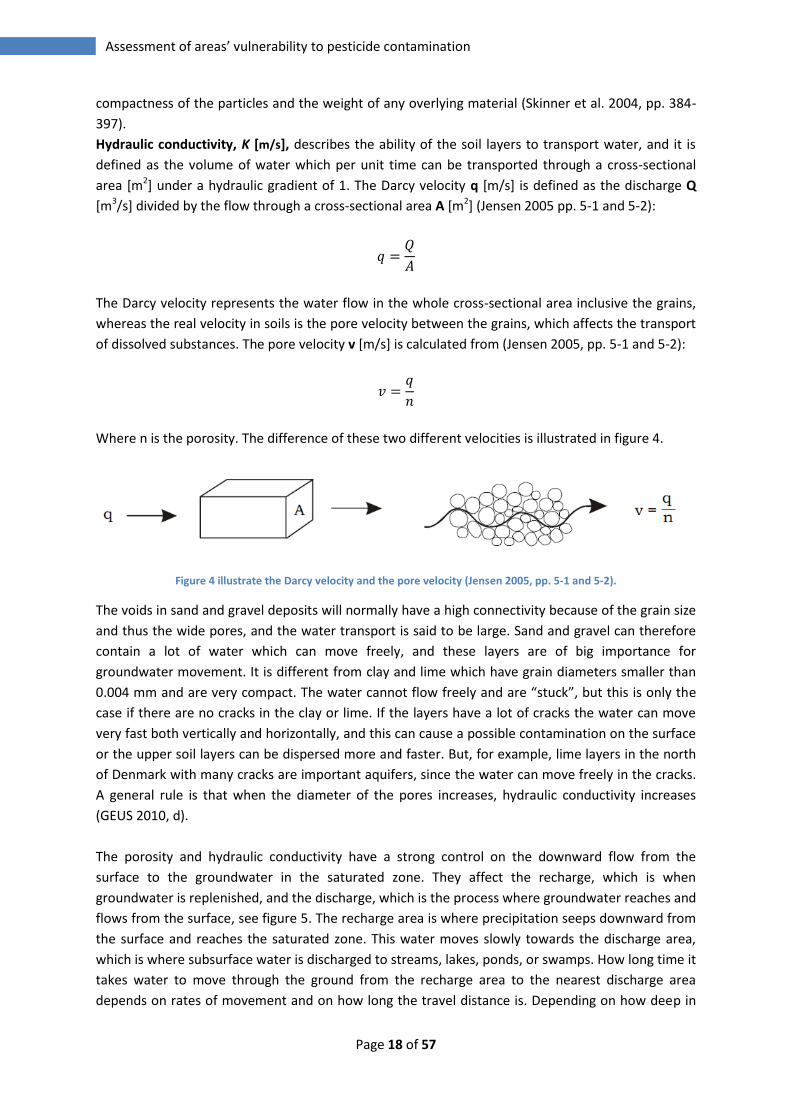
The Darcy velocity represents the water flow in the whole cross-sectional area inclusive the grains,
whereas the real velocity in soils is the pore velocity between the grains, which affects the transport
of dissolved substances. The pore velocity v [m/s] is calculated from (Jensen 2005, pp. 5-1 and 5-2):
Where n is the porosity. The difference of these two different velocities is illustrated in figure 4.
Figure 4 illustrate the Darcy velocity and the pore velocity (Jensen 2005, pp. 5-1 and 5-2).
The voids in sand and gravel deposits will normally have a high connectivity because of the grain size
and thus the wide pores, and the water transport is said to be large. Sand and gravel can therefore
contain a lot of water which can move freely, and these layers are of big importance for
groundwater movement. It is different from clay and lime which have grain diameters smaller than
0.004 mm and are very compact. The water cannot flow freely and are “stuck”, but this is only the
case if there are no cracks in the clay or lime. If the layers have a lot of cracks the water can move
very fast both vertically and horizontally, and this can cause a possible contamination on the surface
or the upper soil layers can be dispersed more and faster. But, for example, lime layers in the north
of Denmark with many cracks are important aquifers, since the water can move freely in the cracks.
A general rule is that when the diameter of the pores increases, hydraulic conductivity increases
(GEUS 2010, d).
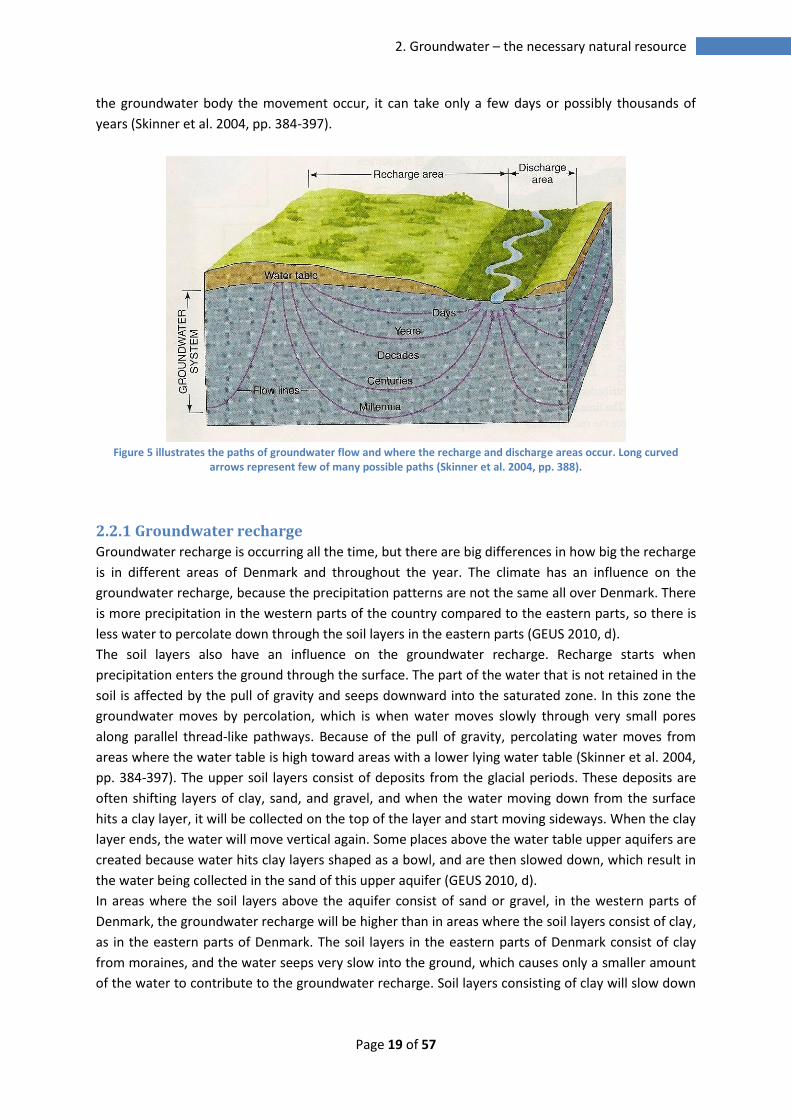
The porosity and hydraulic conductivity have a strong control on the downward flow from the
surface to the groundwater in the saturated zone. They affect the recharge, which is when
groundwater is replenished, and the discharge, which is the process where groundwater reaches and
flows from the surface, see figure 5. The recharge area is where precipitation seeps downward from
the surface and reaches the saturated zone. This water moves slowly towards the discharge area,
which is where subsurface water is discharged to streams, lakes, ponds, or swamps. How long time it
takes water to move through the ground from the recharge area to the nearest discharge area
depends on rates of movement and on how long the travel distance is. Depending on how deep in
Page 19 of 57
2. Groundwater – the necessary natural resource
the groundwater body the movement occur, it can take only a few days or possibly thousands of
years (Skinner et al. 2004, pp. 384-397).
Figure 5 illustrates the paths of groundwater flow and where the recharge and discharge areas occur. Long curved
arrows represent few of many possible paths (Skinner et al. 2004, pp. 388).
2.2.1 Groundwater recharge
Groundwater recharge is occurring all the time, but there are big differences in how big the recharge
is in different areas of Denmark and throughout the year. The climate has an influence on the
groundwater recharge, because the precipitation patterns are not the same all over Denmark. There
is more precipitation in the western parts of the country compared to the eastern parts, so there is
less water to percolate down through the soil layers in the eastern parts (GEUS 2010, d).
The soil layers also have an influence on the groundwater recharge. Recharge starts when
precipitation enters the ground through the surface. The part of the water that is not retained in the
soil is affected by the pull of gravity and seeps downward into the saturated zone. In this zone the
groundwater moves by percolation, which is when water moves slowly through very small pores
along parallel thread-like pathways. Because of the pull of gravity, percolating water moves from
areas where the water table is high toward areas with a lower lying water table (Skinner et al. 2004,
pp. 384-397). The upper soil layers consist of deposits from the glacial periods. These deposits are
often shifting layers of clay, sand, and gravel, and when the water moving down from the surface
hits a clay layer, it will be collected on the top of the layer and start moving sideways. When the clay
layer ends, the water will move vertical again. Some places above the water table upper aquifers are
created because water hits clay layers shaped as a bowl, and are then slowed down, which result in
the water being collected in the sand of this upper aquifer (GEUS 2010, d).
In areas where the soil layers above the aquifer consist of sand or gravel, in the western parts of
Denmark, the groundwater recharge will be higher than in areas where the soil layers consist of clay,
as in the eastern parts of Denmark. The soil layers in the eastern parts of Denmark consist of clay
from moraines, and the water seeps very slow into the ground, which causes only a smaller amount
of the water to contribute to the groundwater recharge. Soil layers consisting of clay will slow down
Page 20 of 57
Assessment of areas’ vulnerability to pesticide contamination
the water much more than sand layers, because clay layers have a lower hydraulic conductivity
(Gravesen et al. 2004 and GEUS 2010, d).
2.2.2 Aquifers
It is the geology of a particular location that determines
the depth and volume of groundwater. Groundwater
that is available to supply wells and springs comes from
aquifers, which are geologic formations. These aquifers
can both be shallow, near the earth´s surface or very
deep in the ground. An aquifer is a body of highly
permeable rock that can transport water and is
composed of various materials. Aquifers consist mainly
of loose deposits of sand, gravel or lime with water in
the voids between particles or in the cracks (Whitford
et al. 2001, pp. 6-7, Skinner et al. 2004, pp. 384-397 and
Davie 2008, pp. 61-63).
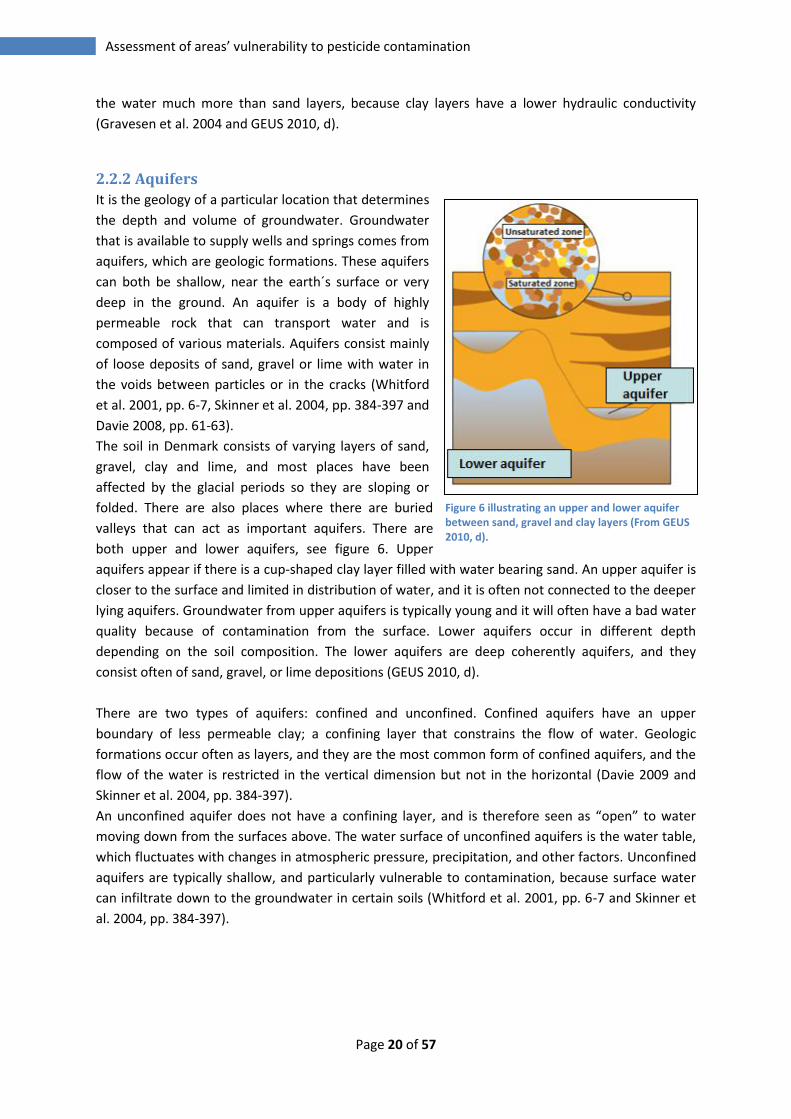
The soil in Denmark consists of varying layers of sand,
gravel, clay and lime, and most places have been
affected by the glacial periods so they are sloping or
folded. There are also places where there are buried
valleys that can act as important aquifers. There are
both upper and lower aquifers, see figure 6. Upper
aquifers appear if there is a cup-shaped clay layer filled with water bearing sand. An upper aquifer is
closer to the surface and limited in distribution of water, and it is often not connected to the deeper
lying aquifers. Groundwater from upper aquifers is typically young and it will often have a bad water
quality because of contamination from the surface. Lower aquifers occur in different depth
depending on the soil composition. The lower aquifers are deep coherently aquifers, and they
consist often of sand, gravel, or lime depositions (GEUS 2010, d).
There are two types of aquifers: confined and unconfined. Confined aquifers have an upper
boundary of less permeable clay; a confining layer that constrains the flow of water. Geologic
formations occur often as layers, and they are the most common form of confined aquifers, and the
flow of the water is restricted in the vertical dimension but not in the horizontal (Davie 2009 and
Skinner et al. 2004, pp. 384-397).
An unconfined aquifer does not have a confining layer, and is therefore seen as “open” to water
moving down from the surfaces above. The water surface of unconfined aquifers is the water table,
which fluctuates with changes in atmospheric pressure, precipitation, and other factors. Unconfined
aquifers are typically shallow, and particularly vulnerable to contamination, because surface water
can infiltrate down to the groundwater in certain soils (Whitford et al. 2001, pp. 6-7 and Skinner et
al. 2004, pp. 384-397).
Figure 6 illustrating an upper and lower aquifer between sand, gravel and clay layers (From GEUS 2010, d).
Page 21 of 57
2. Groundwater – the necessary natural resource
2.2.3 Water types
When the water moves down through the different zones in the soil it is not only affected by the
chemical and microbial conditions, but also the presence of oxygen in the unsaturated zone,
saturated zone and in the aquifer. Denmark has humid climate conditions, i.e. the precipitation is
greater than the evaporation and leaching and oxidation will occur in the upper soil layers. The
oxidation and reduction are moving down through the soil layers as “fronts”, which represents
boundaries between different chemical environments. It is called the “The redox front”. Different
redox zones occur depending on how deep the water moves in the ground, and these zones are a
way of dividing the groundwater into water type A-D. Water types can tell something about how
close to the surface the groundwater is, and thereby give an indication of whether the water is
vulnerable to pesticide contamination (Gravesen et al. 2004).
A redox process is a transfer of electrons from a reducing substance (electron donor) to an oxidising
substance (electron acceptor). Redox processes affects the solubility and transport of inorganic
substances in the soil. It is therefore important to know how and when redox processes occur when
working with the vulnerability of groundwater to pesticides. When oxygen concentrations change in
the soil layers, the minerals in the soil change so they can release some of their chemical
components. Oxidation is dependent upon the presence of oxygen and these processes occur
therefore close to the surface, while reduction processes occur at greater depth. Important oxidising
substances in the top soil layers are oxygen and nitrate, which are able to oxidise reduced
substances such as organic matter, sulfer compounds, nitrogen compounds, and iron compounds
(GEUS 2010, c and Gravesen et al. 2004, pp. 67-69).
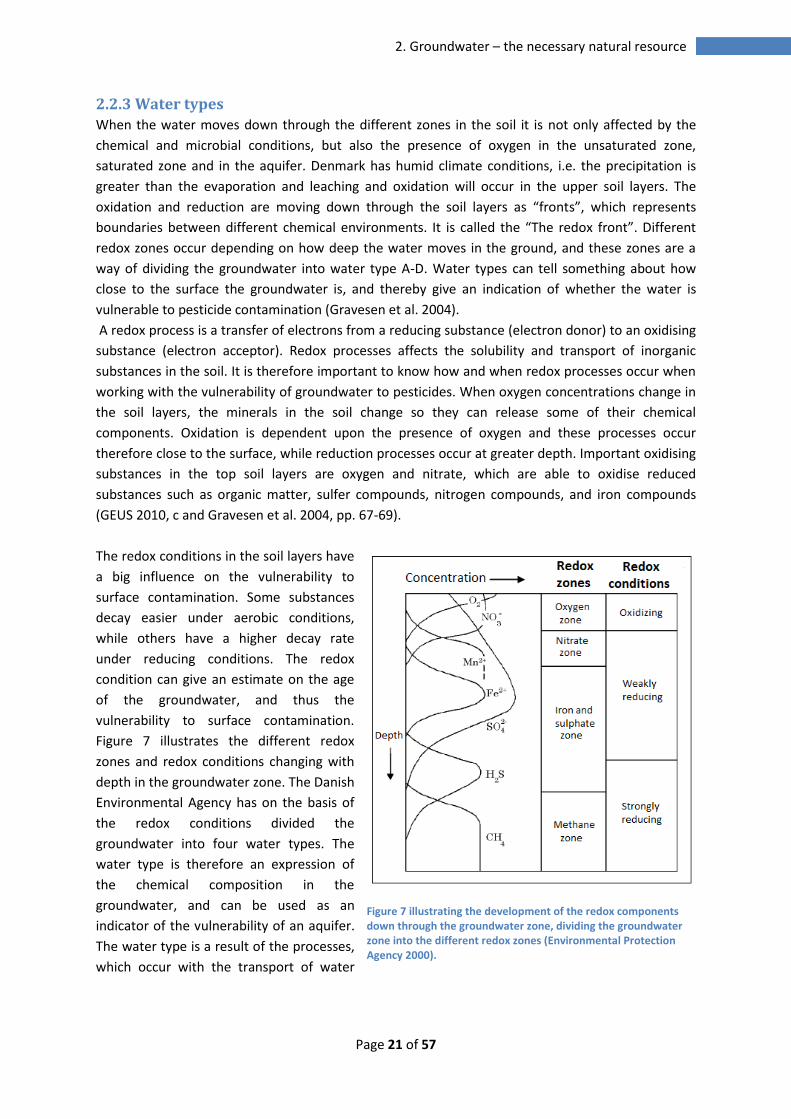
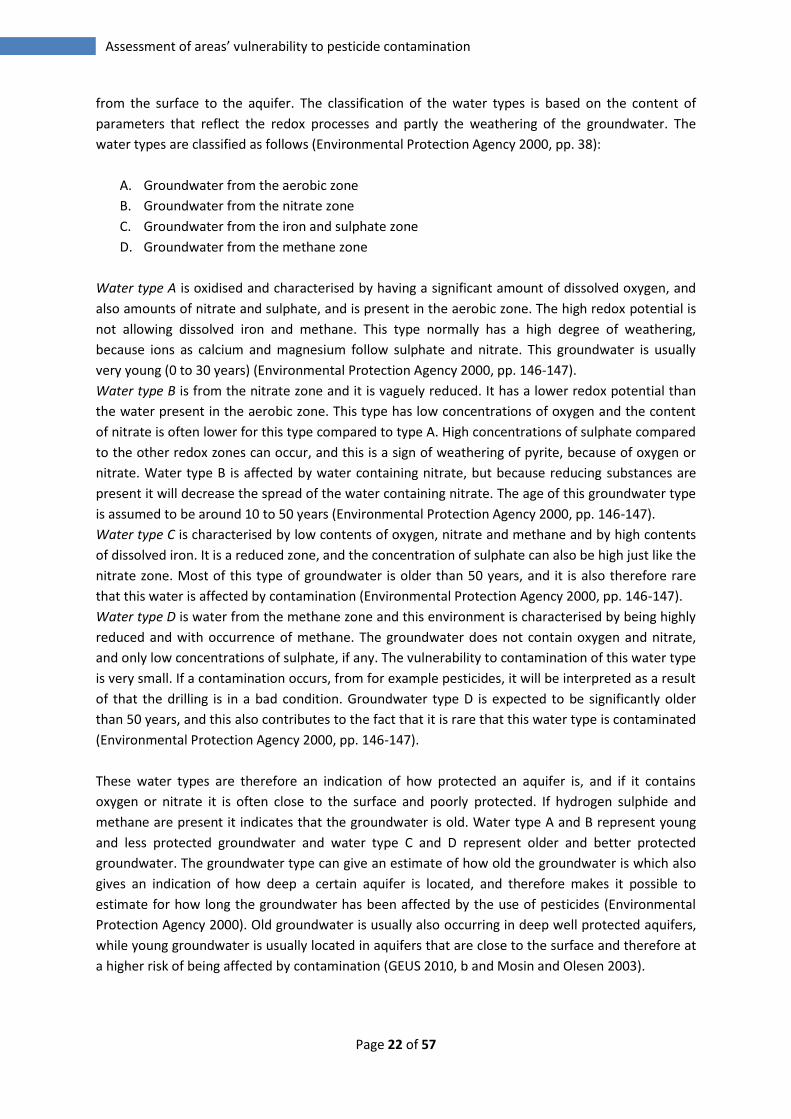
The redox conditions in the soil layers have
a big influence on the vulnerability to
surface contamination. Some substances
decay easier under aerobic conditions,
while others have a higher decay rate
under reducing conditions. The redox
condition can give an estimate on the age
of the groundwater, and thus the
vulnerability to surface contamination.
Figure 7 illustrates the different redox
zones and redox conditions changing with
depth in the groundwater zone. The Danish
Environmental Agency has on the basis of
the redox conditions divided the
groundwater into four water types. The
water type is therefore an expression of
the chemical composition in the
groundwater, and can be used as an
indicator of the vulnerability of an aquifer.
The water type is a result of the processes,
which occur with the transport of water
Figure 7 illustrating the development of the redox components down through the groundwater zone, dividing the groundwater zone into the different redox zones (Environmental Protection Agency 2000).
Page 22 of 57
Assessment of areas’ vulnerability to pesticide contamination
from the surface to the aquifer. The classification of the water types is based on the content of
parameters that reflect the redox processes and partly the weathering of the groundwater. The
water types are classified as follows (Environmental Protection Agency 2000, pp. 38):
A. Groundwater from the aerobic zone
B. Groundwater from the nitrate zone
C. Groundwater from the iron and sulphate zone
D. Groundwater from the methane zone
Water type A is oxidised and characterised by having a significant amount of dissolved oxygen, and
also amounts of nitrate and sulphate, and is present in the aerobic zone. The high redox potential is
not allowing dissolved iron and methane. This type normally has a high degree of weathering,
because ions as calcium and magnesium follow sulphate and nitrate. This groundwater is usually
very young (0 to 30 years) (Environmental Protection Agency 2000, pp. 146-147).
Water type B is from the nitrate zone and it is vaguely reduced. It has a lower redox potential than
the water present in the aerobic zone. This type has low concentrations of oxygen and the content
of nitrate is often lower for this type compared to type A. High concentrations of sulphate compared
to the other redox zones can occur, and this is a sign of weathering of pyrite, because of oxygen or
nitrate. Water type B is affected by water containing nitrate, but because reducing substances are
present it will decrease the spread of the water containing nitrate. The age of this groundwater type
is assumed to be around 10 to 50 years (Environmental Protection Agency 2000, pp. 146-147).
Water type C is characterised by low contents of oxygen, nitrate and methane and by high contents
of dissolved iron. It is a reduced zone, and the concentration of sulphate can also be high just like the
nitrate zone. Most of this type of groundwater is older than 50 years, and it is also therefore rare
that this water is affected by contamination (Environmental Protection Agency 2000, pp. 146-147).
Water type D is water from the methane zone and this environment is characterised by being highly
reduced and with occurrence of methane. The groundwater does not contain oxygen and nitrate,
and only low concentrations of sulphate, if any. The vulnerability to contamination of this water type
is very small. If a contamination occurs, from for example pesticides, it will be interpreted as a result
of that the drilling is in a bad condition. Groundwater type D is expected to be significantly older
than 50 years, and this also contributes to the fact that it is rare that this water type is contaminated
(Environmental Protection Agency 2000, pp. 146-147).
These water types are therefore an indication of how protected an aquifer is, and if it contains
oxygen or nitrate it is often close to the surface and poorly protected. If hydrogen sulphide and
methane are present it indicates that the groundwater is old. Water type A and B represent young
and less protected groundwater and water type C and D represent older and better protected
groundwater. The groundwater type can give an estimate of how old the groundwater is which also
gives an indication of how deep a certain aquifer is located, and therefore makes it possible to
estimate for how long the groundwater has been affected by the use of pesticides (Environmental
Protection Agency 2000). Old groundwater is usually also occurring in deep well protected aquifers,
while young groundwater is usually located in aquifers that are close to the surface and therefore at
a higher risk of being affected by contamination (GEUS 2010, b and Mosin and Olesen 2003).
Page 23 of 57
3. Use of pesticides
3. Use of pesticides
The use and loss of pesticides have an influence on the vulnerability of groundwater to pesticide
contamination, because how the pesticide reacts and which path it moves, decides if it will be a
threat to the groundwater quality or not. Pesticides are widely used on crops to increase yields, save
energy and labour and to make crop production efficient and profitable. Because of these purposes,
pesticides have become indispensable in modern agriculture, but the use and misuse is also a threat
to groundwater quality (Bicki 1989).
Pesticides are a group of chemical compounds that are used in agriculture to protect the crops or
enhance the growth of the crops. Pesticides are not occurring naturally in the environment and are
synthetically produced. The toxicity of a pesticide is connected to the chemical structure, and the
microorganisms in the soil, streams and lakes, decompose the pesticides more or less relatively
faster than other compounds (Hedemand and Strandberg 2009).
The Danish Environmental Protection Agency has the responsibility for the approval of pesticides
before they are put into use. The approval procedure for pesticides in the Danish law for chemicals
makes sure that pesticides first can be sold and used when The Danish Environmental Protection
Agency have assessed that the pesticides have no threat for human health and the environment. The
Danish approval procedure follows the legislation about pesticides from the European Union (EU).
The legislation operates with a principle of a positive list, which means that all the active substances
have to be assessed in EU, and then if they get approved they can be used in the different pesticides
that are individually approved in the different EU-countries (Environmental Protection Agency 2009).
However new analysis has shown that approved pesticides also are identified in groundwater
drillings, and it is therefore necessary to assess if areas are vulnerable to pesticide contamination
(Amtsrådsforeningen 2002 and GEUS 2010, a).
3.1 Loss of pesticides When pesticides are used in agriculture and for private use, interactions will happen with the soil,
surface water and groundwater. These interactions occur as different processes: transformation,
transfer and transport. Transformation is biological and chemical processes that change the
structure of the pesticides or degrade it. Transfer is how a pesticide is distributed between solids and
gases or between solids and liquids. Transport is leaching of pesticides through soil to groundwater,
runoff to surface water or volatilization. When pesticides are applied to a field, different reactions
will occur depending on the way the pesticides are applied. Foliar-applied pesticides will stick to
leaves, and get absorbed. But not all of it gets absorbed, some will be washed off by rainfall to the
soil surface below, and others may be transformed by sunlight. If the pesticide is applied on the soil,
it will generally interact first with moisture around and between soil particles, which influence how
the chemical reacts to the environment. A number of different processes occur when the pesticides
are applied to the surface and these affect the loss of pesticides through the soil. These processes
are: Sorption (transfer), degradation by microbial and chemical reactions (transformation), and the
three transport processes, which are volatilization to the atmosphere, leaching into deeper soil
profiles, and runoff, which all occur from soil solution (Bicky 1989 and Whitford et al. 2001).
Page 24 of 57
Assessment of areas’ vulnerability to pesticide contamination
Sorption
Sorption is a transfer process, where pesticides are dispersed between solid matter and soil water.
An important environmental sink, such as retention or storage site, for many pesticides is organic
matter. The organic matter called humus is a series of organic polymers consisting of a hydrophilic
(water-loving) surface and a hydrophobic (water-hating) interior. Non-ionic pesticides which are
non-charged or neutral will escape from soil solution into the hydrophobic interior, and this will
result in a pesticide-equilibrium between organic matter and soil solution. Water soluble pesticides
tend to remain at the surface of soil organic matter, while the insoluble will penetrate to the
hydrophobic interior (Whitford et al. 2001).
The soil water content will have an influence on the sorption to soil particles, because water is
necessary for the movement of chemicals. Pesticide sorption tends to be greater in dry soils than in
wet soils, because water molecules will compete with pesticide molecules for attachment sites on
clay and organic matter. If the soil water content decreases, the pesticides are forced to interact
with soil surfaces. The amount of sorption is also dependent on the type of clay and organic matter,
which determine how mobile a pesticide is in a certain area. For example tightly sorbed pesticides
have decreased mobility, and are therefore less likely to contaminate groundwater (Whitford et al.
2001).
Degradation
Most pesticides break down as a result of chemical and microbial degradation in the soil. Some
pesticides break down into intermediate substances, called metabolites or end-products (Bicky
1989).
Microbial degradation
Microbial degradation is when microorganisms in the soil partially or completely break down a
pesticide (metabolize). It is these microorganisms that can cause changes in a pesticide when this
degradation occurs, and when oxygen is present it is called aerobic metabolism and without oxygen
it is called anaerobic metabolism. Under aerobic metabolism, a pesticide is normally transformed
into carbon dioxide and water, and under anaerobic conditions the microbial degradation may
produce additional end products, such as methane. Energy from the breakdown of the chemical can
be used for growth and reproduction, and the amount that are not fully degraded to carbon dioxide
is released back into soil solution as intermediate chemical metabolites (Whitford et al. 2001).
Abiotic degradation
Abiotic degradation is the chemical breakdown of pesticides by non-biological reactions, i.e. without
the involvement of living organisms. Generally the two most important abiotic mechanisms are
hydrolysis (reaction with water) and photolysis (reaction with sunlight). Hydrolysis is a chemical
reaction where a pesticide reacts with a water molecule, by substituting a hydroxyl (OH) group from
water (H2O) into the structure of the pesticide, and displacing another group. The extent of
breakdown is pH dependent (Whitford et al. 2001).
Photolysis involves the breakdown of organic pesticides by direct or indirect energy from sunlight.
Pesticides absorb energy from sunlight and become unstable or reactive and degrade. Photolysis can
occur where light can penetrate areas such as water surfaces, the air, on soil surfaces or on a plant
leaf (Whitford et al. 2001).
Page 25 of 57
3. Use of pesticides
Volatilization
When a solid or liquid evaporates into the atmosphere as a gas the process is called volatilization. It
provides a pathway of transfer for some pesticides. The volatilization tendency of a pesticide is
approximated by the ratio of the vapour pressure to the aqueous solubility, and compounds with
high vapour pressure and low water solubility will have a high tendency to volatilize (Whitford et al.
2001). Volatilization is increased by high temperature, low relative humidity, and air movement. So
less volatilization will occur from drier soils because the lack of water allows the pesticide to sorb
onto soil particles. After application, the pesticides are incorporated into the soil to reduce loss of
volatile pesticides to the atmosphere, but the volatilization is also dependent on the movement of
water to and from the soil surface (Whitford et al. 2001).
Leaching
Another process affecting the loss of pesticides is the transport process of downward movement
(infiltration) of pesticides in water, called leaching. This infiltration is affected by two types of flows,
which is preferential flow and matrix flow. Preferential flow allows pesticide molecules to move
rapidly through a section of the soil profile by water through for example worm holes, root channels,
and cracks. This flow reduces the pesticides from being degraded by microbes or retained by soil
particles. Matrix flow is where the pesticide moves slowly with water into small pores in soil, and it
will then have more time to contact soil particles (Whitford et al. 2001). When pesticides move
deeper into the root zone, there is less organic matter, more compaction, and lower biotic activity,
and this will reduce the potential for volatilization. Abiotic degradation reactions become more
important in the leaching past the root zone, because microbial populations are smaller below the
root zone because of the lack of oxygen. Pesticides that are weakly sorbed by soil and resist
degradation and are more likely to leach to groundwater, compared to pesticides that remain bound
to the soil (Whitford et al. 2001).
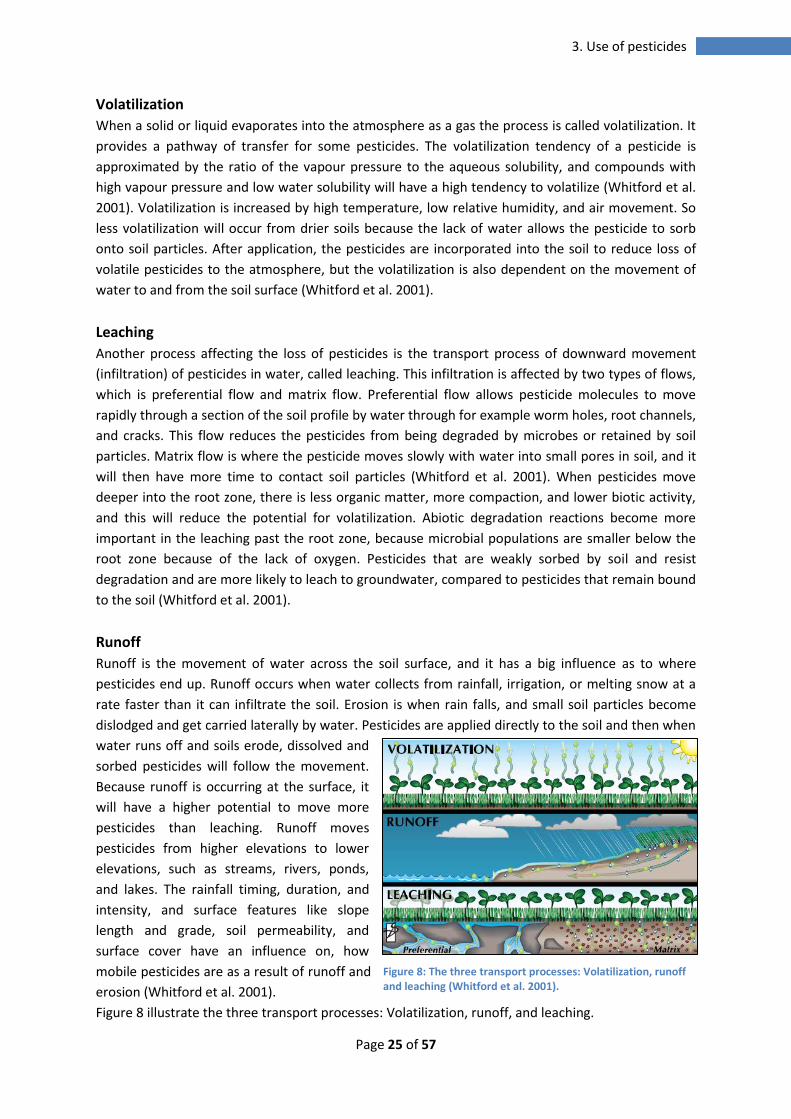
Runoff
Runoff is the movement of water across the soil surface, and it has a big influence as to where
pesticides end up. Runoff occurs when water collects from rainfall, irrigation, or melting snow at a
rate faster than it can infiltrate the soil. Erosion is when rain falls, and small soil particles become
dislodged and get carried laterally by water. Pesticides are applied directly to the soil and then when
water runs off and soils erode, dissolved and
sorbed pesticides will follow the movement.
Because runoff is occurring at the surface, it
will have a higher potential to move more
pesticides than leaching. Runoff moves
pesticides from higher elevations to lower
elevations, such as streams, rivers, ponds,
and lakes. The rainfall timing, duration, and
intensity, and surface features like slope
length and grade, soil permeability, and
surface cover have an influence on, how
mobile pesticides are as a result of runoff and
erosion (Whitford et al. 2001).
Figure 8 illustrate the three transport processes: Volatilization, runoff, and leaching.
Figure 8: The three transport processes: Volatilization, runoff and leaching (Whitford et al. 2001).

Page 26 of 57
Assessment of areas’ vulnerability to pesticide contamination
Page 27 of 57
4. What is affecting pesticide contamination of groundwater?
4. What is affecting pesticide contamination of groundwater?
It is important to be aware that the path of pesticides through the soil layers differs between
different pesticides. Different types of pesticides will sorb, leach, and react differently in the soil
depending on their chemical composition, the amount of pesticides, the vegetation cover, the soil
type, the amount of organic matter, the hydraulic conductivity, and if the soil is wet or dry. The
objective is to find a method to assess if an area is vulnerable to pesticides in general, and it has
therefore been chosen to look at the movement of pesticides as one group, instead of focusing on
the characteristics of individual pesticides.
There is a difference in what data that is available compared to the data that in the best case
scenario would be preferable to have. From chapter 2 and 3 it is possible to point out which factors
are preferable to have when the aim is to be able to give an assessment about the vulnerability of
areas towards pesticide contamination. These factors are:
- Geology and soil type
- Where the pesticide contamination occurs
- The depth of where the pesticide contamination occurs
- Groundwater recharge
- The age of the groundwater from the CFC method
- The movement of the water in the saturated zone, the hydraulic conductivity
- Thickness of protecting clay layer
- The type of aquifer that the groundwater is extracted from
- Drilling condition
This list of factors illustrates a “wishing list” that would be available in the ideal situation. It has been
necessary to use less detailed factors to replace the data which has not been available. The geology
and soil type influence how accessible the path of a pesticide through soil layers are, and are
therefore necessary to have knowledge about. To be able to point out which areas that are affected
by pesticide contamination, it is necessary to have data about where the pesticide contamination
occurs. Which depth the pesticide contamination occurs at is important, since this can indicate if the
contamination only occurs close to the surface or also in deeper soil layers. The filter depth from the
pesticide contaminated groundwater drillings can be an indicator of the depth of the contamination.
Values for groundwater recharge can tell something about if the contaminated area has a high or
low groundwater recharge, and thereby if the area is vulnerable. Data from the CFC-method gives
the age of the groundwater, which can estimate how vulnerable the groundwater is towards
pesticide contamination from the surface. There are no available data on the groundwater age from
the CFC method, and it has therefore been chosen to use the four water types, which the Danish
Environmental Agency has developed from an estimate of the redox fronts (Environmental
Protection Agency 2000, pp. 38). The hydraulic conductivity can give an indication on how easy and
fast the water moves, however when it is only in some of the drillings that this value is available for
and because this value only will show the situation in the drilling and not anything about the water´s
movement on a larger scale, it has been chosen not to include this factor in the analysis. The
thickness of clay layers above the aquifers indicates how protected the aquifer is. Another indicator
of how deep the groundwater is extracted from and how protected it is, can be data about which
aquifer the groundwater drilling is located in.
Page 28 of 57
Assessment of areas’ vulnerability to pesticide contamination
The data that have been chosen for this analysis is:
- Geology and soil type
- Drillings with pesticide concentrations over the limit value
- Filter depth
- The type of the aquifer that the groundwater is extracted from
- Groundwater recharge connected to the different aquifers
- The groundwater type
- Thickness of protecting clay layer
- Drilling condition, by looking at if the deeper extracted water has been mixed with water
closer to the surface.
A spatial illustration of the parameters would in this case be the ideal way to show which areas that
are vulnerable to pesticide contamination. The available data is on a drilling level and the data are
therefore only representing points in a larger area (appendix 2). To be able to make a spatial
illustration with the available data, a necessary assumption is that drilling conditions apply for an
area surrounding the drilling, which would give a margin of error.
4.1 Description of available data This is a description of the data that will be used in the analysis. This data is a necessity if it should be
possible to find a method that can assess if an area where groundwater is extracted is vulnerable
towards pesticide contamination.
Geology
The datasets DJF soil data and J200 are used to give an estimation of the top soil and geology in the
two selected areas (Aalborg and Herning Municipality). These datasets give an overall idea of the
geology in the selected areas, and it has been chosen to use these instead of the geology that is
registered in the individual drillings, because the aquifer is not only affected by the geology found in
the drilling, but by a much larger area around the drilling. DJF soil is published in a Basis-data map in
1:50,000 and in a digital map covering the whole country. The classification of the soil in the map
represents four factors, which are: the geologic conditions, the slopes in the terrain, the texture, and
the natural draining. The dataset is created on the basis of 40,000 tests extracted from the surface
and down to 1.7 m. It was established in 1975 – 1979 (DJF Jordbundsdata n.d.). The area for the
different soil types in DJF soil types have been calculated by using ArcMap, by adding a new field in
the attribute table and then Calculate Geometry, which gives an area for each polygon in the
dataset. These areas are then summarised for each soil type.
The dataset J200 is a national mapping of the soil conditions in a depth of approximately 1 m, which
is published by the Geological Survey of Denmark and Greenland, GEUS in 1999. There is registered
an uncertainty up to 200 m (GEUS n.d., a).
Drillings connected to a certain aquifer
To be able to know which type of aquifer and in what depth the groundwater drilling is connected
to, a dataset based on the Jupiter database and the DK-model with drillings that are connected to
certain aquifers for both the groundwater drillings in Aalborg and Herning Municipality. This dataset
Page 29 of 57
4. What is affecting pesticide contamination of groundwater?
has been received from NIRAS Aalborg on the 06.05.2012. The allocation of the groundwater
drillings to the different aquifers are created through a concept called BEST by NIRAS on the basis of
the hydro stratigraphic layers from the DK-model, categorized as NOVANA-layers (National
vandressourcemodel 2009 and NIRAS 2012, a).
Groundwater drillings – contaminated and non-contaminated drillings
The dataset for the pesticide contaminated drillings, which contain the filter depth and the pesticide
concentration found in the drillings have been received by making an enquiry in the Jupiter database
(GEUS 2012) on the groundwater drillings in Aalborg and Herning Municipality where there have
been found a pesticide concentration above the limit boundary on 0.01 µg/l. This dataset illustrates
the drillings that are contaminated, the depth of the filter, the drill depth and if the water has been
mixed. These values give an indication of how deep and thereby how protected the groundwater is.
It will also be possible to estimate if it is young or old groundwater, because the closer the aquifer is
to the surface, the younger it is.
The dataset with water types has been used to represent all groundwater drillings to be able to
compare pesticide contaminated groundwater drillings with all the groundwater drillings in Aalborg
and Herning Municipality.
Groundwater recharge
The groundwater recharge can give an estimation of how much groundwater that is vulnerable to
pesticide contamination. The origin of the dataset is from the DK-model and it illustrates what the
mean value for recharge is for the different aquifers in mm/day. Negative values are groundwater
moving down, and positive values are groundwater moving towards streams. The dataset has been
received for Aalborg and Herning Municipality (NIRAS 2012, b).
Water type
The groundwater type indicates an approximate age of the groundwater by dividing the water in
groups from A-D on the basis of the redox fronts. From this estimation of the age it is possible to see
if it is correct to assume that younger groundwater, i.e. closer to the surface is more vulnerable,
because the pesticides are not fully deactivated or decomposed before they reaches the aquifer.
Some of the values for water types is a mix of two letters or have attached an x to the letter. If the
water type has attached an x, it means that there is found a redox contradiction in the sample, if for
example water from different redox zones has been mixed. AB is where the oxygen content is
unknown. Cx is when there is a high content of oxygen in a sample, where all other values
characterize water type C. This dataset has been received for Aalborg and Herning Municipality
(NIRAS 2012, b).
Protecting clay layer connected to the different aquifers
It is necessary to have data that shows if there is a protecting clay layer or not, and how thick it is,
because this is an indication of how protected the aquifer is. The data of the clay layers is every clay
deposit connected to the four top layers in the NOVANA model. The origin of the dataset is the
Jupiter database, and it has been received for Aalborg and Herning Municipality (NIRAS 2012, b).
Page 30 of 57
Assessment of areas’ vulnerability to pesticide contamination
Page 31 of 57
5. Soil layers in the selected areas
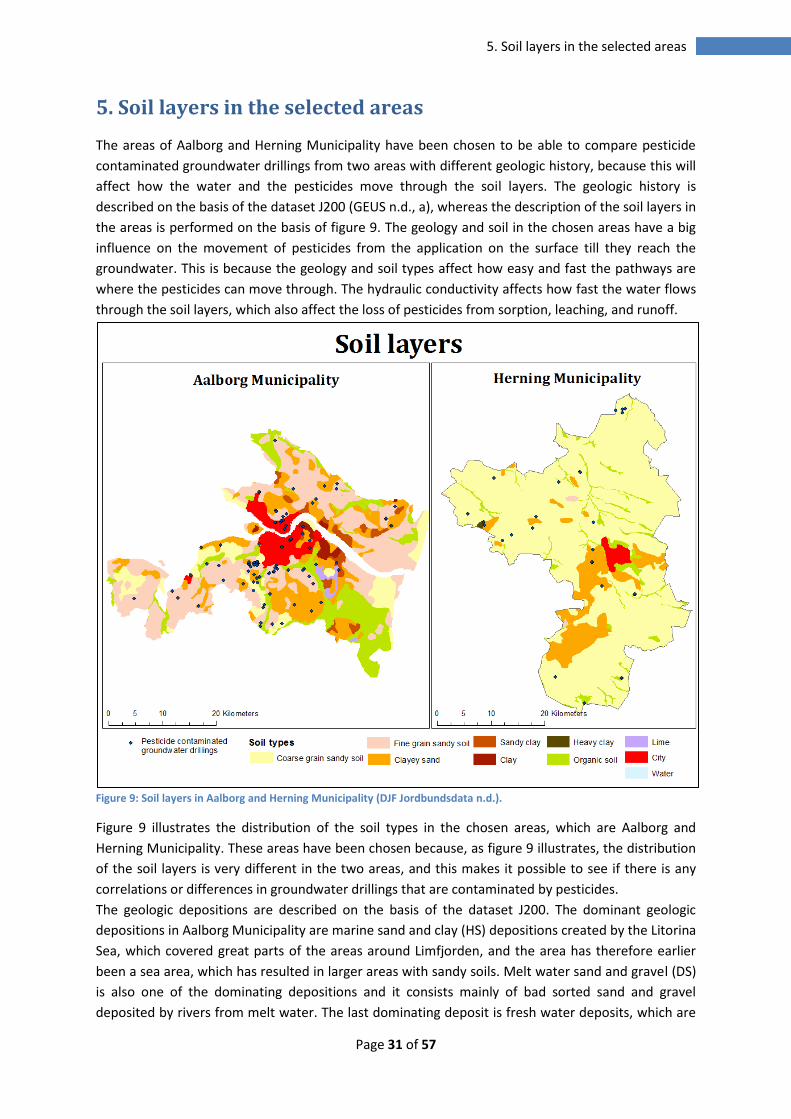
5. Soil layers in the selected areas
The areas of Aalborg and Herning Municipality have been chosen to be able to compare pesticide
contaminated groundwater drillings from two areas with different geologic history, because this will
affect how the water and the pesticides move through the soil layers. The geologic history is
described on the basis of the dataset J200 (GEUS n.d., a), whereas the description of the soil layers in
the areas is performed on the basis of figure 9. The geology and soil in the chosen areas have a big
influence on the movement of pesticides from the application on the surface till they reach the
groundwater. This is because the geology and soil types affect how easy and fast the pathways are
where the pesticides can move through. The hydraulic conductivity affects how fast the water flows
through the soil layers, which also affect the loss of pesticides from sorption, leaching, and runoff.
Figure 9: Soil layers in Aalborg and Herning Municipality (DJF Jordbundsdata n.d.).
Figure 9 illustrates the distribution of the soil types in the chosen areas, which are Aalborg and
Herning Municipality. These areas have been chosen because, as figure 9 illustrates, the distribution
of the soil layers is very different in the two areas, and this makes it possible to see if there is any
correlations or differences in groundwater drillings that are contaminated by pesticides.
The geologic depositions are described on the basis of the dataset J200. The dominant geologic
depositions in Aalborg Municipality are marine sand and clay (HS) depositions created by the Litorina
Sea, which covered great parts of the areas around Limfjorden, and the area has therefore earlier
been a sea area, which has resulted in larger areas with sandy soils. Melt water sand and gravel (DS)
is also one of the dominating depositions and it consists mainly of bad sorted sand and gravel
deposited by rivers from melt water. The last dominating deposit is fresh water deposits, which are

Page 32 of 57
Assessment of areas’ vulnerability to pesticide contamination
both organic (peat and organic silt) and mineral (clay and sand). The geological depositions in
Herning Municipality is dominated by melt water sand and gravel, extra marginal deposits, fresh
water deposits, and moraine clay. The extra marginal deposits consist of both sand and gravel, and
were deposited at the melting of the Weichselian ice sheet from North east. The moraine clay is a
sandy and silt clay with big rocks boulders scattered (GEUS n.d., b).
As figure 9 illustrates the distribution of different soil types are very broad in Aalborg Municipality,
but the dominating soil type is fine grain sandy soil, which occurs in 41.5 % of the area. Clayey sand
occurs in 19.9 % of the total area and coarse grain sandy soil represents 10.4 % of the total area.
Because big parts of the area contain sandy soils there will be a faster leaching of pesticides in these
areas compared to areas with sandy clay and clay that respectively represent 3.1 % and 1.5 % of the
total area. Organic soil represents 16.1 % of the
total area, and this will have a positive effect on
the sorption in these areas. In approximately 1
% of the area just south east of Aalborg the soil
is rich on lime.
Figure 9 also illustrates which soil layers that
occur in Herning Municipality. By looking at
figure 9 it is clear that sandy soils are very
dominant in Herning Municipality with coarse
grain sandy soil as the most dominant occurring
in 83 % of the total area and clayey sand
representing 10.9 % of the area. Organic soil
represents 4.4 % of the total area. The rest of
the area is covered by city (1.4 %), fine grain
sandy soil (0.3 %), and heavy clay (0.1 %).
This distribution of the soil types affects the
hydraulic conductivity, which has an influence
on how fast water and pesticides move down
through the soil layers, and as a comparison
the saturated hydraulic conductivity for clay is
between 10-8 – 10-12, whereas sand has a
saturated hydraulic conductivity between 10-2 -
10-5 m/s (Karlby and Sørensen 2002). Since clay
has a lower hydraulic conductivity than sand
the water and pesticides in sandy areas will
move faster down to the aquifers compared to
areas with more clay in the soil.
5.1 Aquifers from the DK-model The aquifers which are used in this thesis are aquifers found on the basis of the hydro stratigraphic
model in the DK-model. This model divides the geology on the basis of the water-bearing
characteristics. The layers from the hydro stratigraphic define mainly layers as aquifers and
impermeable layers. From the model there are found eight aquifers for Jutland, which consists of
three quaternary sand layers, four pre-quaternary sand layers, and one pre-quaternary limestone
Soil types in Aalborg Municipality
Area [km2] Percent [%]
City 76.20 6.7
Fine grain sandy soil 470.58 41.5
Coarse grain sandy soil
117.83 10.4
Organic soil 182.71 16.1
Clayey sand 225.31 19.9
Clay 16.78 1.5
Sandy clay 34.83 3.1
Lime 10.47 0.9
Total 1134.71 100
Soil types in Herning Municipality
Area [km2] Percent [%]
City 18.31 1.4
Fine grain sandy soil 3.50 0.3
Coarse grain sandy soil
1096.81 83.0
Organic soil 57.92 4.4
Clayey sand 144.30 10.9
Heavy Clay 1.33 0.1
Total 1322.18 100

Page 33 of 57
5. Soil layers in the selected areas
layer. These aquifers are constructed by looking at the boundaries between lime, clay, and sand
layers, and designated from closest the surface and down: Quaternary Sand layer 1 (QS1),
Quaternary Sand layer 2 (QS2), Quaternary Sand layer 3 (QS3), Pre-quaternary Sand layer 1 (PS1),
Pre-quaternary Sand layer 2 (PS2), Pre-quaternary Sand layer 3 (PS3), Pre-quaternary Sand layer 4
(PS4), and pre-quaternary Limestone, which are illustrated in figure 10. If the drilling filter is located
completely or partly in one layer, the drilling is assigned to this layer, but if the drilling filter is
located in more than one layer, the drilling is assigned to the layer where the majority of the filter is
located. The three quaternary sand layers are characterised by that QS1 is present in the higher lying
areas, QS2 consists most of the regional primary aquifers, QS3 account for lower aquifers and have a
limited extent. The four pre-quaternary sand layers are characterised by consisting of silica sand, and
they often account for the deep aquifers in areas. These quaternary and pre-quaternary sand layers
are bounded downwards by pre-quaternary lime deposits, which are important aquifers in areas
where the lime is close to the surface (Nyegaard et al. 2010, pp. 55-58).
Figure 10 illustrates that not all of the
hydra stratigraphic layers necessarily
occur in all of Jutland because of the
varying geology (National
vandressourcemodel 2009, NIRAS
2012, a and Nyegaard et al. 2010, pp.
16). For example there is a big
difference of which aquifers and
impermeable layers that occur in the
area of Aalborg Municipality
compared to Herning Municipality. In
Aalborg Municipality the lime is very
close to the surface and compose as
important aquifers. QS1, QS2, and
QS3 exists in the area above the pre-
quaternary limestone. The pre-
quaternary lime deposits are located
very deep in Herning Municipality,
and are therefore not relevant to focus on, but all three quaternary sand layers and all four pre-
quaternary sand layers are present (Nyegaard et al. 2010, pp. 60-61).
Figure 10: Principle sketch of the aquifers and protecting layers in Jutland, Denmark (From: National vandressource 2009).

Page 34 of 57
Assessment of areas’ vulnerability to pesticide contamination
Page 35 of 57
6. Parameters influencing the vulnerability
6. Parameters influencing the vulnerability
Pesticide contamination of groundwater is influenced by the path which the pesticides follow
through the soil layers, and by the depth of the aquifer and how protected it is. To be able to find a
way to point out which areas that are vulnerable to pesticide contamination it is necessary to
compare the distribution of pesticide contaminated groundwater drillings and all groundwater
drillings to the different factors: The depth of the groundwater drilling filter, the aquifer where the
groundwater drilling is located, and the water type, which indicate if the extracted groundwater is
young or old. Aalborg and Herning Municipality will be analysed separately and these results will
then be compared to see if there is any tendencies of where the pesticide contamination occurs.
These possible tendencies will be used for figuring out which parameters have the biggest influence
on the vulnerability. This will be used in trying to find a method to identify areas which are
vulnerable to pesticide contamination.
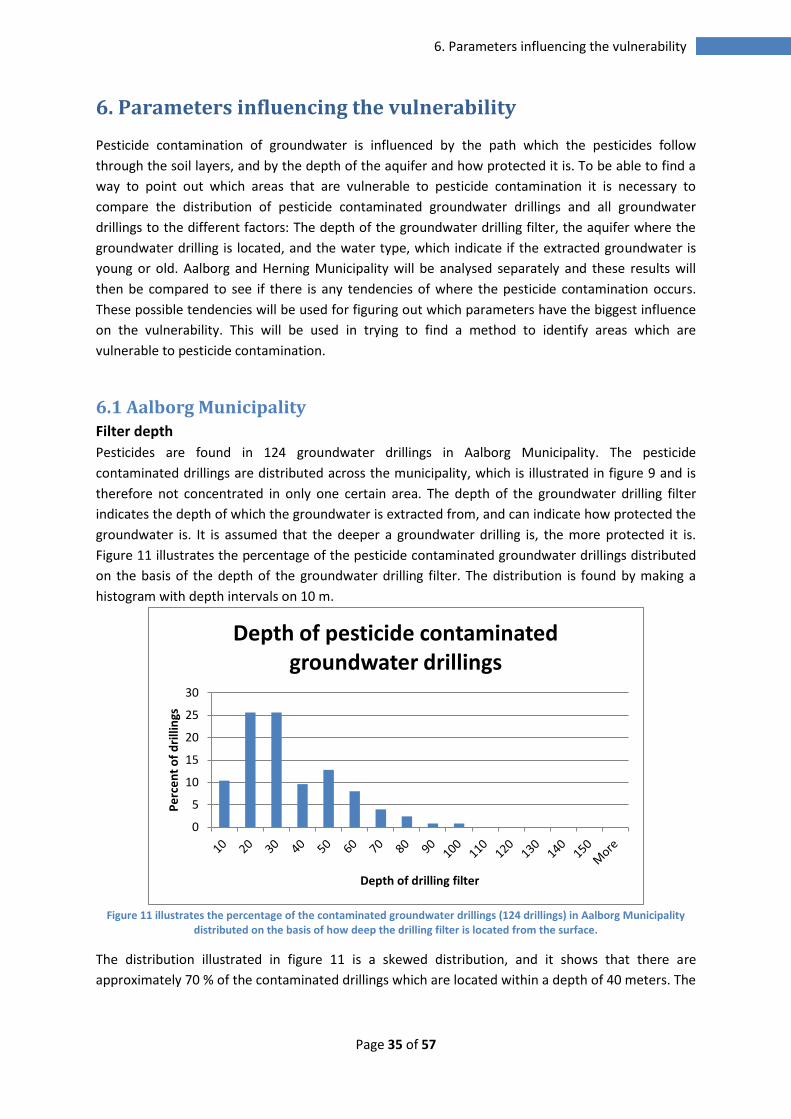
6.1 Aalborg Municipality Filter depth
Pesticides are found in 124 groundwater drillings in Aalborg Municipality. The pesticide
contaminated drillings are distributed across the municipality, which is illustrated in figure 9 and is
therefore not concentrated in only one certain area. The depth of the groundwater drilling filter
indicates the depth of which the groundwater is extracted from, and can indicate how protected the
groundwater is. It is assumed that the deeper a groundwater drilling is, the more protected it is.
Figure 11 illustrates the percentage of the pesticide contaminated groundwater drillings distributed
on the basis of the depth of the groundwater drilling filter. The distribution is found by making a
histogram with depth intervals on 10 m.
Figure 11 illustrates the percentage of the contaminated groundwater drillings (124 drillings) in Aalborg Municipality
distributed on the basis of how deep the drilling filter is located from the surface.
The distribution illustrated in figure 11 is a skewed distribution, and it shows that there are
approximately 70 % of the contaminated drillings which are located within a depth of 40 meters. The
0
5
10
15
20
25
30
Pe
rce
nt
of
dri
llin
gs
Depth of drilling filter
Depth of pesticide contaminated groundwater drillings
Page 36 of 57
Assessment of areas’ vulnerability to pesticide contamination
majority of the contamination occurs therefore in groundwater drillings located close to the surface,
especially around the filter depth of 20 and 30 m.
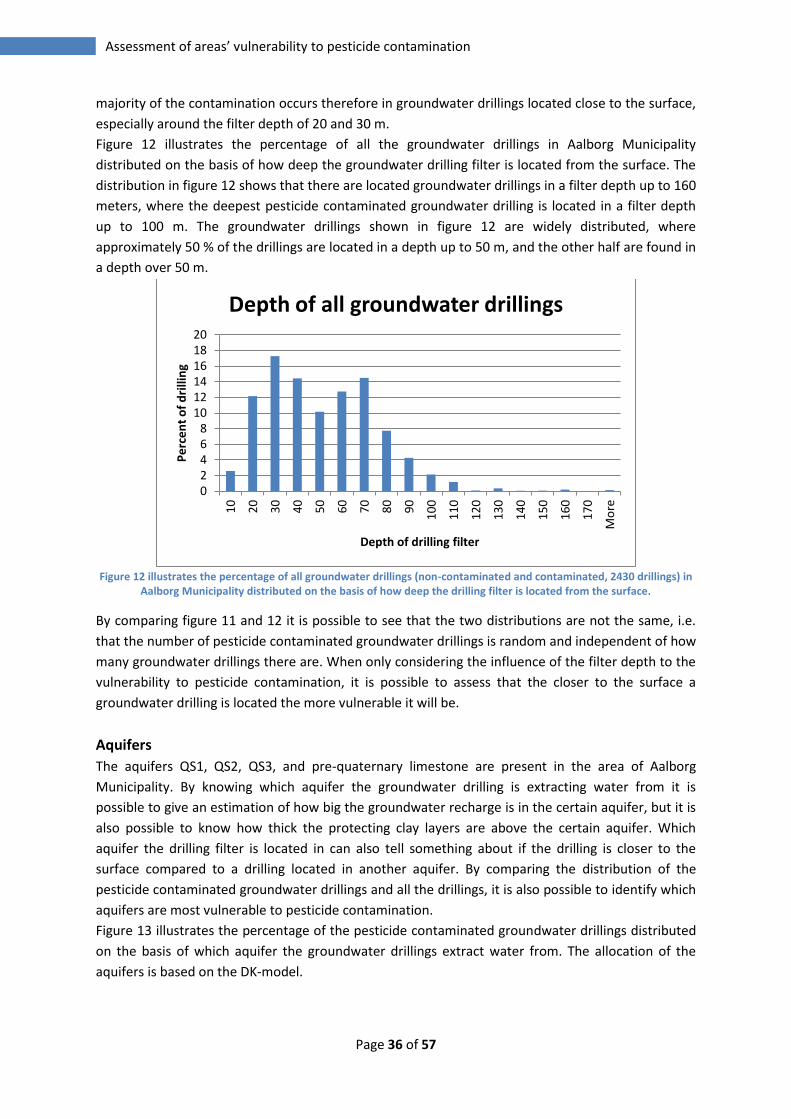
Figure 12 illustrates the percentage of all the groundwater drillings in Aalborg Municipality
distributed on the basis of how deep the groundwater drilling filter is located from the surface. The
distribution in figure 12 shows that there are located groundwater drillings in a filter depth up to 160
meters, where the deepest pesticide contaminated groundwater drilling is located in a filter depth
up to 100 m. The groundwater drillings shown in figure 12 are widely distributed, where
approximately 50 % of the drillings are located in a depth up to 50 m, and the other half are found in
a depth over 50 m.
Figure 12 illustrates the percentage of all groundwater drillings (non-contaminated and contaminated, 2430 drillings) in
Aalborg Municipality distributed on the basis of how deep the drilling filter is located from the surface.
By comparing figure 11 and 12 it is possible to see that the two distributions are not the same, i.e.
that the number of pesticide contaminated groundwater drillings is random and independent of how
many groundwater drillings there are. When only considering the influence of the filter depth to the
vulnerability to pesticide contamination, it is possible to assess that the closer to the surface a
groundwater drilling is located the more vulnerable it will be.
Aquifers
The aquifers QS1, QS2, QS3, and pre-quaternary limestone are present in the area of Aalborg
Municipality. By knowing which aquifer the groundwater drilling is extracting water from it is
possible to give an estimation of how big the groundwater recharge is in the certain aquifer, but it is
also possible to know how thick the protecting clay layers are above the certain aquifer. Which
aquifer the drilling filter is located in can also tell something about if the drilling is closer to the
surface compared to a drilling located in another aquifer. By comparing the distribution of the
pesticide contaminated groundwater drillings and all the drillings, it is also possible to identify which
aquifers are most vulnerable to pesticide contamination.
Figure 13 illustrates the percentage of the pesticide contaminated groundwater drillings distributed
on the basis of which aquifer the groundwater drillings extract water from. The allocation of the
aquifers is based on the DK-model.
0 2 4 6 8
10 12 14 16 18 20
10
20
30
40
50
60
70
80
90
10
0
11
0
12
0
13
0
14
0
15
0
16
0
17
0
Mo
re
Pe
rce
nt
of
dri
llin
g
Depth of drilling filter
Depth of all groundwater drillings
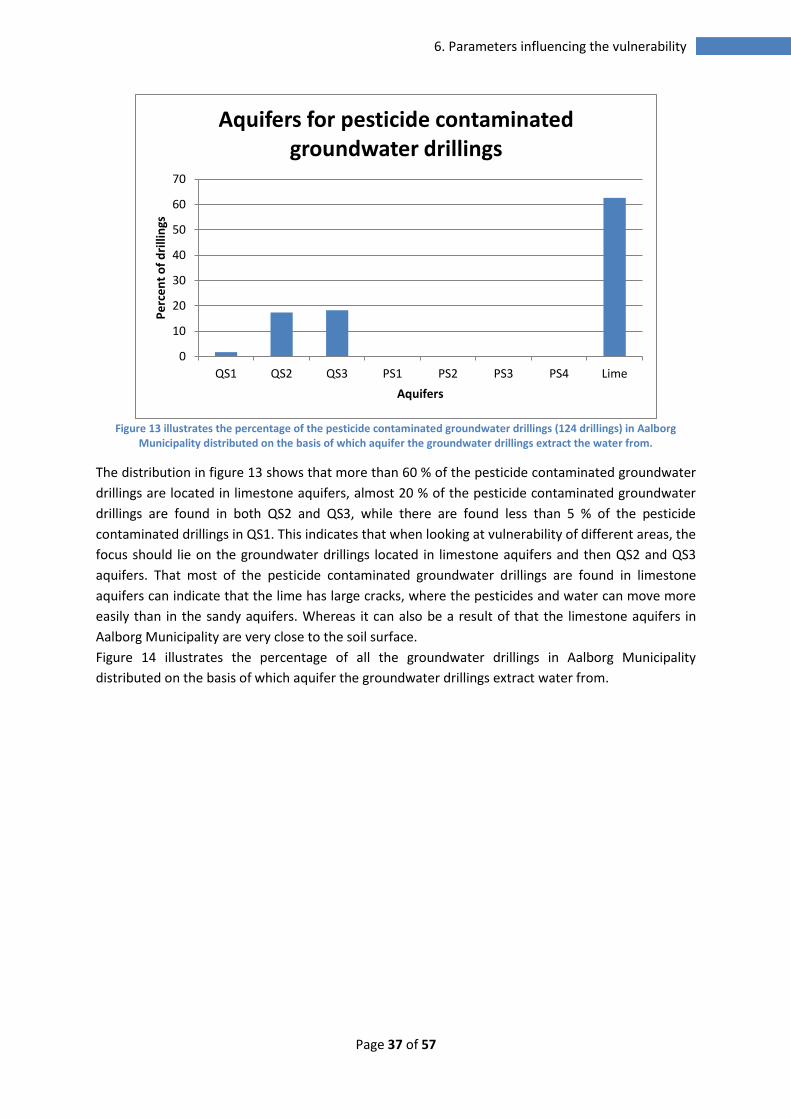
Page 37 of 57
6. Parameters influencing the vulnerability
Figure 13 illustrates the percentage of the pesticide contaminated groundwater drillings (124 drillings) in Aalborg
Municipality distributed on the basis of which aquifer the groundwater drillings extract the water from.
The distribution in figure 13 shows that more than 60 % of the pesticide contaminated groundwater
drillings are located in limestone aquifers, almost 20 % of the pesticide contaminated groundwater
drillings are found in both QS2 and QS3, while there are found less than 5 % of the pesticide
contaminated drillings in QS1. This indicates that when looking at vulnerability of different areas, the
focus should lie on the groundwater drillings located in limestone aquifers and then QS2 and QS3
aquifers. That most of the pesticide contaminated groundwater drillings are found in limestone
aquifers can indicate that the lime has large cracks, where the pesticides and water can move more
easily than in the sandy aquifers. Whereas it can also be a result of that the limestone aquifers in
Aalborg Municipality are very close to the soil surface.
Figure 14 illustrates the percentage of all the groundwater drillings in Aalborg Municipality
distributed on the basis of which aquifer the groundwater drillings extract water from.
0
10
20
30
40
50
60
70
QS1 QS2 QS3 PS1 PS2 PS3 PS4 Lime
Pe
rce
nt
of
dri
llin
gs
Aquifers
Aquifers for pesticide contaminated groundwater drillings
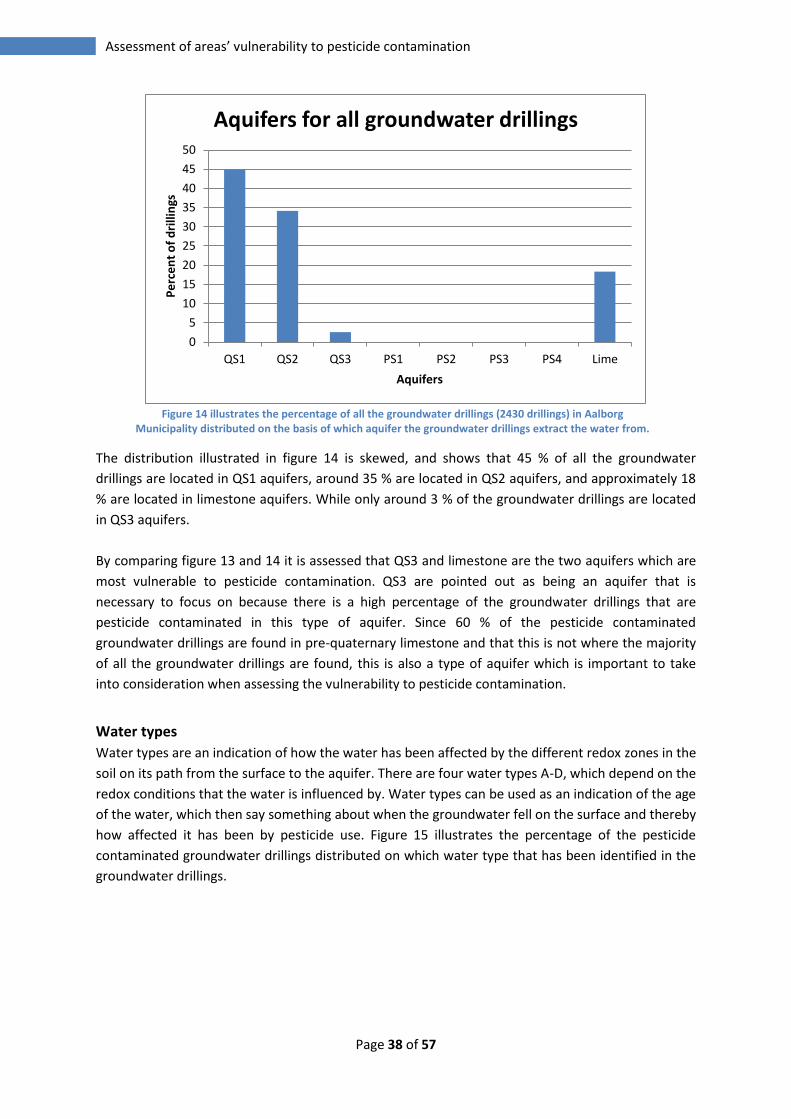
Page 38 of 57
Assessment of areas’ vulnerability to pesticide contamination
Figure 14 illustrates the percentage of all the groundwater drillings (2430 drillings) in Aalborg
Municipality distributed on the basis of which aquifer the groundwater drillings extract the water from.
The distribution illustrated in figure 14 is skewed, and shows that 45 % of all the groundwater
drillings are located in QS1 aquifers, around 35 % are located in QS2 aquifers, and approximately 18
% are located in limestone aquifers. While only around 3 % of the groundwater drillings are located
in QS3 aquifers.
By comparing figure 13 and 14 it is assessed that QS3 and limestone are the two aquifers which are
most vulnerable to pesticide contamination. QS3 are pointed out as being an aquifer that is
necessary to focus on because there is a high percentage of the groundwater drillings that are
pesticide contaminated in this type of aquifer. Since 60 % of the pesticide contaminated
groundwater drillings are found in pre-quaternary limestone and that this is not where the majority
of all the groundwater drillings are found, this is also a type of aquifer which is important to take
into consideration when assessing the vulnerability to pesticide contamination.
Water types
Water types are an indication of how the water has been affected by the different redox zones in the
soil on its path from the surface to the aquifer. There are four water types A-D, which depend on the
redox conditions that the water is influenced by. Water types can be used as an indication of the age
of the water, which then say something about when the groundwater fell on the surface and thereby
how affected it has been by pesticide use. Figure 15 illustrates the percentage of the pesticide
contaminated groundwater drillings distributed on which water type that has been identified in the
groundwater drillings.
0
5
10
15
20
25
30
35
40
45
50
QS1 QS2 QS3 PS1 PS2 PS3 PS4 Lime
Pe
rce
nt
of
dri
llin
gs
Aquifers
Aquifers for all groundwater drillings
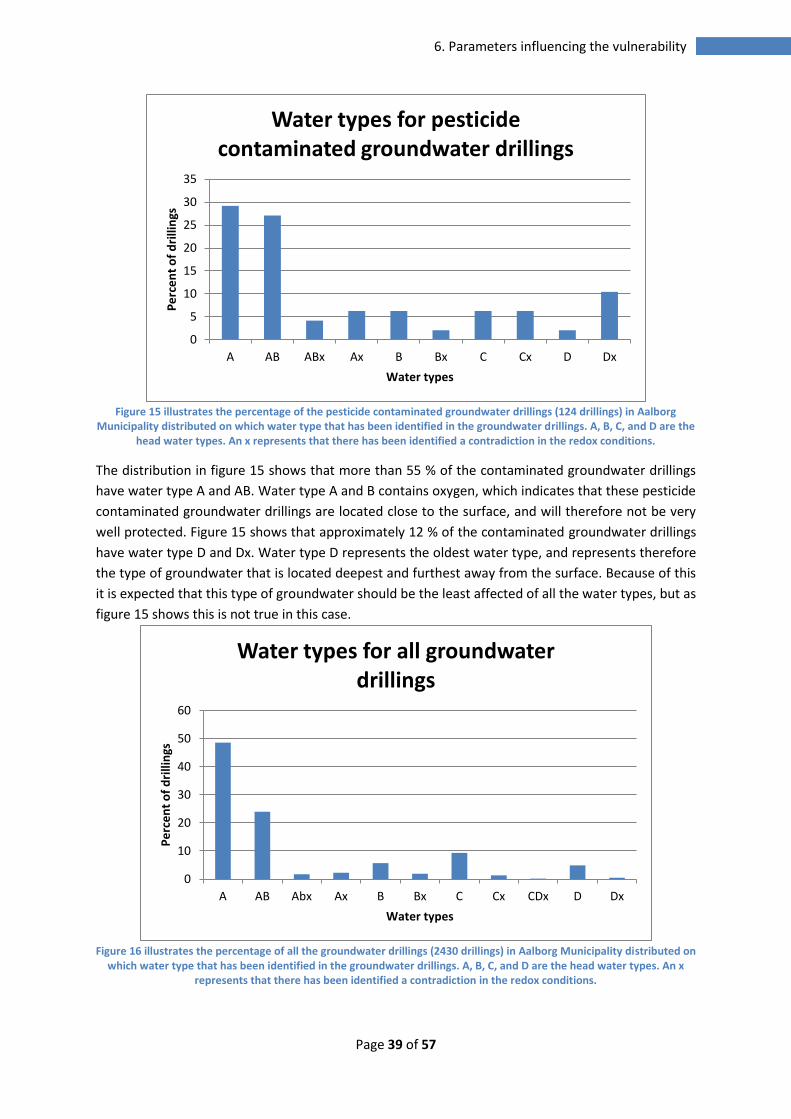
Page 39 of 57
6. Parameters influencing the vulnerability
Figure 15 illustrates the percentage of the pesticide contaminated groundwater drillings (124 drillings) in Aalborg
Municipality distributed on which water type that has been identified in the groundwater drillings. A, B, C, and D are the head water types. An x represents that there has been identified a contradiction in the redox conditions.
The distribution in figure 15 shows that more than 55 % of the contaminated groundwater drillings
have water type A and AB. Water type A and B contains oxygen, which indicates that these pesticide
contaminated groundwater drillings are located close to the surface, and will therefore not be very
well protected. Figure 15 shows that approximately 12 % of the contaminated groundwater drillings
have water type D and Dx. Water type D represents the oldest water type, and represents therefore
the type of groundwater that is located deepest and furthest away from the surface. Because of this
it is expected that this type of groundwater should be the least affected of all the water types, but as
figure 15 shows this is not true in this case.
Figure 16 illustrates the percentage of all the groundwater drillings (2430 drillings) in Aalborg Municipality distributed on
which water type that has been identified in the groundwater drillings. A, B, C, and D are the head water types. An x represents that there has been identified a contradiction in the redox conditions.
0
5
10
15
20
25
30
35
A AB ABx Ax B Bx C Cx D Dx
Pe
rce
nt
of
dri
llin
gs
Water types
Water types for pesticide contaminated groundwater drillings
0
10
20
30
40
50
60
A AB Abx Ax B Bx C Cx CDx D Dx
Pe
rce
nt
of
dri
llin
gs
Water types
Water types for all groundwater drillings
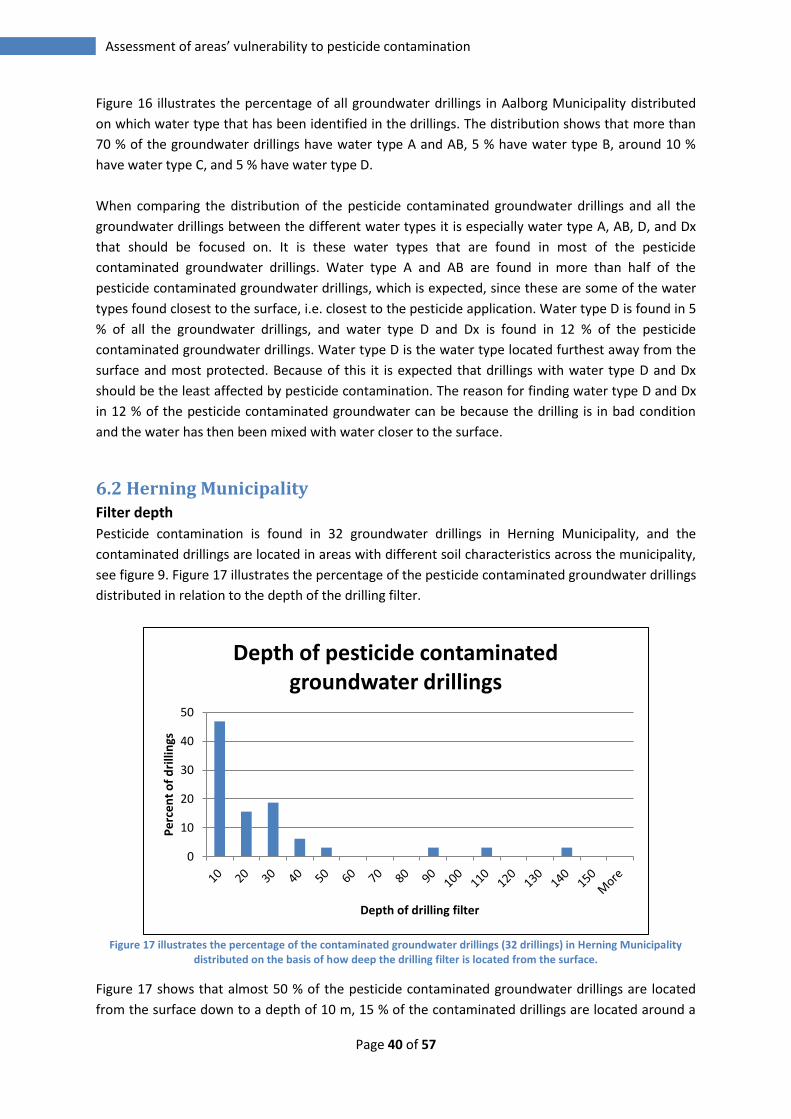
Page 40 of 57
Assessment of areas’ vulnerability to pesticide contamination
Figure 16 illustrates the percentage of all groundwater drillings in Aalborg Municipality distributed
on which water type that has been identified in the drillings. The distribution shows that more than
70 % of the groundwater drillings have water type A and AB, 5 % have water type B, around 10 %
have water type C, and 5 % have water type D.
When comparing the distribution of the pesticide contaminated groundwater drillings and all the
groundwater drillings between the different water types it is especially water type A, AB, D, and Dx
that should be focused on. It is these water types that are found in most of the pesticide
contaminated groundwater drillings. Water type A and AB are found in more than half of the
pesticide contaminated groundwater drillings, which is expected, since these are some of the water
types found closest to the surface, i.e. closest to the pesticide application. Water type D is found in 5
% of all the groundwater drillings, and water type D and Dx is found in 12 % of the pesticide
contaminated groundwater drillings. Water type D is the water type located furthest away from the
surface and most protected. Because of this it is expected that drillings with water type D and Dx
should be the least affected by pesticide contamination. The reason for finding water type D and Dx
in 12 % of the pesticide contaminated groundwater can be because the drilling is in bad condition
and the water has then been mixed with water closer to the surface.
6.2 Herning Municipality Filter depth
Pesticide contamination is found in 32 groundwater drillings in Herning Municipality, and the
contaminated drillings are located in areas with different soil characteristics across the municipality,
see figure 9. Figure 17 illustrates the percentage of the pesticide contaminated groundwater drillings
distributed in relation to the depth of the drilling filter.
Figure 17 illustrates the percentage of the contaminated groundwater drillings (32 drillings) in Herning Municipality
distributed on the basis of how deep the drilling filter is located from the surface.
Figure 17 shows that almost 50 % of the pesticide contaminated groundwater drillings are located
from the surface down to a depth of 10 m, 15 % of the contaminated drillings are located around a
0
10
20
30
40
50
Pe
rce
nt
of
dri
llin
gs
Depth of drilling filter
Depth of pesticide contaminated groundwater drillings

Page 41 of 57
6. Parameters influencing the vulnerability
depth of 20 m, and almost 20 % are extracting water in a depth of 30 m. Thus 85 % of the 32
pesticide contaminated drillings are found within a depth of 30 m.
Figure 18 illustrates the percentage of all groundwater drillings (non-contaminated and contaminated, 4457 drillings) in
Herning Municipality distributed on the basis of how deep the drilling filter is located from the surface.
Figure 18 illustrates the percentage of all the groundwater drillings (non-contaminated and
contaminated) in Herning Municipality distributed on the basis of how deep the drilling filter is
located from the surface. There are found groundwater drillings in a filter depth up to 160 m, and
the distribution shows that the deeper the drilling filter is located less and less drilling filters are
identified. The majority of the groundwater drillings are located within a depth of 30 m, which shows
that the groundwater drillings in Herning Municipality are located close to the surface.
The pesticide contaminated groundwater drillings are especially located in a depth of 10 m, which
can be explained by that the path of the pesticides from surface to the aquifer is short, and the
aquifers close to the surface are therefore poor protected and more vulnerable.
Aquifers
The aquifers that are present in Herning Municipality are Quaternary Sand layer (QS) 1, 2, 3, and Pre-
quaternary Sand layer (PS) 1, 2, and 4. This is a proof of that the soil layers and the geologic layers
are different from the ones found in Aalborg Municipality. The comparison of the two distributions,
seen in figure 19 and 20, is made to be able to identify which aquifers it is necessary to focus on
when working with the vulnerability of an area. Figure 19 illustrates the percentage of the pesticide
contaminated groundwater drillings in Herning Municipality distributed on the basis of which aquifer
the groundwater drilling extracts water from. The allocation of the aquifers is based on the DK-
model.
0
5
10
15
20
25
30
35
40
10
20
30
40
50
60
70
80
90
10
0
11
0
12
0
13
0
14
0
15
0
16
0
17
0
Mo
re
Pe
rce
nt
of
dri
llin
gs
Depth of drilling filter
Depth of all groundwater drillings
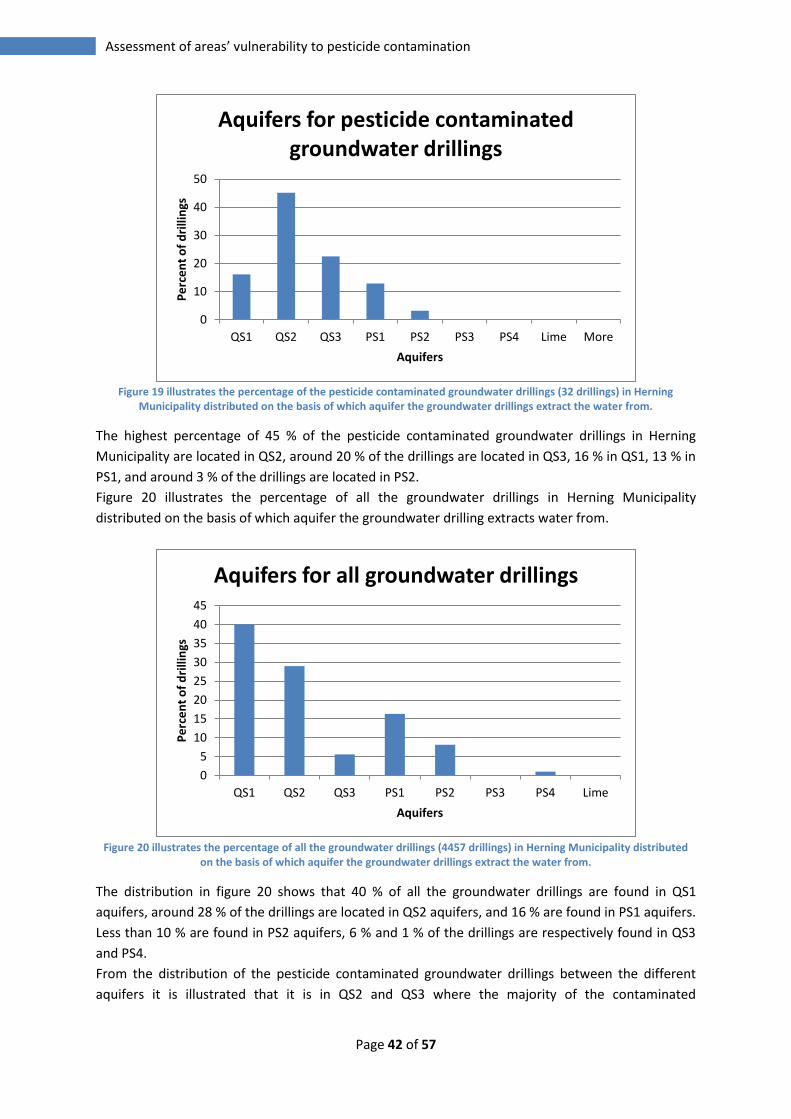
Page 42 of 57
Assessment of areas’ vulnerability to pesticide contamination
Figure 19 illustrates the percentage of the pesticide contaminated groundwater drillings (32 drillings) in Herning
Municipality distributed on the basis of which aquifer the groundwater drillings extract the water from.
The highest percentage of 45 % of the pesticide contaminated groundwater drillings in Herning
Municipality are located in QS2, around 20 % of the drillings are located in QS3, 16 % in QS1, 13 % in
PS1, and around 3 % of the drillings are located in PS2.
Figure 20 illustrates the percentage of all the groundwater drillings in Herning Municipality
distributed on the basis of which aquifer the groundwater drilling extracts water from.
Figure 20 illustrates the percentage of all the groundwater drillings (4457 drillings) in Herning Municipality distributed
on the basis of which aquifer the groundwater drillings extract the water from.
The distribution in figure 20 shows that 40 % of all the groundwater drillings are found in QS1
aquifers, around 28 % of the drillings are located in QS2 aquifers, and 16 % are found in PS1 aquifers.
Less than 10 % are found in PS2 aquifers, 6 % and 1 % of the drillings are respectively found in QS3
and PS4.
From the distribution of the pesticide contaminated groundwater drillings between the different
aquifers it is illustrated that it is in QS2 and QS3 where the majority of the contaminated
0
10
20
30
40
50
QS1 QS2 QS3 PS1 PS2 PS3 PS4 Lime More
Pe
rce
nt
of
dri
llin
gs
Aquifers
Aquifers for pesticide contaminated groundwater drillings
0
5
10
15
20
25
30
35
40
45
QS1 QS2 QS3 PS1 PS2 PS3 PS4 Lime
Pe
rce
nt
of
dri
llin
gs
Aquifers
Aquifers for all groundwater drillings
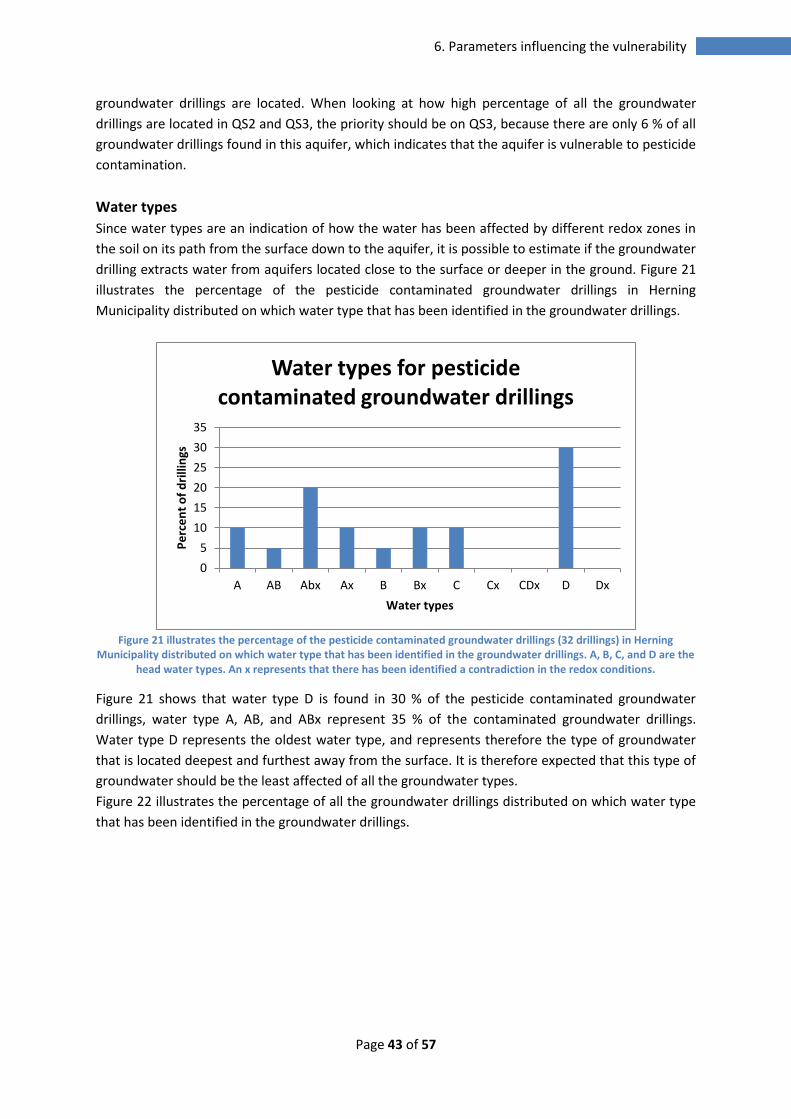
Page 43 of 57
6. Parameters influencing the vulnerability
groundwater drillings are located. When looking at how high percentage of all the groundwater
drillings are located in QS2 and QS3, the priority should be on QS3, because there are only 6 % of all
groundwater drillings found in this aquifer, which indicates that the aquifer is vulnerable to pesticide
contamination.
Water types
Since water types are an indication of how the water has been affected by different redox zones in
the soil on its path from the surface down to the aquifer, it is possible to estimate if the groundwater
drilling extracts water from aquifers located close to the surface or deeper in the ground. Figure 21
illustrates the percentage of the pesticide contaminated groundwater drillings in Herning
Municipality distributed on which water type that has been identified in the groundwater drillings.
Figure 21 illustrates the percentage of the pesticide contaminated groundwater drillings (32 drillings) in Herning
Municipality distributed on which water type that has been identified in the groundwater drillings. A, B, C, and D are the head water types. An x represents that there has been identified a contradiction in the redox conditions.
Figure 21 shows that water type D is found in 30 % of the pesticide contaminated groundwater
drillings, water type A, AB, and ABx represent 35 % of the contaminated groundwater drillings.
Water type D represents the oldest water type, and represents therefore the type of groundwater
that is located deepest and furthest away from the surface. It is therefore expected that this type of
groundwater should be the least affected of all the groundwater types.
Figure 22 illustrates the percentage of all the groundwater drillings distributed on which water type
that has been identified in the groundwater drillings.
0
5
10
15
20
25
30
35
A AB Abx Ax B Bx C Cx CDx D Dx
Pe
rce
nt
of
dri
llin
gs
Water types
Water types for pesticide contaminated groundwater drillings

Page 44 of 57
Assessment of areas’ vulnerability to pesticide contamination
Figure 22 illustrates the percentage of all the groundwater drillings (4457 drillings) in Herning Municipality distributed
on which water type that has been identified in the groundwater drillings. A, B, C, and D are the head water types. An x represents that there has been identified a contradiction in the redox conditions.
The distribution in figure 22 shows that the majority of all the groundwater drillings are distributed
between the water types: A, AB, ABx, C, and D. Approximately 48 % of the groundwater drillings are
identified as water type A, AB, and Abx, and around 27 % of the drillings are identified as water type
D. An explanation of why there are a high percentage of the pesticide contaminated groundwater
drillings that have water type D can be caused by that there are many of all the groundwater drillings
that have water type D. When comparing figure 21 and 22 there are no clear tendencies showing
that the pesticide contamination occurs in a certain water type.
6.3 Recapitulation This section will sum up the results found by comparing the distributions of the different parameters
in Aalborg and Herning Municipality. This will be done so it is possible to point out which parameters
to focus on when assessing the vulnerability. Aalborg and Herning Municipality will be summed up
separately.
6.3.1 Aalborg Municipality
The distribution of the groundwater drillings between the filter depth intervals in Aalborg
Municipality showed that the closer to the surface a groundwater drilling is located the more
vulnerable it will be. It is necessary to have different ways that can represent the depth of the
groundwater drilling, to be able to assess if an area is vulnerable to pesticide contamination. The
distribution of the groundwater drillings between the aquifers QS1, QS2, QS3, and pre-quaternary
limestone in Aalborg Municipality, is another way to indicate the distance from surface to drilling. It
is assessed from the comparison of figure 13 and 14 that the aquifers QS3 and pre-quaternary
limestone are most vulnerable to pesticide contamination. The distribution of the pesticide
contaminated groundwater drillings between the water types, illustrates that the pesticide
contaminated groundwater drillings mainly are found in water type A, AB, D, and Dx. Water type A
and AB are found close to the surface and characterised as being very young (0 to 30 years), and it
0
5
10
15
20
25
30
A AB Abx Ax B Bx C Cx CDx D Dx
Pe
rce
nt
of
dri
llin
gs
Water types
Water types for all groundwater drillings
Page 45 of 57
6. Parameters influencing the vulnerability
makes sense that these water types are found in pesticide contaminated groundwater drillings.
Water type D and Dx are the deepest water types and are therefore the oldest (significant older than
50 years) and well protected, and it is therefore not expected that this water type should be found in
pesticide contaminated groundwater drillings.
It is assessed that the focus should be on the aquifers QS3 and pre-quaternary limestone as the
baseline to investigate how big the groundwater recharge is in these aquifers and how thick the
protecting clay layers are above the aquifers to be able to point out vulnerable areas.
6.3.2 Herning Municipality
The distribution of all the groundwater drillings on the basis of the filter depth shows that most of
the groundwater drillings in Herning Municipality is located within a depth of 30 m. The majority of
the pesticide contaminated groundwater drillings are found in a depth of 10 m and therefore close
to surface. No tendencies are found in the distribution of the pesticide contaminated groundwater
drillings on the basis of the water types.
It is assessed that it is aquifer QS2 and QS3, which are the most vulnerable to pesticide
contamination. The priority should be on QS3, because very few groundwater drillings are found in
this aquifer, but there are still found a relatively high percentage of the contaminated groundwater
drillings in this aquifer.

Page 46 of 57
Assessment of areas’ vulnerability to pesticide contamination
Page 47 of 57
7. Vulnerable areas
7. Vulnerable areas
Assessing the vulnerability of an area to pesticide contamination is influenced by many different
parameters, as described in chapter 2 and 3. There has not been much focus on how vulnerability to
pesticide contamination can be assessed, when considering groundwater quality. This is partly due
to data limitation and insufficient data coverage on groundwater chemistry and aquifer parameters.
Because of this, the discussion will be split up in three sections: The first section will be based on the
description of the influencing parameters and the analysis of the distribution of the groundwater
drillings with focus on the aquifers that are pointed out to be most vulnerable in Aalborg and
Herning Municipality. The second section will concern the data limitation and the influence of this.
The third section will account for which data that should have been available to be able to give a
more precise assessment of the vulnerability of an area to pesticide contamination.
7.1 Parameters Upper soil layers
Sandy soil types are found in half of the area of Aalborg Municipality, where fine grain sandy soil
represents 41.5 % of the total area, clayey sand represents 19.9% of the total area and coarse grain
sandy soil represents 10.4 % of the total area. The soil types in Aalborg Municipality is of different
soil types, but still with sandy soils as the majority, whereas in Herning Municipality 83 % consists of
one type of sandy soil; coarse grain sandy soil. The leaching of pesticides in the upper soil is faster in
areas with sandy soils compared to areas with clayey soil layers, because the hydraulic conductivity
is higher in sand than clay (Karlby and Sørensen 2002), which will affect that the pesticides will move
faster through the soil down to the aquifer. It is expected that there would be a pattern in that the
pesticide contaminated groundwater drillings would mainly be located in these sandy soil layers,
which increase the vulnerability in these areas. However no tendencies are found showing that the
pesticide contamination occurs in a specific soil type, which indicates that the upper soil type in the
selected areas does not influence the vulnerability to pesticide contamination as much as first
expected. The variations in how the pesticide contaminated groundwater drillings are distributed
between the soil types are too big and it is therefore not possible to use this parameter in the
assessment of vulnerability, since it would give a large margin of error.
Distributions
The distributions of how the filter depth affects the influence on pesticide contamination show a
tendency in that the closer to the surface a groundwater drilling is located the more vulnerable it
will be. This is also shown by the finding of water type A and AB in many of the pesticide
contaminated groundwater drillings. It was expected to find these water types in the contaminated
drillings, because these water types contain oxygen and are usually found in aquifers close to the
surface (GEUS 2010, b and Mosin and Olesen 2003). It is assessed that groundwater drillings located
close to the surface and consisting of water type A and AB are vulnerable to pesticide
contamination. However water type D and Dx are also found in some of the pesticide contaminated
groundwater drillings in both Aalborg and Herning Municipality. Water type D represents deeper,
older and better protected groundwater, and it is therefore not expected to find water type D and
Dx in pesticide contaminated groundwater drillings. No tendencies are found concerning which
water types are found in the pesticide contaminated groundwater drillings in Herning Municipality. It
Page 48 of 57
Assessment of areas’ vulnerability to pesticide contamination
indicates therefore that other factors have an influence on the vulnerability to pesticide
contamination or that there are errors in the analysis of water types in these drillings. There have to
be some reservations of using only water types to assess vulnerability to pesticide contamination,
but it can be used as a supplement to the depth and the aquifers.
Thickness of clay layers
From the distributions of the pesticide contaminated groundwater drillings and all groundwater
drillings it is possible to point out which aquifers are the most vulnerable in Aalborg and Herning
Municipality. The aquifers have been chosen to use as a baseline to assess the vulnerability by
looking at how thick the protecting clay layers located above the aquifer are and how big the
groundwater recharge is in the aquifer. Clay layers are very good as protection of the groundwater if
it has a sufficient thickness, because it has a low hydraulic conductivity. The time it takes for water
to percolate through protecting clay layers is very slow. So it is expected that the vulnerability will
decrease with increasing thickness of the clay layers located above the aquifer (Kirsch 2006, pp.
459).
In Aalborg Municipality it is assessed that the aquifers QS3 and pre-quaternary limestone are the
most vulnerable. The pesticide contaminated groundwater drillings that are located in the two
aquifers in Aalborg Municipality have no values for the clay thickness. It is therefore necessary to
illustrate the thickness of the clay layers as a raster map, and then make assumptions about that the
thickness of clay layers in the area where the drilling is located is also applicable for the drillings.
The clay layers protecting QS3 is from appendix 3 found to be between 0-10 m thick in the areas
where the pesticide contaminated groundwater drillings are located in Aalborg Municipality. The
majority of the contaminated drillings are located in areas where the thickness of the clay layers are
less than 2.5 m, which indicates that the thicker a protecting clay layer is, the less vulnerable is the
aquifer. When looking at appendix 4 illustrating how thick the clay layers are above pre-quaternary
limestone aquifers, the thickness of clay layers above the contaminated groundwater drillings are
between 0-15 m. Most of the drillings are located in areas where the clay layers are less than 5 m.
The vulnerability for both QS3 and limestone is assessed to increase if the thickness of the protecting
clay layers decrease in Aalborg Municipality.
The most vulnerable aquifers to pesticide contamination are QS2 and QS3 in Herning Municipality.
When looking at appendix 5 it is possible to see that there are some contradictions about the
thickness of the clay layers in the areas where the pesticide contaminated groundwater drillings are
located. The thickness of the clay layers identified in the contaminated drillings located in QS2 and
QS3 is between 0-55 m, which gives no patterns showing that the thickness of clay layers have an
influence on the protection of the aquifers in these areas.
Groundwater recharge
On the basis of figure 8.5 from Henriksen and Sonnenborg (2003) the groundwater recharge is
divided into two categories; small and large groundwater recharge:
Small recharge: 0 – 200 mm/year
Large recharge: 200 – 900 mm/year

Page 49 of 57
7. Vulnerable areas
It is assumed that if there is a small recharge the aquifer is assessed not to be vulnerable, and if
there is a large recharge in the aquifer it will be characterised as vulnerable to pesticide
contamination. The average groundwater recharge for the aquifers assessed as being vulnerable for
both Aalborg and Herning Municipality are illustrated in table 1.
Table 1 illustrating the average groundwater recharge found in the assessed vulnerable aquifers in Aalborg and Herning Municipality (NIRAS 2012, b).
Groundwater recharge [mm/year]
Aalborg Herning
QS3 Limestone QS2 QS3
-275.969 -290.936 -406.49 -360.172
All four of the aquifers have a large groundwater recharge, and they are therefore all vulnerable to
pesticide contamination based on this parameter.
There are contradicting results from the analysis of the available data, when assessing if an area is
vulnerable to pesticide contamination. The variation in the distributions based on the parameters is
very large, and because of this it is assessed that there will be a margin of errors if the distributions
on the available data are used for assessing if an area is vulnerable to pesticide contamination.
It is possible that there are other factors affecting how big the variations of the results are. A factor
could be the possibility of different types of water mixing in the soil because of bad drilling
conditions or cracks in the aquifer.
If the drillings are in a bad condition there is a risk of that when the groundwater is extracted
different water types are mixed, by for example taking water in from different soil layers all the way
up to the surface. It would be necessary to investigate how much the mixing of water from bad
drilling conditions affects if a groundwater drilling is identified as being pesticide contaminated or
not. This will have a big influence on the assessment of vulnerability to pesticide contamination.
On a large scale the water is transported in the cracks and is therefore moving faster compared to
the dissolved substances. On a smaller scale the transport of water in the cracks is much more
dependent on the time and intensity of the precipitation. There is therefore a high possibility of
finding different water types mixed in aquifers with many cracks (Environmental Protection Agency
2000). It is therefore necessary to investigate if the soil layers and aquifers consist of many cracks,
because pesticides can move faster through the cracks.
7.2 Data limitations From the discussion of the results there are some contradictions in assessing which parameters
influence the vulnerability to pesticide contamination. These contradictions can be caused by the
data limitations that are found to be in this thesis. As a part of the National Groundwater
surveillance there was found pesticide contamination in 23 % of the investigated active groundwater
drillings in 2009 (GEUS 2010, b, pp. 5-6). These findings for 2009 have caused that there have come
more focus on this pesticide issue, but it is still very new and there have only been a few
investigations made about what to focus on when trying to assess what is influencing the
Page 50 of 57
Assessment of areas’ vulnerability to pesticide contamination
vulnerability to pesticide contamination. This is one of the possible causes why there is only a certain
amount of data available on this area, which is necessary to relate to.
There are 124 groundwater drillings in Aalborg Municipality where the pesticide concentration has
been found to exceed the limit value (0.1 µg/l) and the number is 32 groundwater drillings in
Herning Municipality. These pesticide contaminated groundwater drillings are compared with all
groundwater drillings in the selected areas. The number of all groundwater drillings that are used for
the distributions is 2430 in Aalborg Municipality and 4457 in Herning Municipality. There are a small
percentage of all the groundwater drillings that are identified as being pesticide contaminated. It
could indicate that the problem of pesticide contamination is not as big as first expected, but it can
also just be the start of an increasing problem, and it is therefore still necessary to be able to assess
if an area is vulnerable. A way to have a larger number of drillings to represent pesticide
contaminated groundwater drillings could be to look at groundwater drillings where there have
been found pesticide concentrations between 0.01 – 0.1 µg/l.
Some of these pesticide contaminated groundwater drillings can also be drillings that already have
been closed down because of the contamination. There is a risk of that there is no data available for
the other parameters for the closed drillings. This is the case when looking at the water types for the
pesticide contaminated groundwater drillings, because it is not necessarily the same groundwater
drillings that have been analysed for water types. This results in even fewer groundwater drillings to
compare when looking at water types. This gives a relatively small number of drillings to base the
comparisons and distributions on, and there is a risk of errors in the interpretation of the different
parameters. The available data is therefore insufficient to use to create a model that can assess the
vulnerability to pesticide contamination, and the result would be too uncertain.
7.3 Solutions to data limitations The “wishing list” illustrated in chapter 4 is describing the data which is necessary to have when the
aim is to be able to give an assessment of the vulnerability of areas to pesticide contamination. It is
possible to acknowledge from the discussions in section 7.1 and 7.2 that the available data is not
sufficient enough to the necessary analysis for assessing if an area is vulnerable to pesticide
contamination.
To be able to give a more exact assessment of the vulnerability it would be necessary to have data
connected to the certain pesticide contaminated groundwater drillings illustrating the geology, soil
type, the filter depth, the groundwater recharge in the drilling and in the area around, the
groundwater age, the hydraulic conductivity, how thick the clay layer is registered to be in the
drilling, but also the extent of the clay layer around the contaminated drilling. It is also necessary to
know which aquifer the contaminated groundwater drillings is located in, and in what condition the
drillings is in.
Page 51 of 57
8. Conclusion
8. Conclusion
97 % of the drinking water consumed in Denmark origin from groundwater, which makes the
protection of groundwater of national importance. The groundwater has been affected by
contamination and an increasing number of groundwater drillings have been closed down because
of pesticide contamination. A change in the legislation of environmental protection in 2011 has
made it possible for the municipalities to make initiatives to protect the drinking water quality
against pesticide contamination. Aalborg Municipality finds it necessary to find a way to identify
which areas are vulnerable to pesticide contamination. This has been the basis for the objective of
this thesis, which is:
The objective of this project is to find a method to assess if areas are vulnerable to pesticide
contamination.
The conclusion will be build up by answering the hypothesis, focusing on which parameters are
influencing the vulnerability to be able to assess if areas are vulnerable to pesticide contamination.
It is concluded that the variations of how the pesticide contaminated groundwater drillings are
distributed between the soil types are too big, and it is therefore not possible to give an exact
answer about if groundwater drillings located in areas with sand are vulnerable to pesticide
contamination.
The distribution on the basis of the filter depth shows that groundwater drillings that extract water
close to the surface are more vulnerable to pesticide contamination. The water types are also an
indication of the depth of where the contamination occurs, and there are registered water types in
the pesticide contaminated groundwater drillings that occur close to the surface (A and AB), but also
water types located very deep (D and Dx). Since water type D and Dx is expected to be older and
well protected groundwater, it is concluded that other factors may have an influence on the analysis
of the water types in the pesticide contaminated groundwater drillings. It is therefore necessary to
have some reservations when using only water types to assess if groundwater drillings extracting
water close to the surface are vulnerable to pesticide contamination.
It is concluded that the aquifers QS3 and pre-quaternary limestone are the most vulnerable in
Aalborg Municipality and the most vulnerable aquifers in Herning Municipality are QS2 and QS3.
Most of the pesticide contaminated groundwater drillings in Aalborg Municipality are located in
areas where the protecting clay layers are less than 5 m. The vulnerability for both QS3 and
limestone is assessed to increase if the thickness of the protecting clay layers decrease in Aalborg
Municipality. However in Herning Municipality there are found no patterns indicating that the
thickness of clay layers has an influence on the vulnerability in these areas. It is therefore not
possible to use the available data on the thickness of the clay layers to give a precise assessment on
if an increasing thickness of clay layers will decrease the vulnerability.
It is assessed that because of the data limitations in the available data it is not possible to find an
exact method to assess if an area is vulnerable. The data limitations can be caused by that there is a
small percentage of all the groundwater drillings that is identified as being contaminated, and some
Page 52 of 57
Assessment of areas’ vulnerability to pesticide contamination
of the drillings can have been closed down because of the contamination before analysis of other
parameters have been performed. This results in a limited number of pesticide contaminated
groundwater drillings to base the assessment of if an area is vulnerable on, and it is therefore
concluded that the data is insufficient to use to create a model to assess if an area is vulnerable to
pesticide contamination. To decrease the current data limitation it is necessary to have values for all
of the influencing parameters on a drilling level for the contaminated groundwater drillings, but also
for the areas around the drilling, because it is a larger area that affects the vulnerability of an area.
Page 53 of 57
References
References
Amtsrådsforeningen 2002. Amtsrådsforeningen 2002. Grundvandet som drikkevandsressource.
Amtsrådsforeningen.
Bicki 1989. Bicki, Thomas J. 1989. Pesticides and Groundwater – Pesticides As Potential Pollutants.
Land & Water. University of Illinois at Urbana-Champaign.
Burt and Barber 1996. Burt, James E. and Barber, Gerald M. 1996. Elementary Statistics for
Geographers. Second Edition. The Guilford Press.
Davie 2008. Davie, Tim 2008. Fundamentals of Hydrology. Second Edition. Routledge.
DJF Jordbundsdata n.d. DJF Jordbundsdata n.d. Jordbundsdata. http://www.djf-
geodata.dk/datasaml/index.html, Accessed 20.04.2012.
Environmental Protection Agency 2000. Environmental Protection Agency 2000. Zonering –
Detailkortlægning af arealer til beskyttelse af grundvandsressourcen. Danish Ministry of the
Environment. http://www2.mst.dk/udgiv/publikationer/2000/87-7944-132-7/pdf/87-7944-133-
5.pdf, Accessed 28.04.2012.
Environmental Protection Agency 2009. Environmental Protection Agency 2009. Pesticider. Danish
Ministry of the Environment.
http://www.mst.dk/Presse/Presseservice/Pressekit/faktatildinresearch/Pesticider/, Accessed
15.03.2012.
Environmental Protection Agency 2012. Email correspondence with Environmental Protection
Agency 2012. Data for the use of pesticides 1956-2009 in Denmark.
GEUS 2010, a. GEUS, De Nationale geologiske undersøgelser for Danmark og Grønland. 2010, a.
Grundvand – Vi påvirker grundvandet. GEUS, De Nationale geologiske undersøgelser for Danmark og
Grønland. http://www.geus.dk/viden_om/gv05-dk.html#vg58, Accessed 15.04.2012.
GEUS 2010, b. GEUS. GEUS, De Nationale geologiske undersøgelser for Danmark og Grønland 2010,
b. Grundvandsovervågning 2010, Grunvand Status og udvikling 1989 til 2009.
www.grundvandsovervaagning.dk. Accessed 15.02.2012.
GEUS 2010, c. GEUS, De Nationale geologiske undersøgelser for Danmark og Grønland 2010, c.
Grundvand – Grundvandskemi. GEUS, De Nationale geologiske undersøgelser for Danmark og
Grønland. http://www.geus.dk/viden_om/gv04-dk.html#vg41, Accessed 15.04.2012.
GEUS 2010, d. GEUS, De Nationale geologiske undersøgelser for Danmark og Grønland 2010, d.
Grundvand – Vandets kredsløb. GEUS, De Nationale geologiske undersøgelser for Danmark og
Grønland. http://www.geus.dk/viden_om/gv02-dk.html, Accessed 15.04.2012.
Page 54 of 57
Assessment of areas’ vulnerability to pesticide contamination
GEUS 2010, e. GEUS, De Nationale geologiske undersøgelser for Danmark 2010, e. Grundvand – Det
livsvigtige grundvand. GEUS, De Nationale geologiske undersøgelser for Danmark og Grønland.
http://www.geus.dk/viden_om/gv01-dk.html, Accessed 15.04.2012.
GEUS 2012. GEUS, De Nationale geologiske undersøgelser for Danmark og Grønland 2012. Dataset
from Jupiter database. http://www.geus.dk/jupiter/pcjupiter-dk.htm.
GEUS n.d., a. GEUS n.d., a. GEUS’ digitale jordartskort - 1:200.000 – landsdækkende.
Geodatabiblioteket.
http://www.geodatabiblioteket.dk/index.php?option=content&task=view&id=51&Itemid=46,
Accessed 20.04.2012.
GEUS n.d., b. GEUS n.d., b. Digitalt kort over danmarks jordarter 1:200.000 – Kortteknisk beskrivelse.
Geodatabiblioteket. http://www.geus.dk/departments/quaternary-marine-geol/map-cd-
rom/beskriv_200000.pdf, Accessed 20.04.2012.
Gravesen et al. 2004. Gravesen, P., Larsen, C. L, Brûsch, W., Nygaard, E. 2004. Geologi og grundvand.
Chapter 1, 2 and 3. Environmental Protection Agency.
Hedemand and Strandberg 2009. Hedemand, Trine and Stranberg, Morten 2009. Pesticider –
påvirkninger i naturen. Danmarksmiljøundersøgelser, Aarhus University and Hovedland.
Henriksen and Nyegaard 2003. Henriksen, Hans Jørgen and Nyegaard, Per 2003. Den konceptuelle
vandmodel – ferskvandets kredsløb (1). Geologisk Nyt no. 5. GEUS, De Nationale geologiske
undersøgelser for Danmark og Grønland.
Henriksen and Sonnenborg 2003. Henriksen, Hans Jørgen and Sonnenborg, Alex 2003. Ferskvandets
kredsløb. NOVA Temarapport. GEUS, De Nationale geologiske undersøgelser for Danmark og
Grønland.
Jensen 2005. Jensen, Karsten H. 2005. Håndbog i grundvandsmodellering – Matematisk og numerisk
grundlag for grundvandsmodellering. Chapter 5. GEUS, De Nationale geologiske undersøgelser for
Danmark og Grønland.
Jørgensen 2010. Jørgensen, Jens. 18.10.2010, Pesticider truer drikkevandet. KL.
http://www.kl.dk/Momentum/Pesticider-truer-drikkevandet-id76503/. Accessed 15.02.2012.
Karlby and Sørensen 2002. Karlby, Henning and Sørensen, Inga 2002. Ingeniøren A/S.
Kirsch 2006. Kirsch, Reinhard 2006. Groundwater Geophysics. Springer.
Mosin and Olesen 2003. Mosin, Lone and Olesen, Henrik 2003. Grundvandets kemi – et vigtigt bidrag
til indsatsplanlægningen. Dansk Geofysik A/S.
Page 55 of 57
References
National vandressourcemodel 2009. National vandressourcemodel 2009. Beskrivelse af den
Nationale Vandressource Model. http://vandmodel.dk/vm/om_os/index.html#Hydr_strat_Jylland,
Accessed 02.05.2012.
Naturstyrelsen 2011. Naturstyrelsen 2011. Skrivelse til alle kommuner vedr. indsatsplaner og
Miljøbeskyttelsesloven § 26a, Miljøministeriet, Naturstyrelsen, 6. oktober 2011.
NIRAS 2012, a. NIRAS 2012, a. Received word-file: BEST_boredata_og_modellag describing BEST drill
data and model layers.
NIRAS 2012, b. The dataset has been received from NIRAS between the 20.04.2012 to 02.05.2012 for
Aalborg and Herning Municipality.
Nyegaard et al. 2010. Nyegaard, Per, Troldborg, Lars and Højberg, Anker L. 2010. Geologisk og
hydrostratigrafisk opdatering 2005-2009. GEUS, De Nationale geologiske undersøgelser for Danmark
og Grønland. http://vandmodel.dk/xpdf/dk-model2009_geol-hydr-opdatering.pdf, Accessed
14.05.2012.
Petersen 1994, Petersen, Leif. 1994. Grundtræk af jordbundslæren. 4. Udgave. DSR Forlag.
Rosenstand and Marvil 2010. Rosenstand, Ulrik and Marvil, Christine. 2010. Viden om Grundvand.
GEUS, De Nationale geologiske undersøgelser for Danmark og Grønland.
http://www.geus.dk/viden_om/vogv-dk.htm, Accessed 15.04.2012.
Skinner et al. 2004. Skinner, Brian J., Porter, Stephen C. and Park, Jeffrey 2004. Dynamic Earth – An
Introduction to Physical Geology. Fifth Edition. John Wiley & Sons, Inc.
Whitford et al. 2001. Whitford, F., Wolt, J., Nelson, H., Barrett, M., Brichford, S. and Turco, R. 2001.
Pesticides and Water Quality. Purdue University Cooperative Extension Service.

Page 56 of 57
Assessment of areas’ vulnerability to pesticide contamination
Page 57 of 57
List of Appendices
List of Appendices
Appendix 1: Example of how the distributions are found by calculating a histogram in Microsoft
Office Excel and illustrating it in a column chart. The example shows the distribution of the pesticide
contaminated groundwater drillings on the basis of the filter depth.
Appendix 2: All parameters for pesticide contaminated groundwater drillings in Aalborg and Herning
Municipality.
Appendix 3: Thickness of clay layers located above QS3 in Aalborg Municipality
Appendix 4: Thickness of clay layers located above pre-quaternary limestone in Aalborg Municipality
Appendix 5: Thickness of clay layers located above QS2 and QS3 in Herning Municipality


![Adresse adresse New innovative tools to assess and reduce the potential for pesticide water contamination across Europe Igor Dubus [i.dubus@footways.eu]](https://static.fdocuments.in/doc/165x107/55152e29550346c77d8b5786/adresse-adresse-wwwfootwayseu-new-innovative-tools-to-assess-and-reduce-the-potential-for-pesticide-water-contamination-across-europe-igor-dubus-idubusfootwayseu.jpg)