Associations of glutathione and arsenic methylation in ... · DHF Cystathionine Cysteine +...
27
Associations of glutathione and arsenic methylation in Bangladesh Megan Niedzwiecki, PhD student Department of Environmental Health Sciences Mailman School of Public Health Columbia University
-
Upload
vuongthien -
Category
Documents
-
view
214 -
download
0
Transcript of Associations of glutathione and arsenic methylation in ... · DHF Cystathionine Cysteine +...

Associations of glutathione and arsenic methylation
in Bangladesh
Megan Niedzwiecki, PhD student Department of Environmental Health Sciences
Mailman School of Public Health Columbia University

NIEHS Superfund Research Program
http://superfund.ciesin.columbia.edu
Presenter
Presentation Notes
The columbia superfund program focuses on the health effects and geochemistry of arsenic and manganese, which includes four biomedical and three non biomedical projects. This current analysis stemmed from Project 4, One-Carbon Metabolism, Oxidative Stress, and Arsenic Toxicity in Bangladesh.
Presenter
Presentation Notes
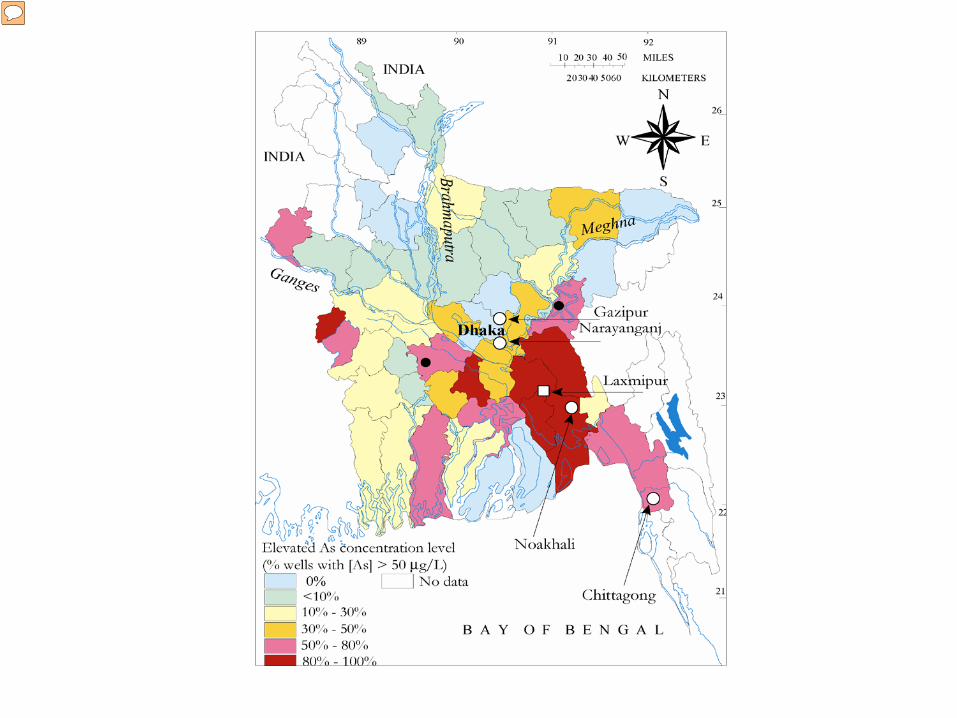
This map shows a map of Bangladesh divided by region, and the colors show which areas have high levels of As contamination (it is color coded by the percent of unsafe wells- over 50 ug/L)- you can see that the darker colors represents a high level of contamination. Lancet study- 77 million people in Bangladesh are thought to be chronically exposed to As through well water. Arsenic exposure is associated with heart disease, neurologic problems, respiratory disorders, and cancers of the skin, bladder, lung, and liver.
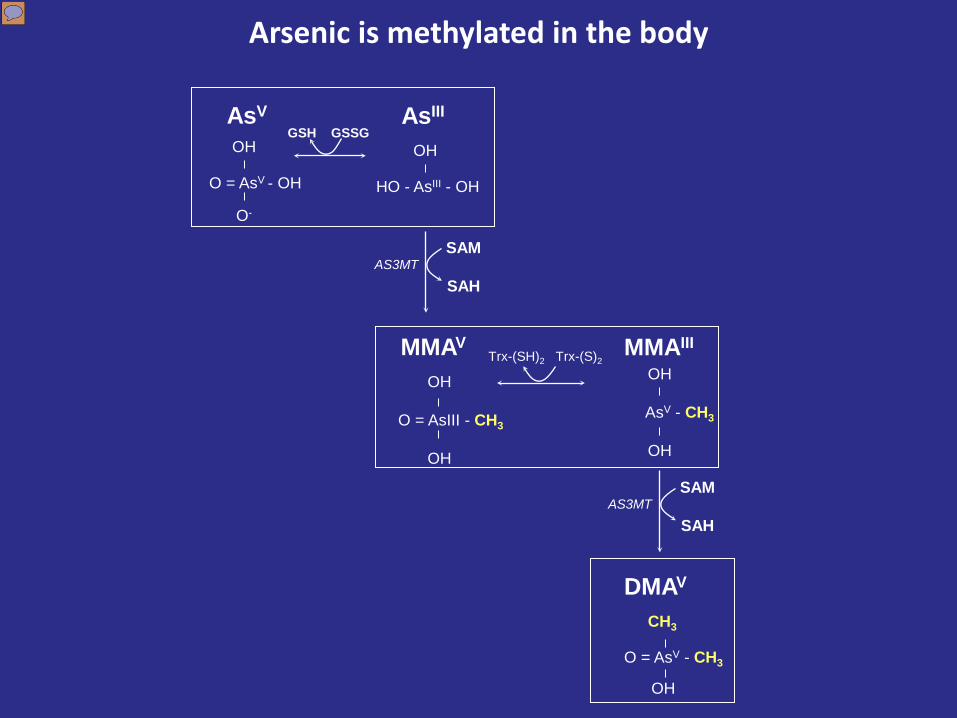
Arsenic is methylated in the body
AsIII
HO - AsIII - OH
OH OH
O-
O = AsV - OH
AsV GSH GSSG
MMAV
OH
O = AsIII - CH3
OH
SAM
SAH AS3MT
Trx-(SH)2 Trx-(S)2
V
OH
As - CH3
OH
MMAIII
CH3
O = AsV - CH3
OH
DMAV
SAM
SAH AS3MT
Presenter
Presentation Notes
Arsenic enters the body primarily as arsenite (As+3) and is methylated via the action of the arsenic methyltransferase enzyme (AS3MT) using s-adenosylmethionine, or SAM, as the methyl donor. The monomethyl form is reduced and then undergoes a second methylation step to the dimethyl form, or DMA. Methylation is generally considered to be a detoxification pathway because the methylated forms have a much shorter halflife in the body. case control studies of arsenic induced skin lesions, precursors to skin cancer, identified increased MMA and decreased DMA, which indicates reduced methylation capacity, as risk factors for skin lesions

Arsenic is methylated via one-carbon metabolism
Substrate Examples: InAsIII
MMAIII cytosine (CpG)
Respective Products:
MMAV DMAV
methyl-cytosine (DNA methylation)
Homocysteine
Methionine
SAM
SAH
Folate
10 formyl THF
THF
5 Methyl THF
5:10 Methylene-THF
Serine
Glycine
purine synthesis
thymidylate synthesis
DHF
Cystathionine
Cysteine + Glutamate
serine
GSH GSSG As(V) As(III)
MMA(V) MMA(III)
γ-glutamylcysteine + Glycine
-
CH3
CH3
CH3
CH3
CBS
MTR MTHFR
AS3MT DNMT
Transsulfuration pathway
Presenter
Presentation Notes
Arsenic is methylated via one-carbon metabolism, which is a folate dependent pathway. dietary folates are reduced to dihydrofolate (DHF) and tetrahydrofolate (THF), then folate picks up a methyl group from serine. It undergoes a series of conversions until it tranfers the methyl group to methylate homocysteine to form methionine. Methionine is then activated to form SAM, which is the primary methyl donor for the majority of methylation reactions, including As methylation and DNA methylation. SAM is then converted to SAH and then hydrolyzed to form homocysteine, which can be remethylated to form methionine. Conversely , homocysteine can instead be converted to cystathionine in the first step of the transsulfuration pathway. The transulfuration pathway is involved in the production of glutathione, which is the body’s primary antioxidant in the defense against oxidative stress. So, you can see that processes responsible for methylation and oxidative stress are metabolically linked, but there hasn’t been much research on potential modulating effects of oxidative stress on methylation.

Oxidative stress may decrease arsenic methylation in two ways: 1. Upregulation of GSH production leads to
decreased SAM production
2. Changes in redox inhibit methyltransferase enzymes

Glutathione and oxidative stress
O2*-
H2O2
2H2O
GSH
GSSG GPx GR
SOD
*OH Lipid peroxidation
Protein oxidation
Antioxidant depletion
DNA damage
↓GSH
↑GSSG
↓GSH/GSSG
Presenter
Presentation Notes
The reduced form of glutathione, GSH, is able to donate an electron to reactive oxygen species. Upon donation of the election, GSH becomes a free radical itself, but it rapidly reacts with another free radical glutathione to form glutathione disulfide, or GSSG. GSSG can be converted back to GSH with the enzyme Glutathione Reductase. Conditions of chronic oxidative stress are characterized by a reduction in glutathione, an increase in glutathione disulfide, and an decrease in the ratio of GSH to GSSG.

One-carbon metabolism under pro-oxidant conditions
Substrate Examples: InAsIII
MMAIII cytosine (CpG)
Respective Products:
MMAV DMAV
methyl-cytosine (DNA methylation)
Homocysteine
Methionine
SAM
SAH
Folate
10 formyl THF
THF
5 Methyl THF
5:10 Methylene-THF
Serine
Glycine
purine synthesis
thymidylate synthesis
DHF
Cystathionine
Cysteine + Glutamate
serine
GSH GSSG As(V) As(III)
MMA(V) MMA(III)
γ-glutamylcysteine + Glycine
Figure courtesy of Dr. Mary Gamble
CBS
Transsulfuration pathway
Presenter
Presentation Notes
Under pro oxidant conditions, activity of cystathionine β-] synthase increases to increase production of GSH, which directs Hcys toward the transsulfuration pathway and away from one-carbon metabolism, which may lead to less SAM formation and a reduction in methylation. This change would occur because the level of SAM required by DNMTs and HMTs would no longer be met.

Redox, E (mV) calculation, and interpretation
Redox state = energetic force for electron transfer; measures ability of compound to donate or receive electrons (reduction potential)
Nernst equation: E (mV) = E0(-RT/nF) * ln([reductant]/[oxidant]) E (mV) = -264 – 30 * log([GSH]2/[GSSG]) E0 = standard reduction state at pH 7 (-264 mV for GSH) R = gas constant T = temperature in Kelvin n = number of transferred electrons F = Faraday’s constant
(Brewer, 2010)
Presenter
Presentation Notes
The redox state refers to the ability of a compound to donate or receive electrons. If we know the intracellular concentrations of glutathoine and glutathoine disulfide, we can use these values to calculate the intracellular redox state because the GSH/GSSG pair is the redox pair at the highest intracellular concentration. The redox environment of a linked set of redox couples as found in a biological fluid, organelle, cell, or tissue is the summation of the products of the reduction potential and reducing capacity of the linked redox couples present.Reduction potential can be thought of as a voltage and reducing capacity would be total charge stored, that is, number of electrons available. Reducing capacity would be estimated by determining the concentration of the reduced species in a redox couple; the reduction potential can be estimated with the Nernst equation. In mathematical terms this could be represented by:

Intracellular redox state influences enzyme activity
C NH3+
COO-
Cysteine (CYS)
Cysteine (CYS)
SH
H H
SH C NH3+
COO-
GSH GSSG
H
S C NH3+
COO-
Cystine (CYSS)
H
S C NH3+
COO-
Fomenko et al., 2008
SAM-dependent methyltransferases
AS3MT
Presenter
Presentation Notes
Some enzymes contain cysteine residues in their active sites. In more oxidized redox environments, disulfide bonds can form between the cysteines to form cystine, rendering the enyzme less active. A 2008 paper in Science established a method to locate potential redox sensitive enzymes, and they identified SAM-dependent methyltransferases, particularly the arsenic methyltransferase enzyme, as potentially redox active. When the cysteines of interest were mutated, the activity of the enyzme was greatly reduced.

Hypothesis: Increased oxidative stress is associated with decreased arsenic methylation. •H1. Decreased GSH is associated with decreased As methylation, which may be mediated by a decrease in SAM. •H2. Increased GSSG and Eh(bGSH) (indicators of a more oxidized intracellular redox environment) are associated with decreased As methylation.

Folate and Oxidative Stress (FOX) Study
• Cross-sectional study of 379 arsenic-exposed
adults in Araihazar, Bangladesh
• Primary focus: examine dose-response relationships between arsenic exposure and oxidative stress
Presenter
Presentation Notes
Columbia Superfund Project 4

H1: Increased GSH production under conditions of oxidative stress leads to decreased SAM, which leads to decreased As methylation.
Decreased bGSH
Decreased bSAM
Decreased As methylation
YES, overall and folate-sufficient Is decreased GSH associated with decreased SAM?
Outcome
Predictor
Folate-sufficient (n=266)
Folate-deficient (n=112)
B ± SE p B ± SE p
bSAM bGSH, unadjusted 0.042±0.012 0.0007 0.010 ±0.025 0.68
bGSH, full* 0.037 ±0.014 0.0078 0.0086 ±0.026 0.74 betas for bGSH represent 100-unit change in bGSH *Adjusted for total urinary As (log), urinary creatinine (log), sex, ever smoking, age (log), betelnut use (log), BMI (log), vitamin B-12 (log), and television ownership
Presenter
Presentation Notes
conditions of chronic oxidative stress leads to depleted or decreased GSH, which leads to depletion of SAM, which then leads to a decrease in methylation capacity. When we first look to see if GSH and SAM are even associated, we see that GSH and SAM are indeed associated, but only in the folate sufficient group. This makes sense, given that we know that SAM is an allosteric activator of CBS, the enzyme catalyzing the conversion of Hcys to cystathionine in the first step of the transulfuration pathway for GSH production, but under conditions of methionine deficiency, SAM can no longer allosterically activate the enzyme, so increased SAM would not be able ot increase the Hcys flux toward GSH production.

H1: Increased GSH production under conditions of oxidative stress leads to decreased SAM, which leads to decreased As methylation.
• Is decreased GSH associated with decreased As methylation?
• Is decreased SAM associated with decreased As methylation?
Outcome Predictor
Folate-sufficient (n=266)
Folate-deficient (n=112)
B ± SE p B ± SE p
%uInAs bSAM* -1.39±0.95 0.15 -1.79 ±1.54 0.25
bGSH* -0.093 ±0.20 0.65 -0.34 ±0.39 0.39
%uMMA bSAM* 0.19 ±0.74 0.80 1.19±1.33 0.39
bGSH* 0.17 ± 0.16 0.27 0.21± 0.34 0.54
%uDMA bSAM* 1.20 ±1.28 0.35 0.59±2.21 0.79
bGSH* -0.08 ±0.28 0.77 0.14±0.56 0.81
betas for bGSH represent 100-unit change in bGSH *Adjusted for total urinary As (log), urinary creatinine (log), sex, ever smoking, age (log), betelnut use (log), BMI (log), vitamin B-12 (log), and television ownership
NO
NO
Presenter
Presentation Notes
However, when we looked to see if either SAM or GSH are associated with As methylation, we did not find any associations with SAM or GSH with any of the metabolites after controlling for potential confounders. SO, it does not seem that changes in GSH are associated with As methylation capacity in this dataset.

H2. Oxidative stress is associated with decreased As methylation due to a more oxidized intracellular redox environment.
1. Is increased bGSSG associated with decreased As methylation?
2. Is a more positive Eh(bGSH) associated with decreased As methylation?
Outcomea
Folate-sufficient (n=266)
Folate-deficient (n=112)
B ± SE p B ± SE p %uInAs* 0.073±0.76 0.92 1.91 ±1.12 0.09
%uMMA* -0.20 ±0.59 0.74 1.61±0.97 0.09 %uDMA* 0.12 ±1.02 0.90 -3.53±1.58 0.03
Outcome
Folate-sufficient (n=266)
Folate-deficient (n=112)
B ± SE p B ± SE p %uInAs* 0.010±0.027 0.71 0.08 ±0.05 0.10
%uMMA* -0.018 ±0.021 0.39 0.031±0.044 0.48 %uDMA* 0.008 ±0.037 0.83 -0.11±0.07 0.12 a. log bGSSG *Adjusted for total urinary As (log), urinary creatinine (log), sex, ever smoking, age (log), betelnut use, BMI (log), vitamin B-12 (log), and television ownership
Presenter
Presentation Notes
However, when we look to see if redox-associated markers are associated with As methylation, we see an association between increased GSSG and a decrease in As methylation capacity, as indicated by an increased % of InAs and MMA and a decreased % of DMA. However, this is only observed in folate deficient individuals. When using the Eh value as the predictor of As methylation, we see a similar pattern among the folate deficient group, but the betas are less significant.

Percent InAs, MMA, and DMA by quintile of bGSSG, in folate sufficient
%InAs
101214161820222426
1 2 3 4 5
%
bGSSG quintile
%MMA
1011121314151617181920
1 2 3 4 5
%
bGSSG quintile
%DMA
56586062646668707274
1 2 3 4 5
%
bGSSG quintile
Presenter
Presentation Notes
The differences are more apparent when we observe the adjusted mean % ‘s for each metabolite by quintile of GSSG. In the folate sufficient group, we see no differences in percent arsenic metabolites by quintile of GSSG.

Percent InAs, MMA, and DMA by quintile of bGSSG, in folate deficient
%InAs
101214161820222426
1 2 3 4 5
%
bGSSG quintile
*
*p<0.05, compared to quintiles 1, 2, and 3
%MMA
10
12
14
16
18
20
1 2 3 4 5
%
bGSSG quintile
*
*p<0.05, compared to quintiles 1, 2, and 3
%DMA
56586062646668707274
1 2 3 4 5
%
bGSSG quintile
*
*p<0.05, compared to quintiles 1, 2, 3, and 4
Presenter
Presentation Notes
However, in the folate deficient group, we observe a significant decrease in As methylation capacity in the highest quintile of GSSG, with the highest quintile having significantly higher %InAs and %MMA and lower %DMA when compared to the first three GSSG quintiles. A paper from Styblo et al shows that MMA and DMA can inhibit glutathione reducatase, which catalyzes the conversion of GSSG back to GSH, so it could be argued that these results might just indicate that it is not that GSSG is inhibiting methylation capacity, but rather that the metabolites are inhibiting glutathione reductase and causing increased GSSG. I would argue that if this were true, we would see increased DMA in the highest GSSG quintile, not lower.

DNA
met
hyla
tion
Global DNA methylation by quintile of blood GSSG, by folate nutritional status
Folate sufficient
0
5000
10000
15000
20000
25000
30000
35000
40000
1 2 3 4 5
DNA
met
hyla
tion
GSSG quintile
Folate deficient
0
5000
10000
15000
20000
25000
30000
35000
40000
1 2 3 4 5GSSG quintile
*
*p<0.05, compared to quintiles 1 and 2
Presenter
Presentation Notes
Furthermore, as further evidence that GSSG may be inhibiting methylation capacity in general, these are the results looking at the relationship between global DNA methylation and quintile of GSSG. We see the same pattern, where the highest quintile of GSSG exposure is associated with decreased global DNA methylation, but only in the folate deficient stratum. I think this result, together with the arsenic metabolite results, indicates that increased GSSG is related to a generalized decrease in methylation capacity in the folate deficient.

Conclusion and future directions
• Increased bGSSG associated with decreased As methylation capacity in folate deficient – Mechanism: Inhibition of methyltransferases or other
metabolic changes?
• Opportunities for intervention – Antioxidant supplementation – Folate supplementation
Presenter
Presentation Notes
So to summarize, we found that GSSG was assoicated with decreased arsenic methylation in the folate deficient. Interestingly, we did not find that the Eh value was as strongly associated with methylation. A letter from David Thomas in Toxicological Sciences references some unpublished data showing that the addition of GSSG to an in vitro assay lowers the As3mt catalyzed formation of methylated products and that GSSG actually binds to As3mt, which seems consistent with our results.

Acknowledgements
• UK SRP
• Columbia Superfund Group – Dr. Mary Gamble – Dr. Joseph Graziano – Dr. Megan Hall – Dr. Kristin Harper
• Field staff in Araihazar
Thank you!
• Gamble lab – Vesna Iliveski – Shelley Qu – Brandi Peters – Julie Oka
• Graziano lab – Vesna Slavkovich – Jagoda Balac – David Santiago – Tiffany Sanchez

Acknowledgements
• Regina Santella and the NIEHS center
• Mary Gamble and lab
• Joseph Graziano and lab
• Arsenic Group
• Araihazar field staff
• UK SRP
• Columbia Superfund Group
• Dr. Mary Gamble • Dr. Joseph Graziano • Dr. Megan Hall
• Gamble lab – Vesna Iliveski – Shelley Qu – Brandi Peters – Julie Oka
• Graziano lab – Vesna Slavkovich – Jagota – David Santiago – Tiffany Sanchez
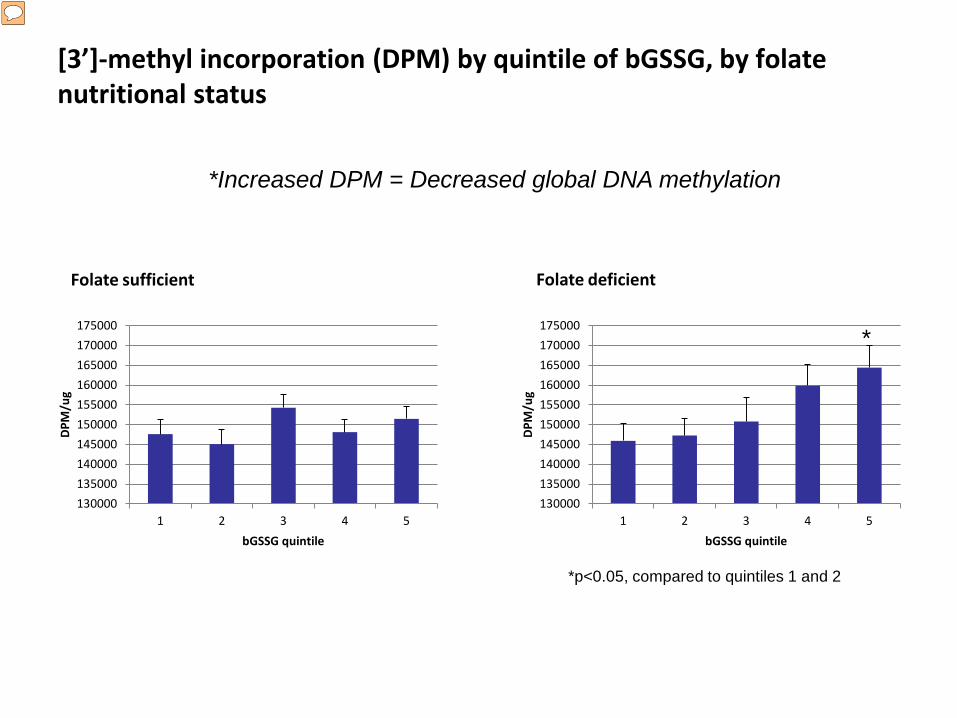
[3’]-methyl incorporation (DPM) by quintile of bGSSG, by folate nutritional status
*Increased DPM = Decreased global DNA methylation
Folate sufficient
130000135000140000145000150000155000160000165000170000175000
1 2 3 4 5
DPM/u
g
bGSSG quintile
Folate deficient
130000135000140000145000150000155000160000165000170000175000
1 2 3 4 5DP
M/u
g bGSSG quintile
*
*p<0.05, compared to quintiles 1 and 2
Presenter
Presentation Notes
Also, even though I did not have time to fully go into my results for DNA methylation, we observe the same association pattern between GSSG and decreased global DNA methylation, where the highest quintile of GSSG is associated with signifanclty decreased DNA methylation in the folate deficient. This result, taken together with the As methylation result, seems to indicate that increased GSSG is inhibiting methylation capacity among folate deficient individuals.

Demographic and clinical data of subjects in the current study
Baseline variables
Folate-deficient
(<9 nmol/L) (n=100)
Folate-sufficient
(≥9 nmol/L) (n=222)
Group difference
Overall (n=322)
Blood GSH (uM) 505.2 ±
149.9 484.5 ± 185.7 0.352 491 ± 173 Blood GSSG (uM) 34.4 ± 19.0 38.6 ± 18.4 0.0192 37.2 ± 18.6
Eh bGSH:GSSG (mV) -200.6 ±
11.7 -196.6 ± 13.9 0.0342 -197.9 ± 13.4 Plasma GSH (uM) 2.5 ± 0.71 2.6 ± 0.72 0.402 2.6 ± 0.72 Plasma GSSG (uM) 2.06 ± 0.66 2.16 ± 0.57 0.0522 2.13 ± 0.60 Eh pGSH:GSSG (mV) -98.4 ± 6.7 -98.3 ± 7.4 0.972 -98.3 ± 7.2 Plasma Cys (uM) 3.55 ± 2.27 3.89 ± 2.57 0.262 3.78 ± 2.49 Plasma CySS (uM) 53.1 ± 14.7 57.5 ± 13.1 0.00372 56.2 ± 13.4 Eh pCys:CySS (mV) -46.8 ± 15.8 -47.6 ± 17.3 0.612 -47.2 ± 16.8 Blood SAM (uM) 1.35 ± 0.54 1.23 ± 0.47 0.0382 1.27 ± 0.50 Blood SAH (uM) 0.33 ± 0.15 0.30 ± 0.17 0.0122 0.31± 0.17
1. Mean ± SD (all such values); 2. P-values determined by Wilcoxon’s rank sum test; 3. P-values determined by chi-square test


E for various cell processes
E(mV) Process
-165 Necrosis
-185 G0/differentiated G1
-195 Dephosphorylation threshold of phosphoproteins on serine residues
-205 to <-260 Proliferation
Hoffman, 2009

Glutathione
• L-cysteine, L-glutamic acid, and glycine • Thiol (SH) group acts as proton donor • Intracellular – high (1-10 mM, liver 5-10 mM)
– GSH – GSSG: < 1% of GSH – 3 major reservoirs: ~90% in the cytosol, ~10% in the mitochondria,
small percentage in the ER
• Extracellular – lower (1-10 uM) • GSH/GSSG usually > 10

Methods
• Glutathione processing: – Blood collected and immediately transferred to Eppindorf tubes
containing either • 5% perchloric acid (PCA), 0.1 M boric acid and γ-glutamyl
glutamate as internal standard (for whole blood GSH), or • 100 mM serine borate, 60 units heparin, 0.75 mg
bathophenanthrolene, 4.5 mg iodoacetic acid, and γ-glutamyl glutamate
– Samples centrifuged for 1 min.; 200 µl of supernatant transferred into Eppendorf tubes containing an equal volume of 10% PCA, 0.2M boric acid
– Samples sent to Columbia for derivatization and HPLC analysis – Measure Cys/CySS, GSH/GSSG